Credit Growth and the Financial Crisis: A New Narrative · Credit Growth and the Financial Crisis:...
60
Credit Growth and the Financial Crisis: A New Narrative * Stefania Albanesi, OSU Giacomo DeGiorgi, FRBNY Jaromir Nosal, Boston College Matthew Ploenzke, Harvard December 14, 2015 Abstract A broadly accepted explanation for the 2007-09 financial crisis emphasizes the growth in lending to subprime households during the preceding boom. According to this view, the resulting rise in insolvencies and foreclosures caused the financial crisis, leading to a decline in housing values and a broad contraction in credit. This paper studies the evolution of household borrowing and delinquency between 1999 and 2013, using a large administrative panel of credit file data. Our findings suggest an alternative narrative that challenges the large role of subprime credit. We show that credit growth between 2001 and 2007 is concentrated in the middle and high quartiles of the credit score distribution. Borrowing by individuals with low credit score is vir- tually constant for all debt categories during the boom. We also find that the rise in defaults during the financial crisis is concentrated in the middle and upper quartiles of the credit score distribution, and the fraction of defaults to the lowest quartile of of the credit score distribution sizably drops during the crisis. We discuss the broader implications of these findings for the role of housing collateral in the propagation of the crisis. * PRELIMINARY AND INCOMPLETE. DO NOT CIRCULATE WITHOUT PERMISSION. We are grateful to Christopher Carroll, William Dudley, Virgiliu Midrigan, Giuseppe Moscarini, Joe Tracy, Wilbert van der Klauw, Paul Willen and participants at the 6th Ifo Conference on Macroeconomics and Survey Data for useful comments and suggestions. We also thank Harry Wheeler for excellent research assistance. The views expressed here are those of the authors and do not necessarily reflect the views of the Federal Reserve Bank of New York or the Federal Reserve System. Correspondence to: [email protected].
Transcript of Credit Growth and the Financial Crisis: A New Narrative · Credit Growth and the Financial Crisis:...

Credit Growth and the Financial Crisis:A New Narrative∗
Stefania Albanesi, OSU Giacomo DeGiorgi, FRBNY
Jaromir Nosal, Boston College Matthew Ploenzke, Harvard
December 14, 2015
Abstract
A broadly accepted explanation for the 2007-09 financial crisis emphasizes thegrowth in lending to subprime households during the preceding boom. Accordingto this view, the resulting rise in insolvencies and foreclosures caused the financialcrisis, leading to a decline in housing values and a broad contraction in credit. Thispaper studies the evolution of household borrowing and delinquency between 1999 and2013, using a large administrative panel of credit file data. Our findings suggest analternative narrative that challenges the large role of subprime credit. We show thatcredit growth between 2001 and 2007 is concentrated in the middle and high quartilesof the credit score distribution. Borrowing by individuals with low credit score is vir-tually constant for all debt categories during the boom. We also find that the rise indefaults during the financial crisis is concentrated in the middle and upper quartilesof the credit score distribution, and the fraction of defaults to the lowest quartile ofof the credit score distribution sizably drops during the crisis. We discuss the broaderimplications of these findings for the role of housing collateral in the propagation ofthe crisis.
∗PRELIMINARY AND INCOMPLETE. DO NOT CIRCULATE WITHOUT PERMISSION. We aregrateful to Christopher Carroll, William Dudley, Virgiliu Midrigan, Giuseppe Moscarini, Joe Tracy, Wilbertvan der Klauw, Paul Willen and participants at the 6th Ifo Conference on Macroeconomics and Survey Datafor useful comments and suggestions. We also thank Harry Wheeler for excellent research assistance. Theviews expressed here are those of the authors and do not necessarily reflect the views of the Federal ReserveBank of New York or the Federal Reserve System. Correspondence to: [email protected].

1 Introduction
A broadly accepted narrative about the 2007-09 financial crisis is based on the findings in
Mian and Sufi (2009) and Mian and Sufi (2015a) suggesting that most of the growth in credit
during the 2001-2006 boom was concentrated in the subprime segment and most of the new
defaults during the 2007-2009 crisis were also concentrated in this segment. The expansion
of subprime credit is then viewed as a leading cause for the crisis, having lead to a rise in
insolvencies and foreclosures, which caused a contraction of credit supply and a decline in
house prices that also otherwise solvent households (see Mian and Sufi (2011), Mian and Sufi
(2010), Mian, Sufi, and Trebbi (2011) and Mian, Rao, and Sufi (2013)).
This paper studies the evolution of household borrowing and delinquency between 1999
and 2013, leading up and following the 2007-09 great recession. Our analysis is based on the
Federal Reserve Bank of New York Consumer Credit Panel/Equifax data, a large adminis-
trative panel of anonymous credit files from the Equifax credit reporting bureau. The data
contains information on individual debt holdings, delinquencies, public records and credit
scores. We examine the evolution of borrowing and defaults for variety of debt categories
during the credit boom and throughout the financial crisis and its aftermath. Our findings
suggest an alternative narrative that challenges a large role of subprime credit growth for
the crisis. Specifically, we show that credit growth between 2001 and 2007 is concentrated
in the middle and high quartiles of the credit score distribution. Credit to individuals with
low credit score is virtually constant for all debt categories during the boom. We also find
that the rise in defaults during the financial crisis is concentrated in the middle and upper
quartiles of the credit score distribution. While low credit score individuals typically have
higher default rates than individuals with higher credit scores, during the financial crisis the
fraction of defaults to the lowest quartile of of the credit score distribution drops from 40%
to 30% for insolvencies,1 and from 70% to 35% for foreclosures.
Mian and Sufi (2009) and Mian and Sufi (2015a) identify subprime individuals based
on their credit score in 1996 and 1997, respectively. We show that this approach implies
that most of the credit growth attributed to low credit score individuals captures life cycle
demand for borrowing, as well as life cycle effects in the evolution of credit scores. This is
because low credit score individuals at any time are disproportionally young. Our approach
is based instead on ranking individuals by their 8 quarter lagged credit score. This avoids
joint endogeneity of the credit score ranking and borrowing and delinquency behavior, but
ensures that the ranking best reflects the borrower’s likely ability to repay debt at the time of
1Insolvencies occur when individuals are 120 or more late on any payments.
1

borrowing. Using payroll income data for 2009, we show that the cross sectional dispersion
of 8 quarter lagged credit scores is mostly explained by the cross sectional dispersion of labor
income, conditional on age.
Our findings confirm and expand those in Adelino, Schoar, and Severino (2015) who show
that for mortgages, most of the growth in balances during the boom and the new defaults
during the financial crisis are concentrated in the middle of the income distribution. We show
that the large contribution of middle and upper credit score and income households to credit
growth during the 2001-07 boom applies to all debt categories, and is associated to a stark
rise in defaults and foreclosures for these households. The share of defaults to households at
the bottom of the credit score distribution, who have low income, falls substantially during
the crisis. Taken together, these findings challenge the prevailing view of the financial crisis.
Based on this narrative, the rise in credit to subprime borrowers lead to a rise in defaults
for this group, especially of housing debt. This lead to a decline in housing values, which
then reduced home equity values for otherwise solvent, less risky borrowers, leading them to
default on their housing debt.
We also begin to explore the broader implications of our results, focussing particularly on
the role of the collateral channel, which is seen as a key driver for the onset and propagation
of the financial crisis. There is a large literature on the role of collateral constraints, through
housing equity, in the financial crisis. (See for example Berger et al (2015), Guerrieri and
Lorenzoni (2011), Kehoe, Midrigan, and Pastorino (2014), Hurst and Stafford (2004), Mian
and Sufi (2014), Iacoviello (2004).) According to this view, the value of collateral, by affecting
household’s ability to borrow, is a key determinant of consumption and its response to
fluctuations in income. Therefore, a drop in house prices would determine a tightening of
credit conditions and a decline in household borrowing.
We explore this mechanism by evaluating the role of home equity based borrowing be-
tween 2001 and 2013. We find that home equity based borrowing contributes only marginally
to the growth in household debt during the credit boom, and does not exhibit a substantial
contraction during the financial crisis. We also show that the contraction in debt is more
severe for non-homeowners, and for non-housing debt for homeowners. These findings chal-
lenge the view that the decline in housing values were a key determinant to the contraction
in household debt during and the aftermath of the 2007-09 financial crisis.
The paper is organized as follows. Section 2 provides a short description of the data
we use for this analysis. Section 3 reports the new evidence on credit growth and default
behavior by credit score. Section 4 examines the role of life cycle factors on credit demand
and credit scores. Section 5 explores the relation between credit score and income. Section
2

6 discusses the broader implications for our findings for the collateral channel. Section 7
concludes.
2 Data
We use the Federal Reserve Bank of New York’s Consumer Credit Panel/Equifax Data
(CCP), which is an anonymous longitudinal panel of individuals, comprising a 5% random
sample of all individuals who have a credit report with Equifax. The data is on quarterly
frequency, starting in 1999:Q1 and ending in 2013:Q3. The data is described in detail in Lee
and van der Klaauw (2010). In our analysis, we use a 1% sample for the individual analysis.
This includes information for approximately 2.5 million individuals in each quarter. We use
the 5% sample for the zip code level analysis.
The data contains over 600 variables,2 allowing us to track all aspects of individuals’
financial liabilities, including bankruptcy and foreclosure, mortgage status, detailed delin-
quencies, various types of debt, with number of accounts and balances. Apart from the
financial information, the data contains individual descriptors such as age, ZIP code and
credit score. The variables included in our analysis are described in detail in Appendix A.
3 Credit Growth and Default Behavior
The credit score is perceived as a critical indicator of credit worthiness for borrowers and
is widely used by the financial industry. For most unsecured forms of lending, the credit
score is the only characteristic that is assessed, jointly with other information available in a
borrower’s credit report, to award credit.
The credit score is a summary measure intended to predict the risk of default by the
borrower. The most widely used measure is the FICO score. We have access to the Equifax
Riskscore, which is a proprietary measure designed to capture the likelihood of a consumer
becoming 90+ days delinquent within 24 months. The measure uses a numerical range of
280 to 850, where higher scores indicate lower credit risk. It can be accessed by lenders
together with the borrower’s credit report. Mian and Sufi (2009) and Mian and Sufi (2015a)
use the 1996 and 1997 credit score as a measure of creditworthiness.3 We will show that
2For data dictionary, go to http://www.newyorkfed.org/householdcredit/2013-q3/data/pdf/data_
dictionary_HHDC.pdf.3Specifically, Mian and Sufi (2009) rank MSA zip codes by the fraction of residents with Equifax Riskscore
below 660 in 1996. Mian and Sufi (2015a) rank individuals by their Vantage Score, a measure similar to theFICO score. Vantage Score in 1997. For this classification, the subprime cutoff is at the high end of the
3
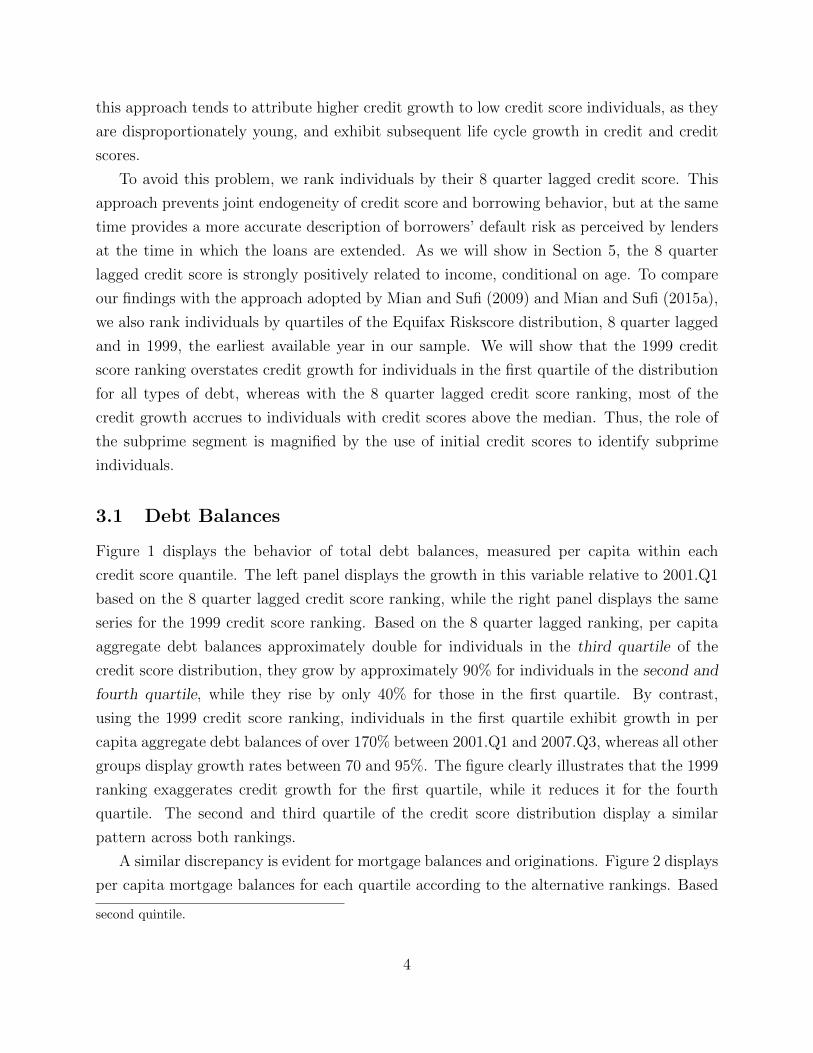
this approach tends to attribute higher credit growth to low credit score individuals, as they
are disproportionately young, and exhibit subsequent life cycle growth in credit and credit
scores.
To avoid this problem, we rank individuals by their 8 quarter lagged credit score. This
approach prevents joint endogeneity of credit score and borrowing behavior, but at the same
time provides a more accurate description of borrowers’ default risk as perceived by lenders
at the time in which the loans are extended. As we will show in Section 5, the 8 quarter
lagged credit score is strongly positively related to income, conditional on age. To compare
our findings with the approach adopted by Mian and Sufi (2009) and Mian and Sufi (2015a),
we also rank individuals by quartiles of the Equifax Riskscore distribution, 8 quarter lagged
and in 1999, the earliest available year in our sample. We will show that the 1999 credit
score ranking overstates credit growth for individuals in the first quartile of the distribution
for all types of debt, whereas with the 8 quarter lagged credit score ranking, most of the
credit growth accrues to individuals with credit scores above the median. Thus, the role of
the subprime segment is magnified by the use of initial credit scores to identify subprime
individuals.
3.1 Debt Balances
Figure 1 displays the behavior of total debt balances, measured per capita within each
credit score quantile. The left panel displays the growth in this variable relative to 2001.Q1
based on the 8 quarter lagged credit score ranking, while the right panel displays the same
series for the 1999 credit score ranking. Based on the 8 quarter lagged ranking, per capita
aggregate debt balances approximately double for individuals in the third quartile of the
credit score distribution, they grow by approximately 90% for individuals in the second and
fourth quartile, while they rise by only 40% for those in the first quartile. By contrast,
using the 1999 credit score ranking, individuals in the first quartile exhibit growth in per
capita aggregate debt balances of over 170% between 2001.Q1 and 2007.Q3, whereas all other
groups display growth rates between 70 and 95%. The figure clearly illustrates that the 1999
ranking exaggerates credit growth for the first quartile, while it reduces it for the fourth
quartile. The second and third quartile of the credit score distribution display a similar
pattern across both rankings.
A similar discrepancy is evident for mortgage balances and originations. Figure 2 displays
per capita mortgage balances for each quartile according to the alternative rankings. Based
second quintile.
4

Ratio to 2001Q1 (3QMA)
2001Q12002Q12003Q1 2004Q12005Q12006Q12007Q1 2008Q12009Q12010Q12011Q1 2012Q12013Q1 1.0000
1.2000
1.4000
1.6000
1.8000
2.0000
2.2000
2.4000
2.6000
2.8000
Ratio to 2001Q1 (3QMA)
1.0000
1.2000
1.4000
1.6000
1.8000
2.0000
2.2000
2.4000
2.6000
2.8000Quartile 4 (Highest)Quartile 3Quartile 2Quartile 1 (Lowest)
(a) 8 quarter lagged Equifax Risk Score
Ratio to 2001Q1 (3QMA)
2001Q12002Q12003Q1 2004Q12005Q12006Q12007Q1 2008Q12009Q12010Q12011Q1 2012Q12013Q1 1.0000
1.2000
1.4000
1.6000
1.8000
2.0000
2.2000
2.4000
2.6000
2.8000
Ratio to 2001Q1 (3QMA)
1.0000
1.2000
1.4000
1.6000
1.8000
2.0000
2.2000
2.4000
2.6000
2.8000
Quartile 4 (Highest)Quartile 3Quartile 2Quartile 1 (Lowest)
(b) 1999 Equifax Risk Score
Figure 1: Per capita total debt balances by Equifax Riskscore quartile. Ratio to 2001Q1.Source: Authors’ calculation based on Federal Reserve Bank of New York’s Consumer CreditPanel/Equifax Data.
on the 8 quarter lagged ranking, mortgage balances approximately double between 2001.Q1
and the start of the great recession, while they peak at 75% higher in 2006.Q4 for individuals
in the first quartile. For individuals in the fourth quartile, per capita mortgage balances also
peak at 75% higher at the start of 2009. Using the 1999 credit score ranking, mortgage
balances for the first quartile of the distribution grow by 125% between 2001.Q1 and the
start of the great recession, 30 percentage points more than the growth for the second quartile
over the same period. As for total debt balances, the growth for the second and third quartile
is quite similar across the two rankings, while for the fourth quartile the growth with the
1999 ranking is smaller than with the 8 quarter lag ranking.
Figure 3 displays the fraction of individuals with new mortgage originations in the last
for quarters for each quartile. Based on the 8 quarter lagged ranking, originations decline
for the entire sample period for the first quartile, and decline starting in 2002.Q1 for the
second quartile. For the third and fourth quartile, the fraction with new originations peaks
in 2004.Q1. Based on the 1999 ranking, originations slightly rise for the first quartile of the
distribution between 2001.Q1 and early 2007, while the pattern is quite similar for the other
quartiles.
The same patterns and discrepancies across the two credit score rankings are also evident
for credit card balances and auto loans. Figure 4 reports per capita credit card balances,
as a ratio to their value on 2001.Q1. Once again, the most striking difference between the
two rankings can be seen for the first quartile. With the 8 quarter lagged ranking, credit
card balances are essentially flat for the entire sample period for the first quartile, while they
5

Ratio to 2001Q1 (3QMA)
2001Q12002Q12003Q1 2004Q12005Q12006Q12007Q1 2008Q12009Q12010Q12011Q1 2012Q12013Q1
1.0000
1.5000
2.0000
2.5000
Ratio to 2001Q1 (3QMA)
1.0000
1.5000
2.0000
2.5000
Quartile 4 (Highest)Quartile 3Quartile 2Quartile 1 (Lowest)
(a) 8 quarter lagged Equifax Risk Score
Ratio to 2001Q1 (3QMA)
2001Q12002Q12003Q1 2004Q12005Q12006Q12007Q1 2008Q12009Q12010Q12011Q1 2012Q12013Q1
1.0000
1.5000
2.0000
2.5000
Ratio to 2001Q1 (3QMA)
1.0000
1.5000
2.0000
2.5000
Quartile 4 (Highest)Quartile 3Quartile 2Quartile 1 (Lowest)
(b) 1999 Equifax Risk Score
Figure 2: Average mortgage balances. Source: Authors’ calculation based on Federal ReserveBank of New York’s Consumer Credit Panel/Equifax Data.
fraction
2001Q12002Q12003Q1 2004Q12005Q12006Q12007Q1 2008Q12009Q12010Q12011Q1 2012Q12013Q10
0.05
0.1
0.15
0.2
0.25
fraction
0
0.05
0.1
0.15
0.2
0.25Quartile 4 (Highest)Quartile 3Quartile 2Quartile 1 (Lowest)
(a) 8 quarter lagged Equifax Risk Score
fraction
2001Q12002Q12003Q1 2004Q12005Q12006Q12007Q1 2008Q12009Q12010Q12011Q1 2012Q12013Q10
0.05
0.1
0.15
0.2
0.25
fraction
0
0.05
0.1
0.15
0.2
0.25Quartile 4 (Highest)Quartile 3Quartile 2Quartile 1 (Lowest)
(b) 1999 Equifax Risk Score
Figure 3: Fraction with new mortgage originations. Source: Authors’ calculation based onFederal Reserve Bank of New York’s Consumer Credit Panel/Equifax Data.
peak at 65% than 2001.Q1 in 2009.Q1 for the 1999 ranking. Credit card balances also grow
more with the 1999 ranking for the fourth quartile, while for the second and third quartile
the discrepancy across ranking is minor.
Figure 5 displays the same results for per capita auto loan balances. While rankings
present a very pronounced cyclical pattern, the first quartile exhibits much stronger growth
during the credit boom.
6

Ratio to 2001Q1 (3QMA)
2001Q12002Q12003Q1 2004Q12005Q12006Q12007Q1 2008Q12009Q12010Q12011Q1 2012Q12013Q1 0.8000
1.0000
1.2000
1.4000
1.6000
1.8000
2.0000
Ratio to 2001Q1 (3QMA)
0.8000
1.0000
1.2000
1.4000
1.6000
1.8000
2.0000Quartile 4 (Highest)Quartile 3Quartile 2Quartile 1 (Lowest)
(a) 8 quarter lagged Equifax Risk Score
Ratio to 2001Q1 (3QMA)
2001Q12002Q12003Q1 2004Q12005Q12006Q12007Q1 2008Q12009Q12010Q12011Q1 2012Q12013Q1 0.8000
1.0000
1.2000
1.4000
1.6000
1.8000
2.0000
Ratio to 2001Q1 (3QMA)
0.8000
1.0000
1.2000
1.4000
1.6000
1.8000
2.0000
Quartile 4 (Highest)Quartile 3Quartile 2Quartile 1 (Lowest)
(b) 1999 Equifax Risk Score
Figure 4: Average credit card balances. Ratio to 2001Q1. Source: Authors’ calculationbased on Federal Reserve Bank of New York’s Consumer Credit Panel/Equifax Data.
Ratio to 2001Q1 (3QMA)
2001Q12002Q12003Q1 2004Q12005Q12006Q12007Q1 2008Q12009Q12010Q12011Q1 2012Q12013Q1 0.9000
0.9500
1.0000
1.0500
1.1000
1.1500
1.2000
1.2500
1.3000
1.3500
1.4000
Ratio to 2001Q1 (3QMA)
0.9000
0.9500
1.0000
1.0500
1.1000
1.1500
1.2000
1.2500
1.3000
1.3500
1.4000
Quartile 4 (Highest)Quartile 3Quartile 2Quartile 1 (Lowest)
(a) 8 quarter lagged Equifax Risk Score
Ratio to 2001Q1 (3QMA)
2001Q12002Q12003Q1 2004Q12005Q12006Q12007Q1 2008Q12009Q12010Q12011Q1 2012Q12013Q1 0.9000
0.9500
1.0000
1.0500
1.1000
1.1500
1.2000
1.2500
1.3000
1.3500
1.4000
Ratio to 2001Q1 (3QMA)
0.9000
0.9500
1.0000
1.0500
1.1000
1.1500
1.2000
1.2500
1.3000
1.3500
1.4000
Quartile 4 (Highest)Quartile 3Quartile 2Quartile 1 (Lowest)
(b) 1999 Equifax Risk Score
Figure 5: Average automobile loan balances. Ratio to 2001Q1. Source: Authors’ calculationbased on Federal Reserve Bank of New York’s Consumer Credit Panel/Equifax Data.
3.2 Defaults
A basic tenet of the common view of the financial crisis is that the growth in credit extended
to subprime individuals during the boom led to a rise in defaults for that segment during
the crisis. Specifically, this view emphasizes that the rise in foreclosures was concentrated in
this segment.
We examine this premise in the next two charts, which present the share of defaults
and foreclosure to each quartile for each of the rankings. For both variables, we find that
the share of the first quartile declines during the financial crisis, and the decline is more
pronounced for the 8 quarter lagged ranking.
7
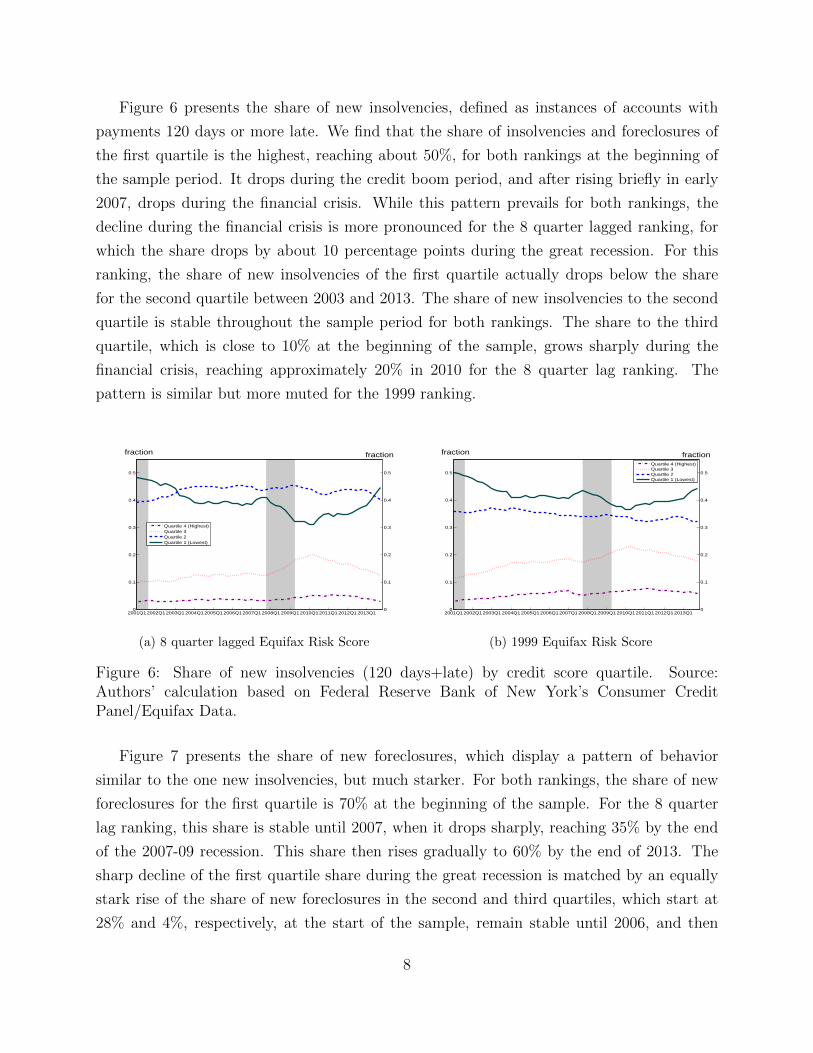
Figure 6 presents the share of new insolvencies, defined as instances of accounts with
payments 120 days or more late. We find that the share of insolvencies and foreclosures of
the first quartile is the highest, reaching about 50%, for both rankings at the beginning of
the sample period. It drops during the credit boom period, and after rising briefly in early
2007, drops during the financial crisis. While this pattern prevails for both rankings, the
decline during the financial crisis is more pronounced for the 8 quarter lagged ranking, for
which the share drops by about 10 percentage points during the great recession. For this
ranking, the share of new insolvencies of the first quartile actually drops below the share
for the second quartile between 2003 and 2013. The share of new insolvencies to the second
quartile is stable throughout the sample period for both rankings. The share to the third
quartile, which is close to 10% at the beginning of the sample, grows sharply during the
financial crisis, reaching approximately 20% in 2010 for the 8 quarter lag ranking. The
pattern is similar but more muted for the 1999 ranking.
fraction
2001Q12002Q12003Q1 2004Q12005Q12006Q12007Q1 2008Q12009Q12010Q12011Q1 2012Q12013Q10
0.1
0.2
0.3
0.4
0.5
fraction
0
0.1
0.2
0.3
0.4
0.5
Quartile 4 (Highest)Quartile 3Quartile 2Quartile 1 (Lowest)
(a) 8 quarter lagged Equifax Risk Score
fraction
2001Q12002Q12003Q1 2004Q12005Q12006Q12007Q1 2008Q12009Q12010Q12011Q1 2012Q12013Q10
0.1
0.2
0.3
0.4
0.5
fraction
0
0.1
0.2
0.3
0.4
0.5
Quartile 4 (Highest)Quartile 3Quartile 2Quartile 1 (Lowest)
(b) 1999 Equifax Risk Score
Figure 6: Share of new insolvencies (120 days+late) by credit score quartile. Source:Authors’ calculation based on Federal Reserve Bank of New York’s Consumer CreditPanel/Equifax Data.
Figure 7 presents the share of new foreclosures, which display a pattern of behavior
similar to the one new insolvencies, but much starker. For both rankings, the share of new
foreclosures for the first quartile is 70% at the beginning of the sample. For the 8 quarter
lag ranking, this share is stable until 2007, when it drops sharply, reaching 35% by the end
of the 2007-09 recession. This share then rises gradually to 60% by the end of 2013. The
sharp decline of the first quartile share during the great recession is matched by an equally
stark rise of the share of new foreclosures in the second and third quartiles, which start at
28% and 4%, respectively, at the start of the sample, remain stable until 2006, and then
8

rise by approximately 15 percentage points between 2009 and the end of 2009. The share
of new foreclosures to the fourth quartile, which is less than 1% until 2007, also rises by 5
percentage points during the crisis. With the 1999 ranking, the share of new foreclosures in
the first quartile drops gradually until 2006, when it starts a faster decline, reaching 45% at
the end of the great recession. The share rises very slowly starting in 2011. The share of
the other quartiles are mostly stable until 2007, and then rise permanently. The increase is
greatest for the third quartile, for which it rises from 10% in early 2007 to just above 20%
in 2009. The age effects which we will discuss in Section 4 likely account for the declining
share of foreclosures to the first quartile for the 1999 ranking.
fraction
2001Q12002Q12003Q1 2004Q12005Q12006Q12007Q1 2008Q12009Q12010Q12011Q1 2012Q12013Q10
0.1
0.2
0.3
0.4
0.5
0.6
0.7
fraction
0
0.1
0.2
0.3
0.4
0.5
0.6
0.7Quartile 4 (Highest)Quartile 3Quartile 2Quartile 1 (Lowest)
(a) 8 quarter lagged Equifax Risk Score
fraction
2001Q12002Q12003Q1 2004Q12005Q12006Q12007Q1 2008Q12009Q12010Q12011Q1 2012Q12013Q10
0.1
0.2
0.3
0.4
0.5
0.6
0.7
fraction
0
0.1
0.2
0.3
0.4
0.5
0.6
0.7Quartile 4 (Highest)Quartile 3Quartile 2Quartile 1 (Lowest)
(b) 1999 Equifax Risk Score
Figure 7: Share of new foreclosures by credit score quartile. Source: Authors’ calculationbased on Federal Reserve Bank of New York’s Consumer Credit Panel/Equifax Data.
3.3 Summary
We conclude this section with a brief summary of our findings.
• The 1999 credit score ranking overstates credit growth for low credit scores during the
boom. This observation applies to aggregate debt balances, mortgage balances and
originations, credit card balances, and auto loans.
• Using our preferred 8 quarter lagged credit score ranking, most credit growth during
boom is concentrated in 3rd quartile of the credit score distribution.
• The rise in new insolvencies and foreclosures during the great recession is concentrated
in the 2nd and 3rd quartile of the credit score distribution, for both rankings, but the
rise is more pronounced for the 8 quarter lagged ranking.
9

• The share of new insolvencies and foreclosures to the 1st quartile drops sharply during
crisis. Again, this pattern is more pronounced for the 8 quarter lagged ranking.
4 The Role of Age
We now explain why ranking individuals by their credit score 15 years prior, as in Mian and
Sufi (2009) and Mian and Sufi (2015a) amplifies credit growth for low credit score individuals.
Specifically, we will show that low credit score individuals are disproportionately young. The
young experience future credit growth, as well as income and credit score growth, due to the
life cycle. Moreover, their credit score at time of borrowing is considerably higher than when
young. Using a 4-12 quarter lagged credit score provides a better assessment of a borrower’s
default risk, as it closely related to income at time of borrowing.
We begin by showing that low credit score individuals are disproportionately young.
Figure 9 displays the fraction of individuals in each credit score quartile in 1999 by age. We
consider 5 age groups. For the youngest group, age 25-34, the fraction in the first quartile
is 36%, the fraction in the second quartile is 25%, the fraction in the third quartile is 18%,
and the fraction in the fourth quartile is 6%. The distribution gradually shifts to higher
quartiles for the older age groups. For 45-54 year olds, the fraction in each quartile are
roughly equal. For the oldest age group, 65 or older, the fraction in the first quartile is 8%,
while the fraction in the fourth quartile is 38%. This distribution is very stable over time.
Given their relatively young age, and correspondingly short credit history, low credit
score individuals in 1999 exhibit credit score growth over time. This is illustrated in figure
9, which plots the ratio of the current and 1999 credit score over the sample period by 1999
credit score quartile. For individuals in the first credit score quartile in 1999, their credit
score grows by more than 10% between 2001 and the end of 2013. The credit score grows
by about 2% for individuals in the second quartile, and is essentially flat for the other 1999
credit score quartiles.
To explore the role of age on credit score and credit growth in more detail, we adopt a
regression approach.
4.1 Age Effects: Regression Analysis
To more precisely assess the relation between age, credit score and credit growth, we regress
the Equifax Riscore in each quarter on age fixed effects, time effects and state fixed effects.
We include state effects due to the sizable cross state variation in important regulation
10

0
0.05
0.1
0.15
0.2
0.25
0.3
0.35
0.4
25_34 35_44 45_54 55_64 65_more
Quar2le 1
Quar2le 2
Quar2le 3
Quar2le 4
Figure 8: Fraction in each age bin in 1999 by Equifax Riskscore quartile in 1999. Source:Authors’ calculation based on Federal Reserve Bank of New York’s Consumer CreditPanel/Equifax Data.
Ratio to 2001Q1 (3QMA)
2001Q12002Q12003Q1 2004Q12005Q12006Q12007Q1 2008Q12009Q12010Q12011Q1 2012Q12013Q1
0.9600
0.9800
1.0000
1.0200
1.0400
1.0600
1.0800
1.1000
1.1200
Ratio to 2001Q1 (3QMA)
0.9600
0.9800
1.0000
1.0200
1.0400
1.0600
1.0800
1.1000
1.1200
Quartile 4 (Highest)Quartile 3Quartile 2Quartile 1 (Lowest)
Figure 9: Current credit score as ratio to 1999, by Equifax Riskscore quartile in 1999.Source: Authors’ calculation based on Federal Reserve Bank of New York’s Consumer CreditPanel/Equifax Data.
regarding foreclosure, health insurance and other factors, which could affect the incidence of
financial distress and credit scores.
11

Figure 10 plots the estimated age effects between age 20 and 85. The growth in credit
score as a function of age is strongest between age 25 and 40, and weakest after age 65.
-20
0
20
40
60
80
100
120
140
160
21 26 31 36 41 46 51 56 61 66 71 76 81
Figure 10: Equifax Riskscore. Estimated age effects. Source: Authors’ calculation based onFederal Reserve Bank of New York’s Consumer Credit Panel/Equifax Data.
We adopt the same approach to evaluate the relation between age and debt balances,
regressing them on age fixed effects, time effects and state fixed effects. Figure 11 plots the
age effects of this regression for aggregate debt balances, home debt balances, credit card
balances and auto loan balances. There is a striking life cycle pattern in all these measures.
Credit card balances (right axis) peak at 3,000$ at age 55, whereas auto loans reach a peak
of approximately 2,000$ at age 32. Home balances do no start rising until age 25, then
peak just above 40,000$ at age 42. The behavior of total debt balances largely reflects the
behavior of home balances.
4.2 Counterfactuals
To further illustrate the role of the life cycle for credit demand, we construct a series of
counterfactuals. These calculations are intended to remove life cycle effects on credit growth
by assigning to individuals in each 1999 age bin, the debt balances of individuals who are in
that same age bin at any given quarter. For example, a 26 year old in 1999 will be attributed
the debt balances of current 26-year-olds in all quarters.
Specifically, we consider the following age bins: 1 = [25, 34), 2 = [35, 44), 3 = [45, 54),
12

-$3,000
-$2,000
-$1,000
$0
$1,000
$2,000
$3,000
$4,000
-$30,000
-$20,000
-$10,000
$0
$10,000
$20,000
$30,000
$40,000
$50,000
21 26 31 36 41 46 51 56 61 66 71 76 81
AggregateBalances
HomeBalances
CreditCardBalances
AutoBalances
Figure 11: Debt balances. Estimated age effects. Credit card and auto loan balances on righaxis. Home debt and aggregate balances on left axis. Source: Authors’ calculation based onFederal Reserve Bank of New York’s Consumer Credit Panel/Equifax Data.
4 = [55, 64) and 5 = [65, ....). Let πi,j1999 be the fraction of individuals in age bin i and
Equifax Riskscore quartile j = 1, 2, 3, 4 in 1999, and xi1999t be the average value of a variable
x for individuals in age bin i in quarter t. We compute xi1999t the average value of the variable
at t for individuals in age bin i in 1999. This measure forces individuals to continue to behave
according to their age in 1999 in all future time periods. Since age is kept constant, this
counterfactual eliminates life cycle effects.
The results are displayed in figure 12. We find that 25-34 year olds in 1999 experience
more debt growth than current 25-34 year olds, whereas 45-54 and 65+ year olds in 1999
experience less debt growth now than current 45-64. The 35-44 year olds in 1999 experience
very similar debt growth to the current 35-44 year olds. The gap between total debt balances
for individuals currently in each age group and those in that age group in 1999 measures the
component of credit demand due to life cycle considerations. For example, in 2007.Q1, total
debt balances for 25-34 year olds in 1999 would have been approximately 25,000$ lower if
their age had remained constant. By contrast, for 55-64 year olds in 1999, per capita total
debt balances would have been approximately 30,000$ higher in 2007.Q1 if they had not
aged.
To quantify the role of life cycle borrowing by 1999 credit score quartile, we compute
the same counterfactual by credit score. Let xi,j1999t be the average value of a variable x for
13

$0$10,000$20,000$30,000$40,000$50,000$60,000$70,000$80,000$90,000
1999Q1
2000Q1
2001Q1
2002Q1
2003Q1
2004Q1
2005Q1
2006Q1
2007Q1
2008Q1
2009Q1
2010Q1
2011Q1
2012Q1
2013Q1
25-34current
25-34in1999
$0$10,000$20,000$30,000$40,000$50,000$60,000$70,000$80,000$90,000
1999Q1
2000Q1
2001Q1
2002Q1
2003Q1
2004Q1
2005Q1
2006Q1
2007Q1
2008Q1
2009Q1
2010Q1
2011Q1
2012Q1
2013Q1
35-44current
35-44in1999
$0$10,000$20,000$30,000$40,000$50,000$60,000$70,000$80,000$90,000
1999Q1
2000Q1
2001Q1
2002Q1
2003Q1
2004Q1
2005Q1
2006Q1
2007Q1
2008Q1
2009Q1
2010Q1
2011Q1
2012Q1
2013Q1
45-54current
45-54in1999
$0
$10,000
$20,000
$30,000
$40,000
$50,000
$60,000
$70,000
1999Q1
2000Q1
2001Q1
2002Q1
2003Q1
2004Q1
2005Q1
2006Q1
2007Q1
2008Q1
2009Q1
2010Q1
2011Q1
2012Q1
2013Q1
55-64current
55-64in1999
Figure 12: Total debt balances by current age, and by age in 1999. Source: Authors’calculation based on Federal Reserve Bank of New York’s Consumer Credit Panel/EquifaxData.
individuals in age bin i and Equifax Riskscore quartile j = 1, 2, 3, 4 in 1999 at quarter t.
Additionally, let xj1999t be the average value of variable x in quarter t for credit score quartile
j in 1999:
xj1999t =∑i
πi,j1999 × xi,j1999t , (1)
Using xit the average value of a variable x for individuals in age bin i in quarter t, we compute
the counterfactual value of that variable for Equifax Riskscore quartile j = 1, 2, 3, 4 in 1999
as follows:
x̂j1999t =∑i
πi,j1999 × xit. (2)
We compare these counterfactual debt balances to actual debt balances by 1999 and 8Q
lagged credit score quartile. If there is no difference between the counterfactual series and
the series for 8 quarter lagged ranking, then all the discrepancy between the 1999 ranking
and the 8 quarter lagged is due to life-cycle effects. Figure 13 displays the results. Consistent
14

with the previous counterfactual and with the age distribution by 1999 credit score quartile,
removing life cycle effects decreases debt growth for the 1st quartile of the 1999 credit score
ranking, and increases debt growth for the 4th quartile of the 1999 credit score ranking. For
the first quartile, the impact of life cycle borrowing is greatest at the height of the credit
boom and during the crisis and its aftermath. The gap between actual and counterfactual per
capita total debt balances is over 50%, suggesting that approximately half of the difference
in debt growth between the 1999 and 8 quarter lagged credit score ranking is due to life cycle
effects. For the 4th quartile, total debt balances would have been approximately twice as
large absent aging from 2007 onward, and the life cycle considerations explain virtually all
the gap between the 1999 and 8 quarter lagged credit score ranking. Life cycle effects are also
sizable for the second quartile of the 1999 credit score distribution, they account for about
25% of total debt balances between 2007 and 2009 and explain most of the discrepancy with
the 8 quarter lagged credit score ranking for that period.
0.0
0.5
1.0
1.5
2.0
2.5
3.0
2001Q1
2001Q4
2002Q3
2003Q2
2004Q1
2004Q4
2005Q3
2006Q2
2007Q1
2007Q4
2008Q3
2009Q2
2010Q1
2010Q4
2011Q3
2012Q2
2013Q1
2013Q4
1999Quar1le1
1999Quar1le1Counterfactual
8QLaggedQuar1le10.0
0.5
1.0
1.5
2.0
2.52001Q1
2001Q4
2002Q3
2003Q2
2004Q1
2004Q4
2005Q3
2006Q2
2007Q1
2007Q4
2008Q3
2009Q2
2010Q1
2010Q4
2011Q3
2012Q2
2013Q1
2013Q4
1999Quar1le2
1999Quar1le2Counterfactual
8QLaggedQuar1le2
0.0
0.5
1.0
1.5
2.0
2.5
2001Q1
2001Q4
2002Q3
2003Q2
2004Q1
2004Q4
2005Q3
2006Q2
2007Q1
2007Q4
2008Q3
2009Q2
2010Q1
2010Q4
2011Q3
2012Q2
2013Q1
2013Q4
1999Quar1le3
1999Quar1le3Counterfactual
8QLaggedQuar1le30.0
0.5
1.0
1.5
2.0
2.5
2001Q1
2001Q4
2002Q3
2003Q2
2004Q1
2004Q4
2005Q3
2006Q2
2007Q1
2007Q4
2008Q3
2009Q2
2010Q1
2010Q4
2011Q3
2012Q2
2013Q1
2013Q4
1999Quar1le4
1999Quar1le4Counterfactual
8QLaggedQuar1le4
Figure 13: Total debt balances. Actual and counterfactual by 1999 Equifax Riskscore quar-tile. Actual by 8Q lagged Equifax Riskscore quartile. Source: Authors’ calculation based onFederal Reserve Bank of New York’s Consumer Credit Panel/Equifax Data.
15

Taken together, these results suggest that life cycle effects in borrowing are very strong
and sizably effect debt growth for individuals at the extreme of the 1999 credit distribution.
There are especially important for individuals in the first quartile of the credit score distri-
bution in 1999, for whom most of the subsequent credit growth is due exclusively to these
life cycle considerations.
5 Credit Score and Income
The rationale behind using a recent credit score to rank individuals is twofold. First, this
measure better reflects their perceived default risk at the time of borrowing. In addition,
it is closely related to individual’s current labor income. In this section, we estimate the
relation between 8 quarter lagged credit score and income. The Equifax Consumer Credit
Panel does not provide individual income. However, for 2009, we have access to Equifax
Worknumber payroll data, linked to the Equifax credit files. The income data, which is from
a large payroll verification firm, is available for a subsample of over 11,000 individuals in the
credit panel, and it is nationally representative. We construct a total labor income measure
using information on pay rate and pay frequency. Detailed information on the construction
of this measure and on other features of these data are provided in Appendix B.
Table 1 displays the distribution of 8 quarter lagged credit score and total income for the
Worknumber data. Median labor income is 39,520$, while the median credit score is 700.
Table 1: Distribution of credit score and labor income in 2009
Percentile 10% 25% 50% 75% 90% Mean St.Dev.
Riskscore 519 602 700 775 808 680 112Income 16,640 22,880 39,520 64,100 99,840 49,728 35,057
Credit score is the 8 quarter lagged Equifax Riskscore. Labor income is Equifax Worknumber
total annual labor income. Source: Authors’ calculations based on Federal Reserve Bank of New
York’s Consumer Credit Panel/Equifax Data.
To evaluate the relation between income and credit score, we regress the 8 quarter lagged
credit score on income, income square, age, age square, state fixed effects and time effects.4
The estimated coefficients on income are highly significant, and suggest that the variation
4Since the credit score is bounded above, we use a truncated regression approach. Additionally, standarderrors are clustered at the state level.
16

in credit scores largely accounted for by variation in income, conditional on age. A change
from the 25th to 75th percentile of the income distribution raises the 8 quarter lagged credit
score by 120 points. This amounts to 69% of the change from 25th to 75th percentile of the
credit score distribution.
This strong relation between credit score and income, conditional on age, suggests that
the probability of default in the next 4 quarters is also closely to income. This is not
surprising, as current income is the source for principal and interest payments on outstanding
debt for most borrowers.
6 Broader Implications: Role of Collateral Channel
Our results pose a challenge for the prevailing narrative that the main precursor of the run-
up in defaults during the financial crisis was the rise in sub-prime lending, which caused
house prices to drop (Mian and Sufi (2009), Mian and Sufi (2015b)). According to this
view, the subsequent drop in house prices induced a broad contraction in aggregate demand,
propagating the shock originated in the sub-prime segment to the overall economy. Instead,
our analysis suggest that a sharp rise in credit the preceded the crisis was driven by prime
borrowers who exhibit unprecedentedly high rates of default during the crisis. These new
findings raise new questions on the determinants of the financial crisis and the policies
necessary to cure it and prevent future episodes.
The collateral value of real estate has generated a sizable related literature focussing on
the role of home borrowing in household credit. Specifically, this research emphasizes that a
decline in house prices would be associated in a contraction of the supply of credit, through
the reduction in the value of collateral (Iacoviello (2004), Guerrieri and Lorenzoni (2011),
Kehoe, Midrigan, and Pastorino (2014)). Our results so far also cast doubt on this collateral
channel, since we find very similar patterns across all debt categories, including those ones
not collateralized by housing equity and unsecured debt, such as auto loans and credit card
debt.
We now provide further evidence specifically on the role of the collateral channel for
the behavior of household credit during the boom, and especially in the aftermath of the
2007-09 financial crisis. We show that home-equity loans, such as HELOCs and other non-
mortgage home debt, constitute a very small fraction of total debt balances and play a small
role in the variation of household credit around the financial crisis. We then show that the
contraction of total home debt during and after the financial crisis is smaller than for other
debt categories. Lastly, we distinguish between homeowners and non-homeowners in our
17

sample.5 We show that the borrowing by non-homeowners exhibits a slower growth in the
boom, but a much sharper contraction in the recession. For homeowners, the contraction in
non-home related debt during the crisis is much more severe than the decline in home debt.
This evidence, while still suggestive, is consistent with borrowing behavior during and after
the crisis driven by an aggregate shock other the decline in housing values, though possibly
correlated with this decline.
6.1 Debt Composition
We begin by studying the composition of household debt holdings at different points in
time. We consider 2001, the first year of analysis; 2008, which marks the peak of the credit
boom; and finally 2013, the last year in our sample. Figure 14 presents the composition of
total balances in these three years. First, HELOCs and home installment loans are the two
smallest components of aggregate balances, followed by credit card, auto loans and then the
biggest component–mortgages. Second, the percentage contribution of each of these types of
debt remained fairly constant during the credit contraction period (between 2008 and 2013),
with the contribution of credit card debt (and home installment loans, although those loans
are extremely small) falling most noticeably and the contribution of mortgage debt rising
slightly. This implies that all types of debt fell during the recession, with credit card debt
falling the most, and mortgage debt falling least.
$0
$5,000
$10,000
$15,000
$20,000
$25,000
$30,000
$35,000
$40,000
$45,000
$50,000
CreditCard Mortgage HELOC HomeInstallmentLoan Auto
2001
2008
2013
0%
10%
20%
30%
40%
50%
60%
70%
80%
90%
CreditCard Mortgage HELOC HomeInstallmentLoan Auto
2001
2008
2013
Figure 14: Composition of total debt balances in selected years: values (left panel) andpercent contribution (right panel). Source: Authors’ calculation based on Federal ReserveBank of New York’s Consumer Credit Panel/Equifax Data.
5Our definition of homeownership is based on the presence of outstanding real estate debt holdings on anindividual’s record. We discuss this definition in more detail below.
18

Home Equity Loans We now further investigate the behavior of home-equity based debt,
compared to other debt categories. Specifically, we compare total balances, total balances
net of home-equity lines, which exclude HELOCs and other home-equity lines of credit, and
total balances without all real estate debt, a category which additionally excludes mortgage
balances.
Figure 15 presents the time series of total balances and total balances net of home equity
loans (i.e. HELOCs and home equity lines of credit). First, home equity loans contribute only
marginally to the dynamics of total debt balances, as total balances with and without home
equity loans are almost identical (left panel). In particular, since the start of the contraction
in aggregate credit in 2008Q3, total debt with and without home lines contract at virtually
the same pace, which is inconsistent with the notion that the contraction in household debt
was driven by the decline in home equity loans. We also investigate the role of real estate
debt in its entirety. Figure 16 presents the results. Mortgage debt clearly played a crucial
role in the rise of total balances between 2001 and 2008 (left panel). However, the drop in
balances starting from the peak of debt (2008Q3) was significantly faster for non-home debt
than for real estate debt (right panel). Non-home balances dropped by 17% of the 2008 level
by 2011Q1, while overall balances dropped by only 9%.
0.00
0.50
1.00
1.50
2.00
2.50
3.00
199903
200006
200109
200212
200403
200506
200609
200712
200903
201006
201109
201212
AggregateBalances
AggregateBalances-HomeLines0.75
0.80
0.85
0.90
0.95
1.00
1.05
200809
200903
200909
201003
201009
201103
201109
201203
201209
201303
201309
AggregateBalances
AggregateBalances-HomeLines
Figure 15: Total debt balances with and without home equity loans (HELOCs and homeequity lines of credit) during the credit boom (left panel) and bust (right panel). Seriesrescaled by own value in first quarter. Source: Authors’ calculation based on Federal ReserveBank of New York’s Consumer Credit Panel/Equifax Data.
19

0.0
0.5
1.0
1.5
2.0
2.5
3.0
199903
200006
200109
200212
200403
200506
200609
200712
200903
201006
201109
201212
AggregateBalances
AggregateBalances-HomeDebt0.5
0.6
0.7
0.8
0.9
1.0
1.1
200809
200903
200909
201003
201009
201103
201109
201203
201209
201303
201309
AggregateBalances
AggregateBalances-HomeLines
Figure 16: Total debt balances with and without home equity loans (HELOCs, home equitylines of credit and mortgages) during the credit boom (left panel) and bust (right panel).Series rescaled by own value in first quarter. Source: Authors’ calculation based on FederalReserve Bank of New York’s Consumer Credit Panel/Equifax Data.
6.2 Homeowners versus Non-homeowners
Our next set of results pertains to the behavior of homeowners and non-homeowners. We
identify homeowners in our sample by the presence of any real estate debt (mortgage, HE-
LOC, home equity line of credit) on their record in the last 4 quarters. Hence, we capture
all individuals who borrow against real estate in any way, but not include individuals who
own a home but do not borrow against it. Our definition is dictated by the nature of our
data, and clearly does not capture all homeowners.However, we don’t think this limitation
is particularly significant for our analysis, since home owners who have no active real estate
loans, who fall into our non-homeowner category, are likely to be older or in high income
and wealth brackets, and thus probably not face binding borrowing constraints.Given this,
we view our homeownership classification as adequate for exploring the link between decline
in housing values and contraction in borrowing during and after the financial crisis.
Our findings suggest that the decline in household borrowing during and in the aftermath
of the financial crisis was not driven by a decline in real estate debt. As shown in figure 17,
total debt balances, while homeowners homeowners experienced a much larger rise in total
debt balances, the decline in total debt balances from the peak of 2008Q3 was significantly
bigger for non-homeowners. This finding is consistent with mortgages driving the rise in
debt during the boom, but falling very slowly during the crisis, as shown in figure 16. The
magnitude in the gap in the change in total debt balances between homeowners and non
homeowners is very sizable. By 2011Q1, non homeowner total debt balances dropped by
20

more than 16%, compared to less than 6% for homeowners. This pattern holds for all types
of debt as well. Figure 18 shows the behavior of credit card balances, which by definition
are not collateralized. Credit card borrowing grows less but falls more for non homeowners
when compared to homeowners in our sample.
0.0
0.5
1.0
1.5
2.0
2.5
200103
200206
200309
200412
200603
200706
200809
200912
201103
201206
201309
non-homeowners
homeowners0.75
0.80
0.85
0.90
0.95
1.00
200809
200903
200909
201003
201009
201103
201109
201203
201209
201303
201309
non-homeowners
homeowners
Figure 17: Total debt balances by homeownership status during the credit boom (left panel)and bust (right panel). Series rescaled by own value in first quarter. Source: Authors’calculation based on Federal Reserve Bank of New York’s Consumer Credit Panel/EquifaxData.
0.8
0.9
1.0
1.1
1.2
1.3
1.4
1.5
1.6
200103
200206
200309
200412
200603
200706
200809
200912
201103
201206
201309
non-homeowners
homeowners
0.60
0.65
0.70
0.75
0.80
0.85
0.90
0.95
1.00
1.05
200809
200903
200909
201003
201009
201103
201109
201203
201209
201303
201309
non-homeowners
homeowners
Figure 18: Credit card balances by homeownership status during the credit boom (left panel)and bust (right panel). Series rescaled by own value in first quarter. Source: Authors’calculation based on Federal Reserve Bank of New York’s Consumer Credit Panel/EquifaxData.
21

7 Interpretation and Ongoing Work
Our analysis challenges the prevailing view of the 2007-09 financial crisis, which emphasizes
the growth of subprime credit during the boom and the role of a decline in the value of real
estate collateral during the crisis. We show that most of the growth in credit during the 2001-
2007 boom is concentrated in the prime segment, and this segment is also responsible for
the growth in defaults and foreclosures during the crisis. We also present evidence strongly
suggesting that forces other than house price dynamics were behind the household credit
cycle during the great recession. Aggregated data points to several robust findings. First,
while all debt categories exhibit a strong boom-bust pattern, this pattern is much more
pronounced for non-housing debt. Second, non homeowners exhibited a much larger decline
in debt balances when compared to homeowners during and after the recession.
Our findings call for a deeper analysis is needed to understand the causes of the sizable
reduction in household credit which took place during and after the financial crisis. In
ongoing work, we are studying the patterns of geographical variation in the evolution of
debt balances by categories, in order to provide a more definitive evidence on the mechanism
behind the variation in household credit.
22
References
Adelino, Manuel, Antoinette Schoar, and Felipe Severino. 2015. “Loan Originations and
Defaults in the Mortgage Crisis: The Role of the Middle Class.” Technical Report,
National Bureau of Economic Research WP 20848.
Guerrieri, Veronica, and Guido Lorenzoni. 2011. “Credit crises, precautionary savings, and
the liquidity trap.” Technical Report, National Bureau of Economic Research.
Hurst, Erik, and Frank Stafford. 2004. “Home is where the equity is: Mortgage refinancing
and household consumption.” Journal of Money, Credit and Banking, pp. 985–1014.
Iacoviello, Matteo. 2004. “Consumption, house prices, and collateral constraints: a struc-
tural econometric analysis.” Journal of Housing Economics 13 (4): 304–320.
Kehoe, Patrick, Virgiliu Midrigan, and Elena Pastorino. 2014. Debt constraints and em-
ployment.
Lee, Donghoon, and Wilbert van der Klaauw. 2010. “An Introduction to the FRBNY
Consumer Credit Panel.” FRBNY Staff Report 479.
Mian, Atif, Kamalesh Rao, and Amir Sufi. 2013. “Household Balance Sheets, Consumption,
and the Economic Slump.” The Quarterly Journal of Economics 128 (4): 1687–1726.
Mian, Atif, and Amir Sufi. 2009. “The Consequences of Mortgage Credit Expansion:
Evidence from the U.S. Mortgage Default Crisis.” The Quarterly Journal of Economics
124 (4): 1449–1496.
. 2010. “The Great Recession: Lessons from Microeconomic Data.” The American
Economic Review 100 (2): 51–56.
. 2011. “House Prices, Home Equity–Based Borrowing, and the US Household
Leverage Crisis.” The American Economic Review 101 (5): 2132–2156.
. 2015a. “HOUSEHOLD DEBT AND DEFAULTS FROM 2000 TO 2010: FACTS
FROM CREDIT BUREAU DATA.” NBER WP, no. 21203.
. 2015b. “Household Debt and Defaults from 2000 to 2010: Facts from Credit Bureau
Data.” Technical Report, National Bureau of Economic Research.
Mian, Atif, Amir Sufi, and Francesco Trebbi. 2011. “Foreclosures, house prices, and the
real economy.”
23

A Consumer Credit Panel Data and Variables
We briefly describe the construction of each variable in the analysis.
Insolvent: An individual is insolvent if they have at least one loan in their CCP reportin that quarter that is 120+ days past due, severely derogatory, or bankrupt (crtr attr16,crtr attr17, or crtr attr18), while not having any loans that are 30, 60, or 90 days past due(crtr attr13, crtr attr14, or crtr attr15). Also, at least one of crtr attr13, crtr attr14, orcrtr attr15 must be non-missing, and the individual must not be in a state of bankruptcy.
Foreclosure: There are two scenarios in which an individual is marked as being in thestate of foreclosure. First, if the individual forecloses on a home (that is, if cma attr3905switches from off (”0”) to on (”1” or ”7”)), then that individual is marked as being in a stateof foreclosure for seven years after the date of their foreclosure. Second, if the individualenters the dataset for the first time while under foreclosure (which almost exclusively occursat the datasets 1999 Q1 truncation), that individual is marked as being in the state offoreclosure until the flag (which is supposed to stay on for seven years after the date of theforeclosure) turns off.
B Income Data
In this section, we describe the supplementary payroll data used for the income imputationprocedure. This data is merged with our credit panel data, allowing us to map individuals’incomes for 2009 to their credit files.
The Equifax Workforce Solutions data provided by Equifax is a nationally-representativerandom sample of individuals containing employment and payroll verification informationprovided directly from the employers. The information provided for each employee includesthe last three years of total income, the date of first hire, tenure, and for the current yearstatus (part time/full time), weekly hours, pay rate and pay frequency.
Income Measure Description There are various income measures provided in theWorknumber dataset. For each year of data available variables are given for the total 12-month base, bonus, overtime, and commission compensation in year t, t− 1, and t− 2. Thisinformation however is only available for a little over 1
3of the sample. The other measure
of income, which is widely available across the sample, is rate of pay and pay frequency.We therefore impute total income using a simple rate × frequency approach to account forthe lack of representation found in the sample regarding the total 12-month income vari-ables. This yields about 11,000 observations for 2009. The sample of records is nationallyrepresentative, both in terms of geographical and age distribution.
Comparison with the CPS To gauge the accuracy of the imputed income measure in ourdata, we performed a simple comparison with the income levels reported in the ConsumerPopulation Survey. We present results based on income quintiles below.
24

Table 2: Income Distribution Comparison by Quintile
Calculation Dataset 1 2 3 4 5
Mean CPS 11058.67 24791.32 36584.61 51872.45 110192.2Worknumber 17078.07 26565.46 39589.76 58510.22 117260.1
Median CPS 12000 25000 36000 50000 85000Worknumber 16640 27040 39520 57512 99990
Source: IPUMS, Equifax Worknumber. Worknumber income calculations made using proxied income from
pay periods and pay rate. CPS income calculations made using total wage and salary income.
25

Credit Growth and the FinancialCrisis: A New Narrative
Stefania Albanesi, OSU
Giacomo DeGiorgi, FRBNY
Jaromir Nosal, Boston College
Matthew Ploenzke, Harvard
14th Workshop on Macroeconomic Dynamics:Theory and Applications
Milan, December 21 2015
The views expressed here are those of the authors and do not necessarily reflect the views of the
Federal Reserve Bank of New York or the Federal Reserve System.

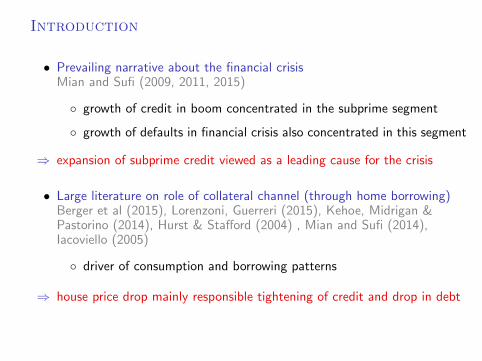
Introduction
• Prevailing narrative about the financial crisisMian and Sufi (2009, 2011, 2015)
◦ growth of credit in boom concentrated in the subprime segment
◦ growth of defaults in financial crisis also concentrated in this segment
⇒ expansion of subprime credit viewed as a leading cause for the crisis
• Large literature on role of collateral channel (through home borrowing)Berger et al (2015), Lorenzoni, Guerreri (2015), Kehoe, Midrigan &Pastorino (2014), Hurst & Stafford (2004) , Mian and Sufi (2014),Iacoviello (2005)
◦ driver of consumption and borrowing patterns
⇒ house price drop mainly responsible tightening of credit and drop in debt

Introduction
• Study behavior of household credit and delinquency, 1999-2013
◦ leading up and following the 2007-09 financial crisis
• Large, panel dataset: FRBNY CCP/Equifax data
debt positions, delinquencies, credit scores
1. Credit growth during boom and defaults during the crisis concentrated atmid/top of credit score distribution for all debt categories
◦ challenges prevailing narrative (consistent with Adelino, Shoar,Severino (2015) findings for home debt)
2. Limited role of collateral channel
◦ small contribution of home equity debt to credit boom
◦ debt contraction bigger for non-homeowners, non-home debt
◦ inconsistent with house prices driving credit bust

Data
• Federal Reserve Bank of New York Consumer Credit Panel/Equifax Data
◦ quarterly, 1999:Q1-2013:Q4
◦ all individuals with an Equifax credit report (anonymous)
• Use 1% sample – about 2.5 million individuals each quarter
• Over 600 variables
◦ all aspects of financial liabilities:by type of account, balances, numbers
◦ delinquent behavior: by severity, type of debt
◦ public record items: court judgements, collections, etc.
◦ credit score, age, ZIP code
• For 2009, matched to payroll data

New Evidence
• Study dynamics of debt and delinquency based on 8Q lagged credit scores
◦ recent risk score, but not contemporaneous with delinquencies
• Findings:
◦ credit growth during boom is concentrated in 2nd-4th quartile
◦ new insolvencies and foreclosures concentrated in 2nd and 3rdquartile
◦ share of new insolvencies and foreclosures to 1st quartile drops duringcrisis; rises for higher quartiles
• Role of subprime segment magnified by ranking with initial credit scores
1996 (Mian & Sufi 2009) and 1997 (Mian & Sufi 2015)
◦ discrepancy between rankings mostly accounted for by life cyclefactors

Debt: Total Debt Balances
• 1999 ranking overstates debt growth for first quartile (subprime segment)
8Q lagged Equifax Riskscore 1999 Equifax Riskscore
Ratio to 2001Q1 (3QMA)
2001Q12002Q12003Q1 2004Q12005Q12006Q12007Q1 2008Q12009Q12010Q12011Q1 2012Q12013Q1 1.0000
1.2000
1.4000
1.6000
1.8000
2.0000
2.2000
2.4000
2.6000
2.8000
Ratio to 2001Q1 (3QMA)
1.0000
1.2000
1.4000
1.6000
1.8000
2.0000
2.2000
2.4000
2.6000
2.8000Quartile 4 (Highest)Quartile 3Quartile 2Quartile 1 (Lowest)
Ratio to 2001Q1 (3QMA)
2001Q12002Q12003Q1 2004Q12005Q12006Q12007Q1 2008Q12009Q12010Q12011Q1 2012Q12013Q1 1.0000
1.2000
1.4000
1.6000
1.8000
2.0000
2.2000
2.4000
2.6000
2.8000
Ratio to 2001Q1 (3QMA)
1.0000
1.2000
1.4000
1.6000
1.8000
2.0000
2.2000
2.4000
2.6000
2.8000
Quartile 4 (Highest)Quartile 3Quartile 2Quartile 1 (Lowest)
Total aggregate debt balances by Equifax Riskscore quartile. Ratio to 2001Q1.Source: Authors’ calculations based on FRBNY CCP/Equifax Data.

Debt: Mortgage Balances
• 1999 ranking overstates debt growth for first quartile (subprime segment)
8Q lagged Equifax Riskscore 1999 Equifax Riskscore
Ratio to 2001Q1 (3QMA)
2001Q12002Q12003Q1 2004Q12005Q12006Q12007Q1 2008Q12009Q12010Q12011Q1 2012Q12013Q1
1.0000
1.5000
2.0000
2.5000
Ratio to 2001Q1 (3QMA)
1.0000
1.5000
2.0000
2.5000
Quartile 4 (Highest)Quartile 3Quartile 2Quartile 1 (Lowest)
Ratio to 2001Q1 (3QMA)
2001Q12002Q12003Q1 2004Q12005Q12006Q12007Q1 2008Q12009Q12010Q12011Q1 2012Q12013Q1
1.0000
1.5000
2.0000
2.5000
Ratio to 2001Q1 (3QMA)
1.0000
1.5000
2.0000
2.5000
Quartile 4 (Highest)Quartile 3Quartile 2Quartile 1 (Lowest)
Average mortgage balance. Ratio 2001Q1.Source: Authors’ calculations based on FRBNY CCP/Equifax Data.

Debt: Mortgage Originations
• 1999 ranking overstates debt growth for first quartile (subprime segment)
8Q lagged Equifax Riskscore 1999 Equifax Riskscore
fraction
2001Q12002Q12003Q1 2004Q12005Q12006Q12007Q1 2008Q12009Q12010Q12011Q1 2012Q12013Q10
0.05
0.1
0.15
0.2
0.25
fraction
0
0.05
0.1
0.15
0.2
0.25Quartile 4 (Highest)Quartile 3Quartile 2Quartile 1 (Lowest)
fraction
2001Q12002Q12003Q1 2004Q12005Q12006Q12007Q1 2008Q12009Q12010Q12011Q1 2012Q12013Q10
0.05
0.1
0.15
0.2
0.25
fraction
0
0.05
0.1
0.15
0.2
0.25Quartile 4 (Highest)Quartile 3Quartile 2Quartile 1 (Lowest)
Fraction with a new origination in the last year.Source: Authors’ calculations based on FRBNY CCP/Equifax Data.

Debt: Credit Card Balances
• 1999 ranking overstates growth for first quartile (subprime segment)
8Q lagged Equifax Riskscore 1999 Equifax Riskscore
Ratio to 2001Q1 (3QMA)
2001Q12002Q12003Q1 2004Q12005Q12006Q12007Q1 2008Q12009Q12010Q12011Q1 2012Q12013Q1 0.8000
1.0000
1.2000
1.4000
1.6000
1.8000
2.0000
Ratio to 2001Q1 (3QMA)
0.8000
1.0000
1.2000
1.4000
1.6000
1.8000
2.0000Quartile 4 (Highest)Quartile 3Quartile 2Quartile 1 (Lowest)
Ratio to 2001Q1 (3QMA)
2001Q12002Q12003Q1 2004Q12005Q12006Q12007Q1 2008Q12009Q12010Q12011Q1 2012Q12013Q1 0.8000
1.0000
1.2000
1.4000
1.6000
1.8000
2.0000
Ratio to 2001Q1 (3QMA)
0.8000
1.0000
1.2000
1.4000
1.6000
1.8000
2.0000
Quartile 4 (Highest)Quartile 3Quartile 2Quartile 1 (Lowest)
Average credit card balances. Ratio to 2001Q1.Source: Authors’ calculations based on FRBNY CCP/Equifax Data.
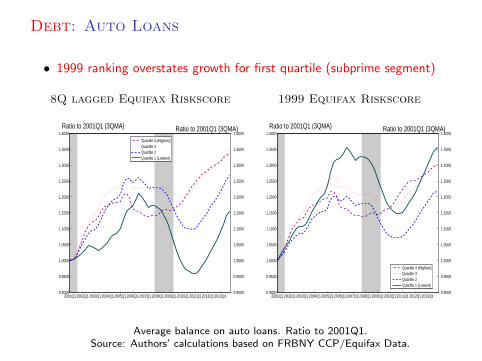
Debt: Auto Loans
• 1999 ranking overstates growth for first quartile (subprime segment)
8Q lagged Equifax Riskscore 1999 Equifax Riskscore
Ratio to 2001Q1 (3QMA)
2001Q12002Q12003Q1 2004Q12005Q12006Q12007Q1 2008Q12009Q12010Q12011Q1 2012Q12013Q1 0.9000
0.9500
1.0000
1.0500
1.1000
1.1500
1.2000
1.2500
1.3000
1.3500
1.4000
Ratio to 2001Q1 (3QMA)
0.9000
0.9500
1.0000
1.0500
1.1000
1.1500
1.2000
1.2500
1.3000
1.3500
1.4000
Quartile 4 (Highest)Quartile 3Quartile 2Quartile 1 (Lowest)
Ratio to 2001Q1 (3QMA)
2001Q12002Q12003Q1 2004Q12005Q12006Q12007Q1 2008Q12009Q12010Q12011Q1 2012Q12013Q1 0.9000
0.9500
1.0000
1.0500
1.1000
1.1500
1.2000
1.2500
1.3000
1.3500
1.4000
Ratio to 2001Q1 (3QMA)
0.9000
0.9500
1.0000
1.0500
1.1000
1.1500
1.2000
1.2500
1.3000
1.3500
1.4000
Quartile 4 (Highest)Quartile 3Quartile 2Quartile 1 (Lowest)
Average balance on auto loans. Ratio to 2001Q1.Source: Authors’ calculations based on FRBNY CCP/Equifax Data.

Delinquency: New Insolvencies
• Share of new insolvencies to 1st quartile drops during crisis; share of 3rdquartile rises
Fraction with Share of
fraction
2001Q12002Q12003Q1 2004Q12005Q12006Q12007Q1 2008Q12009Q12010Q12011Q1 2012Q12013Q10
0.002
0.004
0.006
0.008
0.01
0.012
0.014
0.016
fraction
0
0.002
0.004
0.006
0.008
0.01
0.012
0.014
0.016
Quartile 4 (Highest)Quartile 3Quartile 2Quartile 1 (Lowest)
fraction
2001Q12002Q12003Q1 2004Q12005Q12006Q12007Q1 2008Q12009Q12010Q12011Q1 2012Q12013Q10
0.1
0.2
0.3
0.4
0.5
fraction
0
0.1
0.2
0.3
0.4
0.5
Quartile 4 (Highest)Quartile 3Quartile 2Quartile 1 (Lowest)
New insolvencies (120 days+late) by credit score quartile, 8Q lagged Equifax Riskscore.Source: Authors’ calculations based on FRBNY CCP/Equifax Data.

Delinquency: New Foreclosures
• Share of new foreclosures to 1st quartile drops during crisis; share of 2ndand 3rd quartile rises
Fraction with Share of
fraction
2001Q12002Q12003Q1 2004Q12005Q12006Q12007Q1 2008Q12009Q12010Q12011Q1 2012Q12013Q10
0
0.001
0.002
0.002
0.002
0.003
0.004
0.004
0.005
0.005
fraction
0
0
0.001
0.002
0.002
0.002
0.003
0.004
0.004
0.005
0.005Quartile 4 (Highest)Quartile 3Quartile 2Quartile 1 (Lowest)
fraction
2001Q12002Q12003Q1 2004Q12005Q12006Q12007Q1 2008Q12009Q12010Q12011Q1 2012Q12013Q10
0.1
0.2
0.3
0.4
0.5
0.6
0.7
fraction
0
0.1
0.2
0.3
0.4
0.5
0.6
0.7Quartile 4 (Highest)Quartile 3Quartile 2Quartile 1 (Lowest)
New foreclosures by credit score quartile, 8Q lagged Equifax Riskscore.Source: Authors’ calculations based on FRBNY CCP/Equifax Data.

Role of Life Cycle
• MS 2009-2015 rank individuals by their credit score over 15 years ago,exaggerating credit growth to low score individuals
• Low credit score individuals are disproportionately young
◦ young experience future credit growth due to life cycle
◦ life cycle credit growth related to life cycle income growth
◦ credit score at time of borrowing higher than when young
• 4-12 quarter lagged credit score
◦ closely related to income at time of borrowing
◦ provides better assessment of individual default risk

Credit Score and Age
• Low credit score individuals are disproportionately young
0
0.05
0.1
0.15
0.2
0.25
0.3
0.35
0.4
25_34 35_44 45_54 55_64 65_more
Quar2le 1
Quar2le 2
Quar2le 3
Quar2le 4
Fraction in each age bin in 1999 by Equifax Riskscore quartile in 1999.Source: Authors’ calculations based on FRBNY CCP/Equifax Data.

Credit Score and Age
• Low credit score individuals in 1999 exhibit credit score growth over time
Ratio to 2001Q1 (3QMA)
2001Q12002Q12003Q1 2004Q12005Q12006Q12007Q1 2008Q12009Q12010Q12011Q1 2012Q12013Q1
0.9600
0.9800
1.0000
1.0200
1.0400
1.0600
1.0800
1.1000
1.1200
Ratio to 2001Q1 (3QMA)
0.9600
0.9800
1.0000
1.0200
1.0400
1.0600
1.0800
1.1000
1.1200
Quartile 4 (Highest)Quartile 3Quartile 2Quartile 1 (Lowest)
Current credit score as ratio to 1999, by Equifax Riskscore quartile in 1999.Source: Authors’ calculations based on FRBNY CCP/Equifax Data.

Credit Score and Age
credit score at t = age FE + time FE + state FE
• Estimated age effects
-20
0
20
40
60
80
100
120
140
160
21 26 31 36 41 46 51 56 61 66 71 76 81
Source: Authors’ calculations based on FRBNY CCP/Equifax Data.

Debt Balances and Age
total balances at t = age FE + time FE + state FE
• Estimated age effects
-$3,000
-$2,000
-$1,000
$0
$1,000
$2,000
$3,000
$4,000
-$30,000
-$20,000
-$10,000
$0
$10,000
$20,000
$30,000
$40,000
$50,000
21 26 31 36 41 46 51 56 61 66 71 76 81
AggregateBalances
HomeBalances
CreditCardBalances
AutoBalances
Source: Authors’ calculations based on FRBNY CCP/Equifax Data.

Life Cycle and Credit Demand
• To remove life cycle effects on credit growth:
◦ assign to each 1999 age bin in each quarter the debt balances ofindividuals who currently are in that age bin
i.e. if 25-34 yo in 1999, always behave like current 25-34 yo
◦ compute counterfactual debt balances by 1999 credit score quartile
◦ compare counterfactuals to actual debt balances
i.e. if same, all difference due to life-cycle effects
• Findings
◦ 25-44 in 1999 experience more debt growth than current 25-44
◦ 45-64 in 1999 experience less debt growth than current 45-64
◦ most of 1999 and 8Q ranking discrepancy accounted for by life cycle

Life Cycle and Credit Demand
• 25-44 yo in 1999 experience more credit growth than current 25-44 yo
• 45-64 yo in 1999 experience less credit growth than current 45-44 yo
$0$10,000$20,000$30,000$40,000$50,000$60,000$70,000$80,000$90,000
1999Q1
2000Q1
2001Q1
2002Q1
2003Q1
2004Q1
2005Q1
2006Q1
2007Q1
2008Q1
2009Q1
2010Q1
2011Q1
2012Q1
2013Q1
25-34current
25-34in1999
$0$10,000$20,000$30,000$40,000$50,000$60,000$70,000$80,000$90,000
1999Q1
2000Q1
2001Q1
2002Q1
2003Q1
2004Q1
2005Q1
2006Q1
2007Q1
2008Q1
2009Q1
2010Q1
2011Q1
2012Q1
2013Q1
35-44current
35-44in1999
$0$10,000$20,000$30,000$40,000$50,000$60,000$70,000$80,000$90,000
1999Q1
2000Q1
2001Q1
2002Q1
2003Q1
2004Q1
2005Q1
2006Q1
2007Q1
2008Q1
2009Q1
2010Q1
2011Q1
2012Q1
2013Q1
45-54current
45-54in1999
$0
$10,000
$20,000
$30,000
$40,000
$50,000
$60,000
$70,000
1999Q1
2000Q1
2001Q1
2002Q1
2003Q1
2004Q1
2005Q1
2006Q1
2007Q1
2008Q1
2009Q1
2010Q1
2011Q1
2012Q1
2013Q1
55-64current
55-64in1999
Total debt balances by current age, and by age in 1999.Source: Authors’ calculations based on FRBNY CCP/Equifax Data.

Life Cycle and Credit Demand• Removing life cycle effects accounts for most of 1999 and 8Q lagged discrepancy
in debt growth for for 1st and 4th credit score quartile
0.0
0.5
1.0
1.5
2.0
2.5
3.02001Q1
2001Q4
2002Q3
2003Q2
2004Q1
2004Q4
2005Q3
2006Q2
2007Q1
2007Q4
2008Q3
2009Q2
2010Q1
2010Q4
2011Q3
2012Q2
2013Q1
2013Q4
1999Quar1le1
1999Quar1le1Counterfactual
8QLaggedQuar1le10.0
0.5
1.0
1.5
2.0
2.5
2001Q1
2001Q4
2002Q3
2003Q2
2004Q1
2004Q4
2005Q3
2006Q2
2007Q1
2007Q4
2008Q3
2009Q2
2010Q1
2010Q4
2011Q3
2012Q2
2013Q1
2013Q4
1999Quar1le2
1999Quar1le2Counterfactual
8QLaggedQuar1le2
0.0
0.5
1.0
1.5
2.0
2.5
2001Q1
2001Q4
2002Q3
2003Q2
2004Q1
2004Q4
2005Q3
2006Q2
2007Q1
2007Q4
2008Q3
2009Q2
2010Q1
2010Q4
2011Q3
2012Q2
2013Q1
2013Q4
1999Quar1le3
1999Quar1le3Counterfactual
8QLaggedQuar1le30.0
0.5
1.0
1.5
2.0
2.5
2001Q1
2001Q4
2002Q3
2003Q2
2004Q1
2004Q4
2005Q3
2006Q2
2007Q1
2007Q4
2008Q3
2009Q2
2010Q1
2010Q4
2011Q3
2012Q2
2013Q1
2013Q4
1999Quar1le4
1999Quar1le4Counterfactual
8QLaggedQuar1le4
Total debt balances. Actual and counterfactual 1999 Equifax Riskscore quartile, actual 8Qlagged Equifax Riskscore quartile.
Source: Authors’ calculations based on FRBNY CCP/Equifax Data.

Credit Score and Income
• Why are recent credit scores better indicators of default risk?
• Use supplementary payroll data for 2009, merged with Equifax CCP
◦ 11k observations, comparable with CPS, ACS
• Variation in recent credit scores mostly accounted for by variation inincome, conditional on age
◦ Change from 25th to 75th income percentile increases 8Q lagged creditscore by 120 points – 69% of change from 25th to 75th percentile
Percentile 10% 25% 50% 75% 90% Mean St.Dev.
Riskscore 519 602 700 775 808 680 112Income 16,640 22,880 39,520 64,100 99,840 49,728 35,057
Distribution of 8Q lagged Equifax Riskscore and 2009 Worknumber total annuallabor income. Source: Authors’ calculations based on FRBNY CCP/Equifax Data.

Broader Implications
• Prevailing narrative:
sub-prime lending → high default rates → drop in house prices
→ housing crisis
→ drop in collateralized borrowing
• New findings challenge role of subprime borrowing for housing crisis
• Evidence on behavior of housing debt questions role of collateral channel
◦ find boom bust cycle for all types of debt: credit card, auto
◦ contribution of HELOCs and home equity based loans small
◦ debt contraction largest for non-homeowners and for non-home debtfor homeowners

Debt Composition
• Small contribution of HELOCs and home loans to total balances
0
2000
4000
6000
8000
10000
12000
14000
16000
CreditCard Mortgage HELOC HomeInstallmentLoan
Auto
Total debt composition in 1999.Source: Authors’ calculations based on FRBNY CCP/Equifax Data.

Home Equity Debt
• Small contribution of home equity loans to total balances
0.00
10,000.00
20,000.00
30,000.00
40,000.00
50,000.00
60,000.00
70,000.00
1999Q1
2000Q2
2001Q3
2002Q4
2004Q1
2005Q2
2006Q3
2007Q4
2009Q1
2010Q2
2011Q3
2012Q4
Total Balances
Total Balances -‐ Home Equity Lines
Total balances with and without HELOCS and home equity installment loans.Source: Authors’ calculations based on FRBNY CCP/Equifax Data.

Real Estate Debt
• Real estate debt plays large role in credit boom
• Non-home debt drops faster during credit bust
0.0#
0.5#
1.0#
1.5#
2.0#
2.5#
3.0#
1999Q1#
2000Q2#
2001Q3#
2002Q4#
2004Q1#
2005Q2#
2006Q3#
2007Q4#
2009Q1#
2010Q2#
2011Q3#
2012Q4#
Total#Balances#
Total#Balances#7#Real#Estate#Loans#0.5
0.6
0.7
0.8
0.9
1.0
1.1
2008Q3
2009Q1
2009Q3
2010Q1
2010Q3
2011Q1
2011Q3
2012Q1
2012Q3
2013Q1
2013Q3
Total Balances
Total Balances -‐ Real Estate Loans
Total balances with and without real estate debt.Source: Authors’ calculations based on FRBNY CCP/Equifax Data.

Collateral Channel
• Current homeowners (45% of pop.) and current non-homeowners
• Total debt balances:Boom larger for homeowners, bust larger for non-homeowners
0.0
0.5
1.0
1.5
2.0
2.5
2001Q1
2002Q2
2003Q3
2004Q4
2006Q1
2007Q2
2008Q3
2009Q4
2011Q1
2012Q2
2013Q3
non-‐homeowners
homeowners 0.75
0.80
0.85
0.90
0.95
1.00
2008Q3
2009Q1
2009Q3
2010Q1
2010Q3
2011Q1
2011Q3
2012Q1
2012Q3
2013Q1
2013Q3
non-‐homeowners
homeowners
Total debt balances. Source: Authors’ calculations based on FRBNY CCP/Equifax Data.

Collateral Channel
• Current homeowners (45% of pop.) and current non-homeowners
• Credit card balances:Boom somewhat larger for homeowners, bust larger for non-homeowners
0.8
0.9
1.0
1.1
1.2
1.3
1.4
1.5
1.6
2001Q1
2002Q2
2003Q3
2004Q4
2006Q1
2007Q2
2008Q3
2009Q4
2011Q1
2012Q2
2013Q3
non-‐homeowners
homeowners 0.60
0.65
0.70
0.75
0.80
0.85
0.90
0.95
1.00
1.05
2008Q3
2009Q1
2009Q3
2010Q1
2010Q3
2011Q1
2011Q3
2012Q1
2012Q3
2013Q1
2013Q3
non-‐homeowners
homeowners
Credit card balances. Source: Authors’ calculations based on FRBNY CCP/Equifax Data.

Discussion and Ongoing Work
• Reassessment of role of subprime credit in the crisis
◦ need to rethink the determinants of the crisis
◦ crucial in determining optimal policy interventions and regulation
• Why rise in defaults for high credit score/high income individuals?
◦ unrealistic house price and income growth expectations
◦ aggregate shocks
◦ alternative default risk indicators
• Ongoing work: Reassessment of collateral channel
◦ current evidence challenges critical role
◦ further evidence from geographical variation