Creating a Seamless Coastal Zone Soil Survey -...
34
Crossing the Divide – Creating a Seamless Coastal Zone Soil Survey Maggie K. Payne, Jim Turenne USDA NRCS Northeast Arc Users Conference From Summit to Sea, the Landscape of GIS North Falmouth, MA October 16-19, 2016 USDA is an equal opportunity employer, provider, and lender
Transcript of Creating a Seamless Coastal Zone Soil Survey -...

Crossing the Divide – Creating a Seamless Coastal Zone
Soil Survey
Maggie K. Payne, Jim Turenne
USDA NRCS
Northeast Arc Users Conference From Summit to Sea, the Landscape
of GIS North Falmouth, MA October 16-19, 2016
USDA is an equal opportunity employer, provider, and lender

Overview
• Introduction to soils data
• Recent updates
• Coastal zone soil survey initiative
• Interpretation potential
• Where to get the data

Terrestrial (Subaerial) Maps

Subaqueous Maps

Pedologic (Soils) Approach Soil Surveys
• Studied to depth of 2m
• Well-developed classification system (Soil Taxonomy)
• Soil units linked to landscape
• Attribute rich data
• Multiple uses

Why Map Subaqueous and Coastal Soils?
• Coastal Development
• Sea level rise
• Carbon/Blue carbon
• Living shorelines
• Thin layer deposition
• Aquaculture
• Shellfish restoration
• Eelgrass restoration
• Accurate inventories for future projects
• Intense land use - lots of data gaps

Coastal Zone Soil Survey Initiative

Before
Water
Udipsamments: sand
Matunuck: 8-16” of peat
over sand
Beaches:

After
Beaches, sandy surface
Beaches, bouldery surface
Hooksan, Succotash, Sandyhook
drainage catena
Matunuck (8-16”) Pawcatuck (16-50”)
Subaqueous soil information


Challenges – language and gaps

Challenges – elevation and tides

Use and Management - Interpretations
• Coastal erosion hazards
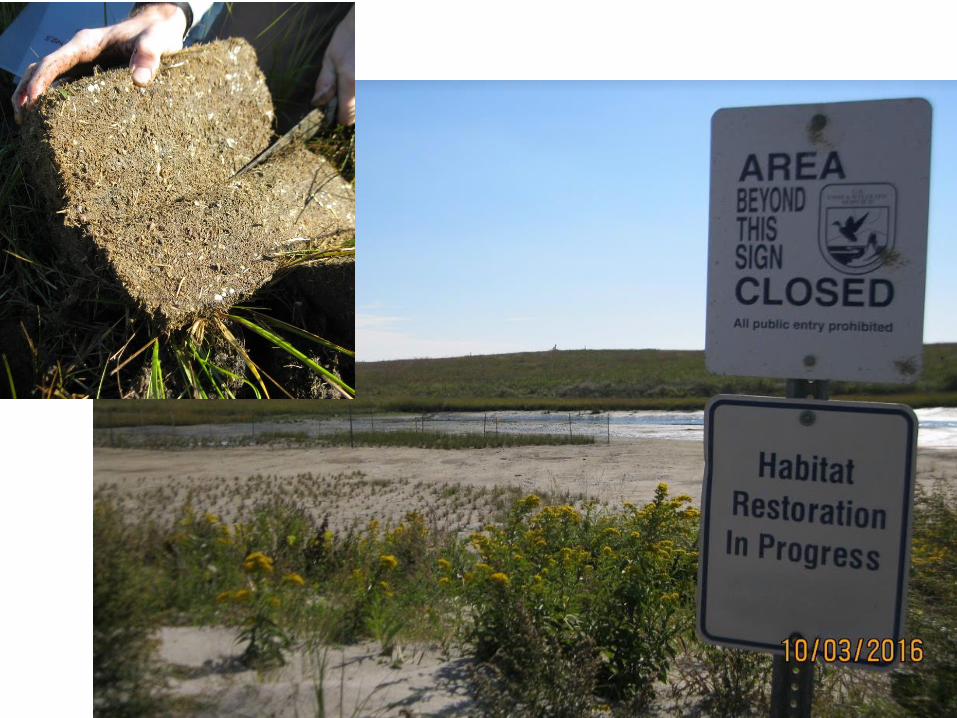
• Marsh restoration
• Carbon sequestration
• Eelgrass habitat potential
• Shellfish habitat potential
• Dredge material disposal concerns

Beaches - sandy
Hooksan
Sandyhook Succotash

Coastal Erosion Hazards


Carbon Accounting
% Organic Carbon in top 100 cm of soil


Ninigret Pond Mean Oyster Length (cm)
October 2008
a a ab
0
1
2
3
4
5
6
7
Washover Fan Slope Washover Fan Mainland Cove Lagoon Bottom
cm
n=90 n=90 n=90 n=90
4.96 4.81 4.69 4.23
26% 16% 18% 2%
After one growing season more than 25% of the Washover Fan Slope oysters were within 15 mm of legal size or were legal sized.
Only 2% of the lagoon bottom oysters were within 15 mm of legal size.

Percent sand (0-30 cm)

Dredge materials
• Acid sulfate soil potential
Ninigret Incubation pH
2.00
3.00
4.00
5.00
6.00
7.00
8.00
9.00
8/20
/200
7
9/3/200
7
9/17
/200
7
10/1/2
007
10/15/200
7
10/29/200
7
pH
Flood Tidal Delta
Washover Fan
Lagoon Bottom
Mainland Cove

Where to get data
• Web Soil Survey (WSS)
– NRCS official data
– Spatial or tabular
– Map online or download for use in GIS
• Google Earth and SoilWeb
– Easy viewing
– Not necessarily up-to-date

Web Soil Survey


Google Earth and Soil Web