
Cost of Final Quality
44
What is Quality “Ability of a complete set of realized inherent characteristic of Product,System,Process to fulfill requirements” •Why Cost of Quality •Management of Quality •For opportunity to improvement •Measuring the progress of the effort of Organization
-
Upload
sarumadamana -
Category
Documents
-
view
218 -
download
0
Transcript of Cost of Final Quality
What is Quality
“Ability of a complete set of realized inherent characteristic of Product,System,Process to fulfill requirements”
•Why Cost of Quality
•Management of Quality
•For opportunity to improvement
•Measuring the progress of the effort of Organization

Quality is important factor in the growth of an organization
Change started in the west as a result of losing market to Japan, a leading country for Quality and cost control
American Experts on Quality Control Deming, Juran were quality gurus of Japan after World war II
In India liberalized industrial Policy and increased consumer awareness has created competitive environment and quality is essential for survival
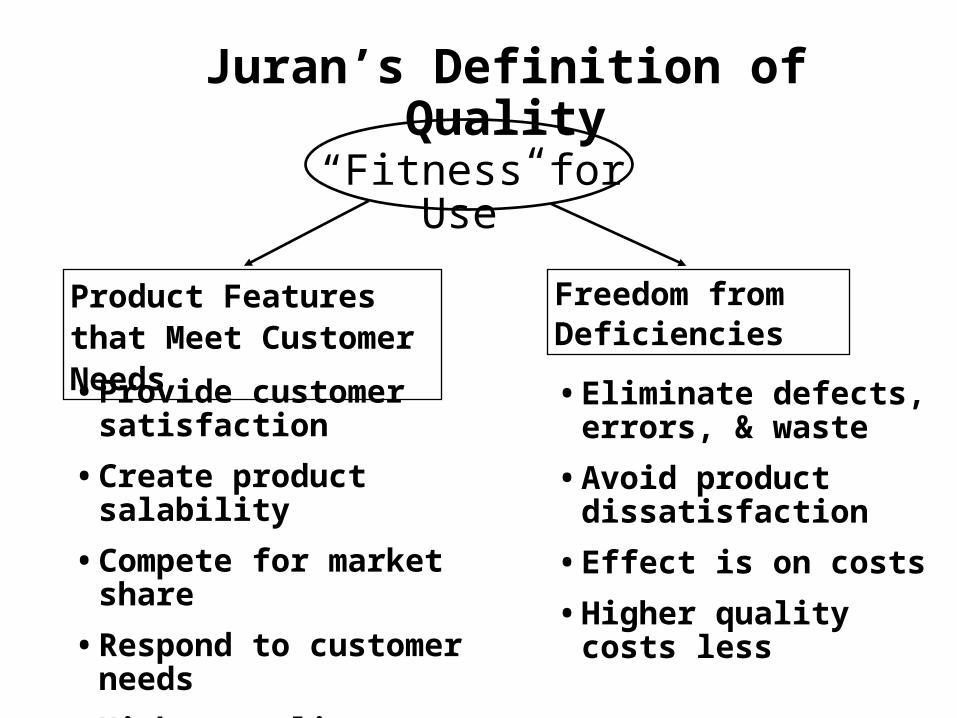
“Fitness for Use”
Product Features that Meet Customer Needs
Freedom from Deficiencies
• Eliminate defects, errors, & waste
• Avoid product dissatisfaction
• Effect is on costs • Higher quality costs
less
Juran’s Definition of Quality
• Provide customer satisfaction
• Create product salability• Compete for market share• Respond to customer
needs• Higher quality costs more

Fundamental Quality Strategies
Managing for Finance Managing for Quality
Financial Planning: Settingbusiness goals; budgeting
Quality Planning: Setting quality goals; design in quality
Financial Control: Costcontrol; actual vs. planned
Quality Control: Plannedvs. actual quality goals;taking action on difference
Financial Improvement: Cost reduction; mergers; acquisitions
Quality Improvement: Waste and rework reduction;eliminate & prevent defects
• Adapted from “Juran on Leadership for Quality: An Executive Handbook”, Juran, 1989.
Quality ObjectivesWhat are your organization’s quality objectives?
• Customer Satisfaction?• Time to market?• On-Time Delivery?• Cost Savings?• ROI?• Productivity?• Performance?• Cycle time?
How fast organization want to improve?
How important is budget and cost savings to the organization?
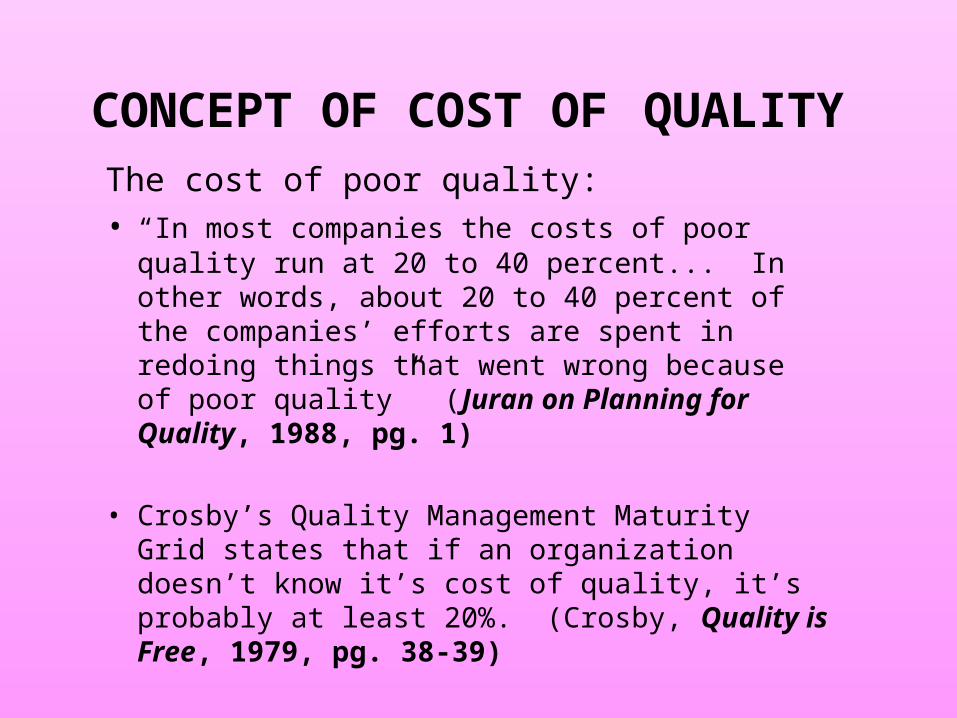
CONCEPT OF COST OF QUALITYThe cost of poor quality:• “In most companies the costs of poor quality run at 20
to 40 percent... In other words, about 20 to 40 percent of the companies’ efforts are spent in redoing things that went wrong because of poor quality” (Juran on Planning for Quality, 1988, pg. 1)
• Crosby’s Quality Management Maturity Grid states that if an organization doesn’t know it’s cost of quality, it’s probably at least 20%. (Crosby, Quality is Free, 1979, pg. 38-39)
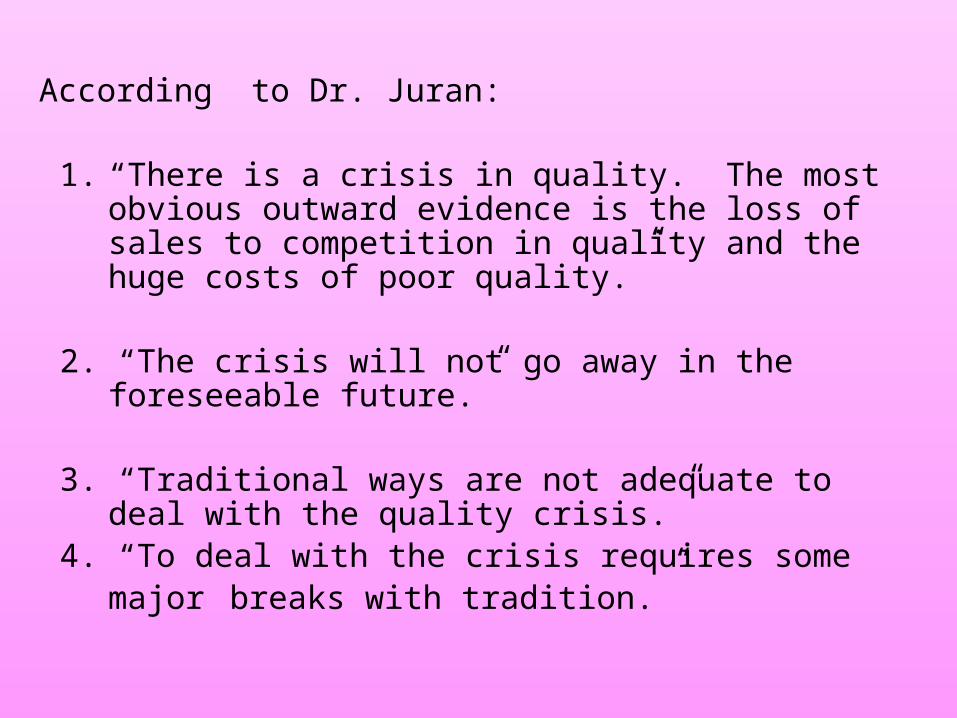
According to Dr. Juran:
1. “There is a crisis in quality. The most obvious outward evidence is the loss of sales to competition in quality and the huge costs of poor quality.”
2. “The crisis will not go away in the foreseeable future.”
3. “Traditional ways are not adequate to deal with the quality crisis.”
4. “To deal with the crisis requires some major breaks with tradition.”
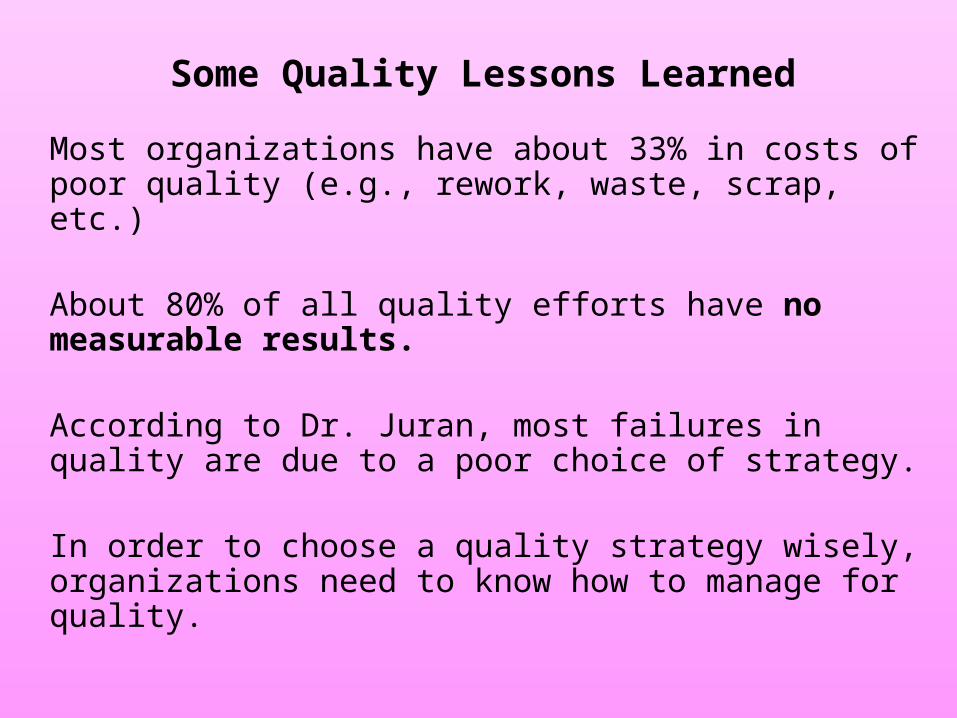
Some Quality Lessons Learned
Most organizations have about 33% in costs of poor quality (e.g., rework, waste, scrap, etc.)
About 80% of all quality efforts have no measurable results.
According to Dr. Juran, most failures in quality are due to a poor choice of strategy.
In order to choose a quality strategy wisely, organizations need to know how to manage for quality.
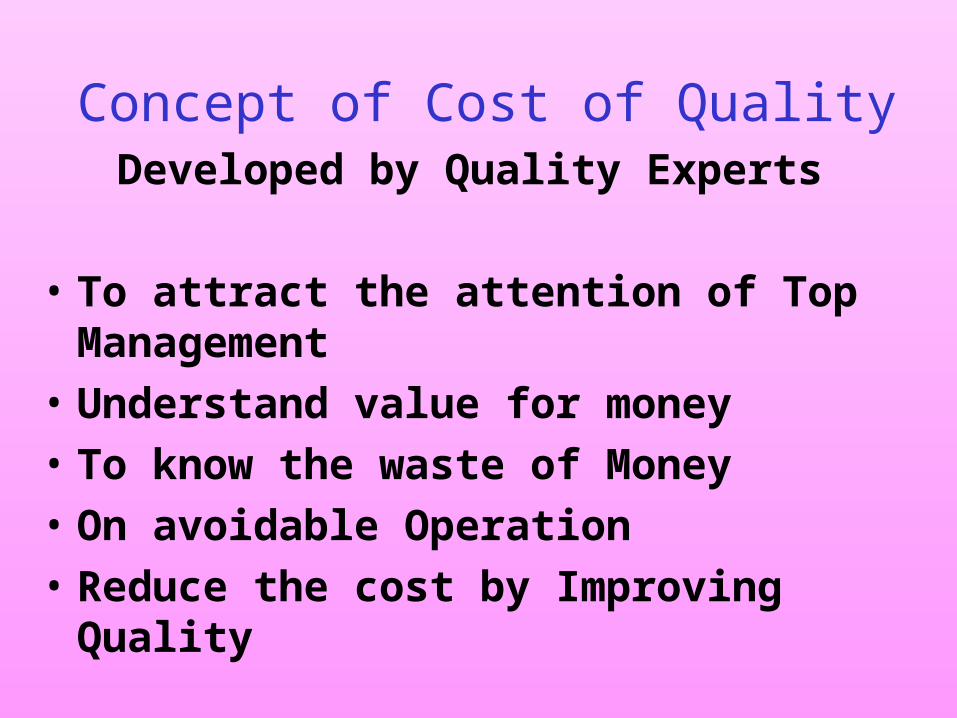
Concept of Cost of Quality Developed by Quality Experts
• To attract the attention of Top Management• Understand value for money• To know the waste of Money• On avoidable Operation• Reduce the cost by Improving Quality
Measuring Cost of Quality
•Cost of Quality is measure of Quality
•Unless one measure something one cannot improve
•Measurement creates an Awareness of a Problem
•Measurement leads to analysis
•Analysis leads to problem elimination
•Measurement is the starting point of improvement
Components of Cost of Quality
•Cost of Prevention
•Cost of Appraisal
•Cost of Internal Failure
•Cost of External Failure
Components of Cost of Quality: Cont…
Cost of Prevention and Cost of Appraisal incurred by the firm to Achieve Quality and hence called by Philip Crosby as Pricing of Conformance
Cost if Internal and External Failure are the expenses the firm is forced to incur because of failure on the part of Some one or some department and called as Pricing forNon Conformance or Dr.Joseph Juran called it as Cost of Poor Quality or Dr.Feigenbaum calls them as Cost of Failure Control
Cost Of Prevention:
Expenditure incurred to prevent failure or Nonconformance.
Detecting defect much earlier on the line,these include
1. Market research
2. Product Quality
3. Process Validation
4. System Development
5. Quality Education
6. Any other Preventive Action
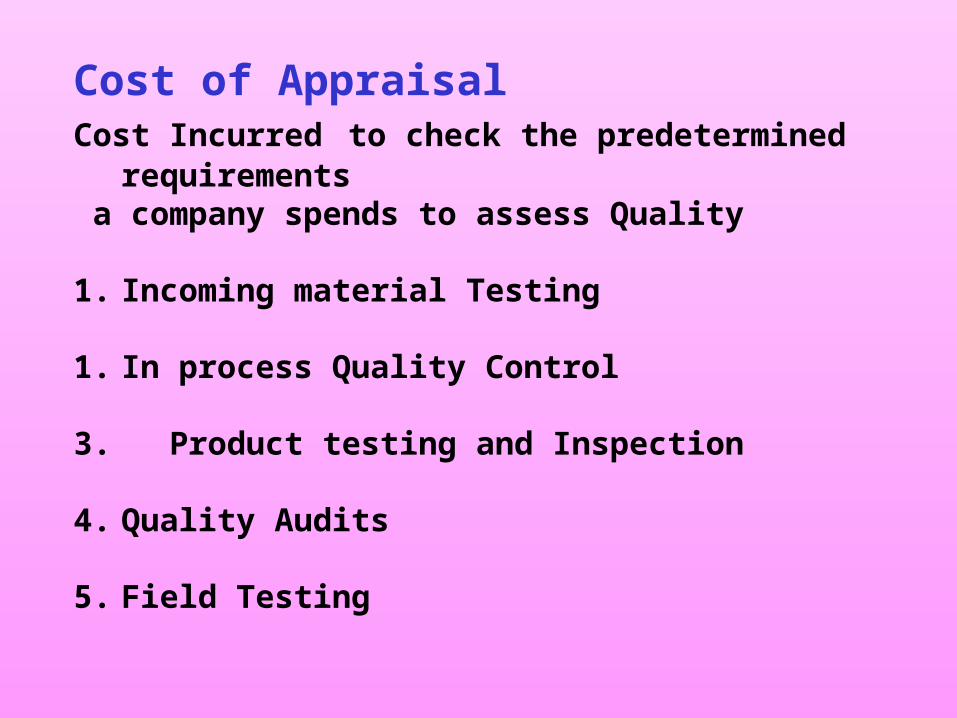
Cost of AppraisalCost Incurred to check the predetermined requirements a company spends to assess Quality
1. Incoming material Testing
1. In process Quality Control 3. Product testing and Inspection
4. Quality Audits
5. Field Testing
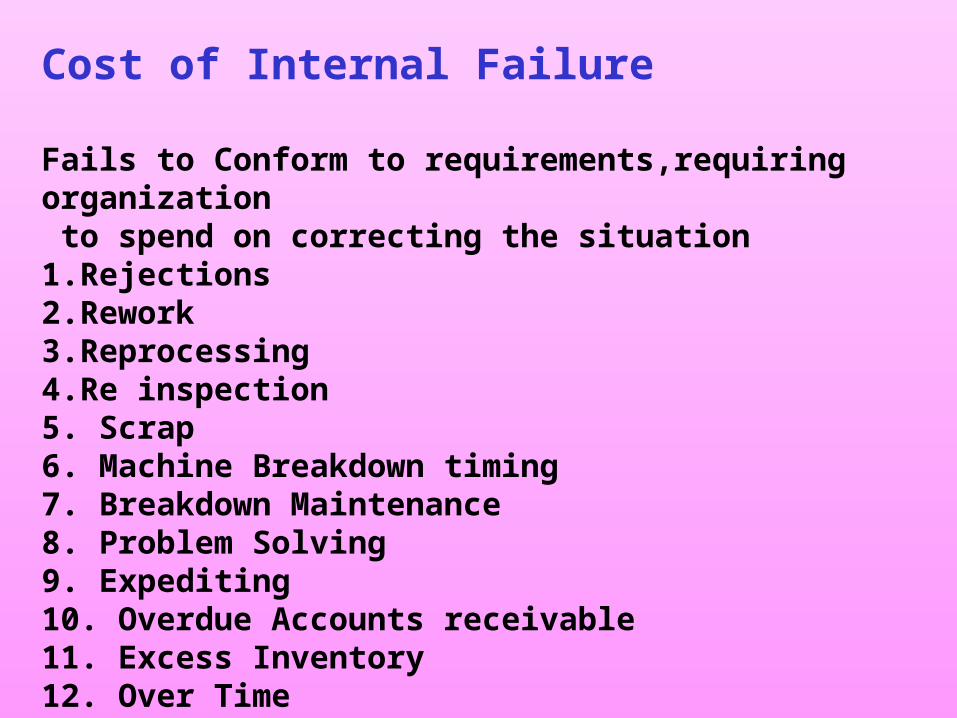
Cost of Internal Failure
Fails to Conform to requirements,requiring organization to spend on correcting the situation1.Rejections2.Rework3.Reprocessing4.Re inspection5. Scrap6. Machine Breakdown timing7. Breakdown Maintenance8. Problem Solving9. Expediting10. Overdue Accounts receivable11. Excess Inventory12. Over Time

Cost Of External FailureFailure occurs and not detected Internally and anorganization has to incur much heavier expenditure to take care.Tangible Cost:1. Complaint handling cost2. Returned Product3. Recall Cost4. Warranty Replacement Intangible Cost1. Loss of Customer Goodwill2. Bad Publicity3. Fall in Market Share4. Low Employee Morale
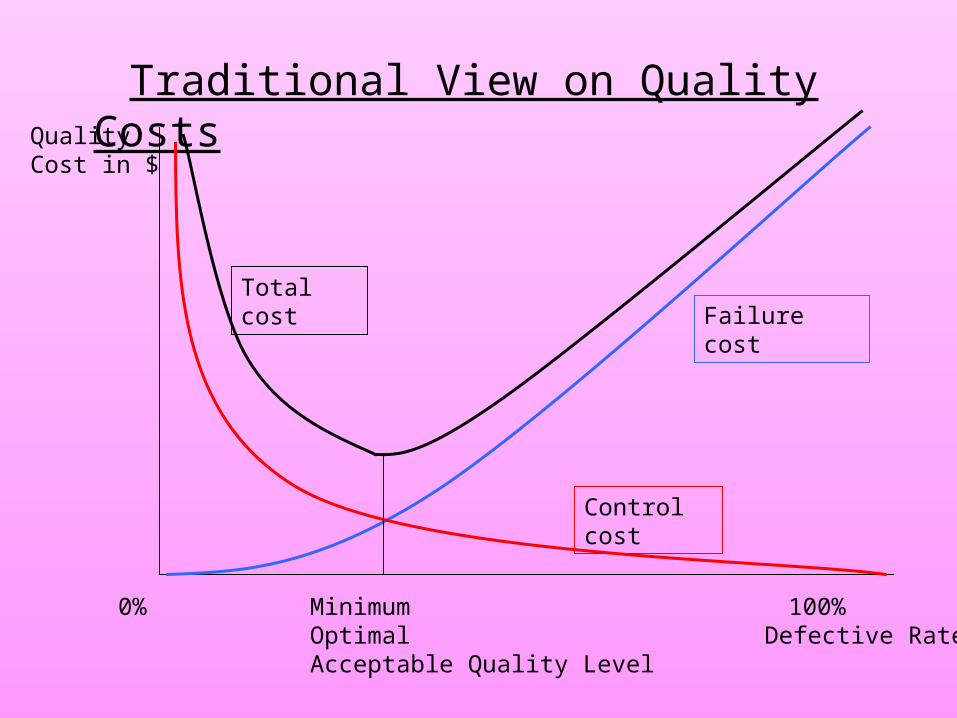
Traditional View on Quality Costs
0% 100% Defective Rate
QualityCost in $
Failure cost
Control cost
Total cost
MinimumOptimalAcceptable Quality Level
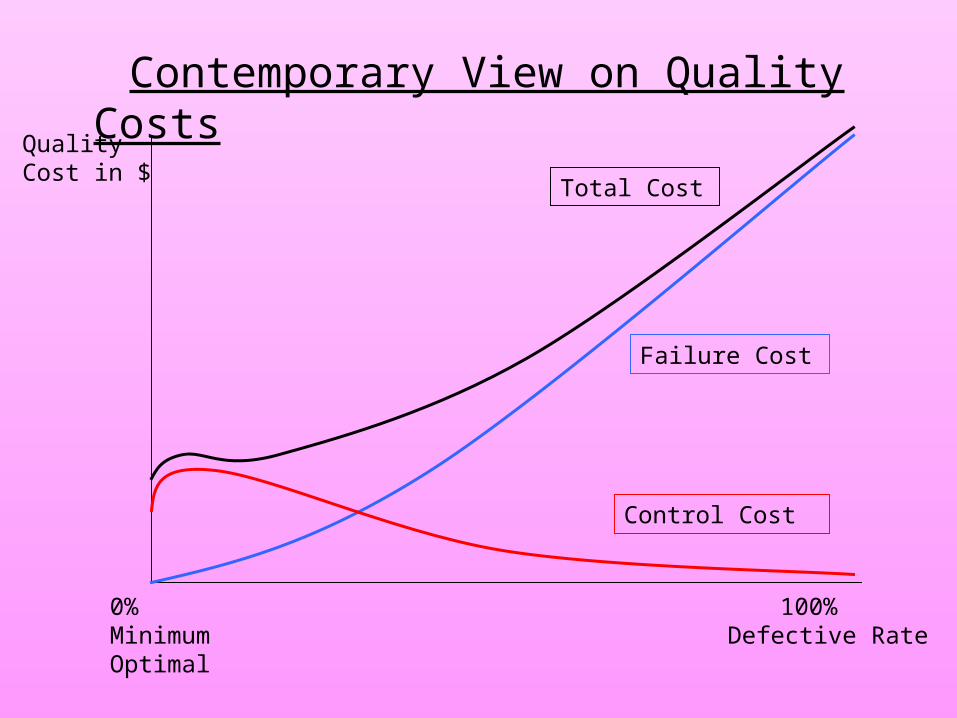
Contemporary View on Quality Costs
Control Cost
Failure Cost
Total Cost
0% 100%Minimum Defective RateOptimal
QualityCost in $
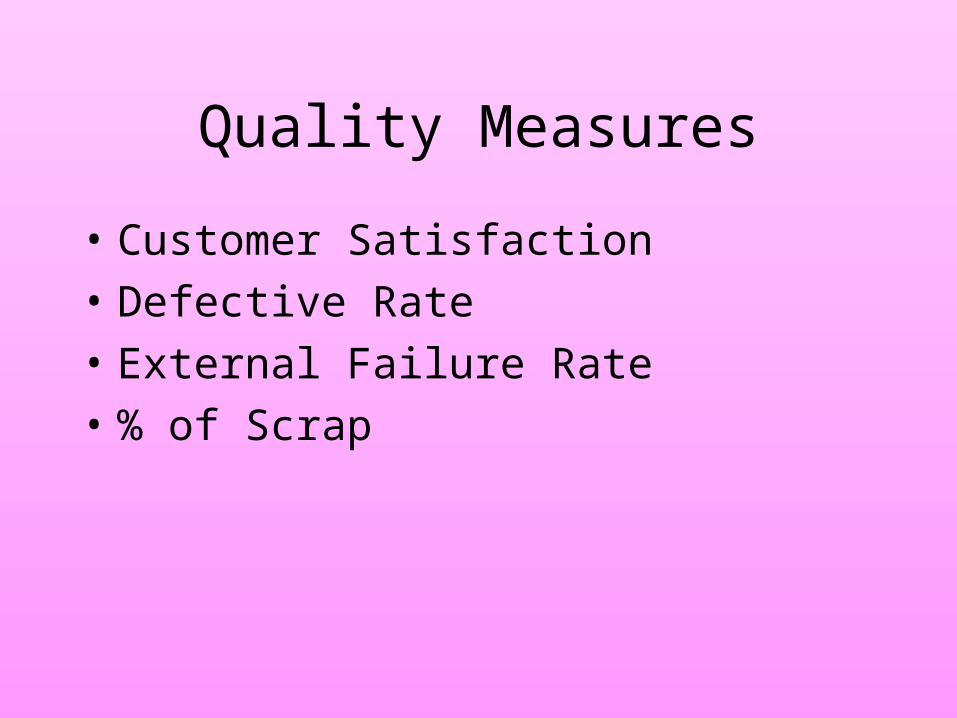
Quality Measures
• Customer Satisfaction• Defective Rate• External Failure Rate• % of Scrap
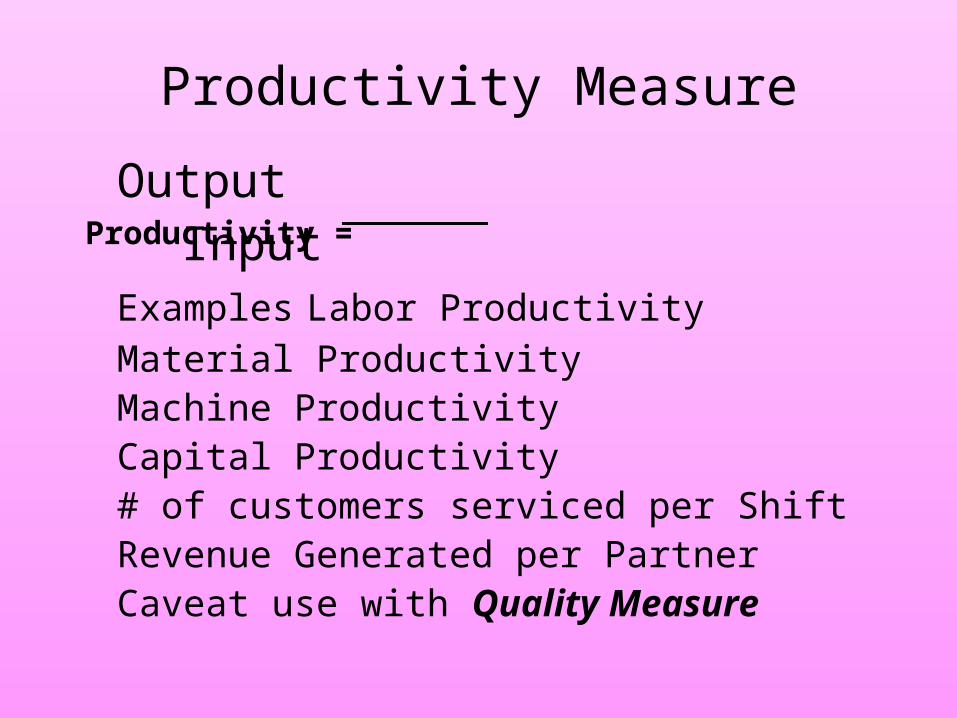
Productivity Measure
Output Input
Examples Labor ProductivityMaterial ProductivityMachine ProductivityCapital Productivity# of customers serviced per ShiftRevenue Generated per Partner
Caveat use with Quality Measure
Productivity =
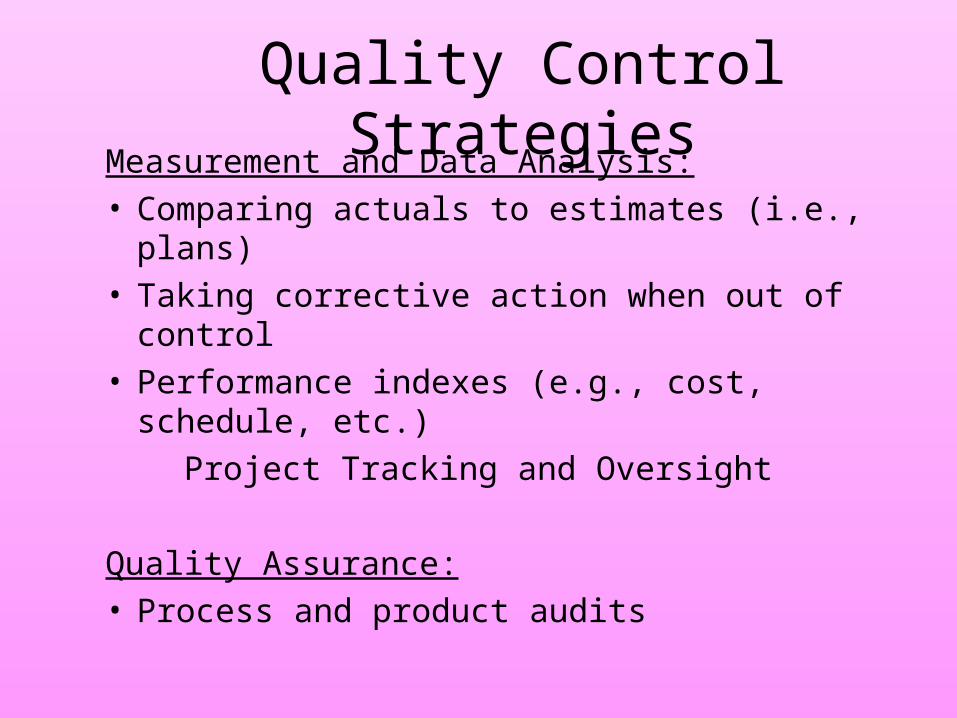
Quality Control StrategiesMeasurement and Data Analysis:• Comparing actuals to estimates (i.e., plans)• Taking corrective action when out of control• Performance indexes (e.g., cost, schedule, etc.) Project Tracking and Oversight
Quality Assurance:• Process and product audits

Efficiency &Timeliness Measures
Order Order Order OrderReceipt Waiting Manufacturing DeliveryTime Time Time Time
Customer Response Time
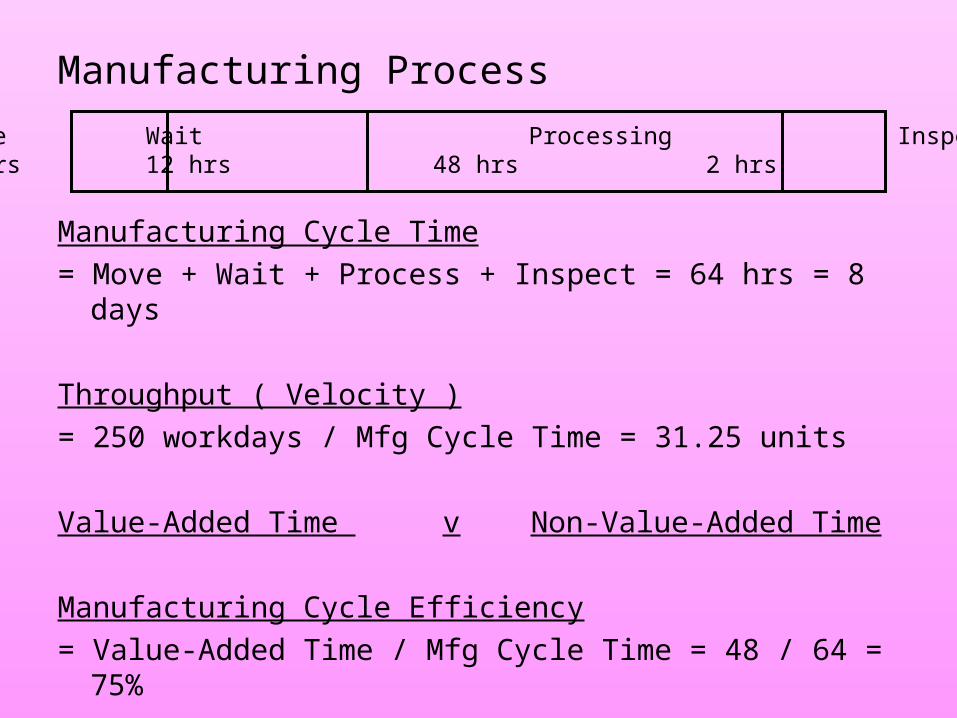
Manufacturing Process
Manufacturing Cycle Time= Move + Wait + Process + Inspect = 64 hrs = 8 days
Throughput ( Velocity )= 250 workdays / Mfg Cycle Time = 31.25 units
Value-Added Time v Non-Value-Added Time
Manufacturing Cycle Efficiency= Value-Added Time / Mfg Cycle Time = 48 / 64 = 75%
Move Wait Processing Inspect2 hrs 12 hrs 48 hrs 2 hrs
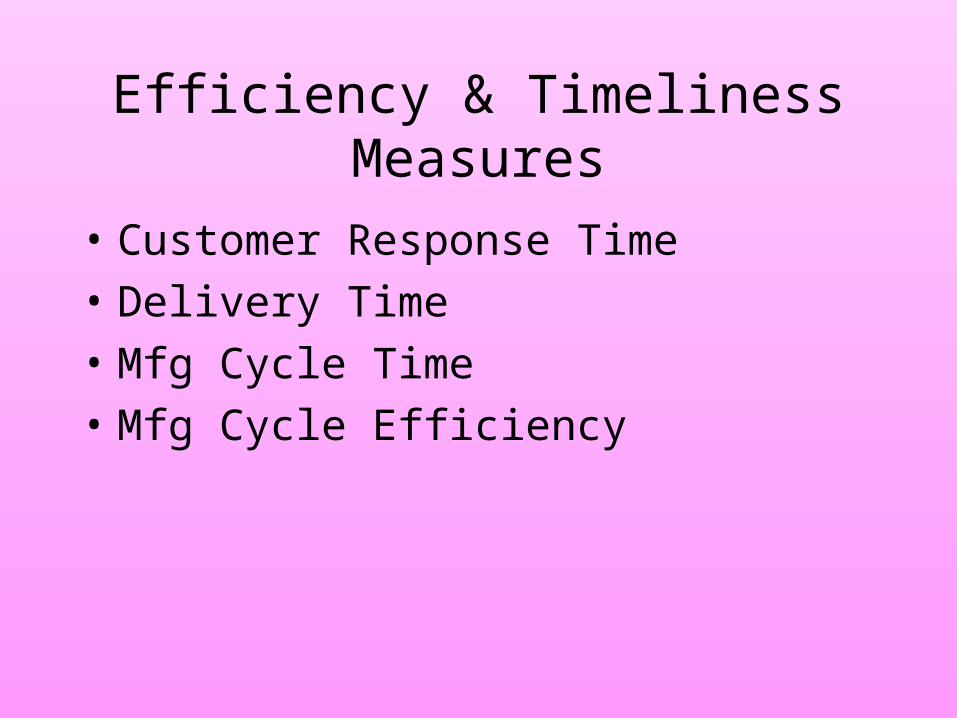
Efficiency & Timeliness Measures
• Customer Response Time• Delivery Time• Mfg Cycle Time• Mfg Cycle Efficiency
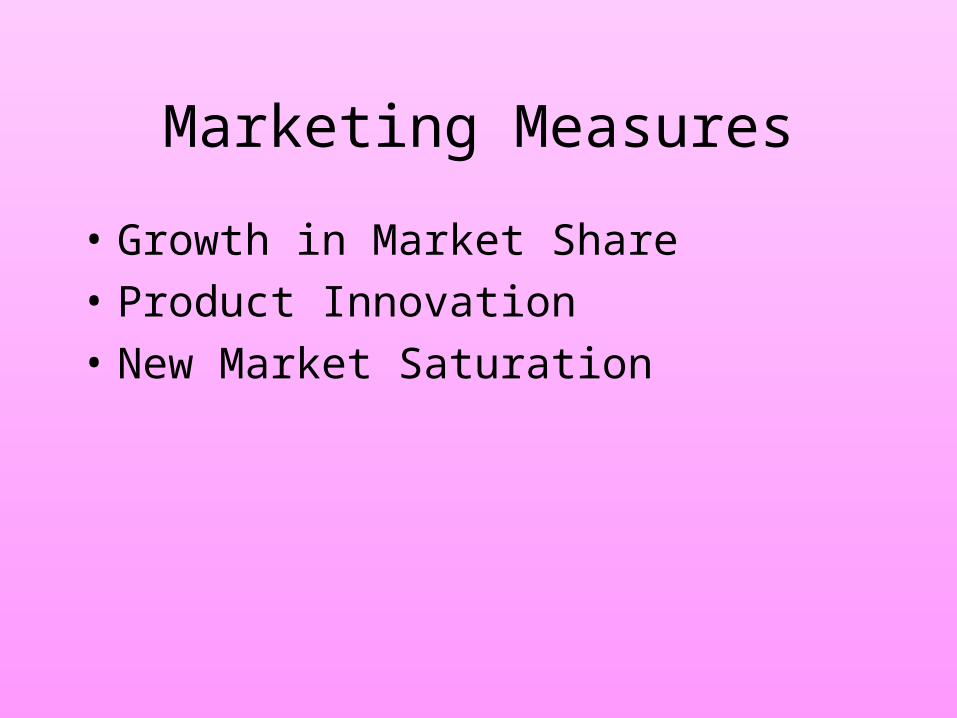
Marketing Measures
• Growth in Market Share• Product Innovation • New Market Saturation
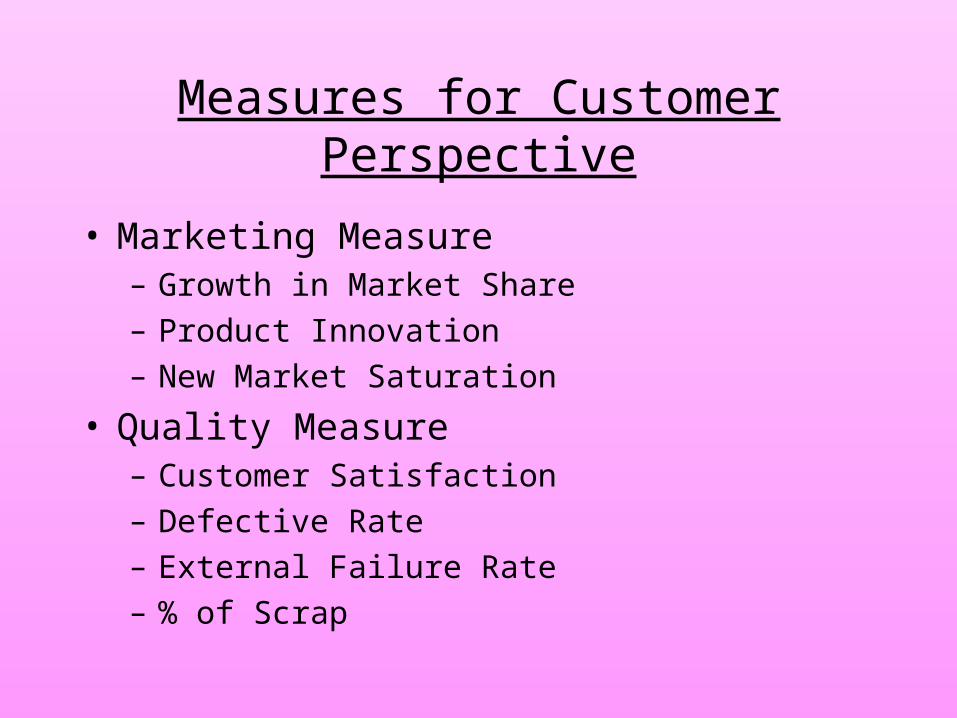
Measures for Customer Perspective
• Marketing Measure– Growth in Market Share– Product Innovation – New Market Saturation
• Quality Measure– Customer Satisfaction– Defective Rate– External Failure Rate– % of Scrap
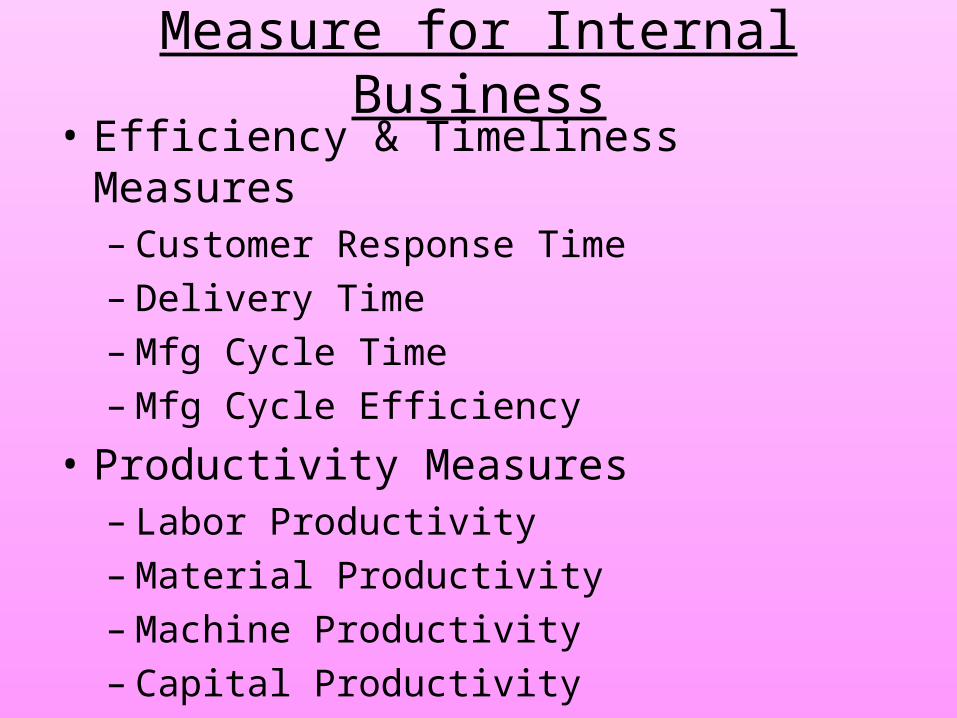
Measure for Internal Business• Efficiency & Timeliness Measures
– Customer Response Time– Delivery Time– Mfg Cycle Time– Mfg Cycle Efficiency
• Productivity Measures– Labor Productivity– Material Productivity– Machine Productivity– Capital Productivity

Measures for Learning & Growth• Suggestion per Employee• Employee Turnover• Training Hours per Employee• Value Added – Employee
= Revenue – Purchased Material & Service

The Juran Trilogy for Quality Management
Quality Planning Quality Control (during operations)
MajorCrisis
Original zone of quality control
New zone of quality control
ContinuousWaste, Errors, & Defects
Lessons learned
Time
• Adapted from Juran's Quality Control Handbook, J.M. Juran, 4th Edition
Improved Process
CurrentProcess
Reduced Waste, Errors, & Defects
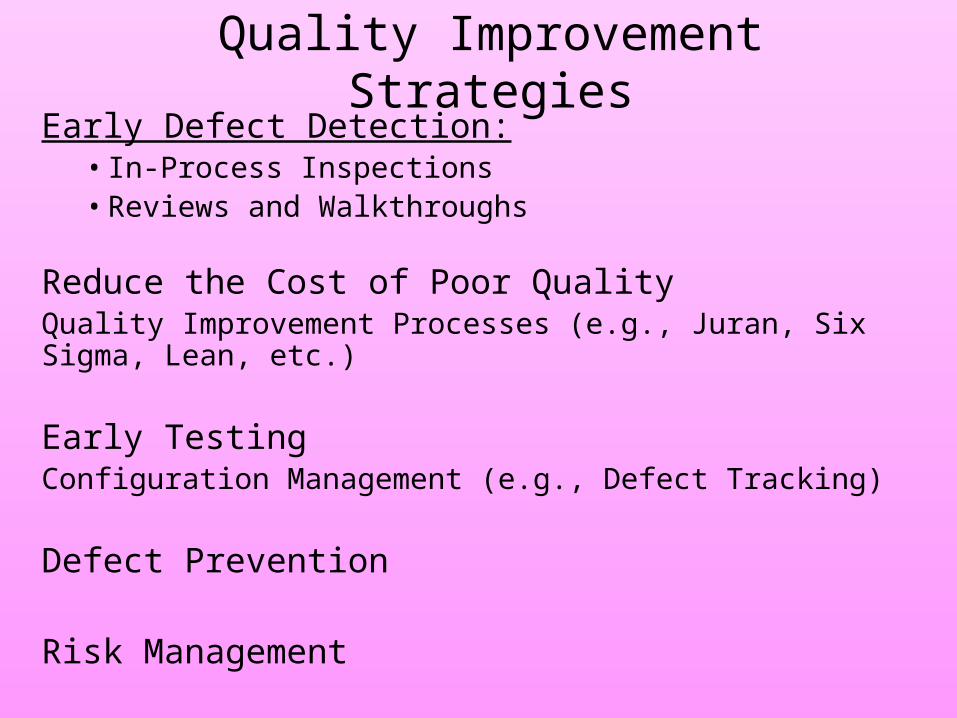
Quality Improvement StrategiesEarly Defect Detection:
• In-Process Inspections• Reviews and Walkthroughs
Reduce the Cost of Poor QualityQuality Improvement Processes (e.g., Juran, Six Sigma, Lean, etc.)
Early TestingConfiguration Management (e.g., Defect Tracking)
Defect Prevention
Risk Management
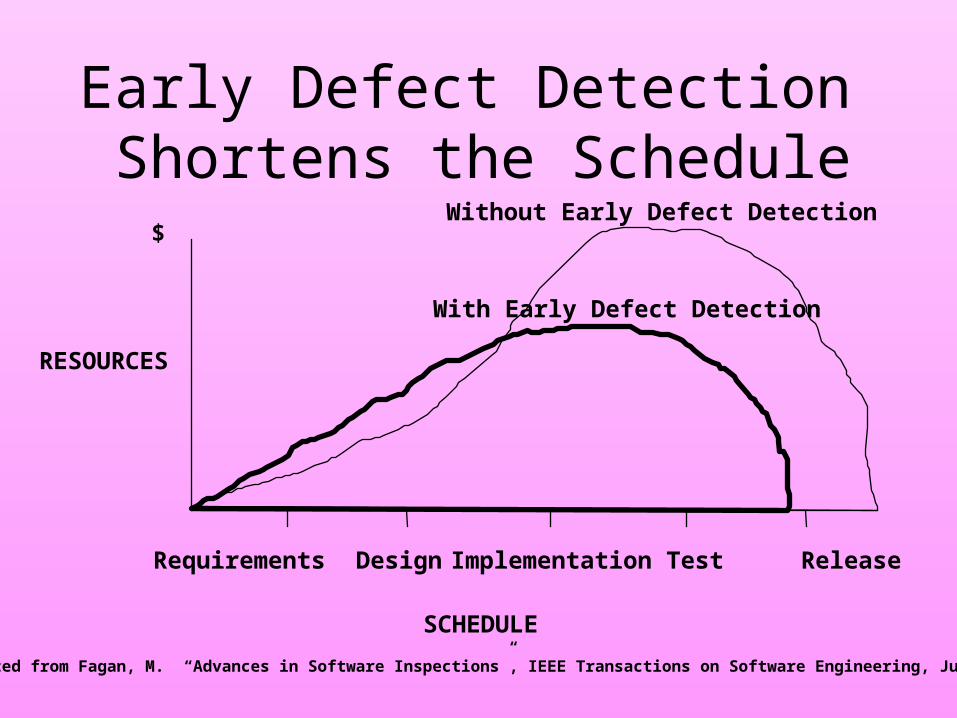
Early Defect Detection Shortens the Schedule
RESOURCES
$Without Early Defect Detection
SCHEDULE• Adapted from Fagan, M. “Advances in Software Inspections”, IEEE Transactions on Software Engineering, July 1986
Requirements Design Implementation ReleaseTest
With Early Defect Detection
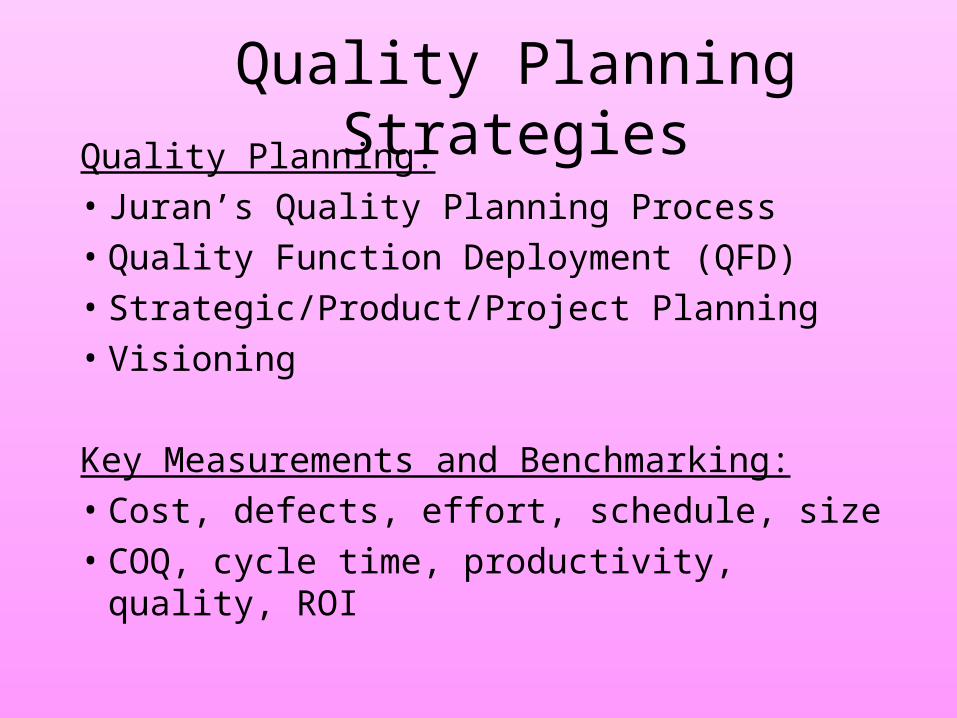
Quality Planning StrategiesQuality Planning: • Juran’s Quality Planning Process• Quality Function Deployment (QFD)• Strategic/Product/Project Planning• Visioning
Key Measurements and Benchmarking:• Cost, defects, effort, schedule, size• COQ, cycle time, productivity, quality, ROI
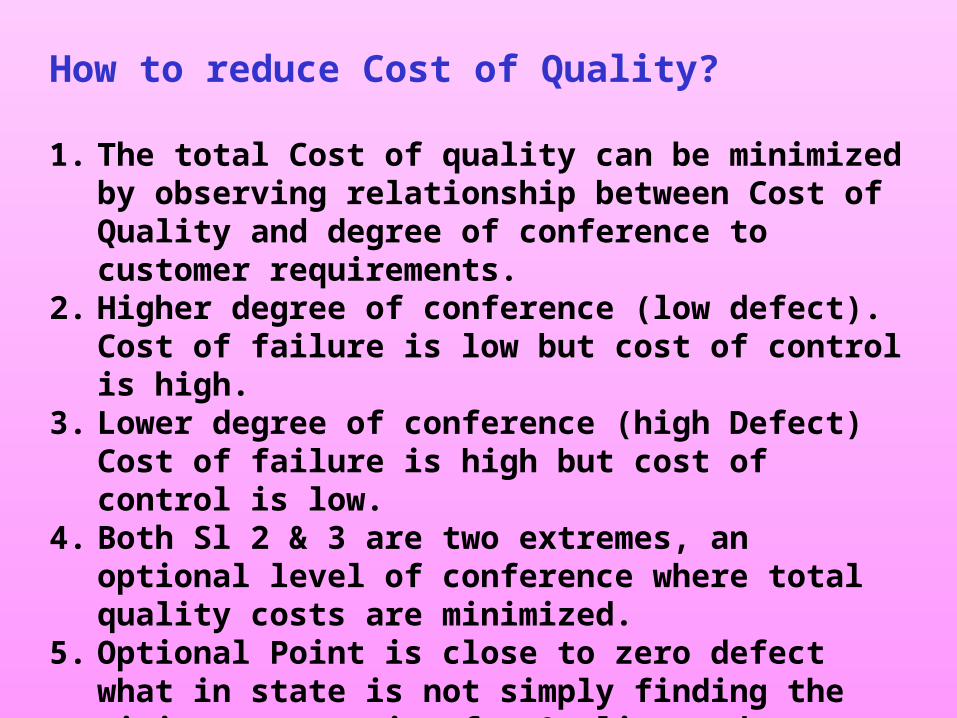
How to reduce Cost of Quality?
1. The total Cost of quality can be minimized by observing relationship between Cost of Quality and degree of conference to customer requirements.
2. Higher degree of conference (low defect). Cost of failure is low but cost of control is high.
3. Lower degree of conference (high Defect) Cost of failure is high but cost of control is low.
4. Both Sl 2 & 3 are two extremes, an optional level of conference where total quality costs are minimized.
5. Optional Point is close to zero defect what in state is not simply finding the minimum cost point for Quality and operating there but constantly reducing the Cost of Quality.
6. This can be achieved by revising production system, including technology and management attitudes.
Why quality Improvements Effects fail?
1. Managers continue to focus on short term financial results to the exclusion of system improvements.
1. Excessive focus on financial results tends to destroy the underlying quality system as improvements are slashed for short term financial results.
1. Quality improvements requires a change in thinking to manage underlying system and not the immediate financial outcome.
1. Normally employees are blamed for Quality failure as sometimes the problem could be at higher level.
6. Wrong thinking that always it is too expensive to have high quality. It is normally forgotten that consistent quality is a driver of better results in schedule, flexibility and cost.
7. Managers sometimes interfere with true team work.
8. Improper reward system.
9. Sloppy internal procedures and process.
10.No attitude change from among employees.

Producing Quality requires systems approach Driven by:
1. customer need.
2. It requires deep cultural change.
3. Only way to Institute True Quality Improvement is though extensive education of all employees and constant leadership at all levels.
The quality planning ‘Road Map’Quality planning comprises the following basic activities•Identify the customer and their needs.
•Develop a product that responds to Those needs.
•Develop a process able to produce that product.
•A road map for quality planning has the following sequence of steps:•Identify who are the customers.
•Translate those needs into your language.
•Develop a product that can respond to those needs.
•Develop a product that can respond to those needs.
•Optimize the product features so as to meet your needs as well as•Customer’s needs.
•Develop a process which is able to produce the product.•Optimize the process.
•Prove that the process can produce the product under operating conditions.
•Transfer the process to the operating forces.
The long list of opportunities for quality improvement
The long list of opportunities for quality improvement
•The list of customers is not fully known.
•The list of products is not fully identified.
•The vital few customers have not been identified.
•The needs of customers are not fully known or understood.
•Customer’s needs are judged by inadequate criteria.
•Customer’s needs are not being met.
•Reactions of non-customers are not known.
•Products are not competitive.
•The relationship of product value compared to cost is not known.
•The relationship of product value is inadequate.
•Products do not serve a useful purpose.
•Much work must be done over again because of deficiencies in the process.
Quality Organizations
There is always room for improvement
Mature quality organizations use many improvement strategies
Continuous thinking (i.e., process maturity or process capability)
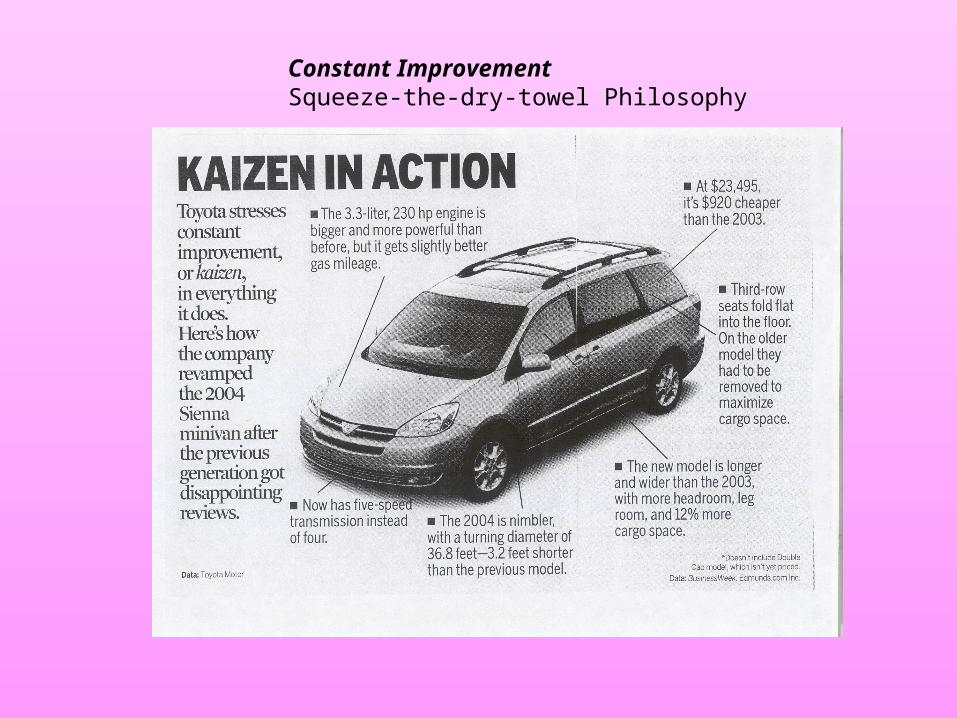
Constant ImprovementSqueeze-the-dry-towel Philosophy


![Quality Cost Final[1]](https://static.fdocuments.net/doc/165x107/577cd90d1a28ab9e78a291ad/quality-cost-final1.jpg)


