Cost Based Advertising Ted Mitchell. Three Methods for Setting Advertising Budget Cost Based...
49
Cost Based Advertising Ted Mitchell
-
Upload
mark-cameron -
Category
Documents
-
view
231 -
download
2
Transcript of Cost Based Advertising Ted Mitchell. Three Methods for Setting Advertising Budget Cost Based...
Cost Based Advertising
Ted Mitchell
Three Methods for Setting Advertising Budget
• Cost Based Advertising
• Competitive Based Advertising
• Customer Based Advertising
Cost Based Advertising
• Affordable Method • Advertising to Sales Ratio• Cost per thousand GRPs• Average Return on Promotional
Investment (Effort) ROMI
• Affordable method–Classic response to the Traditional Institutional Orientation
Favorite Accountant
• Affordable method–Classic response to the Traditional Institutional Orientation
We should do some
advertising too Yes! As much as
we can afford.
Favorite Accountant

How much can we afford?
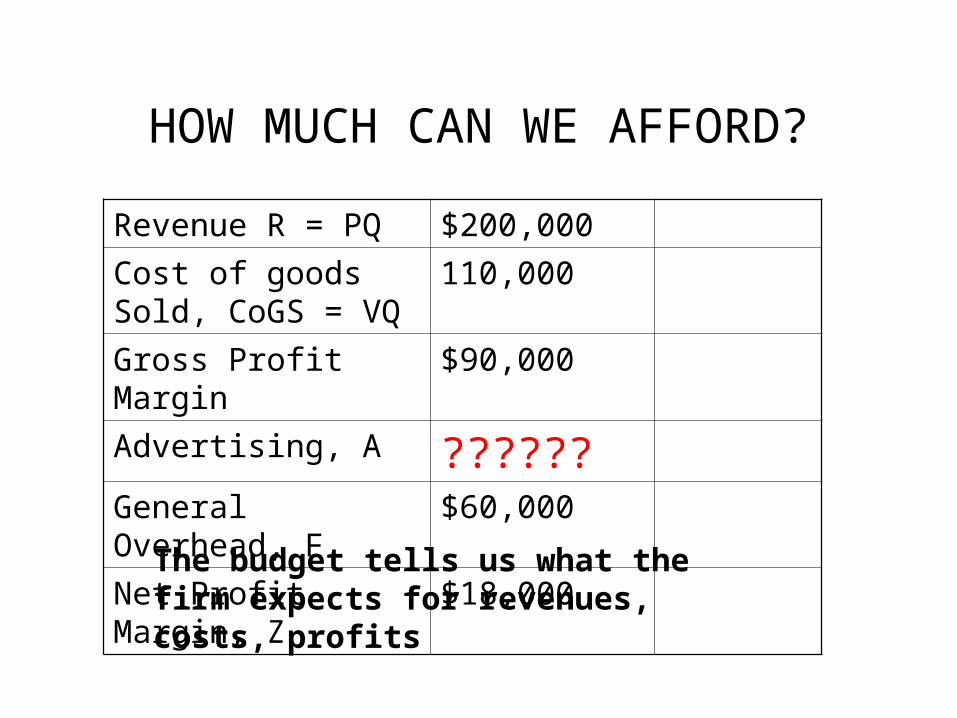
HOW MUCH CAN WE AFFORD?
Revenue R = PQ $200,000
Cost of goods Sold, CoGS = VQ
110,000
Gross Profit Margin $90,000
Advertising, A ??????General Overhead, F $60,000
Net Profit Margin, Z $18,000The budget tells us what the firm expects for revenues, costs, profits
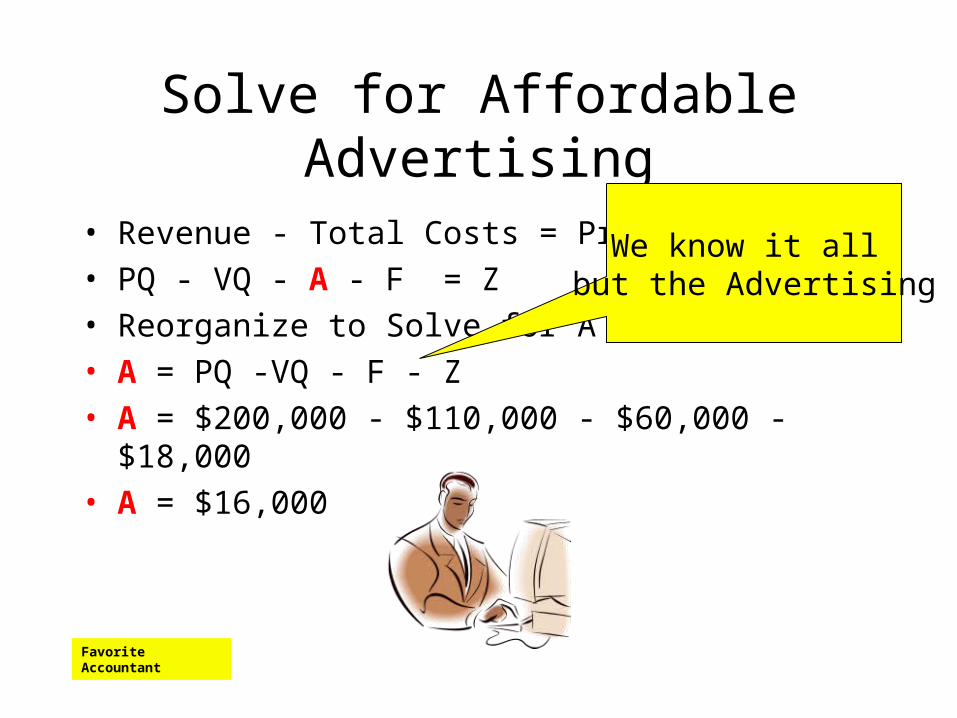
Solve for Affordable Advertising
• Revenue - Total Costs = Profit• PQ - VQ - A - F = Z• Reorganize to Solve for A• A = PQ -VQ - F - Z• A = $200,000 - $110,000 - $60,000 - $18,000• A = $16,000
Favorite Accountant
We know it all but the Advertising

Solve for Affordable Advertising
• Revenue - Total Costs = Profit
• PQ - VQ - A - F = Z
• Reorganize to Solve for A
• A = PQ -VQ - F - Z
• A = $200,000 - $110,000 - $60,000 - $18,000
• A = $16,000
To reach our target profit
with our forecasted revenues and costs
we can afford to spend $16,000
on advertising
Favorite Accountant
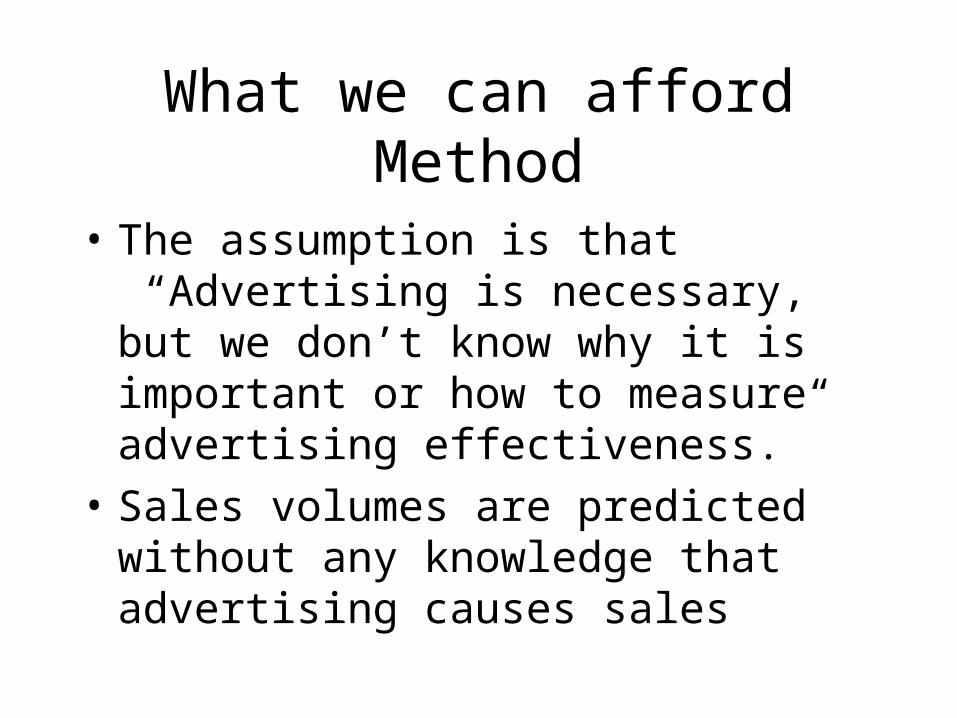
What we can afford Method
• The assumption is that “Advertising is necessary, but we don’t know why it is important or how to measure advertising effectiveness.”
• Sales volumes are predicted without any knowledge that advertising causes sales
Advertising by The Normal Budget Percentage
Setting Advertising Budgets Based on the Advertising to
Sales Ratio
Accountants love ratios with sales revenue in the denominator such
as Markup, Return on Sales, Advertising to Sales, etc.
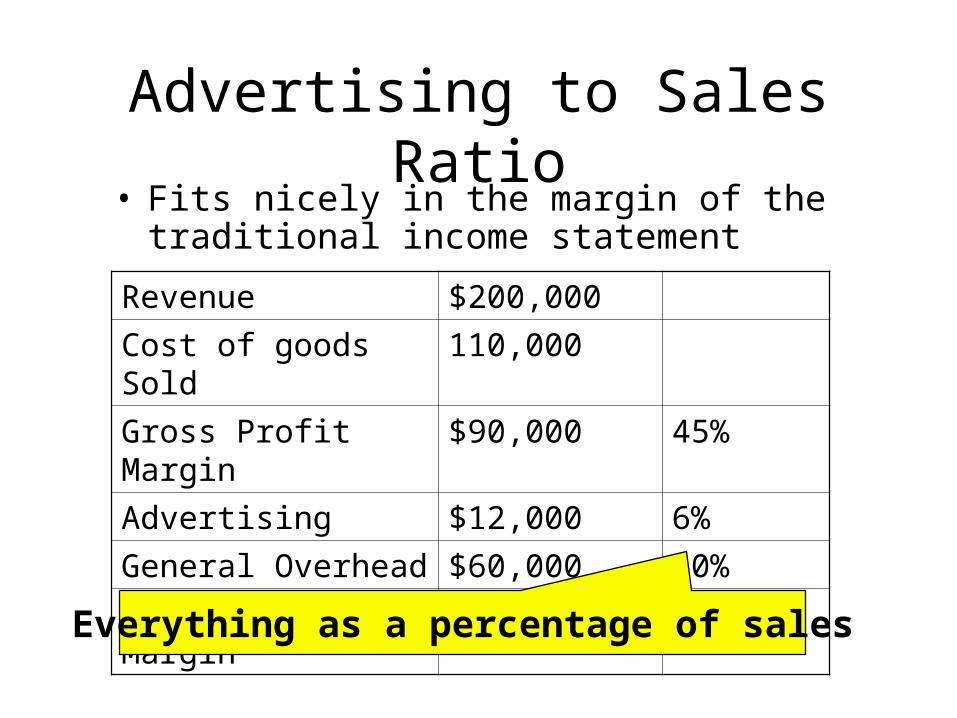
Advertising to Sales Ratio• Fits nicely in the margin of the traditional
income statement
Revenue $200,000
Cost of goods Sold 110,000
Gross Profit Margin $90,000 45%
Advertising $12,000 6%
General Overhead $60,000 30%
Net Profit Margin $18,000 9%
Everything as a percentage of sales
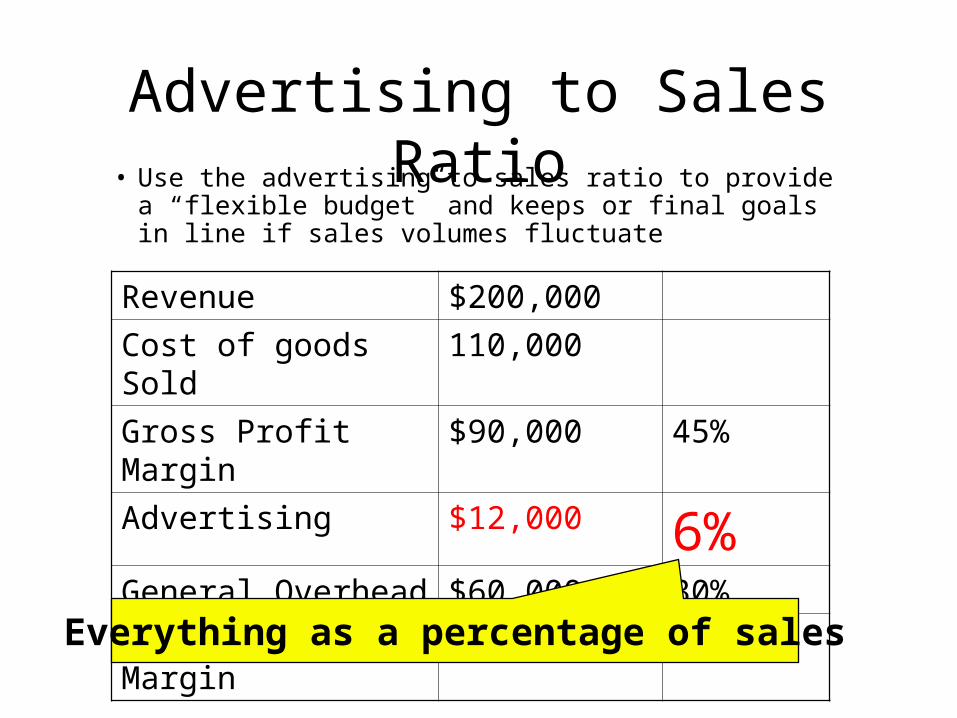
Advertising to Sales Ratio• Use the advertising to sales ratio to provide a
“flexible budget” and keeps or final goals in line if sales volumes fluctuate
Revenue $200,000
Cost of goods Sold 110,000
Gross Profit Margin $90,000 45%
Advertising $12,000 6%General Overhead $60,000 30%
Net Profit Margin $18,000 9%
Everything as a percentage of sales

Accountants Love the Advertising to Sales Ratio as
Means to control the Marketing Budget!
Marketing is always trying to waste
money on advertising
Favorite Accountant
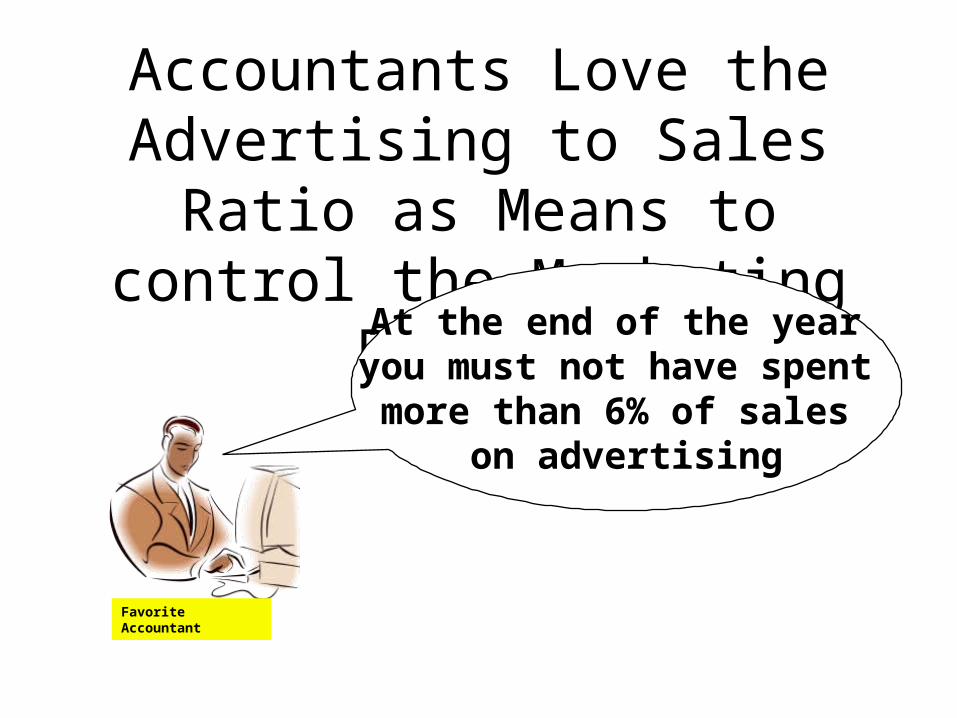
Accountants Love the Advertising to Sales Ratio as
Means to control the Marketing Budget!At the end of the year
you must not have spent more than 6% of sales
on advertising
Favorite Accountant

Accountants Love the Advertising to Sales Ratio as
Means to control the Marketing Budget!To stay on budget
when your sales drop, you must cut your
advertising
Favorite Accountant
Flip the Budget to Sales Ratio
• Advertising is a cost driver to accountants
• Advertising is a revenue driver to marketers!

How many sales do we get for the budget?
• $20,000 in advertising cost is 6% of the$333,333 in sales revenue
• or• $20,000 effort generated $333,333
Or $16.67 in sales for every advertising dollar spent
Or 16.67% return on marketing investment
Return on Marketing Effort
Measured as
• Revenues
• Quantity Sold
• Leads Generated
• # of Customers Acquired
• $ Profit Contribution
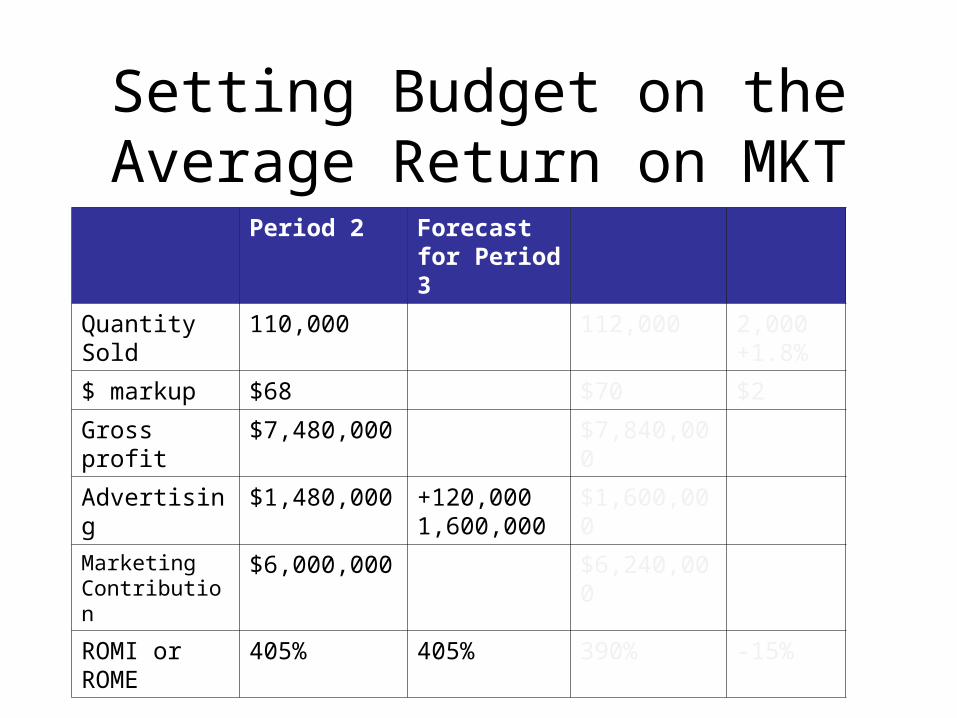
Setting Budget on the Average Return on MKT
Period 2 Forecast for Period 3
Quantity Sold 110,000 112,000 2,000+1.8%
$ markup $68 $70 $2
Gross profit $7,480,000 $7,840,000
Advertising $1,480,000 +120,0001,600,000
$1,600,000
Marketing Contribution
$6,000,000 $6,240,000
ROMI or ROME
405% 405% 390% -15%
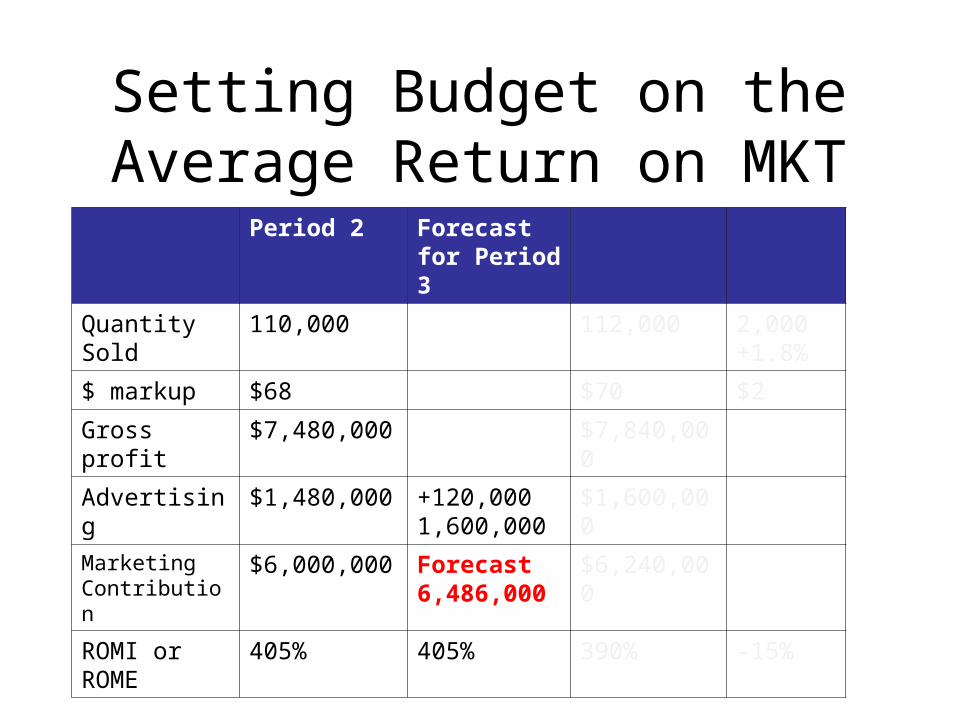
Setting Budget on the Average Return on MKT
Period 2 Forecast for Period 3
Quantity Sold 110,000 112,000 2,000+1.8%
$ markup $68 $70 $2
Gross profit $7,480,000 $7,840,000
Advertising $1,480,000 +120,0001,600,000
$1,600,000
Marketing Contribution
$6,000,000 Forecast6,486,000
$6,240,000
ROMI or ROME
405% 405% 390% -15%
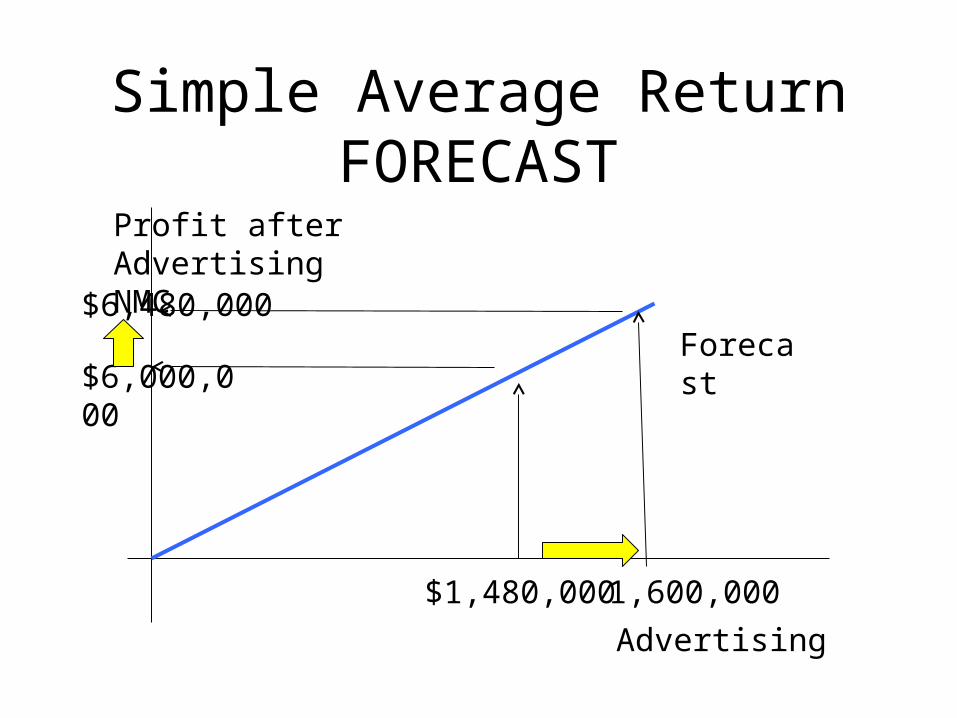
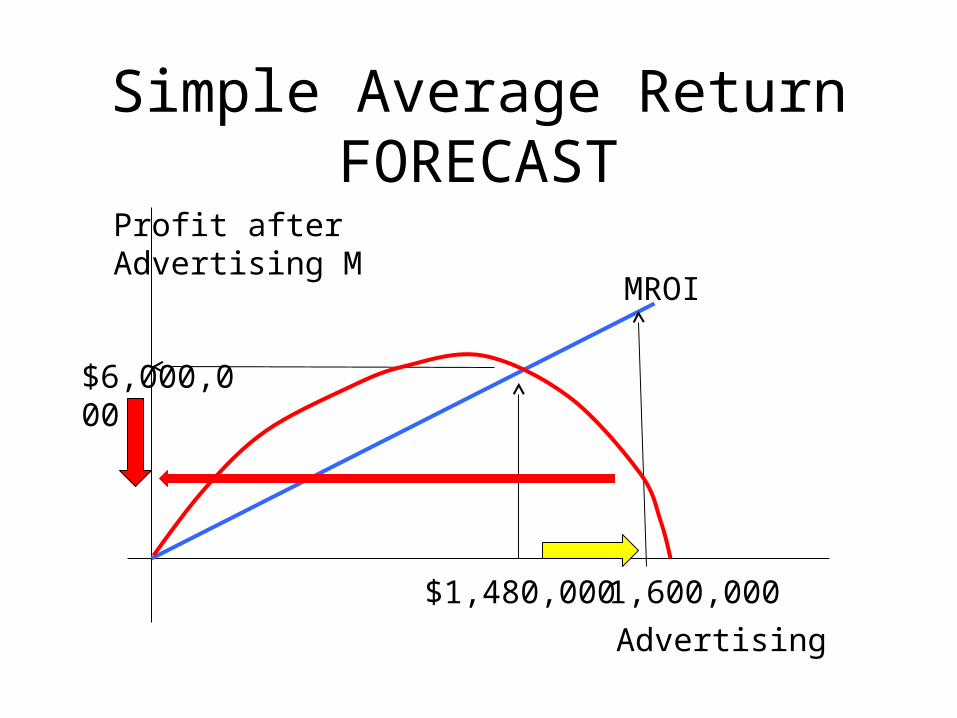
Simple Average Return FORECAST
$1,480,000 1,600,000
$6,000,000
$6,480,000
Profit after Advertising NMC
Advertising
Forecast
Simple Average Return FORECAST
$1,480,000 1,600,000
$6,000,000
$6,480,000
Profit after Advertising NMC
Advertising
MROI
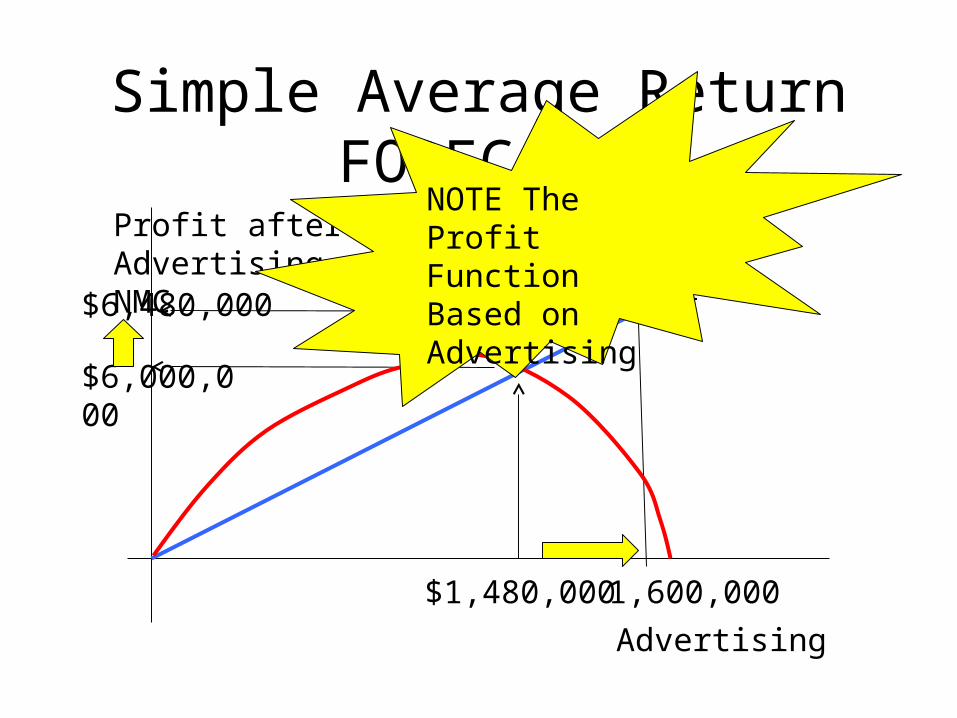
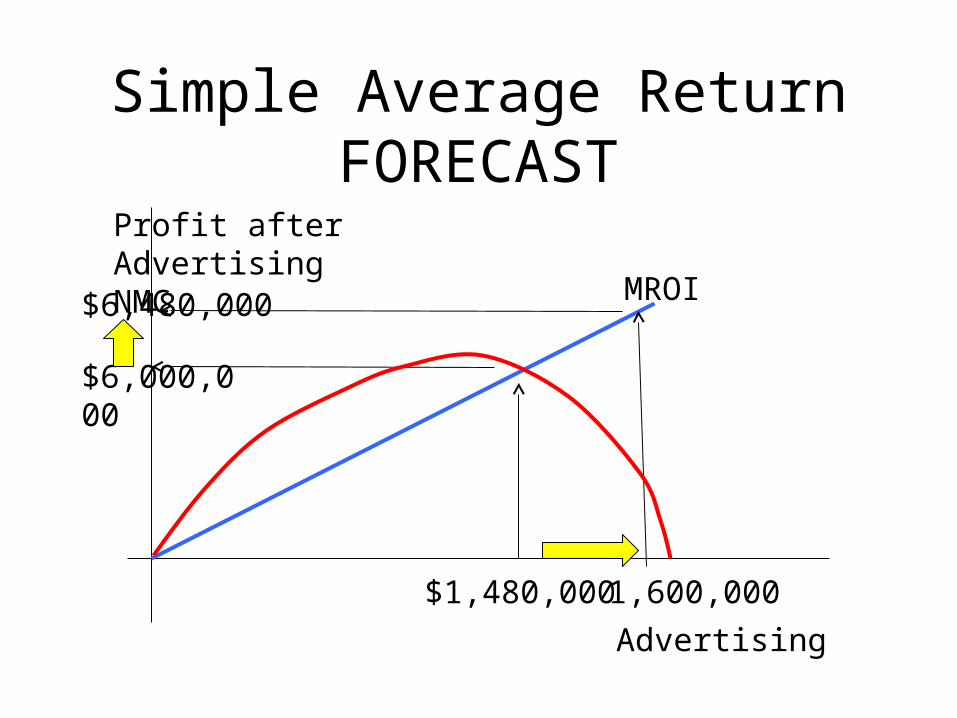
Simple Average Return FORECAST
$1,480,000 1,600,000
$6,000,000
$6,480,000
Profit after Advertising NMC
Advertising
MROI
NOTE The Profit Function Based on Advertising
Simple Average Return FORECAST
$1,480,000 1,600,000
$6,000,000
Profit after Advertising M
Advertising
MROI
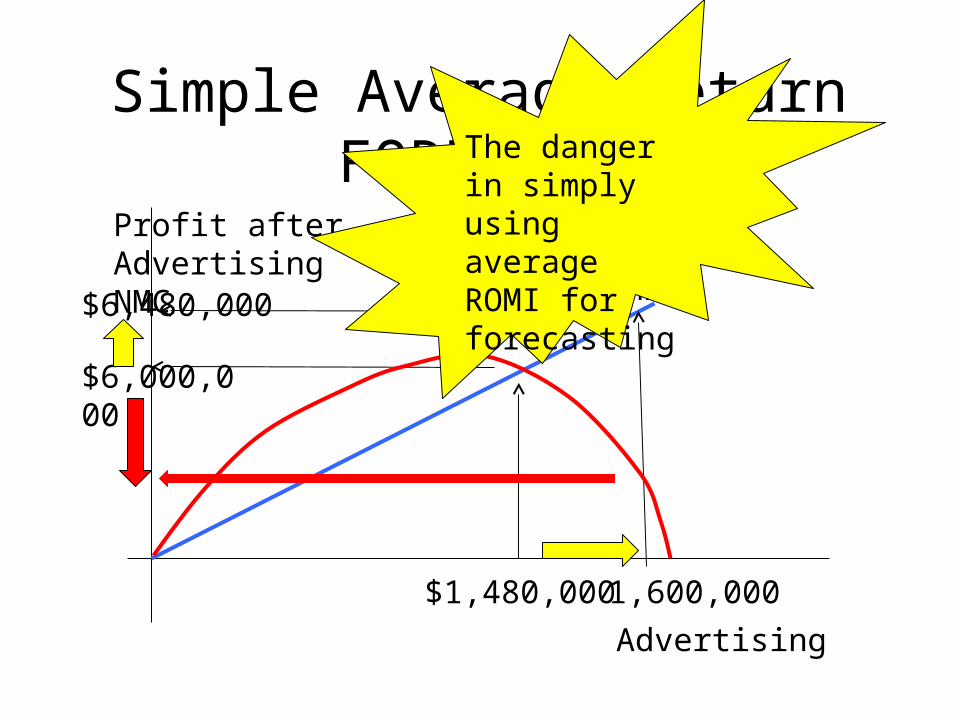
Simple Average Return FORECAST
$1,480,000 1,600,000
$6,000,000
$6,480,000
Profit after Advertising NMC
Advertising
MROI
The danger in simply using average ROMI for forecasting
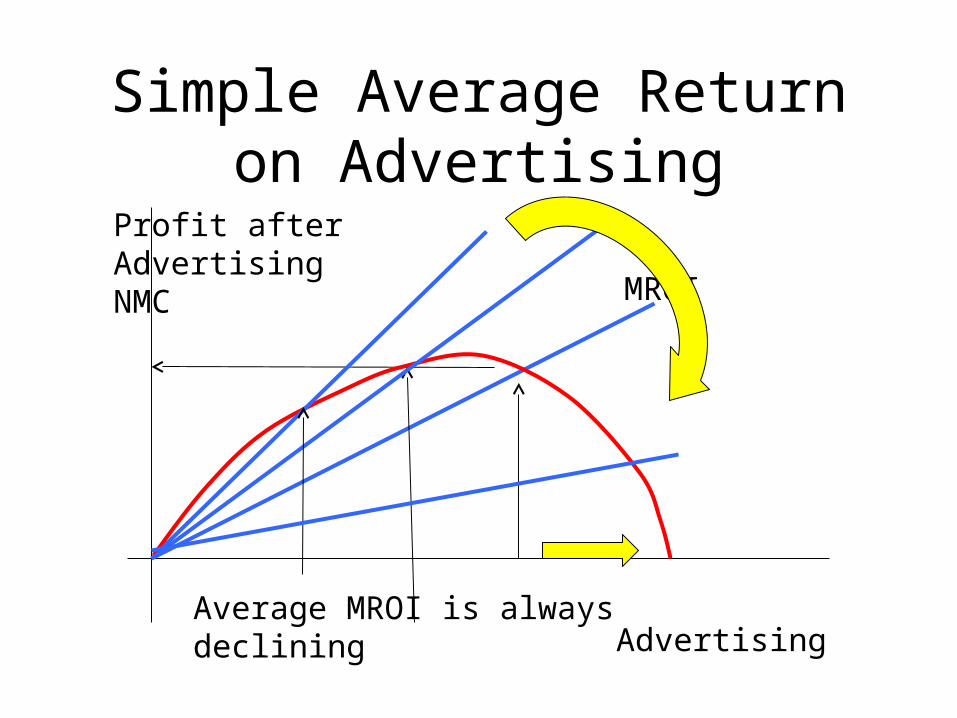
Simple Average Return on Advertising
Profit after Advertising NMC
Advertising
MROI
Average MROI is always declining
• Advertising Increases Units Sold
Average Volume Driver Rates Are Dangerous
Period 1 Period 2 Forecast Period3
Quantity Sold 112,000 +7,000 119,000
$ markup $68 $68
Gross profit $7,616,000
Advertising $1,600,000 +$100,000
Net Marketing Contribution
$6,016,000
# of Units sold per $1,000 of advertising
112,000/1,600 = 70 units per $1,000
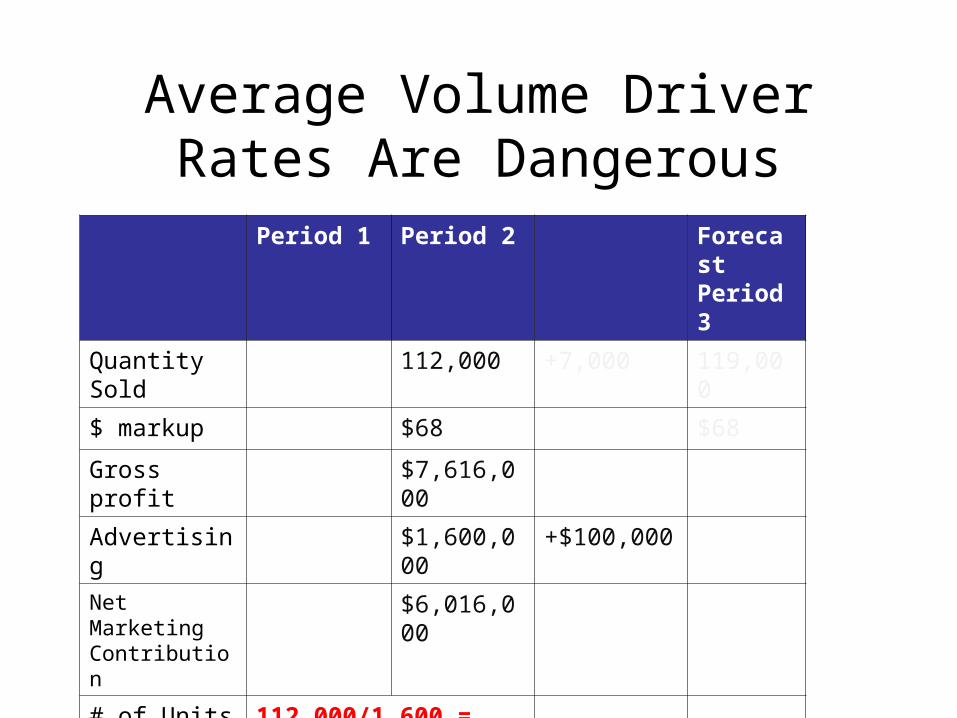
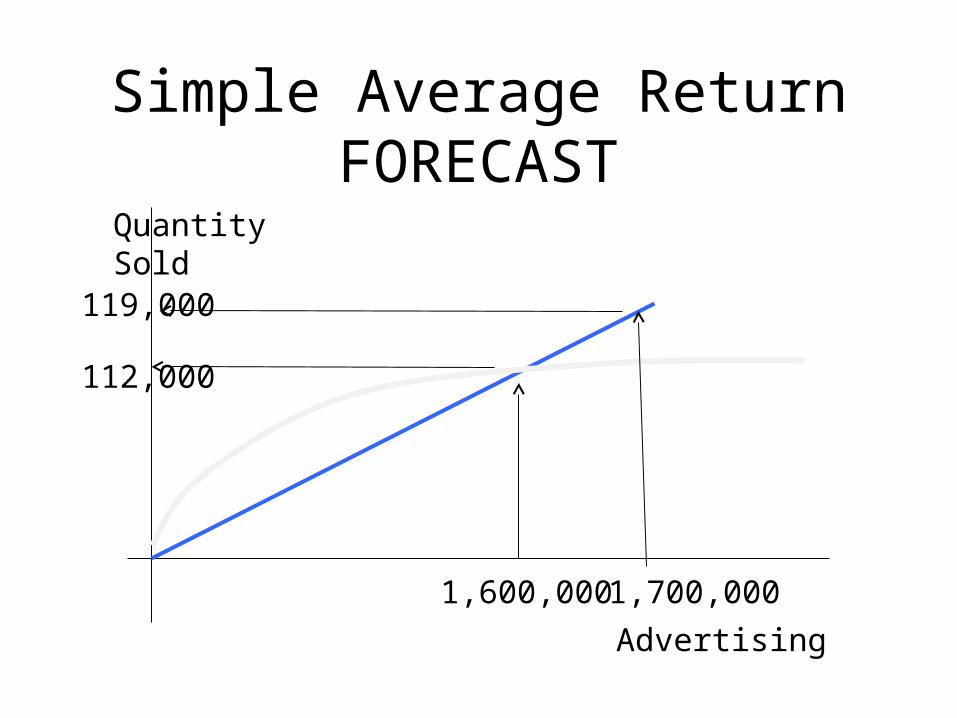
Simple Average Return FORECAST
1,600,000 1,700,000
112,000
119,000
Quantity Sold
Advertising
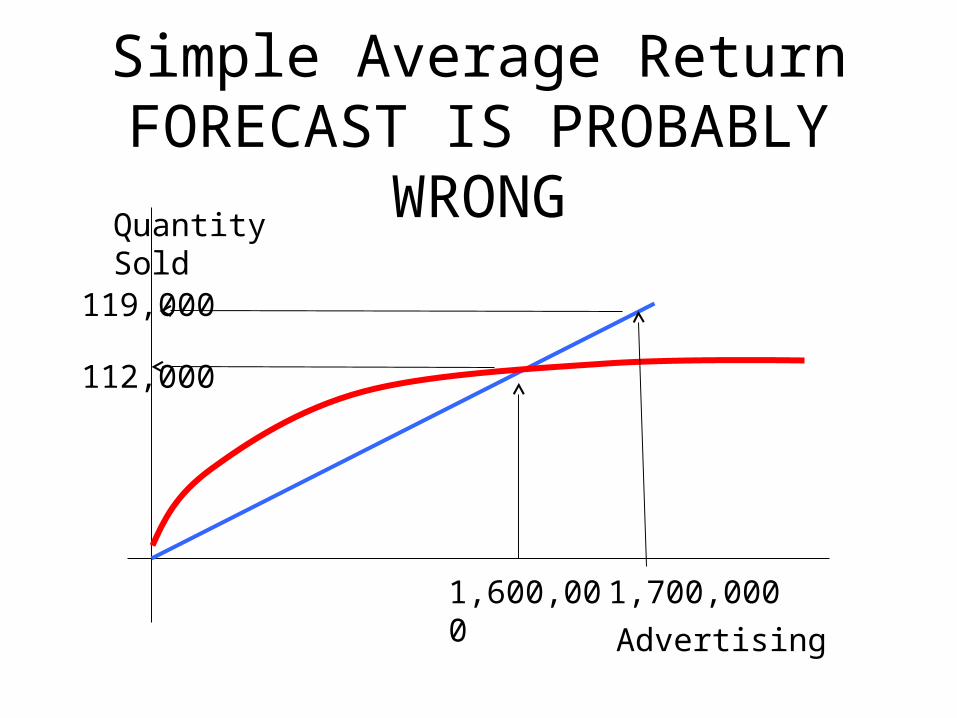
Simple Average Return FORECAST IS PROBABLY
WRONG
1,600,000 1,700,000
112,000
119,000
Quantity Sold
Advertising
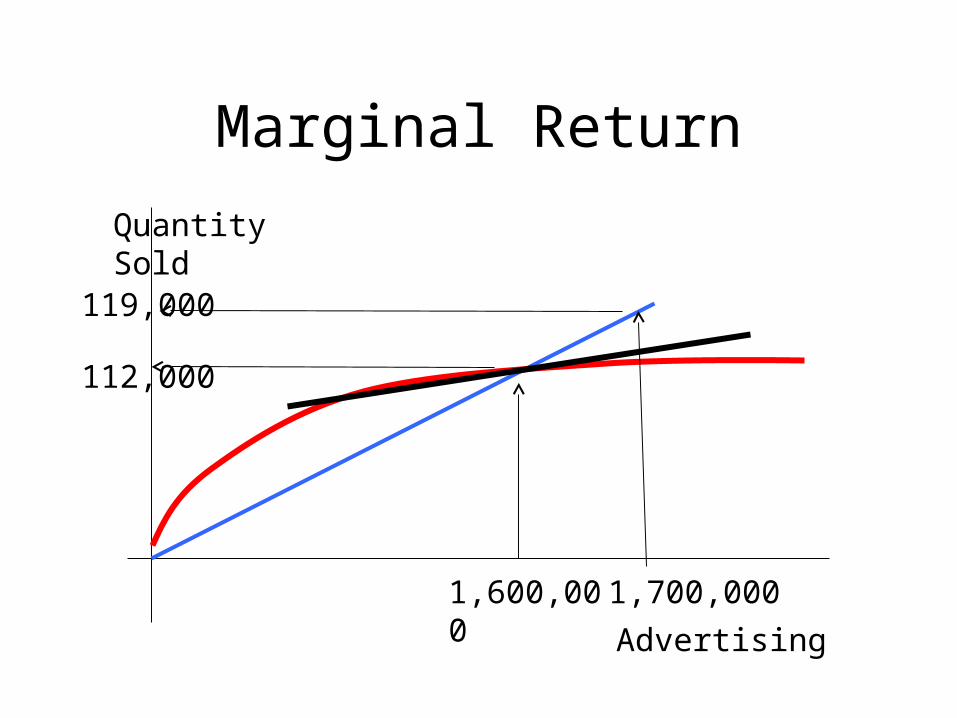
Marginal Return
1,600,000 1,700,000
112,000
119,000
Quantity Sold
Advertising
Why do I want you to look at the last two periods?
• In order to estimate Marginal Rates!!
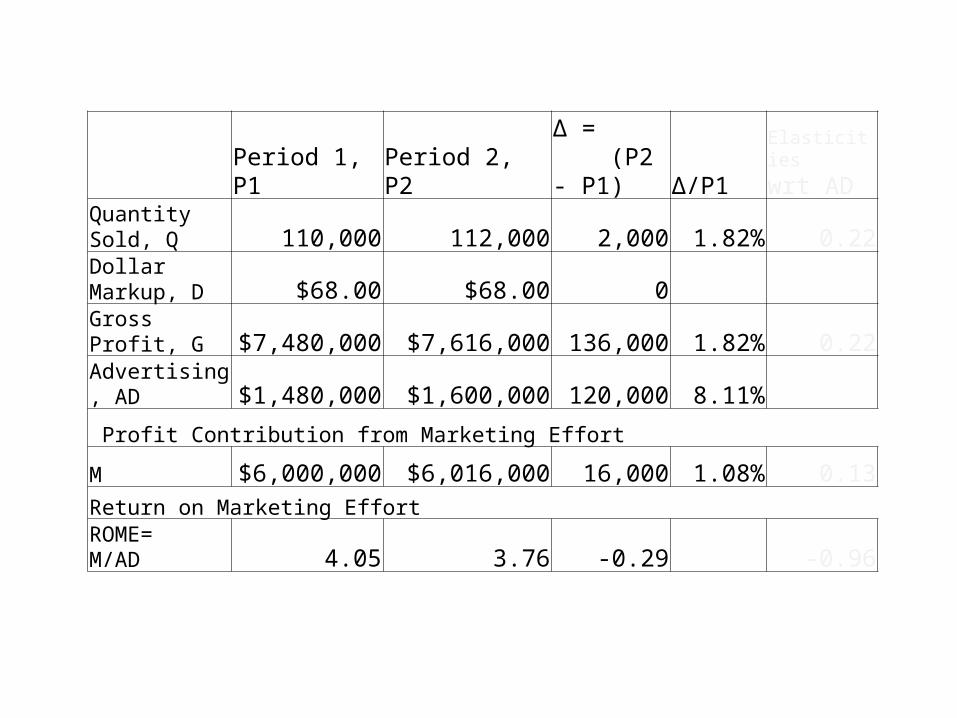
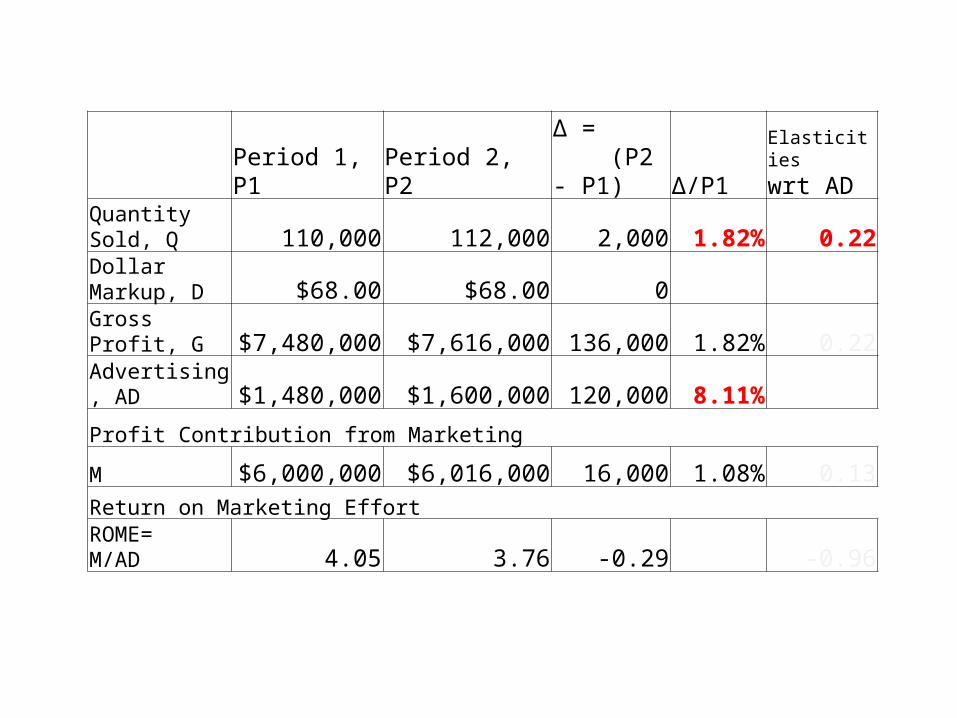
Period 1, P1 Period 2, P2∆ = (P2 - P1) ∆/P1
Elasticities
wrt ADQuantity Sold, Q 110,000 112,000 2,000 1.82% 0.22Dollar Markup, D $68.00 $68.00 0Gross Profit, G $7,480,000 $7,616,000 136,000 1.82% 0.22Advertising, AD $1,480,000 $1,600,000 120,000 8.11%
Profit Contribution from Marketing Effort
M $6,000,000 $6,016,000 16,000 1.08% 0.13Return on Marketing EffortROME=M/AD 4.05 3.76 -0.29 -0.96
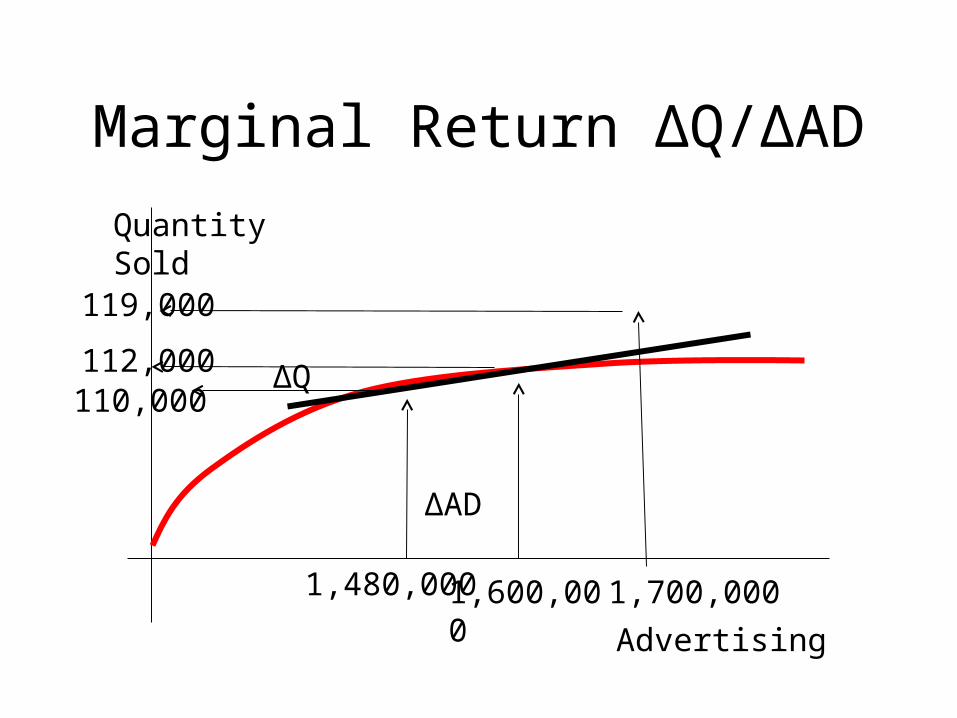
Marginal Return ∆Q/∆AD
1,600,000 1,700,000
112,000
119,000
Quantity Sold
Advertising
110,000
1,480,000
∆AD
∆Q
Period 1, P1 Period 2, P2∆ = (P2 - P1) ∆/P1
Elasticities
wrt ADQuantity Sold, Q 110,000 112,000 2,000 1.82% 0.22Dollar Markup, D $68.00 $68.00 0Gross Profit, G $7,480,000 $7,616,000 136,000 1.82% 0.22Advertising, AD $1,480,000 $1,600,000 120,000 8.11%
Profit Contribution from Marketing
M $6,000,000 $6,016,000 16,000 1.08% 0.13Return on Marketing EffortROME=M/AD 4.05 3.76 -0.29 -0.96
Calculating Advertising Elasticity
• Advertising Elasticity
• A one percentage change in advertising causes a predictable change in quantity sold.
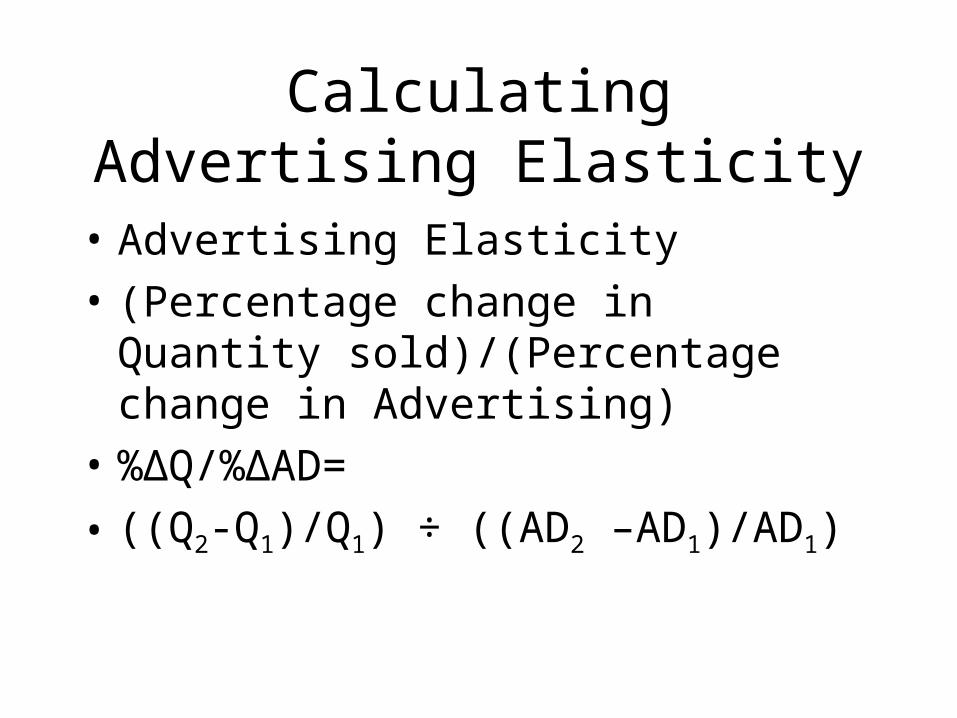
Calculating Advertising Elasticity
• Advertising Elasticity
• (Percentage change in Quantity sold)/(Percentage change in Advertising)
• %∆Q/%∆AD=
• ((Q2-Q1)/Q1) ÷ ((AD2 –AD1)/AD1)
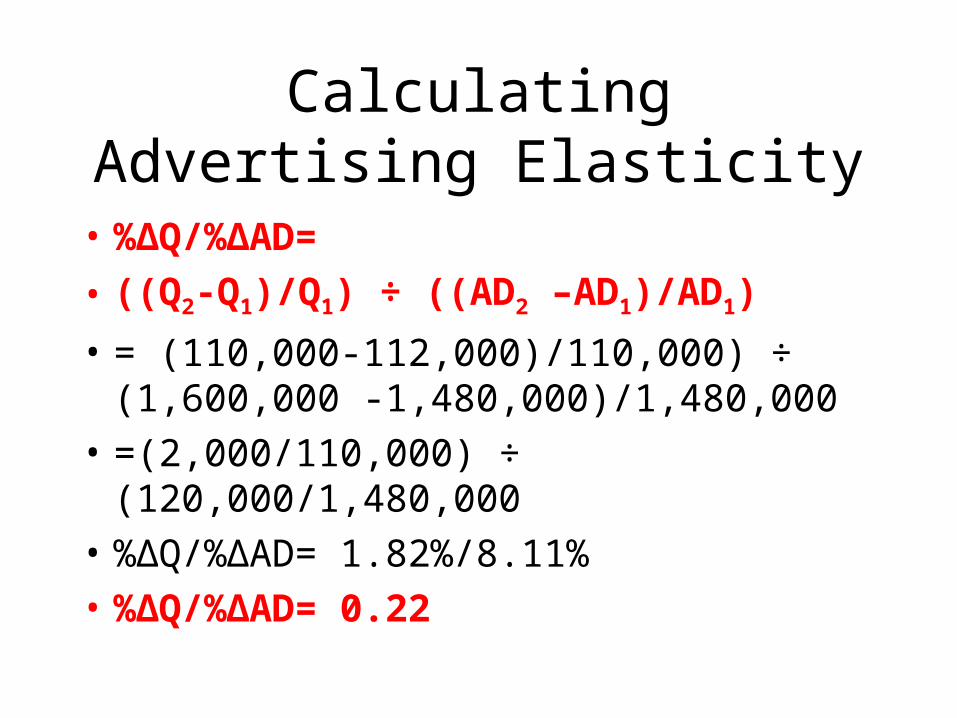
Calculating Advertising Elasticity
• %∆Q/%∆AD=
• ((Q2-Q1)/Q1) ÷ ((AD2 –AD1)/AD1)
• = (110,000-112,000)/110,000) ÷ (1,600,000 -1,480,000)/1,480,000
• =(2,000/110,000) ÷ (120,000/1,480,000
• %∆Q/%∆AD= 1.82%/8.11%
• %∆Q/%∆AD= 0.22
Using Advertising Elasticity
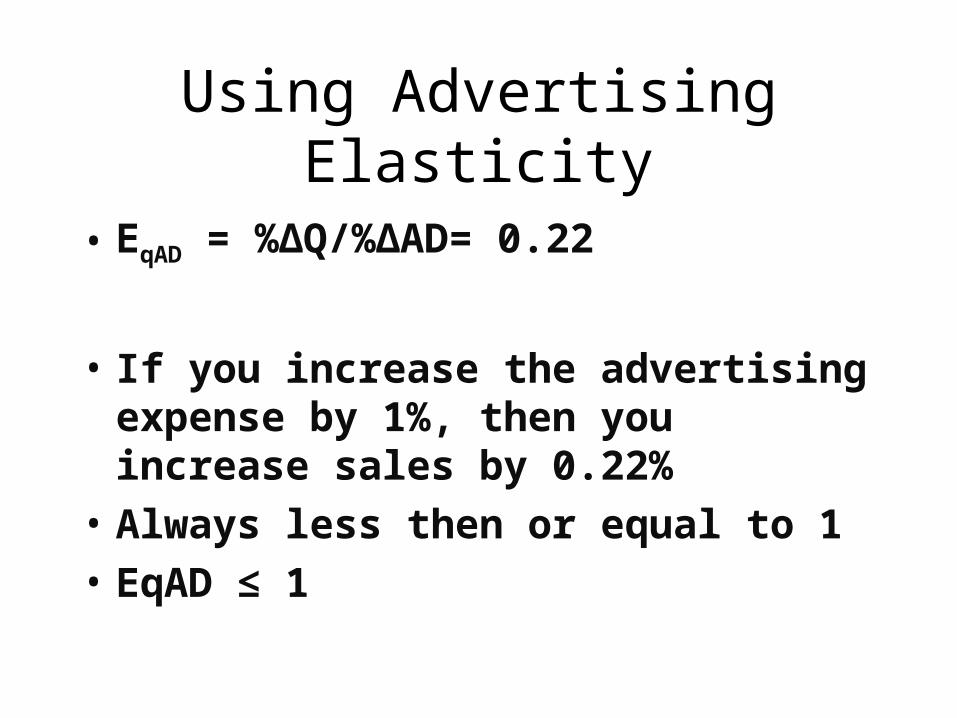
• EqAD = %∆Q/%∆AD= 0.22
• If you increase the advertising expense by 1%, then you increase sales by 0.22%
• Always less then or equal to 1
• EqAD ≤ 1
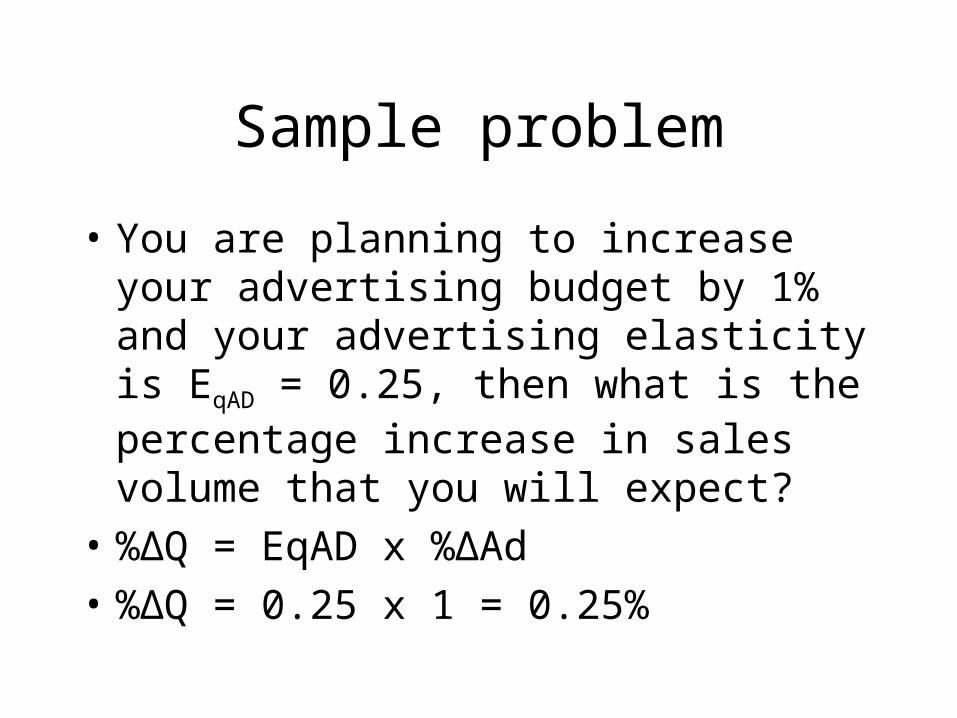
Sample problem
• You are planning to increase your advertising budget by 1% and your advertising elasticity is EqAD = 0.25, then what is the percentage increase in sales volume that you will expect?
• %∆Q = EqAD x %∆Ad
• %∆Q = 0.25 x 1 = 0.25%
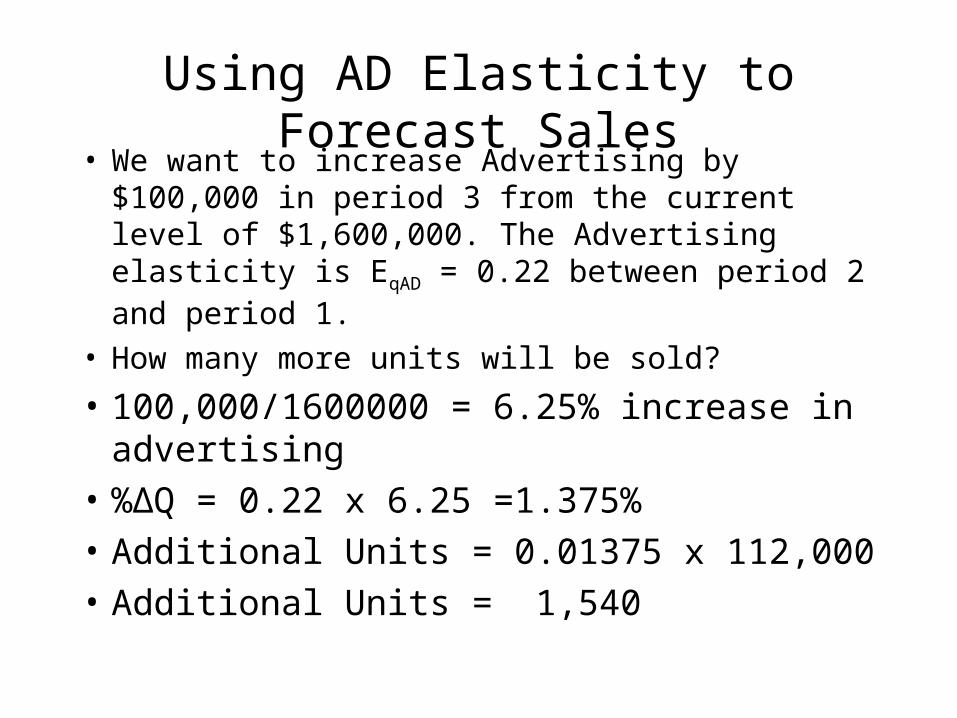
Using AD Elasticity to Forecast Sales• We want to increase Advertising by $100,000
in period 3 from the current level of $1,600,000. The Advertising elasticity is EqAD = 0.22 between period 2 and period 1.
• How many more units will be sold?
• 100,000/1600000 = 6.25% increase in advertising
• %∆Q = 0.22 x 6.25 =1.375%
• Additional Units = 0.01375 x 112,000
• Additional Units = 1,540
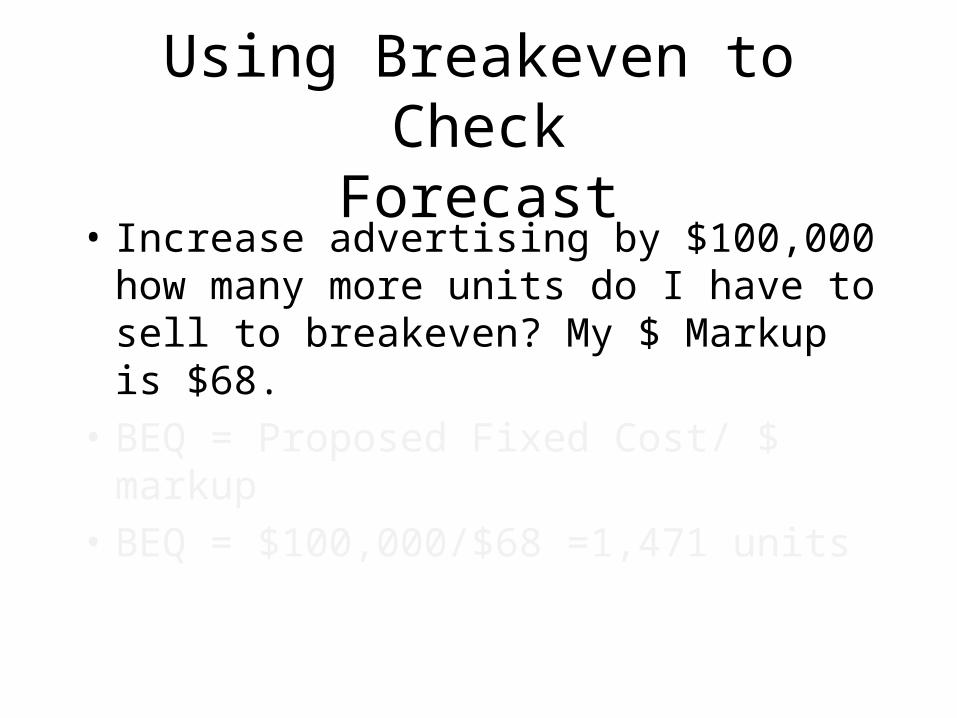
Using Breakeven to CheckForecast
• Increase advertising by $100,000 how many more units do I have to sell to breakeven? My $ Markup is $68.
• BEQ = Proposed Fixed Cost/ $ markup
• BEQ = $100,000/$68 =1,471 units
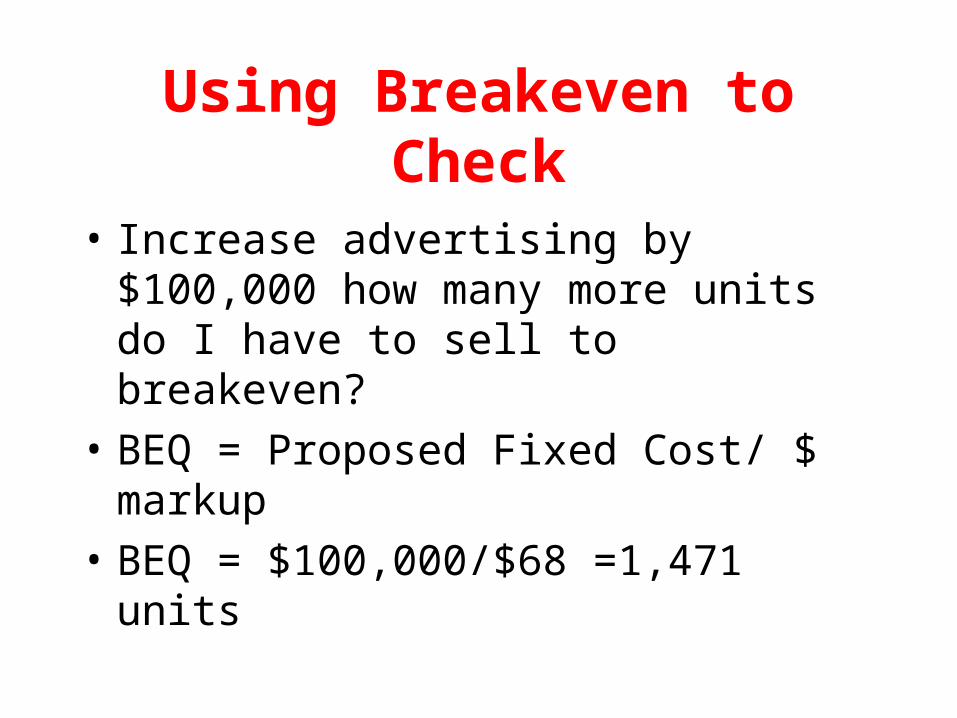
Using Breakeven to Check
• Increase advertising by $100,000 how many more units do I have to sell to breakeven?
• BEQ = Proposed Fixed Cost/ $ markup
• BEQ = $100,000/$68 =1,471 units
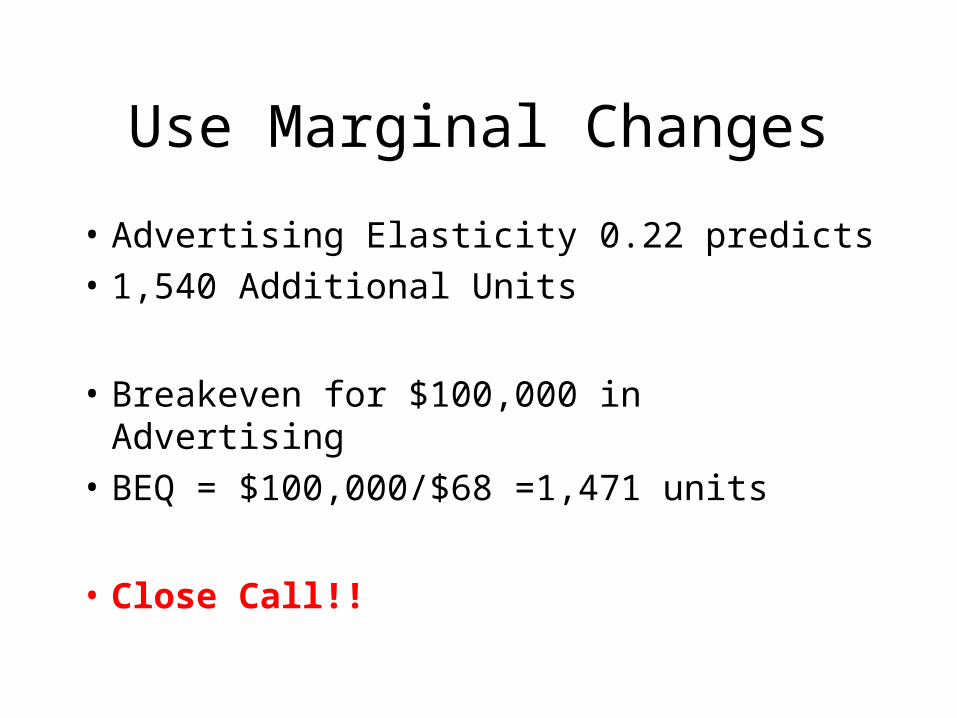
Use Marginal Changes
• Advertising Elasticity 0.22 predicts
• 1,540 Additional Units
• Breakeven for $100,000 in Advertising
• BEQ = $100,000/$68 =1,471 units
• Close Call!!
• Managers Use the Breakeven Analysis as a check for
“DOAbility”