![Anodic dissolution behavior of zirconium in Bu NBr ... · acids and strong alkalis [21]. Thus, zirconium corrosion in non-aqueous solutions would be different from titanium and deserve](https://static.fdocuments.net/doc/165x107/5e51370660b2355520448e26/anodic-dissolution-behavior-of-zirconium-in-bu-nbr-acids-and-strong-alkalis.jpg)
Corrosion mechanisms in titanium oxide-based films ... · formed on commercially pure titanium...
12
Corrosion mechanisms in titanium oxide-based films produced by anodic treatment A.C. Alves a, *, F. Wenger b , P. Ponthiaux b , J.-P. Celis c , A.M. Pinto a,d , L.A. Rocha a,e,f , J.C.S. Fernandes g a CMEMS-UMinho - Center of MicroElectroMechanical Systems - Universidade do Minho, Azurém, 4800-058 Guimarães, Portugal b LGPM – Laboratoire de Génie des Procédés et Matériaux – École Centrale Paris, France c MTM – Materials Engineering – KULeuven, Belgium d Dep. Mechanical Engineering – University of Minho, Portugal e Dep. Physics, Faculdade de Ciências de Bauru, UNESP - Universidade Estadual Paulista, Brazil f IBTN/Br – Brazilian Branch of the Institute of Biomaterials, Tribocorrosion and Nanomedicine, Bauru, Brazil g CQE/DEQ – Instituto Superior Técnico, Universidade de Lisboa, Lisboa, Portugal A R T I C L E I N F O Article history: Received 12 October 2016 Received in revised form 2 March 2017 Accepted 2 March 2017 Available online 4 March 2017 Keywords: Titanium Biomaterial Anodic treatment Corrosion EIS A B S T R A C T Thanks to its excellent corrosion resistance, good mechanical properties and biocompatibility, titanium has been widely used as dental implant material. A passive oxide film formed on titanium surface is responsible for its high corrosion resistance. This study has evaluated the surface characteristics of oxide layers formed on commercially pure titanium samples by anodic treatment and the effect of anodic treatment on their corrosion behaviour. FEG-SEM and XRD were used to evaluate the micromorphology and crystalline structure of these oxide films. Their corrosion resistance was evaluated using electrochemical impedance spectroscopy (EIS) and potentiodynamic polarization curves. EIS was performed for different times of immersion and a new equivalent electrical circuit (EEC) is proposed to fit the experimental data of the anodic oxide films. It was concluded that the morphology, composition, and structure of the outer porous layer of the anodic layer determine the corrosion protection of the material. © 2017 Elsevier Ltd. All rights reserved. 1. Introduction In comparison with other metallic biomaterials (Co-Cr alloys and stainless steels), titanium (Ti) possess the most adequate balance of characteristics for several biomedical applications, namely dental implants. High biocompatibility, specific strength, and corrosion resistance may be pointed out as the most interesting features for those applications [1–4]. However, being a bio-inert metal, titanium does not have the ability to chemically bond with the natural bone [5–8]. Although it was shown that metallic dental implants coated with hydroxyapatite (HA) display enhanced biological response compared to uncoated implants [9], lack of adhesion of HA coatings to the metallic substrate and/or fracture or delamination of the coating are liable to occur [10]. Thus, several surface modification techniques, as plasma-spraying [9,11,12], ion implantation [13–15], sol-gel deposition [16,17] and anodic treatment [10,18–24] have been investigated in order to produce surface layers with improved bioactivity. Due to their simplicity, anodic treatments appear as attractive techniques for tailoring Ti surfaces in terms of topography, porosity, and composition [19,21– 28]. In the 90's, Ishizawa and Ogino [10,19–21,29,30] were among the first authors to perform surface modification of Ti with the incorporation of bio-elements such as Ca and P. An electrolyte consisting of calcium acetate and b-glycerophosphate disodium salt pentahydrate was used to form anodic titanium oxide films containing Ca and P in different amounts depending on the processing conditions. The authors observed precipitation of HA crystals after a hydrothermal treatment [10,19,20,29,30]. Several authors have characterized different porous anodic oxide films formed by micro-arc oxidation (MAO) on Ti or its alloys, in terms of crystalline structure, topography, porosity, composi- tion, corrosion behaviour and biological response [7– 10,19,21,22,24,26–48]. Electrochemical impedance spectroscopy (EIS) was also used by several authors to characterize those films [24,31,33,34,49,50]. Nevertheless, discussion on the most suitable * Corresponding author at: University of Minho - Department of Mechanical Engineering - Campus de Azurém, 4800-058 Guimarães, Portugal. Tel.: +351 253 510 220; fax: +351 253 516 007. E-mail address: [email protected] (A.C. Alves). http://dx.doi.org/10.1016/j.electacta.2017.03.011 0013-4686/© 2017 Elsevier Ltd. All rights reserved. Electrochimica Acta 234 (2017) 16–27 Contents lists available at ScienceDirect Electrochimica Acta journal homepa ge: www.elsev ier.com/locate/electacta
Transcript of Corrosion mechanisms in titanium oxide-based films ... · formed on commercially pure titanium...

Electrochimica Acta 234 (2017) 16–27
Corrosion mechanisms in titanium oxide-based films produced byanodic treatment
A.C. Alvesa,*, F. Wengerb, P. Ponthiauxb, J.-P. Celisc, A.M. Pintoa,d, L.A. Rochaa,e,f,J.C.S. Fernandesg
aCMEMS-UMinho - Center of MicroElectroMechanical Systems - Universidade do Minho, Azurém, 4800-058 Guimarães, Portugalb LGPM – Laboratoire de Génie des Procédés et Matériaux – École Centrale Paris, FrancecMTM – Materials Engineering – KULeuven, BelgiumdDep. Mechanical Engineering – University of Minho, PortugaleDep. Physics, Faculdade de Ciências de Bauru, UNESP - Universidade Estadual Paulista, Brazilf IBTN/Br – Brazilian Branch of the Institute of Biomaterials, Tribocorrosion and Nanomedicine, Bauru, BrazilgCQE/DEQ – Instituto Superior Técnico, Universidade de Lisboa, Lisboa, Portugal
A R T I C L E I N F O
Article history:Received 12 October 2016Received in revised form 2 March 2017Accepted 2 March 2017Available online 4 March 2017
Keywords:TitaniumBiomaterialAnodic treatmentCorrosionEIS
A B S T R A C T
Thanks to its excellent corrosion resistance, good mechanical properties and biocompatibility, titaniumhas been widely used as dental implant material. A passive oxide film formed on titanium surface isresponsible for its high corrosion resistance. This study has evaluated the surface characteristics of oxidelayers formed on commercially pure titanium samples by anodic treatment and the effect of anodictreatment on their corrosion behaviour. FEG-SEM and XRD were used to evaluate the micromorphologyand crystalline structure of these oxide films. Their corrosion resistance was evaluated usingelectrochemical impedance spectroscopy (EIS) and potentiodynamic polarization curves. EIS wasperformed for different times of immersion and a new equivalent electrical circuit (EEC) is proposed to fitthe experimental data of the anodic oxide films. It was concluded that the morphology, composition, andstructure of the outer porous layer of the anodic layer determine the corrosion protection of the material.
© 2017 Elsevier Ltd. All rights reserved.
Contents lists available at ScienceDirect
Electrochimica Acta
journal homepa ge: www.elsev ier .com/locate /e lectacta
1. Introduction
In comparison with other metallic biomaterials (Co-Cr alloysand stainless steels), titanium (Ti) possess the most adequatebalance of characteristics for several biomedical applications,namely dental implants. High biocompatibility, specific strength,and corrosion resistance may be pointed out as the mostinteresting features for those applications [1–4]. However, beinga bio-inert metal, titanium does not have the ability to chemicallybond with the natural bone [5–8].
Although it was shown that metallic dental implants coatedwith hydroxyapatite (HA) display enhanced biological responsecompared to uncoated implants [9], lack of adhesion of HAcoatings to the metallic substrate and/or fracture or delaminationof the coating are liable to occur [10]. Thus, several surfacemodification techniques, as plasma-spraying [9,11,12], ion
* Corresponding author at: University of Minho - Department of MechanicalEngineering - Campus de Azurém, 4800-058 Guimarães, Portugal. Tel.: +351 253 510220; fax: +351 253 516 007.
E-mail address: [email protected] (A.C. Alves).
http://dx.doi.org/10.1016/j.electacta.2017.03.0110013-4686/© 2017 Elsevier Ltd. All rights reserved.
implantation [13–15], sol-gel deposition [16,17] and anodictreatment [10,18–24] have been investigated in order to producesurface layers with improved bioactivity. Due to their simplicity,anodic treatments appear as attractive techniques for tailoring Tisurfaces in terms of topography, porosity, and composition [19,21–28].
In the 90's, Ishizawa and Ogino [10,19–21,29,30] were amongthe first authors to perform surface modification of Ti with theincorporation of bio-elements such as Ca and P. An electrolyteconsisting of calcium acetate and b-glycerophosphate disodiumsalt pentahydrate was used to form anodic titanium oxide filmscontaining Ca and P in different amounts depending on theprocessing conditions. The authors observed precipitation of HAcrystals after a hydrothermal treatment [10,19,20,29,30].
Several authors have characterized different porous anodicoxide films formed by micro-arc oxidation (MAO) on Ti or its alloys,in terms of crystalline structure, topography, porosity, composi-tion, corrosion behaviour and biological response [7–10,19,21,22,24,26–48]. Electrochemical impedance spectroscopy(EIS) was also used by several authors to characterize those films[24,31,33,34,49,50]. Nevertheless, discussion on the most suitable

A.C. Alves et al. / Electrochimica Acta 234 (2017) 16–27 17
equivalent electrical circuits (EEC) for interpreting EIS results isstill going on. Most of the authors assume that the anodic oxidefilm is composed of two-layers, an inner barrier layer followed by aporous outer layer, thus adopting the equivalent circuit proposedby Pan et. al [51] for two-layers oxide film on anodised Ti.
An acceptable equivalent circuit should meet two mainconditions: first of all it should provide a good fitting to the EISexperimental data and secondly it should have a clear and validphysical meaning. In particular, a clear description of the differentpaths for the flow of current should be done, allowing todistinguish between electronic and ionic charge carriers andbetween the faradaic and non-faradaic paths, as proposed byGrahame [52]. As the number of time constants present in the dataincreases, the number of degenerate EEC's that fit the data alsoincreases, but most of them have no physical meaning.
Some of the present authors had previously reported [45] thatincreased concentration of calcium acetate in the mixture ofb-glycerophosphate and calcium acetate anodic treatment elec-trolyte led to better tribocorrosion behaviour, due to the alterationof the crystallographic structure of the resulting anodic layer. Thepresent work aims to study, for the first time, the electrochemicalproperties of Ti anodic oxide layers during long-time immersion ina physiological solution using EIS. In particular, a new EEC to fit theexperimental data is proposed, based on a detailed characteriza-tion of the anodic layers.
2. Experimental
2.1. Materials and solutions
Commercial pure titanium (CP Ti grade 2, Goodfellow Cam-bridge Limited, England) samples were cut from the same originalplate in square forms of 10x10x1 mm. Immediately before theanodic treatment all the samples were cleaned in an ultrasonicbath with acetone for 3 min, etched in Kroll's reagent (1 ml HF and5 ml HNO3 in 44 ml H2O) during 10 min, and cleaned again in anultrasonic bath for 10 min in propanol followed by 5 min rinsing indistilled water, and then dried with warm air.
The electrolyte used for the anodic treatment consisted in asolution of b-glycerophosphate disodium salt pentahydrate(b-GP) at different concentrations of calcium acetate monohydrate(CA) as depicted in Table 1. After the anodic treatment,electrochemical tests were performed in an 8 g/l NaCl solution.The reagents used in the preparation of these solutions weresupplied by Fluka-BioChemika, Sigma-Aldrich and Panreac,respectively.
2.2. Anodic treatment
The anodic treatment was performed under constant voltagemode. A DC power supply (GPR-30H10D) was used and thetreatment was carried out at room temperature for 1 min at 300 V,under a sparking regime. A platinum plate was used as cathode(2 cm2). The distance between the cathode and the anode (Tiplates) was kept constant (8 cm) for each treatment. The surfacearea of the titanium samples exposed to the electrolyte solutionwas 0.358 cm2. All the anodic treatments were done under
Table 1Samples under study and electrolyte composition.
Group Electrolyte
015 CA 0.02 mol/l b-GP + 0.15 mol/l CA035 CA 0.02 mol/l b-GP + 0.35 mol/l CACP Ti just etched
agitation in a turbulent regime by using a magnetic stirrer rotatingat 200 rpm.
2.3. Electrochemical tests
Electrochemical tests consisted of open circuit potential (Eocp)measurements, potentiodynamic polarization curves, and electro-chemical impedance spectroscopy (EIS). All the electrochemicaltests were performed using a 3-electrode arrangement where thesamples were used as working electrode, with an exposed area of0.358 cm2, a Pt electrode was used as counter electrode and asaturated calomel electrode (SCE) was used as reference electrode.All the potentials are given with respect to SCE.
All electrochemical tests were performed using a Reference 600potentiostat/galvanostat from Gamry Instruments. The potentialscan rate in the potentiodynamic tests was 1 mV/s, starting at 0.5 Vbelow Eocp and moving into the anodic direction up to 2 V.
The EIS tests were done for different times of immersion in thetest solution (0 h, 1 h, 1 day, 2 days, 4 days, 8 days, 16 days, and 20days) at Eocp. Before each EIS test the Eocp was measured during30 min. The impedance data acquisition was done by scanning arange of frequencies from 63 kHz till 10 mHz, with 10 points perfrequency decade, and the amplitude of the sinusoidal signal was10 mV, in order to guarantee linearity of the electrode response.
2.4. Characterization Methods
The topography, microstructure and chemical composition ofthe anodic oxide layers formed on the surface were analysed byscanning electron microscope, FEI Nova 200 Field Emission GunScanning Electron Microscope (FEG-SEM) equipped with EnergyDispersive X-Ray Spectroscopy (EDS). The cross sections of theanodic oxide films were prepared by nano-machining using thefocused ion beam of a SEM-FIB (Nova 600 NanoLab) andcharacterized by FEG-SEM/EDS.
The surface roughness was measured on five randomly selectedsamples (using five different areas on each sample), using a highresolution optical sensor from STIL (model CHR150-N), a 3Dmotion measuring station, a controlling system from STIL and anoptic sensor (F3) from ZEISS.
The structure of the anodic layers was analysed by X-raydiffraction with Bragg-Brentano, Göbel mirror mode, CuKaradiation (Bruker D8 Discover). A scanning range (2u) of 10� to100� was used, and the step size was set to 0.02�. The peaksidentification was done using Diffrac Plus Evaluation (PackageRelease 2006) software. The phase percentage (distribution) wascalculated following Eq. (1).
%phasea ¼P
Ia peaksPIall peaks
ð1Þ
3. Results and Discussion
3.1. Characterization of the anodic films
3.1.1. Surface morphologyFig. 1 presents the current density evolution during the
formation of the anodic oxide layers at 300 V in the two differentelectrolytes. After an initial current peak, a decrease is observed inthe early stages of the anodic treatment, being attributed to theformation of a compact and thin oxide layer [37–39,42,53].Whenthe thickness of the oxide films reach a critical value, the appliedvoltage promotes the dielectric breakdown of these films andmicro-arc discharge start to occur at the surface of the material,leading to localised melting and formation of micro-pores

Fig. 1. Current densities evolution during the anodic treatment time at 300 V fortwo different electrolyte concentrations.
Fig. 2. Representative SE SEM images of the titanium samples for different surfaceconditions: a) etched, and anodic treated groups b) 015 CA and c) 035 CA.
18 A.C. Alves et al. / Electrochimica Acta 234 (2017) 16–27
[28,42,49]. Micro-arc discharges are identified in the curves by thecurrent oscillations during the treatment. These dischargesaccelerate the growth of the layer, which then leads to a decreaseof the current density.
A representative SEM micrograph of the untreated Ti afteretching (before the anodic treatment) is shown in Fig. 2 (a), wherethe typical granular structure of Ti can be observed. Fig. 2(b) and (c)show the surface morphology after anodic treatment in 0.15 M and0.35 M CA, respectively. As can be observed, a multiscale porousstructure was obtained with some cracks being observed on thesurface of both groups of samples. The arrows shown in Fig. 2 (c)identify some of the cracks present in the 035CA group. The densityof cracks and distribution of pores size were calculated using apoint-counting method adapted from ASTM E562. A grid consist-ing of a 15 lines parallel to each other with a constant spacing of0.05 mm was superimposed on the micrograph. All the poresintersecting the lines were counted and their diameters weremeasured. Five SEM images were taken for each sample in differentzones of the surface and five samples were used per condition. Itcould be observed that for 015CA group the crack density was of(1.1 �0.4) x 103 cracks/mm2 while for 035CA it is higher, namely(7.1 �1.6) x 103 cracks/mm2. An increase of the number of crackswith the increase of the calcium acetate concentration was alsoobserved by S-D Wu et al. [53].
Also, an increase in the amount of calcium acetate in theelectrolytic solution resulted in higher pore diameters, as shown inFig. 3. Finally, the anodic treatment resulted in pores with a widerange of sizes [28]. Regarding the 015CA group, most of the poreshave a diameter between 0.5 and 1 mm, with a maximum size of3.5 mm. In the 035CA group, the size of pores increased, and theirdiameter is between 1.5 and 2 mm, for most pores, with amaximum size of 5 mm.
Comparing the pores size dispersion of both groups, it wasobserved that the 035CA group presents a larger dispersion than015CA. Also, the number of pores per surface area was different inboth groups, namely (34 � 3) x 103 pores/mm2 for the 015CA and(24 � 3) x 103 pores/mm2 for the 035CA. The increase on the poressize with increasing electrolyte concentration has also beenreported by Ishizawa et al. [21] for anodic titanium oxide filmscontaining Ca and P, processed by similar anodic treatmentconditions. The microstructural differences between the twoanodized surfaces are attributed to the dielectric breakdown ofthe oxides layers [32]. The increase of calcium acetate concentra-tion in the electrolyte may improve the electrical conductivity of
the electrolyte. S. Abbasi et al. [37] stated that the variation inelectrical resistance of the electrolyte is the main reason for thepore size enlargement at higher concentrations of calcium acetate.
In terms of roughness, the acid etched surface (just beforeanodic treatment) presented a mean roughness (Ra) of0.42 � 0.02 mm. After the anodic treatment the roughness

Fig. 3. Pore size distribution on the anodic treated surfaces for two different electrolyte concentrations.
A.C. Alves et al. / Electrochimica Acta 234 (2017) 16–27 19
increased around 4 times, up to 1.64 � 0.36 mm and 1.66 � 0.22 mmfor group 015CA and 035CA, respectively.
3.1.2. Anodic films composition and structureThe Ca/P weight ratio of the anodic films was estimated by EDS
analysis, being strongly influenced by the calcium acetateconcentration. The Ca/P ratio for the 015CA group (1.61 �0.09)was lower than for 035CA (3.62 � 0.11).
Under sparking conditions, local heating occurs and hightemperatures can be reached, so water vapour and oxygen arereleased [18]. During this process, specific ions as Ca and P can beretained in the porous oxide layer [19,20,22]. This is one advantageof this anodic treatment, as the presence of these ions may improveosteointegration [43,46,47].
The presence of HA is known as beneficial to the implants, as itpromotes a direct bonding to the bone and enhancement of newbone formation around it. Many studies have proved that HAcoated implants show superior histological results than theuncoated ones [30]. The Ca/P ratio on HA is 1.67. In this way, itmay be expected that by changing the concentration of theelectrolyte of the anodic treatment, a Ca/P ratio similar to the onein HA may be reached. Ishizawa et al.[19,20,30] have shown thatseveral HA crystals precipitated in the anodic titanium oxide layercontaining Ca and P after a hydrothermal treatment, when the Ca/Pratio was similar to HA.
Anyway, even without HA precipitation, samples investigatedin this work showed enhanced human osteoblast adhesion whentested in vitro [43,46,47].
The cross section of the anodic films is shown in Fig. 4a-d. Bothanodic films presented three different layers. Adjacent to the bulkmaterial (Ti) a compact film was formed (A) followed by twoporous outer layers. The inner porous layer, marked in Fig. 4 as B,presented small pores, whereas the outer porous layer (C) formednear the outer surface presented bigger pores.
The thickness of the anodic films was measured by imageanalysis. The 035CA group has a slightly increased thickness(4.38 � 1.21 mm) compared to the 015CA group (3.39 � 1.04 mm).
The X-ray patterns obtained for the anodic treated samples, aswell as for untreated Ti, are shown in Fig. 5 (only the 2u values from20� to 60� are shown, as this is the range where the characteristicspeaks for Ti and Ti oxides are found). Ti diffraction peaks wereobserved on all groups: 015CA presented anatase, and 035CA bothanatase and rutile.
Kim et al. [25] have found that anodic treatment of titanium in acalcium glycerophosphate /calcium acetate electrolyte producedlayers with two crystalline phases, as rutile and anatase. On theother hand, Sul et al. [54] have shown that the structure of theanodic layer is changed from amorphous to crystalline, meaningthat formation of the anatase, rutile or brokite occurs above acritical oxide thickness. The electrochemical parameters, aselectrolyte concentration or the current density, influence thedielectric breakdown potential, which is related to the crystallo-graphic transformation. It has been reported that after thedielectric breakdown, anatase is formed at lower forming voltages,while the combination of anatase and rutile phases is formed athigher forming voltages [36,55,56]. However, the forming voltagesof both phases may decrease when the conductivity of theelectrolyte increases. In this case, by increasing the concentrationof calcium acetate the dielectric breakdown changed and, probablydue to this fact, the anodic oxide layer was formed as acombination of anatase and rutile phases on the 035CA group.Since no rutile was detected in the case of 015CA group, it isassumed that the crystalline phase of the anodic oxide layer was100% anatase. The phase percentages (phase distribution) regard-ing 035CA group were calculated by Eq. (1), and the results showedthat the anodic oxide layer was a combination of 70% anatase and30% rutile.
3.2. Electrochemical behaviour
3.2.1. Potentiodynamic Polarization curvesFig. 6 shows the polarization curves of the untreated titanium
samples and anodic treated groups of samples. The averagecorrosion potential, E(i=0), and the average passive current density,

Fig. 4. SE SEM images of a FIB-prepared cross-sections of anodic layers for two different electrolyte concentrations: a) and b) 015CA - c) and d) 035CA.
20 A.C. Alves et al. / Electrochimica Acta 234 (2017) 16–27
ipass, obtained from several experiments (up to seven) in eachgroup, are presented in Table 2.
The corrosion potential showed a clear increase from untreatedTi to the 015CA group, followed by a slight decrease from 015CA to035CA. A passivation plateau was observed for all types ofspecimens, starting at 0.250 V for Ti, whereas for 015CA it wasregistered from 0.191 V to 0.652 V, being followed by a slightincrease of the current that corresponds to a degradation of theprotective film, possibly due to the dissolution of calcium andphosphorous. For the 035CA group, the passive domain is observedfrom 0.064 to 0.580 V. The ipass values showed a two orders ofmagnitude drop from Ti to 015Ca, with a slight increase from015CA to 035CA. Although the passive range seems to be reducedfrom the untreated Ti to both treated materials, even above thisprimary passive range and up to 2 V (the maximum appliedpotential) the values of current density are always much lowerthan those observed for Ti. Thus, both the Ei=0 and the ipass valuesindicated an evident tendency for the improvement of thecorrosion resistance on the MAO-processed materials, the 015CAgroup showing the best properties.
Il.S. Park et al. [28] have studied the corrosion resistance of CP Ti(grade 2) anodized in similar conditions. They have also reportedhigher corrosion potential value and lower current density ascompared with untreated Ti. The authors attributed these resultsto the increased resistance of the oxide layer to corrosion throughthe anodic treatment. Previous studies [8,28] also defended that,beyond the increase in roughness, which is desirable for manybiomedical applications, the increase in thickness of the oxidelayer obtained through MAO also results in an improvement of thecorrosion resistance, compared to untreated Ti.
3.2.2. Open Circuit Potential evolution versus immersion timeThe evolution of OCP with immersion time for untreated and
anodic treated Ti samples in 8 g/l of NaCl is presented in Fig. 7. Afterexposing all samples to the solution, the OCP for the untreated Tiincreased while it decreased for the anodic treated samples. For theuntreated Ti samples, the increase on OCP values with immersiontime corresponded to the decrease of the anodic reaction kineticsdue to the formation of the natural oxide film of titanium in contactwith the electrolyte [41,57]. Regarding the anodic treated samples,the decrease on OCP with immersion time may be related to partial

Fig. 5. X-ray diffraction patterns obtained for groups 015CA, 035CA, together withuntreated Ti.
Fig. 6. Potentiodynamic polarization curves of the different groups of samples inNaCl (8 g/l).
Table 2Average values of corrosion potential, E(i=0), and passivation current density, ipass,for all groups.
Group E(i=0) (V vs. SCE) ipass (A cm�2)
CP Ti �0.475 � 0.017 (10.1 � 1.1)x10�6
015CA 0.091 � 0.022 (2.8 � 1.0)x10�8
035CA �0.017 � 0.032 (3.8 � 0.5)x10�8
A.C. Alves et al. / Electrochimica Acta 234 (2017) 16–27 21
dissolution of the anodic film. Banakh et al. [35] evaluated theresponse of anodic oxide layers containing Ca and P by immersionin a simulated body fluid and reported that Ca and P content in theanodic layers decreased after 14 days of immersion. Moreover, Cadissolution occurs at higher rates than P. However, during theimmersion period, the anodic treated samples presented morepositive values than untreated Ti indicating a lower tendency tocorrosion.
3.2.3. Electrochemical Impedance SpectroscopyFig. 8 shows the electrochemical impedance spectra for Ti in the
form of Nyquist and Bode diagrams for different times ofimmersion. At high frequencies (102 Hz to 105 Hz), the Bode
diagram shows constant values of |Z| where the phase angle wasnear 0� which corresponds to the response of the electrolyteresistance. At low and middle frequencies, the phase anglepresented values approaching 90� which is a typical capacitivebehaviour of a compact oxide film. The protective character of thisfilm seemed to be enhanced with increased immersion time, asalready concluded from the OCP evolution.
Fig. 9 presents the equivalent electrical circuit for the nativeoxide film formed on the surface of the CP Ti samples used in thefitting of the experimental data, containing: Rs - electrolyteresistance, Rbf(N) - native barrier oxide film resistance and Qbf(N) -constant phase element (CPE), accounting for the non-idealcapacitance of the native barrier oxide film.
Qbf(N) values were converted to Cbf(N) (capacitance of the nativeoxide film) by using Eq. (2), derived from Brug's equation [58].
Cbf Nð Þ ¼ Qbf Nð ÞRs1�nð Þ
h i1n ð2Þ
The equivalent circuit parameters obtained from EIS data for theuntreated Ti at different immersion times are shown in Table 3. Ascan be seen from the fitting results, the values of Rbf(N) increase andthose of Cbf(N) decrease with the increased immersion time,indicating a higher protection of the passive oxide film formed onthe surface at longer immersion time.
Fig. 10 presents the electrochemical impedance spectra in theform of Nyquist and Bode diagrams, obtained at differentimmersion times for the anodic treated samples. The 015CA grouppresented two time constants: one corresponding to the highfrequencies being shifted to higher frequencies values as timeelapses. The 035CA presented a similar behaviour to the 015CA atthe beginning of immersion but the resistance corresponding tothe high frequencies time constant was considerably lower thanthat of the 015CA. Both groups presented a phase angle near �80�,for the lowest frequencies range (10�2 – 10�1 Hz) during all theimmersion period.
Different circuits for fitting EIS spectra on MAO treated Tisurfaces were found in the literature. Among other authors,Shokouhfar et al. [49] and Venkateswarlu et al. [33,50] used EECconsisting of two time constants, one at high frequency (CPEo witha resistance Ro in parallel), characteristic of the outer porous layer,and the second corresponding to low frequencies and beingcharacteristic of the inner barrier layer of the film, consisting in aCPEbwith a resistance Rb in parallel. Both authors present Ro as the“outer porous layer resistance”, although obtaining quite lowvalues for this parameter, as commented by both authors. In fact, Ro
should not be assigned to the resistance of the outer oxides, but tothe additional solution resistance in their pores. Both the layout ofthe EEC, where Ro is in series with the contribution of the innerbarrier layer, and the low Ro values point out to this interpretation.Additionally, Pan et al. [51] have introduced this interpretation intheir publications, mentioning that Ro (referred as Rp in their work)could be either the outer layer resistance or the electrolyteresistance inside pores.
On the other hand, Fazel et al. [42] used a similar circuit for MAOtreated Ti surfaces but the authors added a constant phase element(Qd) in series with Rb which was assigned to diffusion of ionsthrough the oxide layer. This interpretation is questionable, as then value obtained by these authors for that constant phase elementis 0.845, far from the typical values expected for diffusion-controlled processes (ca. 0.5) and closer to those of a capacitance ofa rough oxide. Thus, even if it fits the experimental data, theproposed EEC lacks physical meaning, which is a major require-ment for acceptance of an EEC.
Several studies [56,59–61] used EEC containing Rs (electrolyte'ssolution), an outer porous oxide layer (CPEp and Rp), an inner densebarrier oxide layer (CPEb and Rb) and a Warburg diffusion element

Fig. 7. Open circuit potential evolution with immersion time of the different groupof samples in NaCl (8 g/l).
Fig. 9. Equivalent circuit proposed for the fitting of EIS spectra for the untreated CPTi (grade 2) samples.
22 A.C. Alves et al. / Electrochimica Acta 234 (2017) 16–27
to account for the mass-transfer process inside the irregularshaped pores in the oxide. However, diffusion control is not verymuch expected in these materials, as the rate of any faradaicreaction (especially metal oxidation) is expected to be very low. Onthe other hand, Quintero et al. [40] proposed a different equivalentcircuit for similar anodic treated surfaces, in a 3 time constantladder arrangement, consisting of the contributions of the outerlayer, inner layer and metal/electrolyte interface at the bottom ofnanometric pores of a not completely homogeneous inner layerthat would allow contact between the Ti substrate and theelectrolyte. However, the fittings presented by these authors arevery poor, with x2 values close to 10-2, which may question thevalidity of their circuit.
In summary, all the circuits presented in the literature, bothrelative to standard anodising or MAO, assumed a two-layeredoxide film, with an inner barrier layer and an outer porous layer,although some of them may include other elements, such asWarburg or CPE's, normally assigned to diffusion control. However,by choosing from these circuits the ones that have a clear physicalmeaning, none of them was able to provide acceptable fitting to theimpedance spectra of the present anodic treated samples. In fact,based on the structure of the anodic film, as revealed from the cross
Fig. 8. Nyquist and Bode diagrams recorded on the untreated CP Ti (Grade
sections of the anodic oxide films prepared by SEM-FIB andcharacterized by FEG-SEM/EDS (Fig. 3), and on the EIS diagrams(Fig. 10), a triplex structure is considered, with a thin and compactoxide film formed at the metal/oxide interface (barrier film)followed by two porous layers, namely an inner porous layerpresenting small pores and an outer porous layer, formed at thesurface, that consisted in larger pores but not reaching the barrierfilm. Therefore, a new equivalent circuit is proposed (Fig. 11),where the barrier film is associated to a resistor Rbf(AT) and aconstant phase element Qbf(AT), whereas the thicker anodic layerscorresponding to the intact porous wall and to the porous wallunder the outer pores are represented by Qwall and Q1/2wall
respectively. In these last cases, no resistor is considered in parallelwith the CPE's as, due to the thickness of the films, the respectivevalue would be extremely high. Three resistors were also added,corresponding to the overall electrolyte resistance, Rs and to theadditional resistances of the solution inside the inner pores andouter pores (Rs-ip, Rs-op).
The impedance spectra for the anodised samples were fitted tothis equivalent circuit using ZView software (version 2.9) and thequality of the fitting was evaluated through their chi-square (x2)values.
The impedance of CPE is defined as ZCPE ¼ Y0ðjwÞn� ��1, where Y0
is the CPE admittance, v is the angular frequency, n the
2) immersed in NaCl (8 g/l) for 0 h, 8 days and 20 days of immersion.

Table 3Equivalent circuit parameters obtained from EIS data for the untreated Ti at different immersion times.
0h 1h 24h (1day) 48h (2days) 96h (4days) 192h (8days) 384h (16days) 480h (20days)
Rs (V cm2) 47.9 � 5.1 47.6 � 5.1 47.7 � 4.2 48.5 � 5.1 45.8 � 3.8 46.0 � 5.8 46.0 � 5.8 44.3 � 5.8Rbf(N) (MV cm2) 0.37 � 0.06 0.53 � 0.02 2.54 � 1.39 5.33 � 0.01 6.51 � 1.01 6.60 � 0.89 8.15 � 1.30 11.30 � 3.46Cbf(N) (mF cm�2) 48.6 � 4.1 47.7 � 3.7 44.1 � 2.0 39.0 � 0.9 35.6 � 3.5 35.0 � 1.6 33.6 � 0.4 28.2 � 5.7n 0.92 � 0.02 0.93 � 0.02 0.93 � 0.01 0.93 � 0.02 0.93 � 0.02 0.94 � 0.02 0.94 � 0.01 0.95 � 0.02x2 <1.35 �10�3 <1.15 �10�3 <1.58 � 10�3 <1.87 � 10�3 <1.53 � 10�3 <1.16 � 10�3 <0.87 � 10�3 <1.13 �10�3
Fig. 10. EIS spectra in the form: a) and c) Nyquist diagrams and b) and d) Bode diagrams recorded on the 015CA and 035CA samples immersed in NaCl (8 g/l) for differentimmersion times.
A.C. Alves et al. / Electrochimica Acta 234 (2017) 16–27 23
exponential factor (�1 � n � 1) and j ¼ffiffiffiffiffiffiffi�1
pis the imaginary
number. When n = 1, n = 0 and n = –1, the CPE responses correspondto those of a capacitor, a resistor or an inductor, respectively. Whenn � 1, a non-ideal capacitor may be described by this element, the nvalue being influenced by the roughness of the surface and itsheterogeneity. As can be observed in Fig. 2, all groups of samplespresented rough surfaces, resulting in a range of n values between0.90 and 0.93.
Fig. 12 shows the Bode diagrams of experimental data and therespective fitted curves, comparing the proposed model (Fig. 11b)and one of the models that has been used in the literature fortitanium anodic films produced by MAO [33,49,50] (Fig.11a). Thesediagrams show differences in the quality of the simulation by usingthe two different models. The proposed model describes
adequately the behaviour of the anodic film in contact with NaCl,with chi-square values often below 1x10�3, whereas the duplexmodel does not satisfactorily fit the behaviour of the anodic oxidefilms, with chi-square values around 1x10�2.
The conversion of Q values into C (capacitance) is veryimportant when experimental capacitance data are used toestimate the parameters as the thickness of anodized layers[62]. Thus, the capacitance values were calculated in the case ofCwall (3) and C1/2wall (4) using Eqs. (3) and (4) respectively that wereextrapolated from Brug's equation [58]. On the other hand, theEq. (5) was used to calculate Cbf(AT), when a resistor exists inparallel with the CPE [58].
Cwall ¼ QwallRsð1�nÞ
h i1n ð3Þ
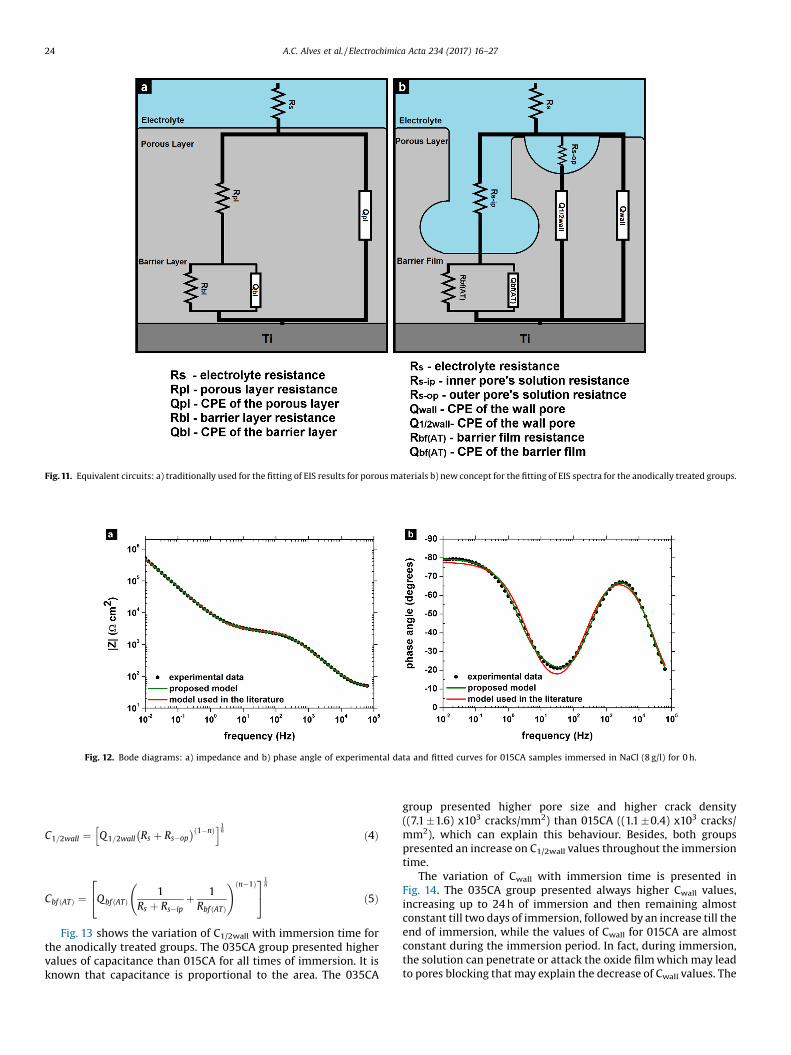
Fig. 11. Equivalent circuits: a) traditionally used for the fitting of EIS results for porous materials b) new concept for the fitting of EIS spectra for the anodically treated groups.
Fig. 12. Bode diagrams: a) impedance and b) phase angle of experimental data and fitted curves for 015CA samples immersed in NaCl (8 g/l) for 0 h.
24 A.C. Alves et al. / Electrochimica Acta 234 (2017) 16–27
C1=2wall ¼ Q1=2wall Rs þ Rs�op� �ð1�nÞh i1
n ð4Þ
Cbf ðATÞ ¼ Qbf ðATÞ1
Rs þ Rs�ipþ 1Rbf ðATÞ
!ðn�1Þ24
35
1n
ð5Þ
Fig. 13 shows the variation of C1/2wall with immersion time forthe anodically treated groups. The 035CA group presented highervalues of capacitance than 015CA for all times of immersion. It isknown that capacitance is proportional to the area. The 035CA
group presented higher pore size and higher crack density((7.1 �1.6) x103 cracks/mm2) than 015CA ((1.1 �0.4) x103 cracks/mm2), which can explain this behaviour. Besides, both groupspresented an increase on C1/2wall values throughout the immersiontime.
The variation of Cwall with immersion time is presented inFig. 14. The 035CA group presented always higher Cwall values,increasing up to 24 h of immersion and then remaining almostconstant till two days of immersion, followed by an increase till theend of immersion, while the values of Cwall for 015CA are almostconstant during the immersion period. In fact, during immersion,the solution can penetrate or attack the oxide film which may leadto pores blocking that may explain the decrease of Cwall values. The

Fig. 13. Variation of C1/2wall as function of immersion time.
Fig. 14. Variation of Cwall as function of immersion time.
Fig. 15. Variation of Cbf as function of immersion time.
A.C. Alves et al. / Electrochimica Acta 234 (2017) 16–27 25
electrolyte penetration through the pores on the 035CA group isfacilitated, as this group presented bigger pores and higher numberof cracks.
The barrier film behaviour is shown in Fig.15. The barrier film ofthe anodic treated samples (Cbf(AT)) was compared with the Tinative oxide film (Cbf(N)) formed on its surface. Taking in accountthe standard deviation for the anodic treated group, it was possibleto observe that the Cbf values did not change significantly duringthe immersion time. However a decrease with time was observedfor the untreated Ti that may be due to the contact with H2Oleading to the hydration of the oxide film. If the growth rate of theoxide film is large enough, it can remain in hydrated form [63].
The values of Cwall are considered representative of thecapacitance of the intact porous wall, and may be affected bothby variation of the exposed area of this layer and by variation of itsthickness. It was concluded from Fig.13 that the pore size increaseswith the immersion time, thus a slight decrease in the exposedarea of intact wall is expected. However, taking into account thatthis area is quite large when compared to the pore area, itsvariation should not be very important.
On the other hand, according to the Eq. (6) the capacitancevalues depend on the thickness:
C ¼ ee0Ad
ð6Þ
d ¼ ee0AC
ð7Þ
where, e is the dielectric constant of the oxide film, e0 is thevacuum permittivity, A is the area and d is the thickness.Considering e0 = 8.854 �10�14Fcm�1 and e = 100 (typical dielectricconstant for TiO2 [64,65]), it may possible to estimate the film(wall) thickness at the beginning of the immersion and at the lastimmersion time. Thus, a decrease in the thickness of the overallfilm, resulting from its dissolution, would lead to an increase of thecapacitance, as it occurs for 035CA group. In the case of the 015CAgroup, the effect of decreasing area may affect this behaviour, as itis observed from Figs. 13 and 14 that the enlargement of the poresize was much bigger in this type of specimens.
To get a better understanding of the electrochemical behaviourof the anodic oxide films under long-time immersion inphysiological solution, the characterization of the anodic filmscross-section should be done, as well potentiodynamic tests afterdifferent immersion times should be performed.
4. Conclusions
The effect of the calcium acetate concentration in theelectrolyte used to anodize CP Ti on the composition, structure,and corrosion behaviour of the anodic layers was investigated. Theoutcomes of this work are the following:
– a new equivalent electrochemical circuit is proposed to fit theEIS spectra of anodic films produced by MAO. The equivalentcircuit was established in accordance with the complexstructure of the films and overcomes the limitations of alreadyexisting circuits proposed for this kind of materials. Theproposed circuit has a clear physical meaning, allows for agood fitting of the experimental data and explains the changes inthe EIS spectra relating them with the different characteristics ofthe anodic oxides.
– the corrosion resistance was improved by the surface treatment,with both concentrations of calcium acetate, when comparedwith untreated titanium. Nevertheless, higher concentrations ofcalcium acetate results in a detrimental effect on the corrosionresistance of the material, essentially due to the contribution ofthe cracks present in the outermost porous layer of the anodicfilm. The obtained knowledge is useful for the development of

26 A.C. Alves et al. / Electrochimica Acta 234 (2017) 16–27
new strategies for the processing of MAO films in calcium-richelectrolytes with less amount of superficial cracks.
Acknowledgments
This work is supported by FCT with the reference project UID/EEA/04436/2013, by FEDER funds through the COMPETE 2020 –
Programa Operacional Competitividade e Internacionalização(POCI) with the reference project POCI-01-0145-FEDER-006941.Part of this work was done within the Scientific Community onSurface Modification of Materials funded by FWO-Flanders (grantnumber WO.039.14N), and within the scope of the EU-funded COSTMP1407 “E-MINDS. CQE is financed by FCT under contract UID/QUI/00100/2013.
References
[1] M. Niinomi, Recent Metallic Materials for Biomedical Applications, Metall.Mater. Trans. A. 33 A (2002) 477–486.
[2] M. Niinomi, Mechanical biocompatibilities of titanium alloys for biomedicalapplications, J. Mech. Behav. Biomed. Mater. I (2008) 30–42.
[3] H.J. Rack, J.I. Qazi, Titanium alloys for biomedical applications, Mater. Sci. Eng.C. 26 (2006) 1269–1277.
[4] S.S. Dheda, Y. Kyung, C. Melnyk, W. Liu, F.A. Mohamed, Corrosion and in vitrobiocompatibility properties of cryomilled-spark plasma sinteredcommercially pure titanium, J. Mater. Scinece Mater. Med. 24 (2013) 1239–1249.
[5] Y. Ni, Z. Liu, W. Gao, S. Qu, J. Weng, B. Feng, Characterization of self-assembleddecyl bis phosphonate–Collagen layers on titanium by QCM-D and osteoblast-compatibility, Appl. Surf. Sci. 257 (2011) 9287–9292.
[6] Y.J. Chen, B. Feng, Y.P. Zhu, J. Weng, J.X. Wang, X. Lu, Fabrication of poroustitanium implants with biomechanical compatibility, Mater. Lett. 63 (2009)2659–2661.
[7] G. He, L. Xie, G.-F. Yin, X.-M. Liao, Y.-W. Zou, Z.-B. Huang, et al., Synthesis andmechanism of (101)-preferred orientation rutile titania via anodic sparkoxidation, Surf. Coat. Technol. 228 (2013) 201–208.
[8] H. Song, M. Kim, G. Jung, M. Vang, Y. Park, The effects of spark anodizingtreatment of pure titanium metals and titanium alloys on corrosioncharacteristics, Surf. Coat. Technol. 201 (2007) 8738–8745.
[9] L. Le Guéhennec, A. Soueidan, P. Layrolle, Y. Amouriq, Surface treatments oftitanium dental implants for rapid osseointegration, Dent. Mater. 3 (2007)844–854.
[10] H. Ishizawa, M. Fujino, M. Ogino, Histomorphometric evaluation of the thinhydroxyapatite layer formed through anodization followed by hydrothermaltreatment, J. Biomed. Mater. Res. 35 (1997) 199–206.
[11] Y. Yang, J.L. Ong, J. Tian, In vivo evaluation of modified titanium implantsurfaces produced using a hybrid plasma spraying processing, Mater. Sci. Eng.C. 20 (2002) 117–124.
[12] S. Vercaigne, J.G. Wolke, I. Naert, J.A. Jansen, The effect of titanium plasma-sprayed implants on trabecular bone healing in the goat, Biomaterials. 19(1998) 1093–1099.
[13] T. Hanawa, In vivo metallic biomaterials and surface modification, Mater. Sci.Eng. A. 267 (1999) 260–266.
[14] T. Hanawa, H. Ukai, K. Murakami, K. Asaoka, Structure of Surface-ModifiedLayers of Calcium-Ion-Implanted Ti-6Al-4 V and Ti-56Ni, Mater. Trans. 36(1995) 438–444.
[15] M. Pham, M. Maitz, W. Matz, H. Reuther, E. Richter, G. Steiner, Promotedhydroxyapatite nucleation on titanium ion-implanted with sodium, Thin SolidFilms. 379 (2000) 50–56.
[16] A. Montenero, G. Gnappi, F. Ferrari, M. Cesari, E. Salvioli, L. Mattogno, et al., Sol-gel derived porous hydroxyapatite coatings, J. Mater. Sci. 35 (2000) 2791–2797.
[17] H.-W. Kim, Y.-H. Koh, L.-H. Li, S. Lee, H.-E. Kim, Hydroxyapatite coating ontitanium substrate with titania buffer layer processed by sol–gel method,Biomaterials. 25 (2004) 2533–2538.
[18] Y. Wang, J. Wang, J. Zhang, Z. Zhang, Effects of spark discharge on the anodiccoatings on magnesium alloy, Mater. Lett. 60 (2006) 474–478.
[19] H. Ishizawa, M. Ogino, Characterization of thin hydroxyapatite layers formedon anodic titanium oxide films containing Ca and P by hydrothermaltreatment, J. Biomed. Mater. Res. 29 (1995) 1071–1079.
[20] H. Ishizawa, M. Fujino, M. Ogino, Mechanical and histological investigation ofhydrothermally treated and untreated anodic titanium oxide films containingCa and P, J. Biomed. Mater. Res. 29 (1995) 1459–1468.
[21] H. Ishizawa, M. Ogino, Formation and characterization of anodic titaniumoxide films containing Ca and P, J. Biomed. Mater. Res. 29 (1995) 65–72.
[22] I.S. Park, T.S. Bae, K.W. Seol, Surface Characteristics of Anodized andHydrothermally Treated Titanium with an Increasing Concentration ofCalcium Ion, Met. Mater. Int 12 (2006) 399–406.
[23] E.M. Szesz, B.L. Pereira, N.K. Kuromoto, C.E.B. Marino, G.B. de Souza, P. Soares,Electrochemical and morphological analyses on the titanium surface modified
by shot blasting and anodic oxidation processes, Thin Solid Films. 528 (2013)163–166.
[24] M.E.P. Souza, M. Ballester, C.M.A. Freire, EIS characterisation of Ti anodic oxideporous films formed using modulated potential, Surf. Coat. Technol. 201(2007) 7775–7780.
[25] K. Kim, T. Kwon, S. Kim, I. Kang, S. Kim, Y. Yang, et al., Preparation andcharacterization of anodized titanium surfaces and their effect on osteoblastresponses, J. Oral Implantol. 32 (2006) 8–13.
[26] F. Deng, W. Zhang, P. Zhang, C. Liu, J. Ling, Improvement in the morphology ofmicro-arc oxidised titanium surfaces: A new process to increase osteoblastresponse, Mater. Sci. Eng. C. 30 (2010) 141–147.
[27] S. Yu, X. Yang, L. Yang, Y. Liu, Y. Yu, Novel Technique for Preparing Ca- and P-Containing Ceramic Coating on Ti-6Al-4 V by Micro-Arc Oxidation, J. Biomed.Mater. Res. Part B Appl. Biomater 83 (2007) 623–627.
[28] I.S. Park, T.G. Woo, W.Y. Jeon, H.H. Park, M.H. Lee, T.S. Bae, et al., Surfacecharacteristics of titanium anodized in the four different types of electrolyte,Electrochim. Acta. 53 (2007) 863–870.
[29] H. Ishizawa, M. Fujino, M. Ogino, Mechanical and histological investigation ofhydrothermally treated and untreated anodic titanium oxide films containingCa and P, J. Biomed. Mater. Res. 29 (1995) 1459–1468.
[30] H. Ishizawa, M. Ogino, Hydrothermal precipitation of hydroxyapatite onanodic titanium oxide films containing Ca and P, J. Mater. Sci. 34 (1999) 5893–5898.
[31] S.A. Fadl-allah, Q. Mohsen, Characterization of native and anodic oxide filmsformed on commercial pure titanium using electrochemical properties andmorphology techniques, Appl. Surf. Sci. 256 (2010) 5849–5855.
[32] L.-H. Li, Y.-M. Kong, H.-W. Kim, Y.-W. Kim, Improved biological performance ofTi implants due to surface modification by micro-arc oxidation, Biomaterials.25 (2004) 2867–2875.
[33] K. Venkateswarlu, N. Rameshbabu, D. Sreekanth, A.C. Bose, V. Muthupandi, S.Subramanian, Fabrication and characterization of micro-arc oxidized fluoridecontaining titania films on Cp Ti, Ceram. Int. 39 (2013) 801–8012.
[34] W.F. Cui, L. Jin, L. Zhou, Surface characteristics and electrochemical corrosionbehavior of a pre-anodized microarc oxidation coating on titanium alloy,Mater. Sci. Eng. C. 33 (2013) 3775–3779.
[35] O. Banakh, T. Journot, P.-A. Gay, J. Matthey, C. Csefalvay, O. Kalinichenko, et al.,Synthesis by anodic-spark deposition of Ca- and P-containing films on puretitanium and their biological response, Appl. Surf. Sci. 378 (2016) 207–215.
[36] P.-C. Chang, B.-Y. Liu, C.-M. Liu, H.-H. Chou, M.-H. Ho, H.-C. Liu, et al., Purifiedtitanium oxide with novel morphologies upon spark anodization of Ti alloys inmixed H2S04/H3PO4 electrolytes, J. Biomed. Mater. Res. A. 80 (2007) 283–296.
[37] S. Abbasi, F. Golestani-Fard, S.M.M. Mirhosseini, A. Ziaee, M. Mehrjoo, Effect ofelectrolyte concentration on microstructure and properties of micro arcoxidized hydroxyapatite/titania nanostructured composite, Mater. Sci. Eng. C.33 (2013) 2555–2561.
[38] I. Han, J.H. Choi, B.H. Zhao, H.K. Baik, I.-S. Lee, Changes in anodized titaniumsurface morphology by virtue of different unipolar DC pulse waveform, Surf.Coatings Technol. 201 (2007) 5533–5536.
[39] N.K. Kuromoto, R.A. Simão, G.A. Soares, Titanium oxide films produced oncommercially pure titanium by anodic oxidation with different voltages,Mater. Charact. 58 (2007) 114–121.
[40] D. Quintero, O. Galvis, J.A. Calderón, J.G. Castaño, F. Echeverría, Effect ofelectrochemical parameters on the formation of anodic films on commerciallypure titanium by plasma electrolytic oxidation, Surf. Coatings Technol. 258(2014) 1223–1231.
[41] D. Veys-Renaux, Z.A. El Haj, E. Rocca, Corrosion resistance in artificial saliva oftitanium anodized by plasma electrolytic oxidation in Na3PO4, Surf. CoatingsTechnol. 285 (2016) 214–219.
[42] M. Fazel, H.R. Salimijazi, M.A. Golozar, M.R. Garsivaz jazi, A comparison ofcorrosion, tribocorrosion and electrochemical impedance properties of pure Tiand Ti6Al4 V alloy treated by micro-arc oxidation process, Appl. Surf. Sci. 324(2015) 751–756.
[43] S.A. Alves, R. Bayón, V.S. de Viteri, M.P. Garcia, A. Igartua, M.H. Fernandes, et al.,Tribocorrosion Behavior of Calcium- and Phosphorous-Enriched TitaniumOxide Films and Study of Osteoblast Interactions for Dental Implants, J. Bio-Tribo-Corrosion 1 (2015) 23.
[44] S.A. Alves, R. Bayón, A. Igartua, V. Saénz de Viteri, L.A. Rocha, Tribocorrosionbehaviour of anodic titanium oxide films produced by plasma electrolyticoxidation for dental implants, Lubr. Sci. 26 (2014) 500–513.
[45] A.C. Alves, F. Oliveira, F. Wenger, P. Ponthiaux, J.-P. Celis, L.A. Rocha,Tribocorrosion behaviour of anodic treated titanium surfaces intended fordental implants, J. Phys. D Appl. Phys. 46 (2013) 404001–404009.
[46] H.P. Felgueiras, L. Castanheira, S. Changotade, F. Poirier, S. Oughlis, M.Henriques, et al., Biotribocorrosion (tribo-electrochemical) characterization ofanodized titanium biomaterial containing calcium and phosphorus before andafter osteoblastic cell culture, J. Biomed. Mater. Res. Part B Appl. Biomater. 103(2015) 661–669.
[47] A.R. Ribeiro, F. Oliveira, L.C. Boldrini, P.E. Leite, P. Falagan-Lotsch, A.B.R.Linhares, et al., Micro-arc oxidation as a tool to develop multifunctionalcalcium-rich surfaces for dental implant applications, Mater. Sci. Eng. C. 54(2015) 196–206.
[48] F.G. Oliveira, A.R. Ribeiro, G. Perez, B.S. Archanjo, C.P. Gouvea, J.R. Araújo, et al.,Understanding Growth Mechanisms and Tribocorrosion Behaviour of PorousTiO2 Anodic Films Containing Calcium, Phosphorous and Magnesium, Appl.Surf. Sci. 341 (2015) 1–12.

A.C. Alves et al. / Electrochimica Acta 234 (2017) 16–27 27
[49] M. Shokouhfar, C. Dehghanian, A. Montenero, A. Baradaran, Preparation ofceramic coating on Ti substrate by plasma electrolytic oxidation in differentelectrolytes and evaluation of its corrosion resistance: Part II, Appl. Surf. Sci.258 (2012) 2416–2423.
[50] K. Venkateswarlu, N. Rameshbabu, D. Sreekanth, A.C. Bose, V. Muthupandi,Role of electrolyte additives on in-vitro electrochemical behavior of micro arcoxidized titania films on Cp Ti, Appl. Surf. Sci. 258 (2012) 6853–6863.
[51] J. Pan, D. Thierry, C. Leygraf, Electrochemical impedance spectroscopy study ofthe passive oxide film on titanium for implant application, Electrochim. Acta.(1996) 1143–1153.
[52] D.C. Grahame, Mathematical Theory of the Faradaic Admittance(Pseudocapacity and Polarization Resistance), J. Electrochem. Soc 99 (1952)370–385.
[53] S.-D. Wu, H. Zhang, X.-D. Dong, C.-Y. Ning, A.S.L. Fok, Y. Wang, Physicochemicalproperties and in vitro cytocompatibility of modified titanium surfacesprepared via micro-arc oxidation with different calcium concentrations, Appl.Surf. Sci. 329 (2015) 347–355.
[54] Y.-T. Sul, C.B. Johansson, Y. Jeong, T. Albrektsson, The electrochemical oxidegrowth behaviour on titanium in acid and alkaline electrolytes, Med. Eng. Phys.23 (2001) 329–346.
[55] R.S. Williamson, J. Disegi, J.A. Griggs, M.D. Roach, Nanopore formation on thesurface oxide of commercially pure titanium grade 4 using a pulsedanodization method in sulfuric acid, J. Mater. Sci. Mater. Med. 24 (2013) 2327–2335.
[56] M.D. Roach, R.S. Williamson, I.P. Blakely, L.M. Didier, Tuning anatase and rutilephase ratios and nanoscale surface features by anodization processing ontotitanium substrate surfaces, Mater. Sci. Eng. C. 58 (2016) 213–223.
[57] K. Elagli, M. Traisnel, H.F. Hildebrand, Electrochemical behaviour of titaniumand dental alloys in artificial saliva, Electrochim. Acta. 38 (1993) 1769–1774.
[58] M.E. Orazem, B. Tribollet, Electrochemical Impedance Spectroscopy, JonhWiley & Sons, Inc. Publications, New Jersey, 2008.
[59] E. Matykina, R. Arrabal, M. Mohedano, A. Pardo, M.C. Merino, E. Rivero,Stability of plasma electrolytic oxidation coating on titanium in artificial saliva,J. Mater. Sci. Med. (2013) 37–51.
[60] M. Mohedano, E. Matykina, R. Arrabal, A. Pardo, M.C. Merino, Metal releasefrom ceramic coatings for dental implants, Dent. Mater. 30 (2013) e28–e40.
[61] E. Matykina, R. Arrabal, B. Mingo, M. Mohedano, A. Pardo, M.C. Merino, In vitrocorrosion performance of PEO coated Ti and Ti6Al4V used for dental andorthopaedic implants, Surf. Coat. Technol. 307 (2016) 1255–1264.
[62] C.H. Hsu, F. Mansfeld, Technical Note: Concerning the Conversion of theConstant Phase Element Parameter Yo into a Capacitance, Corrosion 57 (2001)747–748.
[63] T. Ohtsuka, N. Nomura, The dependence of the optical property of Ti anodicoxide film on its growth rate by ellipsometry, Corros. Sci. 39 (1997) 1253–1263.
[64] J. Lundstrom, L. Rinehart, R. Pate, T. Smith, M. Krogh, W. Huebner,Measurement of the dielectric strength of titanium dioxide ceramics PulsedPower, Conf. Dig. Tecnhical Pap. 12th IEEE Int (1999) 10–12.
[65] A. Wypych, I. Bobowska, M. Tracz, A. Opasinska, S. Kadlubowski, A. Krzywania-Kaliszewska, et al., Dielectric properties and characterisation of titaniumdioxide obtained by different chemistry methods, J. Nanomater. 2014 (2014)1–9.