Susan Jones - Introduction to Copyright - MIRIAD, RDP - Oct2016

Copyright
by
Jack Osban Jones
2012

The Report committee for Jack Osban Jones Certifies that this is the approved version of the following report:
A Guide for Planning Unique Engineering Design Challenges and an Example Unit
APPROVED BY SUPERVISING COMMITTEE:
Supervisor: ________________________________________
Richard Crawford
________________________________________ Matthew Campbell

A Guide for Planning Unique Engineering Design Challenges and an Example Unit
by
Jack Osban Jones, B.S. Phy
Report
Presented to the Faculty of the Graduate School of the University of Texas at Austin
in Partial Fulfillment of the Requirements
for the Degree of
Master of Arts
The University of Texas at Austin December 2012

Dedication
This is dedicated to my parents for they planted the seed and brought it most of
the way up. I would have probably passed on the opportunity to participate in this
program (three years!) if I had not had the raising I did. If we all stand on the shoulders
of giants, my first and still my tallest are my parents.

v
Acknowledgements
I would like to thank Dr. Crawford for helping me throughout this project. In the
early stages he helped to keep me focused and later my formal writing skills were greatly
improved as I reviewed his comments. I would also like to thank the UTeach program
and everyone there that has helped me along the way.

vi
A Guide for Planning Unique Engineering Design Challenges and an Example Unit
by
Jack Osban Jones, M.A.
The University of Texas at Austin, 2012
Supervisor: Richard Crawford
ABSTRACT
This report describes a generic capstone design project for a high school
engineering course. In this unit, the design process is cycled thrice with declining
amounts of structure and support. Students are expected to become increasingly
independent in the design process by the end of the unit. The generic unit can
accommodate many themes, but in order to give a through description, the report focuses
on the design of a hovercraft. The bulk of the report presents engineering content needed
to design RC hovercraft but readers will hopefully see the hovercraft as more of an
example instead of the example. My intention is to inform other teachers of a generic
way to conduct this type of engineering unit. Any brevity or lack of detail should be
viewed as an opportunity for personalization and creativity. The report includes a review
of relevant literature on the topics of student interest and motivation affecting
achievement, recommendations on curriculum guidelines by a national review committee
and some discussion on coaching students from novice to expert performance.

vii
Table of Contents List of Tables …………………………………………………………………….......... xiii List of Figures …………………………………………………………………….…….. ix List of Images ……………………………………………………………………...……. x Chapter 1 Introduction ..….…………………………………………………………....… 1 Chapter 2 Literature Review ………………………………………………………….…. 3 Chapter 3 Generic Engineering Design Unit …..………………………………………... 6 Chapter 4 Hovercraft Unit ……...……………………..…………………...……...…… 13 Chapter 5 Conclusions …………….…………………………...……………….........… 48 Bibliography ……………………………………………………………………...……. 52

viii
List of Tables
Table 1: Possible design project ideas ………………………………………….. 6
Table 2: Example hovercraft component cost sheet ……………………………. 42

ix
List of Figures
Figure 1: Balloon hovercraft ………………………………………………………..…. 14
Figure 2: Free-body diagram of hovercraft …………………………………………..... 15
Figure 3: Free-body diagram of hovercraft with pressures …………………...……….. 17
Figure 4: Two hovercraft illustration …………..………………………………...……. 19
Figure 5: Graphical representation of situations in Figure 4 …………………….……. 20
Figure 6: Box method of fan characterization …………………………………….…... 23
Figure 7: Standard manometer ……………………………………………………....... 28
Figure 8: Manometer at angle …………………………………………………..…….. 29
Figure 9: Comparison of manometer and trash bag methods of measuring air flow ..... 32
Figure 10: Fan curve …………………………………………….…………………….. 36
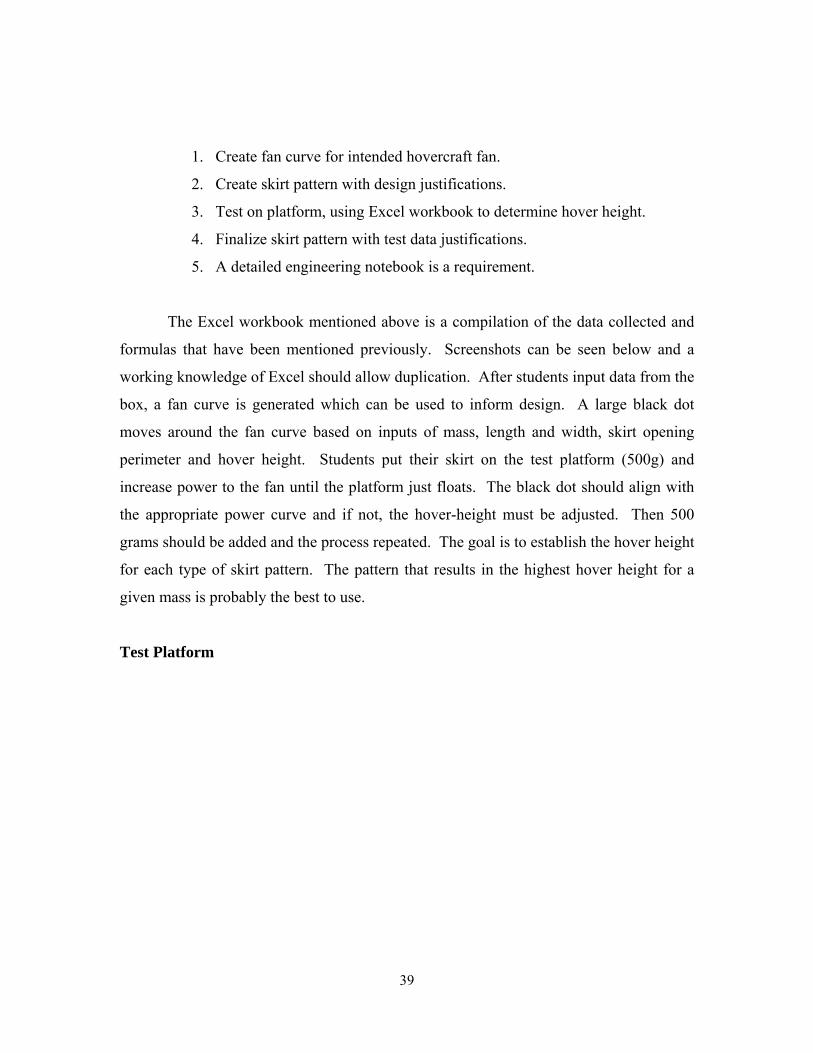
Figure 11: Test platform …………………………………………………………….... 39
Figure 12: Excel screenshot 1 ……………………………………………………….... 40
Figure 13: Excel screenshot 2 ………………………………………………………… 41
Figure 14: Low friction race …………………………………………………………... 42

x
List of Images
Image 1: Box measurement device I made ………………………………………….... 34
Image 2: Test platform I built with fan and battery attached ………………………..... 40
Image 3: Paint tray hovercraft ………………………………………………………… 46
Image 4: Hovercraft I built using the test platform …………………………………… 47

1
Chapter 1
Introduction
The original intent of this project was to create an engineering design project for a
high school level engineering class that could be completed with extremely low costs – a
“Maker” type project. I soon realized that what I was actually trying to do was to make
an accessible engineering design curriculum. I could imagine students at home solving
real mathematics problems and reading real stories for their literature classes but I had no
images for students doing real engineering at home (other than thinking and planning,
which is important). Who has a pressure gauge or anemometer at home? The goal
became to write a guide for creating an engineering unit for high school that could be
completed at home with readily available equipment. I chose to make hovercraft because
I had not made one before and hoped that the novelty would help me to see the details
that needed to be emphasized. In making this hovercraft unit, I wanted to include data
acquisition to incorporate as much engineering as possible. I had to make a measurement
device and a method for verifying its accuracy. Some readers may already be associating
the direction of this report with the growing Maker movement while those that are new to
the concept might need an explanation. A Maker-type project is a very general topic as
can be found from a simple internet search. The spectrum of projects dubbed “Maker”
ranges from individuals making/inventing the things they or others need or want in life
(as opposed to buying them) to any contrivance that uses products or parts of products in
ways that were not originally intended (otherwise known as hacking). Some of these
products will go on to become legitimate, mass-produced products, while the vast
majority will simply be used and cherished by their makers, to be shared with others on
websites like http://makerspace.com and http://www.instructables.com and, of course, in
occasional real life encounters. This hovercraft project embodies the Maker culture in
that we use a fan and motor assembly from a hairdryer (or other similar source), RC
components taken from neglected toys and main body structures from a wide variety of
sources. Students are introduced to the physical principles of hovercraft, are guided in
2
developing a measurement tool and associated mathematical model, and then use these
tools to test skirt designs. The model is then used to inform design choices on
mass/power/size for the actual hovercraft.
This report is organized as a description of a generic unit on engineering design.
The hovercraft is presented as an illustrative example. The generic unit can be modified
to accommodate other themes. The bulk of the report provides instruction on how to
conduct an engineering unit on designing RC hovercraft but readers will hopefully see
the hovercraft as more of an example instead of the example. My intention is to inform
other teachers of a generic way to conduct this type of engineering unit with hopes that
readers will see any brevity or lack of detail as an opportunity for personalization and
creativity. I also include a review of some relevant literature on the topics of student
interest and motivation affecting achievement, recommendations on curriculum
guidelines by a national review committee and some discussion on coaching students
from novice to expert performance.

3
Chapter 2
Literature Review
Studies show that students experience greater success when they have input on
classroom proceedings like determining performance standards, the nature of assignments
and the rewards for successful completion (von Mizener, Williams, 2009). I have
experienced this effect in the classroom to varying degrees. It is often difficult to allow
much student choice of content in core subjects due to the long lists of standards that are
expected to be covered. In cases where student input on content is not possible, allowing
them input on how assessment will occur or to define the rewards of success is almost
always possible. The most common way I do this in core subjects is to create the scoring
rubric with the students. This ensures they understand how they will be assessed and
builds in a trust that the project can be completed and that it will be graded fairly. Care
must be taken that the unit being designed is a task that the students can complete. Some
parts of projects will seem very difficult and, if students cannot see themselves finishing
a project, they will perform to a lower standard (Lamanto, Santoso & Liu, 2012). The
instructor must analyze each part of a project and imagine the students’ opinions on the
work. Confidence in abilities will grow as the students successfully complete more
challenging tasks but a series of failures could destroy that confidence. Scaffolding of
tasks throughout the project is required to prevent that failure.
Also, it is important to distinguish between what is expected by the student and
what is expected by the teacher, or the public. Baumeister, Hamilton and Tice (1985)
conducted a study on the effects of public expectation and private expectation on success.
Their findings showed that student success was positively correlated to private
expectation and negatively so for public expectation. The effect of the public expectation
was reversed when the expectation was supposedly based on research as opposed to
being someone’s opinion (Baumeister, Hamilton and Tice, 1985). To accomplish the
goal of doable projects, the main strategy that I use is to break the project into chunks that

4
are meaningful to the overall project and at a level of both difficulty and workload that
the students perceive they can handle.
A report on engineering in the K-12 classroom by National Academy of
Engineering and the National Research Council (NAS, 2009) determined the scope and
nature of current engineering education. The report describes the range of engineering
curricula as extremely varied but they contain certain common themes like mathematics,
science and science inquiry, technology and design. Some curricula use mathematics and
science to inform decision making while others are limited to using mathematics to help
explain the relevant science concepts. Science inquiry is most often seen in relation to
data collection. Technology incorporation ranges from being the main topic of study to
being an integral tool for the study. Some materials are designed to increase
technological literacy. Design was present in almost all engineering curricula reviewed.
The general characteristics of design projects were “a purposeful, iterative process with
an explicit goal governed by specifications and constraints” (NAS, 2009). The authors
describe design as being the most common linking trait for engineering curricula and
state that it is addressed in three basic ways. The most common method is for the
instructor to pose a problem and for the students to design solutions. Some materials
approach design from a reverse engineering perspective with goals being to learn how
things work and to analyze design. Few curricula required students to define the problem
themselves.
Defining the problem is the step of design where expert performance is most
different than novice performance (Atman, et al., 2007). Experts spend significantly
more time on defining the problem that novices do. This could be because the current
curricula do not highlight the problem defining process; the problem is just given to the
students.
The unit described is intended to address the issues mentioned above. Student
interest and expectations are addressed by topic choice and scaffolding of the entire
project. The engineering design process is the main focus of the entire unit and defining

5
the problem is ongoing throughout the unit because new problems emerge in each design
challenge but they all must be addressed for success.

6
Chapter 3
Generic Engineering Design Unit
The goal of this chapter is to frame the unit and, hopefully, to inspire ideas. The
hovercraft described later will generally follow this outline with a bit more description.
This chapter is meant to guide the instructor’s planning unique units. The goal is to
model the design process, provide structured experience in using the process and then to
allow more freedom for the final cycle. The model, or first, design challenge can be
based on a measurement device, if needed, or can be a simple subsystem of the overall
problem. It can even be presented as a lecture if time demands. The second design
challenge should be about the crucial part of the main challenge, like the hovering of a
hovercraft or the spring power of a spring powered car. The final design challenge stems
from the overall problem. A table containing a few ideas is presented below.
Table 1: Possible design project ideas
Topic 1st Design
Challenge
2nd Design
Challenge
3rd Design
Challenge
Hovercraft Fan measurement
device
Skirt design Performance of
hovercraft challenge
Spring powered cars Procedure to
characterize springs
Design spring
combinations to pull
a string that lifts a
mass the fastest
Spring powered car
race
Composting Composting
efficiency
measuring system
Small-scale
composting unit
Community plan for
enacting composting

7
Why This Topic?
Why choose any topic? Students will work on the assignments they want to work
on. Many students will work for grades or some other reward but all students will work
on things they are interested in working on. Groups of students are just as different in
interests as they are the same in so many other ways. It is impossible to please every
student in a class project and more advanced classes should allow pairs or individuals to
work on self-selected projects, but there are ways to pick exciting projects for any class
of students.
As an engineering class, mathematics and science concepts are going to emerge
and the task of the instructor is to find ways to accurately describe the relevant systems at
or slightly above grade-level for students while incorporating the engineering material.
For example, suppose a class makes spring powered cars (e.g., mousetrap cars) and uses
the energy equation for a spring as the basis of its calculations, ∆ . If
the spring is not accurately modeled by the calculations, the students can simply use data
collected on the spring to model a function in Excel and use that as the basis. Most
students in high school have seen some algebra and will understand, at the least, that
entering measured data into an equation can describe the data as a function. Having to
verify performance and retool explanations and models is not a sign of a blunder; it is a
sign of learning. The instructor’s knowledge will provide a starting place but everyone
will have to make adjustments. The hovercraft unit described later has a variable called
hover height that basically absorbs any variance of the system. It is a real variable that
has important meaning to the idea of hovering; the problem is that we do not know how
much hover height is needed, just that more is probably better than less. Theoretically,
any hover height is hovering.
This plurality of possible topics should not be seen as anything-goes but rather as
anything-is-possible. Something should be produced and tested. It could be a procedure,
a program, an item or anything testable. Often, a good way to find a topic is to talk to the
students about the things they are doing in their science classes. This can lead into real-
8
world applications and the query into interest. Keep in mind that learning what they do
not like is useful, too. Consider the following example:
Instructor: Class, What are you learning about in physics today?
Class: Motion and acceleration!
Instructor: Do you all know that we are building a F1 racetrack here in
Austin?
Class: (Doing flips and making zoom noises) Yes!!
This class should probably enjoy racing. But what if it went differently?
Instructor: Class, What are you learning about in physics today?
Class: Motion and acceleration!
Instructor: Do you all know that we are building a F1 racetrack here in
Austin?
Class: BOO!! We hate the race track and racing and all that it stands for!
Instructor: Yeah, uh, me too. I wonder what all those people are going to
do to the traffic in town.
Class: (Loudly complaining of traffic and visitors) Is there a way to make
the problem not so bad?...
This class should enjoy something other than a race. Sticking with generics, like
races and similar contests, is easier to plan (and gather materials) for and often very
rewarding but we have colleagues that teach a wide variety of engineering lessons so the
possibilities should remain open. Also, keep in mind that there is a wide variety of
engineers doing an even wider array of jobs. As long as a project is doable at the
students’ skill level and is complex enough to be tested and refined, it will qualify as a
worthy topic.

9
Modeling the Engineering Design Process
The engineering notebook is essential to the whole process of teaching
engineering. The mindset of an engineer can be developed and, if nothing else, a well
kept notebook will help students to remember what they did for each project. Having a
final exam grade based on summaries of work, with proof, can help place importance on
the notebook.
Identifying the problem follows naturally from the class discussions about the
general topic, if undertaken. Instructors should vaguely state the issue and then guide
students in fully defining the problem. Problems should be possible for students to solve
in a timely manner. Sometimes you will miss on this and over- or underestimate your
students. Be flexible in adjusting the rigor or scope of the task and feel free to use either
your desire to challenge students more or the need to fit into a time schedule imposed
beyond your control as reasons for changes.
Identifying the problem also requires that there be multiple solutions. Do not
choose a problem like finding the best way to minimize surface area for a maximum
volume. The easiest way to accomplish this is to increase the degrees of freedom, or
variables, so that real decisions and trade-offs have to be made. Constraints can be used
to increase the complexity of the problem by making an otherwise obvious solution
prohibited. Keep in mind that simple problems can have complex solutions. There is a
fair amount of engineering in the legendary pinewood derby car races. A weighted block
of wood rolling down a ramp on plastic wheels is pretty simple. Now shape the wood
and position the weight and smooth and lube the wheels and… are you recording all this
in your notebook?
The third consideration in identifying the problem is the student interest as
discussed earlier. Instructors should do their absolute best to ensure that students feel
they had a say in picking the problem. The importance of this increases with the length
of time spent on the project.
Performance criteria and constraints are parts of the problem defining process. If
a problem requires too many constraints, it may not be a good problem. If not enough

10
constraints can be found, instructors should predict “wild” solutions that their students
might try and use this as a guide in setting constraints. Performance criteria need to be
tested first. If the instructor cannot meet (or come close to) the criteria, how will the
students? It is good to get these all defined up front, very clearly to avoid argument and
disputed results later. Occasionally students will find their way around rules and are not
technically cheating. You should probably give those students high marks then adjust for
next time.
There are many concept generation techniques for solving engineering problems.
I suggest picking several ways that are acceptable based on time and students’ abilities
and try them with the students to find what they like best. Offer them all as possibilities
and even make posters to remind students how to do the more complicated methods.
Usually students will be working in groups and if ideas are left out students might feel
that they are, too. The instructor should observe that each student is actually
contributing. Efforts should be made to group suggestions into categories, thus allowing
multiple students to be able to feel ownership of the same ideas. This initial buy-in, if
they did not do so already with the problem, is crucial because if they do not see the
solution as partly theirs they are less likely to work at it.
Exploring possibilities and selecting an approach is a lot like advertising except
that it is intended to be as honest as possible. Students should believe that their idea is
great and try to convince the others but also have an open ear to other ideas. Often a vote
will have to settle competing ideas so odd numbers of members is best. Time is a factor
always but it is good to devote the necessary allotment here because this justifies the
work thus far. Many good ideas are not used because they just do not solve this problem
the best. Students should feel that they can present their idea thoroughly and that it was
seriously considered by their peers.
Performance test results will vary with the project topics but in setting up such
tests the question to be asked is: Did we solve the problem? Tests should be designed to
show data that can characterize the system under scrutiny. If a project has multiple parts
or systems, like a spring-powered and line-following car, each system could have a

11
standard test to verify performance. Making test equipment is a great way to model the
engineering process, is a real-world application of practice and is a meaningful way to
extend a project if ever needed. Calibrating test equipment is not always crucial but it is
a necessary part of the process in the real world and can instill in students a confidence in
the validity of their work. Not only did they make something they can explain, they can
also justify the explanation. There can be lots of rigor in performance testing or not,
depending on the desired outcome. Use of Excel or a similar computer aid to organize
and analyze data can greatly increase the level of rigor.
Refining the design needs to be structured time and revisions must have
accompanying justifications. I suggest having each group start the day with a quick
group meeting to establish goals for the revisions and to justify any actions taking place
during this time by using those goals. Instructors should attempt to focus groups that are
failing or behind on the key issues. This will allow them success while challenging the
ideas of those groups who are ahead. The final challenge should not be available for
practice runs, at least not in its full glory. A model of the challenge can be used but if the
actual challenge is available, groups will be tempted to use a trial and error approach to
find solutions.
Second Design Challenge and Final Design Challenge
Every unit does not have to have three full design challenges. The hovercraft
challenge is organized this way because hovercraft required a test device for fans and a
skirt design before the hovercraft could be made. The goal is for each unit to contain
guided modeling of the design process followed by structured participation in the design
process leading to full immersion in the process. The second challenge should be a major
component of the overall desired final challenge outcome. In a spring powered car, for
example, the unit could be structured as a race with the final challenge being a tractor-
pull while the first challenge is to design a procedure for characterizing different springs.
In a more advanced class the final challenge might be a race and the second challenge

12
might be supplying the most torque with the drive wheels and the first challenge would
be making the torque measuring device.

13
Chapter 4
Hovercraft Unit
It is important for instructors to emphasize that the goal of the unit is to become
experienced in the design process and to also learn any new mathematics and science
concepts needed for this particular project. Instructors should keep in mind that students
naturally like to implement the trial and error approach to solving problems and, though it
may eventually work, it can be wasteful and should be avoided.
The three design challenges which follow address these problems:
1. Overall problem – What can we learn about hovercraft?
2. First design challenge – How can we characterize a fan?
3. Second design challenge – What skirt design is best?
4. Third design challenge – How do we design and build the most
controllable, stylish, cost-effective RC hovercraft.
Why Hovercraft?
To characterize the systems of a RC hovercraft requires discussion of forces,
pressures, fluid flow, electronics, waves, and possibly more depending on the group of
students. The mathematics involved can easily be kept at the high school level or can be
more rigorous if called for. Hovercraft are also novel for most students, a feat sometimes
hard to accomplish by the time they get to high school.
What is a Hovercraft (and what are its parts?)
A quick internet search will turn up dozens of sites explaining how to build many
different sizes of hovercraft. Some are large enough to put students on and, with a
vacuum cleaner motor blowing out (using the output) or a leaf blower, they can float
around the room. A small one can be made from a CD, a bottle top, and a balloon (see
Figure 1). The small one provides introduction to the concepts because it is simple and

14
allows students to come up with their own solutions (a bigger one requires a skirt). The
space beneath the hovercraft should be termed the plenum.
Figure 1: Balloon hovercraft
Each group of students should make a balloon hovercraft so they can interact with the
basic variables involved in hovering. The following guiding questions will help in their
investigations:
Why is the craft floating?
What happens if you add weight to the craft?
What happens if you squeeze the balloon?
Why will the craft not float any higher?
What is the air doing to keep the craft up?
Why does the craft move so easily?
What does it mean for air to ‘take up space’?
Hovercraft Lift Force
A simple static free-body diagram of a stationary floating hovercraft shows that
the forces in equilibrium are the weight of the hovercraft and the lift force (see Figure 2).
Students who have taken physics can be expected to generate this diagram and sum the

15
forces. Other students may need to be taught that weight is a force and is found by
multiplying mass and the acceleration of gravity as shown in the equations below.
Figure 2: Free-body diagram of hovercraft
0
(1)
We can easily measure the mass of the hovercraft and we know the acceleration of
gravity (–9.81 ) so all that remains is to describe the lift force. What does it come
from?
Pressures
In chemistry and in some physics classes, students learn about pressure. They
learn about the interplay between volume, temperature, amount of gas and pressure. In
some advanced chemistry classes they learn how pressure can influence reactions and
how the size and other factors of the molecules affect what is observed. Rarely is
Bernoulli’s equation or pressure as energy density mentioned, but because of the

16
backgrounds provided in other classes some students will understand this at various
levels. Units are the key. Everything needs to be converted to (or originally measured
in) a common set of units and students need to understand what they are. For example:
100 grams provides ~ 1 Newton of force, which is equal to 1000 mN.
Students should be very comfortable with the idea of pressure as soon as they see
the formula because it is just force divided by area:
(2)
Students may have more trouble with the unit conversions. A good demonstration
of pressure is to hold a piece of paper lengthwise and have a student firmly push a fist
against it without breaking the paper. Then have the student push just as hard with only
one finger. If their fingers are not strong enough they can just hold a pencil; either way
shows that less area supporting the same force causes greater pressure. There are also
many demonstrations for showing atmospheric pressure exists on all sides of an object.
These are strongly recommended depending on the level of the class.
Combining equation (2) with equation (1) provides an estimate of the pressure
needed to lift the hovercraft:
(3)
This is not exactly accurate because is leaves out any mention of atmospheric
pressure. Figure 3 is the full free-body diagram of the hovercraft, which is introduced at
this point to limit confusion on the part of students. The plenum pressure is easily
relatable to the lift force but the atmospheric pressure force is new. The atmospheric
pressure can be shown to be negligible graphically or with mathematics. Graphically,
just extend the atmospheric pressure forces all around the hovercraft then, by canceling

17
forces, the same result as the mathematics method can be achieved. I recommend
showing both in class.
Figure 3: Free-body diagram of hovercraft with pressures
(3)
0
The atmospheric term here must be negative, or opposite the plenum term and
additive with the weight term. The easiest way to do this is to think of Patmosphere as
negative. (If gravity caused upwards accelerations it would be given a positive notation.)

18
(4)
This is the hovering equation in terms of pressures. Assuming atmospheric
pressure applies all over the craft (even underneath) at a constant value, the difference in
the plenum pressure and the atmospheric pressure becomes the pertinent variable. The
plenum pressure and the atmospheric pressure are both absolute pressures while the
∆PPlenum is a gauge pressure. It is important for students to understand that equipment
most often measures gauge pressure because that is usually the required information.
∆
∆
∆
(5)
This is an excellent opportunity to discuss with students the differences between
equation (5) and equation (3). They appear exactly the same but one will lead to
confusion when measurement occurs because one takes into account all pressures and the
other does not.
Atmospheric pressure might be a new idea for some students but relating it to
water pressure in a dive works really well because most students have studied this
situation. Divers experience more pressure as they go deeper because more and more
water above is pushing down. The lift fan on the hovercraft raises the plenum pressure
partly because it is pushing down on the air in the plenum. The fan also pushes more air
into the plenum. Pressure basically arises from the force with which the air molecules are

19
hitting the surfaces. More pressure can result from more air molecules or more energetic
collisions of molecules or both. This means more pressure is simply more force applied
to a given area.
These discussions on pressure are very important to the design phase of the
project because the students have to form a working model of the system before they can
use it. To help in forming a model, it is often useful to imagine the extremes (see Figure
4 below). In a plenum with no air loss (a sealed bag) the fan will fill the bag regardless
of how long it takes but it still has to be able to supply a pressure equal to the hovercraft
mass-to-surface area ratio (see equation 5) to actually float the hovercraft. In a plenum
with maximum air loss (no skirt) the fan must supply lots of air molecules and the same
amount of pressure as in the previous situation.
Figure 4: Two hovercraft, one on a bag (full skirt) and one with no skirt, both needing the
same pressure
By plotting these two extremes on a graph of pressure and airflow, we can get an
idea of what sort of fan is needed for the project.

20
Figure 5: Graphical representation of situations in Figure 4 to frame the search for a fan.
The right side of the line (high pressure and high Q should not be possible with available
fans)
Is This Like a Real Fan?
A quick internet search of keywords ‘fan pressure flow rate’ shows an inverse
relationship between the two variables. Are the fans we found like real fans? This will
have to be tested. Sometimes engineers have to test things that have never been tested
before. To do so they often must acquire new tools and skills to make measurements.
They may even be required to design or invent new tools or processes. To make a
hovercraft we will need to select appropriate fans. To better understand the fans we have
to measure their relevant characteristics. The first design challenge of this project is to
make a device to measure the performance of fans.
First Design Challenge: Characterize a Fan
Characterizing a fan requires measuring pressure and air flow. There are, of
course, dozens of tools specifically made to measure these variables in a variety of ways

21
but to adhere to the Maker theme and to recreate the challenge often faced by engineers,
this project requires designing and using a measurement tool. This can be done as a class
and provides the model for engineering design decisions to be made on the next design
challenge, the skirt.
Engineering Notebook
Students need models of processes to learn and more complicated
processes require more complicated models. The engineering notebook is a key aspect of
an engineer’s process and should be held in high regard in the high school classroom. In
modeling the design process, instructors should compile a class notebook containing
relevant work from each group for each day. This class notebook will serve to guide
students when they later construct their own notebook containing everything they do for a
project. The engineering notebook should have daily entries that can answer the
following questions:
Who wrote this and when?
What are they doing?
How are they doing it?
WHY are they doing it?
Identify the Problem
How can we measure pressure and air flow rate generated by the fan? Students
should help in defining the problem and the goal should be a problem that is specific,
measurable, feasible, and useful to the overall project. Students often overlook this part
of the design process as obvious and not as important as the others. Time in school never
permits learning the hard way (the best way: making mistakes) but anecdotes of learning
the hard way save time and achieve close to the same results, often with humor. I like to
use the (false) story about NASA developing the ball point pen for millions of dollars

22
while the Soviets just used a pencil. Whatever your story, the point should be that the
problem defining process is iterative. Later in the process previously unseen needs can
emerge causing a change in the definition of the problem. This will not always happen in
a classroom but happens continually in real-world projects.
Identify Criteria and Constraints
Defining the problem describes the space to think in while the constraints form
the box around that thinking. This step is a versatile part of the project because there are
lots of constraints, some more important than others. This allows everyone to have
contributing input because most suggestions are lumped into groups. Students must see
this process as not inseparable from identifying the problem; constraints further refine a
problem. Details are important in defining the problem because they guide thinking
while problem specific performance criteria and constraints are important because they
focus thinking. When designing a measurement device to characterize a fan, calibration
is very important, so being calibrate-able is an important criterion for this first challenge.
Idea Generation
Try at least two methods of brainstorming with the students. My preferred
method is to have them do a quick list of ideas and then conduct a round-robin review as
a group, writing ideas on a large surface and connecting ideas when one leads to another.
The most important part of this step is quantity of ideas and this is another place to make
sure that every student is contributing. There is NO judgment of ideas in this step and
unusual ideas should be celebrated. Often a distinction can be made between ideas called
out to be funny and ideas that are truly unique. Many new products and companies
develop from ideas born while brainstorming solutions for another problem. Brainstorm
concepts are not to be thrown away but kept as repositories of ideas. Groups should
coalesce ideas on how to characterize the fans and produce one method. Collect these
and add in the box method (described below).

23
Explore Possibilities
Each team now explains their idea about how they solve the problem of
characterizing a fan. They also need to explain shortcomings of their solution. The goal
of exploring possibilities is to have the class choose the best idea, even if it is not their
own. After all students have presented, the teacher presents the box method.
Box Method
Figure 6: Box method of fan characterization
The box method uses a cardboard box that is 2-4 cubic feet in size with a square
hole cut in top for mounting the fan. It has an outlet of approximately 20 square
centimeters that can be adjusted. An optional manometer is built into the side with an

24
adjustable angle for greater precision. Tape is applied to all seams to make the box
airtight, except for the obvious openings.
The pressure in the box can be directly measured by manometer or indirectly by
the velocity of air escaping the box using Bernoulli’s equation. The air flow rate can be
measured using a pressure reading from the manometer or by directly measuring the time
required for a certain volume of air to escape a given outlet area. I will relate the two
variables using Bernoulli’s equation below and then describe the two methods.
Bernoulli’s Equation
When calculating pressures of fluids (like air) Bernoulli’s equation not only
describes the situation; it helps to frame students’ thinking about the problem by
categorizing variables.
∆ (6)
For a steady state system, the energy contained in the static pressure (first term)
summed with the energy contained in the motion (second term) and the energy contained
in the position (third term) remains constant. This is very similar to the conservation of
energy statements and formulas that students are already familiar with. Now is a good
time to show how the various units relate. I use the same units they will see in science
classes, SI units.
∙
Newtons per square meter is an understandable unit and the standard accepted
unit for pressure. Here I show how all three terms in Bernoulli’s equation have the same
units.

25
1
2 ∙
∙
∆ ∙ ∙
∙
The system that is being described is the air after the fan. This is because the fan
is an energy input so it must be added to calculations or be left out of the system. The
main assumptions are that the air is at low enough pressures that flow is incompressible,
non-turbulent and frictionless and that the system exhibits steady state flow.
With these assumptions, Bernoulli’s equation can be applied as follows:
∆
∆ (7)
The third term, the potential term, can be neglected because the height change of the air
in and out of the box is insignificant.
(8)

26
Inside the box the air is moving a lot but the net air movement can be seen as very small
for these small fans. This term will be closer to zero as the box gets bigger because net
velocity will approach zero. Also neglecting this term yields:
1
2
Rearranging
1
2
∆ (9)
The density of air is about 1.2 kg•m-3 so by this equation the difference in pressure
between the box and the atmosphere can be related to the outlet velocity as the air leaves
the box. Measuring either variable will yield the other. Students should notice that ∆PBox
is a gauge pressure as discussed with the ∆PPlenum term in equation (5).
Determining Pressure with the Box: Method 1
If pressure is desired, air escape velocity can be measured as described below.
(10)
The units are:
This equation relates air flow rate, Q, to the outlet area and the velocity of air
leaving the box. A cubic meter per second is not an appropriately sized unit for our small
fans. Liters per second is more appropriate.

27
1 100
1
10001000
It is a good idea to practice these unit conversions with the students as much as possible
so that they can be independent when on their own.
A trash bag can be used to capture the air leaving the box for a direct
measurement of the average air flow rate of the fan. Later this method will be compared
with another, indirect method of measuring air flow. The technique is important on this
method because the definition of a full bag will determine accuracy. The bag will fill up
with a negligible difference in internal and external pressures with the differences being
proportional to the mass of the bag. If allowed, internal pressure can build causing an
incorrect measurement. An easy way to insure that the bag is not over pressurized is to
allow it to fly off the outlet by loosely holding it. Again, technique is key.
The flow rate into the trash bag is given by:
(11)
Combining the equations (10) and (11) yields:
∙
(12)
And combining this with equation (9) yields
∆ ∙
(13)

28
This equation demonstrates that one way to use the box to measure the pressure
differential caused by a fan is to simply time how long it takes to fill a trash bag. Below
is a sample of what units should look like for this equation. The factor of ten is added to
give the units (with inputs shown) of pressure as milliNewtons per square centimeter.
∙ ∙
∙ 10
Determining Pressure with the Box: Method 2
A manometer is very easy to make and can be constructed of a variety of tubing
materials and fluids. A manometer measures the pressure differential between the two
open ends of a fluid filled tube (see Figure 7).
Figure 7: Standard manometer
When pressures are equal the height of liquid in each tube will be the same.
When the heights are different and both sides of the manometer are vertical, the pressure

29
difference in the box, ∆PBox, is measured with the manometer by the following standard
equation:
∆ (14)
Figure 8: Manometer at angle.

30
The variable x here is different than the d in the standard manometer example.
The two variables are related by . This shows that the tilted manometer will
have greater displacement of water for the same pressure differential. This occurs
because the tube supports the water’s weight, like an inclined plane (this accounts for the
sinθ in equation 15). Greater displacement of water allows for more precise
measurement and sensitivity. When the low pressure side is at an angle of 30 degrees the
water will move about twice as far as when the same side is vertical. The adjusted
equation is:
∆ ∙ (15)
The units for this are:
∙ ∙
And to get our units as milliNewtons per square centimeter:
∙ ∙ ∙1
10000
The fluid in the manometer will move about 20-30 millimeters at most (with a
hairdryer fan). If students want to use millimeters for the height of water displacement in
the equation, the factor 10,000 should be change to 10,000,000.
Using the Box to Measure Q
As mentioned previously, the trash bag of known volume can be secured over the
opening and the time to fill can be measured. This is a direct measurement of average air

31
flow rate (see equation 11 above) and is a well known and fairly accurate method for
determining air flow from heating, ventilation, and air conditioning (HVAC) outlets in
buildings. This application is slightly different in that there is no leakage of air because
the opening is small and the time interval is much longer, which makes time
measurement error less significant.
Using the Manometer (on the Box) to Determine Q
Since Bernoulli’s equation states the relation between pressure in the box and
escape velocity (equation 9), rearrangement of equations allows students to read the
manometer and determine the air flow rate.
Rearranging Equation (9) gives:
2∆
Combining with the flow rate, equation (10), gives:
∆
٠ (16)
Units for this equation are:
∙ √10
10
Select an Approach
32
By this point, students should be aware that the class will be using the box method
to collect data and that the design process is being modeled for them. If they are not yet
aware, they should probably be told. To make sure that this box is going to yield useful
results, a prototype should be built and tested. This will serve the purpose of vetting the
design and will allow students to become familiar with procedures of use.
Test Results
The box is somewhat self-calibrating because it has two methods of direct
measurement. Based on Williams (2003), a report on the accuracy of the trash bag
method on HVAC flow, I expected a reasonable correlation between the measurements
made by trash bag and the flow calculations made by manometer measurements. My first
data was strongly correlated but off by a significant factor (the trash bag method was
about 35% higher than the manometer method). Then I realized that Excel calculates
sine functions as radians and after I fixed that the difference between the two methods
was less than three percent! For a box made of cardboard and duct tape, making
measurements with a trash bag and tube of water, I was very impressed and a class of
students should be, too. I choose to represent this self-accuracy (see Figure 9) as a
comparison of air flow measurements but it would be just as relevant shown as a
comparison of pressures. The line on the graph (y=x) represents both methods yielding
near identical measurements.

33
Figure 9: Comparison of manometer and trash bag methods of measuring air flow.
If trash bags are marked and manufactured accurately (i.e., if a 45 gallon trash bag
holds 45 gallons of air) then either method of using the box to measure the static pressure
and air flow of a fan is accurate enough for this project.
Refine Design
Now the class should review the design and highlight the key components so that
each group, when making their own, can have an accurate tool. The box must be airtight
with one adjustable, fully-closing opening and have a place to securely attach a fan.
While all measurements must be as accurate as possible, here are a few tips:
34
Use a glass tube where the manometer reading is made with an
adjustable, millimeter-marked piece of white paper behind. This
allows the starting point to be adjusted and the glass tube full of water
acts as a magnifier.
Parallax can be overcome by continually adjusting eye level to water
height.
There are many apps that allow angles to be measured with a phone or
other device. This makes finding the manometer angle very easy. A
free on that I use is iHandy Level made by iHandySoft Inc.
When filling the trash bag, have the fan running at the desired speed
and quickly put the bag onto the outlet. I laid the bag out flat and
taped shut all but the last few inches of the opening. I then attached a
cardboard cylinder from a used masking tape roll with staples into the
opening. This helps in getting the bag onto the opening.
Often, the motor will load up and the current will change when the bag
is full. This happens more noticeably on the higher flow rates. By
holding the bag loosely, it should fly off before this happens. This
should help ensure consistency of measurement.
End of First Design Challenge
The first challenge ends with each group building their box measurement device
(see Image 1) and reviewing the class engineering notebook. Every day each group
should document what is happening in their group that is relevant to the box and the best
will be chosen at the end of the class to be added to the notebook (there can be multiple
bests). The group that has the most pages added to the notebook can receive some
recognition. It is very important to review with the students that they not only created a
measurement device and learned some mathematics and science, but they also
experienced the design process and are now expected to follow it with documentation.
Now the class can continue with the original issue of making a hovercraft.

35
Image 1: Box measurement device I made
Fan Curve (return to main problem)
The boxes are now used to generate fan curves for the intended hovercraft fans.
This stage has three main purposes:
1. Make sure that the fans will work for the hovercraft.
2. Calibrate the boxes with each other.
3. Gather data for the Excel workbook that will be used to inform the next two
design challenges (see sample data in Figure 10)
Calibrating the boxes is easy; each should provide very similar measurements and
if not, troubleshooting (finding leaks) should adjust readings. Once a fan curve is
generated in Excel (by graphing pressure versus air flow for varying power; see Figure
10), students should see that the fans can support less static pressure at higher flow
volumes, similar to the standard fan curves that were seen in the internet search. They

36
will also be able to determine the maximum hovercraft mass that can be supported and
how high it can float, as shown in the example calculations below. These variables are
affected by the size and shape of the hovercraft. All these variables provide many paths
for design. To keep things manageable the class should focus on one aspect in the second
challenge.
Figure 10: Fan curve
Example Calculation: A pressure of 10 mN•cm-2 is equivalent to a pressure supporting
approximately 1 g•cm-2 so a square hovercraft with sides of 40 cm maintaining that
pressure can have a maximum mass of 1600 grams.
10 40 40
9.811600

37
Example Calculation: A flow rate of 12 liters per second will float a 40 cm by 40 cm
square hovercraft with a mass of 500 grams at a height of 1 millimeter.
∆
(16)
∆
(9)
The area of escape for the air is the perimeter of the outlet multiplied by the hover-height.
(17)
Combining these three equations yields:
(18)
Solving this equation for the hover height, and using the design variables set in the
example calculation gives:
12
2 500 9.8
40 40
1.2 2 40 40
1

38
Now is a good time to let the students try to solve this on their own as this
equation appears fairly complicated. Challenge students to solve the equation above for
hover height, in millimeters, and to find the conversion factor needed so that each
variable can be measured in the units shown. A conversion factor of 10√10 is needed for
hover heights in units of millimeters.
After discussing fan curves and sample calculations, students should reach/be
guided to the conclusion that something must be done to make the hovercraft float while
only losing tiny amounts of air or more powerful fans have to be found. Reference back
to Figure 5 is useful as it illustrates the two extremes of the skirt design. Many students
will, by now if not earlier, have looked at hovercraft online and be itching to make a skirt.
Others will need some guidance and the following activity is perfect for shaping thinking:
Tape a trash bag completely shut except for 5 drinking straws that are taped into
the wall of the bag. (The only way air gets in or out of the bag is through any of the 5
straws.) Have 5 students (less will work fine) blow into the straws to fill up the bag and
then have the smallest one of them get on top of the inflated bag. The other 4 will try to
keep enough air in the bag to keep it up. The student on top may have to pinch her
unused straw shut but either way the students will be very impressed with how little
effort it takes to keep the student lifted. This is basically how a skirt works.
Second Design Challenge
Students are now tasked with designing a skirt for a standard hovercraft. They
will use what they learn in the final design challenge when they make their own RC
hovercraft but this challenge has all teams designing skirts for one model. The groups
will compete in a low friction race at the end of this second challenge in order to test
designs against one another and to level the field for the final challenge (share ideas).
The class should have an engineering notebook from the box design process that can be
used as a model for their skirt design process. Since the students are still learning,
structure must be provided, but much less is required than before. A general guide can be
provided:
39
1. Create fan curve for intended hovercraft fan.
2. Create skirt pattern with design justifications.
3. Test on platform, using Excel workbook to determine hover height.
4. Finalize skirt pattern with test data justifications.
5. A detailed engineering notebook is a requirement.
The Excel workbook mentioned above is a compilation of the data collected and
formulas that have been mentioned previously. Screenshots can be seen below and a
working knowledge of Excel should allow duplication. After students input data from the
box, a fan curve is generated which can be used to inform design. A large black dot
moves around the fan curve based on inputs of mass, length and width, skirt opening
perimeter and hover height. Students put their skirt on the test platform (500g) and
increase power to the fan until the platform just floats. The black dot should align with
the appropriate power curve and if not, the hover-height must be adjusted. Then 500
grams should be added and the process repeated. The goal is to establish the hover height
for each type of skirt pattern. The pattern that results in the highest hover height for a
given mass is probably the best to use.
Test Platform
40
Figure 11: Test platform
The test platform (see Figure 11, Image 2) is made with leftover rigid foam
insulation (a sheet 4’ x 8’ x ½” costs about ten dollars and will make about four test
platforms), three ½ inch 6-32 bolts with nuts and washers, and some sort of adhesive like
hot glue and tape. It has the same sort of fan attachment as the box so the fan and fan
mount can just be switched over. The bottom piece of the platform comes off so that
each skirt can be put onto the bottom piece and then reattached and tightened to the top
piece. The test skirt is cut from any desired material; trash bags work great.

41
Image 2: Test platform I built with fan and battery attached.
Figure 12: Excel screenshot 1

42
Figure 12 shows a screenshot of the design spreadsheet. To get to this image the
following steps were taken.
1) Fan curve was generated by collecting data and inputting into Excel.
2) Skirt was constructed and attached to test platform.
3) Fan and skirt were mounted to test platform and voltage was applied until the
platform hovered.
4) Hover height input on Excel sheet was adjusted until the black dot aligned with
the voltage being applied.
Figure 13: Excel screenshot 2
Figure 13 shows a second screenshot of the design spreadsheet. To get this image the
following steps were taken.
1) 500 grams were added to test platform and voltage increased until hovering was
achieved.
2) With the previous hover height the dot is slightly off the fan curve line. After
changing the hovercraft mass, the dot should now be close to the appropriate fan
curve according to test platform results. Some adjustment, in this case from

43
0.25mm to 0.2mm, (adjustment not shown above) may be needed to put the dot
on the line.
The actual value of the hover height has not been verified quantitatively but if the
lighter hovercraft is given more voltage than necessary it should attain a higher hover
height. The Excel sheet shows that this should be expected.
Students should be required to show design notebooks and justifications for each
test pattern that they try. Having one test platform for the class will allow this proof to
occur and will also help to illustrate that is it often wasteful and therefore unaccepted to
just try random ideas in the design process. Design is not a guess; it is a process.
Low Friction Race
Figure 14: Low friction race
The culmination of this second design challenge is a timed race, as illustrated in
Figure 14. Each group gets three tries at the fastest time across a table with their best
skirt design on the test platform. Time is taken using a video camera that films the end of
the table. The camera will see the mass start to fall (start) and the hovercraft hit the end

44
(end). Ties can be broken by adding mass to the test platform and conducting a rematch
or by reducing the hanging mass.
Final Design Challenge
All previous activities build to this last design challenge. If the entire project is
done at once, many groups will become frustrated and the degree of success will vary.
Taking the time to guide students through two associated design challenges will allow
them to have more freedom and confidence in their final challenge. The engineering
notebook is a daily expectation and should count as the first quarter of the overall criteria
for judging the RC hovercraft project. The other three parts are a materials mini-
challenge, a style competition, and performance through an obstacle course.
The RC Hovercraft
The third challenge is to build a hovercraft, specifically, a hovercraft that is
controllable rather than a hovercraft for racing. The criteria/constraints will be described
in more detail by the three parts of the challenge below.
Materials
The materials mini-challenge can have many different wordings but they are all
basically: who can do the most for the least? The Maker theme has been an almost silent
impetus thus far and this challenge calls on students to show how well they adhered to it.
Each school is different so the following model might not be reasonable in all situations
but it should be useful as a guide. My school is not far from an outlet center for a
second-hand-goods store. Almost anything can be found there for $1.39 per pound (at
the time of writing). The instructor can build a stockpile of useful items like old
hairdryers and RC toys. Students can use these items as long as they are returned or they
can supply themselves from other sources. Since we are not racing the hovercraft, motor
power is less important than having a controllable motor. A standard price for

45
component categories will be fair because most components will operate in the same
functional ranges (one group’s battery is as good as another group’s battery). An
example cost schedule is given in Table 2. By setting the cost of a motor equal to the
cost of a servo and extra battery, many groups will be forced to decide between steering
with two motors and using one motor with a servo. There are other parts involved but
unless they give a significant advantage, like the components listed, they should be left
off the list. The main body of the hovercraft has been left off the list intentionally to
avoid biasing creativity and because it is assessed in the style competition.
Table 2: Example hovercraft component cost sheet
Component Price ($) Quantity Subtotal
Lift Fan w/motor 10
Directional Motor 5
Servo 2
Battery 3 each
RC control system 10 per channel
Bought propeller 2
Self-made propeller 1
Miscellaneous TBD by class
TOTAL
Example: One group uses one lift fan, 2 motors, 6 batteries, one RC system with 2
channels, 2 purchased propellers and a pizza box as the main structure. Their project
costs 62 dollars. Another group uses one lift fan, 1 motor, 1 servo, 7 batteries, one RC
system with 2 channels, 2 purchased propellers and a paint tray as the main structure.
Their project costs 62 dollars. These groups tie with respect to cost in this challenge
unless one could find savings somewhere. Maybe the second group only really needs 6
batteries and if they reduce this, they win this part of the challenge.

46
Style
Hovercraft made out of Styrofoam sheets, just like the test platform, should not
score too high in the style category. In my opinion, a hovercraft made of a cool shoe box
or a paint tray should score more style points. Construction with loose wires and tape
should score less than neat construction. The best style poorly constructed could score
the same as an average style that was well constructed. After a discussion of style,
students should score each hovercraft from 1-10 on degree of style. The hovercraft with
the most points wins.
Performance
There are many ways to measure performance. The method presented here is
only a suggestion. In an open room, place 5-10 cardboard tubes randomly around the
room and time how long it takes the hovercraft to knock them all down. Place the tubes
close enough that the hovercraft does not have to race between them to be sure that
control is emphasized. Whichever method is used, the students should have a substantial
amount of input into the proceedings.
Unit Recap
This unit is intended to cover 9 weeks of an engineering class. The first 2 to 2.5
weeks are spent constructing the mathematical model and box for collecting data. The
engineering design process is modeled for the class and a model engineering notebook is
created for the entire class to use. The next 1 to 1.5 weeks is spent collecting data on fans
intended to be used for the hovercraft. This should push students to see that a skirt is
needed to limit air flow because the fans cannot provide high pressures and high airflow
rates. The students then spend the next 1.5 to 2 weeks designing and testing skirts on a
test platform using the design models and the notebook that were created earlier. The
sixth week is used to finalize skirt designs and to hold a low friction challenge where the
best floating hovercraft should win the race. The last 3 weeks are all used for the final
design challenge where students build RC hovercraft. The two previous experiences with

47
design will guide them as they compete to make the most stylish, most controllable and
least costly hovercraft they can.
Images 3 and 4 show two hovercraft I constructed in completing this project.
Image 3 shows a hovercraft made from a paint tray, two lift motors and two propulsion
motors. This hovercraft is very nimble. Each motor was actually from a different RC
device but could be controlled by one transmitter. The two lift motors made very little
difference when compared to one lift motor because one tends to overpower the other and
reverse the air flow through it.
Image 3: Paint tray hovercraft.
Image 4 shows a hovercraft built on the test platform. I made this hovercraft to
give an example of a drive system with one propulsion motor and a steering servo. This
hovercraft gave me trouble because the propulsion motor required so much current and
the square shape is harder to balance than the rectangle. The servo moving the rudder

48
does cause the craft to turn but the shape of the craft causes it to lose balance in the
process.
Image 4: Hovercraft I built using the test platform

49
Chapter 5
Conclusions
Critique of Project and Future Work
Overall, I am happy with the outcome of this project. The generic unit is
applicable to many themes and can serve as a starting point for planning of a new unit.
Too often, it is easy to focus on one aspect of a project and to forget to devote time and
detail to other parts. By dividing a project into three parts and making each one a design
challenge, instructors can tackle complex tasks while not losing focus of the engineering
goals, namely the engineering design process. I know I could have made a much better
hovercraft but I had to keep telling myself to focus on the process and to get it on paper
so that it could be repeated with students. Instructors should remember that the examples
they make will influence the class so efforts should be made to make a good example, not
the best performer.
In the completion of this project, I am most disappointed that I had to pay for
batteries. Countless hours were spent trying to modify used cell phone batteries and old,
rechargeable tool batteries. I strongly recommend against doing this as lithium ion
batteries can discharge rapidly without their protective circuits, possibly causing a fire or
explosion. If this warning is ignored, safety should be extreme and should include face
shields, long and heavy material sleeves and fire and ventilation control measures. Most
cell phone batteries are 3.7 V and limited at about 0.8 amps by circuitry by the contacts.
I had a wire just for an instant touch one contact and the case (second contact) with this
control circuit removed and the case became too hot to touch instantly, probably around
100 degrees Celsius in less than a second. An image of scalded hands flashed into my
head. This is when the project took on a different slightly different focus.
If this project were continued, I would compile a list of examples based on the
generic plan. A database could be created for others to contribute to and to gather ideas
from. As high school engineering programs increase in number, a source of ideas like
this would be very useful.

50
Applications to Practice
My experiences in the Uteach Summer Master’s Program (MASEE) have allowed
me to grow as a teacher leader on my campus. In this section I relate how these
experiences have affected this growth.
My background in physics has enabled me to write lessons that are based on
relevant topics set forth in state standards in a way that will be engaging for students and,
most importantly, in a way that will repeatedly work. In the past I created lessons that
involved topics like hydrogen powered bottle rockets in chemistry or water balloon
catapults for physics and the students. I had a great time and the students performed
acceptably on tests so everything was working. I noticed, however, that the learning was
secondary to the goal of winning. The students were not relating the necessary learning
to the tasks because they did not have to. Trial and error methodology ensured success in
almost every task I created and this was frustrating.
In the MASEE program I had to take on the role of student again and this was
very enlightening. I noticed that, while some participants followed the engineering
design process, others just made an adjustment and tested, then made another and tested
again… trial and error, just like my students. This let me see that while I was forcing
myself to justify decisions before testing, some others did not and that my students would
probably not force themselves either. Even though I was not teaching engineering classes
at that time, I realized that the design process can be modified and used in a science class.
True understanding is evidenced by justification of reasoning and if students are told how
to do everything they will just follow instructions without too much thought. If students
are given a design challenge on top of a science lab, maybe they would be forced to
interact with the science concepts more. I modified a few of my big projects, like the two
mentioned, to include justifications for procedures and iteration. As an example, in the
hydrogen rockets lab the students are supplied with a certain amount of fuel containing
compound that has to react to produce the fuel. The design challenge is to create a
method of fueling the rocket that is most efficient. The reaction must be controlled

51
somehow or the fuel will be produced at a rate greater than it can be captured. Some
students solve the problem by catching the two gasses (fuel) in a large container then
transfering it to the rocket with varying success. Other groups control the limiting
reactant in the fuel producing reaction to produce only what is needed for each rocket
shot. Either way shows a general understanding of the system, but the second method
demonstrates understanding of limiting reactants, a course objective. By incorporating a
design element into the lesson I can better assess student understanding of intended
objectives.
I originally viewed the engineering design process (EDP) as just solving a
problem, and sometimes still portray it that way due to a lack of specificity in language.
If problem-solving is a ballpark, the EDP is the franchise operating that park. Solving
problems is, literally, just finding solutions to stated problems. EDP encompasses
defining the problem, solving the problem and assessing the solution as it relates to the
original problem and to the world around it (or any new problems the solution created).
After the MASEE program I now have this expanded view of the EDP, so much so that I
still say it is just solving problems because my view of a problem being solved has
changed. Now a problem is not solved for me unless I can see how the solution impacts
the surroundings and relates back to the problem.
Engineering habits of mind, as I see them, lead to viewing devices as systems of
components working together, creatively forming solutions for problems, and
communicating and collaborating with peers all with a focus on the large scale impact of
a process or device. We often portray engineers in pop culture as being obsessed with
details and sometimes lacking the big picture, almost like a factory worker. This is how I
viewed engineers. In actuality, most engineering tasks require vast amounts of
communication between departments, with ingenious solutions that often go unnoticed.
Significant time and energy is spent assessing the impact of the products in the world.
My view of the engineering profession has changed in that I now better understand the
role of communication between engineers. It is not enough to understand one specific
part of a contraption; that part’s relation to the others is crucial. Everything done on this
52
planet affects everything else and engineers do not just make things and turn them loose
in the world. They first strive to understand the impact their designs will have on
everything else. If communication between groups is lacking, an informed decision
cannot best be made.
I feel comfortable portraying the job of an engineer to my students for a few
reasons. First, I know a handful of them first hand and am familiar with many aspects of
their careers. Second, the MASEE program spent significant time detailing what
engineers do, specifically on assessing the life cycle of a product. I had an understanding
of this before but had never realized that someone could do that as a job or career. This
epiphany allowed me to see that I have to get real engineers to visit my students to
discuss what they do and to keep me portraying the job accurately. This year I have
arranged for an engineering mentoring program to start at my school to address this. I am
competent at describing engineering careers but no one is better than an engineer at doing
so.

53
Bibliography Atman, C. J., Adams, R. S., Cardella, M. E., Turns, J., Mosberg, S., & Saleem, J. (2007). Engineering design processes: A comparison of students and expert practitioners. Journal of Engineering Education, 96 (4), 359-379. Baumeister, Roy F.; Hamilton, James C.; Tice, Dianne M. Public versus private expectancy of success: Confidence booster or performance pressure? Journal of Personality and Social Psychology, Vol 48(6), Jun 1985, 1447-1457. Lawanto, O., Santoso, H. B., & Liu, Y. (2012). Understanding of the Relationship Between Interest and Expectancy for Success in Engineering Design Activity in Grades 9-12. Educational Technology & Society, 15 (1), 152–161. Linda Katehi, Greg Pearson, and Michael Feder, Editors; Committee on K-12 Engineering Education; National Academy of Engineering and National Research Council (2009). Engineering in K-12 Education: Understanding the Status and Improving the Prospects von Mizener, Briana H, Williams, Robert L. (2009). The effects of student choices on academic performance. Journal of Positive Behavior Interventions, 11(2), 110-128. Walker, I.S. (2003). Garbage Bags and Laundry Baskets. Home Energy Magazine, Vol.
20 No.6, November/December 2003.