
Copy of arghanilghsoh final report presentation
76
1 A Project Report on “CONSUMER BUYING BEHAVIOUR AND THE FACTORS INVOLVED IN THE PROCESS” Submitted in partial fulfillment for the award of MASTERS OF BUSINESS ADMINISTRATION Prepared by : ARGHANIL GHOSH
Transcript of Copy of arghanilghsoh final report presentation

1
AProject Report
on
“CONSUMER BUYING BEHAVIOUR AND THE FACTORS INVOLVED IN THE PROCESS”
Submitted in partial fulfillment for the award of
MASTERS OF BUSINESS ADMINISTRATION
Prepared by : ARGHANIL GHOSH

2
DECLARATION
I DO HEREBY DECLARE THAT THIS REPORT IS SUBMITTED BY ME FOR PARTIAL FULLFILMENT OF THE MASTER OF BUSINESS ADMINISTRATION IN MARKETING, VIDYASAGAR UNIVERSITY.
THE REPORT IS EXCLUCIVELY PREPARED BY ME AND HAS NOT BEEN SUBMITTED TO ANY OTHER INSTITUTION OR PUBLISHED ANYWHERE BEFORE.
________________DATE SIGNATURE

3
ACKNOWLEDGEMENT
At the very outset, I would like to thank Mr. Amit Prasad Store Manager of Jackjones and Vero Moda, south city (bestseller India) for his constant guidance and support to undertake this project.
I am grateful to sir for enabling me to turn dream to reality.
I express my deep sense of gratitude to my internal guide, Dr. Surojit Ghosh Dastidar for his help and advice during preparation of this report.
Finally, I would like to thank all others who directly or indirectly helped me to accomplish my project work.
Date: Signature
4
PREFACE
I want to express my gratitude for the experience and practical knowledge that I
gained during the summer internship project at BESTSELER INDIA.It was my first experience
when I went to the market not to buy anything but to do the Study of Market Potential and
Customer Preferences at JACK JONES –VERO MODA, SOUTH CITY. The basic need of this survey
is to interact with customers..
For accomplishment of the project report I think about the conditions and views and
then I used to compose the whole thing on computer. In making the project report theoretical
knowledge was needed more than the practical which was given to us by my professors in my
institutes. In the market the experience relating to the practical knowledge was very good
which realized me about the real conditions of the marketing.
The project flows logically consisting of market research, data collection method and
questionnaire. It hoped that the findings and the suggestions will help the company,
confidently to formulate its strategy in comparison to its competitors. I have enjoyed my
summer internship at Spencer’s and have learnt lots of new things, which will be helpful to me
during my work in any organization. I thank Spencer’s for giving this opportunity at their office
and being good to me all the time.
I am please to work in this esteemed organization. I have tried my best to make this
report a reader friendly & also did my level best to fulfill the objective of the summer training.

5
.
TABEL OF CONTENTS
S.No. CONTENTS
1. Executive Summary
2. Introduction to Retailing
3. Objective of the Study
4. Research Methodology and Scope of the Study
5. Assumption of Study
6. Retail Sector and its scope in India
7. Company Profile
8. Introduction to Market Potential
9. Data Analysis and Interpretation
10. Findings of the Study

6
11. Challenges and Opportunities
12. Suggestions and Recommendation
13. Limitations of Study
14. Conclusion
Annexure
Bibliography
INTRODUCTION
About SIP
An internship is a method of on-the-job training for white-collar and professional careers. Internships for professional careers are similar in some ways to apprenticeships for trade and vocational jobs, but the lack of standardization and oversight leaves the term open to broad interpretation. Interns may be college or university students, high school students, or post-graduate adults. These positions may be paid or unpaid and are usually temporary.
Generally, an internship consists of an exchange of services for experience between the student and an organization. Students can also use an internship to determine if they have an interest in a particular career, create a network of contacts or gain school credit. Some interns find permanent, paid employment with the organizations for which they worked. This can be a significant benefit to the employer as experienced interns often need little or no training when they begin regular employment. Unlike a trainee program, employment at the completion of an internship is not guaranteed.

7
Retailing – Customer is King
“A Customer is the most important visitor on our premises. He is not dependent on us. We are
dependent on him. He is not an interruption on our work. He is the purpose of it. He is not an
outside of our business. He is a part of it and we are not doing him a favor by servicing him. He
is doing us a favor by giving us an opportunity to do so.”
Mahatma Gandhi
Some Published issue of Retail Industry
• The retail industry is expected to grow into a USD 427 billion industry by 2010- FICCI.
• India’s retail industry, which is in the middle of rapid growth, has already
scripted success stories fit to be the subject of a Bollywood film-Business Standard.

8
• The impact of organized retailers that have seen swarming of malls lately, on the “mom-n-
pop stores” in 20 Indian cities- Indian Council of Research in International Economic
Relations (ICRIER).
• Modern Retailing Comprehensive policy vital- The Hindu
• Retail boom triggers ancillary industry growth- The Times of India
The Indian Macro Economy
• Tops AT Kearney list of emerging markets for global Retailers to enter.
• 2nd Fastest growing economy in the World and 50% of the total GDP led by services such as IT, telecommunications, healthcare and retailing.
• GDP growth rate for the year 2007-08 ended at 9.4% (in 1st quarter) and current GDP (6 %) is better than China and other developed country.
• Reserves crossed the $150 billion mark, showcasing India as one of the top ten holders of Foreign exchange reserves.
• Population – 1000+ Million – 50 Million Rich and 300 Million Middle class
• 65% of population below 35 years and 54% below age 25 years
• Working population in India is growing like most other developed countries.
• China has issues of median age 30-34 years at the early stage of development and psychology issues after implementation of “one child policy”
• Housing Boom – due to nuclear family, low interest rates, tax benefits from government and lastly strong Indian values driven by savings and “owning home”

9
• Economy - 4h largest economy in the world on PPP basis (next only to USA, China and Japan) -One of the fastest growing economy with 6.5% average growth in GDP for last 10 years and is expected to rank 3rd by 2010, just behind the US and China
• Fragmented retailing with 5 million retailers and 95% less than 500 sq ft – nation of shop-keepers -brilliant trading and entrepreneur community
• Over 3.9 million tourists visited India this year, up from 3.0 million last year.
• India is on the track to be the servicing capital of the world (As China is manufacturing capital) and Organized retail growing at 25-30%+ p.a. compound growth.
• IPL has again drastically changed the outlook of the whole world towards India. It has the highest paid players across the Globe / Sports.
• Real Estate & Retailers in India are the most aggressive in Asia in expanding their businesses, thus creating a huge demand for real estate. Their preferred means of expansion is to increase the number of outlets in a city and also expand to other regions.
• Driven by changing lifestyles, strong income growth and favorable demographic patterns, Indian retail is expanding at a rapid pace.
• Besides the 6 metros, India has 61 other cities with populations greater than 0.5 million and contributes about 14% to the country’s GDP.

10
1. Executive Summary

11
Executive Summary
Retailing is emerging as a sunrise industry in India and is presently largest employer after
agriculture. Some economists say that Retailing is one of the pillars of the economy in India,
and some say it is gold mine of Indian economy. Retailing in its present form started in the
latter half of 20th century in USA and Europe. Retail industry is divided into organized and
unorganized sectors. Over 12 million outlets operate in the country and only 5% of them being
larger than 500 sq ft (46 m²) in size. Organized retailing in India is projected to grow at the rate
of 25-30% p.a., is estimated to grow from the US $ 330 billion in 2007 to US $ 427 billion by
2010 and US $ 637 billion by 2015. Indian Retail Sector is growing very fast with so many new
players are coming in this growing organized sector and trying to attract customers by giving
attractive offers and offering competitive prices etc.
Spencer’s Retail Ltd is India’s leading retailer that operates in multiple formats. The company
operates over 6 million square feet of retail space, has over 350 square feet of retail stores
across 60 cities in India and employs over 4500 people.
The motive of the study is to know the market potential with reference to Supermarkets & find
out the customer’s perception about Supermarkets & what are the customers’ expectations
from Spencer’s Retail. The main purpose of the study is to find out the target customers,
preferences of the customers and sales potential with reference .
Dr. A.S. Rao Nagar is a developing area of Hyderabad and it consists of all classes of families.
Most of the families belong to Socio Economy Class (SEC) A & B. Most of the residents fall in to
age group 18-45. Most of the families have 4 to 5 members in their families. Residents are well
educated and holding jobs. Their monthly incomes are ranging from 10,000-20,000 and above.
Approximately 86.5% people visit Supermarket for shopping and 50.75% people visit to

12
Spencer’s Daily Supermarket. From the above data it can be observed that there is a potential
for good market opportunities for retail Supermarket.
The reason for visiting super markets as mentioned by the respondents varied from better
services to pricing to variety of products available with the super markets. 44.75% respondents
visit super markets for the prices offered by the super markets and 46.75% mentioned that the
quality of product provided by the super markets is the reason for their visit to super markets.
The other factors which attract the respondents to various super markets are variety of
products offered, fresh products like fruits and vegetables, availability of dairy products, home
delivery, parking facilities, accepting debit/ credit cards, fast billing, booking counters,
customer service, courteous and friendly behavior and ambience.
Most of the customers complained regarding customer service, variety of product with deep
assortment, store image, arrangement of products, pricing, product knowledge of employee,
quality of products, parking space, product updation, closing time at Dr. A.S. Rao Nagar with
reference to Spencer’s Daily.
Company can enhance its business or increase its sales by doing these things; provide better
customer service than its competitors, increase the variety of merchandise with deep
assortment, arrangement of product should be in proper way that creates good store image,
provide club Spencer’s membership card to the customers. Company should also include
apparels segment in the store, should advertise through pamphlets about various offers,
provide parking space and employ knowledgeable sales staff.
This study helped me a lot for analyzing the market, understanding retail business and how to
respond in critical situations. Findings and suggestions/recommendation of this report might
be helpful for the company to improve its performance and business.

13
2. Introduction to retailing

14
Introduction
The word retail has its origin in French word retaillier and means “to cut a piece off’’ or “to
break bulk”. The term Retailing is defined as “All activities involved in selling goods and
services directly to final consumers for their personal and non-business use”. In simple terms,
it implies a first-hand transaction with customer. Retailing involves a direct interface with the
customer and the coordination of business activities from end to end right, from the concept
or design stage of a product or offering, to its delivery and post delivery service to the
customer. The industry has contributed to the fastest changing and dynamic industries in the
world today.
Retailing, it is an emerging trend in the India and Kolkata is not far behind which is also
witnessing the stupendous growth and opportunities presented by this sector. Many
institutions- Manufacturing, Wholesalers and retailers – do retailing, but most retailing is done
by Retailers. A business wholesales come from primarily from retailing. It is a proven fact that
in India the retail industry has become the 2nd largest employer after agriculture. Indian retail
sector is in boom period and many reasons are contributing to it.
The retail scenario in India is unique. Much of it is in the unorganized sector, with over 12
million retail outlets of various sizes and formats. Almost 95% of these retail outlets are less
than 500 sq. ft. In size, the per capita retail space in India being 2 sq. ft. compared to the US
figure of 16 sq. ft. Thus India’s per capita retailing space is the lowest in the world.
With more than 9 outlets per 1000 people, India has the largest number of outlets in the
world. Most of them are independent and contribute as much as 95% to the total retail sales.
Because of the increasing number of nuclear family, working women, greater work pressure
and increased commuting time, convenience has become a priority for the Indian consumers.

15
The growth and development of organized retailing in India is driven by two main factors –
lower price and benefits the consumers can’t resist. According to experts, economies of scale
drive down the cost of supply chain, allowing retailers to offers more benefits offered to the
customers. Globally, retailing is customer-centric with an emphasis on innovation in products,
process and services. In short, the customer is the king.

16
3. Objective of the Study

17
Objectives of the study
• To study about the perception of customers with reference to availability of products
and services in an MBO.
• To study about customer preferences and frequency of shopping.
• To know the target customer’s of Bestseller India Retail at South City in Kolkata.
• To understand the customer’s expectation from retail service provider.

18
4. Research Methodology and Scope of the Study

19
Research Methodology
The study is relied on primary as well as secondary data.
The primary data is collected through personal interviews using structured Questionnaire.
The Secondary is collected from management of the Jack Jones-Vero Moda,South City
Sampling Methods:
Probability sampling method or simple random sampling
Universe: -
The people coming into the store as well as some passer by
Sample Size: -
Sample size was 400.
Research Instrument: -
For this study, for the collection of various data requirement, structured questionnaire is used.
This questionnaire contains qualitative and quantitative information of the customers. The
questionnaire contains of both open-ended and close ended questions, which would help to
know the situation prevailing in the market.
Statistical Tools Used
For the purpose of data analysis, Percentage Method is used for calculation and result was
interpreted.
No. of Respondents

20
Percentage = ---------------------------×100
Total Respondents
Scope of the Study
With the help of primary data given by the respondent during survey and secondary data,
study is done to help Bestsellers India to understand the market potential at JJ&VM in SOUTH
CITY and also to understand the customer preferences and, potential customers and current
market position of Bestsellers India.

21
5. Assumptions of the Study
The assumptions of the study are----
Questionnaires which were filled by both husband and wife and other members of
family have been done in due consultation in and amongst themselves.
Those questionnaires which are more than 80% filled, I have taken them in to
consideration as a full filled questionnaire.

22
6. Retail Sector and its scope in India

23
Retail Sector and its scope in India
Structure of Indian Retail Sector
The retail industry continued in India in the form of Kirana stores till 1980. Soon, following the
modernization of the retail sector in India, many companies started pouring in the retail
industry in India like Bombay Dyeing, Grasim etc. From that time the retail sector in India can be
widely split into the organized and the unorganized sector.
Organized Retail Sector
After 50 years of unorganized retailing and fragmented Kirana stores, the Indian retail industry
has finally begun to move towards modernization, Systematization and consolidation. Today,
modernization is the catch phrase and the key to understanding retail in the next decade.
There has been a boom in retail trade in India owing to a gradual increase in the disposable
incomes of the middle class households, as a result of good performance of IT, Service and

24
Infrastructure sectors. More and more players are entering the retail business in India to introduce
new formats like malls, supermarkets, discount stores, department stores and even changing the
traditional looks of bookstores, chemist shops, and furnishing stores.
Organized retail formats prevalent globally
Malls
Supermarkets
Hypermarkets
Discount Stores
Department Stores
Specialty Stores
Internet Retailing
Convenience Stores
MBO
Unorganized Retail Sector
The unorganized retail sector basically includes the local Kirana stores, hand cart, the
vendors on the pavement (sidewalk) etc. This sector constitutes about 95% of the total retail
trade. As 70% of the employment is generated in Agriculture sector, hence this form of retailing is
widely seen in those areas and of course to some parts of the urban. There is a lot of hue and cry
in the sector for opening of sector for direct investment from the foreign players, but government
cannot neglect the interests of small players. One of main reason of not opening this sector to FDI
is it may shrink the employment in the unorganized sector and expand that in the organized.
The Evolution of retail in India
Traditional Established Emerging

25
Itinerant Salesman Kirana shops Exclusive retail outletsHaats Convenience/Department stores HypermarketMelas PDS Malls/MultiplexesKiosks Pan/Beedi shops Specialty Malls Post Office Fast food outlets etc.
India's Largest retail Chains:
1. PDS (Public Distribution System): 463,000
2. Post offices: 160,000
3. KVIC (Khadi & Village industries): 7,000
4. CSD (Canteen Stores Department) Stores:3,400
(Source business world marketing White book 2005)
Current Scenario of Indian Retail Sector
The Indian retail market, which is the fifth largest retail destination globally, has been ranked
the 2nd most attractive emerging market for investment after Vietnam in the retail sector by AT
Kearney’s seventh annual Global Retail Development Index (GDRI), in 2008. The share of retail
trade in the country’s gross domestic product (GDP) was between 8-10% in 2007. It is currently
12%, and is likely to reach 22% by 2010.
A McKinsey report 'The rise of Indian Consumer Market', estimates that the Indian consumer
market is likely to grow four times by 2025. Commercial real estate services company, CB Richard
Ellis' findings state that India's retail market is currently valued at US$ 511 billion
Indian retail on the fast-track

26
• The Indian retail market is the fifth-largest retail destination globally. It is estimated to
grow from the US$ 330 billion in 2007 to US$ 427 billion by 2010 and further US$ 637
billion by 2015. Indian retail showed a growth rate of 49.73% with a turnover of US$
25.44 billion in 2007-08 as against US$ 16.99 billion in 2006-2007.
• Retail contributes to 10 per cent of India’s Gross Domestic Product and provides
employment to 8 per cent of India’s working population.
• Higher disposable incomes, easy availability of credit and high exposure to media and
brands has considerably increased the average propensity to consume over the years.
GRDI
India ranked first for the third consecutive year on the Global Retail Development Index –
2007, conducted by AT Kearney across 30 emerging economies. India is ranked as the most
preferred retail destination for international investors.
GCCI
India ranked first for the fifth time on the Global Consumer Confidence Index – June 2007,
conducted by The Nielsen Company. Indians were judged as the world’s most optimistic
consumers, with high financial confidence about their income for the next 12 months.
The contribution of retail sector to GDP has been manifested below:
Country Retail Sector's share in GDP (in %)
India 10
USA 20
China 8
Brazil 6
The analysts foresee bright future of the retail sector. A huge number of shopping malls, nearly
100, have come up in the recent past, generating 20mn sq ft. retail space, extending more
space of about 12mn sq ft to it. Nearly 60 malls are on the verge of completion and may be

27
operational by the end of current financial year. A forecasted number of nearly 200 malls, in a
move to make additional 50mn sq ft of retail space, will be completed within the next two-
years.
India retail industry is expanding itself most aggressively; as a result a great demand for real
estate is being created. Indian retailers preferred means of expansion is to expand to other
regions and to increase the number of their outlets in a city. It is expected that by 2010, India
may have 600 new shopping centers. In the Indian retailing industry, food is the most
dominating sector and is growing at a rate of 9% annually. The branded food industry is trying
to enter the India retail industry and convert Indian consumers to branded food. Since at
present 60% of the Indian grocery basket consists of non- branded items. The global retail
giants like Wal-Mart, Spar International, Tesco, K-Mart/SEARS, Carrefour, ZARA, FCUK,
Carrefour Group and The Home Depot, NEXT, Mother Care, lKEA, Trussardi, DKNY and many
more have made plans to march in the Indian market.
Companies like Spencer’s, Shoppers Stop, Trent, Reliance, Lifestyle, Pantaloons Tanishq,
Crossroads, Vishal and More already have planned to invest over Rs 5,000cr. Trent is on the
edge to take both its brands 'Star India Bazaar' and 'Westside' to new cities, meanwhile
Shoppers' Stop has recently geared up for expansion of present ones and to add 11 new stores
including two hypermarkets. Pantaloon has planned to add eight 'Big Bazaar' malls within the
next 6 to 8 months and also Spencer has geared up for opening 15 hypermarkets in near
future.
.

28
7. Company Profile
Company Profile

29
Type: - Family owned(Holch Povlsen family with Anders Holch Povlsen as CEO)
Founded: - Denmark (1972)
Founder(s):- Troels Holch Povlsen.
H.Q. :- Denmark
Key People: - Anders Holch Povlsen.
Industry: - Fashion apparels
Revenue: - Net turnover EUR 2.7 billion (5% increase)
Result before tax EUR 228.2 million (21% increase)
Total equity EUR 1.3 billion
Employees: - 15000+

30
RPG Enterprises:-
BESTSELLER is a family-owned clothing and accessories company founded in Denmark in
1975. We provide fast affordable fashion for women, men, teenagers and children. Our
products are available online, in branded chain stores, in multibrand and department
stores.
Products are marketed and sold under the following brands: JACK & JONES, JUNAROSE,
JAQUELINE DE YONG, LITTLE PIECES, LP BOYS, MAMALICIOUS, NAME IT, NAME IT LIMITED,
NOISY MAY, OBJECT COLLECTORS ITEM, ONLY, ONLY PLAY, ONLY & SONS, OUTFITTERS
NATION, PIECES, PRODUKT, SELECTED, VERO MODA, VILA CLOTHES and Y.A.S
BESTSELLER markets its products in 70 markets across most of Europe, the Middle East,
Canada, India and globally via E-commerce. We have more than 3,000 branded chain
stores across 38 markets worldwide and our products are sold in approx. 15,000 multi-
brand and department stores.
BESTSELLER has no ownership interests in the production chain but cooperates with
selected suppliers primarily in China, India, Bangladesh, Turkey and Italy. We work with
around 300 manufactures of garments and accessories. With our Code of Conduct,
BESTSELLER works to ensure a sustainable approach in the cooperation with the suppliers.
BESTSELLER is 100% owned by the Holch Povlsen family with Anders Holch Povlsen as CEO.

31
Values
10 BASIC PRINCIPLES
More than 30 years ago Troels Holch Povlsen, BESTSELLER's founder, phrased the 10 basic
principles of the company. The principles were reliable guidelines back then, and today they
still express the essence of the BESTSELLER spirit.
• We are honest
• We are hard-working
• We are loyal
• We are co-operative
• We are business minded
• We want to see results
• We want simple solutions
• We take nothing for granted
• We always keep our promises
• We want to be the best
OUR VISION
One World, One Philosophy, One Family is the symbol of the company culture in BESTSELLER.
One World
Our world is built on fairness and opportunities. Cultural differences are an advantage, which
will promote quality, extraordinary results and good values. Always trying to give more than
we promise we try to meet remoteness with closeness.
One Philosophy
We make BESTSELLER’s 10 Basic Principles come alive. We are humble and together we work
hard. We base our co-operation on trust, partnership and honesty. We treat all people as
individuals but we think and act as a team. Therefore we succeed.

32
One Family
The backbone of BESTSELLER is our family feeling. We help each other and have unlimited faith
in our relatives. We show our identity in the good examples we set for one another. We are
proud of our family. It is both our link to the past and the foundation of our
DEVELOPMENT WORK
Social responsibility is something that comes from within the spirit of our company. If we are
able to help others, then we have an obligation to do so. It is about having that extra surplus –
of both energy and resources – to help other people.
BESTSELLER FUND
BESTSELLER has always put great effort and resources into helping people in need. Established
in 1995, BESTSELLER FUND is an independent non-profit charitable foundation that primarily
helps vulnerable people from the lowest levels of society.
The foundation initially supported social and cultural activities in Denmark and later also India
and China where BESTSELLER has suppliers producing parts of its clothes and accessories. Since
2005, BESTSELLER FUND has extended its help and now also supports large village
development projects that aim to eradicate the overwhelming poverty that prevails in rural
China, Africa and parts of India.
The work of BESTSELLER FUND is not directly related to BESTSELLER’s activities but serves as a
means to give something back to some of the poorest and most vulnerable people on the
planet.
For more information about BESTSELLER FUND, please visit www.bestsellerfund.com
THE WILDLAND ORGANISATION
Apart from supporting vulnerable people from the lowest levels of society, BESTSELLER has
also established Wildland Organisation – an organisation that works to preserve and
regenerate nature and its wild beauty.
The first project is called ‘Leaota’, which is a wilderness situated in the Carpathians, Romania.

33
Board of Directors in BESTSELLER A/S:
Chairman of the Board: Merete Bech Povlsen
Member of the Board: Anders Holch Povlsen
Member of the Board: Troels Holch Povlsen
Member of the Board: Finn Poulsen
Executive Management in BESTSELLER A/S
Chief Executive Officer: Anders Holch Povlsen
Executive Brand Director: Lisbeth Holm Højgaard
Chief Financial Officer: Lise Kaae

34
8. Introduction to Market Potential

35
Market Potential
Market Potential:-
Market Potential is the total amount of a product/service that customers will purchase within
a specified period of time at a specific level of industry wide marketing activity or estimated
maximum total sales revenue of all suppliers of a product in a market during certain period of
time.
This is an important aspect of marketing since one has to do market research related to his
industry product which can be business to consumer or business to business. Market potential
is basically carried out to know the strength in the industry also to allocate the target to the
sales force based on optimum market research which normally includes the customer’s
requirement and their expansion plans, investment etc. With optimum information a company
can know amount of investment for a product, also for a particular area.
Total Market Demand:-
The total market demand for a product or service is the total volume that would be bought by
a defined consumer group in a defined geographic area in a defined time period in a defined
marketing environment under a defined level and mix of industry marketing effort. Total
market demand is not a fixed number but a function of the stated conditions.

36
Market demand in the specific period
Market potential
Market forecast
Market minimum
Planned expenditure
Industry marketing expenditures
Market demand as a function of Industry marketing expenditures
Fig (1): Market Demand
Figure (1) shows the relationship between total market demand and various market
conditions. In this figure, upper limit of market demand is called Market Potential.
Companies have developed various practical methods for estimating total market demand.
A common method to estimate total market demand is as follows:-
Q = n × q × p
Where Q = total market demand
n = number of possible buyers in the market
q = quantity purchased by an average buyer per year
p = price of an avg. unit
Benefits of Market Potential Analysis:-
• Understand market potential for a single store, network of stores or a new market.
• Deploy resources effectively by ranking markets in priority order.
• Forecast total opportunity in terms of number of customers and revenue potential.
• Estimate your market share.
A market potential analysis may include:

37
• A customer profile to understand where to find more like them
• Market penetration and market share reports showing performance in existing markets
and expected performance in new markets
• Market ranking reports allowing you to prioritize resource deployment into new
markets
• A geographic view of market opportunity on detailed maps
Market potential can be expressed as a function of:
• The number of customers purchasing
• Amount purchased
• Frequency of purchase
In other words, market potential = (how many * how much* how often)
Bottom Up or Top Down Market Analysis:-
• A Bottom Up approach to market sizing starts with a company customers. How much
and often do they buy? What is their profile? How many potential customers do you
have in the market based on your customer profiles? How can you reach them?
• A Top Down approach starts with market and industry data. It takes a close look at a
geographic market area and profiles the consumers and/or businesses to let you know
their propensity to buy your products and services.
Estimating the market or market potential for a new business or business expansion is critical
in determining the economic feasibility of a venture. But market potential is very essential for
the company and by knowing market potential a company can make its position in the market
by finding how many players are there in that sector.

38
Store Functions
These are the various types of job roles that I had been assigned at the store to boost sales and
to facilitate the ongoing operations and ensure the efficiency and effectiveness of customer
service delivery so that it proves to be a help to the store as a whole.
Stickering - pasting discount stickers so that it is easier to the customer to find which
item has been discounted and by what percentage. It proved to be very effective
because after 2 or 3 days it was observed that people were not asking whether an item
was discounted or not. Thus it took a lesser amount of time in handling and dealing
with such customers. But when the discount percentages were frequently changed it
became quite difficult to sticker all the items before the store is open for customers to
39
walk in
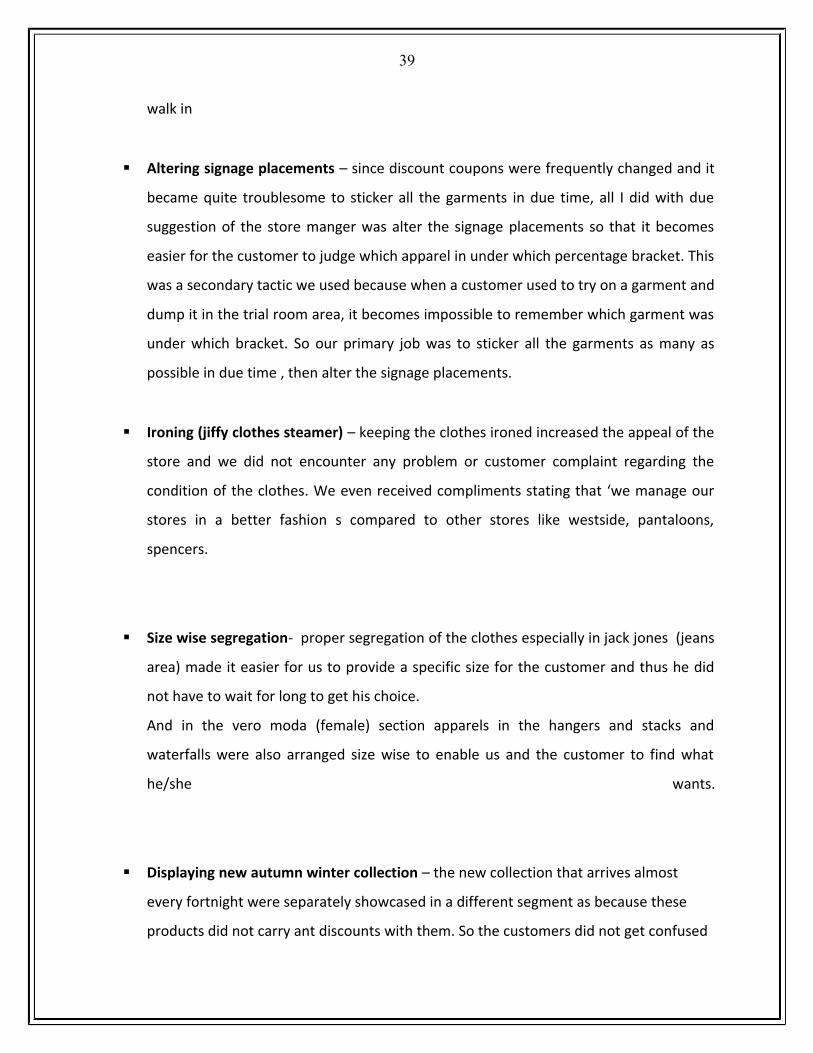
Altering signage placements – since discount coupons were frequently changed and it
became quite troublesome to sticker all the garments in due time, all I did with due
suggestion of the store manger was alter the signage placements so that it becomes
easier for the customer to judge which apparel in under which percentage bracket. This
was a secondary tactic we used because when a customer used to try on a garment and
dump it in the trial room area, it becomes impossible to remember which garment was
under which bracket. So our primary job was to sticker all the garments as many as
possible in due time , then alter the signage placements.
Ironing (jiffy clothes steamer) – keeping the clothes ironed increased the appeal of the
store and we did not encounter any problem or customer complaint regarding the
condition of the clothes. We even received compliments stating that ‘we manage our
stores in a better fashion s compared to other stores like westside, pantaloons,
spencers.
Size wise segregation- proper segregation of the clothes especially in jack jones (jeans
area) made it easier for us to provide a specific size for the customer and thus he did
not have to wait for long to get his choice.
And in the vero moda (female) section apparels in the hangers and stacks and
waterfalls were also arranged size wise to enable us and the customer to find what
he/she wants.
Displaying new autumn winter collection – the new collection that arrives almost
every fortnight were separately showcased in a different segment as because these
products did not carry ant discounts with them. So the customers did not get confused

40
about these new products and whether or not they carried any discounts.
Attending to customer – many a times it was observed that a few customers were left
unattended to, so I attended them in due time so that the customers do not leave the
store unhappy and discontented. Even if he/she doesn’t buy this time , if he is well
attended then he will surely buy in future but if he is left unattended then he might not
cok=me into the store again.
Making it pull rather than push –explaining various offers to the customers so that he
finds it lucrative enough and makes impulsive buying, present the offers and explain in
detail his benefits if he avails of the offers. After explaining offers it was very easy to
convert him/her to buy the product
Folding the apparels in the trial room area – since ours is a fast fashion outlet , there
are a number of people walking in a single given time and they use the trial rooms.
After using the trial rooms the clothes are left there and when the next customer goes
to use the trial room he/she doesn’t like the look of it as there are clothes lying. So we
made the extra effort in keeping the trial rooms clean.
Lending a hand at the billing desk – it becomes an inhumane task for the cashier alone
to bill, remove tags, fold and pack the items and give to the customers. Because in
doing so he spends a lot of time and the queue gets long, so I helped him at the billing
desk in folding, removing the magnetic tags and folding the apparels so it saved time
and people were not irritated for standing in long queues.
Putting tags and removing tags- putting tags in various apparels prevented theft and
removal of tags in the billing counter did not let customer harassment to happen.

41
9. Data Analysis and Interpretation

42
Data Analysis and Interpretation

43
Research in retail is very essential, as customer preferences and choices are dynamic and
change frequently, the retail company needs to understand these before redesigning its
processes for enhancing business and many more. Since customer interaction takes place at
the store and near store, there is a big opportunity to gather first hand information and
feedback from customers through research and survey. Research is carried out at the retail
level for concept testing, business feasibility analysis, identification of the right product mix,
target customer and market potential.
The major objectives of analysis of data are:-
• To evaluate and enhance data quality
• Describe the study population and its relationship
• Examine effects of other relevant factors
• Seek further insight into the relationship observed or not observed
• Evaluate impact and importance

44
Target Customers- Age Wise:-
This Table reveals about age group of customers at JJ&VM,SOUTH CITY.
Table-1
Age Group of Respondents
Age Group No. of Respondents % of Respondents18-25 134 33.526-35 152 3836-45 56 1446-55 27 6.7556+ 31 7.75
Pie Chart: 1
Source: Primary Data
Inference:
From the Table-1 and Pie chart-1 depicted above,
Out of 400 respondents who answerd the questionnaire, 33.5% people fall in the age group
18-25 years, 38% people fall in the age group 26-35 years,14% people fall in the age group 36-
45 years, 6.75% people fall in the age group 46-55 years and 7.75% people fall in the age group
56+ years.
From the above analysis, it is observed that majority of the residents fall in the age group 18-
25 and 26-35

45
No. of family member’s of the Respondents
This table explains about No. of family member’s in a family of JJ&VM,SOUTH CITY
Table-2
No. of Family and Family Member's of RespondentMember's of family No. of Family % of Family
1 2 0.52 20 53 42 10.54 123 30.755 138 34.56 54 13.57 15 3.758 4 19 1 0.25
11 1 0.25
Column Chart-2
Source: Primary Data
Inference:

46
From the Table-2, Column chart-2 depicted above,
Out of 400 respondents who answerd the questionnaire, 34.5 people belong to 5 member’s
family, 33.75% people belong to 4 member’s family, 13.5% people belong to 6 member’s
family, 10.5% people belong to 3 member’s family, 5% people belong to 2 member’s family,
1% people belong to 8 member’s family.
47
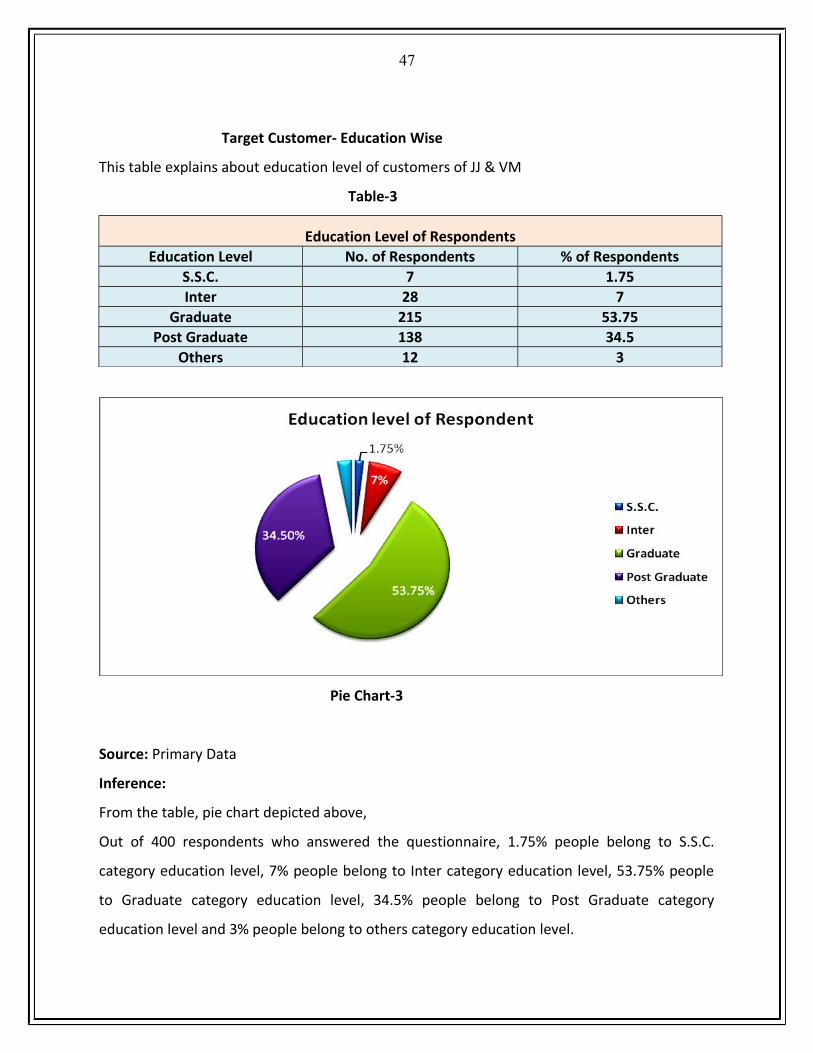
Target Customer- Education Wise
This table explains about education level of customers of JJ & VM
Table-3
Education Level of RespondentsEducation Level No. of Respondents % of Respondents
S.S.C. 7 1.75Inter 28 7
Graduate 215 53.75Post Graduate 138 34.5
Others 12 3
Pie Chart-3
Source: Primary Data
Inference:
From the table, pie chart depicted above,
Out of 400 respondents who answered the questionnaire, 1.75% people belong to S.S.C.
category education level, 7% people belong to Inter category education level, 53.75% people
to Graduate category education level, 34.5% people belong to Post Graduate category
education level and 3% people belong to others category education level.

48
Occupation of Respondents
This table describes the occupation of respondents who gave the answer of questionnaire and
explain class of customers of JJ &VM
Table-4
Occupation of RespondentsOccupations No. of Respondents % of Respondents
Student 73 18.25House Wife 27 6.75
Service 172 43Business 87 21.75Others 41 10.25
Pie Chart-4
Source: Primary Data
Inference:
From the table, pie chart depicted above,
On this basis of 400 respondents who answered the questionnaire, 43% people belong to
Service category, 21.75% people belong to Business category, 18.25% belong to Student
category, 6.75% people belong to House Wife category and 10.25% people belong to Others

49
category.
Monthly Income of Respondents
This table states about the monthly income level of Respondents who gave the answer of this
survey questionnaire and belong to JJ &VM & so taken by me as a sample of the entire
population for the analysis.
Table-5
Monthly Income of RespondentsMonthly Income No. of Respondents % of Respondents
< 5k 68 17%5k-10k 78 19.5%
10k-20k 149 37.25%> 20k 105 26.25%
Pie Chart- 5
Source: - Primary Data
Inference:
From the Table-5, Pie Chart-5 depicted above,
Out of 400 respondents who answered the questionnaire, 17% people belong less than 5000
monthly income category, 19.5% people belong to 5000-10,000 monthly income category,

50
37.25% people belong 10,000-20,000 monthly income category and 26% people belong to
more than 20,000 monthly income category.
Shopping place of Respondents is JJ & VM or not
This question tells about respondents shop at Spencer’s or not and also it tells about brand
awareness of Spencer’s in market.
Table-6
No. of Respondents who visit JJ & VM for shopping
No. of Respondents Shop at Spencer's % of Respondents
203 Yes 50.75%197 No 49.25%
Bar Chart-6
Source:- Primary Data
Inference:-
From the Table-6, Bar Chart-6 depicted above,

51
• Out of 400 respondents who answered the questionnaire, 50.75% people go to JJ &VM
for shopping but not regularly. By this question it reveals that brand awareness of JJ
&VM IN SOUTH CITY, KOLKATA.
• 49.25% people do not go.
No. of times in a week shopping at JJ & VM by the Respondents
This table explains about frequency of shopping in a week by the respondents in a week.
Table-7
Shopping at JJ &VM in a week by RespondentsNo. of times in a week No. of Respondents % of Respondents
1 76 192 98 24.53 20 54 8 2
20 1 0.25203 50.75
Column Chart-7
Source:- Primary Data
Inference:-
From the table, column chart depicted above,

52
• On the basis of 400 respondents who answered the questionnaire, 19% people go for
shopping once in a week, 24.5% people shop twice in a week. 5% people shop thrice in
a week and 2.25% people shop at JJ &VM quadruple times a week
53
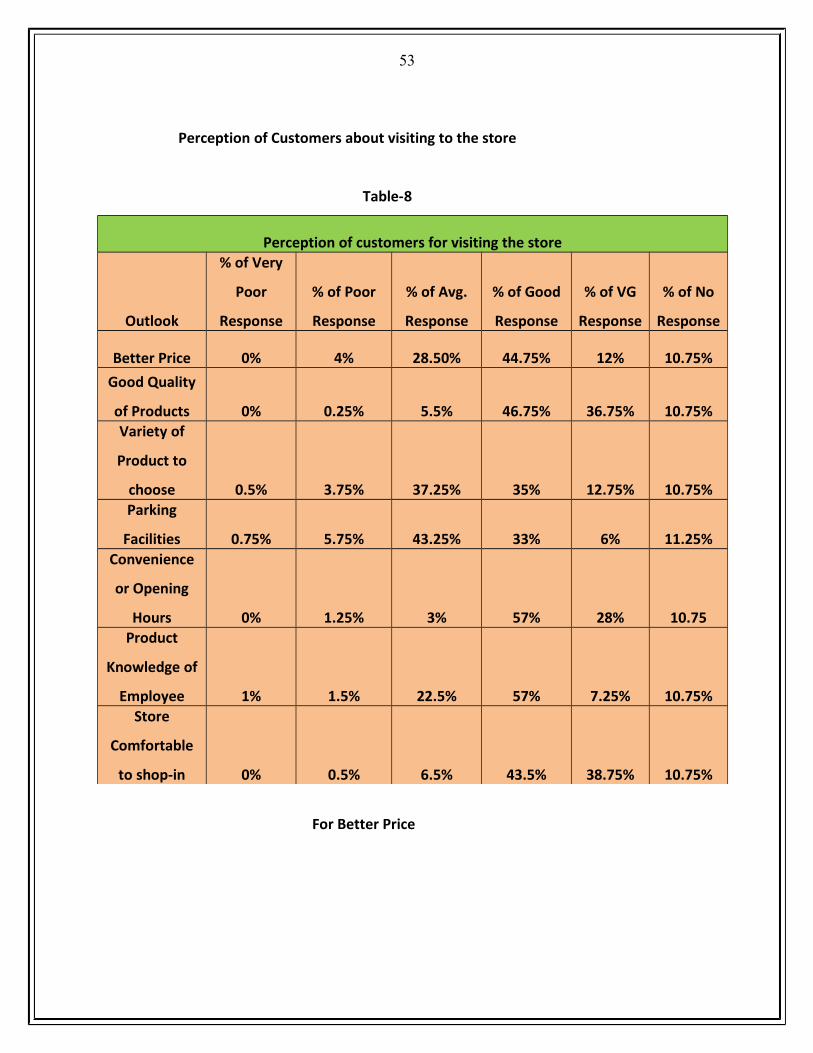
Perception of Customers about visiting to the store
Table-8
Perception of customers for visiting the store
Outlook
% of Very
Poor
Response
% of Poor
Response
% of Avg.
Response
% of Good
Response
% of VG
Response
% of No
Response
Better Price 0% 4% 28.50% 44.75% 12% 10.75%
Good Quality
of Products 0% 0.25% 5.5% 46.75% 36.75% 10.75%Variety of
Product to
choose 0.5% 3.75% 37.25% 35% 12.75% 10.75%Parking
Facilities 0.75% 5.75% 43.25% 33% 6% 11.25%Convenience
or Opening
Hours 0% 1.25% 3% 57% 28% 10.75Product
Knowledge of
Employee 1% 1.5% 22.5% 57% 7.25% 10.75%Store
Comfortable
to shop-in 0% 0.5% 6.5% 43.5% 38.75% 10.75%
For Better Price

54
Column Chart-8
Source:- Primary Data
Inference:-
From the Table-8, Column Chart-8 depicted above,
• Out of 400 respondents who answered the questionnaire, 44.75% said good about
pricing of products, 28.5% said average, 12% said very good and none said very poor
regarding Better Price in reasons for visiting the store.

55
Column Chart-9
Source:- Primary Data
Inference:-
From the Table-8, Column Chart-9 depicted above,
• Out of 400 respondents who answered the questionnaire, 46.75% said good about
quality of products, 5.5% said average, 36.75% said very good and none said very poor
regarding Good Quality of Products

56
Column Chart-10
Source:- Primary Data
Inference:-
From the Table, Column Chart-10 depicted above,
• Out of 400 respondents who answered the questionnaire, 35% said good about
availability of variety of products, 37.25% said average, 12.75% said very good and
none said very poor regarding Variety of Products to choose in reasons

57
Column Chart-11
Source:- Primary Data
Inference:-
From the Table, Column Chart-11 depicted above,
• Out of 400 respondents who answered the questionnaire, Out of 400 respondents who
answered the questionnaire, 33% said good about parking facilities, 43.25% said
average, 6% said very good and 0.75% said very poor regarding Parking Facilities in
reasons

58
Column Chart-12
Source:- Primary Data
Inference:-
From the Table, Column Chart-12 depicted above,
• Out of 400 respondents who answered the questionnaire, 57% said good about
convenience or opening hours, 3% said average, 28% said very good and none said very
poor regarding Convenience or Opening Hours in reason.

59
Column Chart-13
Source:- Primary Data
Inference:-
From the Table, Column Chart-13 depicted above,
• Out of 400 respondents who answered the questionnaire, 57% said good about
products knowledge of employee, 22.5% said average, 7.25% said very good and 1%
said very poor regarding Convenience/Opening Hours in reason.

60
Column Chart-14
Source:- Primary Data
Inference:-
• Out of 400 respondents who answered the questionnaire, 43.5% said good about Store
comfortable to shop-in (ambience), 6.5% said average, 38.75% said very good and none
said very poor regarding Store Comfortable to Shop-in (Ambience) in reasons.
Hence from above analysis, customers show the maximum view on following things in the
reasons for visiting a supermarket— product knowkedge of employee (57%),
Convenience/Opening Hours (57%),Good quality of Products (46.75), Better Price (44.75%),
Store comfortable to shop-in ( 43.50%), Parking Facilities (43.25%) and Variety of products to
choose (37.25%).

61
Customers Expectation with respect to Services
This table tells about what kinds of services, customers expect from Spencer’s and other
Supermarket
Table-10
Kind of Services customers expectServices Important Not Important No Response
Fast Billing 90.25% 4.50% 5.25%Ticket Booking Counter's 24.50% 69.25% 6.25%
All C. & D. cards
Should accept 92.50% 2% 5.50%
Column Chart-24

62
Source:- Primary Data
Inference:-
From the Table-10, Column Chart-23 depicted above,
• Out of 400 respondents who answered the questionnaire, 90.25% respondents give
their view regarding Fast Billing as important, 69.25% respondents give their view
regarding Ticket Booking Counter’s as not important 92.50% respondents give their
view regarding all credit and debit cards should accept as important.

63
10. Findings of the Study
After completing the survey and analyzing the responses of the persons contacted. I came
across the following facts—
• Consumer life style and spending pattern are changing, more and more customers are
visiting supermarket.
• Demographics of people visiting south city especially jj and vm are very nice for retail
business. In this area 38% people belong 26-35 age group category, 33.5% people
belong to 18-25 age group category, and 14% people belong to 36-45 age group
category and rest other age group.
• mixture of Joint family and Nuclear family because 34.5% family are having only 5
family member’s, 30.75% family are having only 4family member’s, 13.5% family are
having 6 family member’s and 10.5% family are having 3 family member’s.
• People well qualified. 53.75% people are Graduate, 34.5% people are Post Graduate
and 7% people have studied Intermediate/ S.S.C.
• most of the people are service man. 43% people are job holders, 21.75% people are
business man, 18.25% people are students and 6.45% women are house wives, 10.25%
people do other works. Among the women respondent most of them are job holders or
business women. This finding indicates that earning person is the decision maker for a
family even for shopping or any other work.
• As we know in this area service holder people are maximum and this shows their
monthly income would be good. In this area, 37.25% people earn 10,000-20,000

64
monthly, 26.25% people earn more than 20,000, 19.50% people earn 5000-10,000 and
17% people earn less than 5000 monthly..
• their preferences regarding Better Price 44.75% good &28.50% average, regarding
Good quality of products 46.75% good & 36.75% very good, regarding Variety of
products to choose 37.25% average, 35% good & 12.75% very good, regarding Parking
Facilities, 43.25% average & 33% good, regarding Convenience/Opening Hours 57%
good, 28% very good, regarding Product Knowledge of Employee 57% good, 22.5%
average & 7.25% very good, regarding Store comfortable to shop-in (ambience) 43.5%
good & 38.75% very good.
.
• their expectation regarding different-different services, -- Fast billing – 90.25%
important, Ticket booking counter’s- 69.25% not important,All Credit & Debit cards
should accept – 92.50% important.

65
11. Challenges and Opportunities

66
12. Suggestions and Recommendations
Suggestions and Recommendations
• Most of the customers believe that stock is not updated and no offer schemes are
provided by Spencer’s on the old stock. Same price is charged for both the fresh stock

67
and old stock. Respondents feel offers should be provided on the old stock, as is done
in other retail stores.
• As the majority of population are falling into the age group of 26-35 and 18-
25.Company should concentrate on the need of people falling into that category.
• People of Dr. A.S. Rao Nagar, say that Spencer’s should employ experienced sales staff
so that they can better explain the quality and features of the products.
• Store layout should be redesigned that a customer can have easy access to the
product.
• People generally search for the product on offer so the high margin product should be
up fronted that mean those item should be in the eye height so that it easily catches
the customers’ attention and generates impulse purchase.
• To improve Product visualization the Company should do visual merchandising in
better way.
• Variety of products should be increased with deep assortment for better selection by
the customers so that customers can choose from huge lot of items of different
companies having different features.
• Customers are very eager to know about offers, discount schemes provided
Complained and feedback should be taken care in well manner to create the loyalty
and goodwill.
• Merchandise should be arranged properly.
• Company should offer competitive price with good quality of products because most of
the customers visit to the store for better price and quality of products.
• Company should give information to the customers through the marketing gimmick
(sms) using database of customers.
• Billing should be fast because customers don’t want to stay in the store after
purchasing the products.

68
13. Limitations of the Study

69
Limitations of the Study
Following are the few limitation of the particulars research study.
• The sample size chosen is limited to 400 only because of time and financial constraint.
• This study was based purely in south city, kolkata
• Data collected may not be a representation of the entire population.
• The time duration for this project was only for a period of 2 months .I also took the
view of respondents who don’t shop from the sore
• This study was limited to the capabilities and willingness of the respondents in
appropriately answering the questions and information given by respondents may be
correct and may not be correct.

70
14. Conclusion

71

72
Questionnaire
FEEDBACK FORM
Name:-
Address:-
Contact No:-
1. What is your age group?
i) 18-25 ii) 26-35 iii) 36-45 iv) 46-55 v) 56+
2. How many Members’ do have in your family including with you
3. Your Education Level
1. S.S.C 2. Inter 3. Graduate 4. Post Graduate 5. Others
4. Your Occupation
1. Student 2.House Wife 3. Service 4.Business 5. Others
5. What is your monthly income?
1. < 5000 2. 5000-10,000 3. 10,000 - 20,000 4. >20,000
6. Do you shop at JJ & VM ……………… store?
Yes / No If Yes, how many times per week

73
7. Reasons for visiting SOUTH CITY
Index: 1 for Very Poor and 5 for Very good
Very Poor Very Good 1 - 5
Better Price 1 2 3 4 5
Good Quality of Products 1 2 3 4 5
Variety of products to choose 1 2 3 4 5
Parking Facilities 1 2 3 4 5
Convenience/Opening hours 1 2 3 4 5
Product knowledge of
Employee
1 2 3 4 5
Store comfortable to shop-in 1 2 3 4 5
Please highlight or enter the appropriate number

74
10. What kind of services you expect?
Please put a mark
Services ImportantNot
ImportantFast BillingTicket Booking Counter’sAll credit and debit cards should accept
If, any other please specify
SUGGESTIONS
THANK YOU
JACK JONES & VERO MODA, SOUTH CITY,KOLKATA

75
Bibliography

76
Bibliography
Books:-
• Marketing Management (13th Edition) - By Philip Kotler, Keller, Koshy and Jha
• Principles of Marketing (11th Edition) – By Philip Kotler and Gary Armstrong
• Research Methodology -- C.R. Kothari
• The Art of Retailing - A.J. Lamba
Reference:-
• www.google.com
• www.indiaretailing.com
• www.retailindustry.com
www.fiber2fashion.com


![Copy of Youth Task Force Presentation Final[W]](https://static.fdocuments.net/doc/165x107/577daccd1a28ab223f8e64bf/copy-of-youth-task-force-presentation-finalw.jpg)
