
An Analysis of Convertible Bond Issuance: Design Features ...
ersion-ntiallyntrast,erfor-ediatelyhori-sh flowce the
ance oft exu-
Journal of Financial Intermediation 12 (2003) 255–276www.elsevier.com/locate/jfi
Convertible bond calls:resolution of the information content puzzle
Sudip Datta,a,∗ Mai Iskandar-Datta,b and Kartik Ramana
a Department of Finance, Bentley College, 175 Forest Street, Waltham, MA 02452, USAb Department of Finance, Sawyer School of Management, Suffolk University, 8 Ashburton Place,
Boston, MA 02108, USA
Received 20 August 2001
Abstract
This study resolves the puzzling evidence on convertible bonds by documenting that convforcing calls are indeed bad news. We find that the common stocks of calling firms substaunderperform their benchmarks by a median of 64% over the five-year post-call period. In cofirms that choose not to call their in-the-money convertibles exhibit no long-run abnormal pmance. We show that studies drawing conclusions based on short-term price reversal immfollowing the call fail to completely capture the valuation effect that occurs over a longer timezon. We document that the market condition at the time of the call (issuance volume) and cabenefits related to the call (relation between dividend and after tax coupon payment) influenpost-call stock price performance. Our analysis also reveals that the post-call underperformhigh-growth firms is more pronounced than that of low-growth firms, indicating greater markeberance associated with high-growth firms at the time of the call. 2003 Elsevier Inc. All rights reserved.
JEL classification: G14; G32
Keywords: Convertible bond calls; Information content of convertible calls; Long-run post-callunderperformance
* Corresponding author.E-mail address: [email protected] (S. Datta).
1042-9573/$ – see front matter 2003 Elsevier Inc. All rights reserved.doi:10.1016/S1042-9573(03)00042-1
256 S. Datta et al. / Journal of Financial Intermediation 12 (2003) 255–276
asym-rcingnotionstors,
egativen pay-ificantre (see,
Dattazzeoent a
consis-olvedbond
ine theles the
ationpiricale longt reac-mancercing
per-preta-ost-call
nd thatnt tobond
) andg theallingey badthat an-nalysts’vaesistic
dingse re-. Thus,lly cap-g the
1. Introduction
Does a convertible bond call really convey bad news? Predicated on informationmetry, Harris and Raviv (1985) propose a signaling model in which a conversion-fobond call conveys a negative signal about the firm’s future prospects. Building on theof asymmetric information, where firm insiders are better informed than outside inveConstantinides and Grundy (1987) argue that conversion-forcing calls constitute a nsignal when expected future dividend payments are lower than the after-tax coupoment on the convertible bond. Consistent with these theoretical predictions, a signadverse stock price response to call announcements is well established in the literatue.g., Mikkelson, 1981; Ofer and Natarajan, 1987; Asquith and Mullins, 1991; andand Iskandar-Datta, 1996). However, analyzing a short period following the call, Maand Moore (1992), Byrd and Moore (1996), and Ederington and Goh (2001) documprice reversal that is in support of the price pressure hypothesis and apparently intent with the theoretical predictions. Therefore, the following question remains unresin the current literature: What are the long-term implications of conversion-forcingcalls for shareholders? Using more appropriate and robust research design, we examlong-run post-call stock price performance and provide new evidence that reconciconflicting conclusions by prior studies of conversion-forcing bond calls.
Daniel et al. (1998) reason that constraints on investors’ ability to process informallow equity to be misvalued over long time horizons. The authors summarize the emfindings around various corporate announcements and show theoretically that in thrun, post-event stock price performance is in the same direction as the initial marketion, and lasts from three to five years. Therefore, we examine the stock price perforover a five-year time horizon following the convertible call and find that conversion-fobond calls have negative long-term implications for shareholders.
This study has several contributions. First, by examining the long-run stock priceformance over a five-year post-call period, we are able to resolve the conflicting intertions of the adverse stock price response at the announcement and the short-term pprice reversal documented in prior studies. Based on Daniel et al. (1998), we contethe relatively short post-call time horizon examined by previous studies is insufficiedraw reliable conclusions regarding the information conveyed by conversion-forcingcalls and about the validity of the theoretical predictions. Byrd and Moore (1996Ederington and Goh (2001) examine analysts’ earnings forecast revisions followinconvertible call and find that analysts are optimistic about the future prospects of cfirms. The authors therefore infer that convertible call announcements do not convnews about the calling firms’ prospects. However, several studies have documentedalysts tend to be overoptimistic. For example, Rajan and Servaes (1997) show that agrowth projections are overly optimistic following IPOs. Specifically, Rajan and Serconclude that “firms perform poorly in the long run when analysts are more optimabout their long run growth projections.” Lewis et al. (2001) document a similar finfor convertible debt offerings. Further, La Porta (1996) provides evidence of an inverlation between analysts’ predicted growth rates and future stock price performancethe conclusion based on analysts’ forecast revisions is also tenuous and may not future the post-call valuation effect that occurs over a longer time frame. By examinin
S. Datta et al. / Journal of Financial Intermediation 12 (2003) 255–276 257
tes to
studiesench-herenter androvide991)
e post-mpbellcall ab-92), it
betteritional999),stronges theprice
anceffer-le with-snd thertible
irect,s asso-s to-
whileut-of-
ve-yearused asonly atvertiblees aretweenmode
ignificant
stock price performance over a five-year period following the call, this study contribuour understanding of the long-term implications of a conversion-forcing call.
Second, this study uses current and more powerful methodology than previousto measure long-run post-call stock price performance. We use the control firm bmark matched by size, book-to-market, and pre-call momentum to circumvent the inweaknesses of previous studies in measuring long-run post-call performance. OfNatarajan (1987) use pre-event beta estimation period and the market model to pevidence that calling firms underperform in the post-call period. Campbell et al. (1subsequently document that when beta is corrected for the pre-call return bias, thcall underperformance disappears. However, both Ofer and Natarajan (1987) and Caet al. (1991) use the market model as the benchmark to measure the long-run post-normal performance. In a series of articles, beginning with Fama and French (19is well established that size and book-to-market factors, as compared to beta, arepredictors of long-run stock price performance. Our use of momentum as an addmatching criterion follows Carhart (1997), Barber and Lyon (1997) and Lyon et al. (1among others, and alleviates the Ofer and Natarajan-type bias resulting from thepre-call stock price run-up. In sum, this study applies a methodology that overcomlimitations of prior studies and provides conclusive evidence on the long-run stockperformance following conversion-forcing bond calls.
Third, our examination of post-call (as opposed to post-offer) stock price performprovides more direct evidence on the long-run implications of “backdoor equity” oings. Although convertible issues may be viewed aspotential backdoor equity, not alsuch offerings necessarily translate into equity because some issues either expirout being called, or, are called “out-of-the-money.1” The backdoor equity materializeonly when the convertible debt is called. Hence, one would expect the post-offer apost-call long-run stock price performance to capture two distinct effects: the “convedebt issue” effect and the “deferred equity realization” effect, respectively.2 Stein (1992)conceptualizes a convertible bond offering as “backdoor” equity financing. This indalbeit uncertain and deferred, sale of equity alleviates the adverse-selection costciated with direct equity financing for firms with sufficient information asymmetrierender an equity offering uneconomical at the time.3 Given this collective theoretical back
1 Asquith (1991) reports that approximately one-third of all convertible bond issues are not called,Ederington and Goh (2001) find that 19.2% of their initial sample of convertible bond calls were called othe-money.
2 Prior studies by Spiess and Affleck-Graves (1999) and Lee and Loughran (1998) examine the fistock price performance following convertible debt offerings and conclude that convertible debt offers are“backdoor equity.” However, the uncertainty surrounding the conversion of the bond into equity is resolvedconversion-forcing call announcement. Further, the five-year performance results of prior studies on condebt offers may capture some of the “equity realization effect” since half of the convertible bond issutypically called within that five-year period. Mayers (1998) reports that for his sample “the time period beissue and call is relatively short.” He finds that the mean (median) time to call is 6.8 (five) years, while theis three years.
3 Dann and Mikkelson (1984) report a significant adverse stock price response to convertible debtoffer an-nouncements. Recently, Lee and Loughran (1998) and Spiess and Affleck-Graves (1999) document a s
258 S. Datta et al. / Journal of Financial Intermediation 12 (2003) 255–276
s for
sam-se notsed byion 5,ts thate “eq-rtiblerms.5 as it
erfor-lly, weof theer tax
996),g therizonpricee findl theirs studyot bad
all. To-entedmorestudy,
rature
mancersionponsee post-owthe time
samplempirical
te
ground, conversion-forcing bond calls should have important long-term implicationshareholders.
We specifically compare the five-year abnormal stock price performance for twoples: (1) firms that call their in-the-money convertible bonds, and (2) firms that chooto call in-the-money convertible bonds. Clearly, both samples reflect the discretion umanagers to either call or not call the bonds. Daniel et al. (1998), in their Propositstate “that the phenomenon of abnormal post-event drift will be concentrated in evenselect for market mispricing.” Thus, unlike previous studies, our analysis captures thuity realization effect” and provides evidence on the information content of a convebond call by comparing the performance of calling firms with that of non-calling fiThis provides a direct test of Daniel, Hirshleifer, and Subrahmanyam’s Propositionrelates to convertible bond calls.
Finally, we examine the relation between the post-call abnormal stock price pmance and information-related factors associated with the call decision. Specificaanalyze how the market condition (i.e., the type of equity issue period) at the timecall, and cash flow benefits related to the call (relation between dividend and aftcoupon payment) influence the post-call stock price performance.
Consistent with previous studies by Mazzeo and Moore (1992), Byrd and Moore (1and Ederington and Goh (2001), we find that in the short run (one month) followincall, the abnormal stock price performance is positive. However, over a longer ho(five years following the call), we document a significant negative abnormal stockperformance. Notably, in sharp contrast to the underperformance of calling firms, wno abnormal stock price performance for a sample of firms that choose not to calin-the-money convertible bonds. Besides overcoming the methodological issues, thidocuments that the conclusion of previous studies that convertible bond calls are nnews is based on the incomplete stock price response in the short run following the cgether with the evidence of a significant decline in post-call earnings growth documby Ofer and Natarajan (1987) and Campbell et al. (1991), our results provide acomplete evidence that conversion-forcing bond calls are indeed bad news. Thistherefore, is able to reconcile the current conflicting conclusions that exist in the liteabout the information conveyed by conversion-forcing bond calls.
We also document a strong link between the post-call abnormal stock price perforand factors related to the call decision. Specifically, we find that firms forcing convein periods of high equity issuance volume (hot markets), and firms with after-tax cou(C(1− t)) that are greater than the dividend payment(D) at the time of the call, experiencsignificant underperformance in the post-call period. Our analysis also reveals that thcall underperformance of high-growth firms is more pronounced than that of low-grfirms, indicating greater market exuberance associated with high-growth firms at thof the call.
The rest of the paper is organized as follows. In the next section, we describe theselection process and the data sources. Section 2 details the research design. Efindings are presented in Section 3. Section 4 concludes the paper.
long-run stock price underperformance following convertible debtofferings. These studies generally attributheir findings to management’s uncanny ability to time the issuance of overvalued backdoor equity.
S. Datta et al. / Journal of Financial Intermediation 12 (2003) 255–276 259
Janu-Poor’s
treatedwhenk priceEstatels arem thein-
ersityricanbe ob-
eonver-ody’se 18-ds are
rop out
1.1. Sample formation process and data sources
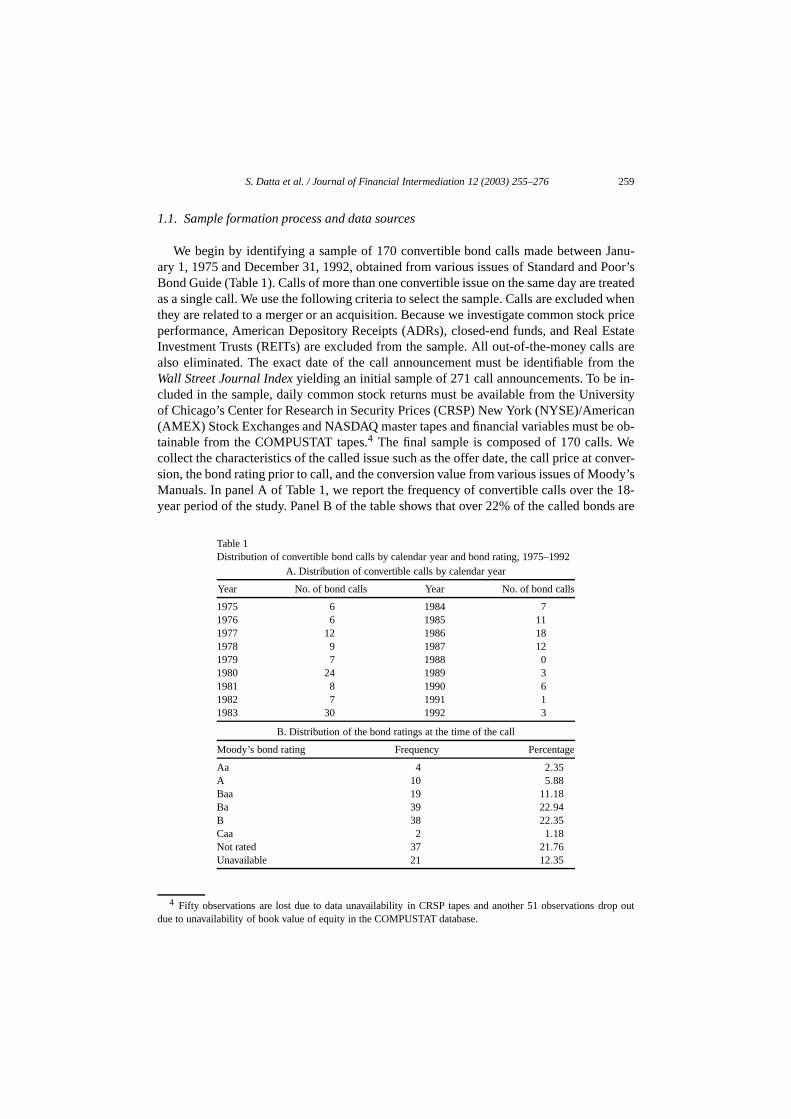
We begin by identifying a sample of 170 convertible bond calls made betweenary 1, 1975 and December 31, 1992, obtained from various issues of Standard andBond Guide (Table 1). Calls of more than one convertible issue on the same day areas a single call. We use the following criteria to select the sample. Calls are excludedthey are related to a merger or an acquisition. Because we investigate common stocperformance, American Depository Receipts (ADRs), closed-end funds, and RealInvestment Trusts (REITs) are excluded from the sample. All out-of-the-money calalso eliminated. The exact date of the call announcement must be identifiable froWall Street Journal Index yielding an initial sample of 271 call announcements. To becluded in the sample, daily common stock returns must be available from the Univof Chicago’s Center for Research in Security Prices (CRSP) New York (NYSE)/Ame(AMEX) Stock Exchanges and NASDAQ master tapes and financial variables musttainable from the COMPUSTAT tapes.4 The final sample is composed of 170 calls. Wcollect the characteristics of the called issue such as the offer date, the call price at csion, the bond rating prior to call, and the conversion value from various issues of MoManuals. In panel A of Table 1, we report the frequency of convertible calls over thyear period of the study. Panel B of the table shows that over 22% of the called bon
Table 1Distribution of convertible bond calls by calendar year and bond rating, 1975–1992
A. Distribution of convertible calls by calendar year
Year No. of bond calls Year No. of bond calls
1975 6 1984 71976 6 1985 111977 12 1986 181978 9 1987 121979 7 1988 01980 24 1989 31981 8 1990 61982 7 1991 11983 30 1992 3
B. Distribution of the bond ratings at the time of the call
Moody’s bond rating Frequency Percentage
Aa 4 2.35A 10 5.88Baa 19 11.18Ba 39 22.94B 38 22.35Caa 2 1.18Not rated 37 21.76Unavailable 21 12.35
4 Fifty observations are lost due to data unavailability in CRSP tapes and another 51 observations ddue to unavailability of book value of equity in the COMPUSTAT database.

260 S. Datta et al. / Journal of Financial Intermediation 12 (2003) 255–276
easurewith
tainedarterlyrevi-ividend
l firment wee-yearook-ed in
eriod),ingsply theAQ-g onfirms.r the
book-e tryding aser the
booknd ofementrketsamplement
pre-call
investment grade, 53% are junk issues, and the remaining 25% are not rated. We mthe cash flow benefits of calling by comparing the annual dividend after conversionthe annual coupon payment (both pre- and post-tax). The dividend information is obfrom CRSP. We measure the total annual dividend per share as the last regular qudividend prior to the call times four, plus any regular extra dividends paid in the pous year. The annual dividend per share times the conversion rate is the annual dassociated with a converted bond.
2. Research design
2.1. Control firms
Barber and Lyon (1997) note that the size-and-book-to-market-matched controapproach yields well-specified statistics. For our post-call performance measuremuse a benchmark of control firms matched by size, book-to-market ratio, and onpre-call stock price run-up. We match by pre-call run-up in addition to size and bto-market ratio to control for the systematic pre-call stock price run-up documentprevious studies (see Lyon et al. (1999)).
At the end of each month from January 1975 to December 1992 (the sample pall NYSE/AMEX common stocks listed on the CRSP tape without any equity offerduring the prior five-year period are used as a pool of possible matching firms. We apsame algorithm to choose matched firms for NASDAQ-listed sample firms. For NASDlisted firms with convertible calls between 1975 and 1977, we use all firms tradinDecember 14, 1972 (the earliest CRSP NASDAQ trading date) as potential matchedCalling firms become eligible to be in the pool of possible matches five years aftecall. We rank these firms at each month-end by their market capitalization (size),to-market (BM) ratio, and one-year pre-call stock return. Following Lee (1997), wto guarantee that the book value is available to the market when used by proceefollows. The book value of a given fiscal year is not used until at least four months aftend of the fiscal year (e.g., firms with a December 31 fiscal year begin using the newvalue for calculations done on or after April 30). The BM ratio is calculated at the ethe month immediately preceding the calendar month of the convertible call announcby dividing the book equity value (COMPUSTAT annual data item #60) by the macapitalization (price per share times number of shares outstanding on CRSP). For afirm, size (market capitalization) is measured 60 days following the call announcedate to take into account the size of post-conversion equity. We measure one-yearreturn as the one-year BHR prior to the call date as[
t=−1∏t=−i
(1+ Rit ) − 1
]× 100,
where dayt = −i is 252 days prior to the call date or the first listing date andt = −1 isthe last trading day prior to the call date,Rit is the return on stocki on dayt . We use thesame holding period to calculate the one-year pre-call return for the matched firm.

S. Datta et al. / Journal of Financial Intermediation 12 (2003) 255–276 261
oolen thetchedhingn their, and
ng thermance
SPBHRsbeforearlier,moval
e use97, and-s.
stribu-pool
m the0 firmschooseetweenrvation.iffer-
edr equal
We match each NYSE/AMEX listed sample firm with the first control firm from the pof NYSE/AMEX firms such that the sum of the absolute percentage difference betwesize, book-to-market ratio, and pre-call stock return of the sample firm and the mafirm is minimized. As in Spiess and Affleck-Graves (1999), the pool of potential matcfirms is constrained so that matched firms are not more than ten percent smaller thasample firms. Two firms did not have potential matched firms meeting this criterionwere matched with the closest fit available.
2.2. Buy-and-hold returns
We measure abnormal common stock returns following convertible bond calls usibuy-and-hold-return(BHR) approach. For robustness checks, we use alternate perfometrics suggested by Fama (1998).
This issue is discussed in detail in Section 3. The buy-and-hold return,BHRi , is calcu-lated as:
BHRi =[
T∏t=1
(1+ Rit ) − 1
]× 100,
where dayt = 1 is the first trading day following the call,Rit is the return on stockion dayt , andT is the five-year anniversary date of the call, or the calling firm’s CRdelisting date, whichever is earlier. We use the same holding periods to calculateof sample firms and their corresponding benchmarks. If a matched firm is delistedthe end of the five-year anniversary or the sample firm’s delisting day, whichever is eCRSP value-weighted returns are spliced into the calculation of the BHR from the redate.
2.3. Non-parametric test of long-run buy-and-hold abnormal returns
To minimize the bias in our inferences arising from the skewness in BHRs, wthe bootstrap method to conduct significance tests (see, e.g., Barber and Lyon, 19Kothari and Warner, 1997). For comparison, we also report thet-statistic for difference between means, and the Wilcoxon (rank sum test)Z-statistic for difference between medianThe bootstrap procedure is employed as follows. The null hypothesis is that the dition of returns for sample firms and their matched firms is identical. We thereforethe 5-year BHRs of sample firms and their corresponding matched firms. Next, fropooled observations, we randomly choose (with replacement) a sub-sample of 17(or the appropriate size of the sub-sample) and record the (mean) median. We thenanother sub-sample (of same size) and record the (mean) median. The difference b(means) medians of the two randomly-chosen sub-samples is recorded as one obseWe repeat this procedure 1000 times to form an empirical distribution of recorded dences between (means) medians. The two-tailedp-value is the proportion of 1000 recorddifferences for which the absolute value of the recorded difference is greater than oto the absolute value of the observed difference.
262 S. Datta et al. / Journal of Financial Intermediation 12 (2003) 255–276
firms.re-calldingatches
f thes. We
, largerof allilliond in
od of
rn (mo-
1992, byed firmscalled ismarket
t. Firmalue ofanding,easuredte (offerpoundedmputed
test
3. Empirical findings
3.1. Firm characteristics
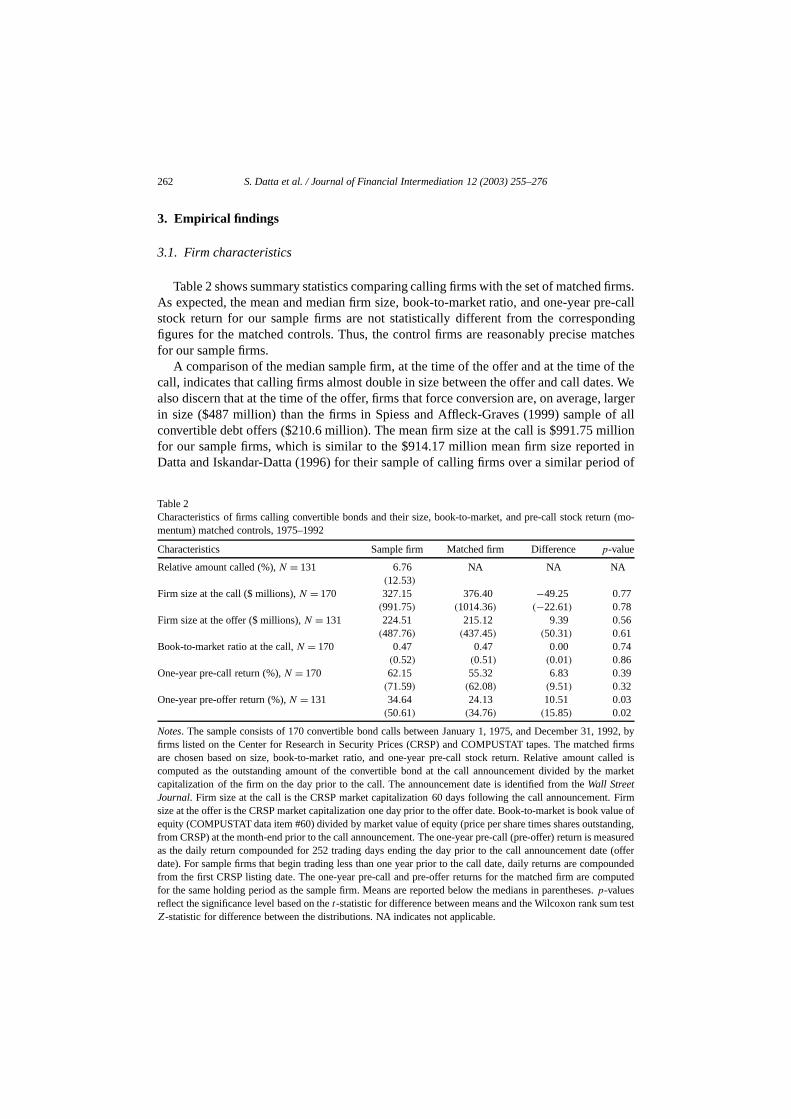
Table 2 shows summary statistics comparing calling firms with the set of matchedAs expected, the mean and median firm size, book-to-market ratio, and one-year pstock return for our sample firms are not statistically different from the corresponfigures for the matched controls. Thus, the control firms are reasonably precise mfor our sample firms.
A comparison of the median sample firm, at the time of the offer and at the time ocall, indicates that calling firms almost double in size between the offer and call datealso discern that at the time of the offer, firms that force conversion are, on averagein size ($487 million) than the firms in Spiess and Affleck-Graves (1999) sampleconvertible debt offers ($210.6 million). The mean firm size at the call is $991.75 mfor our sample firms, which is similar to the $914.17 million mean firm size reporteDatta and Iskandar-Datta (1996) for their sample of calling firms over a similar peri
Table 2Characteristics of firms calling convertible bonds and their size, book-to-market, and pre-call stock retumentum) matched controls, 1975–1992
Characteristics Sample firm Matched firm Difference p-value
Relative amount called (%),N = 131 6.76 NA NA NA(12.53)
Firm size at the call ($ millions),N = 170 327.15 376.40 −49.25 0.77(991.75) (1014.36) (−22.61) 0.78
Firm size at the offer ($ millions),N = 131 224.51 215.12 9.39 0.56(487.76) (437.45) (50.31) 0.61
Book-to-market ratio at the call,N = 170 0.47 0.47 0.00 0.74(0.52) (0.51) (0.01) 0.86
One-year pre-call return (%),N = 170 62.15 55.32 6.83 0.39(71.59) (62.08) (9.51) 0.32
One-year pre-offer return (%),N = 131 34.64 24.13 10.51 0.03(50.61) (34.76) (15.85) 0.02
Notes. The sample consists of 170 convertible bond calls between January 1, 1975, and December 31,firms listed on the Center for Research in Security Prices (CRSP) and COMPUSTAT tapes. The matchare chosen based on size, book-to-market ratio, and one-year pre-call stock return. Relative amountcomputed as the outstanding amount of the convertible bond at the call announcement divided by thecapitalization of the firm on the day prior to the call. The announcement date is identified from theWall StreetJournal. Firm size at the call is the CRSP market capitalization 60 days following the call announcemensize at the offer is the CRSP market capitalization one day prior to the offer date. Book-to-market is book vequity (COMPUSTAT data item #60) divided by market value of equity (price per share times shares outstfrom CRSP) at the month-end prior to the call announcement. The one-year pre-call (pre-offer) return is mas the daily return compounded for 252 trading days ending the day prior to the call announcement dadate). For sample firms that begin trading less than one year prior to the call date, daily returns are comfrom the first CRSP listing date. The one-year pre-call and pre-offer returns for the matched firm are cofor the same holding period as the sample firm. Means are reported below the medians in parentheses.p-valuesreflect the significance level based on thet-statistic for difference between means and the Wilcoxon rank sumZ-statistic for difference between the distributions. NA indicates not applicable.
S. Datta et al. / Journal of Financial Intermediation 12 (2003) 255–276 263
d by
simi-price
lly, themeanEOs.a run-ample,
theHR ofarket,.20%)ntof therper-upporty of-ut the
of anle call
ar pre-to the
ng onrn isletcheds that
d fromldingg pe-
MEX
ure usedlmostented
l made
le
study. The mean BM ratio for our calling firms, 0.52, is comparable to that reporteSpiess and Affleck-Graves, 0.54, for their convertible debt offering sample.
While the pre-offer year benchmark-adjusted performance that we document islar to Lee and Loughran’s (1998) convertible debt offer sample (13%), the pre-callrun-up is reminiscent of that observed for firms issuing seasoned equity. Specificamean pre-call return for our sample of calling firms is 72% which is the same as thepre-issue return documented by Loughran and Ritter (1995) for their sample of S5
These results indicate that conversion-forcing bond calls are announced followingup in stock price, similar to announcements of seasoned equity offers (see, for exLoughran and Ritter, 1995, and Cornett et al., 1998).
3.2. Long-run performance following convertible bond calls
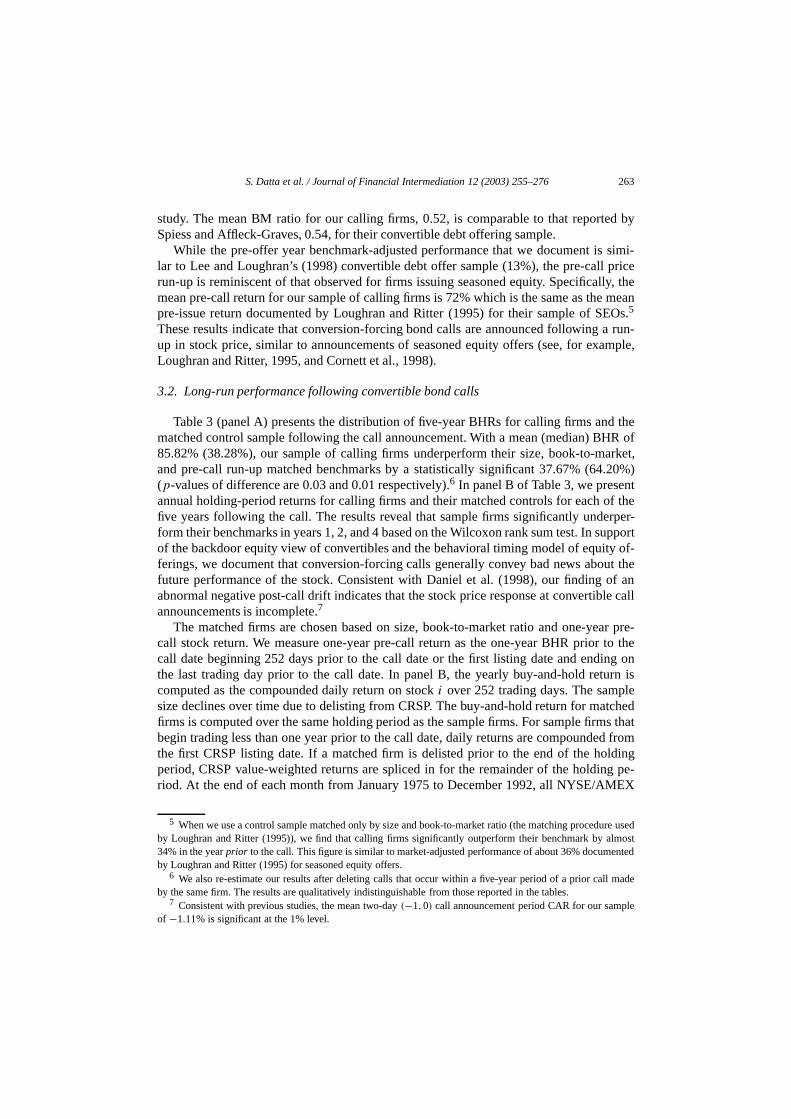
Table 3 (panel A) presents the distribution of five-year BHRs for calling firms andmatched control sample following the call announcement. With a mean (median) B85.82% (38.28%), our sample of calling firms underperform their size, book-to-mand pre-call run-up matched benchmarks by a statistically significant 37.67% (64(p-values of difference are 0.03 and 0.01 respectively).6 In panel B of Table 3, we preseannual holding-period returns for calling firms and their matched controls for eachfive years following the call. The results reveal that sample firms significantly undeform their benchmarks in years 1, 2, and 4 based on the Wilcoxon rank sum test. In sof the backdoor equity view of convertibles and the behavioral timing model of equitferings, we document that conversion-forcing calls generally convey bad news abofuture performance of the stock. Consistent with Daniel et al. (1998), our findingabnormal negative post-call drift indicates that the stock price response at convertibannouncements is incomplete.7
The matched firms are chosen based on size, book-to-market ratio and one-yecall stock return. We measure one-year pre-call return as the one-year BHR priorcall date beginning 252 days prior to the call date or the first listing date and endithe last trading day prior to the call date. In panel B, the yearly buy-and-hold retucomputed as the compounded daily return on stocki over 252 trading days. The sampsize declines over time due to delisting from CRSP. The buy-and-hold return for mafirms is computed over the same holding period as the sample firms. For sample firmbegin trading less than one year prior to the call date, daily returns are compoundethe first CRSP listing date. If a matched firm is delisted prior to the end of the hoperiod, CRSP value-weighted returns are spliced in for the remainder of the holdinriod. At the end of each month from January 1975 to December 1992, all NYSE/A
5 When we use a control sample matched only by size and book-to-market ratio (the matching procedby Loughran and Ritter (1995)), we find that calling firms significantly outperform their benchmark by a34% in the yearprior to the call. This figure is similar to market-adjusted performance of about 36% documby Loughran and Ritter (1995) for seasoned equity offers.
6 We also re-estimate our results after deleting calls that occur within a five-year period of a prior calby the same firm. The results are qualitatively indistinguishable from those reported in the tables.
7 Consistent with previous studies, the mean two-day(−1,0) call announcement period CAR for our sampof −1.11% is significant at the 1% level.
264 S. Datta et al. / Journal of Financial Intermediation 12 (2003) 255–276
e
e
st andesum
ichobserved
r five-BM),d untilfiscalBM
#60)
Table 3Distribution of five-year buy-and-hold returns
A. Five-year BHRs for calling firms and their matched control firms
Sample firms Matched firms Differenc
Minimum −95.46 −77.40 −18.06Q1 −14.79 37.74 −52.53Median 38.28 102.48 −64.20***
Q3 110.02 179.91 −69.89Maximum 1204.05 699.86 504.19Mean 85.82 123.49 −37.67**
B. Yearly following convertible bond calls, 1975–1992
Year 1 Year 2 Year 3 Year 4 Year 5
Sample firm 6.27 2.51 14.20 5.43 1.30(15.06) (6.23) (23.61) (11.03) (10.91)
Matched firm 9.08 13.33 21.52 18.35 6.80(21.47) (19.22) (27.04) (18.38) (15.94)
Difference −2.81 −10.82 −7.32 −12.92 −5.50(−6.41) (−12.99) (−3.43) (−7.35) (−5.03)
Wilcoxon Z −2.02** −3.04*** −1.48 −2.39** −1.49t-statistic −1.21 −3.06*** −0.61 −1.47 −1.00Bootstrapped 0.05 0.00 0.29 0.03 0.31p-value (0.09) (0.00) (0.82) (0.07) (0.33)Sample size 170 167 161 160 156
C. Five-year BHRs for non-calling firms and their matched control firms(N = 137)
Sample firms Matched firms Differenc
Minimum 1.53 1.73 −0.20Q1 87.50 87.18 0.32Median 142.74 142.65 0.09Q3 213.14 192.97 20.17Maximum 1583.20 523.04 1060.16Mean 166.98 148.42 18.56
Notes. In panel A, thep-value for difference between medians is 0.00 using both the Wilcoxon rank sum tethe bootstrap method. Thep-value for the difference between means is 0.03 using thet-test, and 0.01 using thbootstrap method. In panel C, thep-value for difference between medians is 0.55 using the Wilcoxon ranktest and 0.98 using the bootstrap method. Thep-value for the difference between means is 0.22 using thet-test,and 0.43 using the bootstrap method. The bootstrappedp-value is the proportion of 1000 observations for whthe absolute value of the recorded difference between medians (means) is greater than or equal to thedifference between the medians (means) of calling firms and their corresponding benchmark.
** Significance at the 5% level.*** Significance at the 1% level.
common stocks listed on the CRSP tape without any equity offerings during the prioyear period are ranked by their market capitalization (size), book-to-market ratio (and one-year pre-call stock return. Firm book value for a given fiscal year is not useat least four months after the end of the fiscal year (e.g., firms with a December 31year begin using the new book value for calculations done on or after April 30). Theratio is calculated by dividing the book equity value (COMPUSTAT annual data item
S. Datta et al. / Journal of Financial Intermediation 12 (2003) 255–276 265
he BMg themple
hatne-yearoten-ercents for
rms.cem-
eturnsed asalue
e BHRsbondrea-avoid
searchl Indexg thehosen
ty) isity. For
asonederfor-edian
nd notce of
(withnder-calledGravesamin-alysise pure
tibleecem-
rs havemissing
by the market capitalization (price per share times number of shares outstanding). Tratio for a sample firm is computed at the end of the month immediately precedincalendar month of the convertible call announcement. Each NYSE/AMEX listed safirm is matched with the first control firm from the pool of NYSE/AMEX firms such tthe sum of the absolute percentage difference between the size, BM ratio, and the opre-call return of the sample firm and the matched firm is minimized. The pool of ptial matching firms is constrained such that matched firms are not more than ten psmaller than their sample firms. We follow a similar procedure to choose matched firmNASDAQ-listed sample firms. In panel C, we report five-year BHRs for non-calling fiNon-calling firms are convertible bond issuers in SDC from January 1, 1975 to Deber 31, 1992 that do not call their in-the-money convertible bonds, and have daily ron CRSP and book equity values on COMPUSTAT. A convertible bond is classifibeing in-the-money if, following the call protection expiration date, the conversion vexceeds the sum of the call price plus accrued interest by at least 20%. We measurfor non-calling firms beginning on the non-call date, which is the date on which thebecomes in-the-money. Asquith and Mullins (1991) justify that a 20% premium is asonable trigger point for a bond to be called, which is perceived to be a safe buffer tounintentional redemption of the bond instead of the intended forced conversion. Webusiness news articles in the Dow Jones News Wires, and in the Wall Street Journato identify the issues that were not called for a period of at least five years followinnon-call date. The final sample consists of 137 non-calling firms. Matched firms are cbased on firm characteristics at the non-call date.
The underperformance for firms forcing conversion (or issuing backdoor equicomparable to results documented in earlier studies on firms issuing seasoned equexample, Spiess and Affleck-Graves (1995) report that the median firm issuing seequity underperforms its benchmark by 31.03%. Notably, our result of 64% underpmance by the median calling firm is similar to the 58% underperformance by the mSEO firm reported in Loughran and Ritter (1995, p. 30).
3.3. Long-run performance of firms choosing not to call
To be certain that the post-call underperformance can be attributed to the call asimply a continuation of the convertible debt offer effect, we compare the performanthe firms forcing conversion with those that choose not to call their in-the-moneyat least 20% premium over the conversion price) convertible bonds. If the post-call uperformance is a continuation of the post-offer effect, then both the called and non-bond samples should experience similar underperformance. Spiess and Affleck-(1999) and Lee and Loughran (1998) extrapolate the backdoor equity effect by exing the stock price performance following convertible debt offers. In contrast, our anenables us to cleanly capture the information content of convertible bond calls or th“backdoor equity effect” over the long horizon.
To obtain a sample of non-calling firms, we begin by identifying 1284 converdebt issues in the SDC database for our sample period from January 1, 1975 to Dber 31, 1992, that are not in our called convertible bond sample. Of these, 765 issuepermanent number (Permno) on the CRSP tapes. We exclude 145 issues due to
266 S. Datta et al. / Journal of Financial Intermediation 12 (2003) 255–276
ion, orCRSPertibledate,t leastmoneyd fol-squithbt is-
d in them thearlier.09 con-ata toms.
ancenaly-of theerfor-nd call.
not
bnormally
e debtpriorer. For
d book-ost-offerst-offerormancersionecond,r period
udies bylly call
n addi-findingsand clos-rmanceer but are
information on the call price, the coupon rate, the number of shares upon conversthe call protection expiration date. Of the remaining 620 issuers, we require thatdaily returns be available and that the convertible bonds be in-the-money. A convbond is classified as being in-the-money if, following the call protection expirationthe conversion value exceeds the sum of the call price plus accrued interest by a20%. For expositional ease, we refer to the date on which the bond becomes in-the-as the non-call date. The choice of 20% as our trigger point for a bond to be callelows from the evidence and justification presented in previous studies (see, e.g., Aand Mullins (1991), among others). This results in a sample of 445 convertible desuers. Next, we search business news articles in the Dow Jones News Wires, anWall Street Journal Index to identify the issues that were not called by checking froissuance date to maturity or five years following the non-call date, whichever is eThis step of the sample formation process results in the sample size decreasing to 2vertible debt issuers. Lastly, we require that the sample firms have COMPUSTAT dmeasure book-to-market ratios, which results in a final sample of 137 non-calling fir
Panel C of Table 3 shows that there is no abnormal long-run stock price performfor firms that decide not to call their in-the-money convertible bonds. Therefore, our asis clearly documents a significant difference between the stock price performancefirms that call and those that do not force conversion. This difference in stock price pmance between the two groups can be directly ascribed to the conversion-forcingboOur results indicate that the non-calling (delaying) firms, unlike the calling firms, dounderperform.8
3.4. Robustness tests using alternative benchmarks and long-run performance metrics
3.4.1. Cumulative abnormal returns: short-run and long-runTo test the robustness of our results, we use alternative benchmarks to measure a
stock price performance following convertible bond calls.9 In Table 4 we present month
8 We also examine the stock price performance of our sample of calling firms following the convertibloffer for the following two windows: (a) from convertible debt offer to five-year anniversary date, as done instudies, and (b) from convertible debt offer to five year anniversary date or call date, whichever is sooncomparability, following Spiess and Affleck-Graves (1999) and Lee and Loughran (1998), we use size anto-market matched controls as the benchmark to measure post-offer performance. For the five-year pperiod, we document that calling firms underperform their matched group by 83%; however, when poperformance is measured up to the call date or five-year anniversary whichever is sooner, the underperfis much smaller (−48%). We draw the following conclusions from these results. First, firms that force conveexperience two distinct effects—convertible debt offer effect and backdoor equity effect (or call effect). Sthe findings by previous studies overestimate the post-offer underperformance as their five-year post-offeoverlaps the call period for some firms. Finally, based on our results and those obtained by previous stSpiess and Affleck-Graves (1999) and Lee and Loughran (1998), we infer that firms that do not eventuatheir convertible issues may not underperform following theoffering.
9 Following Barber and Lyon (1997), we also use size-and-book-to-market-matched control firms. As ational robustness check, we apply the reference portfolio approach suggested by Lyon et al. (1999). Ourare highly robust to the use of these alternative benchmarks. Further, we use the closest-size matchedest book-to-market matched control firms as additional benchmarks. Again, our five-year post-call perforesults are robust to these benchmarks. For brevity’s sake, these results are not presented in the papavailable upon request.
S. Datta et al. / Journal of Financial Intermediation 12 (2003) 255–276 267
he long-turnsonthly
tock
es onlyortfolioturns,th is
mfortheonth
ass-ue
tisticalto beBHRsience ofs and
ed inmen-for
icee-yearfically,period
por-lete.
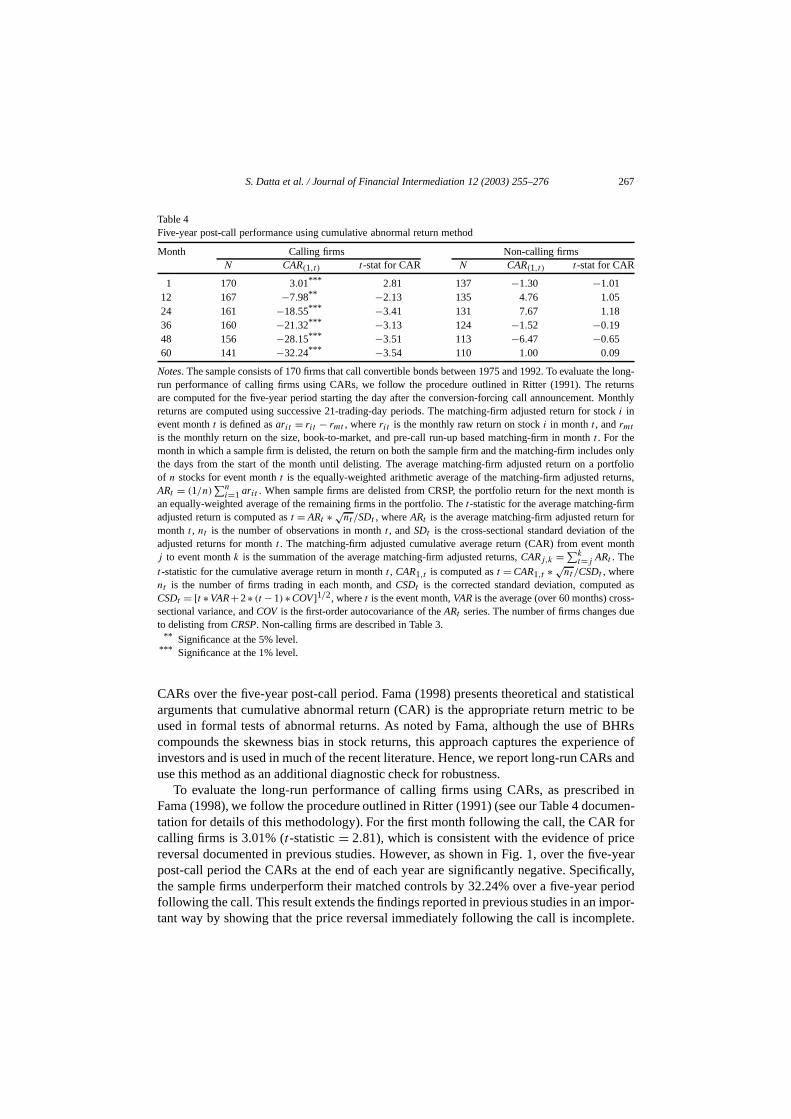
Table 4Five-year post-call performance using cumulative abnormal return method
Month Calling firms Non-calling firmsN CAR(1,t) t-stat for CAR N CAR(1,t) t-stat for CAR
1 170 3.01*** 2.81 137 −1.30 −1.0112 167 −7.98** −2.13 135 4.76 1.0524 161 −18.55*** −3.41 131 7.67 1.1836 160 −21.32*** −3.13 124 −1.52 −0.1948 156 −28.15*** −3.51 113 −6.47 −0.6560 141 −32.24*** −3.54 110 1.00 0.09
Notes. The sample consists of 170 firms that call convertible bonds between 1975 and 1992. To evaluate trun performance of calling firms using CARs, we follow the procedure outlined in Ritter (1991). The reare computed for the five-year period starting the day after the conversion-forcing call announcement. Mreturns are computed using successive 21-trading-day periods. The matching-firm adjusted return for si inevent montht is defined asarit = rit − rmt , whererit is the monthly raw return on stocki in montht , andrmt
is the monthly return on the size, book-to-market, and pre-call run-up based matching-firm in montht . For themonth in which a sample firm is delisted, the return on both the sample firm and the matching-firm includthe days from the start of the month until delisting. The average matching-firm adjusted return on a pof n stocks for event montht is the equally-weighted arithmetic average of the matching-firm adjusted reARt = (1/n)
∑ni=1 arit . When sample firms are delisted from CRSP, the portfolio return for the next mon
an equally-weighted average of the remaining firms in the portfolio. Thet-statistic for the average matching-firadjusted return is computed ast = ARt ∗ √
nt /SDt , whereARt is the average matching-firm adjusted returnmonth t , nt is the number of observations in montht , andSDt is the cross-sectional standard deviation ofadjusted returns for montht . The matching-firm adjusted cumulative average return (CAR) from event mj to event monthk is the summation of the average matching-firm adjusted returns,CARj,k = ∑k
t=j ARt . Thet-statistic for the cumulative average return in montht , CAR1,t is computed ast = CAR1,t ∗ √
nt /CSDt , wherent is the number of firms trading in each month, andCSDt is the corrected standard deviation, computedCSDt = [t ∗ VAR+ 2∗ (t − 1)∗ COV]1/2, wheret is the event month,VAR is the average (over 60 months) crossectional variance, andCOV is the first-order autocovariance of theARt series. The number of firms changes dto delisting fromCRSP. Non-calling firms are described in Table 3.
** Significance at the 5% level.*** Significance at the 1% level.
CARs over the five-year post-call period. Fama (1998) presents theoretical and staarguments that cumulative abnormal return (CAR) is the appropriate return metricused in formal tests of abnormal returns. As noted by Fama, although the use ofcompounds the skewness bias in stock returns, this approach captures the experinvestors and is used in much of the recent literature. Hence, we report long-run CARuse this method as an additional diagnostic check for robustness.
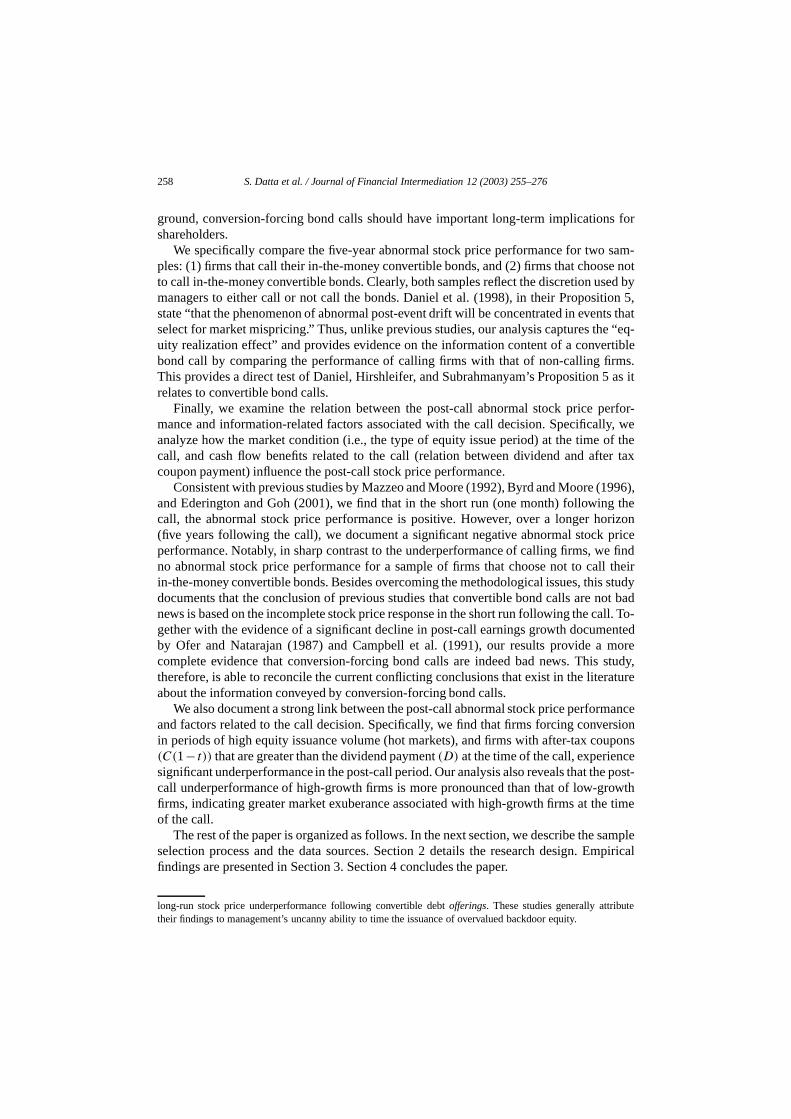
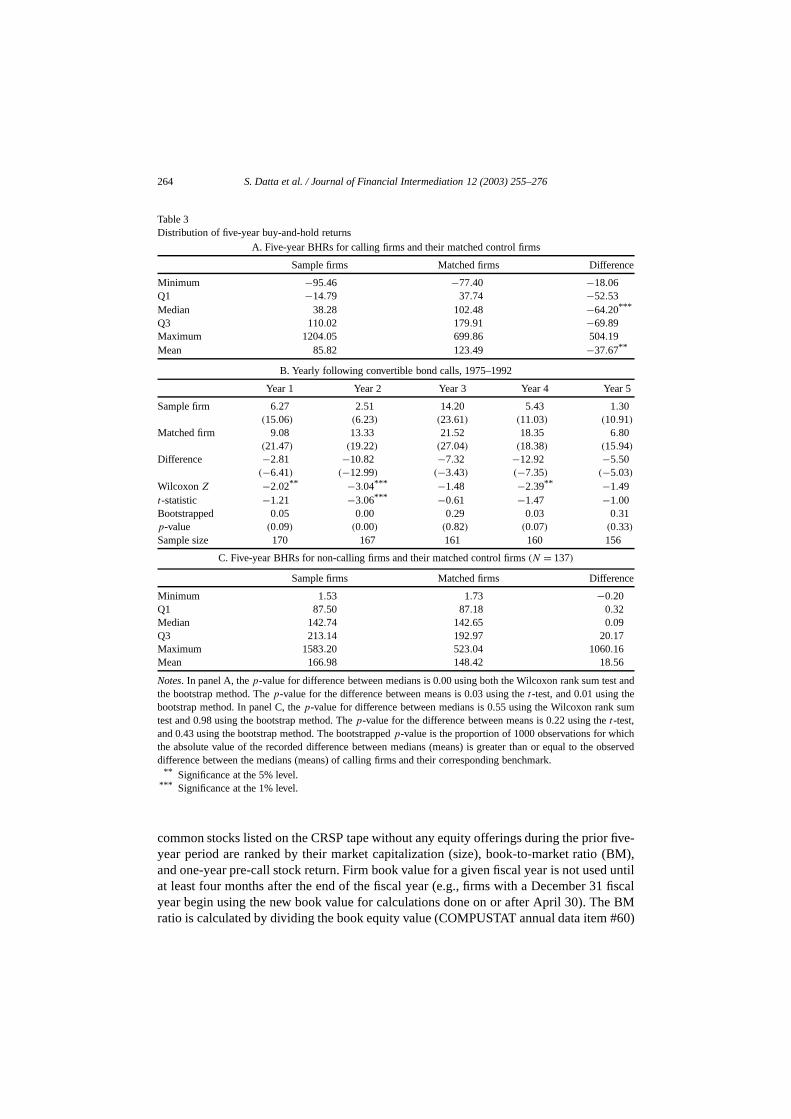
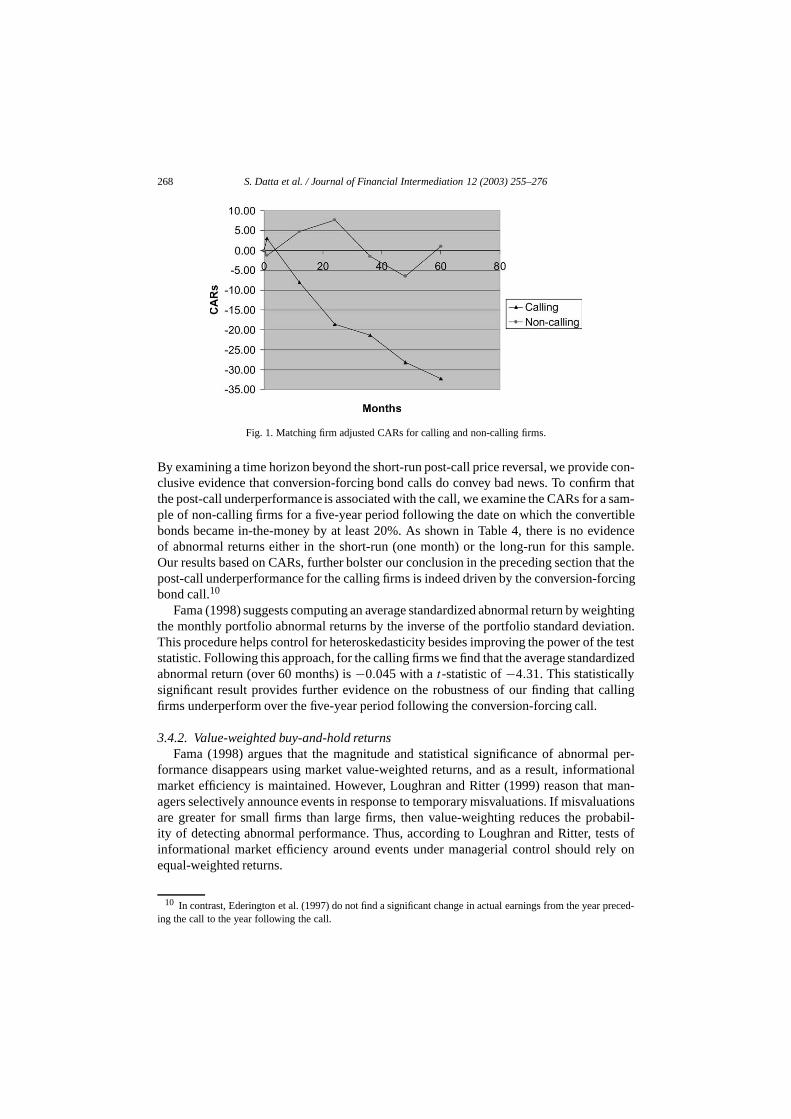
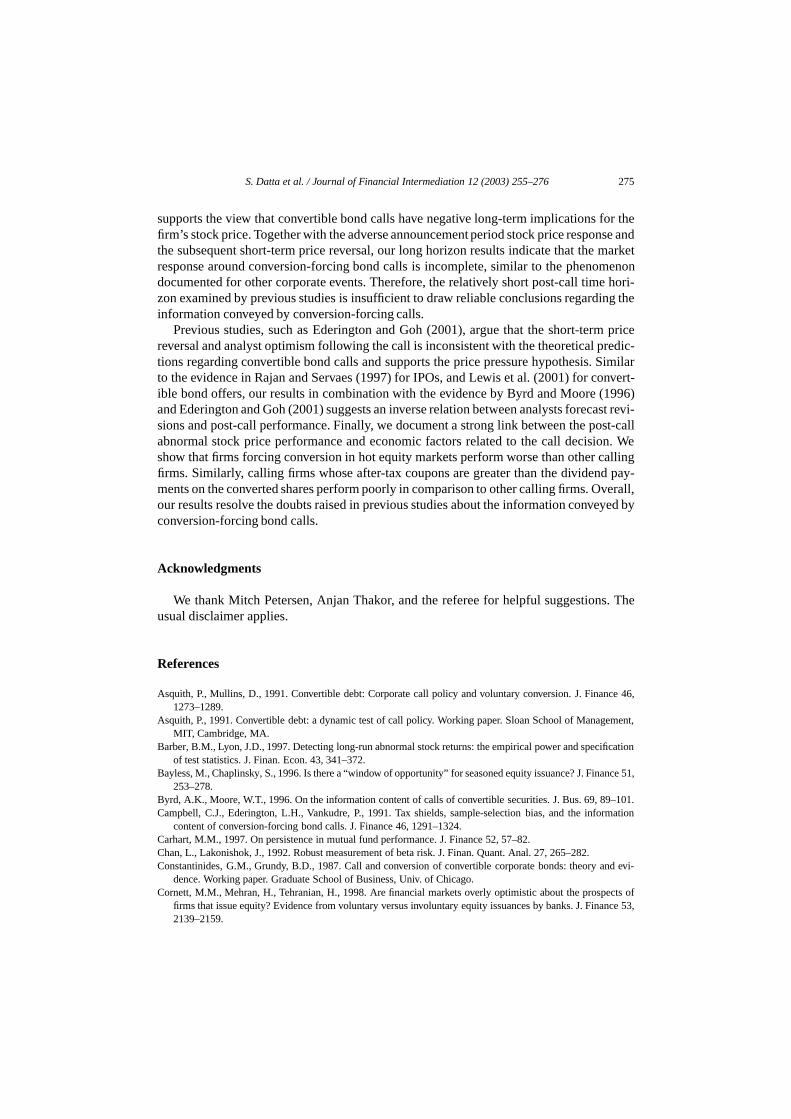
To evaluate the long-run performance of calling firms using CARs, as prescribFama (1998), we follow the procedure outlined in Ritter (1991) (see our Table 4 docutation for details of this methodology). For the first month following the call, the CARcalling firms is 3.01% (t-statistic= 2.81), which is consistent with the evidence of prreversal documented in previous studies. However, as shown in Fig. 1, over the fivpost-call period the CARs at the end of each year are significantly negative. Specithe sample firms underperform their matched controls by 32.24% over a five-yearfollowing the call. This result extends the findings reported in previous studies in an imtant way by showing that the price reversal immediately following the call is incomp
268 S. Datta et al. / Journal of Financial Intermediation 12 (2003) 255–276
e con-m thata sam-tibleidencemple.hat thercing
ightingtion.
he testrdized
alling
al per-ationalman-
uationsbabil-sts ofly on
preced-
Fig. 1. Matching firm adjusted CARs for calling and non-calling firms.
By examining a time horizon beyond the short-run post-call price reversal, we providclusive evidence that conversion-forcing bond calls do convey bad news. To confirthe post-call underperformance is associated with the call, we examine the CARs forple of non-calling firms for a five-year period following the date on which the converbonds became in-the-money by at least 20%. As shown in Table 4, there is no evof abnormal returns either in the short-run (one month) or the long-run for this saOur results based on CARs, further bolster our conclusion in the preceding section tpost-call underperformance for the calling firms is indeed driven by the conversion-fobond call.10
Fama (1998) suggests computing an average standardized abnormal return by wethe monthly portfolio abnormal returns by the inverse of the portfolio standard deviaThis procedure helps control for heteroskedasticity besides improving the power of tstatistic. Following this approach, for the calling firms we find that the average standaabnormal return (over 60 months) is−0.045 with at-statistic of−4.31. This statisticallysignificant result provides further evidence on the robustness of our finding that cfirms underperform over the five-year period following the conversion-forcing call.
3.4.2. Value-weighted buy-and-hold returnsFama (1998) argues that the magnitude and statistical significance of abnorm
formance disappears using market value-weighted returns, and as a result, informmarket efficiency is maintained. However, Loughran and Ritter (1999) reason thatagers selectively announce events in response to temporary misvaluations. If misvalare greater for small firms than large firms, then value-weighting reduces the proity of detecting abnormal performance. Thus, according to Loughran and Ritter, teinformational market efficiency around events under managerial control should reequal-weighted returns.
10 In contrast, Ederington et al. (1997) do not find a significant change in actual earnings from the yearing the call to the year following the call.
S. Datta et al. / Journal of Financial Intermediation 12 (2003) 255–276 269
rn ist, and
gnif-s isss of
y thee in-
lts, wend theRs
ept ofly
a five-gative
theor our.47%
he av-cantly
atchingy sig-
ditionmationd bond
Gravesmoreover-ould
ts, typ-unities
priord) are
We find that the value-weighted average five-year post-call buy-and-hold retu59.61% for our sample firms, as compared to 119.25% for the size, book-to-markepre-call run-up matched control firms. The difference of 59.64% is still statistically siicant with a bootstrappedp-value of 0.07. Thus, the underperformance of calling firmnot driven by poor performance of small firms in our sample, validating the robustneour results.
3.4.3. Non-control firm-based benchmarksTo check that our results indicating post-call underperformance are not driven b
superior performance of the control firms specific to our sample, and to minimize thfluence of cross-sectional dependence (Mitchell and Stafford (2000)) on our resumeasure abnormal performance using calendar-time portfolios of our sample firms aCarhart (1997) four-factor model.11 As an additional check, we also compare the BHfor our sample firms with those of the CRSP indices.
The calendar-time regressions using equal-weighted portfolios yield an interc−0.47 with a White’s (1980)t-statistic of−2.37. This translates into a negative monthabnormal return of 47 basis points, which is roughly 32.5%, when compounded overyear period. When we use value-weighted portfolios, the abnormal return is still ne(intercept of−0.41), but thet-statistic of−1.47 is no longer significant.
A comparison of the sample firms’ BHRs with that of the CRSP indices duringpost-call period shows that the mean (median) post-call BHR of 85.82% (38.28%) fsample firms is significantly less (at the 1% level) than the mean (median) BHR of 152(124.45%) for the CRSP equal-weighted index during the same period. Likewise, terage five-year post-call BHR on the CRSP value-weighted index, 81.38%, signifiexceeds the corresponding metric for our sample firms, 59.61%. Thet-statistic of the dif-ference is 8.59. These results, based on benchmarks that are not specific to our mfirm procedure, cement our finding that conversion-forcing bond calls are followed bnificant post-call stock price underperformance.
3.5. Cross-sectional variations in long-run post-call performance
In Table 5 we present five-year post-call BHRs partitioned by (a) the market conaround the call announcement (hot versus cold or normal markets), and (b) an inforvariable captured by the relation between the after-tax coupon payment of the calleand the firm’s current dividend at the time of the call announcement.
Recent studies, such as Loughran and Ritter (1995) and Spiess and Affleck-(1999), find that security offerings announced during hot markets are followed bysevere stock price underperformance compared to offerings in other periods. If thevaluation of ‘backdoor equity’ is highest during periods of market exuberance, one wexpect managers to time the convertible bond calls during such periods. Hot markeified by buoyancy and overoptimism, are expected to provide managers with opport
11 The sample firms are included in a given monthly portfolio if the bond call date occurs within thesixty months. The number of firms in each monthly portfolio ranges from 1 to 70. Our results (not reportevirtually similar using the Fama–French three-factor model.
270 S. Datta et al. / Journal of Financial Intermediation 12 (2003) 255–276
ter fors based
een theement.
ent
theedians
r coldns the
caledndinge-
etweeniod aretermineonthsat leastile. Allssified
me-entscon-
.73%me-
.91%gnif-partly,
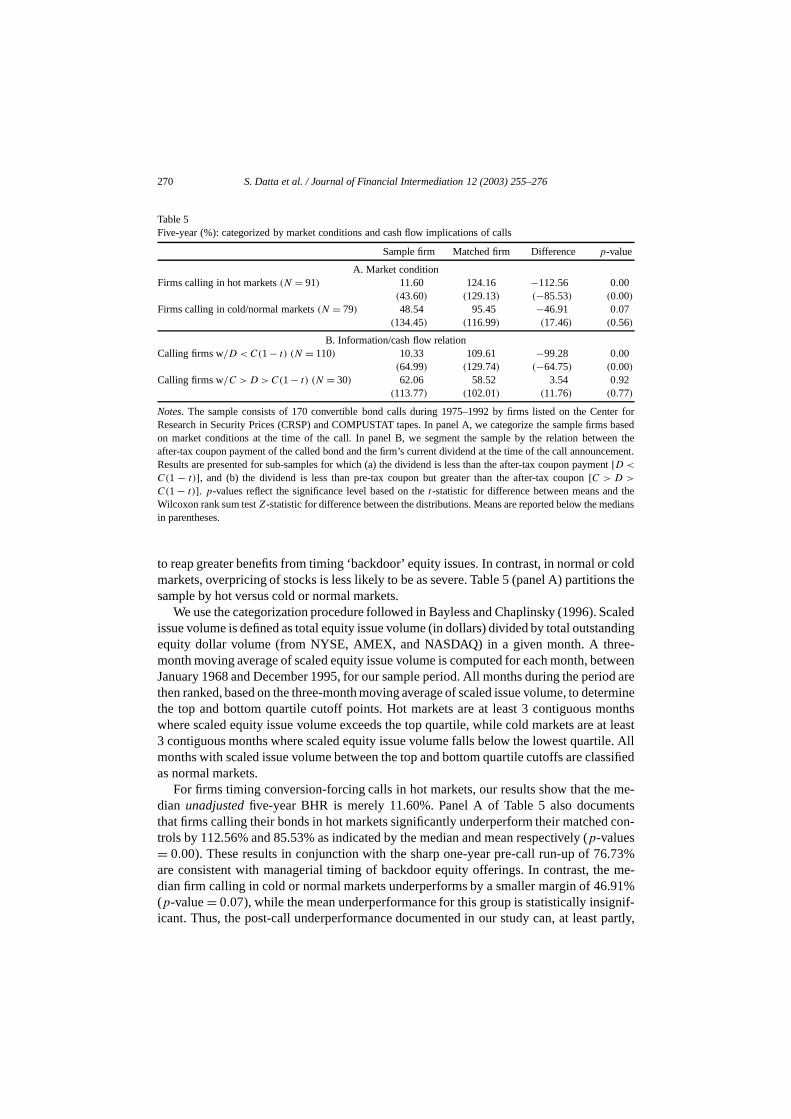
Table 5Five-year (%): categorized by market conditions and cash flow implications of calls
Sample firm Matched firm Difference p-value
A. Market conditionFirms calling in hot markets(N = 91) 11.60 124.16 −112.56 0.00
(43.60) (129.13) (−85.53) (0.00)Firms calling in cold/normal markets(N = 79) 48.54 95.45 −46.91 0.07
(134.45) (116.99) (17.46) (0.56)
B. Information/cash flow relationCalling firms w/D < C(1− t) (N = 110) 10.33 109.61 −99.28 0.00
(64.99) (129.74) (−64.75) (0.00)Calling firms w/C > D > C(1− t) (N = 30) 62.06 58.52 3.54 0.92
(113.77) (102.01) (11.76) (0.77)
Notes. The sample consists of 170 convertible bond calls during 1975–1992 by firms listed on the CenResearch in Security Prices (CRSP) and COMPUSTAT tapes. In panel A, we categorize the sample firmon market conditions at the time of the call. In panel B, we segment the sample by the relation betwafter-tax coupon payment of the called bond and the firm’s current dividend at the time of the call announcResults are presented for sub-samples for which (a) the dividend is less than the after-tax coupon paym[D <
C(1 − t)], and (b) the dividend is less than pre-tax coupon but greater than the after-tax coupon[C > D >
C(1 − t)]. p-values reflect the significance level based on thet-statistic for difference between means andWilcoxon rank sum testZ-statistic for difference between the distributions. Means are reported below the min parentheses.
to reap greater benefits from timing ‘backdoor’ equity issues. In contrast, in normal omarkets, overpricing of stocks is less likely to be as severe. Table 5 (panel A) partitiosample by hot versus cold or normal markets.
We use the categorization procedure followed in Bayless and Chaplinsky (1996). Sissue volume is defined as total equity issue volume (in dollars) divided by total outstaequity dollar volume (from NYSE, AMEX, and NASDAQ) in a given month. A thremonth moving average of scaled equity issue volume is computed for each month, bJanuary 1968 and December 1995, for our sample period. All months during the perthen ranked, based on the three-month moving average of scaled issue volume, to dethe top and bottom quartile cutoff points. Hot markets are at least 3 contiguous mwhere scaled equity issue volume exceeds the top quartile, while cold markets are3 contiguous months where scaled equity issue volume falls below the lowest quartmonths with scaled issue volume between the top and bottom quartile cutoffs are claas normal markets.
For firms timing conversion-forcing calls in hot markets, our results show that thedian unadjusted five-year BHR is merely 11.60%. Panel A of Table 5 also documthat firms calling their bonds in hot markets significantly underperform their matchedtrols by 112.56% and 85.53% as indicated by the median and mean respectively (p-values= 0.00). These results in conjunction with the sharp one-year pre-call run-up of 76are consistent with managerial timing of backdoor equity offerings. In contrast, thedian firm calling in cold or normal markets underperforms by a smaller margin of 46(p-value= 0.07), while the mean underperformance for this group is statistically insiicant. Thus, the post-call underperformance documented in our study can, at least

S. Datta et al. / Journal of Financial Intermediation 12 (2003) 255–276 271
uring
tchedcalledcally,ouponthan
ullins
a callt future
e vol-
trper-
y andcet me-e-year
forcingnce.whichgs
91),fore,and/ore two-
run,ms doe
rll et al.
as thee match
be attributed to the opportunistic behavior of managers issuing “backdoor equity” dperiods of overoptimism and buoyancy in the market.12
Panel B of Table 5 presents the five-year BHRs for calling firms and their macontrols partitioned by the relation between the after-tax coupon payment of thebond and the firm’s current dividend at the time of the call announcement. Specifiwe segment the sample in two groups: (a) the dividend is less than the after-tax cpayment[D < C(1− t)], and (b) the dividend is less than pre-tax coupon but greaterthe after-tax coupon[C > D > C(1− t)].13
Constantinides and Grundy (1987), Campbell et al. (1991), and Asquith and M(1991) argue that a firm that delays calling a bond whenD < C(1 − t) believes that fu-ture increases in the dividend will offset the current cash-flow disadvantage. Thus,under this scenario can be interpreted to mean that management does not expeccash flows to be high enough to justify an increase in dividends that would inducuntary conversion. Consistent with this view, we find that the average two-day(−1,0)
call announcement period CARs for firms withD < C(1 − t) is a statistically significan−1.60%. In the long run, the median (mean) BHR indicates that calling firms undeform their matched controls over the five-year post-call period by an economicallstatistically significant 99.28% (64.75%) withp-values of 0.00. The underperformanusing the CRSP value-weighted index as the benchmark is similar, with a significandian underperformance of 69.46%. Notably, the documented pattern of a sharp onpre-call run-up of 66.87% followed by a five-year post-callraw BHR of only 10.33% forthis sub-sample provides further evidence supporting the argument that conversion-calls by firms withD < C(1 − t) convey bad news about expected future performaThese results are consistent with the empirical evidence in Campbell et al. (1991),shows that calling firms withD < C(1 − t) experience substantial declines in earningrowth rates following the call announcement.
WhenC > D > C(1 − t), Constantinides and Grundy (1987), Campbell et al. (19and Asquith and Mullins (1991) argue that a firm has little incentive to call. Therea conversion-forcing call conveys a signal that management expects the dividendstock price to decrease. Consistent with this hypothesis, we find that the averagday announcement-period CAR for a sub-sample of 30 firms withC > D > C(1 − t)
is −1.61%, which is statistically significant at the 1% level. However, in the long-we do not detect any abnormal performance for these firms. The fact that these firnot underperform while firms withD < C(1 − t) perform poorly is inconsistent with thpredictions in previous studies, that a conversion-forcing call by firms withD > C(1 − t)
is a stronger negative signal than a call by firms withD < C(1 − t). Nevertheless, oufindings can be interpreted as being consistent with the empirical results in Campbe(1991), who document that the decline in earnings growth for firms withD > C(1 − t) isless severe than the corresponding decline experienced by firms withD < C(1− t). Given
12 When we compare the sample raw BHR with the BHR of the CRSP value-weighted index as wellCRSP equally-weighted index, the underperformance results are very similar to those obtained with thcontrol firms indicating that our findings are robust.
13 Following Asquith and Mullins (1991), we use a 46% marginal tax rate.
272 S. Datta et al. / Journal of Financial Intermediation 12 (2003) 255–276
at the
“mop-ample
d long-
anceaturalural
ummyin a
ion co-thatcolduingd rela-999)
the in-d andance.
two
after-ethe in-
pre-tax
-n
by afu-
en to-re
firms’m
that the size of this sub-sample is small (with only 30 observations), we believe thlong-run results for firms withD > C(1− t) should be interpreted with caution.
Finally, when the dividend is larger than the coupon payment,D > C, investors haveincentive to convert voluntarily. In this instance, firms call the outstanding bonds as aup” operation and, therefore, such a call should not constitute a signal. For this sub-sof 11 firms, the average two-day announcement period CAR and the match-adjusterun BHR are not significantly different from zero.
3.6. Multivariate regression analysis
In Table 6, we apply regression analysis to explain the long-run stock price performfollowing convertible bond calls. The dependent variable, LAR, is defined as the nlogarithm of (1+ the five-year buy and hold return for the calling firm) minus the natlogarithm of (1+ the five-year buy and hold return for the control firm).
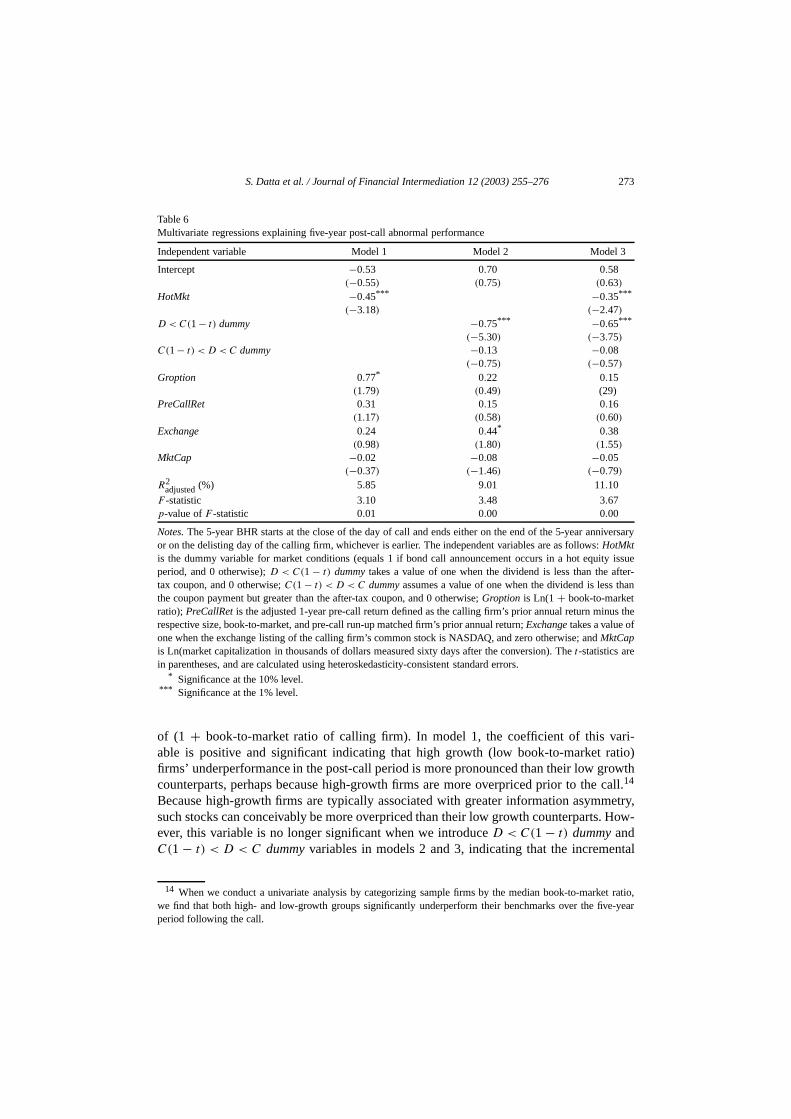
To capture market conditions at the time of the call we use, in models 1 and 3, a dvariable,Hotmkt, which takes a value of one when the call announcement occurshot market, and zero otherwise. Corroborating our univariate results, the regressefficients forHotmkt in both models are significantly negative, indicating that firmscall their bonds in hot markets underperform more than firms forcing conversion inor normal markets. In a similar vein, Loughran and Ritter (1995) find that firms issequity in periods of high issue volume underperform severely in the post-issue periotive to firms issuing in periods of light issuance activity. Spiess and Affleck-Graves (1document a similar result for their sample of convertible debt offerings.
Based on the arguments outlined in the preceding section, we examine whetherformation conveyed by the relation between the coupon payment of the called bonthe firm’s current dividend has any influence on the post-call stock price performWe consider three possible scenarios for our multivariate analysis: (a)D < C(1 − t),(b) C(1− t) < D < C, and (c)D > C. To capture these three scenarios we constructdummy variables,D < C(1 − t) dummy andC(1 − t) < D < C dummy. D < C(1 − t)
dummy is a variable that takes a value of one when the dividend is less than thetax coupon and zero otherwise.C(1 − t) < D < C dummy takes a value of one when thdividend is greater than the after-tax coupon but less than the pre-tax coupon. Thus,tercept represents the group of firms that call when the dividend is greater than thecoupon.
We find that the coefficients ofD < C(1 − t) dummy in models 2 and 3 are significantly negative indicating that calling firms withD < C(1 − t) underperform more thafirms with D > C. However, the coefficients ofC(1 − t) < D < C dummy are not sig-nificant in either model. The insignificance of this variable implies that a bond callfirm with C(1 − t) < D < C does not convey a negative signal concerning the firm’sture stock price performance. Campbell et al. (1991) document that calling firms withD <
C(1 − t) experience the largest decline in earnings growth rate after the call. Takgether, these findings suggest that firms withD < C(1 − t) experience the most sevestock price underperformance and the largest earnings growth decline.
To examine whether post-call stock price performance differs based on callinggrowth opportunities, we include a variableGroption, defined as the natural logarith
S. Datta et al. / Journal of Financial Intermediation 12 (2003) 255–276 273
iversary
y issuefter-than
us thef
ri-atio)rowthcall.etry,
. How-
ntal
t ratio,e-year
Table 6Multivariate regressions explaining five-year post-call abnormal performance
Independent variable Model 1 Model 2 Model 3
Intercept −0.53 0.70 0.58(−0.55) (0.75) (0.63)
HotMkt −0.45*** −0.35***
(−3.18) (−2.47)D < C(1− t) dummy −0.75*** −0.65***
(−5.30) (−3.75)C(1− t) < D < C dummy −0.13 −0.08
(−0.75) (−0.57)Groption 0.77* 0.22 0.15
(1.79) (0.49) (29)PreCallRet 0.31 0.15 0.16
(1.17) (0.58) (0.60)Exchange 0.24 0.44* 0.38
(0.98) (1.80) (1.55)MktCap −0.02 −0.08 −0.05
(−0.37) (−1.46) (−0.79)R2
adjusted(%) 5.85 9.01 11.10
F -statistic 3.10 3.48 3.67p-value ofF -statistic 0.01 0.00 0.00
Notes. The 5-year BHR starts at the close of the day of call and ends either on the end of the 5-year annor on the delisting day of the calling firm, whichever is earlier. The independent variables are as follows:HotMktis the dummy variable for market conditions (equals 1 if bond call announcement occurs in a hot equitperiod, and 0 otherwise);D < C(1 − t) dummy takes a value of one when the dividend is less than the atax coupon, and 0 otherwise;C(1− t) < D < C dummy assumes a value of one when the dividend is lessthe coupon payment but greater than the after-tax coupon, and 0 otherwise;Groption is Ln(1 + book-to-marketratio); PreCallRet is the adjusted 1-year pre-call return defined as the calling firm’s prior annual return minrespective size, book-to-market, and pre-call run-up matched firm’s prior annual return;Exchange takes a value oone when the exchange listing of the calling firm’s common stock is NASDAQ, and zero otherwise; andMktCapis Ln(market capitalization in thousands of dollars measured sixty days after the conversion). Thet-statistics arein parentheses, and are calculated using heteroskedasticity-consistent standard errors.
* Significance at the 10% level.*** Significance at the 1% level.
of (1 + book-to-market ratio of calling firm). In model 1, the coefficient of this vaable is positive and significant indicating that high growth (low book-to-market rfirms’ underperformance in the post-call period is more pronounced than their low gcounterparts, perhaps because high-growth firms are more overpriced prior to the14
Because high-growth firms are typically associated with greater information asymmsuch stocks can conceivably be more overpriced than their low growth counterpartsever, this variable is no longer significant when we introduceD < C(1 − t) dummy andC(1 − t) < D < C dummy variables in models 2 and 3, indicating that the increme
14 When we conduct a univariate analysis by categorizing sample firms by the median book-to-markewe find that both high- and low-growth groups significantly underperform their benchmarks over the fivperiod following the call.
274 S. Datta et al. / Journal of Financial Intermediation 12 (2003) 255–276
y for
maying the
f thiss is
ce ons
ollars,ither offirms(1999)ficant
ssionse fromthe
aviv’ssive
dverseost-callnews.of priordverse
al docu-ut the
, weby ant, weo calltweendence
without
explanatory power of the variable diminishes when we control for factors that proxinformation content of the call.
As implied by DeBondt and Thaler (1987), the underperformance of calling firmsbe due to long-term mean reversion of stock returns. We address this issue by includone-year pre-call return as a control variable in the regression. This variable,PreCallRet,is computed as the calling firm’s annual return preceding the call. The coefficient ovariable is insignificant, indicating that the post-call underperformance of calling firmnot attributable to mean reversion.15
We investigate whether exchange-listing or market capitalization has any influenlong-run post-call returns by including two additional variables:Exchange, which assumea value of one if the stock is NASDAQ-listed and zero otherwise, andMktCap, definedas the natural log of market capitalization of the firm, measured in thousands of d60 days following the call announcement date. As our estimates show, in general, nethese variables is statistically significant indicating that underperformance of callingis invariant to these two factors. Our results corroborate Spiess and Affleck-Gravesfinding for a sample of convertible debt offering firms that underperformance is signiregardless of the exchange-listing.
Following the approach in Chan and Lakonishok (1992), we re-estimate the regrein Table 6 using the Koenker and Bassett (1978) robust regression technique. Asidthe substantial improvement in adjustedR-squares, we find (in unreported results) thatcoefficients of the information content proxies (HotMkt andD < C(1 − t) dummy) arestable and highly significant.
4. Summary and conclusions
The voluminous literature spawned over the two decades since Harris and R(1985) article on the signaling implication of convertible bond calls provides inconcluand contradictory evidence. While the event studies clearly document a significant astock price response to convertible bond calls, some recent studies examining pstock price performance conclude that conversion-forcing calls do not convey badUsing research design and methodology that circumvent the inherent weaknessesstudies, we present new evidence that resolves the conflicting interpretations of the astock price response at the announcement and the short-term post-call price reversmented in prior studies. This study provides relatively unambiguous conclusions aboinformation conveyed by convertible bond calls.
For a sample of “in-the-money” convertible bond calls made during 1975–1992document that calling firms substantially underperform their matched benchmarksaverage (median) of 64% in the five-year period following the call. In sharp contrasfind no abnormal stock price performance for a sample of firms that choose not ttheir in-the-money convertible bonds. This difference in stock price performance bethe two groups can be directly ascribed to the conversion-forcing bond call. This evi
15 We find that our conclusions are maintained when we re-estimate all regression models in Table 6PreCallRet.
S. Datta et al. / Journal of Financial Intermediation 12 (2003) 255–276 275
or these and
marketmenone hori-ng the
priceedic-Similarnvert-996)ast revi-st-calln. We
allingpay-
verall,yed by
s. The
ce 46,
ement,
fication
nce 51,
–101.rmation
nd evi-
ects ofnce 53,
supports the view that convertible bond calls have negative long-term implications ffirm’s stock price. Together with the adverse announcement period stock price responthe subsequent short-term price reversal, our long horizon results indicate that theresponse around conversion-forcing bond calls is incomplete, similar to the phenodocumented for other corporate events. Therefore, the relatively short post-call timzon examined by previous studies is insufficient to draw reliable conclusions regardiinformation conveyed by conversion-forcing calls.
Previous studies, such as Ederington and Goh (2001), argue that the short-termreversal and analyst optimism following the call is inconsistent with the theoretical prtions regarding convertible bond calls and supports the price pressure hypothesis.to the evidence in Rajan and Servaes (1997) for IPOs, and Lewis et al. (2001) for coible bond offers, our results in combination with the evidence by Byrd and Moore (1and Ederington and Goh (2001) suggests an inverse relation between analysts forecsions and post-call performance. Finally, we document a strong link between the poabnormal stock price performance and economic factors related to the call decisioshow that firms forcing conversion in hot equity markets perform worse than other cfirms. Similarly, calling firms whose after-tax coupons are greater than the dividendments on the converted shares perform poorly in comparison to other calling firms. Oour results resolve the doubts raised in previous studies about the information conveconversion-forcing bond calls.
Acknowledgments
We thank Mitch Petersen, Anjan Thakor, and the referee for helpful suggestionusual disclaimer applies.
References
Asquith, P., Mullins, D., 1991. Convertible debt: Corporate call policy and voluntary conversion. J. Finan1273–1289.
Asquith, P., 1991. Convertible debt: a dynamic test of call policy. Working paper. Sloan School of ManagMIT, Cambridge, MA.
Barber, B.M., Lyon, J.D., 1997. Detecting long-run abnormal stock returns: the empirical power and speciof test statistics. J. Finan. Econ. 43, 341–372.
Bayless, M., Chaplinsky, S., 1996. Is there a “window of opportunity” for seasoned equity issuance? J. Fina253–278.
Byrd, A.K., Moore, W.T., 1996. On the information content of calls of convertible securities. J. Bus. 69, 89Campbell, C.J., Ederington, L.H., Vankudre, P., 1991. Tax shields, sample-selection bias, and the info
content of conversion-forcing bond calls. J. Finance 46, 1291–1324.Carhart, M.M., 1997. On persistence in mutual fund performance. J. Finance 52, 57–82.Chan, L., Lakonishok, J., 1992. Robust measurement of beta risk. J. Finan. Quant. Anal. 27, 265–282.Constantinides, G.M., Grundy, B.D., 1987. Call and conversion of convertible corporate bonds: theory a
dence. Working paper. Graduate School of Business, Univ. of Chicago.Cornett, M.M., Mehran, H., Tehranian, H., 1998. Are financial markets overly optimistic about the prosp
firms that issue equity? Evidence from voluntary versus involuntary equity issuances by banks. J. Fina2139–2159.

276 S. Datta et al. / Journal of Financial Intermediation 12 (2003) 255–276
d over-
-related
. Finan.
onality.
nage-
6.1263–
3, 301–
.e debt:
1–389.turns.
ptions.
calls.
, 287–
aling
equity
. J. Fi-
skedas-
Daniel, K., Hirshleifer, D., Subrahmanyam, A., 1998. Investor psychology and security market under- anreactions. J. Finance 53, 1839–1885.
Dann, L.Y., Mikkelson, W.H., 1984. Convertible debt issuance, capital structure change and financinginformation. J. Finan. Econ. 13, 157–186.
Datta, S., Iskandar-Datta, M., 1996. New evidence on the valuation effects of convertible bond calls. JQuant. Anal. 31, 295–307.
DeBondt, W.F.M., Thaler, R.H., 1987. Further evidence on investor overreaction and stock market seasJ. Finance 42, 557–581.
Ederington, L.H., Caton, G.L., Campbell, C.J., 1997. To call or not to call convertible debt. Financial Mament 26, 22–31.
Ederington, L.H., Goh, J.C., 2001. Is a convertible bond call really bad news? J. Bus. 74, 459–476.Fama, E.F., French, K.R., 1992. The cross-section of expected stock returns. J. Finance 47, 427–465.Fama, E., 1998. Market efficiency, long-term returns, and behavioral finance. J. Finan. Econ. 49, 283–30Harris, M., Raviv, A., 1985. A sequential signaling model of convertible debt call policy. J. Finance 40,
1281.Kothari, S.P., Warner, J.B., 1997. Measuring long-horizon security price performance. J. Finan. Econ. 4
309.Koenker, R., Bassett, G., 1978. Regression quantiles. Econometrica 46, 33–50.La Porta, R., 1996. Expectations and the cross-section of stock returns. J. Finance 51, 1715–1742.Lee, I., 1997. Do firms knowingly sell overvalued equity? J. Finance 52, 1439–1466.Lee, I., Loughran, T., 1998. Performance following convertible debt issuance. J. Corp. Finan. 4, 185–207Lewis, C.M., Rogalski, R.J., Seward, J.K., 2001. The long-run performance of firms that issue convertibl
an empirical analysis of operating characteristics and analyst forecasts. J. Corp. Finan. 7, 447–474.Loughran, T., Ritter, J.R., 1995. The new issues puzzle. J. Finance 50, 23–51.Loughran, T., Ritter, J.R., 1999. Uniformly least powerful tests of market efficiency. J. Finan. Econ. 55, 36Lyon, J.D., Barber, B.M., Tsai, C.-L., 1999. Improved methods for tests of long-run abnormal stock re
J. Finance 54, 165–201.Mayers, D., 1998. Why firms issue convertible bonds: The matching of financial and real investment o
J. Finan. Econ. 47, 83–102.Mazzeo, M.A., Moore, W.T., 1992. Liquidity costs and stock price response to convertible security
J. Bus. 65, 353–369.Mikkelson, W.H., 1981. Convertible calls and security returns. J. Finan. Econ. 9, 237–264.Mitchell, M., Stafford, E., 2000. Managerial decisions and long-term stock price performance. J. Bus. 73
320.Ofer, A.R., Natarajan, A., 1987. Convertible call policies: An empirical analysis of an information-sign
hypothesis. J. Finan. Econ. 19, 91–108.Rajan, R., Servaes, H., 1997. Analyst following of initial public offerings. J. Finance 52, 507–529.Ritter, J.R., 1991. The long-run performance of initial public offerings. J. Finance 46, 3–27.Spiess, D.K., Affleck-Graves, J., 1995. Underperformance in long-run stock returns following seasoned
offerings. J. Finan. Econ. 38, 243–267.Spiess, D.K., Affleck-Graves, J., 1999. The long-run performance of stock returns following debt offerings
nan. Econ. 54, 45–73.Stein, J.C., 1992. Convertible bonds as backdoor equity financing. J. Finan. Econ. 32, 3–22.White, H., 1980. A heteroskedasticity-consistent covariance matrix estimator and a direct test for hetero
ticity. Econometrica 48, 817–838.