Convertible Bond Pricing: Renegotiable Covenants ... · PDF fileConvertible Bond Pricing:...
44
Convertible Bond Pricing: Renegotiable Covenants, Seasoning and Convergence * by Alex W.H. Chan The University of Hong Kong and Nai-fu Chen University of California, Irvine September 6, 2004. JEL classification: G12, G13, G14 Keywords: Convertible bond, credit risk, valuation * We are grateful to Tom Berglund, Jane Buchan, Ashley Wang, Fan Yu and seminar participants at the Swedish School of Economics and UC Irvine for helpful comments, Teimur Abasov for research assistance and the financial support from Hong Kong RGC earmarked research grant HKU7137/02H. Corresponding author: Chan is from the School of Economics and Finance, The University of Hong Kong, K.K.Leung Building, Pokfulam Road, Hong Kong. Tel: (852)-2857-8510, Fax: (852)-2548-1152, and Email: [email protected] . Chen is from the Graduate School of Management, University of California, Irvine, CA92697. Email: [email protected] .
Transcript of Convertible Bond Pricing: Renegotiable Covenants ... · PDF fileConvertible Bond Pricing:...
Convertible Bond Pricing: Renegotiable Covenants,
Seasoning and Convergence*
by
Alex W.H. Chan
The University of Hong Kong
and
Nai-fu Chen
University of California, Irvine
September 6, 2004.
JEL classification: G12, G13, G14
Keywords: Convertible bond, credit risk, valuation
* We are grateful to Tom Berglund, Jane Buchan, Ashley Wang, Fan Yu and seminar participants at the Swedish School of
Economics and UC Irvine for helpful comments, Teimur Abasov for research assistance and the financial support from Hong Kong RGC earmarked research grant HKU7137/02H.
Corresponding author: Chan is from the School of Economics and Finance, The University of Hong Kong, K.K.Leung Building, Pokfulam Road, Hong Kong. Tel: (852)-2857-8510, Fax: (852)-2548-1152, and Email: [email protected].
Chen is from the Graduate School of Management, University of California, Irvine, CA92697. Email: [email protected].

i
Convertible Bond Pricing: Renegotiable Covenants,
Seasoning and Convergence
Abstract
We investigate the mispricing of US convertible bonds and provide an explanation to the
long-standing puzzle about their undervaluation. Our main result shows that seasoned
convertible bond prices do converge to their theoretical prices conditional on no rating
downgrades. We hypothesize that the observed underpricing is induced by the possibility that a
convertible bond might renegotiate on some of its covenants, e.g., an imbedded put option, in
financial difficulties. The initial underpricing is larger for lower rated bonds. The underpricing
worsens if the issuer experiences subsequent financial difficulties; otherwise, the bond price
converges to the theoretical price within two years. This seasoning period is shorter for higher
rated convertible bonds.
1
1. Introduction
The underpricing of convertible bonds has been a long-standing puzzle in the finance
literature. This phenomenon is also well known in the industry and has become the basis for a
popular hedge fund strategy often referred to as “convertible arbitrage.” There are numerous
reports on this popular arbitrage strategy in the financial presses, for example,
“…hedge funds, experts at arbitraging, seek to make money from differences in the price of the convertible bond and the price of the equity…the bond’s valuation must be attractive.” Traders Magazine (August 2000)
“Funds specialising in convertible arbitrage – buying a company’s convertible bonds and shorting its common shares – had the highest inflow (of funds in second quarter of 2003 among the different hedge fund strategies)” Financial Times (August 20, 2003).
In recent years, the size of the US convertible market has grown to be about 60% of the
US high yield market (approximately US$0.5 trillion, Lehman Brothers). The success of the
convertible bond market has generated significant academic research interest in the pricing of
convertible bonds. While many theoretical pricing models for convertible bonds have been
developed, the number of extensive empirical studies on the market pricing of convertible bonds
remains small. This deficiency is probably due to the complexity of the computations necessary
for the multiple contractual features of a typical convertible bond. Our study is an effort to
provide a more comprehensive investigation on the pricing of US convertible bonds.
Ingersoll (1977a) and Brennan and Schwartz (1977) apply a contingent claim approach to
price convertible bonds using firm value as the underlying variable. Brennan and Schwartz
(1980) further extend the convertible bond model with a stochastic interest rate process, but
conclude that the improvement from the incorporation of a stochastic interest rate is very small
for the pricing and suggest that stochastic interest rates can be ignored for empirical purposes.
Similar to Brennan and Schwartz, Buchan (1998b) builds a convertible bond pricing model with
firm value and interest rates as the underlying variables. She integrates a “safety premium” in the
firm’s actual call policy, analyzes the existence of call protections and proposes a modified
Monte Carlo procedure to numerically solve for the convertible bond price.
2
The advantage of using firm value as the underlying variable in a contingent claim
approach is that it can endogenously take into account of the default risk. But, as firm value is
not a traded asset, its market price cannot be easily measured. To price convertible bond with
this approach also requires simultaneously valuing all other more senior liabilities of the issuer.
In view of this practical difficulty, McConnell and Schwartz (1986) propose a pragmatic
approach to price convertible bonds with stock price as the underlying variable. They suggest
using the current credit rating and the contemporaneous market credit risk-adjusted interest rate
to take into account of the conditional default on the pricing of convertible bonds. Tsiveriotis
and Fernandes (1998) extend the approach of McConnell and Schwartz by modeling the
convertible bond as a portfolio consisting of a straight bond component and a stock component.
They derive a partial differential equation for each of the two components and solve the two
equations simultaneously for the convertible bond price. Takahashi, Kobayashi and Nakagawa
(2001) propose a method to value convertible bond using stock price as the underlying variable
and take into consideration of default risk with a reduced-form approach derived from Duffie
and Singleton (1999). In all these studies, the conditional default effects are taken into account
either explicitly in the modeling or implicitly in the prevailing market credit risk-adjusted
interest rates.
Empirically, King (1986) studies the pricing of US convertible bonds using firm value as
the underlying variable. He finds that there is an average underpricing of 3.75% for his 103
bond samples. Furthermore, he finds that in general deeply out-of-the-money bonds are
underpriced; however, at-the-money or in-the-money convertible bonds are slightly overpriced.
Carayannopoulos (1996) empirically investigates the pricing of US convertible bonds using a
theoretical model with firm value and interest rates (Cox-Ingersoll-Ross short rate process) as
the underlying variables. His findings are basically consistent with King (1986) and he finds that
market prices are in general lower than the theoretical values by 12.90%.
Buchan (1998a) illustrates the underpricing of convertible bonds by implementing a
hedge fund style convertible bond arbitrage strategy from January 1989 to June 1996 – taking
long positions in an equally weighted portfolio of convertible bonds and taking short positions in
the corresponding underlying stocks and in Treasury notes. She finds that the convertible
hedging portfolio earns an average return of 75.53 basis points per month net of transaction
3
costs, or an average excess return (over risk-free return) of 30.37 basis points per month net of
transaction costs.
Ammann, Kind and Wilde (2003) investigate the French convertible bond market using
daily market price of 21 most active French convertible bonds from February 1999 to September
2000. The theoretical bond value is based on the Tsiveriotis and Fernadez (1998) model with
stock price as the underlying variable. They show that the observed market bond prices are, on
average, 3% lower than the theoretical prices. Carayannopoulos and Kalimipalli (2003)
investigate US convertible bonds with a model similar to the Takahashi, Kobayashi and
Nakagawa (2001) model. Their bond sample consists of monthly closing price observations
based on 25 US convertible bonds over a 21 month period (January 2001 to September 2002).
Similar to previous research findings, they find that market prices of out-of-the-money
convertible bonds are significantly lower than the theoretical values, some of which to the extent
that their prices often imply negative imbedded option prices.
Empirical research on convertible bonds involves significant computational work to
numerically solve for each theoretical bond price on each observation date. Each calculation
requires many input parameters such as the bond contractual specifications, the underlying stock
price, a schedule of conversion prices, interest rates, and estimates of dividend yield and
volatility. These complexities may be a major reason why most of the existing literature of
empirical research on convertible bonds relies on only a small number of bond price
observations per convertible bond or a small number of convertible bonds. This narrow
coverage of analysis makes it difficult to have a clear overall picture about the actual valuation
process of convertible bonds in the market. King (1986) uses data from two trading days (bonds
priced on March 31, 1977, and December 31, 1977). Carayannopoulos (1996) uses data from 12
trading days (monthly data over one year). Buchan (1997) uses data of 1 trading day (bonds
prices on March 31, 1994). Carayannopoulos and Kalimipalli (2003) use a total of 434
observations. Ammann, Kind and Wilde (2003) use daily market prices of French convertible
bonds to include more bond price observations; however, their bond sample covers only 21
French convertible bonds.
This paper is an attempt to look at the big picture through a comprehensive empirical
investigation of all the actively traded US convertible bonds within a recent period. We
investigate the daily market prices of a sample of 107 convertible bonds from their first available

4
observations to the end of February 2003. We examine the time-series of the discrepancy
between market prices and theoretical prices of convertible bonds. Furthermore, we also analyze
the relationship between the discrepancy and the bond characteristics.
We hypothesize that the discrepancy between the observed market price and the
theoretical price is induced by the possibility that a convertible bond might renegotiate on some
of its covenants. We find that the lower the bond is rated, the larger is the underpricing at the
initial private and public offerings and the first recorded market price. The underpricing worsens
if the issuer experiences subsequent financial difficulties. But, most importantly, conditional on
no subsequent rating downgrades over the next 500 weekdays, the convertible bond’s market
price converges to the theoretical price and becomes even slightly overpriced as discussed in
Ingersoll (1977b). Thus, the observed underpricing is mostly limited to the seasoning process
and when the company faces imminent financial difficulties. This seasoning period is shorter for
bonds with higher ratings. The outline of this paper is as follows. Section 2 describes the
valuation model and the data set. Section 3 discusses the hypotheses and presents the empirical
results. Section 4 concludes the paper.
2. The Model and Data
2.1 Model
In this study, the empirical results are based on the same benchmark as calculated in
Ammann, Kind and Wilde (2003), which is derived from the theoretical model of Tsiveriotis and
Fernandes (1998) (TF). We have also conducted a sensitivity study and find that our results are
quite robust (see Section 3.4 below). Our choice of the Tsiveriotis and Fernandes model is also
dictated by the data requirements of conducting a large scale study of convertible bonds of this
nature, in particular the availability and the systematic property of the parameter inputs.
Tsiveriotis and Fernandes (1998) is an extension of the theoretical framework of
McConnell and Schwartz (1986), which uses the current credit risk adjusted interest rate to take
into account of the conditional default risk in the valuation process. Tsiveriotis and Fernandes
further split the convertible bond value into a stock component and a bond component because
the separation can better handle the credit risk exposures of convertible bonds. We numerically
5
solve the two resultant partial differential equations subject to the appropriate boundary
conditions,1 using the implicit finite difference method2.
2.2 Data
Convertible Bond Data Set
Our sample of convertible bonds and their market prices are obtained from DataStream
International. The “USCV” (US convertible bonds) contains basically all US domestic
convertible bonds with face values greater than US$100 million. They can be convertible bonds
issued by industrial or financial companies. A convertible bond is removed from “USCV” if the
bond has matured, or has been redeemed or called early by the issuer or fully converted. 3
We have downloaded data at different points in time from May 1999 to August 2003 to
determine the survivorship characteristics of the data set. The most encouraging characteristic is
that defaulted convertible bonds are still being carried in the dataset, though the “market prices”
of these bonds are of questionable quality. On the other hand, while most convertible bonds
satisfying the minimum size requirement are included in the dataset from their initial private or
public offerings, DataStream does not make clear the criterion it uses to select which bond to
record its market prices.4 This may introduce some unknown selection bias and, in some way,
this recording uncertainty limits our ability to investigate unconditional market efficiency in a
systematic way and there is no other more comprehensive and systematic convertible bond data
source that would allow us to supplement the data.
1 Those boundary conditions include the upper and lower boundaries, the call boundary, the put boundary, the premature conversion
condition, and the maturity condition. 2 See Tsiveriotis and Fernandes (1998) for details. 3 Information is provided by the Research Helpdesk from Thomson Financial. 4 After downloading bond data from different points in time, we find that Datastream sometimes fills in price information ex-
post. In other words, a convertible bond may exist in the data set without price information in an earlier download. In a subsequent download, the price data are filled in even for the period before the previous download. This induces a possible survivorship as bonds that default soon after issuance might not make it to the data base. We speculate that this might be the reason why the number of defaulted bonds in Datastream is less than what one would expect from the historical distribution. But, once the market prices of a convertible bond are included, Datastream continues to carry the bond prices even after the bond defaults.
6
Thus, to create a sample that is least impacted by this selection bias, we limit ourselves to
convertible bonds that are initially rated at B2 (Moody’s ratings) or above in a recent period. An
additional reason to limit our attention to bonds with a rating of B2 or higher is related to the
practical difficulty of obtaining reliable market credit risk premium for bonds rated below B2.
Thus, in this study, the empirical results apply only to this subset of the universe of convertible
bonds and should not be generalized to bonds whose initial ratings are below B2.
Given all these considerations, we select our convertible bond sample in accordance with
the following criteria: (1) we include only convertible bonds with initial Moody’s credit ratings
not lower than B2; (2) we only use those convertible bonds whose first recorded market price
appears in 2001 or later to limit other possibilities of survivorship bias in the data source; (3) we
only use those convertible bonds with sufficient data for calculations, e.g. stock price data and
complete contractual specifications.
The choice of 2001 as the start date is due to a significant increase in the coverage of
convertible bonds by Datastream starting with 2001 [see also Carayannopoulos and Kalimipalli
(2003)]. Based on the above criteria, we include 107 US convertible bonds for this study. Daily
market prices for each convertible bond from its first available observation to the end of
February 2003, if available, are obtained from DataStream. Data related to bond contractual
specifications, including face value, coupon rate, call schedule, put schedule, coupon date,
maturity date, initial offer price, initial conversion price, etc, are obtained from the offering
prospectuses as the contractual information provided by DataStream contains too many
omissions. As convertible bond holders are protected from stock dilution events, such as stock
split, right issue or issuance of stock dividend, the conversion price (and conversion ratio) is
subject to adjustment. The history of conversion price adjustment is obtained through other
supplementary sources, including company annual reports, newspapers, and other sources.
Information about our convertible bond sample is presented in the appendix Table A.1.
Interest Rate and Credit Risk Premium
Risk-free interest rate data are constructed from the US Treasury bond yields.
DataStream provides the redemption yields of US government bond portfolios under various
maturity classes. We take the redemption yields in the maturity classes of 2, 3, 5, 7 and 10 years
to construct the term structure of the risk-free interest rates. For convertible bonds with time to
7
maturity being less than 2 years, the redemption yield of a 2-year government bond is used as the
risk-free interest rate. For convertible bonds with time to maturity of more than 10 years, the
redemption yield of a 10-year government bond is used as the risk-free interest rate. The risk-
free interest rate for a convertible bond with maturity ranging between 2 to 10 years is obtained
by interpolating the redemption yields from the two closest adjacent maturity classes. Weekly
data of the prevailing credit risk premiums for different rating class is obtained from Bloomberg.
Stock Price, Dividend, and Volatility
The underlying stock price and dividend yield data is obtained from DataStream. We
estimate the dividend yield by calculating the moving average of last one-year dividend yield
data. We estimate the volatility of underlying stock with the historical volatility estimate from
the previous one-year’s stock price data.
3. Hypotheses and Empirical Results
3.1 Why Market Prices Deviate from “Theoretical Prices?” ── Three Examples
Theoretical models of convertible bonds are usually derived by assuming a convertible
bond to be a straight bond with an option or a dynamically rebalanced portfolio of cash and
stock. These models do not take into account of certain stylized facts that are relevant to the
pricing in certain states, in particular those in which the convertible bond covenants may be
renegotiated without going into defaults. As the following examples will show, the subtlety of
these renegotiations makes it difficult to parameterize them explicitly in a theoretical model.
Our first example is CoreComm’s renegotiation with its convertible bondholders in 2001
(see Appendix A.2). As CoreComm was experiencing financial difficulties, it first pressured its
convertible bondholders into accept a binding agreement as convertible bonds are the lowest in
the pecking order other than equity. After the acceptance by the convertible bondholders,
CoreComm would negotiate with the other bondholders conditional on the binding agreement
with the convertible bondholders (note: reversing the order of negotiation will induce a windfall
on the convertible bondholders at the intermediate step which may change the negotiated
8
outcome). This sequential nature of renegotiations points out the difficulties in modeling
CoreComm’s convertibles bonds as its straight bonds plus simple options.
Our second example is related to the common practice of convertible bond issuers to
imbed a schedule of put options in the convertible bonds to make them more attractive to the
investors as investors can exercise their put options and force the issuers to buy back their bonds
when the underlying stock price is falling. Issuers, on the other hand, often try to renegotiate
with the investors not to exercise their puts if the company is cash-stranded. The article
“Convertible Bombs” (Economist, Nov 14, 2002) illustrates this common scenario with the
example of Tyco’s 20-year convertible bond (issued in 2000) in which “…days before the (put)
decision date (Nov 17, 2001)… Tyco held an upbeat investor meeting, stoking demand for its
shares. The put option was largely ignored, much to the regret of many investors (later)…”
Those companies who are forced to honor their puts (e.g., Marriott, US Bancorp,
Anadarko Petroleum, etc.) “have seen their stock hit hard” while their convertible bond prices
move up to the exercise prices. Other convertible bond issuers (Cendant, Cox Communications,
Neuberger Berman) “have bought off investors by sweetening terms, such as adding an interest
payment, call protection or opportunities for future puts” with varying degrees of success (an
imbedded put should have a credit rating!). The sequential nature of the renegotiations also
makes the underlying stochastic process rather complicated (see, e.g., Bensoussan and Lions
[1984] and also the literature on endogenous debt renegotiation, e.g., Fan and Sundaresan
[2000]) and the stock price and bond price often move in opposite directions in the process.
On the other hand, the market price of a convertible bond can also increase due to a
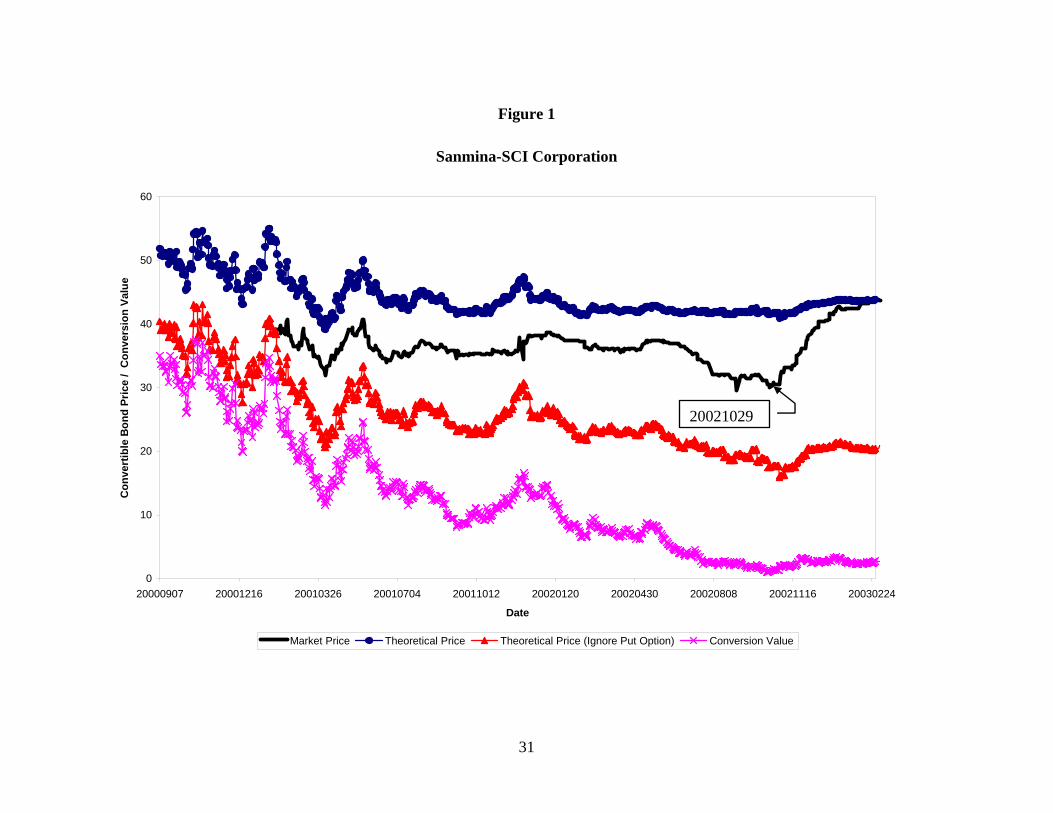
reduced likelihood of renegotiations. The convertible bonds issued by Corning and Sanmina-
SCI offer interesting examples of how the reduced uncertainty of whether the put schedule will
be honored affects the bond market price. Take the case of Sanmina-SCI Corporation. On
October 29, 20025, it was revealed in the earning conference call that the company has been
reducing “amount of (their) convertible debt coming due in 2004 and 2005.” The bond price
reaction is illustrated in Figure 1. The theoretical prices are represented by the top curve with
dots. The market prices are represented by the solid curve (second curve from the top). The
“theoretical prices without the put option” are represented by the curve with triangles (third
5 Source: FD (Fair Disclosure) Wire, October 29, 2002 from LexisNexis.
9
curve from the top). The bottom curve is the conversion value. First, it is clear that the market
price of the convertible bond is supported by the existence of the put. It is also interesting to
note that the market price is between the idealized theoretical curve (where the covenants are not
expected to be renegotiated) and the curve assuming the company will not honor the put. It
illustrates how important some of bond covenants (in this case the put schedule) are to the
market price of the bond. After the signal that the issuer has enough money (the announcement
of the recent buy-back of convertible bonds) to honor the covenants in the convertible bonds, the
convertible bond price moves back to the idealized theoretical price, even though the stock price
(and hence the conversion value) continues to fall.
Figure 1 about here
The above discussion suggests that this “deviation” from a theoretical model (with
idealized assumptions) is most severe when the probability of renegotiations is high. In an
interesting research article published by Moody’s entitled “Default and Recovery Rates of
Convertible Bonds Issuers: 1970-2000,” it shows (see Figure A.1 in Appendix) that the
probability of defaults for non-investment grades reaches the peak in the second year after the
issuance of the convertible bonds and declines thereafter (the “seasoning”). The conventional
wisdom for this pattern (see Moody’s report) is that within the first few years, “the cash
available from the debt is used up and the firm demonstrates itself and its business plan to be
viable or it defaults.” As such, we would expect the price of a convertible bond to move towards
its idealized price conditional on no new negative information.
On the other hand, Ingersoll (1977b) points out that companies who issue convertible
bonds usually have suboptimal call policies. If so, one would find the market prices for
convertible bonds to be eventually higher than the idealized theoretical prices (derived under
optimal call policies) conditional on survival.
3.2 Hypotheses
Our hypothesis is that convertible bonds, being the lowest in the pecking order other than
equity, are more likely to be subject to some renegotiations of the indenture terms if the company
experiences some financial difficulties. Thus, a convertible bond will be underpriced relative to
10
any of the idealized theoretical models unless the probability of restructuring or defaults is
trivial. In this study, we will examine the following testable implications consistent with our
hypothesis.
H.1 Initial underpricing is correlated with the rating of the issuer
Based on our earlier discussion, the underpricing of convertible bonds is related to the
probability of renegotiation or default on some of their covenants. Thus, if the credit rating is
high, the likelihood of renegotiations or default is low and the underpricing should be small. We
predict that the higher the convertible bond rating, the smaller is the underpricing at the initial
offering.
H.2 A convertible bond becomes more underpriced after a significant decline of its stock
price
As the probability of renegotiating or defaulting on some of the convertible bond
covenants increases when the company gets into financial difficulties, we predict that the
underpricing becomes larger immediately after a significant decline of the stock price.
H.3 Most importantly, conditional on no downgrading of its securities, the convertible
bond price will converge to the idealized theoretical price after seasoning
According to Moody’s study above, the seasoning happens typically within the first few
years for convertible bonds with usual maturities of more than 15 years. The market updates the
credit worthiness of the bond as time elapses. If there is no subsequent negative news significant
enough to downgrade the convertible bond, we predict that the market prices of convertible
bonds will converge to their theoretical prices and the convergence is earlier for higher rated
bonds.
11
3.3 Empirical Results.
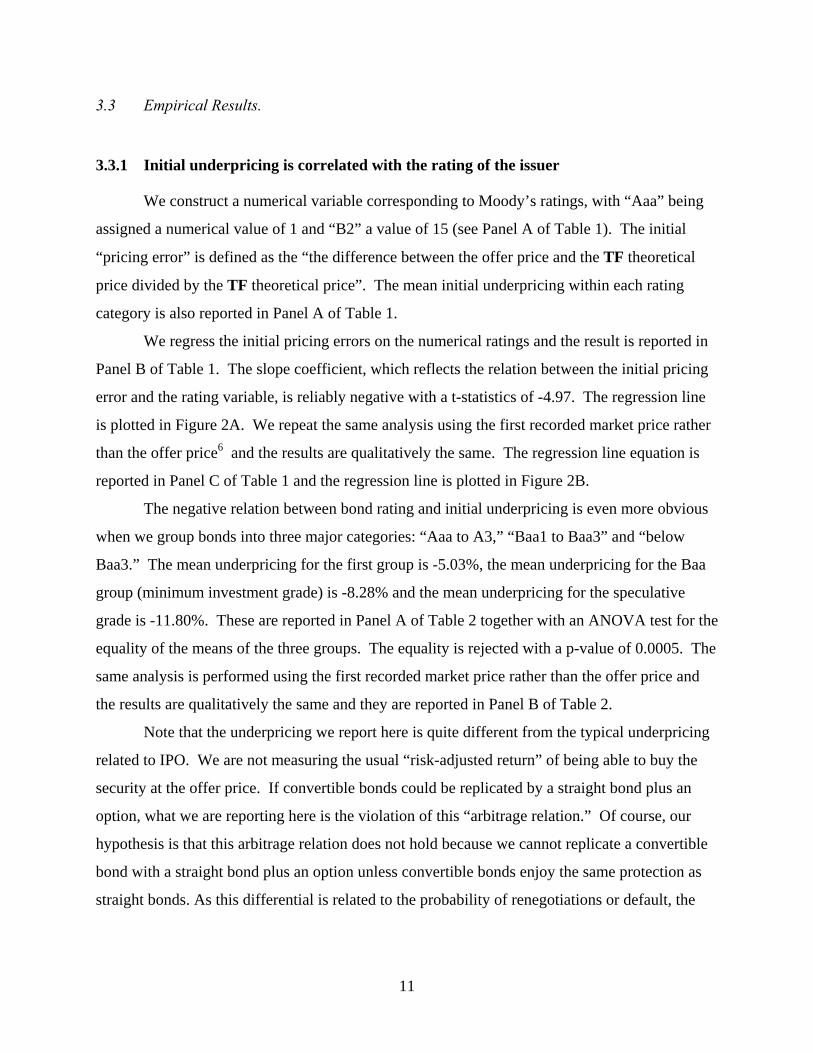
3.3.1 Initial underpricing is correlated with the rating of the issuer
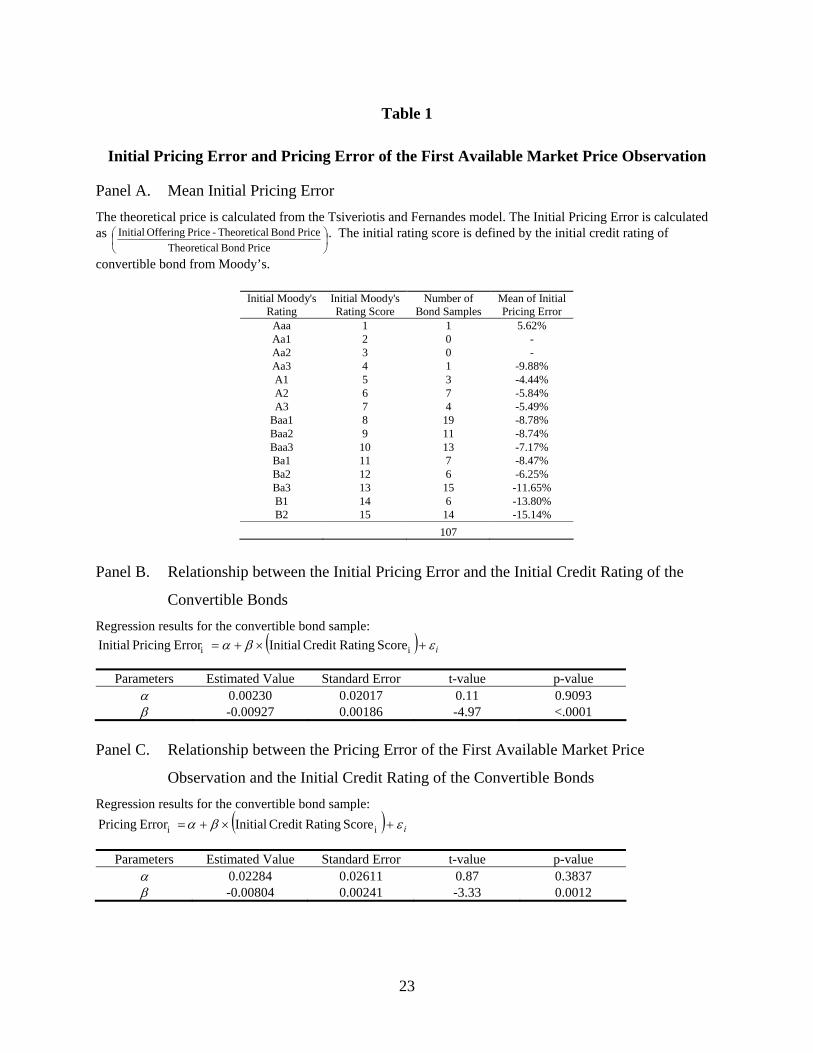
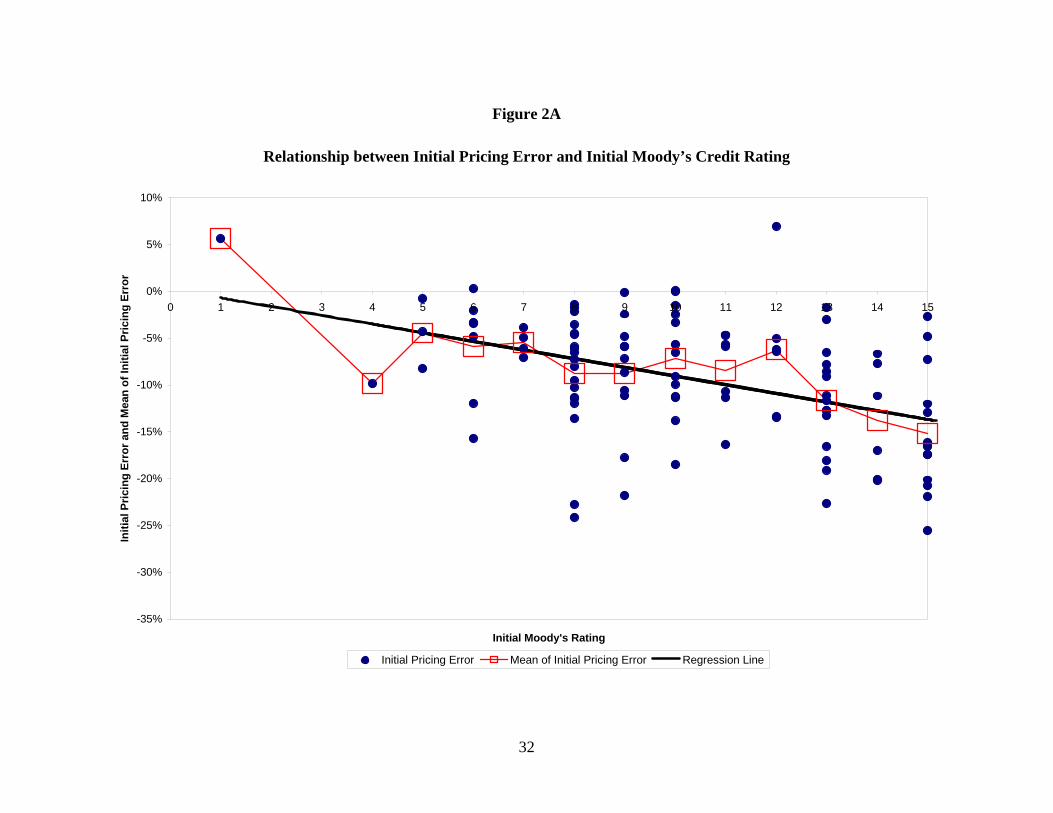
We construct a numerical variable corresponding to Moody’s ratings, with “Aaa” being
assigned a numerical value of 1 and “B2” a value of 15 (see Panel A of Table 1). The initial
“pricing error” is defined as the “the difference between the offer price and the TF theoretical
price divided by the TF theoretical price”. The mean initial underpricing within each rating
category is also reported in Panel A of Table 1.
We regress the initial pricing errors on the numerical ratings and the result is reported in
Panel B of Table 1. The slope coefficient, which reflects the relation between the initial pricing
error and the rating variable, is reliably negative with a t-statistics of -4.97. The regression line
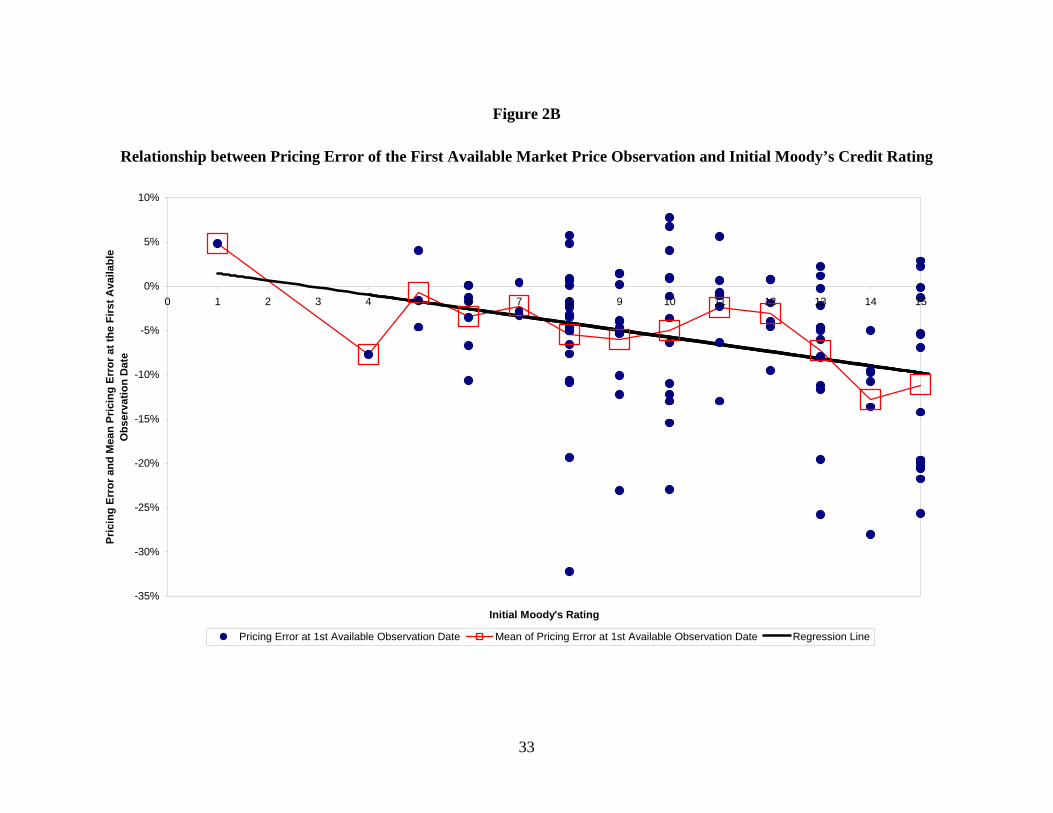
is plotted in Figure 2A. We repeat the same analysis using the first recorded market price rather
than the offer price6 and the results are qualitatively the same. The regression line equation is
reported in Panel C of Table 1 and the regression line is plotted in Figure 2B.
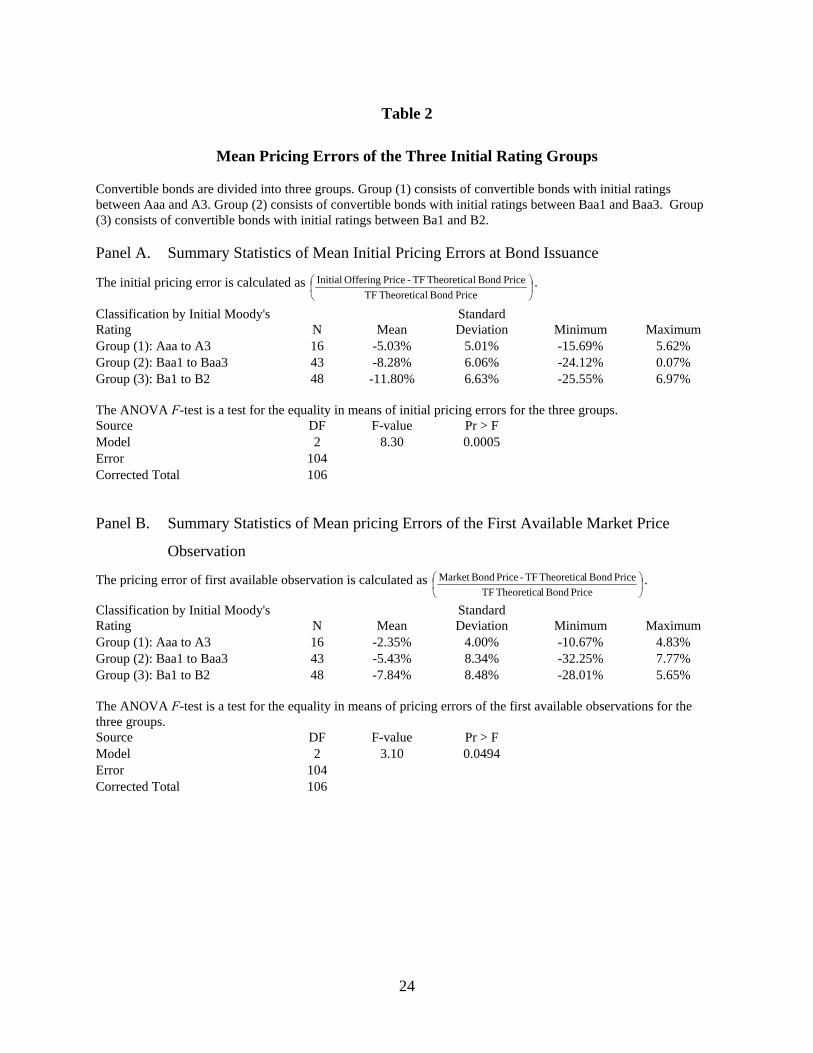
The negative relation between bond rating and initial underpricing is even more obvious
when we group bonds into three major categories: “Aaa to A3,” “Baa1 to Baa3” and “below
Baa3.” The mean underpricing for the first group is -5.03%, the mean underpricing for the Baa
group (minimum investment grade) is -8.28% and the mean underpricing for the speculative
grade is -11.80%. These are reported in Panel A of Table 2 together with an ANOVA test for the
equality of the means of the three groups. The equality is rejected with a p-value of 0.0005. The
same analysis is performed using the first recorded market price rather than the offer price and
the results are qualitatively the same and they are reported in Panel B of Table 2.
Note that the underpricing we report here is quite different from the typical underpricing
related to IPO. We are not measuring the usual “risk-adjusted return” of being able to buy the
security at the offer price. If convertible bonds could be replicated by a straight bond plus an
option, what we are reporting here is the violation of this “arbitrage relation.” Of course, our
hypothesis is that this arbitrage relation does not hold because we cannot replicate a convertible
bond with a straight bond plus an option unless convertible bonds enjoy the same protection as
straight bonds. As this differential is related to the probability of renegotiations or default, the

12
strong negative relation between bond rating and the initial underpricing is consistent with our
hypothesis.
Table 1 about here
Figure 2A and Figure 2B about here
Table 2 about here
3.3.2 A convertible bond becomes more underpriced after a significant decline of its stock
price
Consistent with our hypothesis of why convertible bonds are underpriced, we should
detect a further widening of the market price and the theoretical price when the probability of
renegotiations or default increases. In this section, we compare the “underpricing” of a
convertible bond after a dramatic drop in its stock price with the “underpricing” before the event.
We also compare this change in the “underpricing” with that of a control group over the same
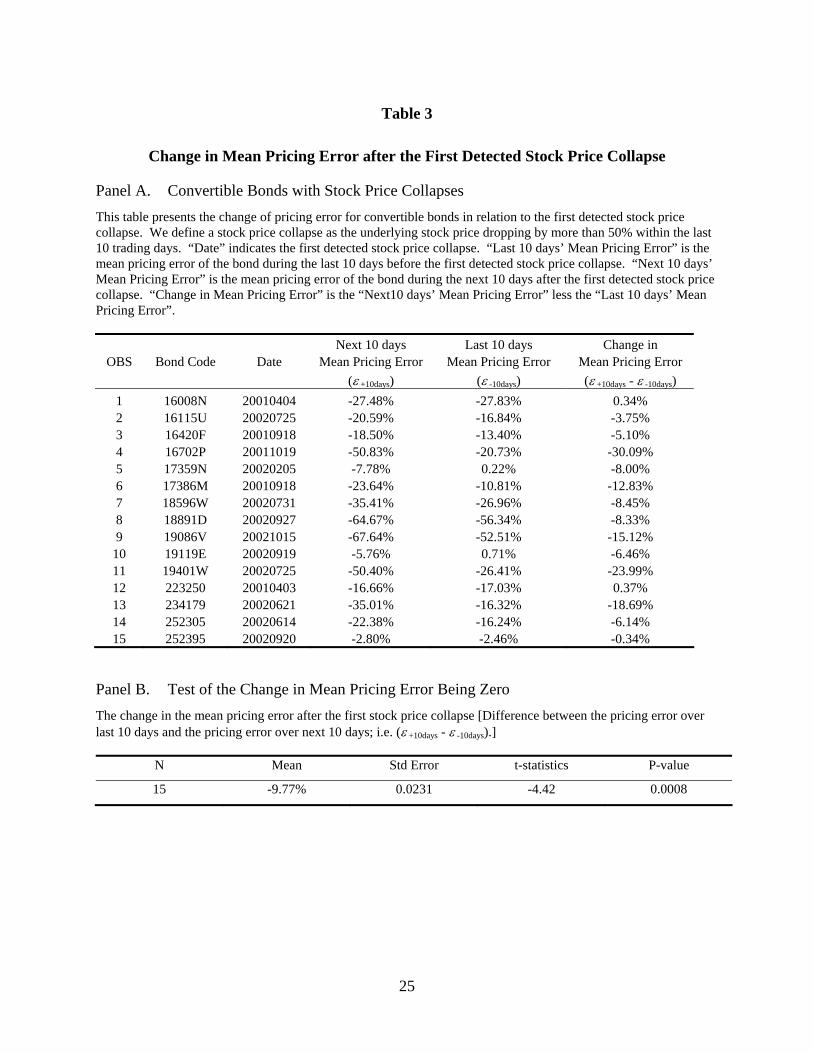
calendar time. We define a dramatic drop of stock price as falling at least 50% within the last
ten trading days. Within our sample of convertible issuers, we scan for such an event during our
sample period and find 15 such issuers and they are listed in Table 3.
We define the event date t = 0 as the first day that the issuer’s stock price has dropped by
more than 50% relative to the stock prices from day t = -10 to t = -1. We define the “mean
pricing error for the next 10 days” as the average of “the difference between the market price and
the TF theoretical price divided by the TF theoretical price” from t = +1 to t = +10, and the
“mean pricing error for the last 10 days” as the average from t = -10 to t = -1. Table 3 compares
6 The first recorded market price may be several months after the initial offer, especially if the initial offer is a private offer.
13
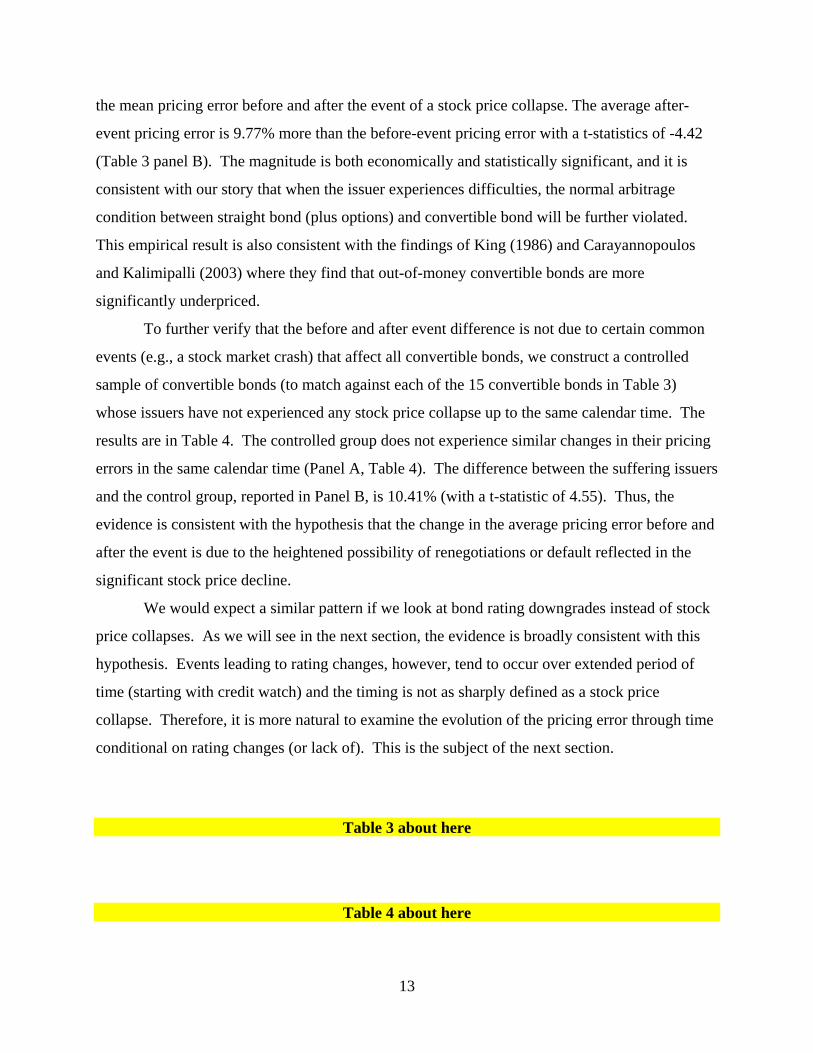
the mean pricing error before and after the event of a stock price collapse. The average after-
event pricing error is 9.77% more than the before-event pricing error with a t-statistics of -4.42
(Table 3 panel B). The magnitude is both economically and statistically significant, and it is
consistent with our story that when the issuer experiences difficulties, the normal arbitrage
condition between straight bond (plus options) and convertible bond will be further violated.
This empirical result is also consistent with the findings of King (1986) and Carayannopoulos
and Kalimipalli (2003) where they find that out-of-money convertible bonds are more
significantly underpriced.
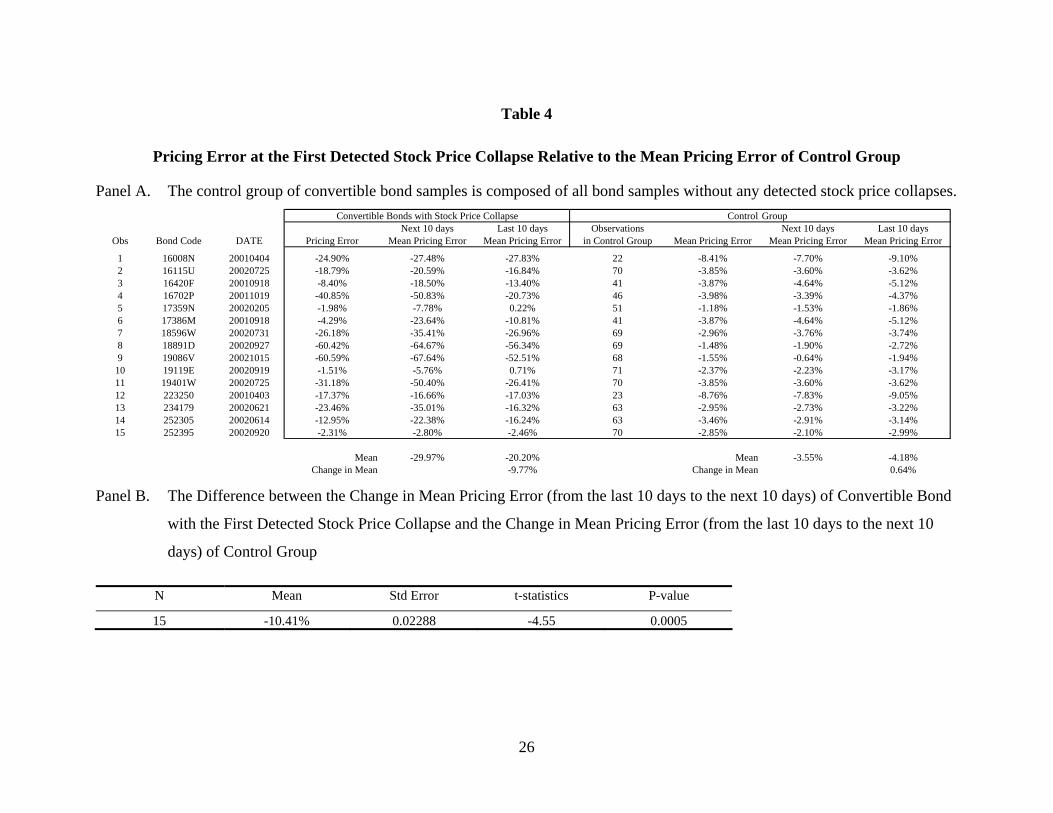
To further verify that the before and after event difference is not due to certain common
events (e.g., a stock market crash) that affect all convertible bonds, we construct a controlled
sample of convertible bonds (to match against each of the 15 convertible bonds in Table 3)
whose issuers have not experienced any stock price collapse up to the same calendar time. The
results are in Table 4. The controlled group does not experience similar changes in their pricing
errors in the same calendar time (Panel A, Table 4). The difference between the suffering issuers
and the control group, reported in Panel B, is 10.41% (with a t-statistic of 4.55). Thus, the
evidence is consistent with the hypothesis that the change in the average pricing error before and
after the event is due to the heightened possibility of renegotiations or default reflected in the
significant stock price decline.
We would expect a similar pattern if we look at bond rating downgrades instead of stock
price collapses. As we will see in the next section, the evidence is broadly consistent with this
hypothesis. Events leading to rating changes, however, tend to occur over extended period of
time (starting with credit watch) and the timing is not as sharply defined as a stock price
collapse. Therefore, it is more natural to examine the evolution of the pricing error through time
conditional on rating changes (or lack of). This is the subject of the next section.
Table 3 about here
Table 4 about here
14
3.3.3 Time-series behavior of pricing errors and convergence
In this section, we examine how pricing errors evolve over time and the conditions under
which they will converge to zero. Our investigation here, however, is limited by the
aforementioned inclusion bias in the data base and the general lack of accurate market credit risk
premium information for low grade bonds and the irregularity of defaulted bond prices. As such,
the data limitation prevents us from conducting a general test of market efficiency for
convertible bonds as the calculated pricing errors become unreliable for bonds whose issuers
experience significant financial difficulties.
There are, however, other interesting implications that we can examine which avoid this
data problem. In particular, the main implication of our discussions is that if a convertible bond
rating is not downgraded, the conditional probability of renegotiations or default decreases over
time (see aforementioned Moody’s study) and we expect the pricing error to converge to zero or
become slightly positive [Ingersoll (1977b)]. Thus, the most important hypothesis we examine
in this study is that the convertible bond price will converge to the theoretical price as the
probability of renegotiation decreases.
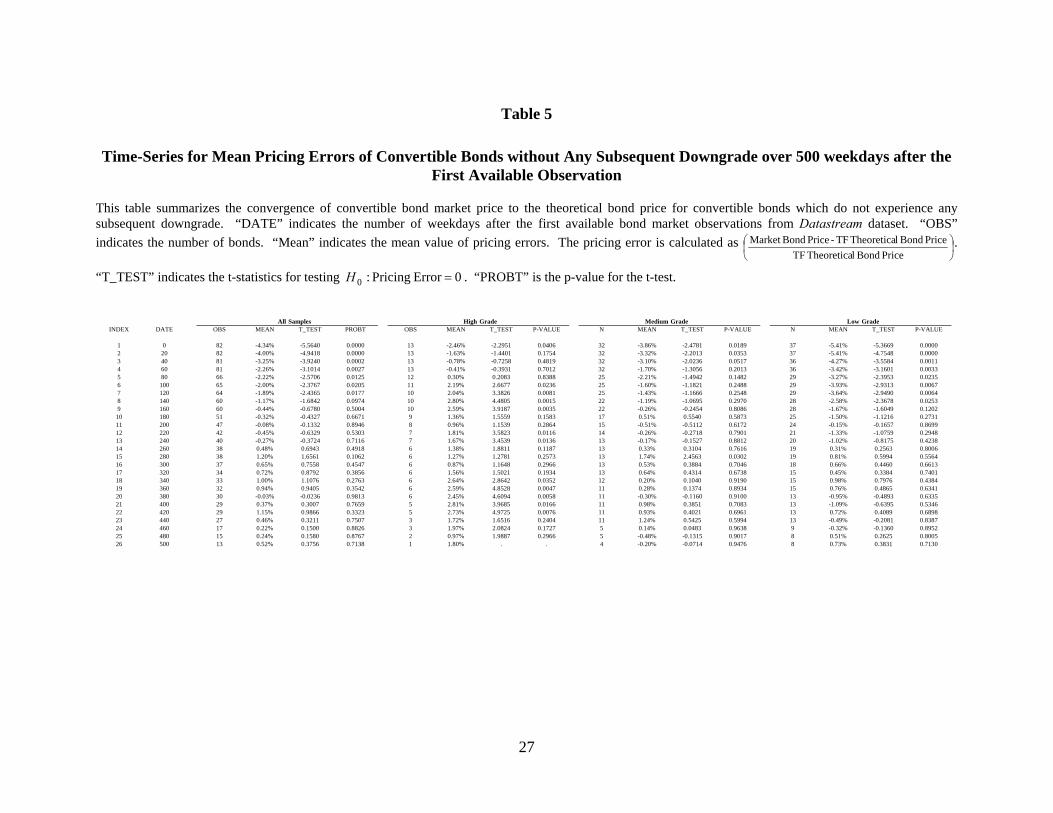
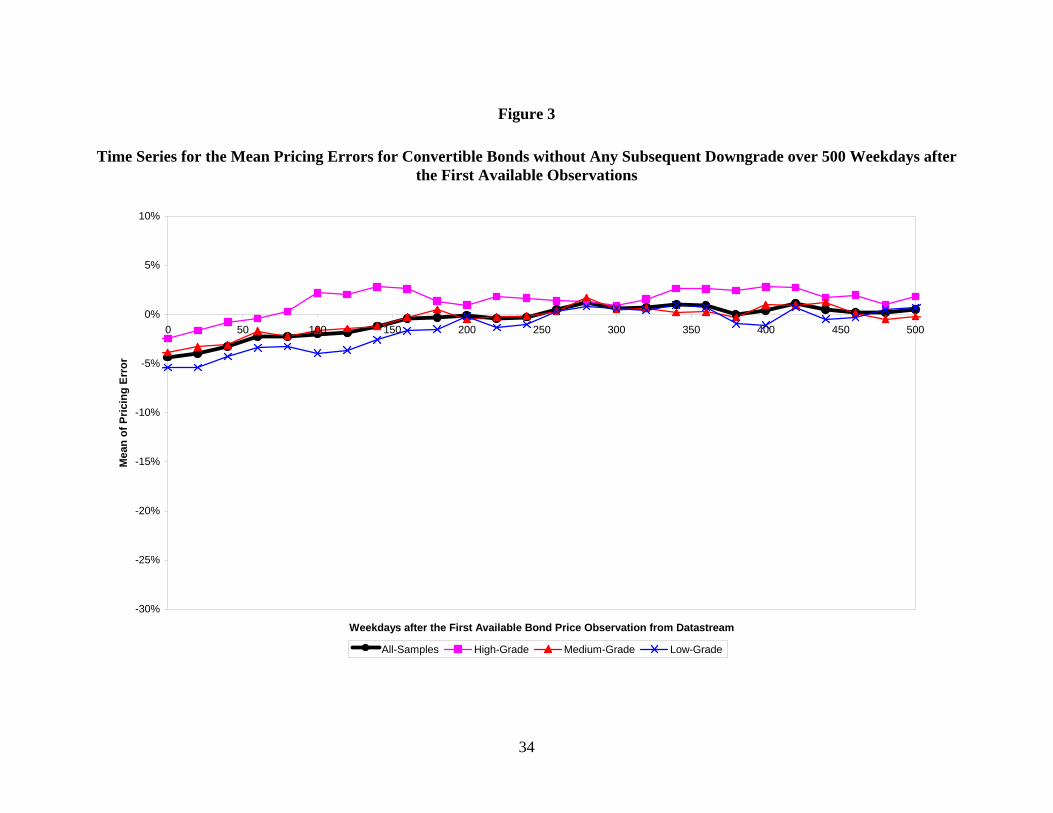
To test this implication, we select ex-post the subset of convertible bonds that have no
rating downgrade in the 500 weekdays after their first price observations. There are 82 such
convertible bonds in our sample. The pricing errors for this subset of bonds without rating
downgrades are reported in Table 5. The time-series of their pricing errors are plotted in Figure
3. We divide the convertible bonds into three sub-groups. The “high grade” group contains
bonds with initial ratings between Aaa and A3. The “medium grade” group contains bonds
between Baa1 and Baa3. The “low grade” group contains bonds between Ba1 to B2. The initial
underpricing is significantly negative for each of the three groups, including the group of high
grade bonds. Over time, conditional on no rating downgrades, the average pricing errors for all
three groups converge to zero or slightly above. From Figure 3, it is obvious that the
convergence is earlier for the higher rated bonds.
This time-series convergence pattern is consistent with our hypothesis. In some sense, it
is the mirror image of the time-series pattern of defaults in Moody’s study (Figure A.1 in
Appendix). As the conditional probability of default decreases over time given no downgrades,
one would expect the time-series of pricing errors to converge to zero. Conditional on the same

15
amount of elapsed time, one would expect the conditional probability of default to be lower for
higher rated bonds, and therefore the convergence sooner. Figure 3 confirms this intuition.
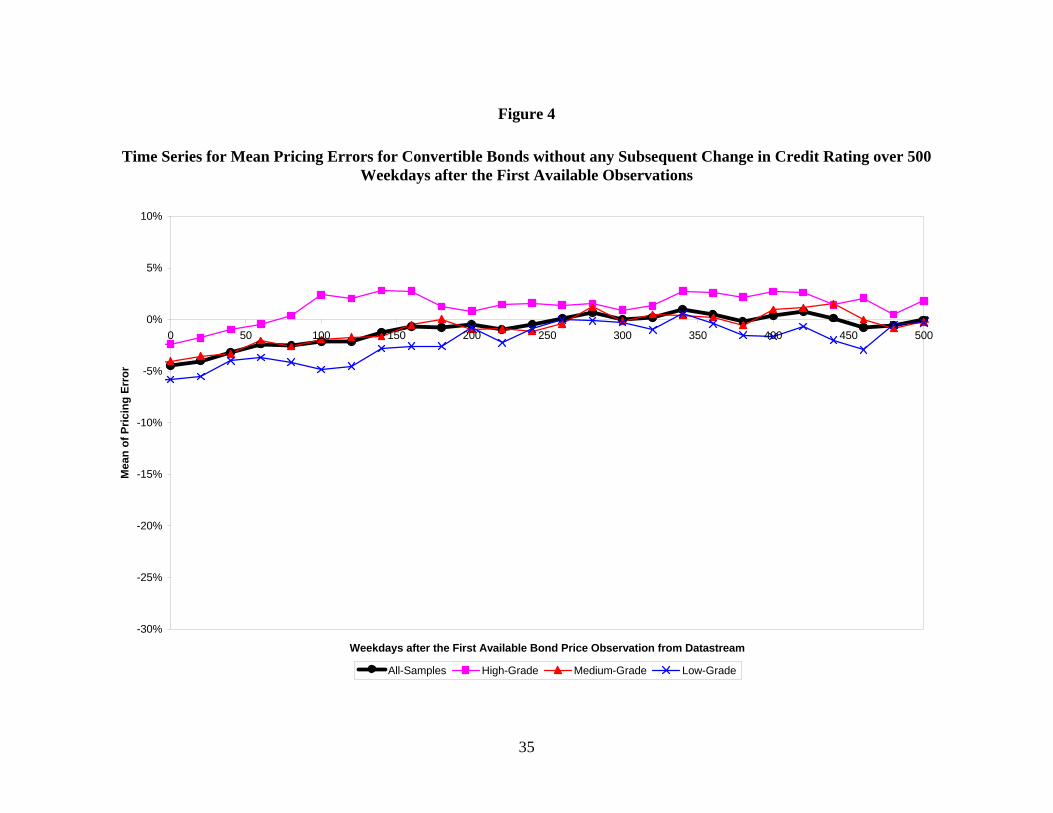
We also look at the results corresponding to a further subset of bonds that experience no
rating changes (i.e., excluding those with upgrades). The results are similar and they are
reported in Table 6 and plotted in Figure 4. Thus, conditional on no rating changes, the average
pricing error of convertible bonds will also converge to zero.
Figure 3 about here
Table 5 about here
Figure 4 about here
Table 6 about here
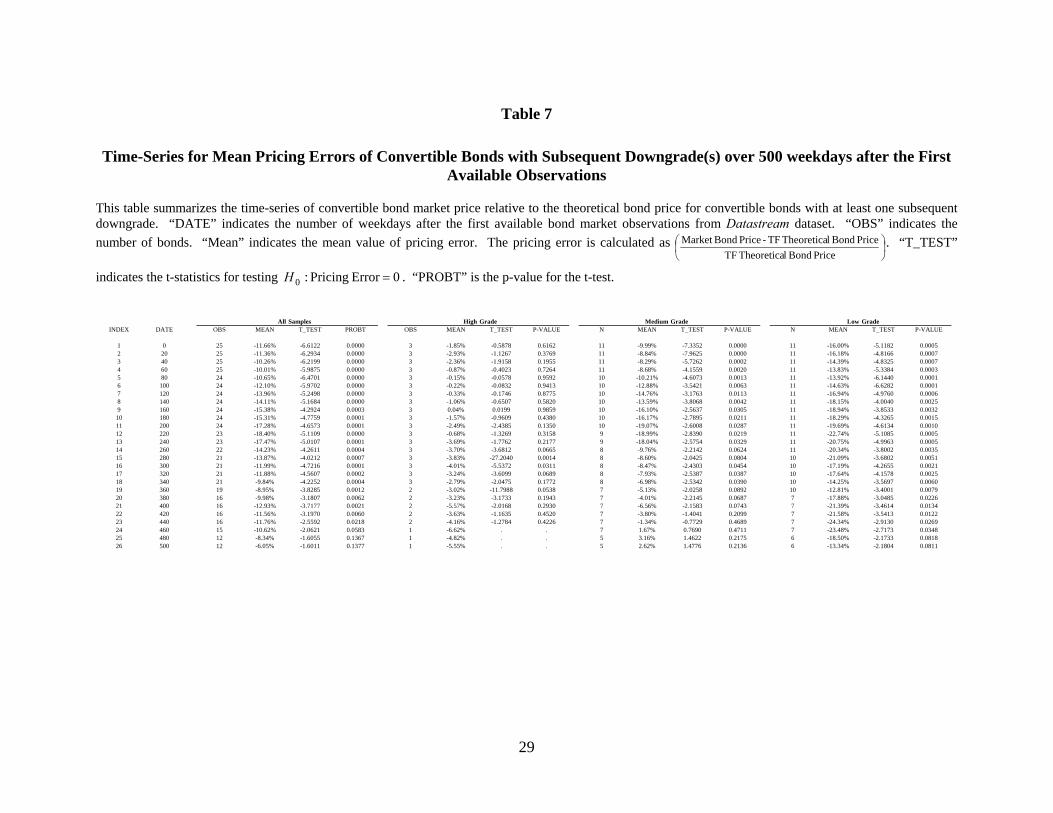
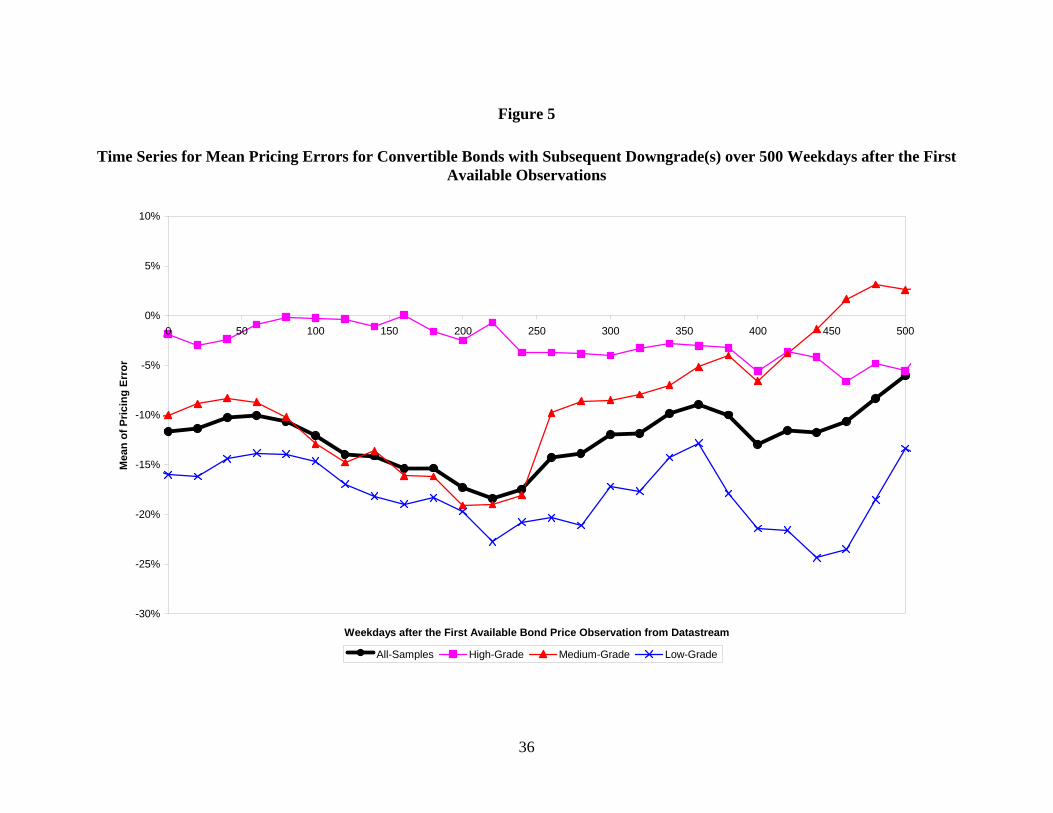
To analyze our hypothesis further, we contrast the above results with the results on the
complementary subset of convertible bonds that experience at least one rating downgrade in the
first 500 weekdays of available price observations. The results are reported in Table 7. Here,
the pricing errors are understated for bonds with downgrades because of the difficulty in
measuring the pricing errors of low grade bonds. With the already understated pricing errors,
we see from Table 7 that the lower rated bonds’ pricing errors remain economically and
statistically negative with a mean of -13.34% five hundred weekdays after the first price
observation. The results are also plotted in Figure 5 (plotted with the same scale as in Figure 3
and 4). The lack of price convergence in Figure 5 for convertible bonds with downgrades is
drastically different from the price convergence of bonds without downgrades in Figures 3 and 4.
Figure 5 about here
16
Table 7 about here
Since we select in our sample only convertible bonds whose first available price
information occurs in 2001 or later, the convergence of pricing errors in Table 5 and Figure 3
(bonds without rating downgrades) cannot be driven by the maturing of the bonds as convertible
bonds tend to have long maturities (typically 15 years or longer). A possible alternative
explanation of the convergence might be due to the increase in the stock price of the issuers
whose ratings have not been downgraded. When the conversion value becomes higher than the
“straight bond component” of the convertible bond, the option is in-the-money and the pricing
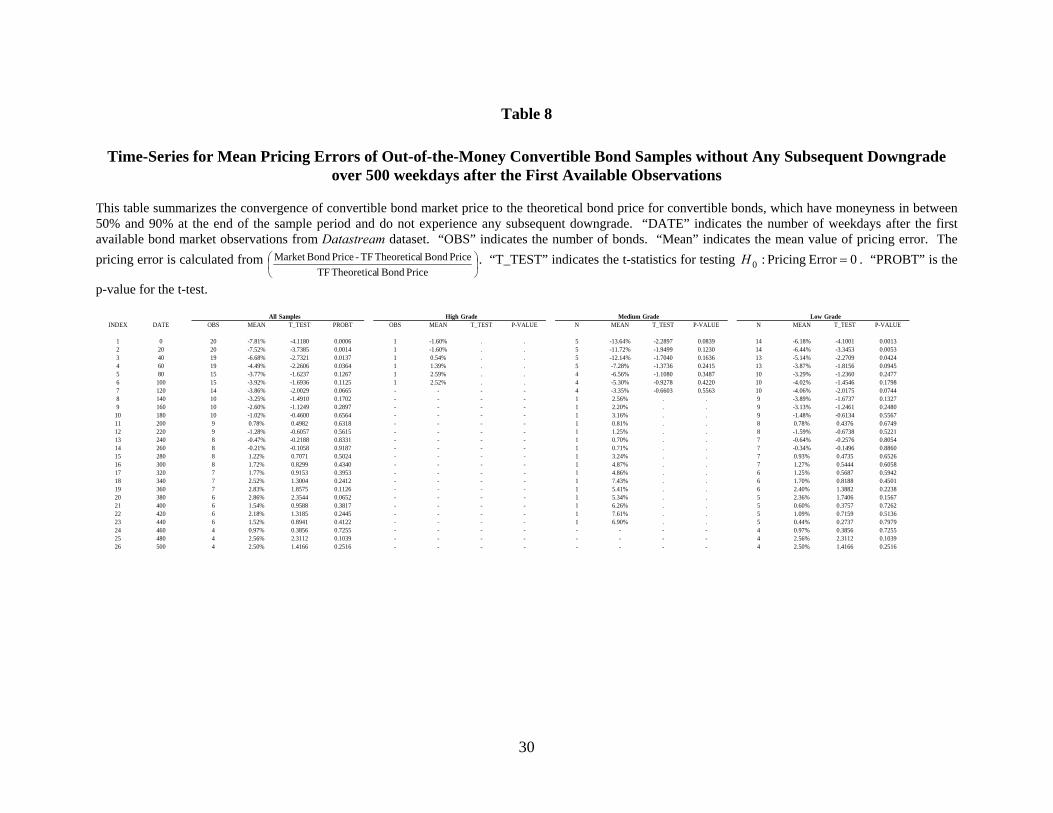
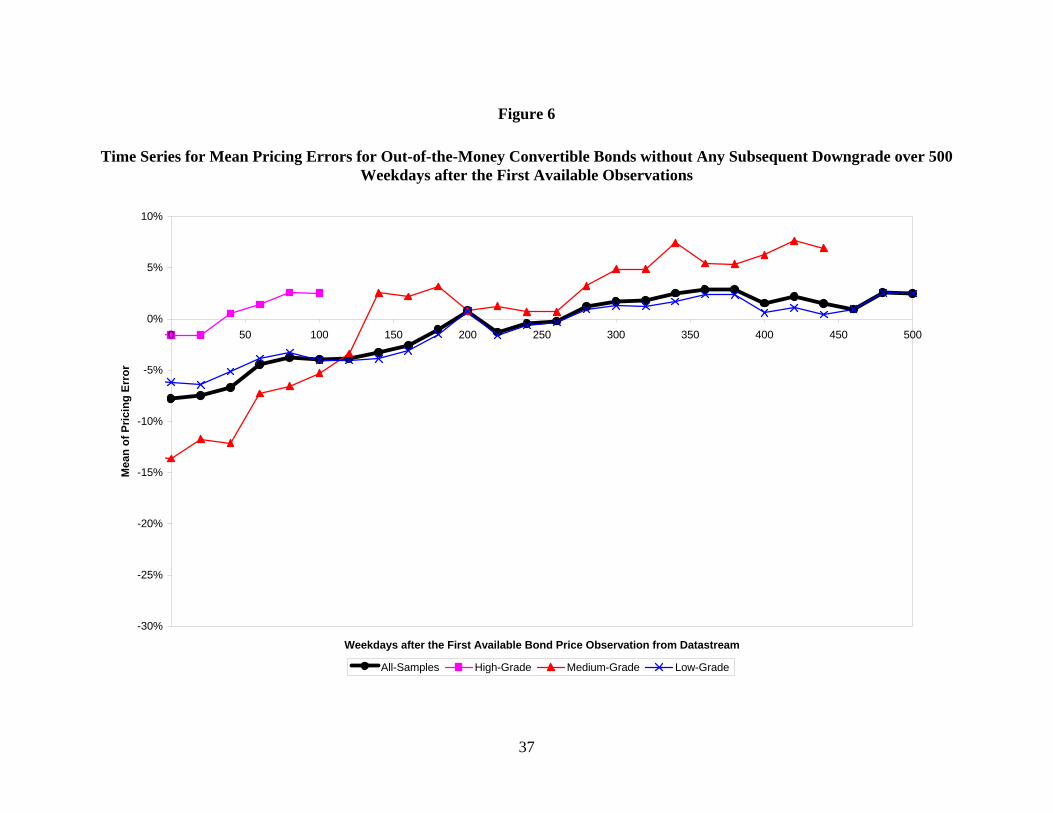
error is likely to be small. To test whether being in-the-money is necessary for the convergence
of the pricing error, we construct a subset of convertible bonds whose implicit options are out-of-
money at the end of the sample period. Among convertible bonds that do not experience any
rating downgrades, we select those whose conversion value at the end of the sample period are
between 50 percent and 90 percent of the straight bond value. The lower bound of 50 percent
ensures that the sample does not contain bonds whose issuers are experiencing financial
difficulties but their ratings are not downgraded yet. The pricing errors of this subset of bonds
are reported in Table 8 and plotted in Figure 6. The results show that despite the out-of-
moneyness of the option value of these convertible bonds, their pricing errors still converge to
zero in the sample period. Thus, it is not necessary for the implicit call option to be in-the-
money for the pricing errors to converge.
Figure 6 about here
Table 8 about here
17
3.4 Robustness Tests and Discussions
What we have shown is that convertible bond prices do converge to their theoretical
prices over time if there is no negative news. The much discussed “underpricing” of convertible
bonds is mostly a phenomenon of convertible bonds that are newly issued or have experienced
significant negative events. One plausible explanation for such underpricing is that the
convertible bond ratings are obsolete if rating agencies tend to be slow in downgrading. To test
this hypothesis, we re-compute the results in section 3.3.2 (underpricing gets worse after
significant price drop) and section 3.3.3 (convergence to theoretical prices) with the assumption
that rating agencies err by three notches. In other words, if the current rating of the convertible
bond is A2, we compute the theoretical price by assuming the convertible bond’s “true” rating is
Baa2 and use the credit-risk adjusted interest rate of Baa2 (down from A2 to A3 to Baa1 to
Baa2).
The results in section 3.3.2 are not much affected because a three-notch downgrade
would hardly make up a price deviation of about 10 percent (Table 3 and Table 4). Results in
section 3.3.3 are also not much affected: those that converge (Tables 5 and 6, and Figures 3 and
4) will continue to converge with the higher credit-risk adjusted interest rate, and those that do
not converge (non-investment grade bonds that experience at least one downgrade, Table 7 and
Figure 5) will still not converge as a three-notch downgrade would only make a slight
improvement on the underpricing but would not make up an underpricing of 13 percent (Table 7,
last column).
We have also recomputed all the results in this study with the McConnell and Schwartz
(1986) model and the results are essentially the same. We have also looked at the small subset of
issuers where both convertible bond prices and straight bond prices are available. If we use the
straight bond yields from the same issuer to price the convertible bonds, there is a slight
improvement on the underpricing but the overall results remain qualitatively the same.7 Thus,
our results are rather robust with respect to this class of theoretical models.
Perhaps the most interesting future direction of work on convertible bonds is to capture
the remaining unsolved problem of modeling the “underpricing” during the seasoning process
7 A difficulty we encounter is that many of the corporate straight bonds are not frequently traded, unlike convertible bonds which
have an equity component that makes the price volatile. The non-trading makes the adjustments rather questionable.
18
and when the issuer experiences financial difficulties. Empirically, it might be tempting to enlist
the help of other frequently updated market information, such as the stock price or the credit
default spread of bonds of the same company. But, the use of the stock price as an additional
variable can help in some cases, but can also hurt in other cases as the examples in section 3.1
show that bond and stock prices can easily go in opposite directions in financial difficulties. The
same goes with the use of credit default spread. Furthermore, models with more parameters can
be easily over fitted in sample, but lack general predictive power. Thus, it would seem more
promising to first make progress on the theory side. The work on endogenous debt
renegotiations and impulse control may shed light on how to model the underlying market
process arising from potential sequential renegotiations of the covenant terms. A structural
model that can integrate these theories into a function of concurrently observable market
variables may allow us to predict the remaining “underpricing” in convertible bonds during the
seasoning process and in financial difficulties.
4. Conclusion
We empirically analyze the much reported underpricings of convertible bonds. The main
finding of our study shows that seasoned convertible bonds without a rating downgrading
actually converge to their theoretical prices within the first 500 weekdays. Thus, the much
reported underpricing is mostly limited to the initial seasoning process and to the cases of
heightened probability of renegotiations or default on some of the bonds’ covenants after the
issuers experience some significant negative events.
We find that the underpricing at the initial private and public offerings and the market
price recorded on the first observation date is related to the convertible bond ratings: the lower
the bond ratings, the larger the initial underpricing. We hasten to point out that this initial
underpricing is different the usual evidence of abnormally high return during the first few trading
days of an IPO. The convertible bond “underpricing” is a violation of the arbitrage relations and
it can last for months after the public trading.
Furthermore, we find that the underpricing increases after a significant decline in the
stock price. On the other hand, if there is no downgrading of the credit rating of the convertible
bonds, the market price of the convertible bond converges to that of its theoretical value. But, if
19
there is a downgrading of the bond, there is no longer any evidence of convergence. Thus the
much touted profitable convertible bond arbitrages may not be riskfree and the “underpricings”
are not really underpricings after all. Taking all these results collectively, the evidence is
consistent with the hypothesis that the “underpricing” is induced by potential renegotiations on
the covenant terms when the issuer faces possible imminent financial difficulties. In the absence
of such events, the convertible bond price will converge to the theoretical price.
20
REFERENCES
Ammann, Manuel, Axel Kind, and Christian Wilde, 2003, Are convertible bond underpriced? An
analysis of the French market, Journal of Banking & Finance 27, 635-653.
Bardhan, Indrajit, Alex Bergier, Emanuel Dosemblet, Cemal Dosembet, Iraj Kani, and Piotr
Karasinski, 1994, Valuing convertible bonds as derivatives, Goldman Sachs Quantitative Strategies
Research Notes.
Bensoussan, Alain and Jacques-Louis Lions, 1984, Impulse Control and Quasi-Variational
Inequalities, Gauthier-villars, Paris.
Black, Fischer, and Myron Scholes, 1973, The Pricing of Options and Corporate Liabilities, Journal
of Political Economy 81, 637-654.
Brennan, Michael J., and Eduardo S. Schwartz, 1977, Convertible Bonds: Valuation and Optimal
Strategies for Call and Conversion, Journal of Finance 32, 1699-1715.
Brennan, Michael J., and Eduardo S. Schwartz, 1980, Analyzing Convertible Bonds, Journal of
Financial and Quantitative Analysis 15, 907-929.
Buchan, Jane, 1997, Convertible bond pricing: theory and evidence, Dissertation, Harvard
University, unpublished.
Buchan, Jane, 1998a, Inter-Market Inefficiency - A Case of Convertible Bond Hedging, working
paper, Amos Tuck School of Business, Dartmouth College.
Buchan, Jane, 1998b, The pricing of convertible bonds with stochastic term structures and corporate
default risk, working paper, Amos Tuck School of Business, Dartmouth College.
Carayannopoulos, Peter, 1996, Valuing convertible bonds under the assumption of stochastic
interest rates: An empirical investigation, Quarterly Journal of Business and Economic 35 (3),17-31.
21
Carayannopoulos, Peter, and Madhu Kalimipalli, 2003, Convertible Bond Prices and Inherent
Biases, Working paper, The Mutual Group Financial Services Research Center, School of Business
and Economics, Wilfrid Laurier University.
Connolly, Kevin B., 1998, Pricing Convertible Bonds, John Wiley, New York.
Duffie, Darrell, and Kenneth J. Singleton, 1999, Modelling Term Structure Models of Defaultable
Bonds, Review of Financial Studies 12 , 687-720.
Fan, Hua and Suresh M. Sundaresan, 2000, Debt Valuation, Renegotiation and Optimal Dividend
Policy, Review of Financial Studies 13, 1057-99.
Hamilton, David T., 2001, Default and Recovery Rates of Convertible Bond Issuers: 1970-2000,
Moody’s Special Comment, Moody’s Investors Service.
Ingersoll, Jonathan, 1977a, A Contingent-Claims Valuation of Convertible Securities, Journal of
Financial Economics 4, 289-321.
Ingersoll, Jonathan, 1977b, An Examination of Corporate Call Policies on Convertible Securities,
Journal of Finance 32, 463-478.
Jones, E. Philip, Scott P. Mason, and Eric Rosenfeld, 1984, Contingent Claims Analysis of
Corporate Capital Structures: An Empirical Investigation, Journal of Finance 39, 611-625.
Kang, Jun-Koo, and Yul W. Lee, 1996, The pricing of convertible debt offerings, Journal of
Financial Economics 41 (2), 231-248
King, Raymond D., 1986, Convertible bond valuation: An empirical test, Journal of Financial
Research 9 (1), 53-69.
Lauterbach, Beni, and Paul Schultz, 1990, Pricing Warrants: An Empirical Study of Black-Scholes
Model and Its Alternatives, Journal of Finance 45, 1181-1209.
McConnell, John J., and Eduardo S. Schwartz, 1986, LYON Taming, Journal of Finance 41, 561-
576.
22
Merton, Robert C., 1973, Theory of Rational Option Pricing, Bell Journal of Economics and
Management Science 4, 141-183.
Merton, Robert C., 1974, On the Pricing of Corporate Debt: The Risk Structure of Interest Rates,
Journal of Finance 29, 449-470.
Ramaswamy, Kriskna, and Suresh M. Sundaresan, 1986, The Valuation of Floating Rate
Instruments: Theory and Evidence, Journal of Finance Economics 17, 251-272.
Rosengren, Eric S., 1993, Defaults of Original Issue High-Yield Convertible Bonds, Journal of
Finance 48, 345-362.
Tsiveriotis, Kostas, and Chris Fernandes, 1998, Valuing convertible bonds with credit risk, The
Journal of Fixed Income 8 (2), 95-102.
Takahashi, Akihiko, Takao Kobayashi, and Naruhisa Nakagawa, 2001, Pricing Convertible Bonds
with Default Risk, The Journal of Fixed Income 11 (3), 20-29.
23
Table 1
Initial Pricing Error and Pricing Error of the First Available Market Price Observation
Panel A. Mean Initial Pricing Error The theoretical price is calculated from the Tsiveriotis and Fernandes model. The Initial Pricing Error is calculated as ⎟
⎠⎞
⎜⎝⎛
Price Bond lTheoreticaPrice Bond lTheoretica - Price Offering Initial . The initial rating score is defined by the initial credit rating of
convertible bond from Moody’s.
Initial Moody's Rating
Initial Moody's Rating Score
Number of Bond Samples
Mean of Initial Pricing Error
Aaa 1 1 5.62% Aa1 2 0 - Aa2 3 0 - Aa3 4 1 -9.88% A1 5 3 -4.44% A2 6 7 -5.84% A3 7 4 -5.49%
Baa1 8 19 -8.78% Baa2 9 11 -8.74% Baa3 10 13 -7.17% Ba1 11 7 -8.47% Ba2 12 6 -6.25% Ba3 13 15 -11.65% B1 14 6 -13.80% B2 15 14 -15.14%
107
Panel B. Relationship between the Initial Pricing Error and the Initial Credit Rating of the
Convertible Bonds Regression results for the convertible bond sample:
( ) iεβα +×+= ii Score RatingCredit InitialError Pricing Initial
Parameters Estimated Value Standard Error t-value p-value α 0.00230 0.02017 0.11 0.9093 β -0.00927 0.00186 -4.97 <.0001
Panel C. Relationship between the Pricing Error of the First Available Market Price
Observation and the Initial Credit Rating of the Convertible Bonds Regression results for the convertible bond sample:
( ) iεβα +×+= ii Score RatingCredit InitialError Pricing
Parameters Estimated Value Standard Error t-value p-value α 0.02284 0.02611 0.87 0.3837 β -0.00804 0.00241 -3.33 0.0012
24
Table 2
Mean Pricing Errors of the Three Initial Rating Groups
Convertible bonds are divided into three groups. Group (1) consists of convertible bonds with initial ratings between Aaa and A3. Group (2) consists of convertible bonds with initial ratings between Baa1 and Baa3. Group (3) consists of convertible bonds with initial ratings between Ba1 and B2. Panel A. Summary Statistics of Mean Initial Pricing Errors at Bond Issuance
The initial pricing error is calculated as ⎟⎠⎞
⎜⎝⎛
Price Bond lTheoretica TFPrice Bond lTheoretica TF - Price Offering Initial .
Classification by Initial Moody's Rating N Mean
Standard Deviation Minimum Maximum
Group (1): Aaa to A3 16 -5.03% 5.01% -15.69% 5.62% Group (2): Baa1 to Baa3 43 -8.28% 6.06% -24.12% 0.07% Group (3): Ba1 to B2 48 -11.80% 6.63% -25.55% 6.97% The ANOVA F-test is a test for the equality in means of initial pricing errors for the three groups. Source DF F-value Pr > F Model 2 8.30 0.0005 Error 104 Corrected Total 106 Panel B. Summary Statistics of Mean pricing Errors of the First Available Market Price
Observation
The pricing error of first available observation is calculated as ⎟⎠⎞
⎜⎝⎛
Price Bond lTheoretica TFPrice Bond lTheoretica TF - Price BondMarket .
Classification by Initial Moody's Rating N Mean
Standard Deviation Minimum Maximum
Group (1): Aaa to A3 16 -2.35% 4.00% -10.67% 4.83% Group (2): Baa1 to Baa3 43 -5.43% 8.34% -32.25% 7.77% Group (3): Ba1 to B2 48 -7.84% 8.48% -28.01% 5.65% The ANOVA F-test is a test for the equality in means of pricing errors of the first available observations for the three groups. Source DF F-value Pr > F Model 2 3.10 0.0494 Error 104 Corrected Total 106
25
Table 3
Change in Mean Pricing Error after the First Detected Stock Price Collapse
Panel A. Convertible Bonds with Stock Price Collapses This table presents the change of pricing error for convertible bonds in relation to the first detected stock price collapse. We define a stock price collapse as the underlying stock price dropping by more than 50% within the last 10 trading days. “Date” indicates the first detected stock price collapse. “Last 10 days’ Mean Pricing Error” is the mean pricing error of the bond during the last 10 days before the first detected stock price collapse. “Next 10 days’ Mean Pricing Error” is the mean pricing error of the bond during the next 10 days after the first detected stock price collapse. “Change in Mean Pricing Error” is the “Next10 days’ Mean Pricing Error” less the “Last 10 days’ Mean Pricing Error”.
Next 10 days Last 10 days Change in OBS Bond Code Date Mean Pricing Error Mean Pricing Error Mean Pricing Error
(ε +10days) (ε -10days) (ε +10days - ε -10days) 1 16008N 20010404 -27.48% -27.83% 0.34% 2 16115U 20020725 -20.59% -16.84% -3.75% 3 16420F 20010918 -18.50% -13.40% -5.10% 4 16702P 20011019 -50.83% -20.73% -30.09% 5 17359N 20020205 -7.78% 0.22% -8.00% 6 17386M 20010918 -23.64% -10.81% -12.83% 7 18596W 20020731 -35.41% -26.96% -8.45% 8 18891D 20020927 -64.67% -56.34% -8.33% 9 19086V 20021015 -67.64% -52.51% -15.12%
10 19119E 20020919 -5.76% 0.71% -6.46% 11 19401W 20020725 -50.40% -26.41% -23.99% 12 223250 20010403 -16.66% -17.03% 0.37% 13 234179 20020621 -35.01% -16.32% -18.69% 14 252305 20020614 -22.38% -16.24% -6.14% 15 252395 20020920 -2.80% -2.46% -0.34%
Panel B. Test of the Change in Mean Pricing Error Being Zero The change in the mean pricing error after the first stock price collapse [Difference between the pricing error over last 10 days and the pricing error over next 10 days; i.e. (ε +10days - ε -10days).]
N Mean Std Error t-statistics P-value
15 -9.77% 0.0231 -4.42 0.0008
26
Table 4
Pricing Error at the First Detected Stock Price Collapse Relative to the Mean Pricing Error of Control Group
Panel A. The control group of convertible bond samples is composed of all bond samples without any detected stock price collapses. Convertible Bonds with Stock Price Collapse Control Group
Next 10 days Last 10 days Observations Next 10 days Last 10 daysObs Bond Code DATE Pricing Error Mean Pricing Error Mean Pricing Error in Control Group Mean Pricing Error Mean Pricing Error Mean Pricing Error
1 16008N 20010404 -24.90% -27.48% -27.83% 22 -8.41% -7.70% -9.10%2 16115U 20020725 -18.79% -20.59% -16.84% 70 -3.85% -3.60% -3.62%3 16420F 20010918 -8.40% -18.50% -13.40% 41 -3.87% -4.64% -5.12%4 16702P 20011019 -40.85% -50.83% -20.73% 46 -3.98% -3.39% -4.37%5 17359N 20020205 -1.98% -7.78% 0.22% 51 -1.18% -1.53% -1.86%6 17386M 20010918 -4.29% -23.64% -10.81% 41 -3.87% -4.64% -5.12%7 18596W 20020731 -26.18% -35.41% -26.96% 69 -2.96% -3.76% -3.74%8 18891D 20020927 -60.42% -64.67% -56.34% 69 -1.48% -1.90% -2.72%9 19086V 20021015 -60.59% -67.64% -52.51% 68 -1.55% -0.64% -1.94%
10 19119E 20020919 -1.51% -5.76% 0.71% 71 -2.37% -2.23% -3.17%11 19401W 20020725 -31.18% -50.40% -26.41% 70 -3.85% -3.60% -3.62%12 223250 20010403 -17.37% -16.66% -17.03% 23 -8.76% -7.83% -9.05%13 234179 20020621 -23.46% -35.01% -16.32% 63 -2.95% -2.73% -3.22%14 252305 20020614 -12.95% -22.38% -16.24% 63 -3.46% -2.91% -3.14%15 252395 20020920 -2.31% -2.80% -2.46% 70 -2.85% -2.10% -2.99%
Mean -29.97% -20.20% Mean -3.55% -4.18%Change in Mean -9.77% Change in Mean 0.64%
Panel B. The Difference between the Change in Mean Pricing Error (from the last 10 days to the next 10 days) of Convertible Bond
with the First Detected Stock Price Collapse and the Change in Mean Pricing Error (from the last 10 days to the next 10
days) of Control Group
N Mean Std Error t-statistics P-value
15 -10.41% 0.02288 -4.55 0.0005
27
Table 5
Time-Series for Mean Pricing Errors of Convertible Bonds without Any Subsequent Downgrade over 500 weekdays after the First Available Observation
This table summarizes the convergence of convertible bond market price to the theoretical bond price for convertible bonds which do not experience any subsequent downgrade. “DATE” indicates the number of weekdays after the first available bond market observations from Datastream dataset. “OBS” indicates the number of bonds. “Mean” indicates the mean value of pricing errors. The pricing error is calculated as ⎟
⎠⎞
⎜⎝⎛
Price Bond lTheoretica TFPrice Bond lTheoretica TF - Price BondMarket .
“T_TEST” indicates the t-statistics for testing 0Error Pricing:0 =H . “PROBT” is the p-value for the t-test.
All Samples High Grade Medium Grade Low Grade
INDEX DATE OBS MEAN T_TEST PROBT OBS MEAN T_TEST P-VALUE N MEAN T_TEST P-VALUE N MEAN T_TEST P-VALUE
1 0 82 -4.34% -5.5640 0.0000 13 -2.46% -2.2951 0.0406 32 -3.86% -2.4781 0.0189 37 -5.41% -5.3669 0.00002 20 82 -4.00% -4.9418 0.0000 13 -1.63% -1.4401 0.1754 32 -3.32% -2.2013 0.0353 37 -5.41% -4.7548 0.00003 40 81 -3.25% -3.9240 0.0002 13 -0.78% -0.7258 0.4819 32 -3.10% -2.0236 0.0517 36 -4.27% -3.5584 0.00114 60 81 -2.26% -3.1014 0.0027 13 -0.41% -0.3931 0.7012 32 -1.70% -1.3056 0.2013 36 -3.42% -3.1601 0.00335 80 66 -2.22% -2.5706 0.0125 12 0.30% 0.2083 0.8388 25 -2.21% -1.4942 0.1482 29 -3.27% -2.3953 0.02356 100 65 -2.00% -2.3767 0.0205 11 2.19% 2.6677 0.0236 25 -1.60% -1.1821 0.2488 29 -3.93% -2.9313 0.00677 120 64 -1.89% -2.4365 0.0177 10 2.04% 3.3826 0.0081 25 -1.43% -1.1666 0.2548 29 -3.64% -2.9490 0.00648 140 60 -1.17% -1.6842 0.0974 10 2.80% 4.4805 0.0015 22 -1.19% -1.0695 0.2970 28 -2.58% -2.3678 0.02539 160 60 -0.44% -0.6780 0.5004 10 2.59% 3.9187 0.0035 22 -0.26% -0.2454 0.8086 28 -1.67% -1.6049 0.120210 180 51 -0.32% -0.4327 0.6671 9 1.36% 1.5559 0.1583 17 0.51% 0.5540 0.5873 25 -1.50% -1.1216 0.273111 200 47 -0.08% -0.1332 0.8946 8 0.96% 1.1539 0.2864 15 -0.51% -0.5112 0.6172 24 -0.15% -0.1657 0.869912 220 42 -0.45% -0.6329 0.5303 7 1.81% 3.5823 0.0116 14 -0.26% -0.2718 0.7901 21 -1.33% -1.0759 0.294813 240 40 -0.27% -0.3724 0.7116 7 1.67% 3.4539 0.0136 13 -0.17% -0.1527 0.8812 20 -1.02% -0.8175 0.423814 260 38 0.48% 0.6943 0.4918 6 1.38% 1.8811 0.1187 13 0.33% 0.3104 0.7616 19 0.31% 0.2563 0.800615 280 38 1.20% 1.6561 0.1062 6 1.27% 1.2781 0.2573 13 1.74% 2.4563 0.0302 19 0.81% 0.5994 0.556416 300 37 0.65% 0.7558 0.4547 6 0.87% 1.1648 0.2966 13 0.53% 0.3884 0.7046 18 0.66% 0.4460 0.661317 320 34 0.72% 0.8792 0.3856 6 1.56% 1.5021 0.1934 13 0.64% 0.4314 0.6738 15 0.45% 0.3384 0.740118 340 33 1.00% 1.1076 0.2763 6 2.64% 2.8642 0.0352 12 0.20% 0.1040 0.9190 15 0.98% 0.7976 0.438419 360 32 0.94% 0.9405 0.3542 6 2.59% 4.8528 0.0047 11 0.28% 0.1374 0.8934 15 0.76% 0.4865 0.634120 380 30 -0.03% -0.0236 0.9813 6 2.45% 4.6094 0.0058 11 -0.30% -0.1160 0.9100 13 -0.95% -0.4893 0.633521 400 29 0.37% 0.3007 0.7659 5 2.81% 3.9685 0.0166 11 0.98% 0.3851 0.7083 13 -1.09% -0.6395 0.534622 420 29 1.15% 0.9866 0.3323 5 2.73% 4.9725 0.0076 11 0.93% 0.4021 0.6961 13 0.72% 0.4089 0.689823 440 27 0.46% 0.3211 0.7507 3 1.72% 1.6516 0.2404 11 1.24% 0.5425 0.5994 13 -0.49% -0.2081 0.838724 460 17 0.22% 0.1500 0.8826 3 1.97% 2.0824 0.1727 5 0.14% 0.0483 0.9638 9 -0.32% -0.1360 0.895225 480 15 0.24% 0.1580 0.8767 2 0.97% 1.9887 0.2966 5 -0.48% -0.1315 0.9017 8 0.51% 0.2625 0.800526 500 13 0.52% 0.3756 0.7138 1 1.80% . . 4 -0.20% -0.0714 0.9476 8 0.73% 0.3831 0.7130

28
Table 6
Time-Series for Mean Pricing Errors of Convertible Bonds without Any Subsequent Change in Credit Rating over 500 weekdays after the First Available Observations
This table summarizes the convergence of convertible bond market price to the theoretical bond price for convertible bonds which do not experience any subsequent change in credit rating. “DATE” indicates the number of weekdays after the first available bond market observations from Datastream dataset. “OBS” indicates the number of bonds. “Mean” indicates the mean value of pricing errors. The pricing error is calculated as
⎟⎠⎞
⎜⎝⎛
Price Bond lTheoretica TFPrice Bond lTheoretica TF - Price BondMarket . “T_TEST” indicates the t-statistics for testing 0Error Pricing:0 =H . “PROBT” is the p-value for the t-test.
All Samples High Grade Medium Grade Low Grade
INDEX DATE OBS MEAN T_TEST PROBT OBS MEAN T_TEST P-VALUE N MEAN T_TEST P-VALUE N MEAN T_TEST P-VALUE
1 0 68 -4.44% -4.9150 0.0000 12 -2.37% -2.0429 0.0658 29 -4.02% -2.3378 0.0268 27 -5.81% -4.7905 0.00012 20 68 -4.01% -4.4545 0.0000 12 -1.76% -1.4386 0.1781 29 -3.56% -2.1488 0.0405 27 -5.50% -4.3048 0.00023 40 67 -3.16% -3.2917 0.0016 12 -0.96% -0.8309 0.4237 29 -3.32% -1.9751 0.0582 26 -4.00% -2.6085 0.01514 60 67 -2.37% -2.8185 0.0064 12 -0.44% -0.3886 0.7050 29 -2.01% -1.4238 0.1655 26 -3.67% -2.6443 0.01395 80 52 -2.53% -2.3790 0.0211 11 0.39% 0.2505 0.8073 22 -2.60% -1.5730 0.1307 19 -4.13% -2.0995 0.05016 100 51 -2.16% -2.1052 0.0403 10 2.40% 2.7277 0.0233 22 -1.93% -1.2649 0.2198 19 -4.83% -2.5796 0.01897 120 50 -2.10% -2.2561 0.0286 9 2.06% 3.0474 0.0159 22 -1.70% -1.2254 0.2340 19 -4.52% -2.7562 0.01308 140 46 -1.23% -1.4778 0.1464 9 2.80% 3.9990 0.0040 19 -1.63% -1.2947 0.2118 18 -2.81% -1.9220 0.07159 160 46 -0.69% -0.8568 0.3961 9 2.74% 3.8048 0.0052 19 -0.52% -0.4238 0.6767 18 -2.57% -1.8330 0.084410 180 37 -0.75% -0.7967 0.4309 8 1.28% 1.2926 0.2372 14 0.05% 0.0449 0.9649 15 -2.58% -1.3066 0.212411 200 33 -0.51% -0.7005 0.4887 7 0.82% 0.8688 0.4183 12 -0.95% -0.7747 0.4549 14 -0.80% -0.6137 0.550012 220 29 -0.96% -1.0581 0.2991 6 1.43% 3.5839 0.0158 11 -0.89% -0.7820 0.4524 12 -2.23% -1.1777 0.263813 240 28 -0.45% -0.4865 0.6305 6 1.60% 2.8271 0.0368 10 -1.14% -0.8690 0.4075 12 -0.89% -0.4883 0.634914 260 26 0.10% 0.1027 0.9190 5 1.39% 1.5427 0.1978 10 -0.41% -0.3217 0.7551 11 -0.02% -0.0121 0.990615 280 26 0.72% 0.7681 0.4496 5 1.53% 1.3009 0.2632 10 1.23% 1.4546 0.1798 11 -0.11% -0.0520 0.959616 300 25 0.02% 0.0160 0.9874 5 0.91% 0.9976 0.3750 10 -0.14% -0.0810 0.9372 10 -0.27% -0.1101 0.914717 320 23 0.16% 0.1586 0.8754 5 1.32% 1.0684 0.3456 10 0.51% 0.2775 0.7877 8 -1.00% -0.5481 0.600718 340 23 0.98% 0.8270 0.4171 5 2.74% 2.4442 0.0709 10 0.42% 0.1805 0.8608 8 0.57% 0.3220 0.756919 360 22 0.52% 0.3859 0.7035 5 2.59% 3.9559 0.0167 9 0.20% 0.0817 0.9369 8 -0.41% -0.1630 0.875120 380 21 -0.21% -0.1219 0.9042 5 2.17% 3.9053 0.0175 9 -0.53% -0.1674 0.8712 7 -1.51% -0.4370 0.677421 400 20 0.40% 0.2364 0.8157 4 2.70% 2.9900 0.0581 9 0.98% 0.3121 0.7629 7 -1.65% -0.5833 0.580922 420 20 0.80% 0.5239 0.6064 4 2.61% 3.7732 0.0326 9 1.12% 0.3937 0.7041 7 -0.66% -0.2689 0.797023 440 18 0.14% 0.0742 0.9417 2 1.42% 0.8216 0.5622 9 1.52% 0.5417 0.6028 7 -1.99% -0.5615 0.594824 460 10 -0.75% -0.3229 0.7542 2 2.09% 1.2920 0.4193 4 0.02% 0.0056 0.9959 4 -2.93% -0.6189 0.579825 480 9 -0.55% -0.2324 0.8221 1 0.48% . . 4 -0.86% -0.1819 0.8673 4 -0.50% -0.1496 0.890626 500 9 -0.03% -0.0181 0.9860 1 1.80% . . 4 -0.20% -0.0714 0.9476 4 -0.32% -0.0977 0.9284
29
Table 7
Time-Series for Mean Pricing Errors of Convertible Bonds with Subsequent Downgrade(s) over 500 weekdays after the First Available Observations
This table summarizes the time-series of convertible bond market price relative to the theoretical bond price for convertible bonds with at least one subsequent downgrade. “DATE” indicates the number of weekdays after the first available bond market observations from Datastream dataset. “OBS” indicates the number of bonds. “Mean” indicates the mean value of pricing error. The pricing error is calculated as ⎟
⎠⎞
⎜⎝⎛
Price Bond lTheoretica TFPrice Bond lTheoretica TF - Price BondMarket . “T_TEST”
indicates the t-statistics for testing 0Error Pricing:0 =H . “PROBT” is the p-value for the t-test.
All Samples High Grade Medium Grade Low Grade
INDEX DATE OBS MEAN T_TEST PROBT OBS MEAN T_TEST P-VALUE N MEAN T_TEST P-VALUE N MEAN T_TEST P-VALUE
1 0 25 -11.66% -6.6122 0.0000 3 -1.85% -0.5878 0.6162 11 -9.99% -7.3352 0.0000 11 -16.00% -5.1182 0.00052 20 25 -11.36% -6.2934 0.0000 3 -2.93% -1.1267 0.3769 11 -8.84% -7.9625 0.0000 11 -16.18% -4.8166 0.00073 40 25 -10.26% -6.2199 0.0000 3 -2.36% -1.9158 0.1955 11 -8.29% -5.7262 0.0002 11 -14.39% -4.8325 0.00074 60 25 -10.01% -5.9875 0.0000 3 -0.87% -0.4023 0.7264 11 -8.68% -4.1559 0.0020 11 -13.83% -5.3384 0.00035 80 24 -10.65% -6.4701 0.0000 3 -0.15% -0.0578 0.9592 10 -10.21% -4.6073 0.0013 11 -13.92% -6.1440 0.00016 100 24 -12.10% -5.9702 0.0000 3 -0.22% -0.0832 0.9413 10 -12.88% -3.5421 0.0063 11 -14.63% -6.6282 0.00017 120 24 -13.96% -5.2498 0.0000 3 -0.33% -0.1746 0.8775 10 -14.76% -3.1763 0.0113 11 -16.94% -4.9760 0.00068 140 24 -14.11% -5.1684 0.0000 3 -1.06% -0.6507 0.5820 10 -13.59% -3.8068 0.0042 11 -18.15% -4.0040 0.00259 160 24 -15.38% -4.2924 0.0003 3 0.04% 0.0199 0.9859 10 -16.10% -2.5637 0.0305 11 -18.94% -3.8533 0.003210 180 24 -15.31% -4.7759 0.0001 3 -1.57% -0.9609 0.4380 10 -16.17% -2.7895 0.0211 11 -18.29% -4.3265 0.001511 200 24 -17.28% -4.6573 0.0001 3 -2.49% -2.4385 0.1350 10 -19.07% -2.6008 0.0287 11 -19.69% -4.6134 0.001012 220 23 -18.40% -5.1109 0.0000 3 -0.68% -1.3269 0.3158 9 -18.99% -2.8390 0.0219 11 -22.74% -5.1085 0.000513 240 23 -17.47% -5.0107 0.0001 3 -3.69% -1.7762 0.2177 9 -18.04% -2.5754 0.0329 11 -20.75% -4.9963 0.000514 260 22 -14.23% -4.2611 0.0004 3 -3.70% -3.6812 0.0665 8 -9.76% -2.2142 0.0624 11 -20.34% -3.8002 0.003515 280 21 -13.87% -4.0212 0.0007 3 -3.83% -27.2040 0.0014 8 -8.60% -2.0425 0.0804 10 -21.09% -3.6802 0.005116 300 21 -11.99% -4.7216 0.0001 3 -4.01% -5.5372 0.0311 8 -8.47% -2.4303 0.0454 10 -17.19% -4.2655 0.002117 320 21 -11.88% -4.5607 0.0002 3 -3.24% -3.6099 0.0689 8 -7.93% -2.5387 0.0387 10 -17.64% -4.1578 0.002518 340 21 -9.84% -4.2252 0.0004 3 -2.79% -2.0475 0.1772 8 -6.98% -2.5342 0.0390 10 -14.25% -3.5697 0.006019 360 19 -8.95% -3.8285 0.0012 2 -3.02% -11.7988 0.0538 7 -5.13% -2.0258 0.0892 10 -12.81% -3.4001 0.007920 380 16 -9.98% -3.1807 0.0062 2 -3.23% -3.1733 0.1943 7 -4.01% -2.2145 0.0687 7 -17.88% -3.0485 0.022621 400 16 -12.93% -3.7177 0.0021 2 -5.57% -2.0168 0.2930 7 -6.56% -2.1583 0.0743 7 -21.39% -3.4614 0.013422 420 16 -11.56% -3.1970 0.0060 2 -3.63% -1.1635 0.4520 7 -3.80% -1.4041 0.2099 7 -21.58% -3.5413 0.012223 440 16 -11.76% -2.5592 0.0218 2 -4.16% -1.2784 0.4226 7 -1.34% -0.7729 0.4689 7 -24.34% -2.9130 0.026924 460 15 -10.62% -2.0621 0.0583 1 -6.62% . . 7 1.67% 0.7690 0.4711 7 -23.48% -2.7173 0.034825 480 12 -8.34% -1.6055 0.1367 1 -4.82% . . 5 3.16% 1.4622 0.2175 6 -18.50% -2.1733 0.081826 500 12 -6.05% -1.6011 0.1377 1 -5.55% . . 5 2.62% 1.4776 0.2136 6 -13.34% -2.1804 0.0811
30
Table 8
Time-Series for Mean Pricing Errors of Out-of-the-Money Convertible Bond Samples without Any Subsequent Downgrade over 500 weekdays after the First Available Observations
This table summarizes the convergence of convertible bond market price to the theoretical bond price for convertible bonds, which have moneyness in between 50% and 90% at the end of the sample period and do not experience any subsequent downgrade. “DATE” indicates the number of weekdays after the first available bond market observations from Datastream dataset. “OBS” indicates the number of bonds. “Mean” indicates the mean value of pricing error. The pricing error is calculated from ⎟
⎠⎞
⎜⎝⎛
Price Bond lTheoretica TFPrice Bond lTheoretica TF - Price BondMarket . “T_TEST” indicates the t-statistics for testing 0Error Pricing:0 =H . “PROBT” is the
p-value for the t-test.
All Samples High Grade Medium Grade Low GradeINDEX DATE OBS MEAN T_TEST PROBT OBS MEAN T_TEST P-VALUE N MEAN T_TEST P-VALUE N MEAN T_TEST P-VALUE
1 0 20 -7.81% -4.1180 0.0006 1 -1.60% . . 5 -13.64% -2.2897 0.0839 14 -6.18% -4.1001 0.00132 20 20 -7.52% -3.7385 0.0014 1 -1.60% . . 5 -11.72% -1.9499 0.1230 14 -6.44% -3.3453 0.00533 40 19 -6.68% -2.7321 0.0137 1 0.54% . . 5 -12.14% -1.7040 0.1636 13 -5.14% -2.2709 0.04244 60 19 -4.49% -2.2606 0.0364 1 1.39% . . 5 -7.28% -1.3736 0.2415 13 -3.87% -1.8156 0.09455 80 15 -3.77% -1.6237 0.1267 1 2.59% . . 4 -6.56% -1.1080 0.3487 10 -3.29% -1.2360 0.24776 100 15 -3.92% -1.6936 0.1125 1 2.52% . . 4 -5.30% -0.9278 0.4220 10 -4.02% -1.4546 0.17987 120 14 -3.86% -2.0029 0.0665 - - - - 4 -3.35% -0.6603 0.5563 10 -4.06% -2.0175 0.07448 140 10 -3.25% -1.4910 0.1702 - - - - 1 2.56% . . 9 -3.89% -1.6737 0.13279 160 10 -2.60% -1.1249 0.2897 - - - - 1 2.20% . . 9 -3.13% -1.2461 0.2480
10 180 10 -1.02% -0.4600 0.6564 - - - - 1 3.16% . . 9 -1.48% -0.6134 0.556711 200 9 0.78% 0.4982 0.6318 - - - - 1 0.81% . . 8 0.78% 0.4376 0.674912 220 9 -1.28% -0.6057 0.5615 - - - - 1 1.25% . . 8 -1.59% -0.6738 0.522113 240 8 -0.47% -0.2188 0.8331 - - - - 1 0.70% . . 7 -0.64% -0.2576 0.805414 260 8 -0.21% -0.1058 0.9187 - - - - 1 0.71% . . 7 -0.34% -0.1496 0.886015 280 8 1.22% 0.7071 0.5024 - - - - 1 3.24% . . 7 0.93% 0.4735 0.652616 300 8 1.72% 0.8299 0.4340 - - - - 1 4.87% . . 7 1.27% 0.5444 0.605817 320 7 1.77% 0.9153 0.3953 - - - - 1 4.86% . . 6 1.25% 0.5687 0.594218 340 7 2.52% 1.3004 0.2412 - - - - 1 7.43% . . 6 1.70% 0.8188 0.450119 360 7 2.83% 1.8575 0.1126 - - - - 1 5.41% . . 6 2.40% 1.3882 0.223820 380 6 2.86% 2.3544 0.0652 - - - - 1 5.34% . . 5 2.36% 1.7406 0.156721 400 6 1.54% 0.9588 0.3817 - - - - 1 6.26% . . 5 0.60% 0.3757 0.726222 420 6 2.18% 1.3185 0.2445 - - - - 1 7.61% . . 5 1.09% 0.7159 0.513623 440 6 1.52% 0.8941 0.4122 - - - - 1 6.90% . . 5 0.44% 0.2737 0.797924 460 4 0.97% 0.3856 0.7255 - - - - - - - - 4 0.97% 0.3856 0.725525 480 4 2.56% 2.3112 0.1039 - - - - - - - - 4 2.56% 2.3112 0.103926 500 4 2.50% 1.4166 0.2516 - - - - - - - - 4 2.50% 1.4166 0.2516
31
Figure 1
Sanmina-SCI Corporation
0
10
20
30
40
50
60
20000907 20001216 20010326 20010704 20011012 20020120 20020430 20020808 20021116 20030224
Date
Con
vert
ible
Bon
d Pr
ice
/ C
onve
rsio
n Va
lue
Market Price Theoretical Price Theoretical Price (Ignore Put Option) Conversion Value
20021029
32
Figure 2A
Relationship between Initial Pricing Error and Initial Moody’s Credit Rating
-35%
-30%
-25%
-20%
-15%
-10%
-5%
0%
5%
10%
0 1 2 3 4 5 6 7 8 9 10 11 12 13 14 15
Initial Moody's Rating
Initi
al P
ricin
g Er
ror a
nd M
ean
of In
itial
Pric
ing
Erro
r
Initial Pricing Error Mean of Initial Pricing Error Regression Line
33
Figure 2B
Relationship between Pricing Error of the First Available Market Price Observation and Initial Moody’s Credit Rating
-35%
-30%
-25%
-20%
-15%
-10%
-5%
0%
5%
10%
0 1 2 3 4 5 6 7 8 9 10 11 12 13 14 15
Initial Moody's Rating
Pric
ing
Erro
r and
Mea
n Pr
icin
g Er
ror a
t the
Firs
t Ava
ilabl
e O
bser
vatio
n D
ate
Pricing Error at 1st Available Observation Date Mean of Pricing Error at 1st Available Observation Date Regression Line
34
Figure 3
Time Series for the Mean Pricing Errors for Convertible Bonds without Any Subsequent Downgrade over 500 Weekdays after the First Available Observations
-30%
-25%
-20%
-15%
-10%
-5%
0%
5%
10%
0 50 100 150 200 250 300 350 400 450 500
Weekdays after the First Available Bond Price Observation from Datastream
Mea
n of
Pric
ing
Erro
r
All-Samples High-Grade Medium-Grade Low-Grade
35
Figure 4
Time Series for Mean Pricing Errors for Convertible Bonds without any Subsequent Change in Credit Rating over 500 Weekdays after the First Available Observations
-30%
-25%
-20%
-15%
-10%
-5%
0%
5%
10%
0 50 100 150 200 250 300 350 400 450 500
Weekdays after the First Available Bond Price Observation from Datastream
Mea
n of
Pric
ing
Erro
r
All-Samples High-Grade Medium-Grade Low-Grade
36
Figure 5
Time Series for Mean Pricing Errors for Convertible Bonds with Subsequent Downgrade(s) over 500 Weekdays after the First Available Observations
-30%
-25%
-20%
-15%
-10%
-5%
0%
5%
10%
0 50 100 150 200 250 300 350 400 450 500
Weekdays after the First Available Bond Price Observation from Datastream
Mea
n of
Pric
ing
Erro
r
All-Samples High-Grade Medium-Grade Low-Grade
37
Figure 6
Time Series for Mean Pricing Errors for Out-of-the-Money Convertible Bonds without Any Subsequent Downgrade over 500 Weekdays after the First Available Observations
-30%
-25%
-20%
-15%
-10%
-5%
0%
5%
10%
0 50 100 150 200 250 300 350 400 450 500
Weekdays after the First Available Bond Price Observation from Datastream
Mea
n of
Pric
ing
Erro
r
All-Samples High-Grade Medium-Grade Low-Grade

38
Appendix
Table A.1
Convertible Bond Data Sample
This table lists all U.S. convertible bond samples in our study.
Bond Code Bond Name 1 16008N TRANSWITCH CORP. CV 4 1/2% 12/09/05 S 2 16115U SANMINA CORP CV ZERO 12/09/20 3 16420F ROYAL CRBN.CRUISES CV ZERO 02/02/21 LYONS 4 16502E ARROW ELECTRONICS CV ZERO 21/02/21 5 16572F FIRST DATA CORP. CV 2% 01/03/08 S 6 16609C NABORS INDS.INCO. CV ZERO 20/06/20 7 16693J PRIDE INTL.INCO. CV ZERO 16/01/21 8 16693W CENDANT CORP. CV ZERO 13/02/21 9 16702P PROVIDIAN_FINL.CORP. CV ZERO 15/02/21
10 16749R OMNICOM GROUP INCO. CV ZERO 07/02/31 11 16950L DANAHER CORP. CV ZERO 22/01/21 12 17003F LENNAR CORPORATION CV ZERO 04/04/21 13 17119L AFFILIATED COM.SVS. CV 3 1/2% 15/03/06 14 17154U BARNES & NOBLE INCO. CV 5 1/4% 15/03/09 S 15 17320E TRANSOCEAN SEDCO. CV 1 1/2% 15/05/21 S 16 17325M DR HORTON INCO. CV ZERO 11/05/21 17 17359N TYCO INTL.GROUP CV ZERO 12/02/21 18 17378P COOPER CAMERON CORP CV 1 3/4% 17/05/21 S 19 17378Q COOPER CAMERON CORP. CV ZERO 17/05/21 20 17386M ROYAL CRBN.CRUISES CV ZERO 18/05/21 LYONS 21 17443Q MERRILL LYNCH & CO. CV ZERO 23/05/31 22 17473H JONES APPAREL GROUP CV ZERO 01/02/21 23 17638M AMERISOURCE HEALTH CV 5% 01/12/07 S 24 17660J SPX CORP. CV ZERO 06/02/21 25 17669K COUNTRY.CR.INDS.INCO. CV ZERO 28/02/31 LYONS 26 17669L DIAMOND OFFSHORE CV 1 1/2% 15/04/31 S 27 17669P SHAW GROUP INCO. CV ZERO 01/05/21 28 17669U CENDANT CORP. CV ZERO 04/05/21 29 17670D VERIZON COMMS.INCO. CV ZERO 15/05/21 30 17699R TJX COS.INCO. CV ZERO 13/02/21 31 17977L PMI GROUP INCO. CV 2 1/2% 15/07/21 S 32 18006W BRIGGS & STRATTON CV 5% 15/05/06 S 33 18120U LIBERTY MEDIA CORP. CV 3 1/2% 15/01/31 S 34 18181H STILWELL FINL.INCO. CV ZERO 30/04/31 35 18401V GENESCO CV 5 1/2% 15/04/05 S 36 18409C GEN.SEMICONDUCTOR CV 5 3/4% 15/12/06 S 37 18430X HANOVER COMPRESSOR CV 4 3/4% 15/03/08 S 38 18596W OAK INDUSTRIES INCO. CV 4 7/8% 01/03/08 S 39 18651C POGO PRODUCING CO. CV 5 1/2% 15/06/06 S 40 18803W WASTE CNCTS.INCO. CV 5 1/2% 15/04/06 S

39
Bond Code Bond Name 41 18891D NORTEL NETWORKS CORP. CV 4 1/4% 01/09/08 S 42 18891E MANPOWER INCO.WIS CV ZERO 17/08/21 43 18911D VALASSIS COMMS.INCO. CV ZERO 06/06/21 44 19007F CHIRON CORP CV ZERO 12/06/31 45 19086V MIRANT CORPORATION CV 2 ½% 15/06/21 S 46 19119E ELECTRONIC DATA SYS CV ZERO 10/10/21 47 19140H STARWOOD HTLS.RSTS. CV ZERO 25/05/21 48 19174X J C PENNY CO.INCO. CV 5% 20/10/08 S 49 19240N APOGENT TECHS. CV 2 1/4% 15/10/21 50 19373J CSX CORP. CV ZERO 30/10/21 51 19373K VISHAY INTECGY.INC. CV ZERO 04/06/21 52 19401W AVAYA INC CV ZERO 31/10/21 53 19428X SUPERVALU INCO. CV ZERO 02/11/31 54 19440C VENATOR GROUP INC CV 5 1/2% 01/06/08 S 55 19459U CARNIVAL CORP. CV ZERO 24/10/21 56 19460R AM.GREETINGS CORP. CV 7% 15/07/06 S 57 19482L AMERICAN INTL.GP. CV ZERO 09/11/31 58 19501W FRANKLIN RES.INCO. CV ZERO 11/05/31 59 19502C LEGG MASON INCO. CV ZERO 06/06/31 60 19551N NEXTEL COMMS.INCO. CV 6% 01/06/11 S 61 19615C QUEST DIAGNOSTICS CV 1 3/4% 30/11/21 S 62 19677X HASBRO INCO. CV 2 3/4% 01/12/21 S 63 19713V CORNING INCO. CV 3 1/2% 01/11/08 S 64 19750J TECH DATA CORP. CV 2% 15/12/21 S 65 19781Q PHOTRONICS INCO. CV 4 3/4% 15/12/06 S 66 19805F INTERPUBLIC GROUP CV ZERO 14/12/21 S 67 19838H GTECH HOLDINGS CORP. CV 1 3/4% 15/12/21 S 68 20157T RADIAN CV 2 1/4% 01/01/22 69 20267E SUNRISE ASTD.LVG. CV 5 1/4% 01/02/09 S 70 20287C GATX CORP. 2002 7 1/2% 01/02/07 S 71 20334F ACXIOM CORPORATION CV 3 3/4% 15/02/09 S 72 20481L LEAR CORP. CV ZERO 20/02/22 73 20579H AMGEN INCO. CV ZERO 01/03/32 74 20734L OHIO CLTY.CORP. CV 5% 19/03/22 75 20734M COMPUTER ASSOCS. CV 5% 15/03/07 76 20747T NAVISTAR FINL.CORP. CV 4 3/4% 01/04/09 77 20822T AIRBORNE INCO. CV 5 3/4% 01/04/07 S 78 20930V CBRL GROUP INCO. 2002 ZERO 03/04/32 79 21164D BJ SERVICES CO. CV 1/2% 24/04/22 S 80 21288P PEP BOYS-MANNY MOE CV 4 1/4% 01/06/07 S

40
Bond Code Bond Name 81 21332M IOS CAPITAL INCO. CV 5% 01/05/07 S 82 21604W BRINKER INTL.INCO. CV ZERO 10/10/21 83 21673L SPX CORP. CV ZERO 09/05/21 84 21709V CENDANT CORP. CV 3 7/8% 27/11/11 S 85 22028M HEALTH MAN.AS.INCO. CV ZERO 28/01/22 86 223250 VITESSE SEMICON.CORP CV 4% 15/03/05 S 87 224210 KOHLS CORP. CV ZERO 12/06/20 88 234179 AMKOR TECH.INCO. 2000 5% 15/03/07 S 89 238235 OMNICARE INCO. CV 5% 01/12/07 S 90 238239 HEALTHSOUTH CORP. CV 3 1/4% 01/04/03 S 91 242116 WEATHERFORD INTL. CV ZERO 30/06/20 92 244967 UNIVERSAL HLTH.SVS. CV 0.426% 23/06/20 S 93 245651 LOEWS CORP. CV 3 1/8% 15/09/07 S 94 246532 TOWER AUTOMOTIVE CV 5% 01/08/04 S 95 251802 WELLPOINT HLTH.NET. CV ZERO 02/07/19 96 251879 LAMAR ADVERTISING CV 5 1/4% 15/09/06 S 97 252005 TOTAL RENAL CARE CV 7% 15/05/09 S 98 252010 LSI LOGIC CORP CV 4 1/4% 15/03/04 S 99 252233 KERR MCGEE CORP. CV 5 1/4% 15/02/10 S 100 252251 LSI LOGIC CORP. CV 4% 15/02/05 S 101 252273 JUNIPER NETWORKS CV 4 3/4% 15/03/07 S 102 252286 ANADARKO PTL.CORP. CV ZERO 07/03/20 103 252305 COX COMMS.INCO. CV 3% 14/03/30 S 104 252395 SOLECTRON CORP. CV ZERO 08/05/20 105 252447 PERKINELMER INCO. CV ZERO 07/08/20 106 668395 AFFILIATED COM.SVS. CV 4% 15/03/05 S 107 668523 GETTY IMAGES INCO. 2000 5% 15/03/07
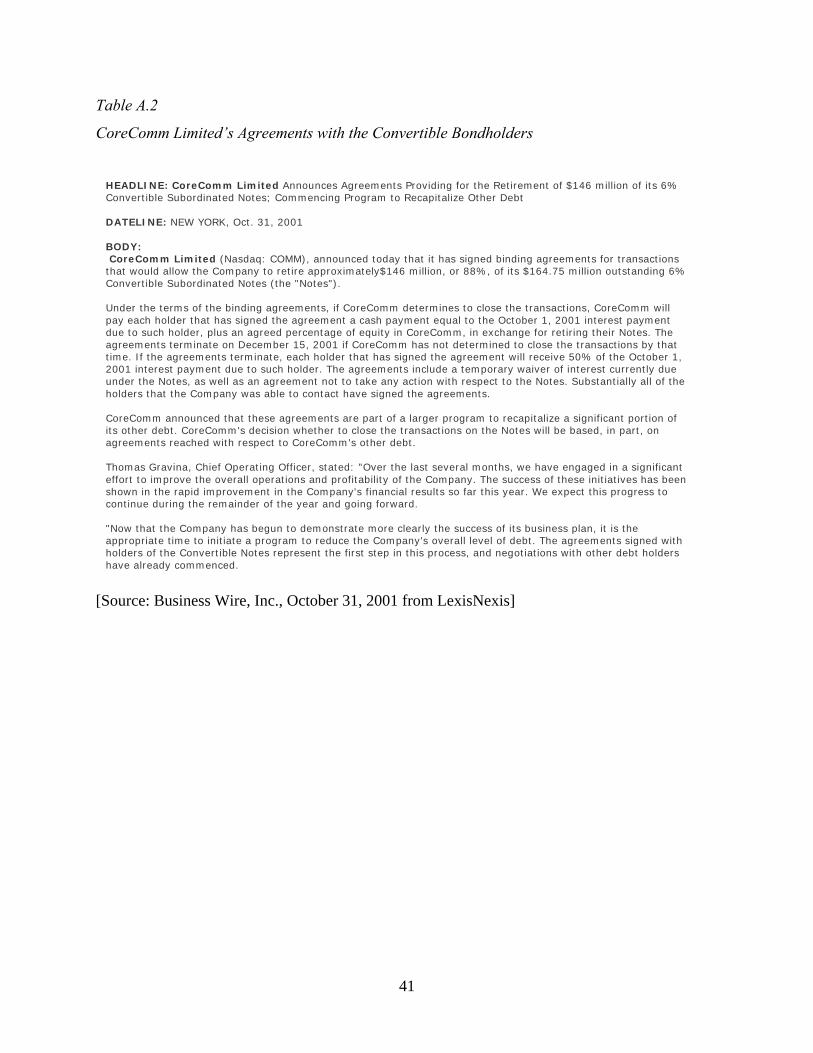
41
Table A.2
CoreComm Limited’s Agreements with the Convertible Bondholders
HEADLINE: CoreComm Limited Announces Agreements Providing for the Retirement of $146 million of its 6% Convertible Subordinated Notes; Commencing Program to Recapitalize Other Debt DATELINE: NEW YORK, Oct. 31, 2001 BODY: CoreComm Limited (Nasdaq: COMM), announced today that it has signed binding agreements for transactions that would allow the Company to retire approximately$146 million, or 88%, of its $164.75 million outstanding 6% Convertible Subordinated Notes (the "Notes"). Under the terms of the binding agreements, if CoreComm determines to close the transactions, CoreComm will pay each holder that has signed the agreement a cash payment equal to the October 1, 2001 interest payment due to such holder, plus an agreed percentage of equity in CoreComm, in exchange for retiring their Notes. The agreements terminate on December 15, 2001 if CoreComm has not determined to close the transactions by that time. If the agreements terminate, each holder that has signed the agreement will receive 50% of the October 1, 2001 interest payment due to such holder. The agreements include a temporary waiver of interest currently due under the Notes, as well as an agreement not to take any action with respect to the Notes. Substantially all of the holders that the Company was able to contact have signed the agreements. CoreComm announced that these agreements are part of a larger program to recapitalize a significant portion of its other debt. CoreComm's decision whether to close the transactions on the Notes will be based, in part, on agreements reached with respect to CoreComm's other debt. Thomas Gravina, Chief Operating Officer, stated: "Over the last several months, we have engaged in a significant effort to improve the overall operations and profitability of the Company. The success of these initiatives has been shown in the rapid improvement in the Company's financial results so far this year. We expect this progress to continue during the remainder of the year and going forward. "Now that the Company has begun to demonstrate more clearly the success of its business plan, it is the appropriate time to initiate a program to reduce the Company's overall level of debt. The agreements signed with holders of the Convertible Notes represent the first step in this process, and negotiations with other debt holders have already commenced.
[Source: Business Wire, Inc., October 31, 2001 from LexisNexis]
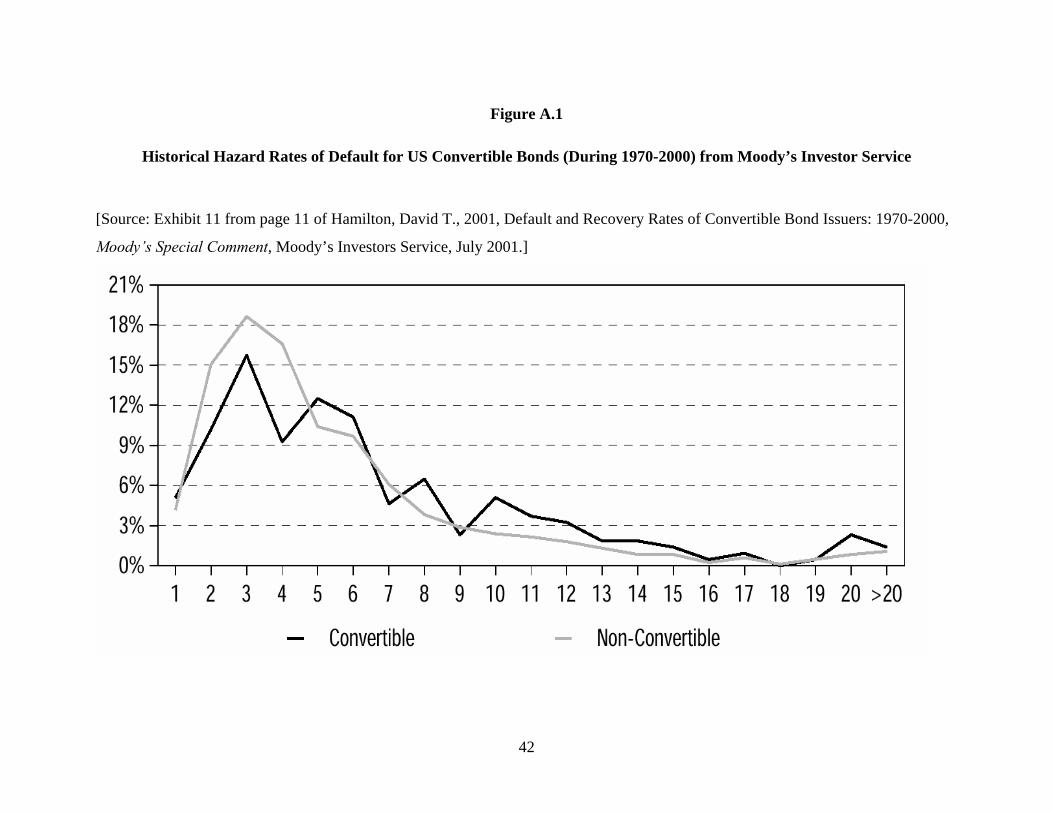
42
Figure A.1
Historical Hazard Rates of Default for US Convertible Bonds (During 1970-2000) from Moody’s Investor Service
[Source: Exhibit 11 from page 11 of Hamilton, David T., 2001, Default and Recovery Rates of Convertible Bond Issuers: 1970-2000,
Moody’s Special Comment, Moody’s Investors Service, July 2001.]