Controversies in Audiogram Interpretation - MOEMARecognition of Noise-Induced Hearing Loss Is Not...
35
Controversies in Audiogram Interpretation Michigan Occupational Health Conference Kalamazoo, MI September 21, 2019
Transcript of Controversies in Audiogram Interpretation - MOEMARecognition of Noise-Induced Hearing Loss Is Not...

Controversies in Audiogram
Interpretation
Michigan Occupational Health Conference
Kalamazoo, MI
September 21, 2019

Or, Every Thing That You Wanted
to Know About Audiometric
Notches (But Were Afraid to Ask)
Michigan Occupational Health Conference
Kalamazoo, MI
September 21, 2019

Disclaimer #1
• I work at Fiat Chrysler Automobiles as a contracted occupational medicine
physician while being directly employed by CR Associates of Newington,
VA, since 2003. I own a small amount of FCA stock. I have also interpreted
audiograms for the Henry Ford Health System’s Occupational Health
program for the past 5 years.
• All opinions expressed in this presentation are the presenter’s alone and not
necessarily those of FCA, CRA, or HFHS.

Disclaimer #2
• The conclusions presented are believed to apply to work environments in
which good hearing conservations programs exist.
• Some of the conclusions presented may not apply to work environments
with no or less than adequate hearing conservations programs.
• Some knowledge of audiometry will be helpful to get the most out of this
presentation.

Learning Objectives
1. List the general characteristics of an audiometric notch as described in ACOEM’s
2018 Guidance Statement on Work-Related Noise-Induced Hearing Loss.
2. List two benefits of using objective criteria for determining the presence or
absence of an audiometric notch.
3. Describe why most audiometric notches are false positives as indicators of noise-
induced hearing loss even in an occupationally noise-exposed population.

Recognition of Noise-Induced Hearing Loss Is Not
New
• Bernardino Ramazzini noted the relationship between working in noisy trades and hearing loss in his book, “Diseases of Workers”, published around 1700.
• A decrease in hearing at 4096 Hz related to noise exposure was first shown in the 1860’s in individuals with a long history of shooting firearms by testing with tuning forks of various frequencies.
• Audiometric testing first started in the 1920’s and showed a decrease in hearing level (labeled a “marked deafened area” or a “dip”) centered at 4000 Hz in workers exposed to noise.

What is Noise-Induced Hearing Loss?
• Per ACOEM’s “Guidance Statement on Work-Related, Noise-Induced Hearing Loss”,
September 2018:
“Its first sign is a ‘notching’ of the audiogram at the high frequencies of 3000, 4000, or
6000 Hz with recovery at 8000 Hz.”
“In early NIHL, average hearing thresholds at the lower frequencies of 500, 1000, and
2000 Hz are better than average thresholds at 3000, 4000, and 6000 Hz, and the hearing
level at 8000 Hz is usually better than the deepest part of the notch.”

“Marked Deafened Areas in Normal Ears”,
EP Fowler, MD, Archives of Otolaryngology, 1928

A Typical Audiometric Notch(from American Family Physician, 2000)

Many Published Objective Criteria for Audiometric
Notches Exist
• Mahboubi et al (2013) European Archives of Otorhinolaryngology
• Phillips et al (2010) International Journal of Audiology
• Agrawal et al (2009) Otology and Neurotology
• Hoffman et al (2006) American Journal of Epidemiology
• Dobie & Rabinowitz (2002) Spectrum (publication of the National Hearing Conservation Association)
• Niskar et al (2001) Pediatrics
• McBride and Williams (2001) Scandinavian Audiology
• Coles et al (2000) Clinical Otolaryngology and Allied Sciences
• Lees et al (1985) Canadian Journal of Public Health
• Wilson (2011) Journal of the American Academy of Audiology
• Wilson & McArdle (2013) Journal of Rehabilitation Research and Development

A Brief Summary of Audiometric Notch
Identification Criteria Used in Previous Research
1. Mahboubi et al (2013) (1) 4 kHz threshold ≥25 dB HL, (2) 4 kHz threshold ≥10 dB compared to the 2 kHz threshold and (3) 4 kHz threshold ≥10 dB compared to the 8 kHz threshold.
2. Phillips et al (2010) ND = PT – BT, where (1) ND is notch depth of at least 15 dB or more, (2) PT is the poorest threshold at 4000 and 6000 Hz followed by recovery of 5 dB in hearing threshold at subsequent high frequency and (3) BT is the best threshold at 4000, 3000, 2000 or 1000 Hz in a linear progression of frequencies
3. Agrawal et al (2008) Absolute hearing threshold values: it was defined as high-frequency hearing loss with a pure-tone mean of 25 dB or higher at 3, 4 and 6 kHz
4. Hoffman et al (2006) (1) Threshold worse by ≥15 dB at 3, 4 or 6 kHz than the average thresholds at 0.5 and 1 kHz and (2) 8 kHz threshold ≥5 dB than the worse threshold at 3, 4 or 6 kHz

A Brief Summary of Audiometric Notch
Identification Criteria Used in Previous Research
5. Dobie & Rabinowitz (2002) (1) Notch depth of ≥0 dB, where notch depth was calculated by subtracting the average thresholds at 1 and 8 kHz from the average thresholds at 2, 3 and 4 kHz.
6. Niskar et al (2001) (1) 0.5 and 1 kHz thresholds ≥15 dB HL, (2) Threshold worse by ≥15 dB at 3, 4 or 6 kHz than the thresholds at 0.5 and 1 kHz and (3) 8 kHz threshold ≥10 dB than the worse threshold at 3, 4 or 6 kHz
7. McBride and Williams (2001) (1) V-shaped notch of ≥15 dB occurring at one audiometric frequency or (2) U-shaped notch occurring at more than one audiometric frequencies with the notch depth of ≥20 dB and ≥10 dB recovery at the high frequency
8. Coles et al (2000) (1) Threshold worse by ≥10 dB at 3, 4 or 6 kHz than those at 1 or 2 kHz and 6 or 8 kHz

A Brief Summary of Audiometric Notch
Identification Criteria Used in Previous Research
9. Lees et al (1985) (1) 10 dB depression of hearing threshold below the audiometric frequencies on both sides
10. Wilson (2011) A notch was defined when the 4000 Hz threshold minus the 2000 Hz threshold and the 4000 Hz threshold minus the 8000 Hz threshold both were ≥10 dB.
11. Wilson and McArdle (2013) A notch was defined when the threshold at the notch frequency (3,000, 4,000, or 6,000 Hz) minus the 2,000 Hz threshold and the threshold at the notch frequency minus the 8,000 Hz threshold both were greater than or equal to 10 dB.
• Adopted with additions from Table 1, page 393 from: Bhatt IS, Guthrie O, International Journal of Audiology 2017; 56: 392–399. Analysis of audiometric notch as a noise-induced-hearing loss phenotype in US youth: data from the National Health And Nutrition Examination Survey, 2005–2010.

Many Published Objective Criteria for
Audiometric Notches Exist
• Some of the published criteria for audiometric notches are vague and (in my
opinion) of limited utility.
• All of the published criteria for audiometric notches are arbitrary.
• None of the published objective criteria for audiometric notches are
evidence-based.

Example of Audiometric Notch
(by most criteria)
0
10
20
30
40
50
60
70
80
90
100
500 1000 2000 3000 4000 6000 8000
D
e
c
i
b
e
l
s
Frequency
Hearing level

Audiogram Showing Hearing Loss from Both Noise
and Aging

2001 Article on Audiometric Notches by DL
McBride and S Williams
• In that article, the authors attempted to determine whether an audiologist, an ENT physician, and an occupational medicine physician experienced in NIHL could agree on which audiograms contained notches.
• The 3 experts read the audiograms independently of each other and used their own definitions of what constituted an audiometric notch at 3000, 4000, or 6000 Hz.
• The study population was 634 men with occupational noise exposure (1268 audiograms).

2001 Article on Audiometric Notches by DL
McBride and S Williams
• “Raters 1, 2 and 3 identified 26%, 49%, and 68% of the individuals as having a notched audiogram, respectively.”
• Authors: “The conclusion that we draw is therefore that the raters had all developed their own personal criteria for notch identification and these differed.”
• Previous study by the same authors: “The main problem here seems to be that there is no standard definition of an audiometric notch, so people tend to develop their own criteria.”
• The results of the study prompted the authors to propose objective criteria for the determination of an audiometric notch.

2006 Study by Rabinowitz, et al
• A study of 6 experts (2 audiologists, 2 ENT physicians, 2 Occ Med physicians) who independently read 2 sets each of 80 audiograms showing STSs for the presence or absence of an audiometric notch.
• 5 or more of the 6 expert panel members agreed 71% - 72% of the time whether a notch was present or not (47.5% of audiograms showing STSs were determined to have audiometric notches).
• “When members of the expert panel judged the same 20 audiograms on two different occasions, the agreement for notch judgments ranged from 55 to 90% among the experts.”
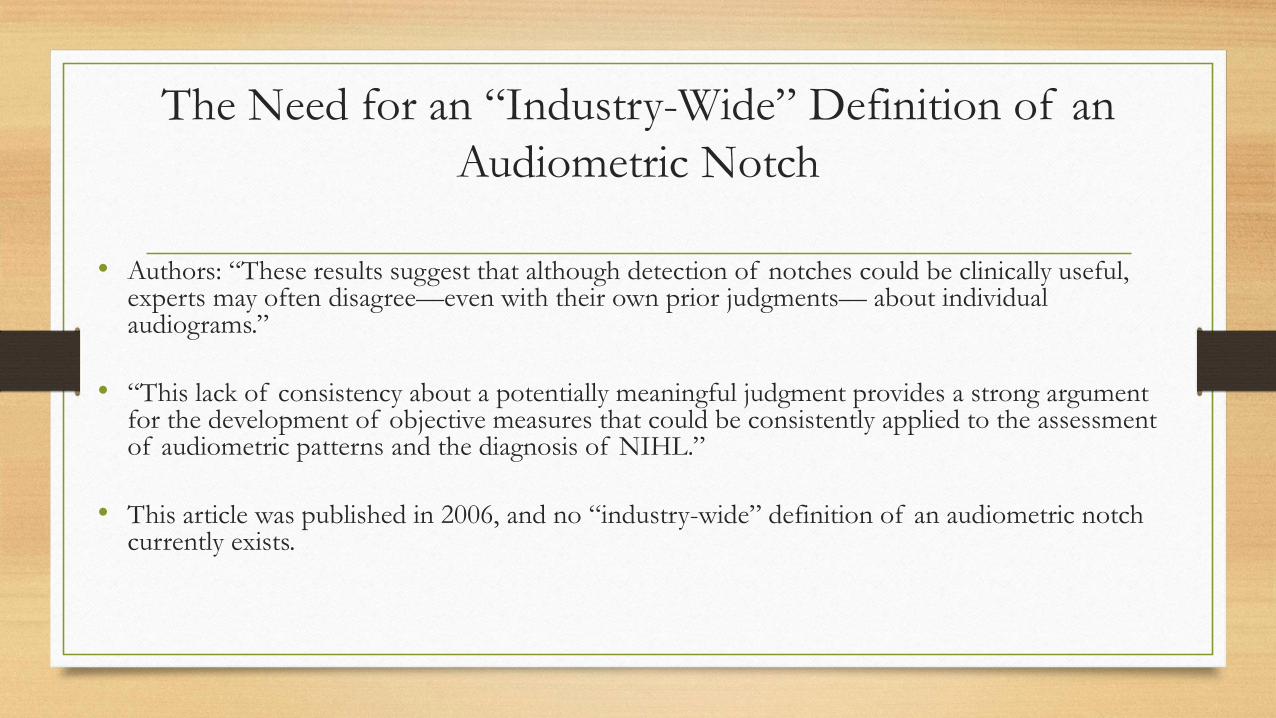
The Need for an “Industry-Wide” Definition of an
Audiometric Notch
• Authors: “These results suggest that although detection of notches could be clinically useful, experts may often disagree—even with their own prior judgments— about individual audiograms.”
• “This lack of consistency about a potentially meaningful judgment provides a strong argument for the development of objective measures that could be consistently applied to the assessment of audiometric patterns and the diagnosis of NIHL.”
• This article was published in 2006, and no “industry-wide” definition of an audiometric notch currently exists.

The Need for an “Industry-Wide” Definition of an
Audiometric Notch
• Two speakers on audiometric topics at conferences: “If it looks like a notch,
I call it a notch.” (One of the speakers is a co-author of ACOEM’s 2018
Guidance Statement on Work-related, Noise-Induced Hearing loss.)
• In 1964, US Supreme Court Justice Potter Stewart famously stated regarding
pornography: “I know it when I see it.”

Do Occupational Medicine Physicians Use Objective Criteria to
Determine the Presence or Absence of an Audiometric Notch?
• My answer is No, based on 30+ years of experience in Occupational Medicine.
• The objective criteria for audiometric notches have originally been published in medical journals Occupational Medicine physicians are unlikely to read.
• In its Guidance Statements on Work-Related Noise-Induced Hearing Loss published in JOEM (2003, 2012, & 2018), ACOEM has not even mentioned that such objective criteria exist.
• A strong case can be made for using objective criteria for determination of audiometric notches for external and internal consistency.

Are All Audiometric Notches the Result of Noise
Exposure?
• Some authors think so.
• “Nearly one in four adults (24%) had audiometric notches, suggesting a high prevalence of noise-induced hearing loss.” MMWR, 2017
• Is this conclusion, based on NHANES data (2011-2012), true?
• What percentage of audiometric notches are attributable to noise exposure?

Odds Ratio, Risk Ratio, and Attributable Risk as they
Relate to Audiometric Notches
• Odds Ratio (OR) = the odds of noise exposure history given that an individual has an audiometric notch
• Relative Risk or Risk Ratio (RR) = the risk of developing an audiometric notch if exposed to noise compared to the risk of developing an audiometric notch if not exposed to noise
• Attributable Risk (AR) = the proportion of audiometric notches in a population attributable to noise exposure= (rate in exposed group – rate in unexposed group)/rate in exposed group = (RR-1)/RR

Odds Ratio, Risk Ratio, and Attributable Risk as they
Relates to Audiometric Notches
• The OR approximates the RR for rare events (but audiometric notches are not rare
events).
• “The more frequent the outcome, the more the odds ratio overestimates the risk
ratio when it is more than 1 or underestimates it when it is less than 1.” JAMA
November 1998
• Therefore, use of the OR in place of RR in calculating AR will knowingly
overestimate the true AR (% of audiometric notches attributable to noise exposure).
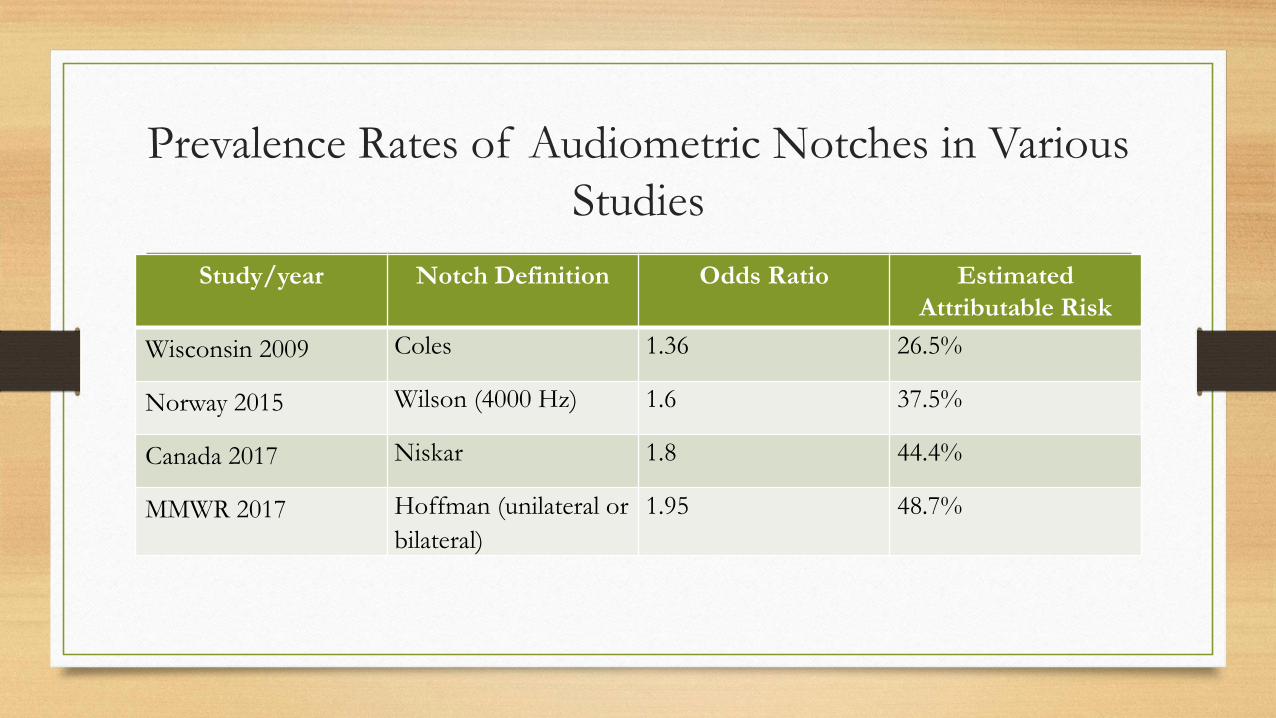
Prevalence Rates of Audiometric Notches in Various
Studies
Study/year Notch Definition Odds Ratio Estimated
Attributable Risk
Wisconsin 2009 Coles 1.36 26.5%
Norway 2015 Wilson (4000 Hz) 1.6 37.5%
Canada 2017 Niskar 1.8 44.4%
MMWR 2017 Hoffman (unilateral or
bilateral)
1.95 48.7%

“What’s the Relative Risk?”
JAMA November 1998
• This article provides a graph that can be used to estimate Risk Ratio if the Odds
Ratio and the prevalence of the outcome (audiometric notches) are known.
• If average Odds Ratio = 1.68 and approximate prevalence of audiometric notches
= 40%, the Risk Ratio is approximately = 1.33.
• This provides an approximate Attributable Risk of noise exposure to audiometric
notches of 25% (1 out of 4). (1.33-1.00)/1.33
• This means that 3 out of 4 audiometric notches (75%) are not attributable to noise
exposure!

“What’s the Relative Risk?”
JAMA November 1998

The National Institute of Occupational Health,
Oslo, Norway
• “The prevalence of Coles notch and notch index in the present study is approximately 60% in the exposed and 50% in the nonexposed group. This implies that the specificity of one notch as criterion for NIHL diagnosis is very low, as 5 of 6 notches may be unrelated to occupational noise exposure. The general rule that a hearing loss with a notch indicates an NIHL and the lack of a notch speaks against must be used with great caution.”
• “Various types of audiometric notches are widely prevalent in workers not occupationally exposed to noise and almost as common as in exposed subjects. This makes the diagnosis of NIHL difficult.”

Some Observations on Audiometric Notches
• Approximately 2/3 of audiometric notches are unilateral, although work-related NIHL is usually described as bilateral.
• Audiometric notches are much more common in men than woman, even with the same reported occupational noise exposure (although no one has proven that men are more susceptible to the effects of noise on hearing than are women).
• The prevalence of audiometric notches increases up to age 50, then decreases slowly thereafter.
• If one reviews previous audiograms of an employee with an STS, it is common to see audiometric notches present in some old audiograms and absent in others. Sometimes the notches are at different frequencies on different audiograms, even in the same ear.

More on Attributable Risk of Audiometric Notches
to Noise Exposure
• Higher noise exposures lead to a higher Odds Ratio (and therefore higher Risk Ratio and Attributable Risk - at least in men).
• The Odds Ratio for bilateral notches is higher than for unilateral notches. (Therefore, the Risk Ratio and Attributable Risk will be higher.)
• The Odds Ratio for 4000 Hz notches is higher than for all notches at 3000, 4000, and 6000 Hz combined.
• The Attributable Risk of noise to bilateral 4000 Hz notches probably exceeds 50% (at least in men).

Bilateral Confirmed STS’s from Noise Exposure
0
10
20
30
40
50
60
70
80
500 1000 2000 3000 4000 6000 8000
Dec
ibel
s
Frequency
Right ear
Left ear

Bilateral Confirmed STS’s from Noise Exposure
• 54 y/o WM with first ever confirmed bilateral STS’s
• The graph meets the “If it looks like a notch, I call it a notch” standard for each ear.
• The greatest hearing loss is 35 dB in each ear.
• However, the audiometric notches are at different frequencies in the two ears (at 3000 Hz in
the right ear and at 4000 Hz in the left ear).
• Ear examination was normal, and there was nothing in the employee’s work history to
suggest why the notches would have occurred at different frequencies.

Bilateral Confirmed STS’s from Noise Exposure
• The audiometric configuration of the left ear fulfills more of the objective criteria for an
audiometric notch than does the audiometric configuration of the right ear.
• The reason is that most of the criteria compare the hearing level at the notch frequency to
that at 8000 Hz.
• Notice that the hearing level in the right ear is worse at 8000 Hz than at 6000 Hz (whereas
the opposite is true of the left ear).
• That same pattern was noted on the employee’s very first audiogram 20 years before and has
not changed; the reason for this finding is unknown.
• Conclusion: There is still much we do not know about audiogram interpretation. It is not
the practice of evidence-based medicine, in my opinion.

Questions, Comments, Suggestions?
• References to studies mentioned in this presentation are available on request.
• Send requests to [email protected].