Consumer / Portable PEG Table of Contents/...
12
Consumer / Portable PEG Table of Contents/ Examples Chair: Vadim Sherman, Intel
Transcript of Consumer / Portable PEG Table of Contents/...
Consumer / Portable
PEG Table of Contents/ Examples
Chair: Vadim Sherman, Intel
1
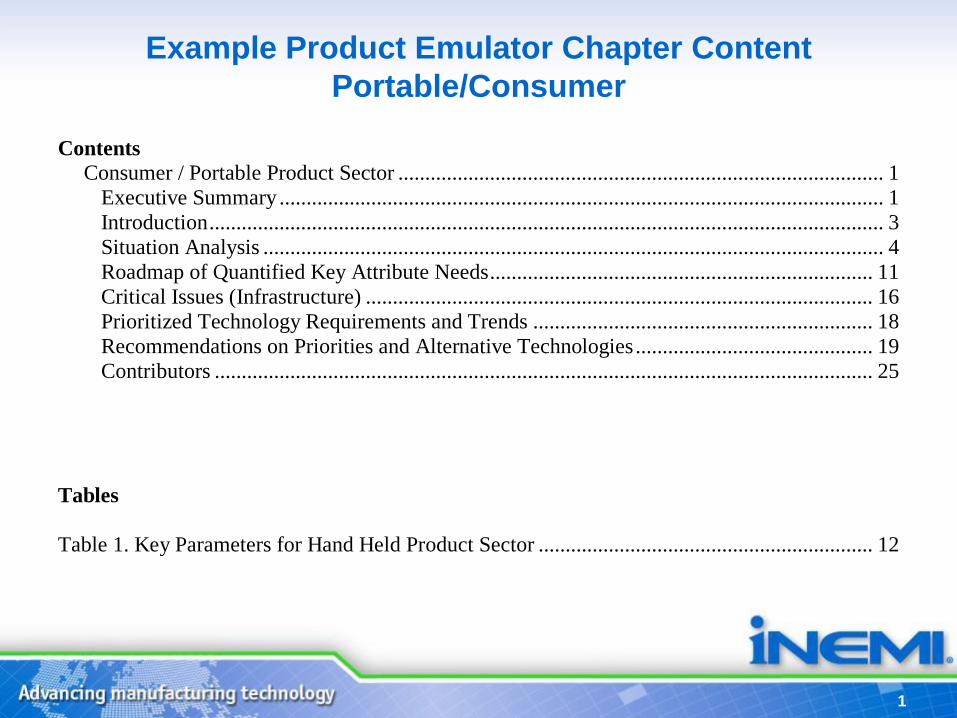
Example Product Emulator Chapter Content
Portable/Consumer
Contents
Consumer / Portable Product Sector .......................................................................................... 1
Executive Summary ................................................................................................................ 1
Introduction ............................................................................................................................. 3
Situation Analysis ................................................................................................................... 4
Roadmap of Quantified Key Attribute Needs ....................................................................... 11
Critical Issues (Infrastructure) .............................................................................................. 16
Prioritized Technology Requirements and Trends ............................................................... 18
Recommendations on Priorities and Alternative Technologies ............................................ 19
Contributors .......................................................................................................................... 25
Tables
Table 1. Key Parameters for Hand Held Product Sector .............................................................. 12

2
0
50
100
150
200
250
300
350
400
450
500
$Bn
2009 2010 2012 2013 20152011 2014 2016
N212.146mvc- value ship
56
98
174
222
275
318
89
$385Bn$377Bn
$361Bn
$324Bn
$276Bn
$235Bn
$178Bn
$146Bn
81
62
54
48
43
Total Branded:
Smartphones: Non-Smartphones:
CAAGR 2011-2016
10.4%
-13.4%
15.4%
339
355
3830
Prismark Partners LLC
September 2012
Example Product Emulator Chapter Content – (continued)
Portable/Consumer – Smartphone/Non-Smartphone Growth

3
Parameter Descriptions Metric 2011 2013 2015 2017 2023
Components/ Package Typical Product Family
Utilizing
Max Component I/O density Substrate Density I/O/sq.cm 500 600 700 800 1200
Average Component I/O density Substrate Density I/O/sq.cm 50 55 60 80 120
Average Component Density Substrate Density #/sq.cm 30 40 50 80 120
Maximum I/O per package State of the Art
(production volume) I/O per part 600 675 725 1000 1400
Average I/O per package State of the Art
(production volume) I/O per part 7 7.5 8 9 11
Max Components/sq. cm. Substrate Density #/sq.cm 55 60 70 75 95
Max I/O for 50 mm square SCM
w/ full area array
State of the Art
(production volume) # 3000 3500 5000 8000 13000
Max I/O for 100 mm square
MCM w/ full area array
State of the Art
(production volume) # UA UA UA UA UA
Package I/O Pitch, (area array) Minimum Pitch
(Production volume) mm 0.4 0.4 0.3 0.3 0.3
Package I/O Pitch for SCM (area
array)
Minimum Pitch
(Production volume) mm 0.4 0.4 0.3 0.3 0.3
Package I/O Pitch for MCM (area
array)
Minimum Pitch
(Production volume) mm 0.5 0.4 0.4 0.3 0.3
Package I/O Pitch (perimeter) Minimum Pitch
(Production volume) mm 0.4 0.4 0.3 0.3 0.3
Example Product Emulator Chapter – (continued)
Portable/Consumer, Key Parameters Table 1 (12 rows of ≈ 250)

4
Highlights

Optoelectronics TWG Table of
Contents/ Examples
Chair: Dick Otte, Promax

6
Sample Chapter Content – Optoelectronics Contents
Optoelectronics ............................................................................................................................1
Executive Summary ................................................................................................................ 1
Introduction ........................................................................................................................... 11
Situation (Infrastructure) Analysis ........................................................................................ 15
Telecommunications Situation.......................................................................................... 17
The Telecommunications Sector vs Data Communications Sector .................................. 23
FTTX Situation ................................................................................................................. 24
Local Area Network (LAN) Situation .............................................................................. 28
Plastic Optical Fiber (POF) (Automotive) Situation ........................................................ 34
Active Optical Cable Situation ......................................................................................... 38
Backplane Situation .......................................................................................................... 41
On-Card Data Transmission Situation .............................................................................. 46
On-Chip Optical Interconnect Situation ........................................................................... 52
BER (Bit Error Rates) ....................................................................................................... 54
Financial and Business Status ........................................................................................... 55
Status Summary ................................................................................................................ 60
Manufacturing Issues ............................................................................................................ 61
Manufacturing Equipment Availability ............................................................................ 61
Data Communication Manufacturing Process Issues ....................................................... 62
Designing for Manufacturing ............................................................................................ 66
Quality Requirements ....................................................................................................... 67
Environmental Issues ........................................................................................................ 68
Supply Chain Issues .......................................................................................................... 68
Roadmap of Quantified Key Attribute Needs ....................................................................... 69
Critical (Infrastructure) Issues .............................................................................................. 84
Technology Needs ................................................................................................................ 87
Prioritized Research & Development Needs ........................................................................ 89
Gaps and Show Stoppers ...................................................................................................... 90
Recommendations on Potential Alternative Technologies ................................................... 91
Black Swans2 ........................................................................................................................ 92
Appendix A ........................................................................................................................... 93
Graphical Roadmap Representation ................................................................................. 93
Appendix B ........................................................................................................................... 95
Electrons vs Photons for Data Communication ................................................................ 95
Appendix C ........................................................................................................................... 97
Contributors/Acknowledgments ....................................................................................... 97
Appendix D ........................................................................................................................... 98
Glossary ............................................................................................................................ 98
Appendix E ..................................................................................................................... 101
Optoelectronic Internet Links to Items of Interest. ......................................................... 101

7
Example Chapter Content – Optoelectronics (2)
Plus Tables 45 through 65
Tables
Table 1: Summary of Critical issues, Gaps and Show Stoppers, and Technical Needs .............9
Table 2: Market and Application Mapping: Product status matrix .........................................13
Table 3: Optical Data Transmission Technology Improvements and Potential Future
Improvements .......................................................................................................21
Table 4: Distinct LAN Applications .........................................................................................28
Table 5: MSA Standards Overview ..........................................................................................29
Table 6: Examples of short range, commercial POF based systems. .......................................35
Table 7: Some of the Active Optical Cable Suppliers as of August 2012 ................................38
Table 8: Recent Financial Results of Some Industry Firms .....................................................54
Table 9: Manufacturing Processes for Optical Products with Those Unique
to Optical Products Highlighted .........................................................................58
Table 10: Telecommunications – Key Attribute Needs ............................................................70
Table 11: FTTX (X = Curb, House, Desk, Antenna, etc…) – Key Attribute Needs ................71
Table 12: LANS – Key Attribute Needs ...................................................................................73
Table 13: Plastic Optical Fiber (POF) (Automotive) – Key Attribute Needs ..........................75
Table 14: Active Optical Cables (AOC) – Key Attribute Needs ..............................................76
Table 15: Backplane – Key Attribute Needs ............................................................................78
Table 16: On-Card – Key Attribute Needs ...............................................................................79
Table 17: In-to and Out-of Package –Key Attribute Needs ......................................................80
Table 18: On-Chip – Key Attribute Needs ...............................................................................82
Table 19: Critical Infrastructure Issues .....................................................................................83
Table 20: Technology Needs ....................................................................................................86
Table 21: Research and Development Needs ...........................................................................88
Table 22: Gaps and Show Stoppers ..........................................................................................89
Table 23: Potential Alternate Technologies ..............................................................................90
Table 24: Black Swans 91

8
Example Chapter Content Optoelectronics (3) Figures
Figure 1: Data rates vs distance with media as a parameter illustrating optical dominance
when distance x data rate exceeds 100 Gb/s. .........................................................1
Figure 2: The Impact of High Performance Computing on the Demand for Optical Links .......3
Figure 3: A 2010 Data Center requires about 25 megawatts of power so energy saving
technology is important. .......................................................................................4
Figure 4: Traffic by data content vs year, both actual and forecast ..........................................11
Figure 5: The overview Graphic of the Optical Electronic TWG Roadmap. ...........................12
Figure 5: Generic Data Transmission Environment .................................................................14
Figure 6: Cost Comparison of Copper vs. Optical by Distance and Bandwidth ......................15
Figure 7: Telecommunication System Capacity and Traffic over 5 decades. ..........................16
Figure 8: Evolution of Telecommunications (>10Km) OE Structure ......................................17
Figure 9: The Shannon Limit and Current Results of Data Transmission Rates
Utilizing Optical Technologies .............................................................................19
Figure 10: Illustrating the Loss in db/Km vs Wavelength of Single Mode Fiber and showing
the “C” band in which the Erbium Doped Fiber Amplifier provides
amplification ........................................................................................................20
Figure 11: An Upstream CATV architecture that modulates light sent from the Central
office and returns in with information impressed on it .....................................25
Figure 12: An FTTX architecture that transmits many wavelengths and then sends one
wavelength to a customer or, more often, sends each of the wavelengths
to multiple customers ...........................................................................................26
Figure 13: Evolution of Common Transceivers and Transponders. .........................................31
Figure 14: The Evolution of Transceiver Size to Increase Panel Data Density........................32
Figure 15: Improvements in Density (Gb/s/inch), Power Use and Bandwidth Density for
Various Form Factors in The Order of Their Introduction ................................33
Figure 16: Low cost Connectorless Package of a POF Source. ................................................35
Figure 17: The Above POF Market Chart from IGI. “Plastic Optical Fiber Market &
Technology Assessment Study – 2011” ............................................................36
Figure 18: Graphic from IGI. “Plastic Optical Fiber in Industrial Controls – 2011” ...............37
Figure 19: Typical Active Optical Cable. AOCs Do Not Utilize Optical Connectors, Only
Electrical Connectors at the Ends. The AOC Fiber Bundle Also Has a
Small Diameter Compared to the Electrical Equivalent ....................................39
Figure 20: A series of Charts with Data on Active Optical Cables. From IGI ........................40
Figure 21: An Optical Backplane concept with both electrical and optical connectors
between the cards and backplane ......................................................................41
Figure 22: “FlexPlane” Optical Backplane by Molex ..............................................................42
Figure 23: Reflex Photonics Implementation of Optical Interconnect to supplement an
Electrical Backplane .........................................................................................43
Figure 24: A Drawer from the IBM Blue Waters Super Computer ..........................................44
Figure 25: The BlueWaters Rack Structure that holds Drawers. ..............................................44
Figure 26: A Basic Method to Implement On-Card Optical IO ...............................................45
Figure 27: Provides Some MicroPOD details; close ups of the bottom BGA pattern; a top
view without the 45o connector and ribbon fiber; an array of MicroPODS
with the ribbon fiber and connector illustrating the fiber management 46
9
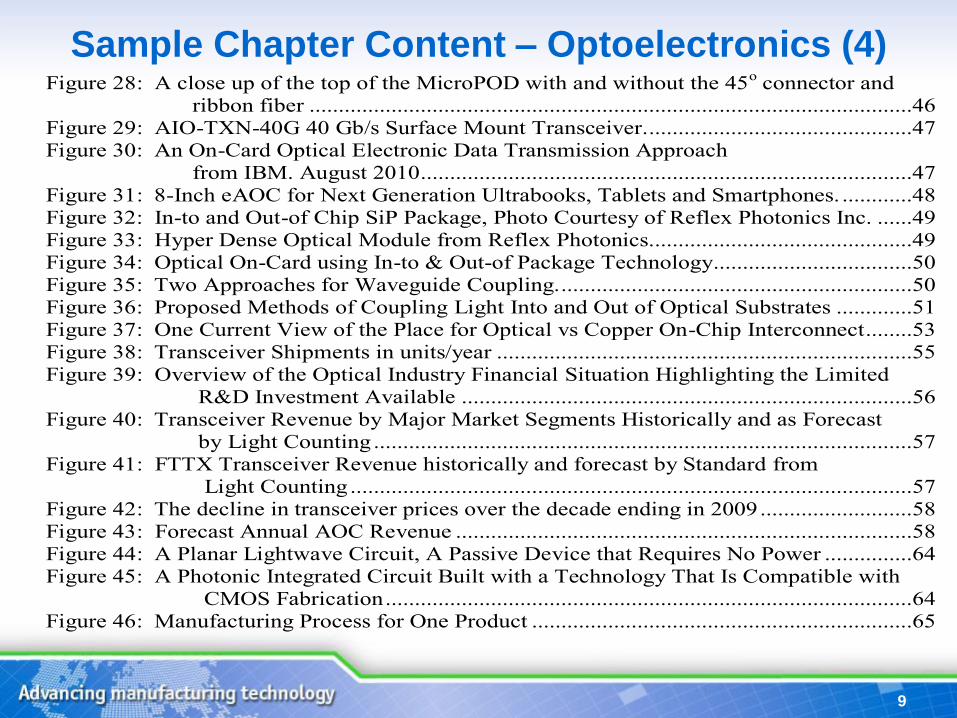
Sample Chapter Content – Optoelectronics (4) Figure 28: A close up of the top of the MicroPOD with and without the 45
o connector and
ribbon fiber .......................................................................................................46
Figure 29: AIO-TXN-40G 40 Gb/s Surface Mount Transceiver. .............................................47
Figure 30: An On-Card Optical Electronic Data Transmission Approach
from IBM. August 2010 ....................................................................................47
Figure 31: 8-Inch eAOC for Next Generation Ultrabooks, Tablets and Smartphones. ............48
Figure 32: In-to and Out-of Chip SiP Package, Photo Courtesy of Reflex Photonics Inc. ......49
Figure 33: Hyper Dense Optical Module from Reflex Photonics.............................................49
Figure 34: Optical On-Card using In-to & Out-of Package Technology..................................50
Figure 35: Two Approaches for Waveguide Coupling. ............................................................50
Figure 36: Proposed Methods of Coupling Light Into and Out of Optical Substrates .............51
Figure 37: One Current View of the Place for Optical vs Copper On-Chip Interconnect ........53 Figure 38: Transceiver Shipments in units/year .......................................................................55
Figure 39: Overview of the Optical Industry Financial Situation Highlighting the Limited
R&D Investment Available .............................................................................56
Figure 40: Transceiver Revenue by Major Market Segments Historically and as Forecast
by Light Counting ............................................................................................57
Figure 41: FTTX Transceiver Revenue historically and forecast by Standard from
Light Counting ................................................................................................57
Figure 42: The decline in transceiver prices over the decade ending in 2009 ..........................58
Figure 43: Forecast Annual AOC Revenue ..............................................................................58
Figure 44: A Planar Lightwave Circuit, A Passive Device that Requires No Power ...............64
Figure 45: A Photonic Integrated Circuit Built with a Technology That Is Compatible with
CMOS Fabrication ..........................................................................................64
Figure 46: Manufacturing Process for One Product .................................................................65

10
Data rates vs distance with media as a parameter
illustrating optical dominance when distance x data rate
exceeds 100 Gb/s.
11
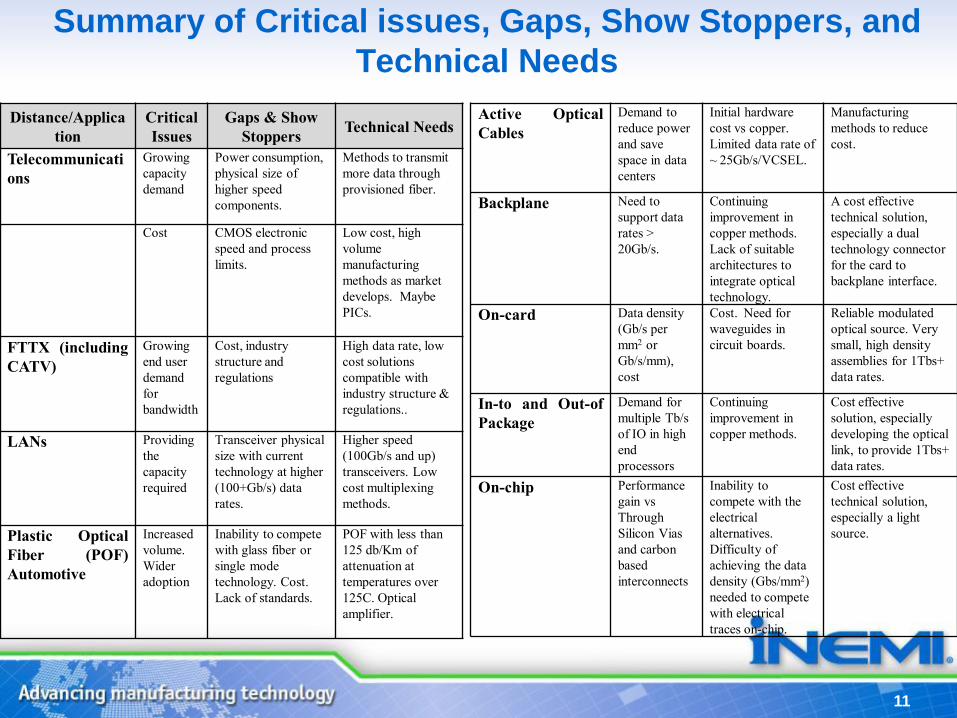
Summary of Critical issues, Gaps, Show Stoppers, and
Technical Needs
Distance/Applica
tion
Critical
Issues
Gaps & Show
Stoppers Technical Needs
Telecommunicati
ons
Growing
capacity
demand
Power consumption,
physical size of
higher speed
components.
Methods to transmit
more data through
provisioned fiber.
Cost CMOS electronic
speed and process
limits.
Low cost, high
volume
manufacturing
methods as market
develops. Maybe
PICs.
FTTX (including
CATV)
Growing
end user
demand
for
bandwidth
Cost, industry
structure and
regulations
High data rate, low
cost solutions
compatible with
industry structure &
regulations..
LANs Providing
the
capacity
required
Transceiver physical
size with current
technology at higher
(100+Gb/s) data
rates.
Higher speed
(100Gb/s and up)
transceivers. Low
cost multiplexing
methods.
Plastic Optical
Fiber (POF)
Automotive
Increased
volume.
Wider
adoption
Inability to compete
with glass fiber or
single mode
technology. Cost.
Lack of standards.
POF with less than
125 db/Km of
attenuation at
temperatures over
125C. Optical
amplifier.
Active Optical
Cables
Demand to
reduce power
and save
space in data
centers
Initial hardware
cost vs copper.
Limited data rate of
~ 25Gb/s/VCSEL.
Manufacturing
methods to reduce
cost.
Backplane Need to
support data
rates >
20Gb/s.
Continuing
improvement in
copper methods.
Lack of suitable
architectures to
integrate optical
technology.
A cost effective
technical solution,
especially a dual
technology connector
for the card to
backplane interface.
On-card Data density
(Gb/s per
mm2 or
Gb/s/mm),
cost
Cost. Need for
waveguides in
circuit boards.
Reliable modulated
optical source. Very
small, high density
assemblies for 1Tbs+
data rates.
In-to and Out-of
Package
Demand for
multiple Tb/s
of IO in high
end
processors
Continuing
improvement in
copper methods.
Cost effective
solution, especially
developing the optical
link, to provide 1Tbs+
data rates.
On-chip Performance
gain vs
Through
Silicon Vias
and carbon
based
interconnects
Inability to
compete with the
electrical
alternatives.
Difficulty of
achieving the data
density (Gbs/mm2)
needed to compete
with electrical
traces on-chip.
Cost effective
technical solution,
especially a light
source.