CONSOLIDATED ANNUAL ACCOUNTS - Indra · Equity-accounted investees 11 5,664 7,925 Non-current...
159
CONSOLIDATED ANNUAL ACCOUNTS Statements of Financial Position Income Statement Statements Changes in Equity Statements of Cash Flows Consolidated Report Appendix
Transcript of CONSOLIDATED ANNUAL ACCOUNTS - Indra · Equity-accounted investees 11 5,664 7,925 Non-current...

CONSOLIDATED ANNUAL ACCOUNTS
Statements of Financial Position
Income Statement
Statements Changes in Equity
Statements of Cash Flows
Consolidated Report
Appendix

Indra • Consolidated Annual Accounts and Management Report
Consolidated Annual Accounts 2
Indra Sistemas, S.A. and Subsidiaries Consolidated Statements of Financial Position at 31 December 2014 and 2013 (Expressed in thousands of Euros)
Assets Note 2014 2013 (*)
Property, plant and equipment 6 127,348 140,778
Investment property 7 - 3,363
Goodwill 8 583,285 605,943
Other intangible assets 9 289,833 285,926
Equity-accounted investees 11 5,664 7,925
Non-current financial assets 12 83,883 71,534
Deferred tax assets 36 116,040 87,094
Total non-current assets 1,206,053 1,202,563
Assets held for sale 10 and 17 7,656 7,572
Inventories 13 231,149 416,460
Other financial assets 14 77,014 97,582
Current tax assets 36 50,057 39,930
Trade and other receivables 15 1,615,490 1,649,742
Cash and cash equivalents 16 293,850 363,071
Total current assets 2,275,216 2,574,357
Total assets 3,481,269 3,776,920
Equity and Liabilities Note 2014 2013 (*)
Subscribed capital 18 32,826 32,826
Share premium 18 375,955 375,955
Reserves 18 1,949 4,465
Other own equity instruments 18 17,046 16,999
Cash flow hedges 18 (19,866) 3,777
Own shares 18 (1,642) (1,258)
Translation differences 18 (48,263) (40,024)
Retained earnings 18 582,894 731,242
Equity attributable to owners of the Parent 940,899 1,123,982
Non-controlling interests 18 12,675 10,680
Total equity 953,574 1,134,662
Financial liabilities from issuing bonds and other marketable securities 20 229,686 263,913
Loans and borrowings 20 596,044 525,944
Other non-current financial liabilities 21 30,984 28,068
Government grants 22 12,958 15,969
Provisions for liabilities and charges 23 40,394 99,338
Deferred tax liabilities 36 1,821 16,143
Total non-current liabilities 911,887 949,375
Financial liabilities from issuing bonds and other marketable securities 24 38,891 -
Current loans and borrowings 24 91,971 195,674
Trade and other payables 25 1,175,343 1,180,397
Current tax liabilities 36 17,340 18,277
Other liabilities 26 292,263 298,535
Total current liabilities 1,615,808 1,692,883
Total equity and liabilities 3,481,269 3,776,920
(*) Restated figuresThe accompanying notes form an integral part of the consolidated annual accounts.

Indra • Consolidated Annual Accounts and Management Report
Consolidated Annual Accounts 3
Indra Sistemas, S.A. and Subsidiaries Consolidated Income Statements for the years ended 31 December 2014 and 2013 (Expressed in thousands of Euros)
Note 2014 2013 (*)
Revenues 27 2,937,885 2,914,073
Self-constructed assets 59,518 51,700
Other income 28 33,258 115,777
Changes in inventories of finished goods and work in progress (188,106) 10,414
Materials and other supplies used 29 (757,219) (752,943)
Personnel expenses 30 (1,399,510) (1,481,439)
Other operating expenses 31 (620,238) (590,490)
Other losses on non-current assets 32 (43,830) (16,892)
Amortisation and depreciation 6 and 9 (64,232) (51,914)
Results from operating activities (42,474) 198,286
Finance income 10 11,804 5,644
Finance costs 10 (61,253) (69,625)
Share of profit/(loss) of investees 33 (1,748) 11,685
Net finance cost (51,197) (52,296)
Profit/(loss) of equity-accounted investees 11 (3,345) 666
Profit/(loss) before income tax (97,016) 146,656
Income tax 36 6,616 (29,968)
Profit/(loss) for the year (90,400) 116,688
Profit/(loss) attributable to the Parent (91,908) 115,822
Profit/(loss) for the year attributable to non-controlling interests 18 1,508 866
Basic earnings per share (Euros) 19 (0.5609) 0.7061
Diluted earnings per share (in Euros) 19 (0.4773) 0.6972
Note 2014 2013 (*)
Profit/(loss) for the year (90,400) 116,688
Other comprehensive income:
Items that will be reclassified in profit or loss:
Income and expense recognised directly in equity (33,127) (40,046)
Translation differences (7,846) (46,153)
Cash flow hedges 18 (36,116) 8,725
Tax effect 18 10,835 (2,618)
Amounts transferred to the income statement 1,638 1,530
Cash flow hedges 18 2,129 2,185
Tax effect 18 (491) (655)
Other comprehensive income for the year, net of tax (31,489) (38,516)
Total comprehensive income for the year (121,889) 78,172
Total comprehensive income attributable to the Parent (123,790) 78,802
Total comprehensive income attributable to non-controlling interests
1,901 (630)
The accompanying notes form an integral part of the consolidated annual accounts.

Indra • Consolidated Annual Accounts and Management Report
Consolidated Annual Accounts 4
Indra Sistemas, S.A. and Subsidiaries Consolidated Statements of Cash Flow for the years ended 31 December 2014 and 2013 (Expressed in thousands of Euros)
2014 2013 (*)
Profit/(loss) for the year (90,400) 116,688
Income tax (6,616) 29,968
Profit/(loss) before income tax (97,016) 146,656
Adjustments for:
- Amortisation and depreciation 64,232 51,914
- Provisions for grants and other 46,724 (9,602)
- (Profit)/loss of associates 3,345 (666)
- Net finance cost 49,449 60,294
+ Dividends received 434 1,117
Operating profit before changes in working capital 67,168 249,713
Changes in trade and other receivables (52,495) 17,452
Change in inventories 179,846 (3,681)
Changes in trade and other payables (2,117) (76,390)
Cash flows from (used in) operating activities 125,234 (62,619)
Income tax (52,615) (34,912)
Net cash flows from operating activities 139,787 152,182
Payments for the acquisition of:
Property, plant and equipment (19,855) (17,922)
Intangible assets (55,295) (56,419)
Financial assets (13,653) (44,921)
Proceeds from the sale of:
Property, plant and equipment 4,963 8,003
Intangible assets - 1,117
Financial assets 791 30,837
Interest received 4,857 4,369
Other cash flows from investing activities 13,517 9,037
Cash flows used in investing activities (64,675) (65,899)
2014 2013 (*)
Changes in own shares (6,928) (2,507)
Dividends paid to non-controlling interests (174) (171)
Ordinary dividend of the Parent (55,636) (55,805)
Increase in grants 5,340 3,378
Increase/(decrease) in loans and borrowings (42,130) 38,117
Increase in debt from issuing bonds and other marketable securities
- 281,103
Interest paid (46,207) (51,648)
Changes in other investments - (1,530)
Net cash flows from (used in) financing activities (145,735) 210,937
Net increase/decrease in cash and cash equivalents (70,623) 297,220
Cash and cash equivalents at beginning of the year 363,071 69,829
Effect of exchange rate fluctuations on cash and cash equivalents
1,402 (3,978)
Net increase/(decrease) in cash and cash equivalents (70,623) 297,220
Cash and cash equivalents at year end 293,850 363,071
The accompanying notes form an integral part of the consolidated annual accounts.

Consolidated Annual Accounts 5
Indra Sistemas, S.A. and Subsidiaries Consolidated Statements of Changes in Equity for the years ended 31 December 2014 and 2013 (Expressed in thousands of Euros)
CapitalShare
premiumOther
reservesRetained earnings
Ownshares
Otherown equity
instruments
Translationdifferences
Cash flowhedges
Total
Non-
controlling
interests
Total
Balance at 01/01/2013 32,826 375,955 3,116 676,322 (111) - 4,671 (3,898) 1,088,881 20,735 1,109,616
Distribution of 2012 profit:
- Dividends - - - (55,805) - - - - (55,805) - (55,805)
Transactions with own shares (note 18) - - 759 - (1,147) - - - (388) - (388)
Acquisition from non-controlling interests (note 18) - - - (5,755) - - - - (5,755) (9,936) (15,691)
Issue of compound instruments - - - - - 16,999 - - 16,999 - 16,999
Other increases and decreases - - 590 658 - - - - 1,248 511 1,759
Total comprehensive income for the year - - - - - - (44,695) 7,675 (37,020) (1,496) (38,516)
Profit/(loss) for the year - - - 115,822 - - - - 115,822 866 116,688
Balance at 31/12/2013 32,826 375,955 4,465 731,242 (1,258) 16,999 (40,024) 3,777 1,123,982 10,680 1,134,662
Distribution of 2013 profit:
- Dividends - - - (55,636) - - - - (55,636) (230) (55,866)
Transactions with own shares (note 18) - - (2,516) - (384) - - - (2,900) - (2,900)
Acquisition from non-controlling interests (note 18) - - - (291) - - - - (291) 46 (245)
Other increases and decreases - - - (513) - 47 - - (466) 278 (188)
Total comprehensive income for the year - - - - - - (8,239) (23,643) (31,882) 393 (31,489)
Profit/(loss) for the year - - - (91,908) - - - - (91,908) 1,508 (90,400)
Balance at 31/12/2014 32,826 375,955 1,949 582,894 (1,642) 17,046 (48,263) (19,866) 940,899 12,675 953,574
The accompanying notes form an integral part of the consolidated annual accounts.

Indra • Consolidated Annual Accounts and Management Report
Consolidated Annual Accounts 6
1. Nature, Composition and Activities of the Group
The Parent of the Group, Indra Sistemas, S.A. (hereinafter the Parent), adopted its present name at an extraordinary shareholders’ meeting held on 9 June 1993. Its registered office is located at Avenida Bruselas 35, Alcobendas (Madrid, Spain).
The Parent is listed on the Madrid, Barcelona, Valencia and Bilbao stock exchanges in Spain (note 18) and included in the selective IBEX 35 Index.
The statutory activity of the Parent consists of the design, development, production, integration, operation, maintenance, repair and marketing of systems, solutions and products that make use of information technology, as well as any part or component thereof and any type of related services, including the civil engineering works required for their installation, applicable to any field or sector; the provision of business and management consultancy, technological consultancy and training services for any field or sector and outsourcing services of activities and processes in any field or sector.
The consolidated companies, their registered offices, activities and the percentage interest held in these companies are shown in Appendix I, which forms an integral part of the notes to the consolidated annual accounts for the year ended 31 December 2014.
The Group did not incorporate any subsidiaries during the year ended 31 December 2014.
The Group incorporated the following subsidiaries during the year ended 31 December 2013:
» On 11 November 2013, the subsidiary Indra BPO Servicios, S.L. set up the Portuguese company, Indra II Business Process Outsourcing Portugal, Unipersonal Lda., subscribing and paying up 100% of its capital.
Business process outsourcing (BPO) and management is Indra II Business Process Outsourcing Portugal, Unipersonal Lda’s statutory activity.
During the year ended 31 December 2014 the Group derecognised the following subsidiaries:
» The Irish company, Prointec Civil Engineering Consultancy Limited; an investee of the subsidiary Prointec, S.A., which was wound up by the latter on 31 January 2014.
Subsidiaries divested by the Group during the year ended 31 December 2013 are as follows:
» On 29 January 2013 the subsidiary Prointec, S.A. sold its entire interest in Inserail, S.A. for Euros 2,875 thousand.
During the year ended 31 December 2014 the Group increased its percentage ownership of the following subsidiaries, which it already controlled:
» On 9 January 2014, the subsidiary, Indra Business Consulting S.L., acquired the remaining shares in its subsidiary Tourisme & Leisure Advisory Services, S.L. After this acquisition it owned 100% of the company and subsequently absorbed it.
» On 26 January 2014, the Parent acquired the remaining shares of its subsidiary Prointec S.A. for Euros 127 thousand. As a result of this acquisition, this company is now wholly-owned by the Group.
» On 5 June 2014 the subsidiary Advanced Logistics Group, S.A. acquired 10% of the shares of its subsidiary Europraxis-ALG Consulting Andina S.A.C for Euros 27 thousand. As a result of this acquisition, this company is now wholly-owned by the Group.
» On 6 October 2014 the Parent acquired the other 20% of the shares of its subsidiary International Financial Operational Services, S.A. (IFOS) for Euros 0.3 thousand. As a result of this acquisition, this company is now wholly-owned by the Group.
» On 27 October 2014 the subsidiary Indra Sistemas Magreb, S.R.L. acquired the other 34% of the shares in the Moroccan affiliate, Europraxis ALG Maroc, S.R.L., for Euros 78 thousand. As a result of this acquisition, this company is now wholly-owned by the Group.
During the year ended 31 December 2013 the Group increased its percentage ownership of the following subsidiaries, which it already controlled:
» On 14 March 2013, the Parent acquired 1.9% of the shares of its subsidiary, Prointec S.A., for Euros 2,767 thousand. As a result of this acquisition, it held a 99.8% interest in this company.
» On 16 May 2013 the Parent acquired the other 25% interest in the subsidiary Indra Perú, S.A. for Euros 12,357 thousand. As a result of this acquisition, this company is wholly-owned by the Group.
» On 23 December 2013 the subsidiary Indra Business Consulting, S.L. (previously Europraxis
Atlante, S.L.) agreed to purchase the remaining 20% of its investee Mensor Consultoría y Estrategia, S.L. for Euros 800 thousand. This payment was made on 10 January 2014. As a result of this acquisition, this company is wholly owned.

Indra • Consolidated Annual Accounts and Management Report
Consolidated Annual Accounts 7
2. Basis of Presentation and Comparative Information
The accompanying consolidated annual accounts have been prepared by the directors of the Parent on the basis of the accounting records of Indra Sistemas, S.A. and the subsidiaries forming the Indra Group. The consolidated annual accounts for 2014 have been prepared in accordance with International Financial Reporting Standards as adopted by the European Union (IFRS-EU), and other applicable provisions in accordance with article 48 of the Spanish Code of Commerce, to present a true and fair view of the consolidated equity and consolidated financial position of Indra Sistemas, S.A. and subsidiaries at 31 December 2014 and consolidated results of operations and changes in consolidated equity and cash flows of the Group for the year then ended.
The Group adopted IFRS-EU on 1 January 2004.
The directors of the Parent consider that the consolidated annual accounts for 2014, authorised for issue on 26 March 2015, will be approved with no changes by the shareholders at their annual general meeting.
The consolidated annual accounts for 2013 were approved by the shareholders at their annual general meeting held on 26 June 2014.
Presentation and formatThe figures disclosed in the consolidated annual accounts are expressed in thousands of Euros, the Parent’s functional and presentation currency, rounded off to the nearest thousand. Foreign currency transactions are translated following the principles described in note 4 x).
Relevant accounting estimates and assumptionsRelevant accounting estimates and judgements and other estimates and assumptions have to be made when applying the Group’s accounting principles to prepare the consolidated annual accounts in conformity with IFRS-EU. A summary of the items requiring a greater degree of judgement or which are more complex, or where the assumptions and estimates made are significant to the preparation of the consolidated annual accounts, is as follows:
» As its principal activity, the Group carries out projects commissioned by customers. The Group recognises income and expenses on contracts using the percentage of completion method. This method is based on estimating the total project costs and income, costs to complete the contract, contractual risk and other parameters. Group management reviews all estimates on an ongoing basis and adjusts them accordingly.
» Expenditure on development projects is capitalised under development costs when it is probable that the cost of the asset will be offset by future economic benefits. . Development projects in progress are tested for impairment by discounting the expected cash flows over their estimated useful life. Intangible assets are amortised based on the best estimates of their useful lives. The estimation of useful lives requires a certain degree of subjectivity, and, to ensure that estimates are adequately supported, they are based on reports prepared by the corresponding technical departments.
» The Group tests goodwill for impairment on an annual basis. The calculation of the recoverable amount of a division to which goodwill has been allocated requires the use of estimates. The recoverable amount is the higher of fair value less costs to sell and value in use. The Group generally uses cash flow discounting methods to calculate these values. Cash flow discounting calculations are based on five-year projections that take into consideration past experience and represent management’s best estimate of future market performance. From the fifth year cash flows are extrapolated using individual growth rates. The key assumptions employed when determining these values include growth rates, the weighted average cost of capital and tax rates (see note 8).
» The Group estimates the useful lives of property, plant and equipment and intangible assets to calculate the corresponding depreciation and amortisation expenses. Determining the useful life of assets requires estimates of expected technological developments, which implies a significant degree of judgement. Factors such as technological obsolescence, the cancellation of certain projects and other changes in estimated circumstances must be taken into consideration when assessing possible impairment.
» The Group makes provisions for liabilities and charges. The final cost of litigation and contingencies may vary depending on the interpretation of the principles, opinions and ultimate evaluations. Any variations in these circumstances could have a significant effect on the amounts recognised under provisions for liabilities and charges.
» The Group recognises deferred tax assets for all deductible temporary differences, deductions and tax loss carryforwards available for offset provided that it is likely that the Group will have sufficient taxable income against which these assets can be utilised. In order to determine the amount of the deferred tax assets to be recognised, the directors estimate the amounts and dates on which future taxable profits will be obtained and the reversal period of temporary differences.
Although these estimates are calculated based on the best information available at the date on which these consolidated annual accounts were prepared, future events may require changes to these estimates

Indra • Consolidated Annual Accounts and Management Report
Consolidated Annual Accounts 8
in future years. Any such changes would be made prospectively and the effects recognised in the consolidated annual accounts for future years.
Standards and interpretations approved by the European Union applied for the first time in the consolidated annual accounts for the year ended 31 December 2014The standards and interpretations adopted by the European Union that entered into effect in 2014 have not had a significant impact on the consolidated annual accounts of the Parent.
The standards applied for the first time in the consolidated annual accounts for the year ended 31 December 2014 are as follows:
» IFRS10: Consolidated Financial Statements. This standard replaces IAS 27: Consolidated and Separate Financial Statements and SIC-12 Consolidation - Special Purpose Entities. Effective for annual periods beginning on or after 1 January 2014.
» IFRS 11: Joint Arrangements This IFRS replaces IAS 31: Interests in Joint Ventures and SIC 13 Jointly Controlled Entities – Non-Monetary Contributions by Venturers. Effective for annual periods beginning on or after 1 January 2014.
» IFRS 12: Disclosure of Interests in Other Entities. This standard unifies and reinforces the disclosure requirements applicable to subsidiaries, joint arrangements, associates and unconsolidated structured entities previously included in IAS 27 Separate Financial Statements, IAS 28 Investments in Associates and Joint Ventures and IAS 31 Interests in Joint Ventures. Effective for annual periods beginning on or after 1 January 2014.
» IAS 28 (revised): Investments in Associates and Joint Ventures. This standard was amended due to the issue of IFRS 11 Joint Arrangements and IFRS 12 Disclosure of Interests in Other Entities with the aim of unifying the definitions and other clarifications provided in these new standards. Effective for annual periods beginning on or after 1 January 2014.
» Amendments to IFRS 10 Consolidated Financial Statements, IFRS 11 Joint Arrangements and
IFRS 12 Disclosure of Interests in Other Entities. The amendments provide additional transition relief, by limiting the requirement to provide adjusted comparative information to only the preceding comparative period. Effective for annual periods beginning on or after 1 January 2014.
» Amendments to IFRS 10 Consolidated Financial Statements, IFRS 12 Disclosure of Interests in
Other Entities and IAS 27 Separate Financial Statements. The amendments introduce an exception to the requirement to consolidate all subsidiaries if the controlling entity qualifies as an investment entity. Effective for annual periods beginning on or after 1 January 2014.
» Amendments to IAS 32: Financial Instruments: Presentation. The requirements for offsetting
financial assets and financial liabilities are specified with a view to eliminating weaknesses in the application of current offsetting criteria in IAS 32. Effective for annual periods beginning on or after 1 January 2014.
» Amendments to IAS 39 Financial Instruments: Recognition and Measurement. These clarify that there would be no need to discontinue hedge accounting if a hedging derivative was novated, i.e. where a central counterparty replaces a counterparty in a derivative designated as a hedging instrument as a consequence of laws or regulations. Effective for annual periods beginning on or after 1 January 2014.
As a result of the adoption of IFRS 11, Indra has changed its accounting policy in respect of investments in joint arrangements. Under IFRS 11, the Group classifies its interests in joint arrangements as joint operations (if the Group has rights over assets and obligations for liabilities related to the arrangement) or as joint ventures (if the Group only has rights over the net assets of an arrangement). Joint ventures have to be accounted for using the equity method, while investments in joint arrangements are proportionately consolidated, i.e. recognising the proportional share of assets, liabilities, income and expenses that correspond to Indra. The Group considers the structure of the arrangements, the legal form of any separate vehicle, the contractual terms of the arrangements and other facts and circumstances when measuring these interests.
The impact of applying IFRS 11 has led to a decline in the assets and liabilities proportionately consolidated in respect of joint ventures, with the corresponding increase in equity-accounted investments under non-current assets on the statement of financial position. The impact on the income statement is a decrease in income and expenses, due to the proportional consolidation, with the corresponding net increase in the share in profits (or losses) for the year from equity-accounted investments. As a result of applying this standard the Group accounted for the following companies using the equity method:
→ I3 Televisión, S.L.
→ IRB Riesgo Operacional, S.L.
→ Indra Esteio Sistemas, S..A.
The impact of this application has been recognised at 1 January 2014 while the figures for 2013 have not been restated because these amendments were not considered to be significant to the consolidated annual accounts as a whole.

Indra • Consolidated Annual Accounts and Management Report
Consolidated Annual Accounts 9
a) Indra expects to adopt the following EU-approved standards and interpretations – not effective from 1 January 2014 – as of 1 January 2015 or at a later date (none have been adopted early)
►The 2011-2013 annual amendments to IFRS. Changes are made to the following standards: IFRS 3: Business Combinations, IFRS 13: Fair Value Measurement and IAS 40: Investment Property. Effective for annual periods beginning on or after 1 January 2015.
►Amendments to IAS 19: Employee Benefits. These simplify the accounting of employee contributions to defined benefit plans that are independent of the number of years of employee service. As a result, these contributions may be recognised as a reduction in the service cost in the year in which the service is rendered, rather than attributing contributions to all years of employee service. Effective for annual periods beginning on or after 1 February 2015.
►The 2010-2012 annual amendments to IFRS. Changes are made to the following standards: IAS 16: Property, Plant and Equipment , IAS 38: Intangible Assets, IAS 24: Related Party Disclosures, IFRS 2: Share-based Payment, IFRS 3: Business Combinations and IFRS 8: Operating Segments. Effective for annual periods beginning on or after 1 February 2015.
At the date of authorising these consolidated annual accounts for issue, Indra management is assessing the effect that the application of these standards and amendments will have on the consolidated annual accounts.
b) Standards and interpretations issued by the International Accounting Standards Board (IASB), pending EU approval: ►Amendment to IAS 16: Property, Plant and Equipment and IAS 38; Intangible Assets (clarification
of acceptable methods of depreciation and amortisation). Mandatory application for annual periods beginning on or after 1 January 2016.
►Amendments to IFRS 10: Consolidated Financial Statements and IAS 28: Investments in Associates and Joint Ventures. Mandatory application for annual periods beginning on or after 1 January 2016.
►Amendments to IAS 1: Presentation of Financial Statements (disclosures). Mandatory application
for annual periods beginning on or after 1 January 2016.
►Amendments to IFRS 10 Consolidated Financial Statements, IFRS 12 Disclosure of Interests in Other Entities and IAS 28 Investments in Associates and Joint Ventures. Mandatory application for
annual periods beginning on or after 1 January 2016.
►Amendments to IAS 11 Joint Arrangements. Mandatory application for annual periods beginning on or after 1 January 2016.
►IFRS 15: Revenue from Contracts with Customers. Mandatory application for annual periods beginning on or after 1 January 2017.
►FRS 9: Financial Instruments and subsequent amendments. Mandatory application for annual periods beginning on or after 1 January 2018.
The Parent's directors are assessing the potential impact of the future application of these standards.
The Group has not opted for the early adoption of any of the IFRSs that have already been issued but have not yet come into effect.
Comparative informationAs required by IFRS-EU, these consolidated annual accounts for 2014 present comparative figures for the prior year.
In accordance with IAS 12: Income Taxes, the Group has presented deferred tax assets and liabilities net by jurisdiction. Consequently the amounts for 2013 have been restated to facilitate comparison.
The impacts of retrospectively applying IAS 12 Income Taxes to the comparative consolidated financial statements are as follows:
Additionally, as mentioned in this note, at 31 December 2014 Indra has not restated the figures for 2013 as a result of the amendments to IFRS 11 because the resultant adjustments are not significant.
Thousands of Euros
Dr Cr
Deferred tax assets - 87,951
Deferred tax liabilities 87,951 -

Indra • Consolidated Annual Accounts and Management Report
Consolidated Annual Accounts 10
3. Application of Losses/Distribution of Profit
The Parent's board of directors will propose at the shareholders' general meeting that the loss of Euros 194,659,300.92 be transferred to prior years losses and that an amount of Euros 14,169,290.83 be transferred from voluntary reserves to the goodwill reserve.
The proposed dividend for 2013 was equivalent to Euros 0.34 per share.
These dividends, which if made effective for all shares held would have totalled Euros 55,805 thousand, were distributed with a charge to profit for 2013.
The directors of the different Group companies have proposed the distribution/application of these companies’ profits/losses for 2014. These proposals are pending approval by the shareholders at their respective annual general meetings.
4. Significant Accounting Principles
The consolidated annual accounts have been prepared in accordance with European Union-endorsed International Financial Reporting Standards (IFRS-EU).
The accounting policies set out below have been applied consistently in the periods presented in these consolidated annual accounts.
The most significant principles are as follows:
a) Subsidiaries and business combinationsSubsidiaries are entities, including structured entities, over which the Group, either directly or indirectly through subsidiaries, exercises control. The Company controls a subsidiary when it is exposed, or has rights, to variable returns from its involvement with the subsidiary and has the ability to affect those returns through its power over the subsidiary. The Company has power over a subsidiary when it has existing substantive rights that give it the ability to direct the relevant activities. The Company is exposed, or has rights, to variable returns from its involvement with the subsidiary when its returns from its involvement have the potential to vary as a result of the subsidiary’s performance.
A structured entity is an entity that has been designed so that voting or similar rights are not
the dominant factor in deciding who controls the entity, such as when any voting rights relate to administrative tasks only and the relevant activities are directed by means of contractual arrangements.
Subsidiaries are consolidated from the acquisition date until the date control ceases.
Subsidiaries are fully consolidated. Therefore, their assets, liabilities, income, expenses and cash flows are included in the consolidated annual accounts after adjusting and eliminating intra-Group transactions.
As permitted by IFRS 1 First-time Adoption of International Financial Reporting Standards, the Group has recognised only business combinations that occurred on or after 1 January 2004, the date of transition to IFRS-EU, using the acquisition method. Entities acquired prior to that date were recognised in accordance with accounting principles prevailing at that time, taking into account the necessary corrections and adjustments at the transition date.
The Group applied IFRS 3 Business Combinations, revised in 2008, to transactions carried out since 1 January 2010.
For business combinations carried out prior to 1 January 2010, the cost of the business combination includes contingent consideration, if this is probable at the acquisition date and can be reliably estimated. Subsequent recognition of contingent consideration or subsequent variations to contingent consideration are recognised as a prospective adjustment to the cost of the business combination.
The Group applies the acquisition method for business combinations.
The acquisition date is the date on which the Group obtains control of the acquiree.
The consideration transferred in a business combination is calculated as the sum of the acquisition-date fair values of the assets transferred, the liabilities incurred or assumed, the equity instruments issued and any consideration contingent on future events or compliance with certain conditions in exchange for control of the business acquired.
The consideration transferred excludes any payment that does not form part of the exchange for the acquired business. Since 1 January 2010, acquisition costs have been recognised as an expense when incurred.
Contingent liabilities are recognised until settlement, cancellation or expiration at the higher of the initially recognised amount, less any amounts that should be taken to consolidated profit or loss in

Indra • Consolidated Annual Accounts and Management Report
Consolidated Annual Accounts 11
accordance with revenue recognition criteria, and the amount resulting from provision measurement criteria.
At the acquisition date the Group recognises the assets acquired, liabilities assumed and any non-controlling interest at fair value. Non-controlling interests in the acquiree are recognised at the proportionate interest in the fair value of the net assets acquired. These criteria are only applicable for non-controlling interests which give access to economic benefits and entitlement to the proportional part of net assets of the acquiree in the event of liquidation. Otherwise, non-controlling interests are measured at fair value or value based on market conditions. Liabilities assumed include any contingent liabilities that represent present obligations arising from past events for which the fair value can be reliably measured. The Group also recognises indemnification assets transferred by the seller at the same time and following the same measurement criteria as the item that is subject to indemnification from the acquired business, taking into consideration, where applicable, the insolvency risk and any contractual limit on the indemnity amount.
With the exception of lease and insurance contracts, the assets acquired and liabilities assumed are classified and designated for subsequent measurement based on contractual agreements, economic terms, accounting and operating policies and any other conditions existing at the acquisition date.
The excess between the consideration given, plus the value assigned to non-controlling interests, and the value of net assets acquired and liabilities assumed, is recognised as goodwill. Any shortfall, after evaluating the consideration given the value assigned to non-controlling interests and the identification and measurement of net assets acquired, is recognised in profit or loss.
♦ Non-controlling interestsNon-controlling interests are disclosed in consolidated equity separately from equity attributable to equity holders of the Parent. Non-controlling interests’ share in consolidated profit or loss for the year (and in consolidated total comprehensive income for the year) is disclosed separately in the consolidated income statement and consolidated statement of comprehensive income.
The consolidated profit or loss for the year (consolidated total comprehensive income for the year) and changes in equity of the subsidiaries attributable to the Group and non-controlling interests after consolidation adjustments and eliminations, is determined in accordance with the percentage ownership at year end, without considering the possible exercise or conversion of potential voting rights and after discounting the effect of dividends, agreed or not, on cumulative preference shares classified in equity accounts. However, Group and non-controlling interests are calculated taking into account the possible exercise of potential voting rights and other derivative financial instruments which, in substance,
currently give access to the returns associated with the interests held, such as entitlement to a share in future dividends and changes in the value of subsidiaries.
The excess of losses attributable to non-controlling interests incurred prior to 1 January 2010, which cannot be attributed to them as such losses exceed their interest in the equity of the subsidiary, is recognised as a decrease in equity attributable to shareholders of the Parent, except when the non-controlling interests are obliged to assume part or all of the losses and are in a position to make the necessary additional investment. Profits obtained in subsequent years are allocated to equity attributable to shareholders of the Parent until the non-controlling interest’s share in prior years’ losses is recovered.
As of 1 January 2010, profit and loss and each component of other comprehensive income are allocated to equity attributable to shareholders of the Parent and to non-controlling interests in proportion to their investment, even if this results in a balance receivable from non-controlling interests. Agreements entered into between the Group and non-controlling interests are recognised as a separate transaction.
The increase and reduction of non-controlling interests in a subsidiary in which control is retained is recognised as an equity instrument transaction. Consequently, no new acquisition cost arises in increases nor is a gain recorded on reductions, rather, the difference between the consideration transferred or received and the carrying amount of the non-controlling interests is recognised in the reserves of the investor, without prejudice to reclassifying consolidation reserves and reallocating other comprehensive income between the Group and the non-controlling interests. When a Group’s interest in a subsidiary diminishes, non-controlling interests are recognised at their share of the consolidated net assets, including goodwill.
The Group recognises put options on interests in subsidiaries extended to non-controlling interests at the date of acquisition of a business combination as an advance purchase of the interests, recognising a financial liability at the present value of the best estimate of the payable, which forms part of the consideration given.
In subsequent years any variation in the financial liability, including the financial component, is recognised in reserves. Any discretionary dividends paid to non-controlling interests before the exercise date of the options are recognised as a distribution of profit. If the options are ultimately not exercised, the transaction is recognised as a sale of interests to non-controlling interests.
Puttable financial instruments and obligations arising on liquidation, which qualify for classification as equity instruments in the separate financial statements of the subsidiaries, are classified as financial liabilities in the consolidated annual accounts and not as non-controlling interests.

Indra • Consolidated Annual Accounts and Management Report
Consolidated Annual Accounts 12
♦ Provisional valuesIf it is only possible to determine a business combination provisionally, the identifiable net assets are initially recognised at their provisional amounts and adjustments made over the twelve months following the acquisition date are recognised as if they had been known at that date (see note 5).
At 31 December 2014 and 2013 no business combinations are recognised at provisional values.
♦ Other aspects relating to the consolidation of subsidiariesTransactions and balances with Group companies and unrealised gains or losses have been eliminated on consolidation. Nevertheless, unrealised losses have been considered as an indicator of impairment of the assets transferred.
The subsidiaries’ accounting policies have been adapted to Group accounting policies for like transactions and events in similar circumstances.
The annual accounts or financial statements of the subsidiaries used in the consolidation process have been prepared as of the same date and for the same period as those of the Parent.
b) Joint arrangementsJoint arrangements are those in which there is a contractual agreement to share the control over an economic activity, in such a way that decisions about the relevant activities require the unanimous consent of the Group and the remaining venturers or operators. The existence of joint control is assessed considering the definition of control over subsidiaries.
‣ Joint venturesInvestments in joint ventures are accounted for using the equity method described in c) below.
‣ Joint operationsFor joint operations, the Group recognises the assets, including its share of any assets held jointly, the liabilities, including its share of any liabilities incurred jointly with the other operators, the revenue from the sale of its share of the output arising from the joint operation, its share of the revenue from the sale of the output by the joint operation and the expenses, including its share of any expenses incurred jointly, in the consolidated annual accounts.
In sales or contributions by the Group to the joint operation, it recognises the resulting gains and losses
only to the extent of the other parties’ interests in the joint operation. When such transactions provide evidence of a reduction in net realisable value or an impairment loss of the assets transferred, such losses are recognised in full.
In purchases by the Group from a joint operation, it only recognises the resulting gains and losses when it resells the acquired assets to a third party. However, when such transactions provide evidence of a reduction in net realisable value or an impairment loss of the assets, the Group recognises its entire share of such losses.
The Group's acquisition of the initial and subsequent interest in a joint operation, is recognised applying the criteria for business combinations i.e. based on the percentage ownership in the individual assets and liabilities. Nevertheless, in the subsequent acquisition of an additional interest in a joint operation, the previously held interest in the individual assets and liabilities is not remeasured.
c) Equity-accounted investeesAssociates are entities over which the Parent, either directly or indirectly through subsidiaries, exercises significant influence. Significant influence is the power to participate in the financial and operating policy decisions of the investee but is not control or joint control over those policies. The existence of potential voting rights that are exercisable or convertible at the end of each reporting period, including potential voting rights held by the Group or other entities, are considered when assessing whether an entity has significant influence.
Investments in associates are accounted for using the equity method from the date that significant influence commences until the date that significant influence ceases.
The Group’s share of the profit or loss of an associate from the date of acquisition is recognised as an increase or decrease in the value of the investments, with a credit or debit to share of the profit or loss for the year of equity-accounted investees in the consolidated income statement.
d) Intangible assets‣ GoodwillGoodwill (see note 8) on business combinations carried out subsequent to the transition date (1 January 2004) is initially measured at an amount equivalent to the difference between the cost of the business combination and the Group’s share of the net fair value of the assets acquired and liabilities and contingent liabilities assumed from the acquired subsidiary or joint venture.
Goodwill is not amortised but is tested for impairment annually or more frequently where events or

Consolidated Annual Accounts 13
circumstances indicate that an asset may be impaired. Goodwill on business combinations is allocated to the cash-generating units (CGUs) that are expected to benefit from the synergies of the business combination and the criteria described in section g) of this note are applied. After initial recognition, goodwill is measured at cost less any accumulated impairment losses.
‣ Other intangible assetsIntangible assets are measured at purchase price or production cost, less any reduction in value as described in section g) of this note. Intangible assets include the following:
» Development expenses: which represent direct costs incurred in developments specifically attributable to individual projects.
Expenditure on research, development and innovation projects (R&D and innovation) are recognised directly in the consolidated income statement for the corresponding period, except for costs incurred on development projects, which are capitalised under development costs when the following conditions exist: • The expenditure to carry out the project can be measured reliably. • The allocation, assignment and timing of costs for each project are clearly defined.• There is evidence of the project’s technical success, in terms of direct operation or sale to a third party of the results thereof once completed and if a market exists. • The economic and commercial feasibility of the project is reasonably assured• Financing to develop the project, the availability of adequate technical and other resources to complete the development and to use or sell the resulting intangible asset are reasonably assured. • There is an intention to complete the intangible asset for its use or sale.
Development expenses are only capitalised when there is certainty that a project will generate future income to offset the costs capitalised for the project.
The cost of completed development projects is transferred to computer software and amortised on the basis of the estimated useful life of the asset.
» Computer software: expenses incurred on the acquisition of computer software or licences, as well as costs related to programs developed by the Group, are capitalised when these assets contribute to the generation of income.
Amounts capitalised do not include costs incurred to modify or upgrade programs used by the Group or expenses arising from review, consultancy and training services rendered by third parties in relation to the implementation of computer software.
» Industrial property: are stated at cost and amortised over the period of use stipulated therein.
Industrial property acquired in business combinations is recognised at the transaction-date fair value of the identifiable asset.
» Useful life and amortisation rates: The Company assesses whether the useful life of each intangible asset acquired is finite or indefinite. An intangible asset is regarded as having an indefinite useful life when there is no foreseeable limit to the period over which the asset will generate net cash inflows.
Intangible assets with finite useful lives are amortised by allocating the depreciable amount of an asset on a systematic basis over its useful life, by applying the following criteria:
Intangible assets with indefinite useful lives are not amortised, but are instead tested for impairment on an annual basis or whenever there is an indication that the intangible asset may be impaired.
e) Property, plant and equipmentProperty, plant and equipment are measured at cost less accumulated depreciation and any accumulated impairment losses. Costs of expansion, modernisation or improvements which increase the productivity, capacity or efficiency or extend the useful lives of assets are capitalised as an increase in the cost of those assets. Repair and maintenance costs are recognised in the consolidated income statement when incurred.
The cost of property, plant and equipment or, where applicable, the value assigned by independent experts is depreciated on a straight-line basis over the following average estimated useful lives:
Patents, licenses and trademarks Computer software
Straight-lineStraight-line
10 years1 to 10 years
Amortisation method
Estimated yearsof useful life
Buildings
Technical installations, machinery and other installations
Furniture
Information technology equipment
Motor vehicles
Other property, plant and equipment
50
10
10
4
7
10
Years of useful life

Indra • Consolidated Annual Accounts and Management Report
Consolidated Annual Accounts 14
f) Investment propertyInvestment property, including assets under construction or development, is property which is totally or partially held to earn rentals or for capital appreciation or both. Investment property is initially recognised at cost, including transaction costs.
After initial recognition, investment property is measured using the cost or deemed cost criteria applicable to property, plant and equipment. Details of the depreciation methods and useful lives are provided in that note.
Lease income is recognised using the criteria described in section h).
g) Impairment of non-financial assets subject to amortisation or depreciationImpairment testing is carried out annually in the case of goodwill and whenever there is any indication of impairment in the case of assets with indefinite useful lives. An impairment loss is recognised in the consolidated income statement when the carrying amount of the asset exceeds the recoverable amount, and the carrying amount is reduced to the recoverable amount. The recoverable amount is the higher of fair value less costs to sell and value in use.
To estimate value in use the Group prepares cash flow forecasts based on the best available estimates of income and expenses of cash-generating units, sector forecasts, historical experience and future expectations.
The Group calculates impairment on the basis of the business plans, generally for five years, of the different cash-generating units to which the assets are allocated, applying expected growth rates and maintaining constant growth as of the fifth year. To calculate the present value of cash flows, these are discounted at a pre-tax rate that considers the cost of capital of the business and of the geographical area in which the business is carried out. This calculation takes into account the present cost of money and the risk premiums generally used for each business and geographical area. The pre-tax rates used in 2014 ranged from 6.85% to 11.93%.
In the case of identifiable assets that do not generate cash flows independently, the Group estimates likelihood of recovery of the CGU to which the assets belong.
Reversal of impairment losses incurred on assets, except in the case of goodwill and development expenditure, is recognised as revenue in the consolidated income statement, with an adjustment to the provision associated with the assets. Where the Company has reasonable doubts as to the technical success or financial and commercial feasibility of in-progress development projects, the amounts in the
consolidated statement of financial position are recognised directly in impairment and other gains/losses on the disposal of intangible assets in the consolidated income statement and may not be reversed.
h) LeasesLeases in which the Group assumes substantially all the risks and rewards incidental to ownership are classified as finance leases. At the inception of a finance lease, the Group recognises an asset and liability for the lower of the fair value of the leased asset and the present value of the minimum lease payments. Interest is expensed using the effective interest method.
All other leases are operating leases and the leased assets are not recognised in the consolidated statement of financial position. Lease payments are recognised as an expense on a straight-line basis over the lease term.
Contingent rents, if any, are recognised as an expense when it is probable that they will be incurred.
i) Financial instruments‣ Classification of financial instruments Financial instruments are classified on initial recognition as a financial asset, a financial liability or an equity instrument in accordance with the economic substance of the contractual arrangement and the definitions of a financial asset, a financial liability and an equity instrument in IAS 32 “Financial Instruments: Presentation”.
Financial instruments are classified into five categories for measurement purposes: 1) Financial assets and financial liabilities at fair value through profit or loss; 2) loans and receivables; 3) held-to-maturity investments; 4) available-for-sale financial assets; and 5) financial liabilities at amortised cost. Financial instruments are classified into different categories based on the nature of the instruments and management’s intentions on initial recognition.
1) Financial assets and financial liabilities at fair value through profit or lossFinancial assets and financial liabilities at fair value through profit or loss are those classified as held for trading on initial recognition.
A financial asset or financial liability is classified as held for trading if:
• It is acquired or incurred principally for the purpose of selling or repurchasing it in the near term;

Indra • Consolidated Annual Accounts and Management Report
Consolidated Annual Accounts 15
measured at cost. Nonetheless, if the financial assets can be reliably measured subsequently, they are accounted for at fair value and any subsequent gain or loss is recognised in equity.
The Group recognises income from investments in equity instruments measured at cost only to the extent that retained earnings accumulated since the acquisition are distributed. Dividends received in excess of such earnings are regarded as a recovery of the investment and are therefore recognised as a reduction in the carrying amount of the investment.
5) Financial liabilitiesFinancial liabilities, including trade and other payables, which are not classified at fair value through profit or loss, are initially recognised at fair value less transaction costs that are directly attributable to the issue of the financial liability. After initial recognition, liabilities classified under this category are measured at amortised cost using the effective interest method.
6) Convertible bondsWhen compound financial instruments are issued with equity and liability components, the equity component is assigned the residual amount, after deducting from the fair value of the instrument as a whole the liability component, including any derivative financial instrument. The liability component is measured at the fair value of a similar instrument that does not have an associated equity component. Transaction costs relating to the issue of compound financial instruments are allocated to the components based on their relative carrying amount upon classification.
7) Offsetting principlesA financial asset and a financial liability are offset only when the Group currently has the legally enforceable right to offset the recognised amounts and intends either to settle on a net basis or to realise the asset and settle the liability simultaneously.
The risks associated with the asset or liability in question, including the credit risk posed by both the counterparty (credit value adjustment) and the entity itself (debt value adjustment) are taken into account when determining fair value. Any security or collateral or offsetting agreements with the counterparty are also taken into account when calculating credit risk.
►Impairment and uncollectibility of financial assetsAn impairment loss is recognised on a financial asset or group of financial assets when there is objective evidence of impairment as a result of one or more events occurring after initial recognition of the asset.
• Forms part, on initial recognition, of a portfolio of identified financial instruments that are managed together and for which there is evidence of a recent actual pattern of short-term profit-taking; or
• Is a derivative, except for a derivative that is a designated and effective hedging instrument or a financial guarantee contract.
Equity instruments which do not have a quoted price in an active market and for which fair value cannot be measured reliably are not classified in this category.
Financial assets and financial liabilities at fair value through profit or loss are initially recognised at fair value. Transaction costs directly attributable to the acquisition or issue are recognised as an expense when incurred.
After initial recognition, they are recognised at fair value through profit or loss. Fair value is not reduced by transaction costs incurred on sale or disposal.
2) Loans and receivablesLoans and receivables are non-derivative financial assets with fixed or determinable payments that are not quoted in an active market, other than those classified in other financial asset categories. These assets are initially recognised at fair value, including transaction costs, and are subsequently measured at amortised cost using the effective interest method.
3) Available-for-sale financial assetsThe Group classifies in this category non-derivative financial instruments that are designated as such or which do not qualify for recognition in the aforementioned categories.
Available-for-sale financial assets are initially recognised at fair value plus transaction costs directly attributable to the acquisition.
Following initial recognition, financial assets classified in this category are measured at fair value and any gain or loss is taken to other comprehensive income. On disposal of the financial assets, amounts recognised in other comprehensive income or the impairment loss are reclassified to profit or loss.
4) Financial assets carried at costInvestments in equity instruments for which the fair value cannot be reliably measured and derivative instruments that are linked to and must be settled by delivery of such unquoted equity instruments, are
Indra • Consolidated Annual Accounts and Management Report
Consolidated Annual Accounts 16
and the Group is not entitled to reinvest the cash flows. This criteria is not applicable to investments in cash or cash equivalents made by the Group during the settlement period from the collection date to the date of required remittance to the eventual recipients, provided that interest earned on such investments is passed on to the eventual recipients.
If, as a result of a transfer, a financial asset is derecognised in its entirety, the new financial asset, financial liability or servicing liability are recognised at fair value.
If the transferred asset is part of a larger financial asset, the previous carrying amount of the larger financial asset is allocated between the part that continues to be recognised and the part that is derecognised, including servicing assets, based on the relative fair values of those parts on the date of the transfer.
On derecognition of a financial asset in its entirety, the difference between the carrying amount and the sum of the consideration received, net of transaction costs, including any new asset obtained less any new liability assumed and any cumulative gain or loss deferred in other comprehensive income, is recognised in profit or loss.
If the Group neither transfers nor retains substantially all the risks and rewards of ownership of the financial asset, it determines whether it has retained control of the financial asset. In this case
» If the Group has not retained control, it derecognises the financial asset and recognises separately as assets or liabilities any rights and obligations created or retained in the transfer.
» If the Group has retained control, it continues to recognise the financial asset to the extent of its continuing involvement therein and recognises an associated liability. The extent of the Group’s continuing involvement in the transferred asset is the extent to which it is exposed to changes in the value of the transferred asset. The transferred asset and the associated liability are measured on a basis that reflects the rights and obligations that the Group has retained. The associated liability is measured in such a way that the carrying amount of the transferred asset and the associated liability is equal to the amortised cost of the rights and obligations retained by the Group, if the transferred asset is measured at amortised cost, or to the fair value of the rights and obligations retained by the Group, if the transferred asset is measured at fair value. The Group continues to recognise any income arising on the transferred asset to the extent of its continuing involvement and recognises any expense incurred on the associated liability. Recognised changes in the fair value of the transferred asset and the associated liability are accounted for consistently with each other in profit and loss or equity, following the general recognition criteria described previously, and are not offset.
The Group recognises impairment and uncollectibility of loans and receivables and debt instruments by recognising an allowance account for financial assets. When impairment and uncollectibility are considered irreversible, their carrying amount is eliminated against the allowance account. The impairment loss is reversed against the allowance account.
Impairment of available-for-sale financial assetsWhen a decline in the fair value of an available-for-sale financial asset has been accounted for directly in other comprehensive income, the cumulative loss is reclassified to profit and loss when there is objective evidence that the asset is impaired. The impairment loss recognised in profit or loss is calculated as the difference between the acquisition cost, net of any reimbursements or repayment of the principal, and the present fair value, less any impairment loss previously recognised in profit or loss for the year.
Impairment losses for investments in equity instruments are not reversed through profit or loss. Subsequent increases in the fair value of equity instruments are recognised in other comprehensive income.
If the fair value of debt instruments increases and the increase can be objectively related to an event occurring after the impairment loss was recognised, the increase is recognised in profit or loss up to the amount of the previously recognised impairment loss and any excess is accounted for in other comprehensive income.
Derecognition of financial assetsThe Group applies the criteria for derecognition of financial assets to part of a financial asset or part of a group of similar financial assets or to a financial asset or group of similar financial assets.
Financial assets are derecognised when the contractual rights to the cash flows from the financial asset expire or have been transferred and the Group has transferred substantially all the risks and rewards of ownership. Where the Group retains the contractual rights to receive cash flows, it only derecognises financial assets when it has assumed a contractual obligation to pay the cash flows to one or more recipients and if the following requirements are met:
» Payment of the cash flows is conditional on their prior collection;
» The Group is unable to sell or pledge the financial asset; and
» The cash flows collected on behalf of the eventual recipients are remitted without material delay

Indra • Consolidated Annual Accounts and Management Report
Consolidated Annual Accounts 17
i) InventoriesInventories are measured at the lower of cost on a FIFO basis and net realisable value. Work in progress includes the direct cost of labour, materials or services acquired for projects. Materials and services directly attributable to projects are measured at cost, while labour is recognised at standard cost, which does not differ significantly from the actual cost.
m) Trade receivablesSubsequent to initial recognition, trade and other receivables are measured at amortised cost using the effective interest method, provided they have a fixed maturity date of more than one year.
The Group provides for bad debts when there is objective evidence of impairment losses.
n) Government grantsNon-refundable grants received by the Group to finance research and development costs are recognised by reducing the corresponding asset by the amount received and are taken to income in line with the amortisation of projects capitalised under other intangible assets.
Financial liabilities comprising implicit assistance in the form of below-market interest rates are initially recognised at fair value. The difference between this value, adjusted where necessary for the issue costs of the financial liability and the amount received, is recognised as a government grant based on the
nature of the grant awarded.
o) Provisions for Liabilities and ChargesProvisions are recognised when the Group has a present obligation (legal or constructive) as a result of a past event; it is probable that an outflow of resources embodying economic benefits will be required to settle the obligation; and a reliable estimate can be made of the amount of the obligation.
The amount recognised as a provision is the best estimate at the end of the reporting period of the expenditure required to settle the present obligation, taking into account all risks and uncertainties surrounding the amount to be recognised as a provision and, where the time value of money is material, the financial effect of discounting provided that the expenditure to be made each period can be reliably estimated. The discount rate is a pre-tax rate that reflects the time value of money and the specific risks for which future cash flows associated with the provision have not been adjusted at each reporting date.
Single obligations are measured using the individual most likely outcome. When the provision involves a large population of identical items, the obligation is estimated by weighting all possible outcomes by their
Derecognition and modifications of financial liabilitiesThe Group derecognises all or part of a financial liability when it either discharges the liability by paying the creditor, or is legally released from primary responsibility for the liability either by process of law or by the creditor.
The exchange of debt instruments between the Group and the counterparty or substantial modifications of initially recognised liabilities are accounted for as an extinguishment of the original financial liability and the recognition of a new financial liability, providing the instruments have substantially different terms.
The Group considers the terms to be substantially different if the discounted present value of the cash flows under the new terms, including any fees paid net of any fees received and discounted using the original effective interest rate, is at least 10 per cent different from the discounted present value of the remaining cash flows of the original financial liability.
The difference between the carrying amount of a financial liability, or part of a financial liability, extinguished or transferred to another party and the consideration paid, including any non-cash assets transferred or liabilities assumed, is recognised in profit or loss.
j) Parent own sharesThe Group’s acquisition of equity instruments of the Parent is recognised separately at cost of acquisition in the consolidated statement of financial position as a reduction in equity, irrespective of the reason for the purchase. Any gains or losses on transactions with own equity instruments are not recognised.
The subsequent redemption of the Parent instruments entails a capital reduction equivalent to the par value of the shares. Any positive or negative difference between the purchase price and the par value of the shares is debited or credited to reserves.
Transaction costs related to own equity instruments, including issue costs related to a business combination, are accounted for as a reduction in equity, net of any tax effect.
k) Cash and cash equivalentsCash and cash equivalents include cash on hand and demand deposits in financial institutions. They also include other short-term, highly liquid investments that are readily convertible to known amounts of cash and which are subject to an insignificant risk of changes in value. An investment normally qualifies as a cash equivalent when it has a maturity of less than three months from the date of acquisition.

Indra • Consolidated Annual Accounts and Management Report
Consolidated Annual Accounts 18
discounted using market interest rates. The difference between this value and the nominal amount of the loan is recognised as a decrease in the accrued expense. The loan is therefore treated as an operating grant if an expense has been incurred or as a capital grant if no cost has been incurred or has been capitalised.
In subsequent years the loan revaluation is recognised under finance income or costs.
q) Classification of assets and liabilitiesAssets and liabilities are classified in the consolidated statement of financial position as current and non-current, as follows:
Non-current: payables falling due more than twelve months from the date of the statement of financial position, which is the Group’s normal operating cycle, and assets which are not expected to be realised, sold or consumed within this time.
Current: assets expected to be realised, sold or consumed within the Group’s normal operating cycle and payables falling due within twelve months of the date of the statement of financial position.
r) Income taxThe income tax expense or tax income for the year comprises current tax and deferred tax.
Current tax is the amount of income taxes payable or recoverable in respect of the consolidated taxable profit or tax loss for the period. Current tax assets or liabilities are measured at the amount expected to be paid to or recovered from the taxation authorities, using the tax rates and tax laws that have been enacted or substantially enacted at the reporting date.
Current and deferred tax are recognised as income or an expense and included in profit or loss for the year, except to the extent that the tax arises from a transaction or event which is recognised, in the same or a different year, directly in equity, or from a business combination.
A deferred tax liability is an amount payable in the future in respect of income tax relating to taxable temporary differences, while a deferred tax asset is an amount recoverable as a result of deductible temporary differences, tax loss carryforwards or deductions pending application. Temporary differences are differences between the carrying amount of an asset or liability and its tax base.
associated probabilities. Where there is a continuous range of possible outcomes, and each point in that range is as likely as any other, the mid-point of the range is used.
The financial effect of provisions is recognised as a finance cost in profit or loss.
The tax effect and gains on the expected disposal of assets are not taken into account in measuring a provision.
If it is not probable that an outflow of resources will be required to settle an obligation, the provision is reversed. The provision is reversed against the income statement item in which the related expense was recognised, and any surplus is accounted for in other income.
►Provisions for restructuring costsA provision for restructuring is recognised when the Group has a constructive obligation deriving from a detailed formal plan and it has raised a valid expectation that it will carry out the process by starting to implement the plan or announcing its main features to those affected by it. Restructuring provisions only include the direct expenditures arising from the restructuring which are not associated with the ongoing activities of the Group.
Obligations existing at the reporting date that arose as a result of past events, the amount and settlement date of which are not determined and which could have a negative effect on the Group’s equity are recognised as provisions for liabilities and charges under liabilities in the consolidated statement of financial position at the present value of the most probable estimated amount that the Group would be obliged to disburse to settle the obligation.
These provisions are measured at each reporting date based on the best available information on the consequences of the event for which they were recognised.
►Trade provisionsTrade provisions are made to cover the estimated cost of project repairs or revisions during the warranty period.
p) R&D loansR&D loans are granted to assist the Group’s research and development activities. These loans bear zero explicit interest and the repayment schedule generally exceeds five years.
R&D loans are initially recognised under liabilities at the present value of the future cash flows,

Indra • Consolidated Annual Accounts and Management Report
Consolidated Annual Accounts 19
Deferred tax assets that do not comply with the above conditions are not recognised in the consolidated statement of financial position. At year end the Group reassesses whether conditions are met for recognising previously unrecognised deferred tax assets.
s) Earnings per shareThe Group calculates basic earnings per share using the weighted average number of shares outstanding during the period. Outstanding shares are issued shares not held as own shares. Diluted earnings per share are calculated taking into account the dilutive effect of convertible instruments or instruments with an equity component.
t) Derivative financial instruments and hedge accountingDerivative financial instruments which qualify for hedge accounting are initially measured at fair value, plus any transaction costs that are directly attributable to the acquisition, or less any transaction costs directly attributable to the issue of the financial instruments. Nonetheless, transaction costs are subsequently recognised in profit and loss providing they do not change the effectiveness of the hedge. Derivatives that do not meet these criteria are classified and measured as financial assets and financial liabilities at fair value through profit or loss.
The Group also records hedges of foreign currency risk of a firm commitment as a cash flow hedge.At the inception of the hedge the Group formally designates and documents the hedging relationships and the objective and strategy for undertaking the hedges. Hedge accounting is only applicable when the hedge is expected to be highly effective at the inception of the hedge and in subsequent years in achieving offsetting changes in fair value or cash flows attributable to the hedged risk, throughout the period for which the hedge was designated (prospective analysis) and the actual effectiveness, which can be reliably measured, is within a range of 80%-125% (retrospective analysis).
For cash flow hedges of forecast transactions, the Group assesses whether these transactions are highly probable and if they present an exposure to variations in cash flows that could ultimately affect profit or loss.
The Group has arranged forward purchases and sales of foreign currency. These exchange rate insurance contracts are considered as derivative financial instruments that classify for hedge accounting, details of which are as follows:
In the case of hedges of the exposure of the fair value of foreign currency monetary financial assets and liabilities to currency risk, changes in both the market value of derivative financial instruments designated as hedging instruments and the market value of the hedged item as a result of the hedged exposure are
►Recognition of taxable temporary differencesDeferred tax liabilities due to taxable timing differences are recognised in all cases except where:
» They arise from the initial recognition of goodwill or an asset or liability in a transaction that is not a business combination and, at the time of the transaction, affects neither accounting profit nor taxable income.
» They are associated with investments in subsidiaries and jointly controlled entities over which the Group is able to control the timing of the reversal of the temporary difference and it is not probable that the difference will reverse in the foreseeable future.
►Recognition of deductible temporary differencesDeferred tax assets derived from deductible temporary differences are recognised provided that:
» It is probable that sufficient taxable profit will be available against which the deductible temporary difference can be utilised, unless the differences arise from the initial recognition of an asset or liability in a transaction that is not a business combination and, at the time of the transaction, affects neither accounting profit nor taxable income.
» The temporary differences are associated with investments in subsidiaries and jointly controlled entities that will reverse in the foreseeable future and sufficient taxable profit is expected to be generated against which the temporary differences can be offset.
Tax planning opportunities are only considered when assessing the recoverability of deferred tax assets if the Group intends to use these opportunities or it is probable that they will be utilised.
►MeasurementDeferred tax assets and liabilities are measured at the tax rates that are expected to apply to the period when the asset is realised or the liability is settled, based on tax rates and tax laws that have been enacted or substantively enacted. The tax consequences that would follow from the manner in which the Group expects to recover or settle the carrying amount of its assets or liabilities are also reflected in the measurement of deferred tax assets and liabilities.
The Group reviews the carrying amount of deferred tax assets at the reporting date and reduces this amount to the extent that it is not probable that sufficient taxable profit will be available against which to recover them.

Indra • Consolidated Annual Accounts and Management Report
Consolidated Annual Accounts 20
performance, and for which discrete financial information is available.
The Group’s activities are carried out in two main segments:
» Solutions, which include a wide range of systems, applications and components for compiling data and information and for data and information processing, transmission and subsequent presentation, for the control and management of complex processes. The Group’s solutions business is characterised by the customer-based approach and knowledge of the business, and incorporates a high degree of business consulting and technology.
» Services, including the management and operation of systems and solutions, as well as certain business processes where technology is a strategic and differentiating element.
Inter-segment pricing is determined on an arm’s length basis. The profit or loss of each segment is measured and fund-allocation decisions are taken using the contribution margin. This margin is the gross margin of projects less the cost of sales in the markets in which the Group offers its solutions and services and costs to support the completion of projects.
For consolidation purposes, corporate functions and other activities which cannot be allocated to a specific segment are shown under Corporate (unallocated).
Based on the different characteristics of the geographical areas in which the Group operates, the Group’s activities have been divided into the following geographical areas: Spain, Latin America, Europe and North America, Asia, Middle East and Africa.
w) Revenue recognitionThe Group recognises income on projects using the stage of completion method, which is based on the estimated portion of the total contract completed at the closing date. Accordingly, the total estimated profit is distributed over the period over which the contract is carried out, based on the percentage of completion at each reporting date.
The Group determines the percentage of completion of transactions, which is used as a basis for revenue recognition, as the proportion that contract costs incurred for work performed to date bear to the estimated total contract works.
Where the amounts billed exceed the income calculated by applying the percentage of total costs incurred, the difference is recognised under advances from customers. Conversely, where the amount
taken to the consolidated income statement.
In the case of cash flow hedges, changes in the market value of hedging derivative financial instruments are recognised, to the extent that these hedges are effective, in other comprehensive income in the consolidated statement of comprehensive income during the year in which the expected transaction or firm commitment impacts on profit and loss.
As currencies are traded on official markets, the fair value of exchange rate insurance is calculated based on the quoted price of each currency at each reporting date.
The Group has also contracted interest rate hedges to eliminate or significantly reduce these risks. The fair value of interest rate hedges is based on the market values of equivalent derivative financial instruments at the reporting date. All interest rate hedges are also effective as cash flow hedges. The Group recognises the portion of the gain or loss on the measurement at fair value of a hedging instrument that is determined to be an effective hedge in recognised income and expense.
The Group has established that the inputs used to determine the fair value of hedging derivatives should consider observable inputs within level 2 of the hierarchy, except in the case of adjustments for counterparty credit risk (commonly known as CVA/DVA) (Level 3) that have been estimated based on the credit rating or the ratings/spreads of comparable companies to determine the probability of counterparty default.
Given that the counterparties of derivatives are prestigious financial institutions, after an analysis, the Group has concluded that the credit risk adjustments are not significant within the overall measurement of derivative financial instruments and, therefore, have no material impact on the calculation of the fair value of the instruments in question. Therefore, the Indra Group considers that these derivatives should be classified within level 2 of the hierarchy.
u) Termination benefitsUnless there is just cause, prevailing employment law requires companies to pay termination benefits to employees whose services are discontinued in certain circumstances. Termination benefits are expensed when the decision to terminate employment is approved and announced to the affected parties.
v) Segment reportingAn operating segment is a component of the Group that engages in business activities from which it may earn revenues and incur expenses, whose operating results are regularly reviewed by the Group’s chief operating decision maker to make decisions about resources to be allocated to the segment and assess its

Indra • Consolidated Annual Accounts and Management Report
Consolidated Annual Accounts 21
(III) Translation of foreign operationsThe Group has applied the exemption permitted by IFRS 1, First-time Adoption of International Financial Reporting Standards, relating to accumulated translation differences. Consequently, translation differences recognised in the consolidated annual accounts generated prior to 1 January 2004 are recognised in retained earnings. As of that date, foreign operations whose functional currency is not the currency of a hyperinflationary economy have been translated into Euros as follows:
» Assets and liabilities, including goodwill and net asset adjustments derived from the acquisition of the operations, including comparative amounts, are translated at the closing rate at the reporting date.
» Income and expenses, including comparative amounts, are translated at the exchange rates prevailing at each transaction date; and
» All resulting exchange differences are recognised as translation differences in other comprehensive income.
These criteria are also applicable to the translation of the financial statements of equity-accounted companies, with translation differences attributable to the Group recognised in other comprehensive income.
Translation differences recognised in other comprehensive income are accounted for in profit or loss as an adjustment to the gain or loss on the sale using the same criteria as for subsidiaries and associates.
(IV) Entities located in hyperinflationary countriesFollowing the criteria established in IFRS-EU, the Venezuelan economy has been considered as hyperinflationary at the 2014 close. The financial statements of Group companies located in Venezuela have therefore been adjusted to correct the effects of inflation.
As required by IAS 29, monetary items have not been restated, whereas non-monetary items (mainly property, plant and equipment and equity) have been restated based on the Venezuelan Consumer Price Index.
The differences arising from this adjustment have been taken to the consolidated income statements for 2014 and 2013.
At 31 December 2014 these adjustments had a positive impact of Euros 206 thousand on the equity
billed is lower than the income calculated by applying the percentage of completion method, the unbilled amount is recognised under receivables in the consolidated statement of financial position.
The Group regularly assesses whether any service contracts are onerous and, where applicable, recognises the necessary provisions.
x) Foreign currency transactions and balances
(I) Functional and presentation currencyThe figures disclosed in the consolidated annual accounts are expressed in thousands of Euros, the parent’s functional and presentation currency, rounded off to the nearest thousand.
(II) Foreign currency transactions, balances and cash flowsTransactions in foreign currency are translated at the spot exchange rate prevailing at the date of the transaction.
Monetary assets and liabilities denominated in foreign currencies have been translated into the functional currency at the closing rate, while non-monetary assets and liabilities measured at historical cost have been translated at the exchange rate prevailing at the transaction date. Non-monetary assets measured at fair value have been translated into the functional currency at the exchange rate at the date that the fair value was determined.
In the consolidated statement of cash flows, cash flows from foreign currency transactions have been translated into Euros at the exchange rates prevailing at the dates the cash flows occur. The effect of exchange rate fluctuations on cash and cash equivalents denominated in foreign currencies is recognised separately in the statement of cash flows as effect of exchange rate fluctuations on cash and cash equivalents held.
Exchange gains or losses on monetary financial assets or financial liabilities denominated in foreign currencies are recognised in profit or loss.
Monetary financial assets denominated in foreign currencies classified as available for sale are measured at amortised cost in the foreign currency. Consequently, the exchange differences associated with changes in amortised cost are recognised in profit or loss and the remainder of the change in fair value is recognised as set forth in section i).

Indra • Consolidated Annual Accounts and Management Report
Consolidated Annual Accounts 22
recognised in the consolidated statement of financial position (a positive impact of Euros 200 thousand in 2013).
5. Business Combinations
a) SubsidiariesThe Group did not acquire any subsidiaries in the year ended 31 December 2014 and no business combinations are recognised at a provisional amount.
Details of subsidiaries acquired by the Group during the year ended 31 December 2013 are as follows:
» On 12 March 2013 the Parent acquired 100% of the capital of G-nubila Technology, S.L.U. and G-nubila Colombia SAS for Euros 2,652 thousand and Euros 290 thousand, respectively. On 28 October 2013 G-nubila Technology S.L.U. was merged with and into the Parent.
Aggregate details of the cost of business combinations and the fair value of the net assets acquired and goodwill were as follows (see note 8):
Had these acquisitions taken place at 1 January 2013, the Group’s revenue and profit attributable to the Parent for the year ended 31 December 2013 would have amounted to Euros 2,914,282 thousand and Euros 115,691 thousand, respectively.
The business combinations acquired during 2013 generated revenue of Euros 482 thousand and profit of Euros 24 thousand since the acquisition date. These amounts were included in the consolidated statement of comprehensive income for 2013.
The transaction costs recognised in the consolidated income statement for 2013 for this business combination are not significant.
Assets Thousands of Euros
Property, plant and equipment 38
Intangible assets 3,901
Financial assets
Deferred tax
Inventories
Trade receivables 156
Other assets 86
4,181
Liabilities
Grants
Non-current provisions
Non-current payables (935)
Suppliers (202)
Other liabilities (156)
(1.293)
Total net assets 2,888
Cost of the business combination 2,942
Cash and cash equivalents 54
Goodwill -
Cost of the business combination:
- Cash paid and payables 2,942
2,942
Fair value of net assets acquired 2,942
Goodwill (note 8) -

Consolidated Annual Accounts 23
6. Property, Plant and Equipment
Details of this item at 31 December 2014 and 2013 are as follows:
Thousands of Euros
Balance at31.12.13
Change inscope of cons.
Translationdifferences
Additions Disposals TransfersBalance at
31.12.14
Investments:
Land 10,744 - - - - 10,744
Buildings 56,419 - 174 104 (72) (374) 56,251
Tech, installations, mach, and other fixtures 206,784 (24) (14,304) 5,296 (4,355) (994) 192,403
Furniture 37,901 (17) (1,271) 2,857 (393) 351 39,428
Motor vehicles 3,432 (15) (58) 372 (593) (169) 2,969
Information technology equipment 67,774 (41) (3,563) 4,224 (1,001) 4 67,397
Other property, plant and equipment 9,892 (77) 148 4,199 (2,494) (100) 11,568
Under construction 849 45 175 (714) (134) 221
393,795 (174) (18,829) 17,227 (9,622) (1,416) 380,981
Depreciation:
Buildings (19,080) - (105) (1,336) 72 (204) (20,653)
Tech, installations, mach, and other fixtures (144,091) - 12,541 (13,409) 3,404 980 (140,575)
Furniture (24,227) 1 743 (2,847) 288 (99) (26,141)
Motor vehicles (1,825) - 111 (348) 447 122 (1,493)
Information technology equipment (56,944) 23 3,561 (6,239) 837 576 (58,186)
Other property, plant and equipment (6,850) - (76) (1,319) 1,522 138 (6,585)
(253,017) 24 16,775 (25,498) 6,570 1,513 (253,633)
Carrying amount:
Land 10,744 - - - - - 10,744
Buildings 37,339 - 69 (1,232) - (578) 35,598
Tech, installations, mach, and other fixtures 62,693 (24) (1,763) (8,113) (951) (14) 51,828
Furniture 13,674 (16) (528) 10 (105) 252 13,287
Motor vehicles 1,607 (15) 53 24 (146) (47) 1,476
Information technology equipment 10,830 (18) (2) (2,015) (164) 580 9,211
Other property, plant and equipment 3,042 (77) 72 2,880 (972) 38 4,983
Under construction 849 - 45 175 (714) (134) 221
Total 140,778 (150) (2,054) (8,271) (3,052) 97 127,348

Consolidated Annual Accounts 24
As in 2013, additions to technical installations, machinery and other fixtures in 2014 are mainly due to the ongoing fitting-out of the Parent’s new offices.
A loss of Euros 1,272 thousand was generated on disposals in 2014, which is recognised in the consolidated income statement (see note 32).
Thousands of Euros
Balance at31.12.12
Change inscope of cons.
Translationdifferences
Additions Disposals TransfersBalance at
31.12.13
Investments:
Land 10,719 - - - - 25 10,744
Buildings 57,118 - (411) 274 (359) (203) 56,419
Tech, installations, mach, and other fixtures 231,422 17 (6,175) 10,036 (28,064) (452) 206,784
Furniture 40,504 28 (1,035) 1,708 (2,028) (1,276) 37,901
Motor vehicles 3,976 - (268) 439 (673) (42) 3,432
Information technology equipment 74,045 138 (3,107) 3,865 (4,884) (2,283) 67,774
Other property, plant and equipment 9,812 - (1,338) 1,790 (336) (36) 9,892
Under construction 258 - (9) 738 - (138) 849
427,854 183 (12,343) 18,850 (36,344) (4,405) 393,795
Depreciation:
Buildings (18,076) - 122 (1,306) 180 - (19,080)
Tech, installations, mach, and other fixtures (153,825) (10) 4,707 (15,759) 18,856 1,940 (144,091)
Furniture (24,330) (16) 744 (3,153) 1,519 1,009 (24,227)
Motor vehicles (1,975) - 70 (432) 484 28 (1,825)
Information technology equipment (59,340) (119) 2,416 (7,628) 4,914 2,813 (56,944)
Other property, plant and equipment (7,169) - 1,052 (953) 220 - (6,850)
(264,715) (145) 9,111 (29,231) 26,173 5,790 (253,017)
Carrying amount:
Land 10,719 - - - - 25 10,744
Buildings 39,042 - (289) (1,032) (179) (203) 37,339
Tech, installations, mach, and other fixtures 77,597 7 (1,468) (5,723) (9,208) 1,488 62,693
Furniture 16,174 12 (291) (1,445) (509) (267) 13,674
Motor vehicles 2,001 - (198) 7 (189) (14) 1,607
Information technology equipment 14,705 19 (691) (3,763) 30 530 10,830
Other property, plant and equipment 2,643 - (286) 837 (116) (36) 3,042
Under construction 258 - (9) 738 - (138) 849
Total 163,139 38 (3,232) (10,381) (10,171) 1,385 140,778

Indra • Consolidated Annual Accounts and Management Report
Consolidated Annual Accounts 25
Details of assets acquired through finance leases, by type of asset, at 31 December 2014 and 2013 are as follows:
Details of minimum lease payments and the present value of finance lease liabilities, by maturity date, are as follows:
Finance lease liabilities are effectively secured as the rights to the leased assets revert to the lessor in the event of default.
At 31 December 2014 fully depreciated property, plant and equipment amount to Euros 143,332 thousand (Euros 135,211 thousand at 31 December 2013).
The Group has taken out insurance policies to cover the risk of damage to its property, plant and equipment. The coverage of these policies is considered sufficient.
7. Investment property
On 29 April 2014 the subsidiary Prointec, S.A. sold all its investment property for Euros 2,700 thousand, recognising a loss of Euros 485 thousand in the corresponding item in the consolidated income statement. (Note 32).
In 2013 an appraisal by an independent expert showed impairment of Euros 65 thousand on the Group's investment property, which was recognised in the consolidated income statement (see note 32).
Thousands of Euros
2014 2013
Investments:
Land - -
Buildings - 2,905
Tech, installations, mach, and other fixtures 8,420 8,487
Furniture 98 98
Information technology equipment 2,173 2,581
Other property, plant and equipment 406 649
11,097 14,720
Depreciation:
Buildings - (1,463)
Tech, installations, mach, and other fixtures ( 4,172 ) ( 3,494 )
Furniture ( 65 ) ( 55 )
Information technology equipment ( 740 ) ( 541 )
Other property, plant and equipment ( 115 ) ( 247 )
(5,092) (5,800)
Carrying amount:
Buildings - 1,442
Tech, installations, mach, and other fixtures 4,248 4,993
Furniture 33 43
Information technology equipment 1,433 2,040
Other property, plant and equipment 291 402
Total 6,005 8,920
Thousands of Euros
2014 2013
Minimum payments
InterestPurchase
optionMinimum
paymentsInterest
Purchase option
Less than one year 2,079 260 - 2,261 332 28
One to five years 4,337 229 515 6,262 471 515
Total 6,416 489 515 8,523 803 543

Indra • Consolidated Annual Accounts and Management Report
Consolidated Annual Accounts 26
8. Goodwill
For impairment testing purposes, goodwill has been allocated to the Group’s cash-generating units (CGUs) in accordance with their respective business segment and the country of operation.
A summary of goodwill is as follows:
Thousands of Euros
2014 2013
Cost Accum, impairment Carrying amount Cost Accum, impairment Carrying amount
Indra EWS 14,462 - 14,462 14,462 - 14,462
Indra ATM 29,447 - 29,447 29,447 - 29,447
Brazil 101,558 (16,656) 84,902 100,408 - 100,408
Indra Italy 20,504 - 20,504 20,504 - 20,504
Indra Navia 26,136 - 26,136 28,364 - 28,364
Consultancy Group 36,608 (4,055) 32,553 36,608 - 36,608
BPO Group 58,925 - 58,925 58,925 - 58,925
Azertia Group 67,475 (8,582) 58,893 67,811 (8,582) 59,229
Prointec Group 30,479 (2,682) 27,797 30,522 (1,788) 28,734
Soluziona Group 169,455 (2,831) 166,624 169,930 (2,831) 167,099
Other 63,956 (914) 63,042 63,077 (914) 62,163
Total 619,005 (35,720) 583,285 620,058 (14,115) 605,943

Indra • Consolidated Annual Accounts and Management Report
Consolidated Annual Accounts 27
No additions were made to goodwill in the consolidated statement of financial position in the year ended 31 December 2014.
Additions for the year ended 31 December 2013 reflected the following transactions relating to business combinations established prior to 2010, giving rise to the recognition of new goodwill:
» On 16 May 2013, the Parent settled Euros 2,428 thousand of the variable price for the acquisition of Indra Perú, S.A. recognising goodwill of Euros 3,237 thousand.
Disposals for the year ended 31 December 2013 related to the following transactions:
» On 17 May 2013 the subsidiary Indra BPO, S.L. sold its printing and finishing (P&F) activity, derecognising goodwill of Euros 740 thousand accordingly. The Group derecognised goodwill allocated to Azertia Group companies amounting to Euros 8,462 thousand as a result of this sale.
Thousands of Euros
31.12.13 AdditionsTranslation differences
Disposals Impairment 31.12.14
Indra EWS 14,462 - - - - 14,462
Indra ATM 29,447 - - - - 29,447
Brazil 100,408 - 1,150 - (16,656) 84,902
Indra Italy 20,504 - - - - 20,504
Indra Navia 28,364 - (2,228) - - 26,136
Consultancy Group 36,608 - - - (4,055) 32,553
BPO Group 58,925 - - - - 58,925
Azertia Group 59,229 - (336) - - 58,893
Prointec Group 28,734 - (44) - (894) 27,796
Soluziona Group 167,099 - (475) - - 166,624
Other 62,163 - 880 - - 63,043
Total 605,943 - (1,053) - (21,605) 583,285
Thousands of Euros
31.12.12 AdditionsTranslation differences
Disposals Impairment 31.12.13
Indra EWS 14,462 - - - - 14,462
Indra ATM 29,447 - - - - 29,447
Brazil 120,983 - (20,575) - - 100,408
Indra Italy 20,504 - - - - 20,504
Indra Navia 32,317 - (3,953) - - 28,364
Consultancy Group 36,608 - - - - 36,608
BPO Group 59,665 - - (740) - 58,925
Azertia Group 68,669 - (978) (8,462) - 59,229
Prointec Group 29,630 - (2) - (894) 28,734
Soluziona Group 170,764 - (3,665) - - 167,099
Other 62,242 3,237 (3,120) - (196) 62,163
Total 645,291 3,237 (32,293) (9,202) (1,090) 605,943

Indra • Consolidated Annual Accounts and Management Report
Consolidated Annual Accounts 28
Key assumptions used to calculate value in use
The Group periodically measures the recoverability of the goodwill included in the above table by discounting the expected future cash flows of the various cash generating units (CGUs) based on their business plans.
The assumptions on which these cash flow projections are based are past experience and reasonable forecasts of the business plans of the Group’s different cash-generating units. These forecasts are contrasted with market growth forecasts according to different specialised sources, taking into account the company’s position in the market and any strategic aspects that could lead to changes in this position (innovation, new market openings, etc.).
The assumptions used to calculate the value in use of each significant existing CGU are as follows:
Year-on-year growth rate Discount rate Residual growth rate
Income (5 years)
2014 2013 2014 2013 2014 2013
Indra EWS (0.5%) 0.8% 8.36% 8.90% 1.00% 1.00%
Indra ATM 1.8% (0.7%) 7.80% 8.90% 2.00% 2.00%
Brazil 12.4% 16.3% 11.93% 11.65% 4.96% 4.70%
Indra Italy 9.6% 3.5% 8.17% 8.90% 1.70% 2.00%
Indra Navia 2.3% 9.4% 6.85% 8.90% 2.70% 2.00%
Consultancy Group 5.8% 6.1% 8.22% 8.90% 1.50% 1.53%
BPO Group 3.0% 6.6% 7.94% 8.90% 2.00% 2.00%
Azertia Group 3.1% 1.1% 8.07% 8.90% 2.00% 2.00%
Prointec Group 6.7% 10.5% 8.39% 8.90% 2.00% 2.00%
Soluziona Group 7.9% 7.1% 8.40% 8.90% 2.00% 2.06%

Indra • Consolidated Annual Accounts and Management Report
Consolidated Annual Accounts 29
To calculate their present value cash flows are discounted at a pre-tax rate that considers the specific risks affecting the assets as well as cash flow risks not contemplated, such as country risk. This rate is calculated using the capital asset pricing model (CAPM). The data used in these calculations come from prestigious and independent external information sources and the results are compared with the rates used by independent financial analysts when valuing comparable businesses. The pre-tax rates used in 2014 ranged from 6.85% to 11.93%.
The projections are for a period of five years. From the sixth year onwards the cash flows are those that compose the terminal value and are estimated as income in perpetuity at a constant growth rate (residual growth rate) on a normalised cash flow that reflects the CGU's operations in perpetuity. The residual growth rate is estimated for each CGU taking into account the nature of the business and forecast long-term inflation in the activity area of each CGU, comparing this information with external sources. Growth rates of 1% to 4.96% were used in the projections made in 2014.
The normalised cash flow used as the base to calculate the terminal value is determined by making the following adjustments to the cash flow in the fifth year:
Sales Normalised cash flow = Sales Year 5 x (1+g)Operating expenses Normalised cash flow = Operating expenses Year 5 x (1+g)Depreciation and amortisation Normalised cash flow = Depreciation and amortisation Year 5
Investment Normalised cash flow = Depreciation and amortisation Normalised cash flow Investment in working capital Normalised cash flow = Days working capital Year 5 / 365 x Sales Year 5 x g (1)Tax rate Normalised cash flow = Tax rate Year 5
Normalised cash flow = (Sales – Operating expenses – Investment – Investment in working capital – Taxes) Normalised cash flow
"g" is the residual growth rate
(1) The investment in working capital is calculated based on residual growth.
The percentage that the discounted amount of the terminal value represents compared to the recoverable amount of each CGU in 2014 and 2013 is as follows:
2014 2013
Indra EWS 69% 75%
Indra ATM 77% 71%
Brazil 73% 93%
Indra Italy 79% 60%
Indra Navia 80% 69%
Consultancy Group 80% 78%
BPO Group 76% 78%
Azertia Group 72% 75%
Prointec Group 76% 81%
Soluziona Group 78% 75%

Indra • Consolidated Annual Accounts and Management Report
Consolidated Annual Accounts 30
Details of the carrying and recoverable amounts of the most significant CGUs at 31 December 2014 and 2013, are as follows:
In all cases sensitivity analyses are performed in relation to the discount rate used and the residual growth rate, to verify that reasonable changes in these assumptions would not have an impact on the possible recovery of the goodwill recognised. Sensitivity analyses are also conducted on the main assumptions: sales, margins, working capital and residual EBIT.
2014 (Thousands of Euros) 2013 (Thousands of Euros)
Carrying amount (1)
Recoverable amount (2)
Difference (2)-(1)
Carrying amount (1)
Recoverable amount (2)
Difference (2)-(1)
Indra EWS 14,462 217,024 202,562 14,462 167,257 152,795
Indra ATM 48,670 66,214 17,544 29,447 37,775 8,328
Brazil 225,589 225,589 - 175,119 232,878 57,759
Indra Italy 47,951 71,871 23,920 42,999 46,847 3,848
Indra Navia 47,803 96,853 49,050 40,470 66,925 26,455
Consultancy Group 58,684 58,684 - 64,913 82,980 18,067
BPO Group 71,520 133,111 61,591 66,306 68,462 2,156
Azertia Group 82,548 143,162 60,614 86,893 230,545 143,652
Prointec Group 61,222 110,982 49,760 66,236 115,263 49,027
Soluziona Group 286,960 454,668 167,708 206,125 519,823 313,698

Consolidated Annual Accounts 31
The result of the sensitivity analysis of the impairment tests on the goodwill allocated to the CGUs is as follows:
2014
WACC fluctuation Residual growth rate
Impact on recoverable amount of CGUs: -1 p.p. +1 p.p. -0.5 p.p. +0.5 p.p.
Indra EWS 35,244 (26,683) (11,625) 13,320
Indra ATM 14,587 (10,252) (3,185) 3,787
Brazil 39,697 (29,622) (7,893) 9,113
Indra Italy 14,635 (10,643) (2,941) 3,434
Indra Navia 31,081 (18,973) (7,313) 9,315
Consultancy Group 11,245 (8,270) (2,153) 2,499
BPO Group 28,441 (20,156) (7,885) 9,335
Azertia Group 28,443 (20,337) (7,386) 8,711
Prointec Group 22,222 (16,132) (5,191) 6,073
Soluziona Group 92,224 (66,835) (21,299) 24,909
2014
Sales fluctuation EBIT MarginChange in days of
working capital
Impact on recoverable amount of CGUs: -8.0% -1 p.p +10 days
Indra EWS (18,595) (7,319) (2,144)
Indra ATM (3,714) (6,804) (1,854)
Brazil (9,721) (32,617) (15,157)
Indra Italy (3,693) (8,252) (2,614)
Indra Navia (6,170) (10,369) (2,512)
Consultancy Group (2,776) (5,877) (1,691)
BPO Group (9,552) (13,042) (3,713)
Azertia Group (8,957) (13,081) (3,736)
Prointec Group (6,389) (11,151) (3,262)
Soluziona Group (26,848) (52,149) (15,486)

Consolidated Annual Accounts 32
This sensitivity analysis shows that, except in the cases of the Brazil CGU and the Consultancy CGU, the most important CGUs present no significant risks associated with reasonably possible variations in financial variables and operational variables, considered on an individual basis.
In 2014 the Brazil CGU and the Consultancy CGU suffered impairment of Euros 16,656 thousand and Euros 4,055 thousand, respectively.
Furthermore, the calculations in respect of the other CGUs show that impairment of Euros 894 thousand was incurred in 2014 (Euros 1,090 thousand in 2013), which together with the impairment of the Brazil CGU and the Consultancy CGU has been recognised under other losses on non-current assets in the consolidated income statement (see note 32).
2013
WACC fluctuation Residual growth rate
Impact on recoverable amount of CGUs: -1 p.p. +1 p.p. -0.5 p.p. +0.5 p.p.
Indra EWS 27,603 (21,231) (9,226) 10,472
Indra ATM 6,688 (4,983) (1,078) 1,247
Brazil 52,027 (38,628) (11,655) 13,462
Indra Italy 7,094 (5,309) (979) 1,132
Indra Navia 11,481 (8,543) (2,758) 3,189
Consultancy Group 15,004 (11,305) (3,035) 3,480
BPO Group 13,293 (9,865) (3,343) 3,866
Azertia Group 44,811 (33,186) (11,445) 13,242
Prointec Group 22,834 (16,937) (5,584) 6,457
Soluziona Group 96,022 (70,959) (19,310) 22,345
2013
Sales fluctuation EBIT MarginChange in days of
working capital
Impact on recoverable amount of CGUs: -8.0% -1 p.p +10 days
Indra EWS (14,831) (5,799) (1,813)
Indra ATM (1,368) (5,247) (1,630)
Brazil (14,449) (29,657) (13,546)
Indra Italy (1,099) (5,045) (1,737)
Indra Navia (3,697) (5,506) (1,806)
Consultancy Group (4,031) (5,762) (1,797)
BPO Group (4,274) (9,036) (2,891)
Azertia Group (14,990) (17,570) (5,646)
Prointec Group (6,894) (7,714) (2,399)
Soluziona Group (24,293) (53,650) (17,088)

Indra • Consolidated Annual Accounts and Management Report
Consolidated Annual Accounts 33
Details are provided below of the amount by which the value assigned to key assumptions must be changed so that the recoverable amount is equal to the carrying amount of each CGU. 2014
WACC Residual growth rate
CGU: AssumptionValue to equal
carrying amountAssumption
Value to equal carrying amount
Indra EWS 8.36% 121.92% 1.00% -
Indra ATM 7.80% 10.06% 2.00% (3.51%)
Brazil 11.93% 11.93% 4.96% 4.96%
Indra Italy 8.17% 10.98% 1.70% (7.36%)
Indra Navia 6.85% 11.06% 2.70% (8.02%)
Consultancy Group 8.22% 8.22% 1.50% 1.50%
BPO Group 7.94% 12.67% 2.00% (7.16%)
Azertia Group 8.07% 12.53% 2.00% (8.10%)
Prointec Group 8.39% 13.02% 2.00% (12.62%)
Soluziona Group 8.40% 11.72% 2.00% (6.51%)
2014
Sales fluctuation EBIT Margin Days of working capital
CGU:Value to equal
carrying amountAssumption*
Value to equal carrying amount
Assumption*Value to equal
carrying amount
Indra EWS (87.1%) 27.2% (0.4%) (155) 857
Indra ATM (42.1%) 10.4% 7.5% 127 232
Brazil - 8.3% 8.3% 88 88
Indra Italy (51.8%) 9.6% 6.7% 120 212
Indra Navia (63.6%) 9.8% 5.1% 102 297
Consultancy Group - 10.7% 10.7% 158 158
BPO Group (51.6%) 10.1% 5.4% 27 193
Azertia Group (54.1%) 10.4% 5.7% 55 218
Prointec Group (62.3%) 10.4% 5.9% 96 249
Soluziona Group (50.0%) 9.3% 6.1% 91 199

Indra • Consolidated Annual Accounts and Management Report
Consolidated Annual Accounts 34
2013
WACC Residual growth rate
CGU: AssumptionValue to equal
carrying amountAssumption
Value to equal carrying amount
Indra EWS 8.90% 64.88% 1.00% (548.9%)
Indra ATM 8.90% 10.75% 2.00% (5.5%)
Brazil 11.65% 13.27% 4.70% 1.2%
Indra Italy 8.90% 9.60% 2.00% (0.5%)
Indra Navia 8.90% 13.39% 2.00% (10.7%)
Consultancy Group 8.90% 10.65% 1.53% (3.0%)
BPO Group 8.90% 9.19% 2.00% 1.6%
Azertia Group 8.90% 17.73% 2.00% (37.4%)
Prointec Group 8.90% 12.95% 2.00% (8.1%)
Soluziona Group 8.90% 18.35% 2.06% (27.6%)
2013
Sales fluctuation EBIT Margin Days of working capital
CGU:Value to equal
carrying amountAssumption*
Value to equal carrying amount
Assumption*Value to equal
carrying amount
Indra EWS (82.4%) 27.1% 0.8% (155) 688
Indra ATM (48.7%) 7.2% 5.6% 126 177
Brazil (32.0%) 10.6% 8.6% 90 133
Indra Italy (28.0%) 8.0% 7.2% 150 172
Indra Navia (57.2%) 11.0% 6.2% 79 225
Consultancy Group (35.9%) 14.9% 11.8% 185 285
BPO Group (5.9%) 7.8% 7.4% 49 60
Azertia Group (76.7%) 14.8% 6.7% 87 325
Prointec Group (56.9%) 15.5% 9.2% 114 318
Soluziona Group (63.3%) 9.5% 3.7% 132 311

Consolidated Annual Accounts 35
9. Other intangible assets
Details of this item at 31 December 2014 and 2013 are as follows:
Thousands of Euros
Balance at31.12.13
Change inscope of cons.
Translationdifferences
Additions Disposals TransfersBalance at
31.12.14
Investments:
Industrial property 39,200 - 106 - - - 39,306
Computer software 116,666 (730) 348 192 (3,418) 66,001 179,059
Development expenditure 256,417 (21) (126) 59,518 (595) (66,746) 248,447
Other intangible assets 24,293 (253) 749 3 (30) (904) 23,858
436,576 (1,004) 1,077 59,713 (4,043) (1,649) 490,670
Amortisation
Industrial property (10,035) - 11 (1,363) - (1) (11,388)
Computer software (45,101) 357 (46) (34,145) 458 1,322 (77,155)
Development expenditure (7,645) 21 130 (822) 178 (776) (8,914)
Other intangible assets (12,193) - (355) (2,404) - 1,206 (13,746)
(74,974) 378 (260) (38,734) 636 1,751 (111,203)
Grants
Development expenditure (75,676) - - (13,124) 18,309 - (70,491)
(75,676) - - (13,124) 18,309 - (70,491)
Provisions
Development expenditure - - - (18,956) - - (18,956)
Other intangible assets - - - (187) - - (187)
- - - (19,143) - - (19,143)
Carrying amount:
Industrial property 29,165 - 117 (1,363) - (1) 27,918
Computer software 71,565 (373) 302 (33,953) (2,960) 67,323 101,904
Development expenditure 173,096 - 4 26,616 17,892 (67,522) 150,086
Other intangible assets 12,100 (253) 394 (2,588) (30) 302 9,925
Total 285,926 (626) 817 (11,288) 14,902 102 289,833

Indra • Consolidated Annual Accounts and Management Report
Consolidated Annual Accounts 36
Thousands of Euros
Balance at31.12.12
Change inscope of cons.
Translationdifferences
Additions Disposals TransfersBalance at
31.12.13
Investments:
Industrial property 42,977 - (2,183) 1 (1,702) 107 39,200
Computer software 61,626 4,743 (1,841) 3,412 (843) 49,569 116,666
Development expenditure 259,152 - (1,324) 51,551 (589) (52,373) 256,417
Other intangible assets 33,381 - (2,553) 22 (4,722) (1,835) 24,293
397,136 4,743 (7,901) 54,986 (7,856) (4,532) 436,576
Amortisation
Industrial property (8,879) - (589) (1,318) - 751 (10,035)
Computer software (31,446) (842) 1,396 (17,150) 516 2,425 (45,101)
Development expenditure (6,478) - 556 (1,386) 162 (499) (7,645)
Other intangible assets (11,727) - 494 (2,829) 1,222 647 (12,193)
(58,530) (842) 1,857 (22,683) 1,900 3,324 (74,974)
Grants
Development expenditure (58,281) - - (17,395) - - (75,676)
(58,281) - - (17,395) - - (75,676)
Carrying amount:
Industrial property 34,098 - (2,772) (1,317) (1,702) 858 29,165
Computer software 30,180 3,901 (445) (13,738) (327) 51,994 71,565
Development expenditure 194,393 - (768) 32,770 (427) (52,872) 173,096
Other intangible assets 21,654 - (2,059) (2,807) (3,500) (1,188) 12,100
Total 280,325 3,901 (6,044) 14,908 (5,956) (1,208) 285,926

Consolidated Annual Accounts 37
The most significant groupings of development projects and computer software capitalised, excluding the impact of grants extended, are as follows:
(1) The amortisation of all current developments is expected to have started by 2016 year end.(2) The groupings of projects comprise many projects with different useful lives on an individual basis. Therefore, in one grouping a project could be amortised in the same year it is capitalised while other projects in that grouping could have useful lives of 10 years
Thousands of Euros
2014 2013
Investments:
Banking core 33,029 33,029
Healthcare market software development 15,172 15,166
Insurance market platform development 30,321 30,321
Development of air surveillance system (Atlante)
20,631 17,595
Internal SAP software 18,151 17,114
Energy market sales management systems 75,368 64,041
Earth observation software and satellite communications systems
5,513 4,375
Intercity and rail traffic control systems 17,439 6,946
Defence systems and mounted sensors 14,602 12,254
Revenue accounting systems for airlines 12,840 9,309
Security systems 7,479 6,065
Defence surveillance systems 3,116 1,351
Air traffic control and surveillance systems 6,985 4,545
Systems for flight simulators 1,598 1,132
Remotely Piloted Aircraft (RPA) Systems 12,155 9,914
Smart Grid solutions 9,656 8,460
284,055 241,617 Estimated years of
useful life (2)
Amortisation (1):
Banking core (6,727) (2,496) 1 to 10 years
Healthcare market software development (3,795) - 1 to 10 years
Insurance market platform development (3,032) - 10
Internal SAP software (4,284) (2,398) 10
Earth observation software and satellite communications systems
(1,927) - 1 to 5 years
Defence systems and mounted sensors (371) - 1 to 5 years
Security systems (1,919) (675) 1 to 5 years
(22,055) (5,569)
Thousands of Euros
2014 2013
Impairment:
Energy market sales management systems (18,956) -
(18,956) -
Carrying amount:
Banking core 26,302 30,533
Healthcare market software development 11,377 15,166
Insurance market platform development 27,289 30,321
Development of air surveillance system (Atlante)
20,631 17,595
Internal SAP software 13,867 14,716
Energy market sales management systems 56,412 64,041
Earth observation software and satellite communications systems
3,586 4,375
Intercity and rail traffic control systems 17,439 6,946
Defence systems and mounted sensors 14,231 12,254
Revenue accounting systems for airlines 12,840 9,309
Security systems 5,560 5,390
Defence surveillance systems 3,116 1,351
Air traffic control and surveillance systems 6,985 4,545
Systems for flight simulators 1,598 1,132
Remotely Piloted Aircraft (RPA) Systems 12,155 9,914
Smart Grid solutions 9,656 8,460
Total 243,044 236,048

Indra • Consolidated Annual Accounts and Management Report
Consolidated Annual Accounts 38
These projects are likely to generate future economic benefits that will offset the cost of the assets recognised.
In 2014, as in 2013, the Parent continued investing in internal developments in all areas of activity, particularly in the area of financial institutions and in the energy market. A total amount of Euros 59,518 thousand was capitalised in 2014 (Euros 51,700 thousand in 2013). The Parent recognised impairment of Euros 18,956 thousand in 2014 as a result of the annual review of the business plans associated with the main intangible assets. This impairment is in respect of energy market investments as new, more conservative, estimates were used for the commercial performance.
The most significant transfers recognised under computer software in 2014 and 2013 are as follows:
Capitalised development costs have been financed or subsidised by various public authorities through the relevant public entities. Details are provided below of the projects that received the most significant grants in 2014 and 2013 (Euros 70,491 thousand and Euros 75,676 thousand, respectively):
(Thousands of Euros)
PROJECT 2014 2013
Banking core - 33,029
Air traffic control systems - 13,203
Insurance market platform development 30,321 -
Healthcare market software development 15,172 -
Development of flight simulators - 1,484
Security systems 1,244 1,312
(Thousands of Euros)
PROJECT 2014 2013
Banking core 7,815 8,773
Healthcare market software development 3,187 1,941
Development of air surveillance system (Atlante) 1,833 1,833
Earth observation software and satellite communications systems
5,485 5,516
Intercity and rail traffic control systems 4,557 2,086
Defence systems and mounted sensors 2,418 2,789
Security systems 2,478 5,893
Air traffic control and surveillance systems 2,122 1,939
Systems for flight simulators 1,145 1,865
Remotely Piloted Aircraft (RPA) Systems 1,507 722
Soluciones Smart Grids 4,682 4,313

Indra • Consolidated Annual Accounts and Management Report
Consolidated Annual Accounts 39
In 2014 and 2013, industrial property includes the following assets acquired from third parties for a total amount of Euros 39,306 thousand (Euros 39,200 thousand in 2013): » Software maintenance rights acquired by the Parent for Euros 23,170 thousand in 2010.
» Industrial property of Euros 13,711 thousand recognised on the acquisition of Politec Tecnología da InformaÇao, S.A. in 2011.
In 2013 computer software included additions of Euros 3,471 thousand recognised as a result of acquiring G-nubila Technology, S.L. during the year.
The useful lives and amortisation rates of intangible assets are as follows:
During 2014 and 2013, the Group performed the impairment tests required under accounting standards, which revealed the need to recognise impairment of Euros 18,865 thousand on the energy market Commercial Management project (see note 32).
At 31 December 2014 fully amortised intangible assets amounted to Euros 61, 204 thousand (Euros 41,423 thousand at 31 December 2013).
In 2014 a loss of Euros 1,063 thousand (Euros 5,080 thousand in 2013) was generated on disposals, which was recognised in the consolidated income statement (see note 32).
The Group has taken out insurance policies to cover the risks to which some of its intangible assets are exposed. The coverage of these policies is considered sufficient.
Thousands of Euros
Balance at31,12,14
Costs incurred internally Acquisitions from third parties
Finite useful life Amortisation rate Indefinite useful life Finite useful life Amortisation rate
Carrying amount
Industrial property 27,918 - - 19,948 7,970 10%
Computer software 101,904 100,125 10-100% - 1,779 25%
Development expenditure 150,086 149,444 20% - 642 10-25%
Other intangible assets 9,925 - - - 9,925 10%
289,833 249,569 19,948 20,316
Thousands of Euros
Balance at31,12,13
Costs incurred internally Acquisitions from third parties
Finite useful life Amortisation rate Indefinite useful life Finite useful life Amortisation rate
Carrying amount
Industrial property 29,165 - - 19,948 9,217 10%
Computer software 71,565 59,124 10-100% - 12,441 25%
Development expenditure 173,096 171,731 20% - 1,365 10-25%
Other intangible assets 12,100 - - - 12,100 10%
285,926 230,855 19,948 35,123

Indra • Consolidated Annual Accounts and Management Report
Consolidated Annual Accounts 40
The carrying amount of financial assets and financial liabilities measured at cost or amortised cost does not differ significantly from their fair value, except for the convertible bond (see note 20).
10. Financial instruments
The classification of financial instruments (except investments in associates) by class and maturity date in 2014 and 2013 is as follows:
2014 Thousands of Euros
FINANCIAL ASSETS:NATURE/CATEGORY
NoteAvailable-for-sale
financial assetsLoans and
receivablesHedging derivatives
Other investments in non-Group companies 12 15,872 - -
Derivatives 12 - - 14
Debt securities 12 - 42,991 -
Other financial assets 12 - 25,006 -
Non-current 15,872 67,997 14
Equity instruments 17 7,656 - -
Debt securities 14 - 4,866 -
Derivatives 14 - - 777
Other financial assets 14, 15 y 16 - 1,653,015 -
Current 7,656 1,657,881 777
Total 23,528 1,725,878 791
2014 Thousands of Euros
FINANCIAL ASSETS:NATURE/CATEGORY
NoteAvailable-for-sale
financial assetsDebts and payables Hedging derivatives
Loans and borrowings 20 472,697 -
Bonds and other marketable securities 20 229,686 -
Derivatives 20 - 8,785
Other financial liabilities 20 and 21 145,546 -
Non-current payables/financial liabilities 847,929 8,785
Loans and borrowings 24 91,971 -
Bonds and other marketable securities 24 38,891 -
Derivatives 26 - 18,493
Other financial liabilities 25 and 26 1,325,097 -
Current payables/financial liabilities 1,455,959 18,493
Total 2,303,888 27,278

Indra • Consolidated Annual Accounts and Management Report
Consolidated Annual Accounts 41
2013 Thousands of Euros
FINANCIAL ASSETS:NATURE/CATEGORY
NoteAvailable-for-sale
financial assetsLoans and
receivablesHedging derivatives
Other investments in non-Group companies 12 13,902 - -
Derivatives 14 - - 1,943
Debt securities 12 - 30,962 -
Derivatives 11
Other financial assets 12 - 24,727 -
Non-current 13,902 55,689 1,943
Equity instruments 17 205 - -
Debt securities 16 - 5,971 -
Derivatives 14 - - 8,449
Other financial assets 14 and 15 - 1,687,056 -
Current 205 1,693,027 8,449
Total 14,107 1,748,716 10,392
2013 Thousands of Euros
FINANCIAL ASSETS:NATURE/CATEGORY
Note Debts and payables Hedging derivatives
Loans and borrowings 20 416,855 -
Bonds and other marketable securities 20 263,913 -
Derivatives 20 - 3,839
Other financial liabilities 20 and 21 133,318 -
Non-current payables/financial liabilities 814,086 3,839
Loans and borrowings 24 195,674 -
Bonds and other marketable securities 24
Derivatives 26 - 215
Other financial liabilities 25 and 26 1,354,808 -
Current payables/financial liabilities 1,550,482 215
Total 2,364,568 4,054

Indra • Consolidated Annual Accounts and Management Report
Consolidated Annual Accounts 42
The Group has established that the inputs used to determine the fair value of hedging derivatives should consider observable inputs within level 2 of the hierarchy, except in the case of adjustments for counterparty credit risk (commonly known as CVA/DVA) (Level 3) that have been estimated based on the credit rating or the ratings/spreads of comparable companies to determine the probability of counterparty default.
Given that the counterparties of derivatives are prestigious financial institutions, after an analysis, the Group has concluded that the credit risk adjustments are not significant within the overall measurement of derivative financial instruments and, therefore, have no material impact on the calculation of the fair value of the instruments in question. Therefore, the Indra Group considers that these derivatives should be classified within level 2 of the hierarchy.
Details of the characteristics of each financial instrument are provided in the relevant note to these consolidated annual accounts.
A breakdown of the net finance cost recognised in the consolidated income statements for 2014 and 2013 is as follows:
The Euros 6,291 thousand recognised under financial liabilities at amortised cost in 2014 (Euros 6,881 thousand in 2013) comprises finance costs from debt adjustments, mainly R&D loans with below-market interest rates.
Available-for-sale financial assets consist of investments in unlisted companies which, because their market value cannot be reliably determined, were measured at acquisition cost or for a lower amount in the event of any impairment.
Thousands of Euros
2014 2013
Finance costs relating to loans and borrowings 30,626 41,618
Other finance costs 10,114 13,095
Financial liabilities at amortised cost 6,291 6,881
Exchange gains 967 4,003
Total finance costs 61,253 69,625
Other finance income 11,804 5,644
Total finance income 11,804 5,644

Indra • Consolidated Annual Accounts and Management Report
Consolidated Annual Accounts 43
11. Equity-accounted investees
As a result of the application of IFRS 11 Joint Arrangements, the financial statements of joint ventures that until 2013 were proportionately consolidated from 2014 were accounted for using the equity method (see note 5 b).
Details of this item at 31 December 2014 and 2013 are as follows:
Thousands of Euros
Balance at 31.12.13
Changes in scope of cons.
InvestmentTranslation differences
Dividends Profit/(loss) TransfersBalance at
31.12.14
SAES Capital 2,500 - - - (434) 206 - 2,272
Eurofighter Simulation Systems 3,173 - - - 522 - 3,695
Euromids 337 - - - - 58 - 395
Iniciativas Bioenergéticas 1,079 - 650 - - (221) - 1,508
Idetegolf 15 - - - - - - 15
Trias Beltran 8 - - - - - - 8
I3 Televisión - - 425 - - (382) 130 173
IESSA - - - - - (3,744) (652) (4,396)
IRB Riesgo Operacional - - - - - 99 326 425
A4 Essor 158 - - - - 72 - 230
Eólica Maritima y Portuaria (21) 21 - - - - - -
Tower Air Traffic System 501 - - - - - - 501
Indra Sistemas de Tesorería 38 - - - - 58 - 96
Logistica Marítima de Tuxpan 150 - - - - - - 150
Romskog Utvickling AS 6 - - (6) - - - -
Natming 3 - - - - - - 3
Indra Isolux México 5 - - - - (9) - (4)
Visión Inteligente Aplicada (67) - - - - (2) - (69)
EFI Túneles Necaxa 40 - - - - (2) - 38
Societat Catalana Per a la Mobilitat - 624 - - - - 624
Total 7,925 645 1,075 (6) (434) (3,345) (196) 5,664

Indra • Consolidated Annual Accounts and Management Report
Consolidated Annual Accounts 44
Thousands of Euros
Balance at 31.12.12
Changes in scope of cons.
Investment Dividends Profit/(loss) TransfersBalance at
31.12.13
SAES Capital 2,500 - - (513) 513 - 2,500
Eurofighter Simulation Systems 3,052 - - (520) 641 - 3,173
Euromids 250 - - - 87 - 337
Iniciativas Bioenergéticas 1,410 - 334 - (665) - 1,079
Idetegolf 12 - - - 3 - 15
Trias Beltran 8 - - - - 8
Inmunologística - - - - - -
Huertas de Binipark 1,205 (1,310) - - 105 - -
A4 Essor 97 - - - 61 - 158
Zeronine ACI - - - - - -
Eólica Maritima y Portuaria (20) - - - (1) - (21)
Tower Air Traffic System 501 - - - - 501
Oyauri Investment 828 (742) - - (86) - -
Indra Sistemas de Tesorería 59 - - - (21) - 38
Logistica Marítima de Tuxpan 150 - - - - - 150
Romskog Utvickling AS 7 - - - - (1) 6
Natming 3 - - - - - 3
Indra Isolux México 2 - - - 3 - 5
Visión Inteligente Aplicada (52) - - - (15) - (67)
EFI Túneles Necaxa (1) - - - 41 - 40
Total 10,011 (2,052) 334 (1,033) 666 (1) 7,925

Indra • Consolidated Annual Accounts and Management Report
Consolidated Annual Accounts 45
The main figures for the most significant equity-accounted investments are provided in Appendix V.
Movement relating to investments in associates during the year ended 31 December 2014 is as follows:
» On 15 January 2014 the subsidiary Prointec, S.A. dissolved its investee Eólica Marítima y Portuaria, in which it held a 20% interest. A loss of Euros 17 thousand was generated, which was recognised in the consolidated income statement (see note 32).
» On 31 January 2014 the subsidiary Prointec, S.A. subscribed and paid up the share capital increase carried out by Iniciativas Bioenergéticas, S.L. for Euros 650 thousand.
» On 10 October 2014 the Parent, together with three other shareholders, incorporated Societat Catalana per a la Mobilitat, S.A., in which it holds a 25% interest. The amount paid in was Euros 624 thousand.
»On 26 December 2014 the Parent subscribed and paid up the capital increase of Euros 5 thousand, with a share premium of Euros 50 thousand and a contribution of Euros 370 thousand to offset losses, in the investee I3 Televisión, S.L.
The following movements took place in investments in associates during the year ended 31 December 2013:
» On 29 January 2013 the subsidiary Prointec, S.A. sold its stake in Huertas de Binipark, S.L. for Euros 1,230 thousand (see note 33).
» On 8 April 2013 the Parent sold its shareholding in Oyauri Investment, S.L. for Euros 100 thousand (see note 33).
» On 27 September 2013 the subsidiary Prointec, S.A. subscribed and paid up the share capital increase carried out by Iniciativas Bioenergéticas, S.L. for Euros 334 thousand.

Indra • Consolidated Annual Accounts and Management Report
Consolidated Annual Accounts 46
12. Non-current Financial Assets
Movement in other investments during the years ended 31 December 2014 and 2013 is as follows:
Thousands of Euros
Balance at 31.12.13
Changes in scope of cons.
Translation differences
Additions Disposals TransfersBalance at
31.12.14
Investments:
in non-Group companies 15,583 - - 1,979 (9) - 17,553
Non-current loans 2,132 - (1) 815 (14) - 2,932
Non-current security deposits 24,727 (300) 188 6,309 (5,758) (160) 25,006
Cash flow hedges 1,943 - - - (1,929) - 14
Other financial assets 28,830 (80) 303 10,020 (14) 1,000 40,059
73,215 (380) 490 19,123 (7,724) 840 85,564
Impairment:
Other non-current investments
in non-Group companies (1,681) - - - - - (1,681)
(1,681) - - - - - (1,681)
Carrying amount:
Other non-current investments
in non-Group companies 13,902 - - 1,979 (9) - 15,872
Non-current loans 2,132 - (1) 815 (14) - 2,932
Non-current security deposits 24,727 (300) 188 6,309 (5,758) (160) 25,006
Cash flow hedges 1,943 - - - (1,929) - 14
Other financial assets 28,830 (80) 303 10,020 (14) 1,000 40,059
Total 71,534 (380) 490 19,123 (7,724) 840 83,883

Indra • Consolidated Annual Accounts and Management Report
Consolidated Annual Accounts 47
Thousands of Euros
Balance at 31.12.12
Translation differences
Additions Disposals TransfersBalance at
31.12.13
Investments:
Other non-current investments in non-Group companies
45,403 - 1,926 (31,746) - 15,583
Non-current loans 2,421 (23) 11 (33) (244) 2,132
Non-current security deposits 22,933 (3,292) 11,635 (6,439) (110) 24,727
Cash flow hedges 5 - 1,938 - - 1,943
Other financial assets 6,050 (3,638) 27,205 (31) (756) 28,830
76,812 (6,953) 42,715 (38,249) (1,110) 73,215
Impairment:
Other non-current investments in non-Group companies
(18,287) - (1,000) 17,606 - (1,681)
(18,287) - (1,000) 17,606 - (1,681)
Carrying amount:
Other non-current investments in non-Group companies
27,116 - 926 (14,140) - 13,902
Non-current loans 2,421 (23) 11 (33) (244) 2,132
Non-current security deposits 22,933 (3,292) 11,635 (6,439) (110) 24,727
Cash flow hedges 5 - 1,938 - - 1,943
Other financial assets 6,050 (3,638) 27,205 (31) (756) 28,830
Total 58,525 (6,953) 41,715 (20,643) (1,110) 71,534

Consolidated Annual Accounts 48
a) Other non-current investments in non-Group companies
Details are as follows: Thousands of Euros
Percentage ownership
Balance at 31.12.13
Business combinations
Additions DisposalsBalance at
31.12.14
Investments:
Safelayer Secure Comunications 15% 476 - - - 476
Galileo Sistemas y Servicios 13.45% 138 - - - 138
Hisdesat Servicios Estratégicos 7% 7,572 - - - 7,572
Prointec sub-group - 118 - - - 118
Neotec 4.76% 5,071 - - - 5,071
Bansabadell Information Systems 19% 1,169 - 15 - 1,184
Volcat 4.77% 1,000 - - - 1,000
Medina Capital Fund GP - - 1,923 - 1,923
Other - 39 - 41 (9) 71
15,583 - 1,979 (9) 17,553
Impairment:
Safelayer Secure Comunications (152) - - - (152)
Galileo Sistemas y Servicios (3) - - - (3)
Hisdesat Servicios Estratégicos (520) - - - (520)
Prointec sub-group (6) - - - (6)
Volcat (1,000) - - - (1,000)
(1,681) - - - (1,681)
Carrying amount:
Safelayer Secure Comunications 324 - - - 324
Galileo Sistemas y Servicios 135 - - - 135
Hisdesat Servicios Estratégicos 7,052 - - - 7,052
Prointec sub-group 112 - - - 112
Neotec 5,071 - - - 5,071
Bansabadell Information Systems 1,169 - 15 - 1,184
Volcat - - - - -
Medina Capital Fund GP - - 1,923 - 1,923
Other 39 - 41 (9) 71
Total 13,902 - 1,979 (9) 15,872

Consolidated Annual Accounts 49
Thousands of Euros
Balance at 31.12.12
Additions DisposalsBalance at
31.12.13
Investments:
Safelayer Secure Comunications 476 - - 476
Galileo Sistemas y Servicios 138 - - 138
Banco Inversis 31,672 - (31,672) -
Hisdesat Servicios Estratégicos 7,572 - - 7,572
Prointec sub-group 130 - (12) 118
Neotec 3,166 1,905 - 5,071
Bansabadell Information Systems 1,151 18 - 1,169
Volcat 1,000 - - 1,000
Other 98 3 (62) 39
45,403 1,926 (31,746) 15,583
Impairment:
Safelayer Secure Comunications (152) - - (152)
Galileo Sistemas y Servicios (3) - - (3)
Banco Inversis (17,594) - 17,594 -
Hisdesat Servicios Estratégicos (520) - - (520)
Volcat - (1,000) - (1,000)
Other (12) - 12 -
(18,287) (1,000) 17,606 (1,681)
Carrying amount:
Safelayer Secure Comunications 324 - - 324
Galileo Sistemas y Servicios 135 - - 135
Banco Inversis 14,078 - (14,078) -
Hisdesat Servicios Estratégicos 7,052 - - 7,052
Prointec sub-group 124 - (12) 112
Neotec 3,166 1,905 - 5,071
Bansabadell Information Systems 1,151 18 - 1,169
Volcat 1,000 (1,000) - -
Other 86 3 (50) 39
Total 27,116 926 (14,140) 13,902

Indra • Consolidated Annual Accounts and Management Report
Consolidated Annual Accounts 50
Serviços Tecnológicos, S.A. entered into a mutual consent agreement with Politec Participaçoes, Ltda (Polipar) and its shareholders. The main aspects of this agreement are as follows:
» Polipar and its shareholders recognise that no additional amount or price is payable by the Indra Group as a result of the aforementioned SPA.
» Polipar and its shareholders recognise by virtue of the SPA, that they are jointly and severally obliged to compensate the buyers as a result of the contingent liabilities incurred by the acquirees.
» To settle this compensation obligation set forth in the SPA and described above, Polipar and its shareholders agree to transfer two buildings free of any liens to Indra Brasil Soluções e Serviços Tecnológicos, S.A.
» The parties expressly agree to waive any right or additional compensation deriving from the SPA signed in 2011 other than that mentioned in the above point.
The aforementioned buildings will be registered in the name of the Indra Group once the formal requirements to release the judicial attachments affecting the buildings and reverse their inalienable status are completed, which is when the Group will acquire legal title to these buildings.
The estimated receivables at 31 December 2014 (Euros 36,605 thousand) correspond to the value of both buildings taken from an assessment made by an independent expert in Brazil of both buildings less the estimated costs that will be incurred in any subsequent sale.
This item also includes Euros 3,502 thousand (Euros 4,754 thousand in 2013) for the estimated fair value of the asset arising from the nine-year marketing agreement arranged as part of the sale of Gibb Portugal Consultores de Engenharia, Gestado e Ambiente, S.A.
In 2014 the main operations relating to non-current investments in non-Group companies were as follows:
» On 1 December 2014 the Parent invested Euros 1,923 thousand in Medina Capital Fund GP, LLC. The Company has a commitment to invest up to USD 5,000 thousand over 5 years.
The main transactions involving non-current investments in non-Group companies in 2013 are as follows:
» On 8 July 2013 the Parent made an additional payment of Euros 476 thousand to increase the share capital of Neotec Capital Riesgo Sociedad de Fondos S.A. S.C.R.
» On 5 November 2013 the Parent sold its interest in Banco Inversis for Euros 28,904 thousand recognising a profit of Euros 14,826 thousand in 2013 and Euros 44 thousand in 2014 (see note 33).
» On 20 November 2013 the Parent subscribed to Euros 1,429 thousand of a share capital increase by Neotec Capital Riesgo Sociedad de Fondos S.A. S.C.R. (payable in January 2014). At the reporting date its interest in the share capital of this company was the same as in the prior year.
b) Non-current security depositsThis item also includes deposits and guarantees placed to secure the rental of buildings and properties used by the Group and employment-related and commercial claims.
Additions include Euros 6,309 thousand (Euros 11,635 thousand in 2013) of arrangement costs relating to deposits for leased property, due to office relocation. Also security deposits totalling Euros 5,758 thousand were derecognised (Euros 6,439 thousand in 2013).
c) Other financial assetsAt 31 December 2013 the cancellation of the liability for the variable component arising from the acquisition of Politec Tecnología da Informaçao, S.A. (now Indra Brasil Soluçoes e Servicos Tecnológicos, S.A.) in 2011 (see note 21), together with the recognition and materialisation in 2014 and 2013 of new contingent employment liabilities at the Brazilian subsidiary led to the execution of contractual guarantees related to certain buildings on the part of the seller. As a result of this circumstance, Euros 36,605 thousand (Euros 27,205 thousand in 2013) were recognised in other under non-current financial assets for the estimated receivables from the difference between the contingent liabilities paid by Indra up to that date less the amount of the franchise established in the stock purchase agreement (SPA).
On 14 November 2014 Indra Sistemas, S.A., Indra Company Brasil, Ltda. and Indra Brasil Soluções e

Indra • Consolidated Annual Accounts and Management Report
Consolidated Annual Accounts 51
13. Inventories
Details of inventories at 31 December 2014 and 2013 are as follows:
Work in progress under inventories includes materials, direct labour costs, and other services acquired for projects.
During 2014 the Group has derecognised projects underway totalling Euros 138,563 thousand (Euros 131,349 thousand recognised in the Parent) due to reprogramming and program cancellations as well as changes to estimates as a result of various factors and events that occurred in 2014 that have made their future recovery very unlikely.
14. Other Financial Assets, Including Derivatives, and Other Current Assets
Details of other financial assets at 31 December 2014 and 2013 are as follows:
Thousands of Euros
2014 2013
Merchandise 341 271
Raw materials 14,495 13,338
Work in progress 216,313 402,851
Total carrying amount 231,149 416,460
Thousands of Euros
2014 2013
Other receivables 11,699 14,785
Advances and loans to personnel 7,427 8,354
Public entities (note 36) 40,633 45,848
Prepayments 8,743 10,692
Current deposits 2,869 2,791
Current security deposits 4,866 6,663
Cash flow hedges (note 37 a)) 777 8,449
Total carrying amount 77,014 97,582

Indra • Consolidated Annual Accounts and Management Report
Consolidated Annual Accounts 52
In 2014 the Group recognised provisions totalling Euros 48,205 thousand (Euros 37,405 thousand in the Parent) in respect of receivables for billable production on projects which the Group considers to be of doubtful recovery. It also recognised a provision of Euros 3,974 thousand for amounts receivable from Indra Esteio Sistemas S.A. (an associate).
At 2014 and 2013 year ends the Group derecognised receivables under non-recourse factoring agreements totalling Euros 187,129 thousand and Euros 166,658 thousand, respectively.The transfer of risks and rewards was analysed to conclude on whether these amounts could effectively be derecognised. According to the agreements signed, the factors (various financial institutions) assume the risk of insolvency and payment in arrears. Therefore, Indra does not retain the risks derived from non-payment. The nature of these financial assets written off under non-recourse factoring is invoices issued for services rendered and projects carried out by the Group.
Movement in the provision for impairment in both years was as follows:
15. Trade and other receivables
Details of trade and other receivables at 31 December 2014 and 2013 are as follows:
Thousands of Euros
2014 2013
Trade receivables, non-Group 710,202 741,681
Receivables, billable production 961,298 920,278
Advances to suppliers 19,658 11,790
Other receivables 5,476 6,354
Total 1,696,634 1,680,103
Impairment (81,144) (30,361)
Total carrying amount 1,615,490 1,649,742
Thousands of Euros
Balance at 31.12.13
Charges ApplicationsTranslation differences
ReversalsBalance at
31.12.14
Impairment 30,361 69,646 (9,882) (234) (8,747) 81,144
Thousands of Euros
Balance at 31.12.12
Charges ApplicationsTranslation differences
ReversalsBalance at
31.12.13
Impairment 38,066 28,209 (14,436) (1,210) (20,268) 30,361

Indra • Consolidated Annual Accounts and Management Report
Consolidated Annual Accounts 53
The share capital has been subscribed and fully paid.
All the shares are listed on the Madrid, Barcelona, Valencia and Bilbao stock exchanges. They are traded on the Organised Stock Market and listed in the selective IBEX-35 index, with a year-end share price of Euros 8.07 (Euros 12.155 at the 2013 reporting date). The average share price for the last quarter of the year was Euros 8.86 in 2014 and Euros 11.498 in 2013.
The Parent does not have a register of the percentage interests held by shareholders and can only verify its shareholding structure when this information is provided directly by shareholders or made public in compliance with prevailing legislation on significant shareholdings (which generally requires the disclosure of interests exceeding 3% of share capital), or through the information provided by Iberclear when shareholders’ meetings are held.
Consequently, according to information available to the Parent, the significant shareholders with an interest exceeding 3%, excluding any interest held on behalf of third parties, are as follows:In 2013 deposits and fixed-income securities included several Euro deposits totalling Euros 280,350
thousand, which matured in January 2014 and earned interest at 1-month Euribor plus a spread of 1.85%.
This item also comprises Euros 3,479 thousand in relation to a liquidity agreement with BEKA FINANCE (note 18).
In 2014 cash included Euros 145,455 thousand in current accounts that earned interest at an average 1.06% during 2014.
17. Non-current assets held for sale This balance includes land with a value of Euros 7,451 thousand (Euros 7,367 thousand in 2013) obtained on the acquisition of Indra Brasil, S.A., as this investment has been put up for sale.
It also includes Euros 205 thousand reflecting the Parent’s interests in the subsidiaries Azertia Brasil and Azertia Puerto Rico, which are currently undergoing liquidation (see note 10).
18. Equity
Subscribed capitalAt 31 December 2014 subscribed and paid-in share capital amounts to Euros 32,826,507.80, represented by 164,132,539 ordinary shares of Euros 0.20 par value each, represented by book entries.
16. Cash and cash equivalents
Details are as follows:
Thousands of Euros
2014 2013
Current deposits and fixed-income securities 5,225 282,965
Other current investments 6,787 966
Subtotal 12,012 283,931
Cash 281,838 79,140
Total 293,850 363,071
31,12,14 31,12,13
Sociedad Estatal de Participaciones Industriales (SEPI) 20.141% 20.141%
Corporación Financiera Alba 12.523% 11.324%
Fidelity Management & Research LLC 9.962% 9.962%
Casa Grande de Cartagena, S,L, 4.001%

Indra • Consolidated Annual Accounts and Management Report
Consolidated Annual Accounts 54
On 28 January 2015, Telefónica, S.A. reported that it had acquired 5,190,000 shares, which amounts to 3.162% of the Parent's share capital. Also on 19 February 2015 Telefónica confirmed that it had call options on 4,873,682 shares of the Parent, representing 2.969% of the share capital. The last exercise or expiration date of these is 3 June 2015.
Details of the shareholdings held directly or indirectly by members of the board of directors at 31 December 2014 are as follows:
(1) Representing the shareholder Sociedad Estatal de Participaciones Industriales (SEPI) (2) Representing the shareholder Corporación Financiera Alba.
Shares owned either directly or indirectly by members of the board of directors at 31 December 2013 were as follows:
(1) Representing the shareholder Sociedad Estatal de Participaciones Industriales (SEPI)(2) Representing the shareholder Corporación Financiera Alba.
2014 No of shares
Board members Class Direct Indirect Total% of share
capital
Isabel Aguilera Navarro Independent 32,579 - 32.579 0.02
Javier de Andrés González Executive 146,317 - 146.317 0.089
Juan Carlos Aparicio Pérez (1) Proprietary 4,184 - 4.184 0.00
Daniel García-Pita Independent 57,536 12,600 70.136 0.043
Luis Lada Díaz Independent 28,931 - 28.931 0.018
Juan March de la Lastra (2) Proprietary 23,543 - 23.543 0.014
Santos Martínez-Conde Gutiérrez-Barquín (2) Proprietary 11,389 - 11389 0.007
Adolfo Menéndez Menéndez (1) Proprietary 4,919 - 4.919 0.00
Javier Monzón de Cáceres Executive 403,322 - 403.322 0.246
Mónica de Oriol Icaza Independent 25,416 25.416 0.015
Ignacio Santillana del Barrio Independent 16,355 - 16.355 0.010
Rosa Sugrañes Arimany Independent 27,707 - 27.707 0.017
Alberto Terol Estabean Independent 22,841 22.841 0.014
Total 805,039 12,600 817.639 0.498
2013 No of shares
Board members Class Direct Indirect Total% of share
capital
Isabel Aguilera Navarro Independent 28,686 - 28,686 0.017
Javier de Andrés González Executive 116,200 - 116,200 0.071
Juan Carlos Aparicio Pérez (1) Proprietary 292 - 292 0.00
Casa Grande de Cartagena, S,L,U Proprietary 6,566,248 - 6,566,248 4.001
Daniel García-Pita Independent 1,274 47,269 48,543 0.03
Luis Lada Díaz Independent 24,260 - 24,260 0.015
Juan March de la Lastra (2) Proprietary 19,391 - 19,391 0.012
Santos Martínez-Conde Gutiérrez-Barquín (2) Proprietary 7,497 - 7,497 0.005
Adolfo Menéndez Menéndez (1) Proprietary 767 - 767 0.00
Javier Monzón de Cáceres Executive 352,895 - 352,895 0.215
Mónica de Oriol Icaza Independent 22,042 22,042 0.013
Ignacio Santillana del Barrio Independent 12,203 - 12,203 0.007
Rosa Sugrañes Arimany Independent 24,333 - 24,333 0.015
Alberto Terol Estabean Independent 17,522 17,522 0.011
Total 7,193,610 47,269 7,240,879 4.412

Indra • Consolidated Annual Accounts and Management Report
Consolidated Annual Accounts 55
At 31 December 2014 the board of directors represented 54,440,120 shares or 33.17% of total shares. At 31 December 2013 the board of directors represented 58,885,768 shares or 35.88% of total shares.
At the annual general meetings held on 26 June 2014 and 27 June 2013, the shareholders agreed to the distribution of the Parent's profit for 2013 and 2012, respectively, shown in the consolidated statements of changes in equity.
The Group manages its capital with the aim of safeguarding its capacity to continue operating as a going concern, so as to continue providing shareholder remuneration and benefiting other stakeholders, while maintaining an optimum capital structure.
Capital management is aimed at maintaining a solid financial structure that optimises the cost of capital and the availability of financial resources, ensuring long-term business continuity. This conservative financial policy enables the Parent to create adequate shareholder value while ensuring liquidity and its solvency.
The Company uses the consolidated leverage ratio (the resultant ratio from dividing net financial debt by total capital, obtained by adding net debt to equity) as an indicator to monitor the financial position. Movement in 2014 and 2013 was as follows:
Share premiumThe share premium deriving from the share capital increases carried out in 2001, 2003 and 2007 is subject to the same restrictions and may be used for the same purposes as the voluntary reserves of the Parent, including conversion into share capital.
The share premium and voluntary reserves include a non-distributable portion equivalent to the amount of the statement of financial position revaluation permitted by Law 9/1983 of 13 July 1983, totalling Euros 9,624 thousand at 31 December 2014 and 9,784 thousand at 31 December 2013, as well as the amount of research and development costs not yet amortised, totalling Euros 202,092 thousand at 31 December 2014 (Euros 234,601 thousand at 31 December 2013) and any prior years' losses.
♦ Other reserves
Details of other reserves are as follows:
Thousands of Euros
2014 2013
Net debt 662.7 622.5
Equity 953.60 1,134.70
Capital Total 1,616.30 1,757.20
Debt ratio 41.00% 35.40%
Thousands of Euros
2014 2013
Merger reserves 1,846 1,846
Other changes in equity 103 2,619
Total 1,949 4,465

Indra • Consolidated Annual Accounts and Management Report
Consolidated Annual Accounts 56
Any gains or losses on the sale of own shares are recognised in other changes in equity. The decrease due to the sale of own shares in 2014 amounts to Euros 2,516 thousand (an increase of Euros 759 thousand in 2013).
♦ Other own equity instrumentsThe change in equity due to the difference between the funds obtained in the Parent’s October 2013 bond issue (see note 20) and the fair value of the corresponding financial liability, Euros 16,999 thousand in total (Euros 16,999 thousand in 2013), was recognised in this item. This amount includes the Euros 1,125 thousand embedded derivative arising from the early redemption clause.
Also Euros 47 thousand were recognised in this item in respect of share-based payments resulting from the share plan for employees.
The remuneration policy established in 2014 contemplates remuneration deferred over the medium term through the delivery of Parent shares accrued from July 2014 until the end of 2016. In 2014, a total of 220,536 shares were delivered in respect of this plan, valued at Euros 2,310 thousand at the share price on the delivery date.
In 2013, the remuneration policy established in 2011 also contemplated remuneration deferred over the medium term through the delivery of Parent shares accrued between September 2011 and the end of 2013. In 2013, a total of 231,479 shares were delivered in respect of this plan, valued at Euros 2,209 thousand at the share price on the delivery date. This plan ended in 2013.
♦ Exchange rate and interest rate cash flow hedging reservesThis item comprises the hedging reserve generated by the following: » The effect of changes in the fair value of forward exchange contracts used to hedge highly
probable future transactions or firm commitments.
» The effect of changes in the fair value of interest rate swap contracts.
Details are as follows:
♦ Own sharesAs authorised by the shareholders at their annual general meeting, at 31 December 2014 the Parent directly held 202,199 own shares amounting to Euros 1,642 thousand (103,358 shares amounting to Euros 1,258 thousand at 31 December 2013).
Details of own shares and movement during 2014 and 2013 are as follows:
Thousands of Euros
2014 2013
Exchange rate insurance cash flow hedges (18,599) 6,534
Interest rate cash flow hedges (1,267) (2,757)
Total (19,866) 3,777
Thousands of Euros
Balance at 31.12.13
Additions DisposalsBalance at
31.12.14
Ordinary transactions 1,258 188,258 (187,874) 1,642
Thousands of Euros
Balance at 31.12.12
Additions DisposalsBalance at
31.12.13
Ordinary transactions 111 109,031 (107,884) 1,258

Indra • Consolidated Annual Accounts and Management Report
Consolidated Annual Accounts 57
Details of movement in shares in 2014 and 2013 are as follows:
On 31 July 2014 the Parent entered into a liquidity agreement with BEKA FINANCE, S.V., S.A. with the aim of boosting liquidity from transactions and stabilising the share price.
The main characteristics of this agreement are as follows:
►Contract term: 12 months►Number of shares earmarked for the securities account associated with the agreement: 200,000.►Amount earmarked for the cash account associated with the agreement: Euros 2.3 million
♦ Retained earnings Details of retained earnings are as follows:
Number of shares
% ownership 31.12.13 Additions Disposals% annual
volume 31.12.14
Ordinary transactions 0.06 103,358 17,051,236 (16,952,395) 5.11 202,199
Number of shares
% ownership 31,12,12 Additions Disposals% annual
volume 31,12,13
Ordinary transactions 0.01 11,041 10,291,495 (10,199,178) 6.21 103,358
Thousands of Euros
2014 2013
Legal reserve 6,955 6,955
Reserves in fully consolidated companies (16,147) (9,387)
Reserves in proportionately consolidated companies - 848
Merger reserve 15,212 15,212
Reserves in equity-accounted investees 3,925 4,518
Voluntary reserves 573,341 534,476
Undistributed reserves 91,516 62,798
Profit/loss for the year attributable to the Parent (91,908) 115,822
Total 582,894 731,242

Consolidated Annual Accounts 58
a) Legal reserveThe Spanish Companies Act requires that the Parent transfer 10% of profits for the year to a legal reserve until this reserve reaches an amount equal to 20% of share capital. This reserve is not distributable to shareholders and if it is used to offset losses, in the event that no other reserves are available, the reserve must be replenished with future profits. Under certain conditions it may also be used to increase share capital.
At 31 December 2014 and 2013, the Parent has appropriated to this reserve the minimum amount required by law.
b) Reserves in fully-consolidated companiesDetails by company of reserves in consolidated companies at 31 December 2014 and 2013 are as follows:
Thousands of Euros
2014 2013
Indra Sistemas (9,038) (9,934)
BPO Group (formerly BMB Group) (15,321) (17,514)
Indra Emac (1,168) (900)
Indra Sistemas de Seguridad 6,620 6,273
Indra SI (3,769) (2,463)
Indra Sistemas Chile (7,976) (7,327)
Indra Sistemas Portugal 3,702 4,346
Consultancy Group 12,073 17,203
Inmize Capital (214) (161)
Inmize Sistemas 2,384 2,123
Indra Systems (17,344) (15,163)
Indra Beijing 1,310 10,081
Indra Company (Brazil) (80,004) (76,299)
Indra Software Labs 21,489 25,626
Indra Mexico 15,983 8,445
Indra Sistemas Comunicaciones Seguras 3,348 2,999
Indra Maghreb (354) (261)
Indra France (1,405) (958)
Indra Poland (338) (117)
Indra Australia 3,820 1,778
Azertia TI Mexico 7,051 5,707
Indra Colombia 3,419 4,850
Azertia TI Venezuela - (3,132)
Azertia GC Venezuela (5,058) (4,625)
Azertia TI Argentina (12,175) (7,599)
Indra USA 875 (1,188)
Thousands of Euros
2014 2013
Prointec (19,528) (11,911)
Soluziona C&S Holding (Chile) 193 140
Indra Czech Republic 928 (188)
Indra Slovakia 113 240
Soluziona Guatemala 262 262
Indra Hungary 106 332
Indra Kenya 1,382 1,243
Soluziona Mexico (6,425) (3,114)
Soluziona Uruguay (104) (17)
Indra Sisteme SRL (290) (278)
Indra Panama 1,491 985
Indra Philippines 3,472 2,712
Electrica Soluziona (Romania) 941 823
Indra Ukraine (263) (189)
Soluziona SP CA (Venezuela) 1,484 1,195
Computación Ceicom 4,786 4,761
Indra Company Peru 1,354 1,326
Indra Peru 1,977 2,931
AC-B 1,207 941
Indra Radar Technology (1,535) (1,336)
Indra India (4,234) (2,549)
Avitech Technology 153 951
Indra Malaysia (344) (289)
Indra Bahrain 3,634 3,484
Indra Indonesia (1,936) (769)
Indra Italy 5,922 4,743
Indra Brazil 51,636 37,983
Indra Navia 12,173 5,600
Indra Turkey (1,565) (652)
Indra Kazakhstan (131) (86)
Politec Argentina (340) (192)
Teknatrans (435) (259)
Indra Technology South Africa (141) -
Total (16,147) (9,387)

Indra • Consolidated Annual Accounts and Management Report
Consolidated Annual Accounts 59
c) Reserves in proportionately consolidated companiesDetails by company of reserves in consolidated companies at 31 December 2013 are as follows:
d) Reserves in equity-accounted investeesDetails by company of reserves in consolidated companies at 31 December 2014 and 2013 are as follows:
e) Voluntary reserves and merger reserves The merger reserves and voluntary reserves are freely distributable except for a portion equivalent to the amount of the statement of financial position revaluation permitted by Law 9/1983 of 13 July 1983, totalling Euros 9,624 thousand at 31 December 2014 and Euros 9,784 thousand at 31 December 2013, as well as the amount of research and development costs not yet amortised, totalling Euros 202,092 thousand at 31 December 2014 (Euros 234,601 thousand at 31 December 2013) and any prior years'
losses.
f) Profit / loss for the year attributable to the ParentDetails of the consolidated companies’ profits/losses for 2014 and 2013 are disclosed in Appendix I.
Thousands of Euros
2014 2013
IRB Riesgo Operacional - 341
I3 TV - (6)
IESSA Brazil - 513
Total - 848
Thousands of Euros
2014 2013
Eurofighter Simulation System 3,105 2,984
Euromids 326 239
Trias Beltrán 7 7
Saes Capital 1,160 1,160
A4 Essor SAS 138 77
Indra Sistemas de Tesorería 30 51
IRB Riesgo Operacional 326 -
I3 TV (20) -
IESSA Brazil (1,147) -
Total 3,925 4,518

Indra • Consolidated Annual Accounts and Management Report
Consolidated Annual Accounts 60
♦ Non-controlling interestsMovement in non-controlling interests in fully consolidated companies during 2014 and 2013 is as follows:
Thousands of Euros
Balance at 31.12.13
Profit/(loss) attributable
to NCIs
Translation differences
DividendsChange in %
ownershipProfit/(loss) in
equityOther changes
Balance at 31.12.14
Inmize Capital 685 (159) - - - - - 526
Inmize Sistemas 3,950 32 - - - - (117) 3,865
Tourism & Leisure 58 - - - (79) 21 - -
ALG Peru 54 (13) 2 - (43) - - -
ALG Venezuela 193 4 (165) - - - - 32
ALG Maroc (137) - - - 137 - - -
Prointec (77) (7) - - (33) - 117 -
Elektrica Soluziona 780 268 (1) - - - - 1,047
Indra Philippines 5,089 1,137 675 (230) - - (271) 6,400
Uatec (316) 7 - - - - 309 -
Indra Radar Technology (Tianjin) Co,, Ltd,
(30) (16) (3) - - - - (49)
IFOS (49) (24) 8 - 65 - - -
Indra Kazakhstan 468 (104) (26) - - - - 338
Indra Malaysia 1 (176) 10 - - - 240 75
Normeka 1,051 81 (90) - - - - 1,042
Search (940) 875 (22) - - - - (87)
Prointec Panama (14) (10) (4) - - - - (28)
Indra Technology South Africa (86) (387) (13) - - - - (486)
Total 10,680 1,508 371 (230) 47 21 278 12,675

Indra • Consolidated Annual Accounts and Management Report
Consolidated Annual Accounts 61
Thousands of Euros
Balance at 31.12.12
Profit/(loss) attributable
to NCIs
Translation differences
Change in % ownership
Profit/(loss) in equity
Other changesBalance at
31.12.13
Inmize Capital 637 48 - - - - 685
Inmize Sistemas 3,711 239 - - - - 3,950
Tourism & Leisure 165 (61) - - (46) - 58
ALG Peru 65 (4) (7) - - - 54
ALG Venezuela 355 (41) (121) - - - 193
ALG Maroc 37 (174) - - - - (137)
Prointec 309 (33) 9 (368) 6 - (77)
Elektrica Soluziona 667 115 (2) - - - 780
Indra Philippines 4,636 1,100 (647) - - - 5,089
Inserail 315 (1) - - 2 (316) -
Uatec 41 (372) - - - 15 (316)
Indra Radar Technology (Tianjin) Co,, Ltd, 55 (86) 1 - - - (30)
Indra Peru 9,123 57 (507) (9,482) - 809 -
IFOS 63 (117) 5 - - - (49)
Indra Kazakhstan 548 (45) (35) - - - 468
Indra Malaysia (85) 79 7 - - - 1
Normeka 1,054 134 (137) - - - 1,051
Search (961) 44 (23) - - - (940)
Prointec Panama - (16) (1) - - 3 (14)
Indra Technology South Africa - - - (86) - - (86)
Total 20,735 866 (1,458) (9,936) (38) 511 10,680

Indra • Consolidated Annual Accounts and Management Report
Consolidated Annual Accounts 62
A breakdown of non-controlling interests at 31 December 2014 and 2013 is as follows:
Thousands of Euros
31.12.14 31.12.13
NCI capital NCI reserves NCI profit/(loss) Total NCI capital NCI reserves NCI profit/(loss) Total
Inmize Capital 32 653 (159) 526 32 605 48 685
Inmize Sistemas 750 3,083 32 3,865 750 2,961 239 3,950
Tourism & Leisure - - - - 18 101 (61) 58
ALG Peru - 13 (13) - 1 57 (4) 54
ALG Venezuela - 28 4 32 - 234 (41) 193
ALG Maroc - - - - 161 (124) (174) (137)
Prointec - 7 (7) - 396 (440) (33) (77)
Elektrica Soluziona 15 764 268 1,047 15 650 115 780
Indra Philippines 264 4,999 1,137 6,400 264 3,725 1,100 5,089
Inserail - - - - 6 (5) (1) -
Uatec 18 (25) 7 - 18 38 (372) (316)
Indra Radar Technology 579 (612) (16) (49) 579 (523) (86) (30)
Indra Peru - - - - 242 (299) 57 -
IFOS - 24 (24) - 1 67 (117) (49)
Indra Kazakhstan 600 (158) (104) 338 600 (87) (45) 468
Indra Malaysia 282 (31) (176) 75 35 (113) 79 1
Normeka - 961 81 1,042 - 917 134 1,051
Search 1,201 (2,163) 875 (87) 1,201 (2,185) 44 (940)
Prointec Panama - (18) (10) (28) - 2 (16) (14)
Indra Technology South Africa - (99) (387) (486) - (86) - (86)
Total 3,741 7,426 1,508 12,675 4,319 5,495 866 10,680

Indra • Consolidated Annual Accounts and Management Report
Consolidated Annual Accounts 63
Information on assets, liabilities and consolidated profit/loss for 2014 and 2013 of the most significant non-controlling interests, assigned to the Parent, is provided in Appendix IV.
The main transactions with non-controlling interests in 2014 are as follows:
» On 9 January 2014, the subsidiary, Indra Business Consulting S.L., acquired the remaining shares in its subsidiary Tourisme & Leisure Advisory Services, S.L. After this acquisition it owned 100% of the company and subsequently absorbed it.
» On 26 January 2014, the Parent acquired the remaining shares of its subsidiary Prointec S.A. for Euros 127 thousand. As a result of this acquisition, this company is now wholly-owned by the Group.
» On 5 June 2014 the subsidiary Advanced Logistics Group, S.A. acquired 10% of the shares of its subsidiary Europraxis-ALG Consulting Andina S.A.C for Euros 27 thousand. As a result of this acquisition, this company is now wholly-owned by the Group.
» On 6 October 2014 the Parent acquired the other 20% of the shares of its subsidiary International Financial Operational Services, S.A. (IFOS) for Euros 0.3 thousand. As a result of this acquisition, this company is now wholly-owned by the Group.
» On 27 October 2014 the subsidiary Indra Sistemas Magreb, S.R.L. acquired the other 34% of the shares in the Moroccan affiliate, Europraxis ALG Maroc, S.R.L., for Euros 78 thousand. As a result of this acquisition, this company is now wholly-owned by the Group.
The main transactions with non-controlling interests in 2013 were as follows:
» On 29 January 2013 the subsidiary Prointec, S.A. sold its entire interest in Inserail, S.A.
» On 14 March 2013 the Parent company acquired an additional 1.9% of the share capital of its
subsidiary Prointec, S.A., thereby increasing its percentage ownership to 99.8%.
» On 16 May 2013 the Parent acquired the remaining 25% of the subsidiary Indra Perú, S.A., thereby becoming the sole shareholder of this company.

Indra • Consolidated Annual Accounts and Management Report
Consolidated Annual Accounts 64
19. Earnings per share
The calculation of the weighted average number of ordinary shares outstanding and diluted shares at 31 December 2014 and 2013 is as follows:
The calculation of basic earnings per share (rounded to four decimal places) for 2014 and 2013 is as follows:
The calculation of diluted earnings per share (rounded to four decimal places) for 2014 and 2013 is as follows:
(*) Profit for the year not including the cost accrued on the convertible bond, net of the tax effect.
The calculation of earnings per ordinary share (rounded to four decimal places) for 2014 and 2013 is as follows:
Weighted average
number of ordinary shares at 31/12/2014
Ordinary shares at
31/12/2014
Weighted average
number of ordinary shares at 31/12/2013
Ordinary shares at
31/12/2013
Total shares issued 164,132,539 164,132,539 164,132,539 164,132,539
Own shares (282,131) (202,199) (93,096) (103,358)
Total shares outstanding 163,850,408 163,930,340 164,039,443 164,029,181
Weighted average
number of ordinary shares at 31/12/2014
Weighted average
number of ordinary shares at 31/12/2013
Total shares issued 164,132,539 164,132,539
Own shares and financial instruments linked to shares 17,212,621 3,549,647
Total diluted shares 181,345,160 167,682,186
2014 2013
Profit/(loss) attributable to the Parent (in thousands of Euros) (91,908) 115,822
Weighted average number of ordinary shares outstanding 163,850,408 164,039,443
Basic earnings/loss per ordinary share (in Euros) (0.5609) 0.7061
2014 2013
Profit/(loss) attributable to the Parent (in thousands of Euros) (*) (86,555) 116,903
Weighted average number of ordinary shares outstanding 181,345,160 167,682,186
Diluted earnings/loss per ordinary share (in Euros) (0.4773) 0.6972
2014 2013
Profit/(loss) attributable to the Parent (in thousands of Euros) (91,908) 115,822
Shares issued 164,132,539 164,132,539
Earnings/loss per ordinary share (in Euros) (0.5600) 0.7057

Indra • Consolidated Annual Accounts and Management Report
Consolidated Annual Accounts 65
20. Financial Liabilities from Issuing Bonds and Other Marketable Securities and Non-current Loans and Borrowings
a) Financial liabilities from issuing bonds and other marketable securitiesThis line item includes the financial liability of Euros 229,686 thousand (Euros 229,999 thousand in 2013) for the issue by the Parent of convertible and/or redeemable bonds relating to shares listed on Freiverkehr, the open market of the Frankfurt Stock Exchange. The terms and conditions of the bonds are as follows:
» The bonds were issued for a nominal amount of Euros 250,000 thousand, to be redeemed after five years (17 October 2018).
» The issue expenses totalled Euros 4,702 thousand.
» The bonds accrue annual fixed interest at a nominal rate of 1.75%, payable every six months in arrears, specifically on 17 April and 17 October each year, with the first interest payment on 17 April 2014. Euros 4,375 thousand were paid in this respect in 2014.
» The effective interest rate of the bond was 3.70% (a nominal rate of 3.29%).
» The initial conversion price of the bonds was Euros 14.290 per share.
» The shares underlying the bonds initially represented around 10.7% of the Parent's share capital prior to the issue.
» Bondholders may exercise their conversion rights from the last day of the offer, i.e. 17 October 2013, until 9 October 2018, the seventh trading day prior to the expiry date.
» Indra Sistemas can redeem in cash all (not a portion) of the bonds issued for an amount equivalent to the principal plus the accrued interest payable until redemption in two situations:
1. At any time from 7 November 2016 if the value of the bond over a certain period of time exceeds Euros 130,000 per bond.
2. At any time if 90% of the amount of the bond issue has been converted, redeemed or acquired by the Company.
» Bondholders may demand early redemption of the bonds in two situations:
1. In the event of a change of control at the Parent, for the principal of the bond issue plus the accrued interest receivable.
2. In the event of a public takeover bid of the issuer's shares for the higher of: (i) the nominal value of the bond or (ii) the equivalent value of the bond that includes the appreciation in the issuer's share price.
» The conversion rate may be reduced if the Company pays an annual dividend of more than Euros 0.34 per share and should any of the following situations, among others, arise:
1. The distribution of reserves or other amounts equivalent to dividends of more than Euros 0.34 per share. 2. A share split.3. A capital increase with pre-emptive subscription rights.4. The issue of new shares as payments in kind. 5. Spin-offs of assets or dividend payments in kind.6. In general any shareholder remuneration that could have an impact on the equivalent value of the convertible bonds
» The bond issue is guaranteed by the Parent's equity, and not by any third parties.
» The fair value of the bond at the 2014 reporting date was Euros 223,918 thousand (Euros 268,000 thousand in 2013), based on the quoted price on the Frankfurt Stock Exchange.
In 2013 this item also comprised the Euros 33,914 thousand bond issue carried out by the subsidiary Indra Brasil, S.A. The terms and conditions of the bonds were as follows:
» The bonds were issued for a nominal amount of BRL 110,000 thousand, to be redeemed after two years (20 May 2015).
» The bonds were issued on 20 May 2013.
» Interest is accrued at a floating rate, comprising the ID rate (interbank deposit rate in Brazil) +2.52%, payable every six months in arrears (first payment made on 20 November 2013).
At 2014 year end, all of this balance was transferred to current liabilities (see note 24).

Indra • Consolidated Annual Accounts and Management Report
Consolidated Annual Accounts 66
b) Non-current loans and borrowingsDetails by maturity of all other non-current loans and borrowings at 31 December 2014 are as follows:
Accrued interest payable in 2014 and 2013 totalled Euros 3,114 thousand and Euros 2,811 thousand, respectively.
Details by maturity of all other non-current loans and borrowings at 31 December 2013 were as follows:
In 2014 the most significant loans arranged by the Group for an amount of Euros 345,000 thousand (Euros 165,000 thousand in 2013) consisted of non-current financing in Euros, originally arranged with terms of between three and seven years, maturing between 2017 and 2012, and with floating interest rates of 1.43%-2.23%. No covenants are in place in respect of this financing.
In 2013 this item also included the Euros 2,693 thousand mortgage loan assumed by the subsidiary Prointec, S.A. in 2010 in relation to the residential properties acquired that year. This mortgage loan had a grace period until 31 January 2013 and falls due on 31 January 2019, accruing interest at Euribor plus a spread of 0.75%, which is settled annually. At 2014 year end, this mortgage had been repaid (see note 7).
Non-current loans and borrowings also include interest rate swaps used by the Parent to manage its exposure to interest rate fluctuations, mainly on non-current bank loans arranged at floating rates. The Euros 1,761 thousand fair value of financial swaps (Euros 2,941 thousand in 2013) is based on the market values of equivalent derivative financial instruments at the reporting date (see note 37 a).
Thousands of Euros
YearFinance lease
payablesCredit
institutionsR&D loans Total
2016 1,736 33,577 11,937 47,250
2017 1,577 128,271 17,568 147,416
2018 1,024 15,000 17,773 33,797
Subsequent years - 291,512 76,069 367,581
Total at 31/12/2014
4,337 468,360 123,347 596,044
Thousands of Euros
YearFinance lease
payablesCredit
institutionsR&D loans Total
2015 1,791 206,945 11,799 220,535
2016 1,900 113,185 11,900 126,985
2017 1,546 59,388 14,353 75,287
Subsequent years 1,025 31,075 71,037 103,137
Total at 31/12/2013
6,262 410,593 109,089 525,944

Indra • Consolidated Annual Accounts and Management Report
Consolidated Annual Accounts 67
21. Other Non-Current Financial Liabilities
for calculating this price is based on a bilateral negotiation.
The agreement has been signed early because it was advisable to assign additional resources and capacity to the activity in Italy to carry out more solutions work, especially in the Defence and Security and Transport and Traffic markets.
As a result of the earlier agreement, in 2014 the Parent recognised income of Euros 4,844 thousand under finance income in the consolidated income statement.
The amount presented at 2014 year end is the net present value of the price expected to be paid, i.e. Euros 2,715 thousand, in 2016.
Also the amount payable in respect of the acquisition of the subsidiary G-Nubila Technology was Euros 2,886 thousand (Euros 2,750 thousand in 2013).
The variable payment of Euros 74,031 thousand due in relation to the Brazilian company Politec Tecnología da Informacao, S.A. was written off from this item in 2013, considering 2013 year-end values based on the contract terms and the foreseeable settlement of this balance. This agreement was signed on 14 November 2014.
At 31 December 2014 suppliers of non-current assets include the estimated balances payable due to the acquisition of G-Nubila Technology and the other 22.5 % interest in Indra Italia, Spa. The amounts due to the remeasurement of these two items recognised under finance income in the consolidated income statement in 2014 total Euros 225 thousand (Euros 292 thousand in 2013).
The estimated liabilities arising from the acquisition of 22.5% of Indra Italia Spa by exercising the call option at the reporting dates from the date of the agreement is as follows:
‣ 2011: Euros 6,987 thousand
‣ 2012: Euros 7,176 thousand
‣ 2013: Euros 7,369 thousand
‣ 2014: Euros 2,615 thousand
In 2011, 2012 and 2013 a calculation criterion was applied that fixed the price according to expected EBIT at 2015 year end, multiplied by a multiple based on a rising scale subject to fulfilment.
However, the signing of an agreement to acquire the 22.5% non-controlling interest in Indra Italia, Spa for Euros 3.3 million, plus a variable amount of 0.325 million subject to the renewal of a major contract, was brought forward (planned for 2016) to February 2014. The price will be paid in May 2016. The criterion
Details of other non-current financial liabilities are as follows:
2014 2013
Guarantees and deposits received 111 189
Suppliers of property, plant and equipment and intangible assets 7,428 12,613
Other non-current payables 23,445 15,266
Total 30,984 28,068

Indra • Consolidated Annual Accounts and Management Report
Consolidated Annual Accounts 68
22. Government grants
23. Provisions for liabilities and charges
Details of government grants and movement in 2014 and 2013 are as follows:
Details of provisions for liabilities and charges and movement during 2014 and 2013 are as follows:
Grants have been awarded by various public entities for development projects (see note 9) and training programmes.
Thousands of Euros
Balance at 31.12.13
AdditionsTransfers
Taken to p/lBalance at
31.12.14
Grants 15,969 13,124 3,590 (19,725) 12,958
Thousands of Euros
Balance at 31.12.13
Translation differences
Charges Applications Payments TransfersBalance at
31,12,14
Provisions for taxes 9,667 (341) 66 - - (4,841) 4,551
Other provisions 89,671 5,941 12,012 (48,723) (22,282) (776) 35,843
Total 99,338 5,600 12,078 (48,723) (22,282) (5,617) 40,394
Thousands of Euros
Balance at 31.12.12
Translation differences
Charges Applications Payments TransfersBalance at
31,12,13
Provisions for taxes 6,779 (518) 2,998 (535) (15) 958 9,667
Other provisions 68,174 (11,123) 33,241 (1,650) (441) 1,470 89,671
Total 74,953 (11,641) 36,239 (2,185) (456) 2,428 99,338
Thousands of Euros
Balance at 31.12.12
AdditionsTransfers
Taken to p/lBalance at
31.12.13
Grants 29,356 5,178 (12,654) (5,911) 15,969

Consolidated Annual Accounts 69
Details of provisions, as well as the corresponding temporary differences and expected application dates, are as follows:
Thousands of Euros
Provision for taxes Balance at 31.12.13 Balance at 31.12.14
Concept BalanceTemporary difference
Translation differences
Charges Transfers BalanceTranslation differences
Expected cancel, date
Appeals filed with taxation authorities 9,667 33 (341) 66 (4,841) 4,551 34 2015-2017
Total provision for taxes 9,667 33 (341) 66 (4,841) 4,551 34
Thousands of Euros
Other provisions Balance at 31.12.13 Balance at 31.12.14
Concept BalanceTemporary difference
Translation differences
Charges Applications Payments Transfers BalanceTemporary difference
Expected cancel, date
Trade claims 362 362 - 703 (156) - - 909 909 2016 2016-2018
HR claims 45,069 3,537 3,394 7,596 (25,461) (1,172) (2,701) 26,725
Salaries 23,510 22,742 (20) 439 (129) (21,110) (1,718) 972 22,742 2018
Contingencies 20,730 4,907 2,567 3,274 (22,977) - 3,643 7,237 1,185 2016-2019
Total other provisions 89,671 31,548 5,941 12,012 (48,723) (22,282) (776) 35,843 24,836
Thousands of Euros
Other provisions Balance at 31.12.12 Balance at 31.12.13
Concept BalanceTemporary difference
Translation differences
Charges Applications Payments Transfers BalanceTemporary difference
Expected cancel, date
Trade claims 234 212 (3) 282 (133) - (18) 362 362 2015
HR claims 20,627 4,464 (6,149) 32,602 (1,480) (408) (123) 45,069 3,537 2015
Salaries 20,493 19,128 (165) 357 (37) - 2,862 23,510 22,742 2016 and -2029
Contingencies 26,820 4,907 (4,806) - - (33) (1,251) 20,730 4,907 2015 and -2017
Total other provisions 68,174 28,711 (11,123) 33,241 (1,650) (441) 1,470 89,671 31,548
Thousands of Euros
Provision for taxes Balance at 31.12.12 Balance at 31.12.13
Concept BalanceTemporary difference
Translation differences
Charges Transfers BalanceTranslation differences
Expected cancel, date
Appeals filed with taxation authorities 6,779 415 (518) 2,998 958 9,667 33 2014-2016
Total provision for taxes 6,779 415 (518) 2,998 958 9,667 33

Indra • Consolidated Annual Accounts and Management Report
Consolidated Annual Accounts 70
The largest amount corresponding to appeals made is the contested assessment A0271821943 of the Parent dated 9 December 2010. This assessment contains a proposed income tax settlement for 2004 to 2007 which involves paying Euros 4,493 thousand (principal of Euros 3,806 thousand and interest of Euros 687 thousand). In January 2011 the Parent submitted allegations against this assessment, requesting it be annulled.
The amounts relating to trade appeals pending resolution by courts and city councils have been discounted using the discount rate applicable to late payment interest for each year.
The provision for HR claims is basically to cover various claims from former suppliers of the Brazilian subsidiaries- the nature of which was similar to self-employed personnel - who after completing the service agreements for which they were contracted made claims against the company (or there is a risk that they will), questioning the status of self-employed supplier and claiming compensation as if they had had an employment relationship.
Various amounts for legal proceedings are included under contingent liabilities in 2014. These proceedings are not expected to be resolved until 2016. At 2014 year end the main contingent liabilities included in this provision are as follows: » Tax contingencies totalling Euros 4.2 million (Euros 3.8 million in 2013): A provision derived from
legal proceedings questioning a CIDE (Contribuição de Intervenção no Domínio Econômico) tax incident in respect of the subsidiary, Indra Brasil, S.A.
» Contingent liabilities arising from possible risks in the subsidiary Indra Esteio, for which the Parent has made a provision of Euros 1.2 million.
As is explained in more detail in note 40, in December 2013 the board of directors resolved, as planned, to convert the existing termination benefit scheme for senior management into an early retirement and long-term savings scheme channelled through a defined contribution fund that has been externalised to an insurance provider. The board also resolved to transfer to this fund the provisions recognised for this scheme at 31 December 2013, which amounted to Euros 21,110 thousand and were included under salaries within other non-current provisions. The various steps necessary to put these resolutions into effect were taken during January 2014.

Indra • Consolidated Annual Accounts and Management Report
Consolidated Annual Accounts 71
24. Financial Liabilities from Issuing Bonds and Other Marketable Securities and Current Loans and Borrowings
Details of this consolidated income statement item at 31 December 2014 and 2013 are as follows:
Bonds and debentures comprises the amounts for bonds issued with current maturities by the Parent, totalling Euros 4,375 thousand (these bonds accrue interest at a fixed nominal annual rate of 1.75%, payable every six months in arrears, on 17 April and 17 October each year) and by the subsidiary Indra Brasil, S.A. totalling Euros 34,516 thousand.
Loans comprise the current credit facilities drawn down as well as the current portion of non-current bank loans. The difference of Euros 103,070 thousand between the 2013 and 2014 figures is mainly due to the lower amount drawn on credit facilities in local currencies by subsidiaries abroad, largely as a result of the capital increases carried out by the Parent totalling Euros 143,857 thousand.
The entire Euros 8,809 thousand (Euros 9,127 thousand in 2013) of official loans for research programmes consist of the current portion of loans received from public entities to carry out research programmes (see note 22).
The information on amounts drawn down and available on credit facilities is as follows:
Thousands of Euros
2014 2013
Bonds and debentures (note 20) 38,891 -
Loans 78,405 181,475
Interest payable 2,678 2,811
Finance leases (note 6) 2,079 2,261
Total 122,053 186,547
Official loans for research programmes 8,809 9,127
Total 130,862 195,674
Thousands of Euros
Year 2014 2013
Amount available 363,099 481,128
Amount drawn down 78,405 148,519
Total credit facilities 441,504 629,647

Indra • Consolidated Annual Accounts and Management Report
Consolidated Annual Accounts 72
25. Trade and other payables
Details of trade and other payables at 31 December 2014 and 2013 are as follows:
The Spanish Indra Group companies are completing the adaptation of their internal processes and payment policies to Law 15/2010, which establishes measures to combat late payments in commercial transactions. Consequently, the terms of trade supplier agreements in 2014 and 2013 have respectively contained payment terms of 60 days or less, in line with transitional provision two of the aforementioned law. For reasons of efficiency and in line with common trade practices, the Group has a supplier payment schedule whereby payments are made on set days. Invoices that fall due between two payment days are paid on the next payment date according to the schedule, which is not considered as delaying payment.
Payments that were made to suppliers outside the maximum legal period in 2014 and 2013 were due to circumstances or incidents not related to the established payment policy, above all, completing agreements with suppliers, the delivery of goods or the rendering of the service or one-off processing problems.
Average payment period of the Group's Spanish companies:
Details of the Group's Spanish companies’ payments at 31 December 2014 and 31 December 2013 are as follows:
At 31 December 2014 and 2013, details of the payment terms of balances payable to suppliers and creditors by the Spanish companies of the Group are as follows:
Thousands of Euros
2014 2013
Purchases and services received 581,310 565,156
Advances from customers 594,033 615,241
Total 1,175,343 1,180,397
Thousands of Euros
2014 2013
Amount Amount
Total payments for the year 1,355,002 1,326,707
Weighted average late payment days 60 67
Thousands of Euros
2014 2013
Amount % Amount %
Within maximum legal period 776,268 57.29% 643,920 48.54%
Other 578,734 42.71% 682,787 51.46%
Total payments for the year 1,355,002 100.00% 1,326,707 100,00%
Weighted average late payment days 78 84
Thousands of Euros
2014 2013
Amount % Amount %
Within maximum legal period 356,334 77.76% 334,713 72.87%
Other 101,904 22.24% 124,588 27.13%
Total outstanding balance 458,238 100.00% 459,301 100.00%

Indra • Consolidated Annual Accounts and Management Report
Consolidated Annual Accounts 73
26. Other liabilities
Details of other liabilities at 31 December 2014 and 2013 are as follows:
Thousands of Euros
2014 2013
Public entities (note 36) 124,016 123,909
Salaries payable 71,372 74,506
Cash flow hedges 18,493 215
Guarantees and deposits received 212 444
Trade provisions 40,083 56,959
Accruals 2,554 2,337
Suppliers of property, plant and equipment and intangible assets 1,512 6,291
Other payables 34,021 33,874
Total 292,263 298,535

Indra • Consolidated Annual Accounts and Management Report
Consolidated Annual Accounts 74
27. Segment reporting
The following tables present information on the Group's business segments, based on the individual financial statements of the different Group companies.
The Group’s segments are Services and Solutions.
2014 (Thousands of Euros)
Segment reporting at 31 December 2014: Solutions % Services %Unallocated
corporateEliminations Total %
External sales 1,886,972 99.9% 1,050,913 98% - - 2,937,885 100%
Inter-segment sales 2,168 0.1% 16,257 2% - (18,425) - -
Net sales 1,889,140 100% 1,067,170 100% - (18,425) 2,937,885 100%
Contribution margin 289,219 15.3% 132,213 12.4% - (910) 420,522 14%
Impairment and provisions (224,474) (4,566) (16,940) - (245,980) -8%
Other income and expenses (corporate and unallocated)
- - (217,926) 910 (217,016)-7%
Results from operating activities 64,745 127,647 (234,866) - (42,474) -1%
Other gains/(losses) (33,763) (23,206) 5,772 - (51,197) -2%
Share in profit/(loss) of associates 398 (3,743) - - (3,345) -0.1%
Income tax (84,095) (27,317) 118,028 - 6,616 0.2%
Segment profit/(loss) (52,715) -3% 73,381 7% (111,066) - (90,400) -3%
Other information
Investments 52,497 8,963 11,103 - 72,563
Amortisation and depreciation 28,705 11,381 24,146 - 64,232
Balance sheet
Assets
Segment assets 1,646,373 718,082 1,111,150 - 3,475,605
Assets in associates 8,860 (3,196) - - 5,664
Total consolidated assets 3,481,269
Liabilities
Segment liabilities 1,241,753 584,742 713,874 2,540,369
Total consolidated liabilities 2,540,369
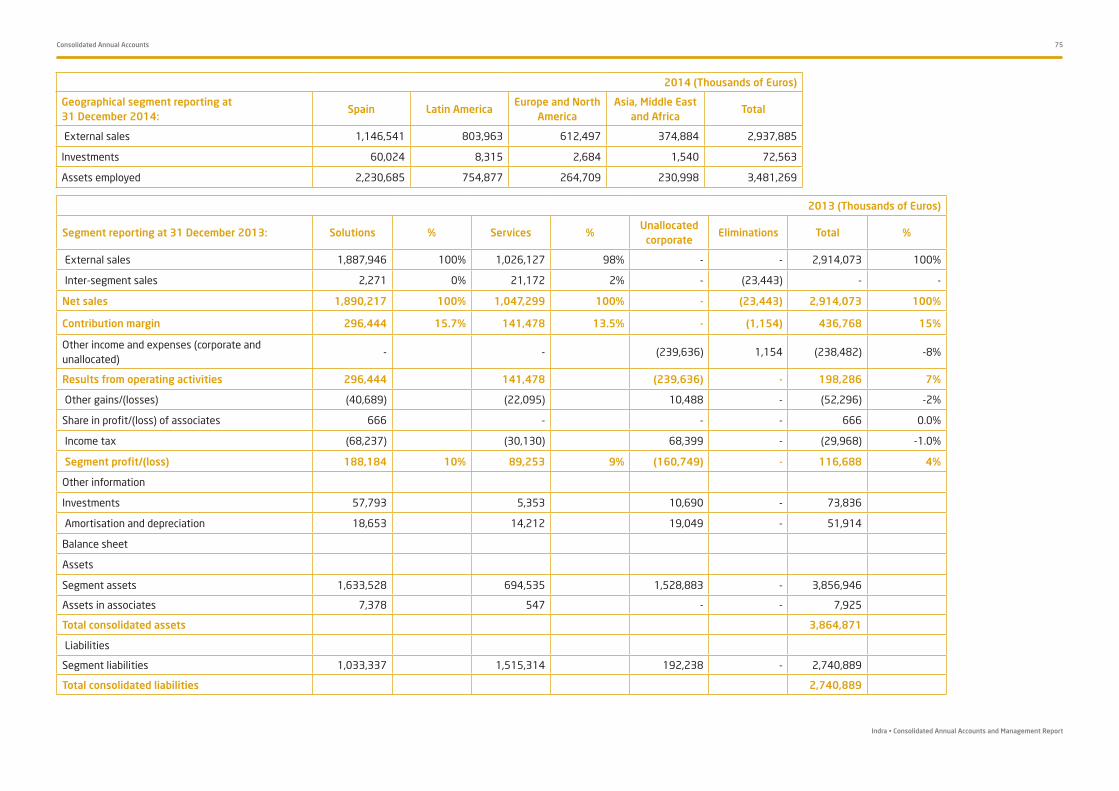
Indra • Consolidated Annual Accounts and Management Report
Consolidated Annual Accounts 75
2014 (Thousands of Euros)
Geographical segment reporting at 31 December 2014:
Spain Latin AmericaEurope and North
AmericaAsia, Middle East
and AfricaTotal
External sales 1,146,541 803,963 612,497 374,884 2,937,885
Investments 60,024 8,315 2,684 1,540 72,563
Assets employed 2,230,685 754,877 264,709 230,998 3,481,269
2013 (Thousands of Euros)
Segment reporting at 31 December 2013: Solutions % Services %Unallocated
corporateEliminations Total %
External sales 1,887,946 100% 1,026,127 98% - - 2,914,073 100%
Inter-segment sales 2,271 0% 21,172 2% - (23,443) - -
Net sales 1,890,217 100% 1,047,299 100% - (23,443) 2,914,073 100%
Contribution margin 296,444 15.7% 141,478 13.5% - (1,154) 436,768 15%
Other income and expenses (corporate and unallocated)
- - (239,636) 1,154 (238,482) -8%
Results from operating activities 296,444 141,478 (239,636) - 198,286 7%
Other gains/(losses) (40,689) (22,095) 10,488 - (52,296) -2%
Share in profit/(loss) of associates 666 - - - 666 0.0%
Income tax (68,237) (30,130) 68,399 - (29,968) -1.0%
Segment profit/(loss) 188,184 10% 89,253 9% (160,749) - 116,688 4%
Other information
Investments 57,793 5,353 10,690 - 73,836
Amortisation and depreciation 18,653 14,212 19,049 - 51,914
Balance sheet
Assets
Segment assets 1,633,528 694,535 1,528,883 - 3,856,946
Assets in associates 7,378 547 - - 7,925
Total consolidated assets 3,864,871
Liabilities
Segment liabilities 1,033,337 1,515,314 192,238 - 2,740,889
Total consolidated liabilities 2,740,889

Indra • Consolidated Annual Accounts and Management Report
Consolidated Annual Accounts 76
Other income and expenses mainly comprise fixed costs for corporate functions and overheads of the subsidiaries and other activities that, due to their nature, cannot be assigned to segments, as no separate financial information is available.
28. Other income
In 2014 this item mainly includes income from grants amounting to Euros 23,649 thousand (Euros 9,267 thousand in 2013).
In 2013 this consolidated income statement line item includes the income generated as a result of writing off the variable payment of Euros 74,031 thousand (see note 21) in relation to the Brazilian company Politec Tecnología da Informacao, S.A., considering year-end values for 2013, and the proceeds from the sale of the P&F activity for Euros 17,878 thousand.
29. Materials and Other Supplies Used
The total cost of materials and other supplies used by the Group during the years ended 31 December 2014 and 2013 is as follows:
2013 (Thousands of Euros)
Geographical segment reporting at 31 December 2013:
Spain Latin AmericaEurope and North
AmericaAsia, Middle East
and AfricaTotal
External sales 1,124,930 830,686 577,340 381,117 2,914,073
Investments 59,621 10,180 2,242 1,793 73,836
Assets employed 3,073,855 483,951 146,745 160,320 3,864,871
Thousands of Euros
2014 2013
Subcontracted work and materials consumed 755,992 753,783
Change in inventories 1,227 (840)
Total 757,219 752,943
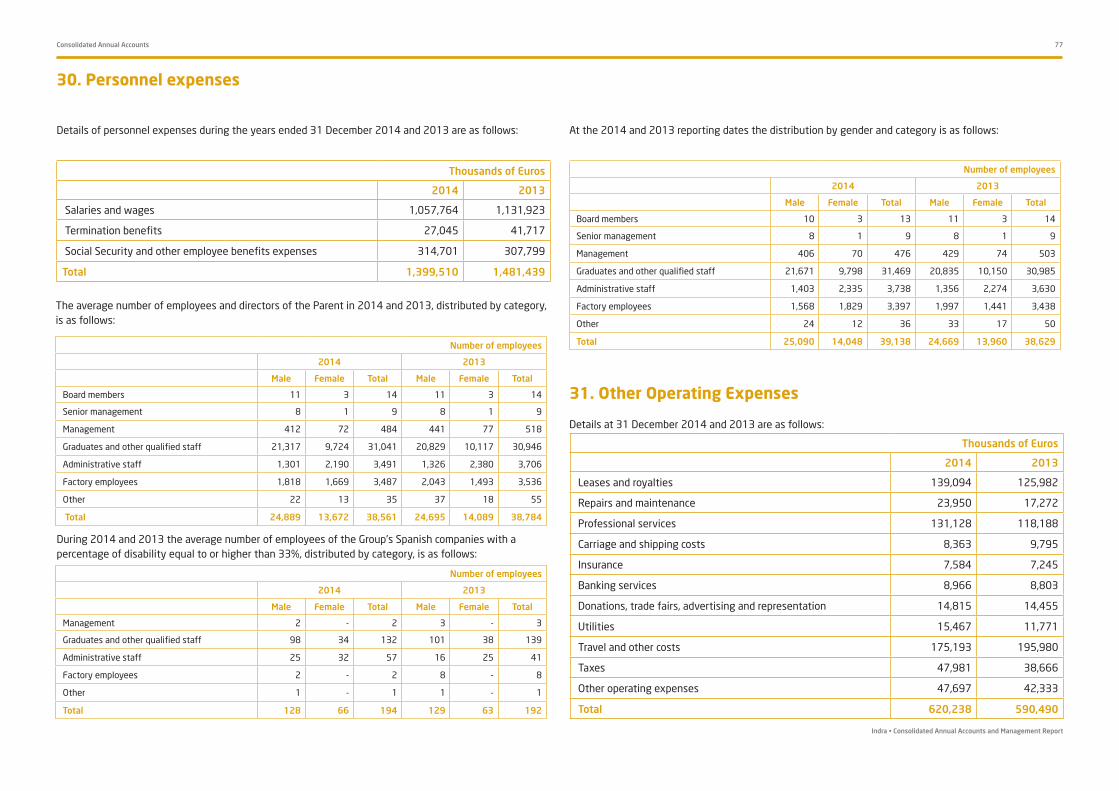
Indra • Consolidated Annual Accounts and Management Report
Consolidated Annual Accounts 77
30. Personnel expenses
Details of personnel expenses during the years ended 31 December 2014 and 2013 are as follows:
The average number of employees and directors of the Parent in 2014 and 2013, distributed by category, is as follows:
During 2014 and 2013 the average number of employees of the Group's Spanish companies with a percentage of disability equal to or higher than 33%, distributed by category, is as follows:
At the 2014 and 2013 reporting dates the distribution by gender and category is as follows:
31. Other Operating Expenses
Details at 31 December 2014 and 2013 are as follows:
Thousands of Euros
2014 2013
Salaries and wages 1,057,764 1,131,923
Termination benefits 27,045 41,717
Social Security and other employee benefits expenses 314,701 307,799
Total 1,399,510 1,481,439
Number of employees
2014 2013
Male Female Total Male Female Total
Board members 11 3 14 11 3 14
Senior management 8 1 9 8 1 9
Management 412 72 484 441 77 518
Graduates and other qualified staff 21,317 9,724 31,041 20,829 10,117 30,946
Administrative staff 1,301 2,190 3,491 1,326 2,380 3,706
Factory employees 1,818 1,669 3,487 2,043 1,493 3,536
Other 22 13 35 37 18 55
Total 24,889 13,672 38,561 24,695 14,089 38,784
Number of employees
2014 2013
Male Female Total Male Female Total
Board members 10 3 13 11 3 14
Senior management 8 1 9 8 1 9
Management 406 70 476 429 74 503
Graduates and other qualified staff 21,671 9,798 31,469 20,835 10,150 30,985
Administrative staff 1,403 2,335 3,738 1,356 2,274 3,630
Factory employees 1,568 1,829 3,397 1,997 1,441 3,438
Other 24 12 36 33 17 50
Total 25,090 14,048 39,138 24,669 13,960 38,629
Number of employees
2014 2013
Male Female Total Male Female Total
Management 2 - 2 3 - 3
Graduates and other qualified staff 98 34 132 101 38 139
Administrative staff 25 32 57 16 25 41
Factory employees 2 - 2 8 - 8
Other 1 - 1 1 - 1
Total 128 66 194 129 63 192
Thousands of Euros
2014 2013
Leases and royalties 139,094 125,982
Repairs and maintenance 23,950 17,272
Professional services 131,128 118,188
Carriage and shipping costs 8,363 9,795
Insurance 7,584 7,245
Banking services 8,966 8,803
Donations, trade fairs, advertising and representation 14,815 14,455
Utilities 15,467 11,771
Travel and other costs 175,193 195,980
Taxes 47,981 38,666
Other operating expenses 47,697 42,333
Total 620,238 590,490

Indra • Consolidated Annual Accounts and Management Report
Consolidated Annual Accounts 78
Details at 31 December 2014 and 2013 are as follows:
32. Impairment and gains/losses on disposal of fixed assets
In 2014 the Parent recognised an impairment loss of Euros 18,865 thousand on investments made in the energy market commercial management system under impairment and gains/losses on disposal of fixed assets (see note 9).
In 2014 losses on property, plant and equipment included a loss of Euros 485 thousand incurred on the sale of investment properties by the subsidiary Prointec, S.A. (Note 7)
In 2013, losses on property, plant and equipment included impairment losses of Euros 65 thousand on investment property, specifically on housing owned by the subsidiary Prointec, S.A. (see note 7).
This amount also includes disposals of Euros 1,272 thousand (Euros 1,390 thousand in 2013) mainly due to the renewal of equipment by the subsidiary, Indra Brasil, S.A.
33. Share in Profit of Other Investees
34. Foreign Currency Transactions
Details at 31 December 2014 and 2013 are as follows:
The main transactions in non-Euro currencies in 2014 and 2013 are as follows:
In 2013 gains on financial assets include the Euros 14,826 thousand proceeds from the sale of Banco Inversis (see note 12).
Thousands of Euros
2014 2013
Disposals/impairment of goodwill (note 8) (22,145) (10,292)
Losses and impairment on other intangible assets (note 9) (19,928) (5,080)
Losses and impairment on property, plant and equipment (note 6) (1,272) (1,455)
Losses and impairment on investment property (note 7) (485) (65)
(43,830) (16,892)
Thousands of Euros
2014 2013
Gains on financial assets 64 14,947
Losses and impairment on financial assets (1,812) (3,262)
(1,748) 11,685
Thousands of Euros
2014 2013
Sales 1,318,976 1,264,331
Purchases 534,846 683,719

Indra • Consolidated Annual Accounts and Management Report
Consolidated Annual Accounts 79
35. Deposits and Guarantees
36. Taxation
At 31 December 2014 several different banks and insurance companies had deposited guarantees totalling Euros 999,676 thousand with third parties on behalf of the Group, mainly to secure the completion of contracts. At 31 December 2013 these guarantees totalled Euros 962,965 thousand.
The Group does not expect any significant liabilities to arise from these guarantees.
In 2014 and 2013 guarantees amounting to Euros 6,413 thousand and Euros 9,938 thousand, respectively, were received from third parties to ensure fulfilment of project-related obligations. They consist of bank guarantees with different maturities, which Indra can execute if the third party fails to meet the obligations guaranteed by third parties.
The Parent files consolidated income tax returns as the parent of tax group 26/01, which comprises the Parent and the subsidiaries Indra Sistemas de Seguridad, S.A.U., Inmize Capital, S.L., Indra Business Consulting, S.L.U., Indra Software Labs, S.L.U., Indra BPO, S.L.U., Indra Emac, S.A.U., Indra Sistemas de Comunicaciones Seguras, S.L.U, Advanced Logistics Group, S.L.U., Indra BPO Servicios, S.L.U., Prointec, S.A., Central de Apoyos y Medios Auxiliares S.A.U. and Servicios Avanzados Printing & Finishing, S.L.
At 31 December 2014 and 2013, in accordance with IAS 12, the Group has presented its net deferred tax assets and liabilities by jurisdiction, amounting to Euros 89,155 thousand and 87,951 thousand, respectively.

Indra • Consolidated Annual Accounts and Management Report
Consolidated Annual Accounts 80
Deferred tax assets
Details of movement in deferred tax assets are as follows:
The recovery of deferred tax assets depends on the generation of sufficient taxable income in the future. The Parent’s directors consider that the projected taxable income of the various Group companies amply cover the amounts necessary to recover these assets.
Details of deferred tax assets at 31 December 2014 and 2013 are as follows:
The period for reversal of the tax losses and deductions recognised in 2014 is as follows:
The Spanish Group companies have deferred tax assets with an estimated reversal period of more than one year amounting to Euros 100,615 thousand (Euros 46,475 thousand at 31 December 2013).
Approximately 75% of the deferred tax assets recognised are expected to be recovered within three years.
Thousands of Euros
Balance at 31/12/2013
Change in rates
Translation differences
Generated ReversalsOther
movementsBalance at
31/12/2014
Deferred tax assets 175,045 (16,600) 333 95,642 (44,885) (4,340) 205,195
Thousands of Euros
Balance at 31/12/2012
Change in rates
Translation differences
Generated ReversalsOther
movementsBalance at
31/12/2013
Deferred tax assets 164,118 - (18,406) 31,621 (15,308) 13,020 175,045
Thousands of Euros
Concept 2014 2013
Charges to and application of provisions 52,246 59,867
Amortisation of goodwill 1,974 2,613
Excess amortisation/depreciation 5,708 4,658
Loss carryforwards and deductions 112,044 48,099
Other 33,223 59,808
Deferred tax assets 205,195 175,045
Year Thousands of Euros
2015 11,429
2016 17,563
2017 26,540
2018 19,194
Thereafter 37,318
Total 112,044

Indra • Consolidated Annual Accounts and Management Report
Consolidated Annual Accounts 81
Current tax assets
Details of income tax assets at 31 December 2014 and 2013 are as follows:
Deferred tax liabilities
The Parent has not recognised deferred tax liabilities relating to undistributed profits of subsidiaries over which its control enables it to manage when the temporary differences are reversed, and these are not expected to reverse in the near future.
Details of movement in deferred tax liabilities during 2014 and 2013 are as follows:
Thousands of Euros
2014 2013
Prior years’ income tax recoverable - 16,806
Current year’s income tax recoverable 50,057 23,124
Total 50,057 39,930
Thousands of Euros
Balance at 31/12/2013
Change in rates
Translation differences
Generated ReversalsOther
movementsBalance at
31/12/2014
Deferred tax liabilities 104,094 (18,675) 352 13,770 (1,333) (7,232) 90,976
Thousands of Euros
Balance at 31/12/2012
Change in rates
Translation differences
Generated ReversalsOther
movementsBalance at
31/12/2013
Deferred tax liabilities 97,729 - (5,971) 20,747 (9,566) 1,155 104,094

Indra • Consolidated Annual Accounts and Management Report
Consolidated Annual Accounts 82
Details of deferred tax liabilities at 31 December 2014 and 2013 are as follows:
It is not expected that a material amount of deferred tax liabilities will be reversed in less than one year.
Current tax liabilities
Details of income tax liabilities at 31 December 2014 and 2013 are as follows:
Thousands of Euros
Concept 2014 2013
Finance leases 598 1,004
Taxable gains 2,427 4,613
Portfolio provisions 33,665 54,682
Amortisation of goodwill 23,344 24,073
Other 30,942 19,722
Deferred tax liabilities 90,976 104,094
Thousands of Euros
2014 2013
Income tax (prior years) 2,617 2,585
Income tax (current year) 7,597 10,761
Income tax (companies located abroad) 7,126 4,931
Total 17,340 18,277

Indra • Consolidated Annual Accounts and Management Report
Consolidated Annual Accounts 83
Income tax expense
Due to the treatment permitted by fiscal legislation of certain transactions, accounting profit differs from taxable income. A reconciliation of accounting profit/loss for the year with the taxable income of the companies forming the Group, including the income tax expense calculation at 31 December 2014 and 2013, is as follows:
Thousands of Euros
Concept 2014 2013
A,- Accounting profit before tax (97,016) 146,656
Adjustments to accounting profit:
- Other positive differences 67,160 46,671
- Other negative differences (47,922) (56,369)
Total adjustments to accounting profit 19,238 (9,698)
B,- Adjusted accounting profit (77,778) 136,958
Temporary differences:
- Positive, generated during the year 85,264 103,529
- Positive, generated in prior years 8,142 28,404
- Negative, generated during the year (46,649) (64,506)
- Negative, generated in prior years (49,095) (50,405)
Total temporary differences (2,338) 17,022
C,- Taxable income/(tax loss) (80,116) 153,980
D,- Tax loss carryforwards for offset (5,523) (6,315)
E,- Adjusted taxable income (85,639) 147,665
Income tax payable (25,533) 51,600
Deductions:
- International double taxation relief (7,204) (4,298)
- Investments in R&D&i and others (17,595) (32,335)
F,- Credit for loss carryforwards 60,462 19,192
G,- Local taxes abroad 582 257
H,- Total tax payable 10,712 34,416
Withholdings and payments on account 38,617 46,779
Total recoverable (27,905) (12,363)
I,- Deferred tax assets (current year) (25,688) (31,621)
J,- Deferred tax assets recovered 15,523 15,308
K, - Deferred tax liabilities (current year) 13,770 20,747
L,- Deferred tax liabilities recovered (1,333) (9,566)
Accrued income tax (H+I+J+K+L) 12,984 29,284
Income tax (companies located abroad) 13,792 8,621
Prior years’ income tax 9,275 7,549
Income tax, differences in tax rates (2,075) 3,844
Deductions capitalised (40,592) (19,330)
M,- Income tax for the year (6,616) 29,968
Profit/(loss) for the year after tax (A-M) (90,400) 116,688

Indra • Consolidated Annual Accounts and Management Report
Consolidated Annual Accounts 84
A reconciliation of the legal tax rate and the effective tax rate applied by the Group is as follows: Details of available deductions for investment, training and export activities at 31 December 2014 and 2013 are as follows:
As in 2013, the Group has no reinvestment commitments at 31 December 2014.
Under prevailing Spanish tax legislation, the application period for deductions in respect of investments is 18 years and for other deductions is 15 years.
The reversal periods for available deductions for investments, training and export activity in 2014 are as follows:
2014
Thousands of Euros %
- Consolidated loss (before tax) (97,016)
- Income tax at the rate applicable in Spain (29,105) 30.00%
- Effect of permanent differences 5,771 (5.95)%
- Effect of deductions (24,799) 25.56%
- Effect of other income tax adjustments from prior years 9,275 (9.56)%
- Effect of tax loss carryforwards 60,462 (62.32)%
- Effect of deductions capitalised (40,592) 41.84%
- Income tax on companies located abroad 13,792 (14.22)%
- Effect of different tax rates (1,421) 1.46%
(6,616) 6.82%
Thousands of Euros
Deductions for investments and other reasons
Year 2014 Year 2013
2010 and prior years 4,006 2009 and prior years 3,410
2011 455 2010 608
2012 311 2011 455
2013 155 2012 311
2014 44 2013 101
Total 2014 4,971 Total 2013 4,885
2013
Thousands of Euros %
- Consolidated profit (before tax) 146,656
- Income tax at the rate applicable in Spain 43,997 (45.35)%
- Effect of permanent differences (2,909) 3.00%
- Effect of deductions (36,633) 37.76%
- Effect of other income tax adjustments from prior years 7,549 (7.78)%
- Effect of tax loss carryforwards 19,192 (19.78)%
- Effect of deductions capitalised (19,330) 19.92%
- Income tax on companies located abroad 8,621 (8.89)%
- Effect of different tax rates 9,482 (9.77)%
29,968 (30.89)%
Year Thousands of Euros
2023 180
2024 911
2025 1.308
2026 447
Thereafter 2.125
Total 4.971

Indra • Consolidated Annual Accounts and Management Report
Consolidated Annual Accounts 85
Details of loss carryforwards available for offset and not yet capitalised as a result of the legislation in each country at 31 December 2014 and 2013 are as follows:
Spanish tax legislation caps the amount of tax loss carryforwards available for offset by the companies forming part of the tax group headed by Indra Sistemas, S.A. in 2012, 2013, 2014 and 2015 at 25% of taxable income prior to offset. For the rest of the Spanish companies, this percentage varies depending on the volume of transactions and revenues. For these same periods goodwill may only be amortised up to one hundredth of its amount per year and the amortisation of intangible assets with indefinite useful lives is capped at one fiftieth of the amount. Furthermore, for 2013 and 2014 property, plant and equipment, intangible assets and investment property may only be depreciated or amortised up to 70% of the assets’ depreciation/amortisation for accounting purposes.
As a result of the approval of the Corporate Income Tax Law 27/2014, of 27 November 2014, which will enter into effect on 1 January 2015 and will generally be applicable to the tax periods starting on or after that date of the Spanish Group companies, the tax rate will gradually decline. The general tax rate will be reduced from 28% in 2015 to 25% in 2016. Consequently, the Spanish Group companies have adapted their deferred tax rates, taking into account the year in which they will revert.
In accordance with prevailing legislation, taxes cannot be considered definitive until they have been inspected by the taxation authorities or before the prescription period pursuant to legislation in force in each of the countries in which the Group operates has elapsed. The Parent has open to inspection all applicable taxes for 2010 and subsequent years.
The Group companies consider that all applicable taxes for the years open to inspection have been properly filed and settled. However, in the event of inspection, discrepancies could arise regarding the interpretation of prevailing tax legislation, although the companies do not expect that any such discrepancies would be significant to the consolidated annual accounts.
The period for reversal of available tax losses for offset in 2014 is as follows:
Thousands of Euros
Tax loss carryforwards for offset
Year 2014 Year 2013
2010 and prior years 32,040 2009 and prior years 13,022
2011 16,926 2010 17,731
2012 31,801 2011 18,922
2013 21,339 2012 28,445
2014 18,244 2013 22,171
Total 2014 120,350 Total 2013 100,291
Year Thousands of Euros
2015 3,755
2016 3,899
2017 7,988
2018 1,705
2019 1,463
2020 2,003
2021 2,290
2023 2,383
2024 698
Indefinite 90,699

Indra • Consolidated Annual Accounts and Management Report
Consolidated Annual Accounts 86
Balances with public entities
The balances receivable from public entities are as follows:
Details of balances payable to public entities are as follows:
Thousands of Euros
2014 2013
Taxation authorities:
Value added tax 26,231 31,439
Other taxes 7,578 9,295
Subtotal 33,809 40,734
Grants receivable 2,251 4,554
Social Security receivable 4,573 560
Total (note 14) 40,633 45,848
Thousands of Euros
2014 2013
Taxation authorities:
Value added tax 60,070 60,353
Personal income tax withholdings 28,033 24,888
Other taxes 6,547 10,822
Subtotal 94,650 96,063
Repayable grants 2 2
Social Security payable 29,364 27,844
Total (note 26) 124,016 123,909

Indra • Consolidated Annual Accounts and Management Report
Consolidated Annual Accounts 87
37. Financial Risk Management and Hedging Policies
Financial risk factors
The Group’s activities are exposed to various financial risks: market risk (including currency risk and interest rate risk), credit risk and liquidity risk. The risk management model aims to minimise potential adverse effects on the Group’s profits.
Financial risk management is controlled by the Group’s Finance and Control departments. Internal regulations provide written policies for global risk management, as well as policies for specific issues such as currency risk, interest rate risk and liquidity risk.
To ensure that the above-mentioned risks are managed appropriately, the Group maintains control over financial information using an internal system that is highly efficient in all major respects.
a) Market risk
(I) Currency riskThe Group operates internationally and is therefore exposed to currency risk when operating with foreign currencies. Currency risk arises from future commercial transactions and recognised assets and liabilities which are presented in a foreign currency that is not the functional currency of each of the companies.
In order to mitigate the impact of exchange rate differences on the projects carried out by the Group in currencies other than that of the country of origin of the transaction, hedging transactions (mainly forward purchases and sales of foreign currency) are arranged with banks. Indra analyses the exchange rate risk at the time each individual project contract is signed and arranges suitable hedges (primarily exchange rate insurance policies) to ensure that future profits are not significantly affected by fluctuations in the exchange rate. No derivative financial instruments are used for speculative ends.
The profits of operations with income and expenses denominated in currencies other than the Euro may increase or decrease on consolidation into the Group’s Euro-denominated accounts. Although this risk is partly mitigated by the Group’s significant geographical diversity, exchange rate fluctuations in the different currencies of Latin America, as the most important region in terms of the Group’s non-Euro activity, could have a detrimental impact on the Group’s results.
The Group’s exposure to currency risk at 31 December 2014 and 2013 is presented in Appendix III. This appendix reflects the carrying amount of the Group’s financial instruments or classes of financial instruments denominated in foreign currencies (in thousands of Euros).
To compare the gross exposure covered by hedging instruments, based on the Group's policies, the amounts of foreign subsidiaries in local currency are eliminated.
The Group’s currency risk management policy generally involves hedging 100% of the net exposure arising from transactions in currencies other than the functional currency of each company. Hedging instruments are not used in transactions that are not material, when there is no active market for the hedging instruments, which is the case of certain non-convertible currencies and when other mechanisms are available to offset currency fluctuations in supplier payments or trade receivables.
The sensitivity analysis of +/-5% variation in the exchange rate for the main functional currencies (other than the Euro) where the Group has exposure due to its foreign subsidiaries is as follows:
Changes in equity 2014
+5% Thousands of Euros
US Dollar 440
Argentine Peso 47
Brazilian Real 61
Changes in profit and loss 2014
+5% Thousands of Euros
US Dollar (61)
Argentine Peso (51)
Brazilian Real 222
Changes in equity 2013
+5% Thousands of Euros
US Dollar 436
Argentine Peso 106
Brazilian Real 465
Changes in profit and loss 2013
+5% Thousands of Euros
US Dollar 25
Argentine Peso (27)
Brazilian Real 47
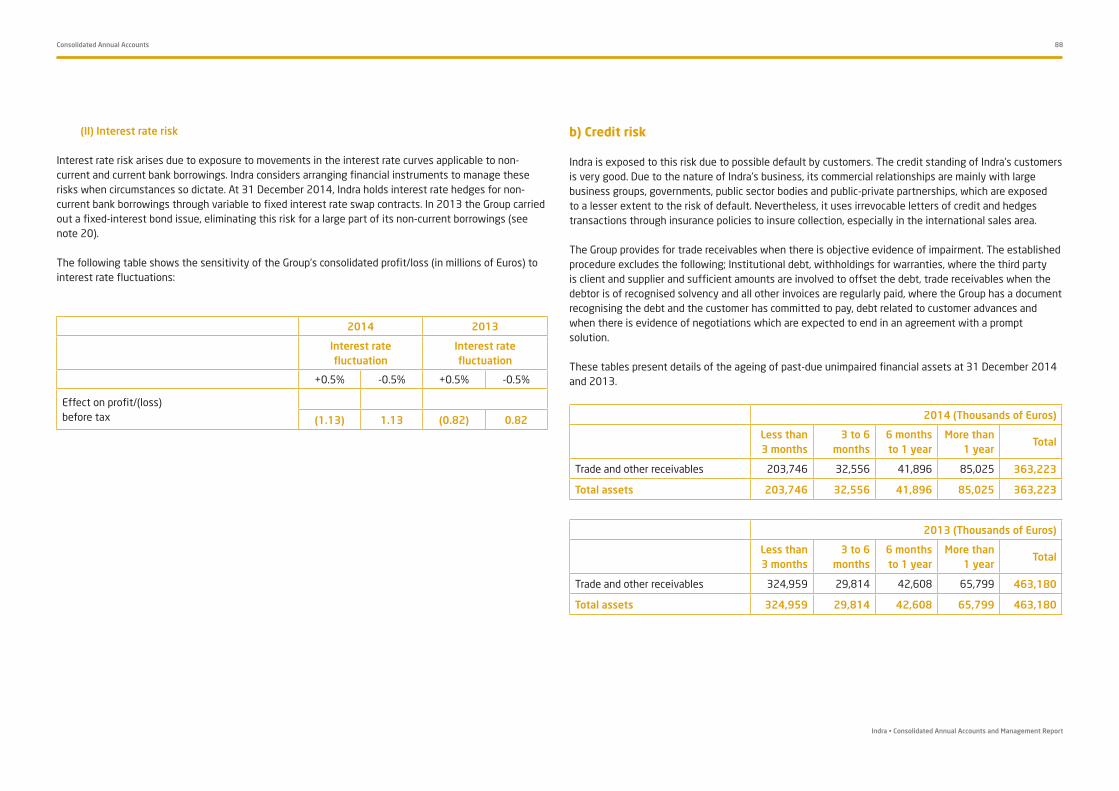
Indra • Consolidated Annual Accounts and Management Report
Consolidated Annual Accounts 88
(II) Interest rate risk
Interest rate risk arises due to exposure to movements in the interest rate curves applicable to non-current and current bank borrowings. Indra considers arranging financial instruments to manage these risks when circumstances so dictate. At 31 December 2014, Indra holds interest rate hedges for non-current bank borrowings through variable to fixed interest rate swap contracts. In 2013 the Group carried out a fixed-interest bond issue, eliminating this risk for a large part of its non-current borrowings (see note 20).
The following table shows the sensitivity of the Group’s consolidated profit/loss (in millions of Euros) to interest rate fluctuations:
b) Credit risk
Indra is exposed to this risk due to possible default by customers. The credit standing of Indra’s customers is very good. Due to the nature of Indra’s business, its commercial relationships are mainly with large business groups, governments, public sector bodies and public-private partnerships, which are exposed to a lesser extent to the risk of default. Nevertheless, it uses irrevocable letters of credit and hedges transactions through insurance policies to insure collection, especially in the international sales area.
The Group provides for trade receivables when there is objective evidence of impairment. The established procedure excludes the following; Institutional debt, withholdings for warranties, where the third party is client and supplier and sufficient amounts are involved to offset the debt, trade receivables when the debtor is of recognised solvency and all other invoices are regularly paid, where the Group has a document recognising the debt and the customer has committed to pay, debt related to customer advances and when there is evidence of negotiations which are expected to end in an agreement with a prompt solution.
These tables present details of the ageing of past-due unimpaired financial assets at 31 December 2014 and 2013.
2014 2013
Interest rate fluctuation
Interest rate fluctuation
+0.5% -0.5% +0.5% -0.5%
Effect on profit/(loss)before tax (1.13) 1.13 (0.82) 0.82
2014 (Thousands of Euros)
Less than 3 months
3 to 6 months
6 months to 1 year
More than 1 year
Total
Trade and other receivables 203,746 32,556 41,896 85,025 363,223
Total assets 203,746 32,556 41,896 85,025 363,223
2013 (Thousands of Euros)
Less than 3 months
3 to 6 months
6 months to 1 year
More than 1 year
Total
Trade and other receivables 324,959 29,814 42,608 65,799 463,180
Total assets 324,959 29,814 42,608 65,799 463,180

Consolidated Annual Accounts 89
c) Liquidity risk
The Group applies a prudent policy to cover its liquidity risk, consisting of arranging credit facilities and loans with different financial institutions and issuing bonds for a sufficient amount to settle its current commitments. Indra Group policy with regard to cash surpluses is to invest them in highly liquid, non-speculative short-term instruments through prestigious financial institutions.
Given the dynamic nature of its underlying business, the Group’s Treasury Department aims to be flexible with regard to financing through drawdowns on credit facilities.
The Group’s exposure to liquidity risk at 31 December 2014 and 2013 is shown below. These tables reflect the analysis of financial liabilities by remaining contractual maturity dates:
2014 (Thousands of Euros)
Less than 1 month 1 to 3 months 3 months to 1 year 1 to 5 years More than 5 years Total
Loans and borrowings 27,361 14,924 47,607 224,126 367,581 681,599
Financial liabilities from bonds and debentures 38,891 - - 229,686 - 268,577
Finance lease payables 175 600 1,304 4,337 - 6,416
Trade and other payables 45,953 616,707 86,897 - - 749,557
Other financial liabilities - - - 30,910 - 30,910
Total 112,380 632,231 135,808 489,059 367,581 1,737,059
Derivative financial instruments - 1,345 17,148 8,785 - 27,278
Total 112,380 633,576 152,956 497,844 367,581 1,764,337
2013 (Thousands of Euros)
Less than 1 month 1 to 3 months 3 months to 1 year 1 to 5 years More than 5 years Total
Loans and borrowings 8,963 53,930 130,520 460,101 59,580 713,094
Financial liabilities from bonds and debentures - - - 263,914 - 263,914
Finance lease payables 158 604 1,499 6,262 - 8,523
Trade and other payables 55,164 646,065 52,028 - - 753,257
Other financial liabilities - - - 24,229 - 24,229
Total 64,285 700,599 184,047 754,506 59,580 1,763,017
Derivative financial instruments - 215 - 3,839 - 4,054
Total 64,285 700,814 184,047 758,345 59,580 1,767,071
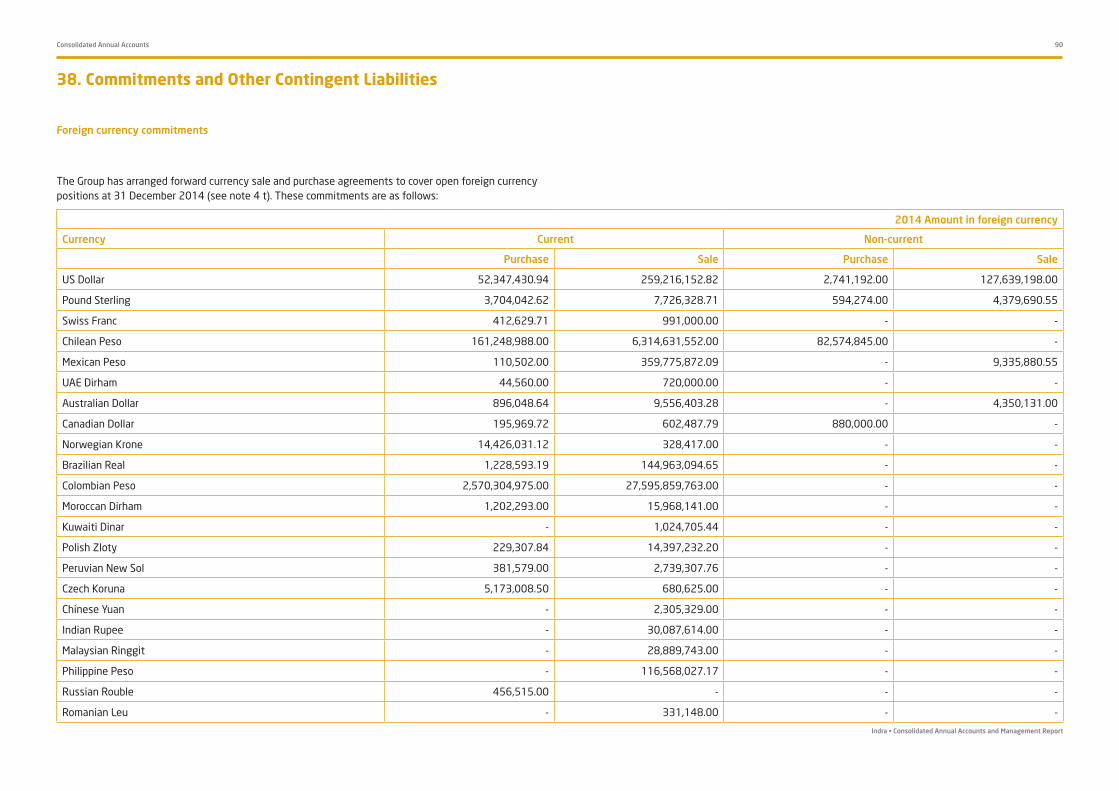
Indra • Consolidated Annual Accounts and Management Report
Consolidated Annual Accounts 90
38. Commitments and Other Contingent Liabilities
Foreign currency commitments
The Group has arranged forward currency sale and purchase agreements to cover open foreign currency positions at 31 December 2014 (see note 4 t). These commitments are as follows:
2014 Amount in foreign currency
Currency Current Non-current
Purchase Sale Purchase Sale
US Dollar 52,347,430.94 259,216,152.82 2,741,192.00 127,639,198.00
Pound Sterling 3,704,042.62 7,726,328.71 594,274.00 4,379,690.55
Swiss Franc 412,629.71 991,000.00 - -
Chilean Peso 161,248,988.00 6,314,631,552.00 82,574,845.00 -
Mexican Peso 110,502.00 359,775,872.09 - 9,335,880.55
UAE Dirham 44,560.00 720,000.00 - -
Australian Dollar 896,048.64 9,556,403.28 - 4,350,131.00
Canadian Dollar 195,969.72 602,487.79 880,000.00 -
Norwegian Krone 14,426,031.12 328,417.00 - -
Brazilian Real 1,228,593.19 144,963,094.65 - -
Colombian Peso 2,570,304,975.00 27,595,859,763.00 - -
Moroccan Dirham 1,202,293.00 15,968,141.00 - -
Kuwaiti Dinar - 1,024,705.44 - -
Polish Zloty 229,307.84 14,397,232.20 - -
Peruvian New Sol 381,579.00 2,739,307.76 - -
Czech Koruna 5,173,008.50 680,625.00 - -
Chinese Yuan - 2,305,329.00 - -
Indian Rupee - 30,087,614.00 - -
Malaysian Ringgit - 28,889,743.00 - -
Philippine Peso - 116,568,027.17 - -
Russian Rouble 456,515.00 - - -
Romanian Leu - 331,148.00 - -

Indra • Consolidated Annual Accounts and Management Report
Consolidated Annual Accounts 91
At 31 December 2013 the Group had the following commitments:
2013 Amount in foreign currency
Currency Current Non-current
Purchase Sale Purchase Sale
US Dollar 54,368,981 275,621,298 2,441,600 79,610,114
Pound Sterling 5,018,590 7,540,794 890,906 172,358
Swiss Franc 333,988 - - -
Chilean Peso 14,434,599 6,751,953,811 - 131,563,944
Mexican Peso 1,176,714 320,501,334 - 4,147,519
Argentine Peso - 41,560,462 - -
Malaysian Ringgit 519,797 15,335,770 - -
Australian Dollar 43,450 9,525,790 - 8,136,542
Canadian Dollar 762,462 3,298,739 100,000 -
Polish Zloty 415,446 17,897,389 -
Swedish Krona 1,100,000 - - -
Brazilian Real - 41,408,684 - -
Colombian Peso 4,763,538,938 32,714,898,648 - -
Moroccan Dirham - 11,432,695 - 2,498,318
Czech Koruna 7,945,762 - - -
Kuwaiti Dinar - 1,460,248 - -
Singapore Dollar - 1,912,681 - -
UAE Dirham - 7,319,955 - -
Peruvian New Sol 972,967 14,304,777 - -
South African Rand - 1,293,873 - -
Russian Rouble 5,407,515 114,546,713 - -
Philippine Peso 5,980,800 302,526,948 - -

Indra • Consolidated Annual Accounts and Management Report
Consolidated Annual Accounts 92
At 31 December 2014 and 2013 exchange rate hedges are valued as follows: Cash flow hedges also include interest rate swaps used by the Parent to manage its exposure to interest rate fluctuations, mainly on non-current bank loans arranged at floating rates. The fair value of these swaps, Euros 1,761 thousand (Euros 2,941 thousand in 2013) has been determined based on the market values of equivalent financial derivatives at the reporting date (see note 20).
The interest rate hedges arranged are swaps that ensure a fixed interest rate on three non-current loans bearing a floating interest rate arranged with two financial institutions. The swap and the loan interest have the same quarterly settlement dates.
Details of the swap are as follows:
The impact on the consolidated income statement in 2014 and 2013 was zero as the gain/loss from the financial instrument is offset by the loss/gain (opposite result) of the swap.
The information on foreign currency cash flow hedges is as follows:
‣ Income of Euros 459 thousand was reclassified from equity to the consolidated income statement (an expense of Euros 4,717 thousand in 2013).
‣ Correction costs (recognition of inefficiency) amount to Euros 947 thousand in 2014 (Euros 885 thousand in 2013).
‣ A gain of Euros 874 thousand attributable to the hedging instrument was recognised in 2014 and a loss of Euros 576 thousand in 2013 (same amount of gain/loss as the hedged item).
The years in which the cash flows from non-current foreign currency hedges are expected are as follows:
Thousands of Euros
2014 2013
Current Non-current Current Non-current
Exchange rate hedges Assets Liabilities Assets Liabilities Assets Liabilities Assets Liabilities
Cash flow hedges 4,731 7,722 14 7,458 (1,113) 202 4,387 3,831
Fair value hedges (3,953) 10,771 - 1,327 9,562 13 (2,444) 8
Total (note 10) 778 18,493 14 8,785 8,449 215 1,943 3,839
Thousands of Euros
2014 2013
Year Assets Liabilities Assets Liabilities
2016 14 5,707 1,134 898
2017 - 747 416 -
2018 - 320 166 -
2019 - 250 227 -
Total 14 7,024 1,943 898
Thousands of Euros
2014 2013
Hedgednotional amt,
Average fixed interest swap
Hedgednotional amt,
Average fixedinterest swap
Finalmaturity
Swappedfloating rate
103,462 1.60% 130,266 1.64% 2015 - 20173-month Euribor

Consolidated Annual Accounts 93
39. Operating leases
The Group has leased certain assets under operating leases from third parties.
The most significant lease contracts are as follows:
Operating lease payments have been recognised as an expense for the year as follows:
Others include all amounts lower than Euros 250 thousand.
Leased premisesContract signature
date
Contract expiry date
Review Review %Deposits
(thousands of Euros)
Avenida de Bruselas, 35 (Alcobendas)
1/1/02 30/6/22 July CPI 1,005
Anabel Segura, 7 (Alcobendas)
1/9/07 31/5/17 January CPI 423
Tanger, 120 (Barcelona) 1/7/05 1/1/17 July CPI 660
Acanto, 11 (Madrid) 1/1/07 31/12/12 enero I,G,P,C, 209
Tanger 98-108, Edificio Interface (Barcelona)
1/7/08 31/10/27 June CPI 371
Julian Camarillo, nº 16-20, Madrid
26/7/11 31/12/21 January CPI 192
Owner LocationContract
expiry date2014 expense 2013 expense
Testa Alcobendas (Madrid) 30/6/22 6,405 6,150
Alcobendas town council/Sogepima Alcobendas (Madrid) 31/5/17 2,151 3,097
Castellvi Group Barcelona 31/10/17 3,152 2,980
Gratan, S.L. Barcelona 1/1/17 1,278 1,269
Obenque Madrid 31/12/21 1,343 1,184
Mapfre Vida, S.A. Madrid 29/2/16 737 894
Rentiber InternacionalSan Fernando de Henares (Madrid)
31/3/17 746 746
Grupo Integral de Desarrollo Inmobiliario Mexico City (Mexico) 31/12/22 780 728
Portocarrio, S.L. Madrid 7/4/16 692 685
Auris Andino Inversiones Inmobiliarias Avda, del Valle (Chile) 31/1/16 639 633
Mapfre Vida, S.A. Madrid 30/4/17 516 -
Colombiana de Televisión, S.A. Bogota (Colombia) 30/11/14 503 -
Edificio De Alcobendas, S.A. Alcobendas (Madrid) 31/5/15 431 463
Inmobiliaria Financiera Bogota (Colombia) 31/8/17 272 383
General de Edificios y Solares La Coruña 31/5/14 401 366
Red Tenc. Servicios de Asistencia Sanitaria Málaga 31/8/21 364 355
Fundación P. Cientifico Universidad de Salamanca
Salamanca 31/10/17 351 322
Alleanza Toro Spa Rome (Italy) 30/9/16 360 319
Inmoan, S.L. Torrejon De Ardoz - Madrid 31/10/19 255 275
Veintisiete, S.L. Barcelona 31/10/15 286 -
Farrag, S.L. Cordovilla (Navarra) 30/6/22 286 -
Gasel, S.A. Paraná (Brazil) 31/12/15 279 -
Morera y Vallejo Patrimonial, S.A. Seville 31/12/19 269 -
Sprilur, S.A. Erandio (Vizcaya) 31/5/19 267 -
Fernando Gonzalez Tovar Mexico City (Mexico) 31/7/15 258 -
Fossgal, S.A. Buenos Aires (Argentina) 31/12/15 258 -
Other 7,540 11,835

Indra • Consolidated Annual Accounts and Management Report
Consolidated Annual Accounts 94
40.Remuneration of the Board of Directors and Senior Management
1. Remuneration of board members1.1 Remuneration for general oversight and decision-making duties
The board members receive remuneration for acting as such based on their involvement in the different administrative bodies.
This remuneration was established based on best practices and recommendations in this area and taking into account the board regulations in that the remuneration of independent directors should be an incentive to reward dedication and responsibility, but must not compromise their independence. Full explanations of this matter are provided in the 2014 Annual Remuneration Report that the Parent publishes on the same date as the annual accounts.
The board members' remuneration for their general supervisory and collective decision-making functions consists solely of a fixed amount based on their involvement in the different administrative bodies, which is all received in cash based on the following annual amounts: Euros 100 thousand for members of the board of directors; Euros 30 thousand for Delegate Committee members; Euros 50 thousand for Audit and Compliance Committee members; and Euros 30 thousand for Appointments, Remuneration and Corporate Governance Committee members. The chairperson of each body receives 1.5 times these amounts. Based on the present number of members of each body the average annual income is approximately Euros 150 thousand per board member.
The board also agreed that if the Parent failed to meet its published annual targets, the members’ remuneration would be reconsidered and submitted once again to the shareholders.
An itemised breakdown of total remuneration received by the members of the board of directors of the Parent in 2014 and 2013 in relation to the duties of oversight and decision-making is as follows:
Remuneration of board members (€) 2014
Fixed amount
Board member Board of directors
Delegatecommittee
Audit and
compliance
committee
Appointments,remuneration and
corporate governancecommittee
Total
I. AGUILERA 100,000 -- 50,000 -- 150,000
J. DE ANDRÉS 100,000 45,000 -- -- 145,000
J.C. APARICIO 100,000 -- 50,000 -- 150,000
CASA GRANDE DE CARTAGENA(1) 58,333 17,500 -- -- 75,833
D. GARCÍA-PITA 100,000 -- -- 45,000 145,000
L. LADA 100,000 30,000 50,000 -- 180,000
J. MARCH 100,000 30,000 -- 30,000 160,000
S. MARTÍNEZ-CONDE 100,000 -- 50,000 -- 150,000
A. MENÉNDEZ 100,000 30,000 -- 30,000 160,000
J. MONZON 150,000 -- -- -- 150,000
M. ORIOL 100,000 -- -- 30,000 130,000
I. SANTILLANA 100,000 30,000 -- 30,000 160,000
R. SUGRAÑES 100,000 30,000 -- -- 130,000
A. TEROL 100,000 30,000 75,000 -- 205,000
TOTAL 1,408,333 242,500 275,000 165,000 2,090,833
Average remuneration per board member (13.6 members) 153,738

Indra • Consolidated Annual Accounts and Management Report
Consolidated Annual Accounts 95
(1) En representación de Liberbank. Consejero hasta junio 2013 (2) Consejero desde octubre 2013 (3) En representación de Banco Financiero y de Ahorros. Consejero hasta agosto 2013 (4) Consejero desde julio 2013
Remuneration of board members (€) 2013
Fixed amount
Board member Board of directors
Delegatecommittee
Audit and
compliance
committee
Appointments,remuneration and
corporate governancecommittee
Total
ADM, VALTENAS (1) 50,000 15,000 -- -- 65,000
I, AGUILERA 100,000 -- 8,333 25,000 133,333
J, DE ANDRÉS 100,000 45,000 -- -- 145,000
J,C, APARICIO (2) 25,000 -- 8,333 -- 33,333
CASA GRANDE DE CARTAGENA 100,000 15,000 25,000 -- 140,000
D, GARCÍA-PITA 100,000 25,000 -- 45,000 170,000
MEDIACION Y DIAGNOSTICOS (3) 66,667 20,000 -- 20,000 106,667
L, LADA 100,000 30,000 50,000 -- 180,000
J, MARCH 100,000 30,000 -- 30,000 160,000
S, MARTÍNEZ-CONDE (4) 50,000 -- 25,000 -- 75,000
A, MENÉNDEZ (2) 25,000 5,000 -- 5,000 35,000
J, MONZON 150,000 -- -- -- 150,000
M, ORIOL 100,000 25,000 -- 5,000 130,000
PARTICIPACIONES Y CARTERA DE INVERSION (3)
66,667 -- 33,333 -- 100,000
I, SANTILLANA 100,000 5,000 41,667 5,000 151,667
R, SUGRAÑES 100,000 30,000 -- 25,000 155,000
A, TEROL 100,000 5,000 75,000 -- 180,000
TOTAL 1,433,333 250,000 266,667 165,000 2,110,000
Average remuneration per board member (13.8 members) 152,899

Indra • Consolidated Annual Accounts and Management Report
Consolidated Annual Accounts 96
During 2014 and 2013 no options on Parent shares were granted to the members of the board of directors, nor did they exercise any options on Parent shares. At the 2013 and 2014 year ends the members of the board of directors do not hold any Parent share options.
In 2014 and 2013 the members of the board of directors have not received any benefits or remuneration other than those disclosed above for the duties of oversight and decision-making. Neither the Parent nor any of the consolidated group companies have assumed any pension commitments on behalf of directors for the fulfilment of those duties or extended any loans or advances to the members of the board.
Without prejudice to the fact that, as indicated, the remuneration of the board members for the duties of oversight and collective decision-making is settled entirely in cash, all of the board members have informed the Parent of their decision to use a significant part of the sum received (currently equivalent to approximately 50% of the net remuneration) to purchase Indra shares and have committed to retain ownership of these shares until the end of their mandate. The Spanish National Securities Market Commission was informed of this decision in a price sensitive information report filed on 28 July 2011, and the members of the board have fulfilled these commitments since then.
1.2 Remuneration of executive directors for administration and management duties delegated by the board of directorsIrrespective of the remuneration indicated in section 1.1. above, executive directors earn additional remuneration as a result of their contractual relationship with the Parent for performing their executive functions. This remuneration is based on the same criteria and includes the same components as that received by the rest of the Parent’s senior management personnel. As such, although it forms part of the remuneration of the board of directors pursuant to article 27 of the articles of association, for the sake of clarity and to avoid unnecessary repetition this remuneration is explained along with that of the other senior management personnel in section 2 below.
2. Remuneration of senior management 2.1. Characteristics and components of the remuneration systemThe remuneration of the Company’s senior management, comprising the executive directors and general managers, is determined on an individual basis by the board of directors, based on proposals by the Appointments, Remuneration and Corporate Governance Committee.
Since 2002 the Parent has established the remuneration framework for senior management for periods of three years. The current remuneration framework was approved by the board of directors in February 2014 and is valid for 2014, 2015 and 2016.
The current remuneration of senior management includes the following components:
(I) Fixed remuneration, received entirely in cash and which does not vary, other than in justified exceptional cases, for the three year period.
(II) Variable annual remuneration, paid entirely in cash and determined at each year end based on a percentage of the fixed annual remuneration established individually for each senior executive based on the fulfilment of budget and targets as well as the result of their individual management. These percentages range from 50-100% of the fixed annual remuneration.
To determine the extent to which each senior executive has reached his or her goals, the Company weighs up overall targets and the executive’s quantitative and qualitative individual targets for his or her area of responsibility, using metrics for the quantitative parameters and taking into consideration market performance compared to the main companies in the sector.
(III) Remuneration in kind mainly consists of a life insurance policy, health insurance and use of a car.
(IV)Share-based payments, the amount of which is determined annually based on the evaluation of each senior executive's management performance in the prior year, as indicated previously.
The shares are awarded on two or three dates each year during 2014-2016.
The gross amount assigned to each senior executive for this share-based payment is between 37.5% and 100% of their fixed remuneration. The shares are awarded at market value and the number of shares depends on the share price at each payment date. The senior executive's ownership of the shares received is not consolidated until the last day of the remuneration period, 31 December 2016. Therefore should senior executives leave the Parent for reasons attributable to them they must return all the shares received in the period. In addition to the above, senior management cannot transfer shares received until three years after the date those shares were awarded.

Indra • Consolidated Annual Accounts and Management Report
Consolidated Annual Accounts 97
(v) The Medium-term Incentive, paid entirely in cash has been established at between 1.9 to 3 times fixed annual remuneration, based on the achievement of medium-term strategic objectives set for this period by the board of directors. It also takes into consideration the Company’s comparative performance in respect of the markets where it operates and the main comparable companies in the sector. The current Medium-term Incentive is accrued at the end of the three-year period and, where applicable, will be settled after the 2016 year end.
Additionally the Parent makes an annual contribution to the early retirement and long-term savings scheme externalised to an insurance company as an endowment life insurance. Senior management has the right to receive the accumulated amount in the early retirement and long-term savings scheme at 62 or earlier if they leave the Parent for reasons not attributable to themselves. The annual contributions are determined as a percentage of the total annualised remuneration of the senior executive and are within the range of 12-17% of the remuneration.
These remuneration components are explained in detail in section A of the Annual Remuneration Report, including information on the targets set for senior management in the case of variable remuneration as well as the procedures and methodology to measure achievement.
2.2. Remuneration amountsIn 2014 the Company had nine senior management personnel. Details are as follows:
ChairmanManaging Director Corporate General Managers
General Managers of Operations
The amounts of the remuneration of the executive directors are as follows:
Javier MonzónJavier de AndrésJuan Carlos BaenaEmma FernándezJuan Tinao
Emilio DíazRafael GallegoSantiago RouraCarlos Suárez
(€M) Chairman Managing Director
2014 2013 2014 2013
Fixed remuneration 1,000 1,000 550 450
Variable remuneration 0 800 0 360
Remuneration in kind 125 54 35 20
Share-based payment 1,000 1,000 550 550
Total 2,125 2,854 1,135 1,380

Indra • Consolidated Annual Accounts and Management Report
Consolidated Annual Accounts 98
The annualised amount of the prevailing Medium-term Incentive (2014-2016) is Euros 1,000 thousand in the case of the Chairman and Euros 550 thousand for the Managing Director. In 2014 the Parent made a provision of Euros 775 thousand for this item (Euros 500 thousand for the Chairman and Euros 275 thousand for the Managing Director).
The total Medium-term Incentive for the previous period (2011-2013), which was paid in March 2014, was Euros 2,550 thousand in the case of the Chairman and Euros 1,148 thousand for the Managing Director. These amounts are equivalent to an annual amount of Euros 850 thousand and Euros 382.5 thousand, respectively in each of the three years of the prior period.
The amounts corresponding to other senior management that are not executive directors are as follows
No share options were extended to senior management personnel during 2013 or 2014 and senior management did not take up any options on Parent shares during the period.
In 2014 and 2013 members of senior management did not receive any benefits, compensation or remuneration other than those indicated in this note. Neither the Parent nor any of the Group companies has assumed any pension commitments on behalf of or extended any loans or advances to senior management.
3 Contractual framework for executive directors and senior managementThe Parent´s executive directors have no right to any compensation in the event of termination of their contractual relationship with the Parent. Their contracts establish a three month notice period in the case of termination by the Company, which if not respected, must be compensated by an amount equivalent to their total annualised salary corresponding to the notice period in question.
The present General Managers have a transitional right to compensation in 2014, which decreases over time, of between 0.4 and 2 times their total annualised salary. This right will gradually be reduced until extinguished when the sum of: (i) the cumulative amount for each of them in the early retirement and long -term savings scheme and (ii) the corresponding compensation receivable in the event of unfair dismissal for their previous ordinary employment relationship, reaches a gross amount equivalent to 45 days of the annualised salary per year of service calculated from the date of joining the Parent, up to a maximum of 42 monthly payments.
The Executive Directors and General Managers of operations have signed non-compete clauses applicable for two years from the termination of their contractual relationship. In return they are respectively entitled to total compensation of 0.75 times and 0.5 times their total annualised remuneration for each year of compliance.
The annualised amount of the prevailing Medium-term Incentive (2014-2016) for all seven General Managers totals Euros 1,950 thousand. In 2014 the Parent made a provision of Euros 975 thousand for this item for all of senior management as a whole.
The total Medium-term Incentive for the previous period (2011-2013), which was paid in March 2014 was Euros 4,675 thousand, equivalent to an annual amount of Euros 1,558 thousand in each of the three years in the period.
The gross amounts of share-based payments indicated in the above tables led to the awarding of the following shares: (i) In 2014, 46,535 shares to the Chairman, 26,355 shares to the Managing Director and a combined 74,963 shares to the seven General Managers and (ii) In 2013 49,204 shares to the Chairman and 22,910 shares to the Managing Director and a combined 83,242 shares to the seven General Managers.
(€M) 2014 2013
Fixed remuneration 2,800 2,720
Variable remuneration 722 1,314
Remuneration in kind 294 211
Share-based payment 1,410 1,410
Total 5,226 5,655

Indra • Consolidated Annual Accounts and Management Report
Consolidated Annual Accounts 99
41. Information Provided by the Members of the Board of Directors as Required by Article 229 of the Spanish Companies Act
43. Environmental Information
42. R&D&Innovation Activities
After reviewing the information reported by the secretary to the board, the directors of the Parent and their related parties have had no conflicts of interest and are not in a situation of conflict of interest requiring disclosure in accordance with article 229 of the Revised Spanish Companies Act.
The Group’s activities have not changed significantly in comparison with prior years, and therefore the environmental impact continues to be low. Consequently, the directors consider that no significant contingencies exist in relation to the protection or improvement of the environment and therefore have made no related provision for environmental liabilities and charges in 2013 or 2014.
Similarly, no significant assets have been allocated to protect and improve the environment, and no material expenses of this nature have been incurred during the year. Consequently, the Group has neither requested nor received any environmental grants during the years ended 31 December 2014 and 2013.
R&D and innovation expenditure is incurred on a significant part of the activities carried out by the Indra Group. These expenses are taken to the consolidated income statement when they are accrued (see note 4).
R&D and innovation project expenses totalled Euros 195,122 thousand, including capitalised projects (see note 9), in 2014, equivalent to 6.6% of the Group’s total sales for the year. R&D&innovation expenses incurred by the Parent account for approximately 98% of the Group's total expenses of this nature for the year.
In 2013, R&D&innovation expenses amounted to Euros 195,334 thousand, equivalent to 6.7% of total Group sales.
Notwithstanding the above, one of the core pillars of Indra’s Corporate Governance is its commitment to protecting the environment during the course of its activities. This has been seen in the adoption of an environmental management system based on UNE-EN ISO 14001, implemented in the Group's various work centres. Since the outset the greatest effort has been made in the facilities of the most important centres of the Parent. The UNE-EN ISO 14001 certification was awarded in prior years to the work centres in Arroyo de la Vega (Avda. de Bruselas - Alcobendas), San Fernando de Henares, Torrejón de Ardoz and Triángulo (c/ San Julián - Alcobendas), Aranjuez, Barcelona (Roc Boronat), Barcelona -Interface, Avda. de Arteixo (La Coruña), Anabel Segura (Alcobendas-Madrid), Ciudad Real, C/ Aviación (Seville), Erandio (Bilbao), Baracaldo (Bilbao), C/ Alcalá (Madrid), C/ Julián Camarillo (Madrid), Bembibre (León), c/ Severo Ochoa (Campanillas – Málaga) and c/ Adaja (Villamayor de la Armuña – Salamanca). In 2014 the following work centres have also joined this list; Fuente Alamo (Cartagena – Murcia) and Puerto de Santa Maria, where activities of Indra Sistemas, S.A. are carried out and Cr Prado de la Torre (Bollullos de la Mitación – Sevilla) where activities of CAYMASA are carried out.
In addition to these two companies, the following companies had already been certified to operate in the aforementioned centres; Indra Sistemas de Seguridad, S.A., Indra Software Labs, S.L., Indra BPO, S.L., Indra BPO Servicios, S.L. S.L., Indra Emac, S.A. and Advanced Logistics Group, S.A.
With regard to international subsidiaries, an environmental management system based on UNE-EN ISO 14001 has been implemented in six centres in Colombia where Indra Colombia LTDA and Indra Sistemas S.A. Sucursal Colombia carry out activity, in two centres of Indra Sistemas Portugal, S.A. and one centre of Indra Australia Pty Ltd. in Australia. Also as part of the Indra Group’s Globalisation Plan steps have been taken to implement the system in three more centres, in Brazil, Italy and Mexico.
Additionally, in 2014 a Strategic Environmental Plan for Italy has been added to those already in place at the following international subsidiaries: Portugal, Colombia, Brazil, Mexico, Chile and Peru, in line with Indra’s Global Strategic Environmental Plan. Also the Group continued with a number of initiatives relating to energy efficiency and “green IT” in its installations. Furthermore, the objective of reducing the greenhouse gas emissions generated on carrying out our activities in the Indra Group's installations was changed and is now part of a more long-term strategy established for 2014-2020.

Indra • Consolidated Annual Accounts and Management Report
Consolidated Annual Accounts 100
44. Audit Fees
45. Related Party Transactions
KPMG Auditores, S.L., the auditors of the consolidated annual accounts of the Group, and other companies affiliated with KPMG International have invoiced the following net fees for professional services during the years ended 31 December 2014 and 2013:
Related party transactions with significant shareholders and board members do not represent, either individually or collectively, a significant amount of the Parent’s revenues or statement of financial position at 31 December 2014 or 2013. All of these transactions took place in the normal course of the Parent’s business and in market conditions, and were authorised by the board of directors as required by its regulations. However, it is Parent policy to publish detailed and transparent information on these transactions.
During 2014 and 2013, commercial, financial and professional services transactions were carried out with significant shareholders at that time or with their related parties, as well as with companies linked to the board member Ms. De Oriol.
Details of related party transactions in 2014 and 2013, by type of transaction, are shown in the table below.
The amount shown in the above table includes the total fees for audit and other services rendered in 2014 and 2013, irrespective of the date of invoice.
Other auditors charged total fees for audit services of Euros 124 thousand in 2014 (Euros 91 thousand in 2013).
Thousands of Euros
2014 2013
KPMGAuditores,
S,L,
Affiliates of KPMG
InternationalTotal
KPMGAuditores,
S,L,KPMG
Europe, LLP Other KPMG Total
Audit services 513 739 1,252 537 17 646 1,200
Other services 15 225 240 37 - 253 290
528 964 1,492 574 17 899 1,490
2014 (Thousands of Euros)
Type of transactionWith
shareholdersWith board members
With other parties
Total at 31.12.2014
Sale of goods and services 11,041 - - 11,041
Purchase of goods and services 424 1,434 - 1,858
Expenses for financial services 6 - - 6
11,471 1,434 - 12,905
2013 (Thousands of Euros)
Type of transactionWith
shareholdersWith board members
With other parties
Total at 31.12.2013
Sale of goods and services 7,926 - 2,033 9,959
Purchase of goods and services 382 2,582 - 2,964
Finance income received 83 - - 83
Expenses for financial services 211 - 82 293
8,602 2,582 2,115 13,299
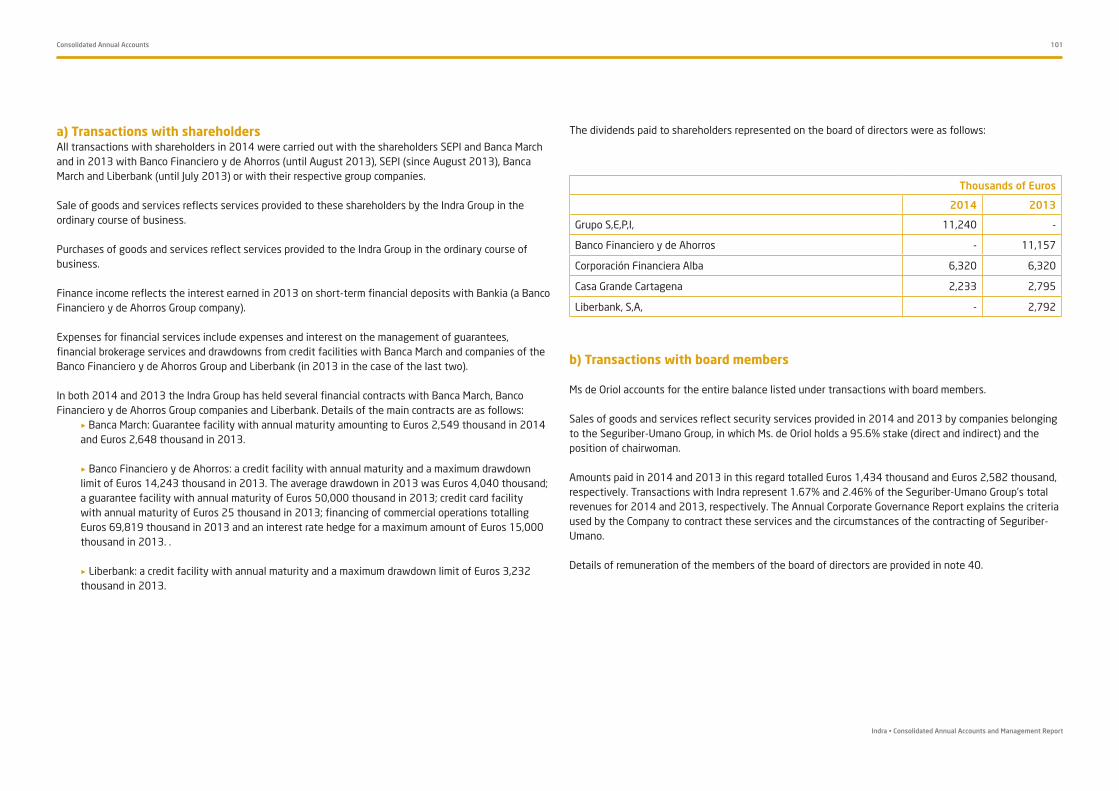
Indra • Consolidated Annual Accounts and Management Report
Consolidated Annual Accounts 101
a) Transactions with shareholdersAll transactions with shareholders in 2014 were carried out with the shareholders SEPI and Banca March and in 2013 with Banco Financiero y de Ahorros (until August 2013), SEPI (since August 2013), Banca March and Liberbank (until July 2013) or with their respective group companies.
Sale of goods and services reflects services provided to these shareholders by the Indra Group in the ordinary course of business.
Purchases of goods and services reflect services provided to the Indra Group in the ordinary course of business.
Finance income reflects the interest earned in 2013 on short-term financial deposits with Bankia (a Banco Financiero y de Ahorros Group company).
Expenses for financial services include expenses and interest on the management of guarantees, financial brokerage services and drawdowns from credit facilities with Banca March and companies of the Banco Financiero y de Ahorros Group and Liberbank (in 2013 in the case of the last two).
In both 2014 and 2013 the Indra Group has held several financial contracts with Banca March, Banco Financiero y de Ahorros Group companies and Liberbank. Details of the main contracts are as follows: ‣ Banca March: Guarantee facility with annual maturity amounting to Euros 2,549 thousand in 2014
and Euros 2,648 thousand in 2013.
‣ Banco Financiero y de Ahorros: a credit facility with annual maturity and a maximum drawdown limit of Euros 14,243 thousand in 2013. The average drawdown in 2013 was Euros 4,040 thousand; a guarantee facility with annual maturity of Euros 50,000 thousand in 2013; credit card facility with annual maturity of Euros 25 thousand in 2013; financing of commercial operations totalling Euros 69,819 thousand in 2013 and an interest rate hedge for a maximum amount of Euros 15,000 thousand in 2013. .
‣ Liberbank: a credit facility with annual maturity and a maximum drawdown limit of Euros 3,232 thousand in 2013.
The dividends paid to shareholders represented on the board of directors were as follows:
b) Transactions with board members
Ms de Oriol accounts for the entire balance listed under transactions with board members.
Sales of goods and services reflect security services provided in 2014 and 2013 by companies belonging to the Seguriber-Umano Group, in which Ms. de Oriol holds a 95.6% stake (direct and indirect) and the position of chairwoman.
Amounts paid in 2014 and 2013 in this regard totalled Euros 1,434 thousand and Euros 2,582 thousand, respectively. Transactions with Indra represent 1.67% and 2.46% of the Seguriber-Umano Group’s total revenues for 2014 and 2013, respectively. The Annual Corporate Governance Report explains the criteria used by the Company to contract these services and the circumstances of the contracting of Seguriber-Umano.
Details of remuneration of the members of the board of directors are provided in note 40.
Thousands of Euros
2014 2013
Grupo S,E,P,I, 11,240 -
Banco Financiero y de Ahorros - 11,157
Corporación Financiera Alba 6,320 6,320
Casa Grande Cartagena 2,233 2,795
Liberbank, S,A, - 2,792

Indra • Consolidated Annual Accounts and Management Report
Consolidated Annual Accounts 102
c) Transactions with other related partiesAll transactions with other related parties were conducted with Banco Inversis until August 2013, when it ceased to be classed within “other related parties” as a result of the sale of Banco Financiero y de Ahorros’s stake in Indra.
d) Transactions with senior managementNo transactions with senior management personnel or their related parties have taken place in 2014 or 2013.
Details of senior management remuneration are provided in note 40.
e) Transactions with associates and joint venturesIn 2014 and 2013 the transactions performed with joint ventures through associates were as follows:
Note: Receivables and payables comprise the amounts recognised at 31 December each year.
On 12 March 2013 the Parent acquired 100% of the capital of G-nubila Technology, S.L.U. and G-nubila Colombia SAS from its associate Oyauri Investment for Euros 2,942 thousand. In compliance with the terms of the agreement, Euros 290 thousand were paid in cash and the remainder, Euros 2,652 thousand, is payable as a variable price due in 2018.
The assets, liabilities, income and expenses of transactions performed through the temporary joint ventures, which in 2014 and 2013 were consolidated according to the criteria explained in note 2, are as follows:
Appendix II provides details of the temporary joint ventures consolidated by the Group.
46. Events after the Reporting Period
On 29 January 2015 the Spanish Securities Market Commission (CNMV) was informed that in a board meeting held on that date, subsequent to receiving a report from the Appointments, Remuneration and Corporate Governance Committee, the Parent's board of directors unanimously agreed the following:
1- To appoint Mr. Fernando Abril-Martorell Hernández as a board member by co-option.
2- To accept the resignation of Mr. Javier Monzón de Cáceres, from the positions of Chairman, board member and Chairman of the Strategy Committee of the Parent at the request of the board of directors after his executive functions were revoked.
3- To appoint Mr. Abril-Martorell as Chairman of the board and as a member of the Strategy Committee as an Executive director.
4- To designate Mr. Javier Monzón as Honorary Chairman of Indra.
2014 (Thousands of Euros)
Receivables Payables Income Expenses
Associates 5,674 13,218 10,950 2,063
5,674 13,218 10,950 2,063
Thousands of Euros
2014 2013
Non-current assets 1,690 2,582
Current assets 33,892 29,788
Non-current liabilities (6,221) (13,925)
Current liabilities (28,614) (17,620)
Revenues (55,878) (29,291)
Outsourcing and other expenses 55,131 28,466
- -
2013 (Thousands of Euros)
Receivables Payables Income Expenses
Associates 956 16,544 10,690 2,079
956 16,544 10,690 2,079

Indra • Consolidated Annual Accounts and Management Report
Consolidated Annual Accounts 103
Indra Sistemas, S.A. and Subsidiaries Details of Group companies at 31 December 2014
This appendix forms an integral part of notes 1 and 5 to the consolidated annual accounts, in conjunction with which it should be read.
1.- Parent
Indra Sistemas, S.A.Avenida de Bruselas, 35 Alcobendas (Madrid)
Design, development, production, integration and maintenance of systems, solutions and services based on information technology: computing, electronics and communications.
2.- Subsidiaries
Indra Emac, S.A. Calle Mar Egeo, 4 Pol.Ind.1 San Fernando de Henares (Madrid)
Engineering and maintenance of aerial defence systems and other related areas.
Indra Sistemas de Seguridad, S.A.Carrer de Roc Boronat, 133 (Barcelona)
Diseño, desarrollo, integración y mantenimiento de sistemas y soluciones destinados a la vigilancia y control de seguridad de instalaciones.
Indra Sistemas de Comunicaciones Seguras, S.L.Avenida de Bruselas, 35 Alcobendas (Madrid)
Design, development, integration and maintenance of systems and solutions for surveillance and installation security.
Inmize Capital, S.L.Avenida de Bruselas, 35 Alcobendas (Madrid)
Research, engineering, design, manufacturing, development, sale, installation, maintenance and repair of security equipment, devices and systems for data communication, encoding systems, encrypting, signals and command and control centres.
Inmize Sistemas, S.L.Avenida de Bruselas, 35 Alcobendas (Madrid)
Management, engineering, marketing and sale of defence systems.
Indra Software Labs, S.L.Avenida de Bruselas, 35 Alcobendas (Madrid)
Management, engineering, marketing and sale of defence systems.
Teknatrans Consultores, S.L.Portuetxe, 23, (San Sebastián)
Technical architecture and engineering services.
COMPANY REGISTERED OFFICE ACTIVITY

Consolidated Annual Accounts 104
Indra SI, S.A. Buenos Aires (Argentina)Design, development, production, integration and maintenance of systems, solutions and services based on information technology: computing, electronics and communications.
Politec Argentina, S.A. Buenos Aires (Argentina)Design, development, production, integration and maintenance of systems, solutions and services based on information technology: computing, electronics and communications.
Azertia Tecnologías de la Información Argentina S.A.
Buenos Aires (Argentina)Design, development, production, integration and maintenance of systems, solutions and services based on information technology: computing, electronics and communications.
Computación Ceicom, S.A. Buenos Aires (Argentina)Data processing, consultancy services and technical assistance in systems analysis, development and implementation of programmes for computing equipment.
Indra Company Brasil Tecnologia, Ltda. Sao Paulo (Brazil)Design, development, production, integration and maintenance of systems, solutions and services based on information technology: computing, electronics and communications.
Indra Brasil Soluciones y Servicios, S.A. Sao Paulo (Brazil)Design, development, production, integration and maintenance of systems, solutions and services based on information technology: computing, electronics and communications.
Search Informatica Ltda Brasilia (Brazil)Advisory and consultancy services for IT-based business management, software development and the sale of equipment and software.
Ultracom Consultoría em Tecnologia da InformaÇao Ltda
Sao Paulo (Brasil)Customisation, development, adaptation and maintenance of IT programs and systems. IT advisory, consultancy and training services; IT localisation services, software installation, implementation and technical support services; software design and the sale of IT materials and accessories.
Indra Tecnología Brasil LTDA Brasilia (Brasil)Design, development, production, integration and maintenance of systems, solutions and services based on information, technology: computing, electronics and communications for the air traffic, defence, ground transport and traffic, shipping and railway sectors and for electoral use.
Indra Colombia LTDA. Bogotá (Colombia)Design, development, production, integration and maintenance of systems, solutions and services based on information technology: computing, electronics and communications.
Indra Sistemas Chile, S.A. Santiago de Chile (Chile)Design, development, production, integration and maintenance of systems, solutions and services based on information technology: computing, electronics and communications.
Soluziona C & S Holding, S.A. (Chile) Santiago de Chile (Chile)Design, development, production, integration and maintenance of systems, solutions and services based on information technology: computing, electronics and communications.
Soluziona Guatemala, S.A. Guatemala (Guatemala)Design, development, production, integration and maintenance of systems, solutions and services based on information technology: computing, electronics and communications.
COMPANY REGISTERED OFFICE ACTIVITY
This appendix forms an integral part of notes 1 and 5 to the consolidated annual accounts, in conjunction with which it should be read.
Indra Sistemas, S.A. and Subsidiaries Details of Group companies at 31 December 2014

Consolidated Annual Accounts 105
Indra Sistemas México S.A. de C.V. Mexico City (Mexico)Design, development, production, integration and maintenance of systems, solutions and services based on information technology: computing, electronics and communications.
Azertia Tecnología de la Información México S.A.C.V.
Mexico City (Mexico)Design, development, production, integration and maintenance of systems, solutions and services based on information technology: computing, electronics and communications.
Soluziona Mejico S.A. de C.V. Mexico City (Mexico)Design, development, production, integration and maintenance of systems, solutions and services based on information technology: computing, electronics and communications.
Indra Panamá, S.A. Panama (Panama)Design, development, production, integration and maintenance of systems, solutions and services based on information technology: computing, electronics and communications.
Indra Company Perú S.A.C. Lima (Peru)Design, development, production, integration and maintenance of systems, solutions and services based on information technology: computing, electronics and communications.
Indra Perú, S.A. Lima (Peru)Design, development, production, integration and maintenance of systems, solutions and services based on information technology: computing, electronics and communications.
Soluciones y Servicios Indra Company Uruguay, S.A.
Montevideo (Uruguay)Design, development, production, integration and maintenance of systems, solutions and services based on information technology: computing, electronics and communications.
Indra USA Inc. Philadelphia (USA)Design, development, production, integration and maintenance of systems, solutions and services based on information technology: computing, electronics and communications.
Indra USA Inc. Orlando (USA)Design, development, production, integration and maintenance of systems, solutions and services based on information technology: computing, electronics and communications.
Indra USA IT Services Atlanta (USA)Design, development, production, integration and maintenance of systems, solutions and services based on information technology: computing, electronics and communications.
Azertia Gestión de Centros Venezuela S. A. Caracas (Venezuela)Design, development, production, integration and maintenance of systems, solutions and services based on information technology: computing, electronics and communications and document management services.
Soluziona, S.P. C.A. (Venezuela) Caracas (Venezuela)Design, development, production, integration and maintenance of systems, solutions and services based on information technology: computing, electronics and communications.
Indra Italia Spa Rome (Italy)Design, development, production, integration and maintenance of systems, solutions and services based on information technology: computing, electronics and communications.
COMPANY REGISTERED OFFICE ACTIVITY
This appendix forms an integral part of notes 1 and 5 to the consolidated annual accounts, in conjunction with which it should be read.
Indra Sistemas, S.A. and Subsidiaries Details of Group companies at 31 December 2014

Consolidated Annual Accounts 106
Indra Czech Republic s.r.o. Prague (Czech Republic)Design, development, production, integration and maintenance of systems, solutions and services based on information technology: computing, electronics and communications.
Indra Eslovakia, a.s. Bratislava (Slovakia)Design, development, production, integration and maintenance of systems, solutions and services based on information technology: computing, electronics and communications.
Indra France S.A.S. Paris (France)Design, development, production, integration and maintenance of systems, solutions and services based on information technology: computing, electronics and communications.
Indra Hungary L.L.C. Debrecen (Hungary)Diseño, desarrollo, producción, integración y mantenimiento de sistemas, soluciones y servicios basados en el uso de tecnologías de la información: informática, electrónica y comunicaciones.
Indra Sisteme S.R.L. Chisinau (Moldavia)Design, development, production, integration and maintenance of systems, solutions and services based on information technology: computing, electronics and communications.
Indra Sistemas Polska S.p.z.o.o Warsaw (Poland)Design, development, production, integration and maintenance of systems, solutions and services based on information technology: computing, electronics and communications.
Indra Sistemas Portugal, S.A. Lisbon (Portugal)Design, development, production, integration and maintenance of systems, solutions and services based on information technology: computing, electronics and communications.
Elektrica Soluziona S.A. (Rumania) Bucharest (Romania)Design, development, production, integration and maintenance of systems, solutions and services based on information technology: computing, electronics and communications.
Indra Ucrania L.L.C. Kiev (Ukraine)Design, development, production, integration and maintenance of systems, solutions and services based on information technology: computing, electronics and communications.
Indra Kazakhstan Engineering Llp Astana (Kazakhstan)Design, development, production, integration and maintenance of systems, solutions and services based on information technology: computing, electronics and communications.
Indra Turkey Teknolojileri Çözümleri Anonim Sirketi
Istanbul (Turkey)Design, development, production, integration and maintenance of systems, solutions and services based on information technology: computing, electronics and communications.
Indra Beijing Information Technology Systems Co. Ltd.
Beijing (China)Design, development, production, integration and maintenance of systems, solutions and services based on information technology: computing, electronics and communications.
Indra Radar Technology (Tianjin) Co., Ltd. Tianjin (China)Design, development, production and maintenance of navigation and landing support and air traffic control systems.
Indra Philippines, Inc. Quezon City (Philippines)Design, development, production, integration and maintenance of systems, solutions and services based on information technology: computing, electronics and communications.
Indra Technology Solutions Malasya Sdn Bhd Kuala Lumpur (Malaysia)Design, development, production, integration and maintenance of systems, solutions and services based on information technology: computing, electronics and communications.
COMPANY REGISTERED OFFICE ACTIVITY
This appendix forms an integral part of notes 1 and 5 to the consolidated annual accounts, in conjunction with which it should be read.

Consolidated Annual Accounts 107
PT Indra Indonesia Jakarta (Indonesia)Design, development, production, integration and maintenance of systems, solutions and services based on information technology: computing, electronics and communications.
Indra Sistemas India Private Limited New Delhi (India)Design, development, production, integration and maintenance of systems, solutions and services based on information technology: computing, electronics and communications.
Indra Bahrain Consultancy SPC Manama (Bahrain)Design, development, production, integration and maintenance of systems, solutions and services based on information technology: computing, electronics and communications.
Indra Arabia Company Ltd. Jeddah (Saudi Arabia)Design, development, production, integration and maintenance of systems, solutions and services based on information technology: computing, electronics and communications.
Indra Sistemas Magreb S.A.R.L Rabat (Morocco)Design, development, production, integration and maintenance of systems, solutions and services based on information technology: computing, electronics and communications.
Indra Limited (Kenya) Nairobi (Kenya)Design, development, production, integration and maintenance of systems, solutions and services based on information technology: computing, electronics and communications.
Soluziona Professional Services (Private) Ltd Harare (Zimbabwe)Design, development, production, integration and maintenance of systems, solutions and services based on information technology: computing, electronics and communications.
Indra Technology South Africa Pty Ltd Johannesburg (South Africa)Design, development, production, integration and maintenance of systems, solutions and services based on information technology: computing, electronics and communications.
Indra Australia Pty Ltd Sídney (Australia)Design, development, production and maintenance of navigation and landing support and air traffic control systems.
Indra BPO, S.L. Avenida de Bruselas, 35 Alcobendas (Madrid)Business process outsourcing (BPO), document management services and morgage management.
Indra BPO Servicios, S.L. Avenida de Bruselas, 35 Alcobendas (Madrid)Data capture and digitisation.
Central de Apoyos y Medios Auxiliares, S.A.U. Manufacturas, 11. Mairena del Aljarafe (Seville)Business process outsourcing (BPO).
Indra II Business Process Outsorcing Portugal, unipersonal LTD
Lisbon (Portugal)Business process outsourcing (BPO).
OUAKHA Services, Saarl AU (Marruecos) Tangier (Morocco)Back-office process outsourcing (BPO) for financial institutions.
IFOS (International Financial Operational Services), S.A.
Buenos Aires (Argentina)Business process outsourcing and management and design, development, production, integration and maintenance of systems for financial institutions.
COMPANY REGISTERED OFFICE ACTIVITY
This appendix forms an integral part of notes 1 and 5 to the consolidated annual accounts, in conjunction with which it should be read.

Indra • Consolidated Annual Accounts and Management Report
Consolidated Annual Accounts 108
Indra Business Consulting, S.L. Calle Tánger, 98 BarcelonaProfessional services consisting of business, technological and solutions consultancy.
Advanced Logistics Group, S.A. Calle Tánger, 98 BarcelonaPreparation of studies, technical projects and reports on transport engineering, consultancy and logistics.
Europraxis ALG Consulting Maroc, S.A. Casablanca (Morocco)Professional services consisting of business, technological and solutions consultancy.
Europraxis ALG Consulting Brasil, Ltda. Sao Paulo (Brazil)Professional services consisting of business, technological and solutions consultancy.
Indra Business Consulting ALG Mexico S.A. de C.V.
Mexico City (Mexico)Professional services consisting of business, technological and solutions consultancy.
Europraxis ALG Consulting Andina, S.A.C. (Perú) Lima (Peru)Professional services consisting of business, technological and solutions consultancy.
Advanced Logistic Group Venezuela, S.A. Colinas del Bello Monte (Venezuela)Professional services consisting of business, technological and solutions consultancy.
Europraxis ALG Consulting, Ltd (U.K.) Slough, Berkshire (UK)Professional services consisting of business, technological and solutions consultancy.
Prointec, S.A. Avda. de Burgos 12, MadridEngineering and consultancy services mainly in relation to the environment, transport, construction, water and industry.
Unmanned Aircraft Technologies, S.A. Avda. de Burgos 12, MadridResearch and development of autopilot systems and advanced solutions in unmanned aircraft systems.
COMPANY REGISTERED OFFICE ACTIVITY
This appendix forms an integral part of notes 1 and 5 to the consolidated annual accounts, in conjunction with which it should be read.

Consolidated Annual Accounts 109
Prointec Engenharia, Ltda. Sao Paulo (Brazil)Civil engineering services and consultancy.
Ingeniería de Proyectos e Infraestructuras Mexicana, S.A. de C.V.
Mérida (Mexico)Technical architecture and engineering services.
Prointec Panamá, S.A. Ancon (Panama)Civil engineering services and consultancy.
Prointec Usa LLc Sacramento, California (USA)Research and development of autopilot systems and advanced solutions in unmanned aircraft systems.
Consis Proiect SRL Bucharest (Romania)Civil engineering services and consultancy.
Prointec Romaría S.R.L. (Rumanía) Bucharest (Romania)Civil engineering services and consultancy.
Prointec India Privated Ltd Haryana (India)Civil engineering services and consultancy.
Servicios Avanzados Printing & Finishing, S.L. Avenida de Bruselas, 35 Alcobendas (Madrid)Business process outsourcing (BPO).
AC-B air Traffic Control & Business Systems GmbH (Alemania)
Markdorf (Germany)Design, development, production and maintenance of systems, solutions and services based on the use of information technologies as well as navigation and landing support and air traffic control systems.
Avitech AG Friedrichshafen (Germany)Design, development, production and maintenance of navigation and landing support and air traffic control systems.
Avitech S.R.O. Bratislava (Slovakia)Design, development, production and maintenance of navigation and landing support and air traffic control systems.
Indra Navia AS (Park Air, Noruega) Oslo (Norway)Design, development, production and maintenance of navigation and landing support and air traffic control systems.
Normeka, AS Rømskog (Norway)Design, development, production and maintenance of navigation and landing support and air traffic control systems.
3.- Negocios conjuntos
I3 Televisión, S.L.Avda. Isla Graciosa 13, San Sebastián de los Reyes
(Madrid)
Design, development, manufacture, supply, assembly, repair, maintenance, installation and marketing of IT products, solutions, applications and systems for the audiovisual industry.
IRB Riesgo Operacional S.L. Avenida de Bruselas, 35 Alcobendas (Madrid)Design, development, production, integration and maintenance of systems, solutions and services based on information technology: computing, electronics and communications.
Indra Esteio Sistemas S.A. (Brasil) Sao Paulo (Brazil)Design, development, production, integration and maintenance of systems, solutions and services based on information technology: computing, electronics and communications.
COMPANY REGISTERED OFFICE ACTIVITY

Consolidated Annual Accounts 110
4.- Associated
Saes Capital, S.A. Paseo de la Castellana 55, MadridThrough associates, the design, development, production, integration, maintenance and operation of electronic, IT and communications systems mainly related to naval systems and submarine acoustics.
Eurofighter Simulation System GmbH Munich (Germany)Development and production of flight simulators for the Eurofighter EF-2000.
Euromids SAS Paris (France)Development, manufacture and commercialisation of tactical communications systems.
Green Border OOD Sofia (Bulgaria)Design, development, integration and maintenance of systems and solutions for surveillance and installation security.
Tower Air Traffic Services, S.L. Carretera de Loeches 9, Torrejon de Ardoz (Madrid)Airfield transit services for the management of airborne traffic.
A4 Essor, S.A.S. Paris (France)Development of a security programme for radiocommunications.
Indra Sistemas de Tesorería, S.L. Pº de la Castellana 89, MadridDesign, development, production, integration, operation, repairs and maintenance and marketing of systems, solutions and products based on the use of information technology. Professional services consisting of business, management, technology and training consultancy.
Societat Catalana Per a la Mobilitat, S.A. Calle Roc Boronat, nº 133, BarcelonaExecution of the T-Mobilitat project for the implementation of a new technological, tariff and management system for the Autoritat del Transport Metropolita.
Idetegolf, S.A. Julio Sáez de la Hoya 7, BurgosDesign, management and construction of sports facilities.
Iniciativas Bioenergéticas, S.L. Gran Vía Juan Carlos I nº9, Logroño (La Rioja)Study, promotion, development and execution of groundbreaking projects relating to the environment and energy generation.
Logística marítima de Tuxpan S.A.P.I. de C.V. Veracruz (Mexico)Engineering and consultancy services rendered to port infrastructures.
Indra México
Indra Isolux México SA de CV Mexico CitySupply, installation and entry into service of equipment for toll management systems and/or traffic control systems.
Visión Inteligente Aplicada S.A de C.V Mexico City
EFI Túneles Necaxa SA de CV Munich (Germany)
Study, advisory services, preparation of projects and construction of public works, as well as any other types of civil, hydraulic, electrical, infrastructure or similar works, in the public and private sector, the acquisition of materials and consumables for the construction and transportation thereof and all activities related to construction in general.
COMPANY REGISTERED OFFICE ACTIVITY

Consolidated Annual Accounts 111
Indra Sistemas, S.A. and Subsidiaries Financial information on Group companies at 31 December 2014
1.- Parent
Indra Sistemas 928,592 2,080,024 (194,659)
2.- Subsidiaries
Indra Emac, S.A. 100% - 100% 2,687 14,208 1,765
Indra Sistemas de Seguridad, S.A. 100% - 100% 7,778 13,419 1,072
Indra Sistemas de Comunicaciones Seguras, S.L. - 100% 100% 8,917 3,348 1,095
Inmize Capital, S.L. 80% - 80% 1,542 - (6)
Inmize Sistemas, S.L. - 50% 50% 7,736 594 70
Indra Software Labs, S.L. 100% - 100% 39,584 166,800 11,368
Teknatrans Consultores, S.L. 100% - 100% 581 496 102
BPO Group 100% - 100% 23,053 143,439 3,770
Consultoría Group 100% - 100% 21,925 44,623 (8,946)
Servicios Avanzados Printing & Finishing Group
100% - 100% 55,470 75,684 5,364
Prointec, S.A. Group 100% - 100% 25,718 50,578 (5,954)
COMPANY
Interest
EQUITY TOTAL OPERATING INCOMEINDIVID. POST-TAX
PROFIT / (LOSS) DIRECT INDIRECT TOTAL

Indra • Consolidated Annual Accounts and Management Report
Consolidated Annual Accounts 112
Indra SI, S.A. 83% 17% 100% 4,465 54,936 1,574
Politec Argentina 95% 5% 100% 88 - 52
Azertia Tecnología de la Información Argentina S.A.
100% 0% 100% (3,989) 3,376 (2,610)
Computación Ceicom 100% - 100% 3,042 6,496 96
Indra Company Brasil, Ltda. 100% 100% (11,822) 20,786 5,960
Indra Brasil SA 92% 8% 100% 117,885 266,997 (52,994)
Search Informática Ltda. 51% - 51% 301 4,164 (701)
Ultracom-Consultoría em Tecnología da InformaÇao Ltda.
100% - 100% (322) 2,013 (200)
Indra Tecnología Brasil LTDA 100% - 100% (47) 2,743 (1,029)
Indra Colombia LTDA. 100% - 100% 10,624 46,660 359
Indra Sistemas Chile S.A. 100% - 100% 1,774 41,080 (3,424)
Soluziona C&S Holding S.A. - 100% 100% 1,361 - 77
Soluziona S.A. Guatemala 100% - 100% 121 - (2)
COMPANY
Interest
EQUITY TOTAL OPERATING INCOMEINDIVID. POST-TAX
PROFIT / (LOSS) DIRECT INDIRECT TOTAL

Indra • Consolidated Annual Accounts and Management Report
Consolidated Annual Accounts 113
Indra Sistemas México, S.A. de C.V. 100% - 100% 18,063 119,338 1,736
Azertia Tecnología de la Información México S.A. de C.V.
100% - 100% 12,483 16,198 116
Soluziona México S.A. de C.V. 100% - 100% (4,127) 14,812 556
Indra Panama, S.A. 100% - 100% 2,775 14,547 (919)
Indra Company Perú SAC 100% - 100% 1,700 3,377 (135)
Indra Perú, S.A. 100% - 100% 15,824 38,734 1,208
Soluciones y Servicios Indra Company Uruguay S.A.
100% - 100% 1,427 4,238 115
Indra USA, Inc 100% - 100% 4,932 15,861 593
Indra Systems, Inc 100% - 100% (1,104) 1,855 (1,784)
Indra USA IT Services 100% - 100% 2,386 194 (216)
Azertia Tecnología de la Información Venezuela S.A.
100% - 100% 50 229 50
Azertia Gestión de Centros Venezuela, S.A. 100% - 100% (340) 5 (53)
Soluziona SP, C.A. Venezuela 100% - 100% 2,433 5,557 119
COMPANY
Interest
EQUITY TOTAL OPERATING INCOMEINDIVID. POST-TAX
PROFIT / (LOSS) DIRECT INDIRECT TOTAL

Indra • Consolidated Annual Accounts and Management Report
Consolidated Annual Accounts 114
Indra Italia Spa 100% - 100% 11,359 64,121 (167)
Indra Czech Republic s.r.o. 100% - 100% 4,352 6,272 409
Indra Eslovakia, a.s. 100% - 100% 661 1,950 1
Indra France Sas 100% - 100% (647) 62 (521)
Indra Hungary K.F.T. 100% - 100% (240) - (106)
Indra Sisteme S.R.L. (Moldavia) 100% - 100% 429 894 217
Indra Polska Sp.z.o.o 100% - 100% 73 224 (583)
Indra Sistemas Portugal, S.A. 100% - 100% 7,094 23,987 475
Electrica Soluziona S.A. (Rumanía) 51% - 51% 2,142 2,695 543
Indra Kazakhstan Engineering Llp 51% - 51% 710 7,057 (212)
Indra Turquía 100% - 100% 724 4,084 (342)
Indra Beijing Information Technology Systems Ltd. (China)
100% - 100% 2,008 3,557 303
Indra Radar Technology (Tianjin) Co., Ltd. 70% - 70% (127) - (52)
COMPANY
Interest
EQUITY TOTAL OPERATING INCOMEINDIVID. POST-TAX
PROFIT / (LOSS) DIRECT INDIRECT TOTAL

Indra • Consolidated Annual Accounts and Management Report
Consolidated Annual Accounts 115
Indra Philippines INC 50% - 50% 12,681 31,516 2,281
Indra Technology Solutions Malasya Sdn Bhd. 70% - 70% 226 2,378 (588)
Indra Indonesia 100% - 100% (1,513) 132 (1,035)
Indra Sistemas India Private Limited 100% - 100% 4,153 815 (1,721)
Indra Bahrain Consultancy SPC 100% - 100% 2,363 14,177 (1,916)
Indra Arabia LLC CO 95% 5% 100% 13,265 100,334 13,155
Indra Sistemas Magreb S.A.R.L. 100% - 100% 597 1,749 102
Indra Limited (Kenya) 100% - 100% 2,931 4,033 323
Soluziona Professional services (private) Limited (Zimbabwe)
70% - 70% - - -
Indra Technology South Africa 62% - 62% (1,226) 37 (1,018)
Indra Australia Pty Limited 100% - 100% 6,071 31,228 496
COMPANY
Interest
EQUITY TOTAL OPERATING INCOMEINDIVID. POST-TAX
PROFIT / (LOSS) DIRECT INDIRECT TOTAL

Consolidated Annual Accounts 116
3.- Joint ventures
I-3 Televisión S.L. 50% - 50% - - -
IRB Riesgo Operacional S.L. 33% - 33% - - -
IESSA (Brasil) 50% - 50% - - -
4.- Associates
Saes Capital, S.A. 49% - 49% - - -
Eurofighter Simulation System GmbH 26% - 26% - - -
Euromids SAS 25% - 25% - - -
A4 Essor SAS 21% - 21% - - -
Tower Air traffic, S.L. 50% - 50% - - -
Indra Sistemas de Tesorería, S.A. 33% - 33% - - -
Green Border OOD 50% - 50% - - -
Sociedad Catalana per a la mobilitat, S.A. 25% - 25% - - -
Indra Mexico
Indra Isolux México SA de CV 50% - 50% - - -
Visión Inteligente Aplicada S.A de C.V 50% - 50% - - -
EFI Túneles Necaxa SA de CV 10% - 10% - - -
COMPANY
Interest
EQUITY TOTAL OPERATING INCOMEINDIVID. POST-TAX
PROFIT / (LOSS) DIRECT INDIRECT TOTAL

Indra • Consolidated Annual Accounts and Management Report
Consolidated Annual Accounts 117
BPO Group composition 2.- Subsidiaries
Indra BPO, S.L. 16,318 24,865 3,654
OUAKHA Services, Saarl AU (Morocco) 100% - 100% (271) - (9)
Indra BPO Servicios , S.L. 100% - 100% 48,883 113,954 6,352
Central de Apoyos y Medios Auxiliares, S.A.U. (CAYMASA)
100% - 100% 1,819 10,208 (1,887)
IFOS (Argentina) 80% 20% 100% (359) 12 (128)
Indra II BPO Portugal 100% - 100% (384) 4,771 (636)
4.- Associates
Trias Beltran, S.L. 40% - 40% - - -
COMPANY
Interest
EQUITY TOTAL OPERATING INCOMEINDIVID. POST-TAX
PROFIT / (LOSS) DIRECT INDIRECT TOTAL

Indra • Consolidated Annual Accounts and Management Report
Consolidated Annual Accounts 118
Consultoría Group composition 2.- Subsidiaries
Indra Business Consulting - - 35,512 35,875 (5,958)
Europraxis ALG Consulting, Ltd. (UK) 100% - 100% 75 (46) (70)
Europraxis ALG Consulting, Ltda. (Brazil) 99.99% 0.01% 100% (5,981) 2,026 (1,640)
Advanced Logistics Group, S.A. 100% - 100% (2,696) 9,016 (2,856)
Indra Business Consulting ALG Mexico 99.99% 0.01% 100% 216 3,155 (247)
Advanced Logistics Group Andina - 100% 100% 384 200 (142)
Advanced Logistics Group Venezuela - 90% 90% 313 - 37
Europraxis Alg Maroc 67% 33% 100% (838) 49 (430)
Servicios Avanzados Printing & Finishing Group composition 2.- Subsidiaries
Servicios Avanzados Printing & Finishing 47,200 - -
AC-B air Traffic Control & Business Systems GmbH (Germany)
100% - 100% 1,479 1,732 211
Avitech AG 100% - 100% 5,321 15,646 1,029
Indra Navia AS 100% - 100% 19,323 57,113 4,256
COMPANY
Interest
EQUITY TOTAL OPERATING INCOMEINDIVID. POST-TAX
PROFIT / (LOSS) DIRECT INDIRECT TOTAL

Indra • Consolidated Annual Accounts and Management Report
Consolidated Annual Accounts 119
Prointec Group composition 2.- Subsidiaries
Prointec, S.A. 27,948 50,855 (6,567)
Consis Proiect SRL (Romania) 100% - 100% 1,517 902 (155)
Ingenieria de Proyectos de Infraestructuras Mexicanas
98% 2% 100% 5,340 24,360 698
Prointec Romaría S.R.L. (Romania) 100% - 100% (63) 470 (135)
Prointec Engenharia, Ltda. 100% - 100% 303 304 82
Prointec Panama 75.00% - 75% (108) - (38)
Unmanned Aircraft Technologies, S.A. 51% - 51% 5 - 656
Prointec USA 100% - 100% 575 1,012 185
Prointec India 100% - 100% - - -
4.- Associates
Idetegolf, S.A. 33% - 33% - - -
Gestión de Recursos Eólicos Riojanos, S.L. - 16% 16% - - -
Iniciativas Bioenergéticas, S.L. - 20% 20% - - -
COMPANY
Interest
EQUITY TOTAL OPERATING INCOMEINDIVID. POST-TAX
PROFIT / (LOSS) DIRECT INDIRECT TOTAL

Consolidated Annual Accounts 120
Indra Sistemas, S.A. and Subsidiaries Financial information on Group companies at 31 December 2013
1.- Parent
Indra Sistemas 1,202,520 1,904,381 108,415
2.- Subsidiaries
Indra Emac, S.A. 100% - 100% 2,561 16,237 1,620
Indra Sistemas de Seguridad, S.A. 100% - 100% 6,739 10,713 560
Indra Sistemas de Comunicaciones Seguras, S.L. - 100% 100% 9,393 4,197 1,572
Inmize Capital, S.L. 80% - 80% 1,548 - (5)
Inmize Sistemas, S.L. - 50% 50% 7,666 2,712 488
Indra Software Labs, S.L. 100% - 100% 35,917 153,045 9,253
Teknatrans Consultores, S.L. 100% - 100% 669 684 191
BMB Group 100% - 100% 19,475 152,035 2,011
Consultoría Group 100% - 100% 30,668 56,697 (6,894)
Prointec Group 100% - 100% 22,020 52,796 (2,484)
Indra Brazil Group 100% - 100% (7,493) 268,590 1,634
COMPANY
Interest
EQUITY TOTAL OPERATING INCOMEINDIVID. POST-TAX
PROFIT / (LOSS) DIRECT INDIRECT TOTAL

Indra • Consolidated Annual Accounts and Management Report
Consolidated Annual Accounts 121
Indra SI, S.A. 83% 17% 100% 3,066 53,555 (1,240)
Indra Company Brasil LTDA 100% 100% (28,999) 74,742 (12,418)
Politec Argentina 95% 5% 100% 13 103 (148)
Azertia Tecnología de la Información Argentina S.A.
100% - 100% (2,423) 11,228 (4,552)
Computación Ceicom 100% - 100% 3,365 11,059 29
Indra Colombia LTDA. 100% - 100% 10,740 43,394 (1,330)
Indra Sistemas Chile S.A. 100% - 100% 5,354 51,759 232
Soluziona C&S Holding S.A. - 100% 100% 1,307 - 54
Soluziona S.A. Guatemala 100% - 100% 105 - -
Indra Sistemas México, S.A. de C.V. 100% - 100% 16,848 119,808 7,709
Azertia Tecnología de la Información México S.A. de C.V.
100% - 100% 12,404 41,084 2,556
Soluziona México S.A. de C.V. 100% - 100% (4,834) 12,309 (3,313)
Indra Panama, S.A. 100% - 100% 3,271 16,569 539
COMPANY
Interest
EQUITY TOTAL OPERATING INCOMEINDIVID. POST-TAX
PROFIT / (LOSS) DIRECT INDIRECT TOTAL

Indra • Consolidated Annual Accounts and Management Report
Consolidated Annual Accounts 122
Indra Company Perú SAC 100% - 100% 1,719 7,139 0
Indra Perú, S.A. 100% - 100% 13,888 40,853 2,858
Soluciones y Servicios Indra Company Uruguay S.A.
100% - 100% 1,295 3,953 (89)
Indra USA, Inc 100% - 100% 3,895 15,117 2,061
Indra Systems, Inc 100% - 100% (17,269) 996 (2,477)
Azertia Tecnología de la Información Venezuela S.A.
100% - 100% 4,207 3,150 830
Azertia Gestión de Centros Venezuela, S.A. 100% - 100% (2,014) 258 (433)
Soluziona SP, C.A. Venezuela 100% - 100% 7,978 20,958 2,657
COMPANY
Interest
EQUITY TOTAL OPERATING INCOMEINDIVID. POST-TAX
PROFIT / (LOSS) DIRECT INDIRECT TOTAL

Consolidated Annual Accounts 123
AC-B air Traffic Control & Business Systems GmbH (Germany)
100% 100% 1,268 1,812 279
Avitech AG 100% 100% 4,292 14,100 993
Indra Italia Spa (Visiant Galyleo Spa) 78% 78% 11,291 59,071 1,635
Indra Czech Republic s.r.o. 100% - 100% 4,047 9,310 1,108
Indra Eslovakia, a.s. 100% - 100% 664 2,398 (127)
Indra France Sas 100% - 100% (127) 1,010 (448)
Indra Hungary K.F.T. 100% - 100% (142) 364 (226)
Indra Sisteme S.R.L. (Moldavia) 100% - 100% 455 762 127
Indra Polska Sp.z.o.o 100% - 100% (322) 168 (220)
Indra Sistemas Portugal, S.A. 100% - 100% 6,619 35,774 (634)
Electrica Soluziona S.A. (Romania) 51% - 51% 1,600 2,835 233
Indra Ukraine L.L.C. - 100% 100% (25) - (74)
Indra Kazakhstan Engineering Llp 51% - 51% 953 2,244 (91)
Indra Beijing Information Technology Systems Ltd. (China)
100% - 100% 1,544 4,336 228
COMPANY
Interest
EQUITY TOTAL OPERATING INCOMEINDIVID. POST-TAX
PROFIT / (LOSS) DIRECT INDIRECT TOTAL

Consolidated Annual Accounts 124
Indra Radar Technology (Tianjin) Co., Ltd. 70% - 70% (73) 144 (285)
Indra Philippines INC 50% - 50% 10,376 31,824 2,117
Indra Technology Solutions Malasya Sdn Bhd. 70% - 70% 11 8,285 263
Indra Indonesia 100% - 100% (622) 95 (1,167)
Indra Arabia LLC CO 95% 5% 100% - - -
Indra Bahrain Consultancy SPC 100% - 100% 3,772 12,156 120
Indra Sistemas Magreb S.A.R.L. 100% - 100% 483 1,370 126
Indra Limited (Kenya) 100% - 100% 2,634 3,868 373
Soluziona Professional services (private) Limited (Zimbabwe)
70% - 70% - - -
Indra Australia Pty Limited 100% - 100% 5,995 36,193 2,289
Indra Sistemas India Private Limited 100% - 100% 469 3,928 (1,682)
Indra Navia AS 100% - 100% 16,733 61,790 5,998
Indra Turquía 100% - 100% 888 2,085 (913)
Indra Technology South Africa 62% - 62% (227) - (227)
Indra Tecnología Brasil LTDA 100% - 100% 971 4,767 3
Gnubila Colombia SAS 100% - 100% 289 482 24
COMPANY
Interest
EQUITY TOTAL OPERATING INCOMEINDIVID. POST-TAX
PROFIT / (LOSS) DIRECT INDIRECT TOTAL

Indra • Consolidated Annual Accounts and Management Report
Consolidated Annual Accounts 125
3.- Joint ventures
I-3 Televisión S.L. 50% - 50% 130 3,389 13
IRB Riesgo Operacional S.L. 33% - 33% 430 88 (42)
IESSA (Brazil) 50% - 50% (866) 2,386 (1,678)
UTE Zona Norte 10% - 10% 39 160 14
UTE Alta Capacidad 20% - 20% 119 743 118
UTE Copsa-Indra 50% - 50% 114 3 (2)
UTE Jocs del Mediterrani 49% - 49% (4,022) 1,004 17
UTE Área Metropolitana 20% - 20% 57 12 1
UTE Mantenimiento Las Palmas 10% - 10% (7) 24 23
UTE Segura XXI-II 35% - 35% 82 64 81
COMPANY
Interest
EQUITY TOTAL OPERATING INCOMEINDIVID. POST-TAX
PROFIT / (LOSS) DIRECT INDIRECT TOTAL

Indra • Consolidated Annual Accounts and Management Report
Consolidated Annual Accounts 126
UTE Indra-Eurocopter ECE 63% - 63% (7) 756 11
UTE Saih CHJ 25% - 25% 7 14 7
UTE CIC-TF 50% - 50% 316 199 50
UTE CEIDECOM 60% - 60% (352) - (16)
UTE Instalación VSM Instalazioak 25% - 25% 12 - 0
UTE Mantenimiento Semafórico de Torrejón de Ardoz
50% - 50% (7) 40 (7)
UTE IND. AMB. DELTA DEL EBRO 33% - 33% 56 268 54
UTE Mantenimiento Rondes 2012 30% - 30% (7) 1,085 (35)
UTE Telvent-Indra-Atos 33% - 33% - 1,742 -
COMPANY
Interest
EQUITY TOTAL OPERATING INCOMEINDIVID. POST-TAX
PROFIT / (LOSS) DIRECT INDIRECT TOTAL

Indra • Consolidated Annual Accounts and Management Report
Consolidated Annual Accounts 127
Indra Peru
Consorcio Procom 49% - 49% 799 8,611 845
Consorcio CEI 50% - 50% (108) 393 (31)
Consorcio GMD 50% - 50% 1,647 8,141 1,693
Consorcio Petróleos 95% - 95% 6,759 3,278 (566)
Consorcio NSC 90% - 90% 285 14 (102)
Consorcio Mincetur 98% - 98% 378 469 88
Consorcio Fábrica 50% - 50% 3,462 3,178 132
Consorcio Reapro 85% - 85% 404 3,917 626
COMPANY
Interest
EQUITY TOTAL OPERATING INCOMEINDIVID. POST-TAX
PROFIT / (LOSS) DIRECT INDIRECT TOTAL

Indra • Consolidated Annual Accounts and Management Report
Consolidated Annual Accounts 128
4.- Associates
Saes Capital, S.A. 49% - 49% - - -
Eurofighter Simulation System GmbH 26% - 26% - - -
Euromids SAS 25% - 25% - - -
A4 Essor SAS 21% - 21% - - -
Tower Air traffic 50% - 50% - - -
Indra Sistemas de Tesorería, S.A. 33% - 33% - - -
Green Border OOD 50% - 50% - - -
Indra Mexico
Indra Isolux México SA de CV 50% - 50% - - -
Visión Inteligente Aplicada S.A de C.V 50% - 50% - - -
EFI Túneles Necaxa SA de CV 10% - 10% - - -
COMPANY
Interest
EQUITY TOTAL OPERATING INCOMEINDIVID. POST-TAX
PROFIT / (LOSS) DIRECT INDIRECT TOTAL

Indra • Consolidated Annual Accounts and Management Report
Consolidated Annual Accounts 129
BMB Group Composition 2.- Subsidiaries
Indra BMB S.L. 12,665 21,501 1,327
OUAKHA Services, Saarl AU (Morocco) 100% - 100% (256) - (9)
Indra BMB Servicios Digitales, S.A. 100% - 100% 46,455 122,113 5,013
Central de Apoyos y Medios Auxiliares, S.A.U. (CAYMASA)
100% - 100% 4,858 14,277 (1,206)
Caymasa El Sendero, S.L. 100% - 100% 148 421 (544)
IFOS (Argentina) 80% - 80% (373) 1,438 (586)
Indra II BPO Portugal 100% - 100% 252 25 2
4.- Associates
Trias Beltran, S.L. 40% - 40% - - -
COMPANY
Interest
EQUITY TOTAL OPERATING INCOMEINDIVID. POST-TAX
PROFIT / (LOSS) DIRECT INDIRECT TOTAL

Indra • Consolidated Annual Accounts and Management Report
Consolidated Annual Accounts 130
Consultoría Group composition 2.- Subsidiaries
Indra Business Consulting - - 41,288 33,469 (1,116)
Tourism & Leisure Advance Service, S.L. 70% - 70% 205 4,411 (205)
Europraxis ALG Consulting, Ltd. (UK) 100% - 100% 144 367 47
Europraxis ALG Consulting, Ltda. (Brasil) 99.99% 0.01% 100% (4,581) 1,177 (2,413)
Advanced Logistics Group, S.A. 100% - 100% 220 14,468 (662)
Europraxis Consulting, S.R.L. 100% - 100% (578) 606 (497)
Indra Business Consulting ALG Mexico 100% 0% 100% 447 2,672 (193)
Advanced Logistics Group Andina - 90% 90% 490 715 (35)
Advanced Logistics Group Venezuela - 90% 90% 1,932 868 (411)
Mensor Consultoría y Estrategia S.L. 80% - 80% (2,327) 1,922 (829)
Europraxis Alg Maroc 67% - 67% (402) 344 (512)
COMPANY
Interest
EQUITY TOTAL OPERATING INCOMEINDIVID. POST-TAX
PROFIT / (LOSS) DIRECT INDIRECT TOTAL

Indra • Consolidated Annual Accounts and Management Report
Consolidated Annual Accounts 131
Indra Brazil Composition 2.- Subsidiaries
Indra Brasil SA 100% 56,631 261,978 (25,632)
Search Informática Ltda. 51% - 51% 1,289 6,504 2,488
Ultracom-Consultoría em Tecnología da InformaÇao Ltda.
100% - 100% (108) 4,071 107
Indra USA IT Services 100% - 100% 2,300 2,573 268
COMPANY
Interest
EQUITY TOTAL OPERATING INCOMEINDIVID. POST-TAX
PROFIT / (LOSS) DIRECT INDIRECT TOTAL

Indra • Consolidated Annual Accounts and Management Report
Consolidated Annual Accounts 132
Prointec Group composition 2.- Subsidiaries
Prointec, S.A. 28,675 40,409 (11,661)
Prointec Hidrógeno, S.L. 60% - 60% - - (5)
Consis Proiect SRL (Romania) 100% - 100% 1,600 1,048 47
Geoprin, S.A. 99.99% 0.01% 100% (1,934) 165 (554)
GICSA-Goymar Ingenieros Consultores, S.L. 99.80% 0.2% 100% (1,161) 45 (587)
Ingenieria de Proyectos de Infraestructuras Mexicanas
98% 2% 100% 1,640 2,686 93
Inse Rail, S.A. 90% - 90% 3,171 1,281 143
Mecsa, S.A. 99% 1% 100% (681) 930 (550)
Procinsa Ingeniería, S.A. 99% 1% 100% 936 1,143 (109)
Prointec civil engineering Consultancy (Irlanda) 100% - 100% 606 7 (23)
Prointec Romaría S.R.L. (Romania) 100% - 100% (29) 1,177 89
Prointec Engenharia, Ltda. 99.99% - 100% 574 217 246
Prointec Panama 75% - 75% - - -
Prointec Extremadura, S.L. 97% 3% 100% 15 64 2
COMPANY
Interest
EQUITY TOTAL OPERATING INCOMEINDIVID. POST-TAX
PROFIT / (LOSS) DIRECT INDIRECT TOTAL

Indra • Consolidated Annual Accounts and Management Report
Consolidated Annual Accounts 133
Prointec Diseño y Construcción, S.A. 99% 1% 100% (633) - (97)
Unmanned Aircraft Technologies, S.A. 51% - 51% 80 170 (12)
Prointec USA 100% - 100% 198 1,201 92
4.- Associates
Idetegolf, S.A. 33% - 33% - - -
Gestión de Recursos Eólicos Riojanos, S.L. - 16% 16% - - -
Iniciativas Bioenergéticas, S.L. - 20% 20% - - -
Eólica Marítima y Portuaria, S.L. - 20% 20% - - -
Huertas de Binipark 25% - 25% - - -
COMPANY
Interest
EQUITY TOTAL OPERATING INCOMEINDIVID. POST-TAX
PROFIT / (LOSS) DIRECT INDIRECT TOTAL

Consolidated Annual Accounts 134
Indra Sistemas, S.A. and Subsidiaries Details of activities jointly operated with third parties at 31 December 2014
Indra SL
Indra SI SA-Retesar SA UTE 80.00%
Indra SI SA-DCM Solution SA UTE 90.00%
Deloitte & Co.SRL-Indra SI SA UTE 46.38%
Metronec-Siemens-Indra UTE 33.33%
Indra Peru
CONSORCIO PROCOM 49.00%
CONSORCIO CEI 50.00%
CONSORCIO GMD 50.00%
CONSORCIO PETROLEOS 95.00%
CONSORCIO NSC 90.00%
CONSORCIO MINCETUR 98.00%
CONSORCIO FABRICA 50.00%
CONSORCIO REAPRO 85.00%
Company Direct Interest

Indra • Consolidated Annual Accounts and Management Report
Consolidated Annual Accounts 135
Spanish Group companies
UTE ABI CORREDOR NORTE 4.00%
UTE PROINTEC-TALHER-GEOCISA-DRAGADOS 7.00%
UTE INSTALACIONES MADRID ESTE 7.50%
UTE ZONA NORTE 10.00%
UTE PEREZ MORENO SAU - COMSA SA - INDRA SISTEMAS 10.00%
UTE ADIS 12.00%
UTE ADIS 12.00%
UTE INDRA SISTEMAS-INDRA SISTEMAS DE SEGURIDAD 15.00%
PROINTEC-GPY ARQUITECTOS, S.L.U.-CIVILPORT INGENIEROS, S.L.P.-ENRIQUE AMIGÓ, S.L. (INTERCAMBIADOR CANDELARIA)
15.00%
UTE INDRA - ALSTOM 18.00%
UTE INDRA SISTEMAS - ALSTOM - INDRA SISTEMAS DE SEGURIDAD 18.50%
PEREZ MORENO S.AU. COMSA S.A. INDRA SISTEMAS S.A. 20.00%
UTE ALTA CAPACIDAD 20.00%
UTE SIEMENS - INDRA 20.00%
Company Direct Interest

Indra • Consolidated Annual Accounts and Management Report
Consolidated Annual Accounts 136
AIE FORMALIZACIÓN ALCALA 265 20.00%
AIE CRISTAL HIPOTECARIO 2009 20.00%
UTE TRANSITIA - PABISA - INDRA 22.50%
UTE ACCENTURE, SL-CORITEL-ACCENTURE O.S., SAU-INDRA 25.00%
UTE ALTIA - ILUS-INDRA-R. CABLE 25.00%
UTE INSTALACIONES SEGUNDO CINTURON 25.00%
UTE SAIH C.H.J. 25.00%
UTE INSTALACIONES VSM/VSM INSTALAZIOAK 25.00%
AIE ENRIQUE JARDIEL PONCELA, 6 25.00%
UTE AUDITORIA SEGURIDAD VIARIA AUTOVIA A-22 25.00%
UTE PROINTEC-AEPO-EUROESTUDIOS-INSERCO 25.00%
UTE AEAT 03/07 26.54%
UTE SAN MAMES FASE II 26.66%
UTE GISS 7201/10 G LOTE 10 28.00%
UTE GISS 7 30.00%
Company Direct Interest

Indra • Consolidated Annual Accounts and Management Report
Consolidated Annual Accounts 137
UTE SPEE 2/10 30.00%
UTE MANTENIMIENTO RONDES 2012 30.00%
UTE ARTXANDA - ETORKISUNA - 30.00%
UTE METRO QUITO (AYESA-PROINTEC-CAMINOSGA) 30.00%
UTE TELVENT - INDRA - ATOS 33.00%
UTE AUDING-CENSA-INTECSA INARSA-PROINTEC (UTE PORT BARCELONA) 33.00%
UTE CEMOSA-TYPSA-PROINTEC 33.00%
PROINTEC, S.A.-INTEMAC, S.A.-PAYMA COTAS, S.A.U., UTE (UTE AEROPUERTO VALENCIA) 33.30%
UTE INDICADORES AMBIENTALES DELTA DEL EBRO 33.33%
UTE ESMOVILIDAD AYESA-PROINTEC 33.33%
UTE CONTROL MOGAN 33.34%
Company Direct Interest
This appendix forms an integral part of notes 1 and 5 to the consolidated annual accounts, in conjunction with which it should be read.

Consolidated Annual Accounts 138
Indra Sistemas, S.A. y Sociedades dependientesDatos de las actividades conjuntas explotadas conjuntamente con terceros al 31 de diciembre de 2014
UTE INOCSA-PROSER-PROINTEC 33.34%
UTE GISS 7201/10 LOTE 6 34.00%
UTE OSAKIDETZA AM 34.00%
UTE INDRA - EVERIS - ISOFT - TELVENT INTERACT. 34.00%
UTE PROINTEC-INTEVIA-GETNISA 34.00%
UTE PROINTEC-TYPSA-CEMOSA ALICANTE 34.00%
UTE CEMOSA-TYPSA-PROINTEC 34.00%
UTE SAIH SUR 35.00%
UTE GISS 11 35.00%
UTE ACCENTURE - INDRA 35.00%
UTE INDRA-MNEMO 35.00%
UTE MANTENIMIENTO SAI-SEGURA 35.00%
ALATEC-PROINTEC-TCA. Y CCION. DE CATALUÑA 35.00%
UTE AEAT 68/06 35.18%
Company Direct interest

Consolidated Annual Accounts 139
UTE AEAT 42/10 35.18%
UTE GISS 7201/10 LOTE 8 35.50%
UTE INDRA SISTEMAS - ALSTOM - INDRA SISTEMAS DE SEGURIDAD 37.00%
UTE INDRA - ALSTOM 37.00%
GEOPRIN-ICYFSA 37.00%
UTE IECISA-INDRA-ZENSANIA-EMTE 37.50%
UTE TUNELES DE PAJARES 39.00%
UTE AIMEN 40.00%
UTE ISM LOTE 2 40.00%
UTE TELEFÓNICA - INDRA - FUCODA 40.00%
UTE S.A.I. DEL SEGURA 40.00%
UTE VALLADOLID 40.00%
UTE SELEX ES -INDRA SISTEMAS 40.00%
UTE DBS - INDRA - IASOFT 40.00%
UTE ZORTNOZA (EUSKONTRO-PROINTEC-INGEPLAN 40.00%
UTE PROINTEC-AQUAGEST-GRS (CENSO TRIBUTARIO BURGOS 40.00%
UTE METRO DONOSTI (ACCIONA-PROINTEC-ASMATU) 40.00%
Company Direct interest

Consolidated Annual Accounts 140
UTE PROINTEC-ESTUDIO 7 GUIADOR 40.00%
UTE FOA-MECSA GIJON 40.00%
UTE IECISA - INDRA 42.00%
UTE IECISA - INDRA . 42.00%
UTE INDRA-ACCENTURE-GESEIN 45.00%
UTE BILBOMATICA, S.A. - INDRA SISTEMAS, S.A. 45.00%
UTE JOCS DEL MEDITERRANI 49.00%
UTE GISS 7201/10 LOTE 9 49.00%
UTE TGSS 7201/13G 49.00%
AP7 AUMAR NORTE 49.00%
UTE CIC-TF 50.00%
UTE 1 INDRA - UNITRONICS 50.00%
UTE 2 INDRA - UNITRONICS 50.00%
"UTE PROSELEC - INDRA SISTEMAS DE SEGURIDAD 50.00%
UTE INDRA - ITALTEL 50.00%
UTE CONTROL ACCESOS DONOSTIA 50.00%
This appendix forms an integral part of notes 1 and 5 to the consolidated annual accounts, in conjunction with which it should be read.
Company Direct interest

Consolidated Annual Accounts 141
Indra Sistemas, S.A. and Subsidiaries Details of activities jointly operated with third parties at 31 December 2014
UTE COPSA - INDRA 50.00%
UTE 2 INDRA - UNITRONICS 1 50.00%
UTE INDRA SISTEMAS, S.A. - TELVENT TRAF.Y TRANS. 50.00%
UTE 1 INDRA - UNITRONICS "DGSC1" 50.00%
UTE ORION 50.00%
UTE AVIONICA 50.00%
UTE INDRA - AVANZIT 50.00%
UTE INIB EJE 50.00%
UTE INDRA - AVANZIT 50.00%
UTE INDRA - NETINEX 50.00%
UTE INDTEC 137/09 50.00%
UTE INDRA - ITP (1) 50.00%
UTE INDRA - ITP (2) 50.00%
UTE SISTEMAS METRO MALAGA 50.00%
Company Direct Interest

Consolidated Annual Accounts 142
UTE MANTENIMIENTO DNIe 50.00%
UTE IMPLAMTBAT 50.00%
UTE SOPORTE LOTE 2 50.00%
UTE ALG - CINESI (Plans Mobilitat) 50.00%
UTE EMTE-INDRA 50.00%
UTE INSTALACIONES TUNELES MUROS-DUEÑAS 50.00%
UTE INDRA-INICIATIVAS AMBIENTALES 50.00%
UTE MASTIN 50.00%
UTE AVIONICA DE HELICOPTEROS 50.00%
UTE INDRA SISTEMAS, S.A. - SIA, S.p.A. 50.00%
UTE INDRA-TELEFONICA 50.00%
UTE INDRA-TECDOA 50.00%
UTE INDRA-ALTIA 50.00%
UTE SIVE INDRA - AMPER 50.00%
UTE INDRA-TELEFONICA S.I.C. 50.00%
UTE ACCESOS LEVANTE 50.00%
UTE INDRA-EADS CASA 50.00%
Company Direct Interest

Consolidated Annual Accounts 143
UTE INDRA-ALTIA 50.00%
UTE INDRARANZADI 50.00%
UTE SIVE II INDRA-AMPER 50.00%
UTE ABC MALAGA 50.00%
UTE CONTROL POLOPOS 50.00%
UTE INDRA - TECNOCOM 50.00%
UTE ALG - FULCRUM 50.00%
UTE INDRA - ALVENTO 50.00%
UTE TELEFÓNICA SOL.DE INF. Y COM. DE ESPAÑA, SAU - 50.00%
UTE INOCSA-PROINTEC (TUNEL O CAÑIZO 50.00%
UTE PROINTEC-ACCIONA-ASMATU (UTE ZIZURKIL) 50.00%
UTE AGENCIA EFE (INCOSA-PROINTEC) 50.00%
UTE PROINTEC-BPG UTE PTL2016 50.00%
UTE PROINTEC-NOLTER INGENIERIA (ABASTECIMIENTO LA RIOJA) 50.00%
UTE III PLAN CARRETERAS CLM 50.00%
UTE III PLAN CARRETERAS CLM 50.00%
Company Direct Interest
This appendix forms an integral part of notes 1 and 5 to the consolidated annual accounts, in conjunction with which it should be read.

Consolidated Annual Accounts 144
Indra Sistemas, S.A. and Subsidiaries Details of activities jointly operated with third parties at 31 December 2014
UTE PROINTEC-PAYMA COTAS 50.00%
UTE CIPSA CONSULPAL SA - PROINTEC SA 50.00%
UTE PROINTEC-PROINTEC EXTREMADURA SEGURIDAD VIAL 2013-2014 50.00%
UTE PROINTEC-PRORAIL 50.00%
UTE PROINTEC-GIUR LP-2 50.00%
UTE PROINTEC-AIRIA AEROPUERTO DE BARCELONA 2012 50.00%
PROINTEC-AUDITORIAS E INGENIERIAS.A. (MONTAJE VIA) 50.00%
UTE ABASTECIMIENTO ORENSE (PROINTEC-INSERCO) 50.00%
UTE PUEBLA DE OBANDO (PROINTEC-PROINTEC EXTREMADURA) 50.00%
UTE PUEBLA DE OBANDO (PROINTEC-PROINTEC EXTREMADURA) 50.00%
PROINTEC-BB&J CONSULT S.A. (UTE MOVILIDAD BARCELONA) 50.00%
UTE TRN-MECSA 50.00%
EPTISA SERVICIOS DE INGENIERIA, S.L. - PROINTEC, S.A., UTE 50.00%
UTE ARQUING-PROINTEC 577 50.00%
Company Direct Interest

Consolidated Annual Accounts 145
UTE E3 SOLINTEG SL Y PROINTEC S.A. (UTE PROTOCOL PROJECTES) 50.00%
PROINTEC-INFRAESTRUCTURA Y ECOLOGIA, S.L. 50.00%
PROINTEC-INSTITUTO TECNICO DE MATERIALES Y CONSTRUCCIONES, S.A. (INTEMAC), UTE - UTE CE VALENCIA
50.00%
UTE PROINTEC-INTECSA-INARSA 50.00%
MECSA-OVE ARUP 50.00%
UTE EIPSA-PROINTEC-EUSKONTROL (UTE VIADUCTO) 50.00%
UTE PROINTEC-MEDIO AMBIENTE Y PATRIMONIO SL (MAP) 50.00%
PROINTEC-T.T.U. 50.00%
UTE PROINTEC-BLOM 50.00%
UTE INPROESA-MECSA 50.00%
PROINTEC-CASTELLANA DE INGENIERIA 50.00%
UTE INGENIERIA CIVIL INTERNACIONAL S.A.- PROINTEC S.A. (UTE ALMUDEVAR) 50.00%
PROINTEC-T.T.U. II 50.00%
INIMA-PROINTEC UTE 50.00%
PROINTEC-INIMA Mº AMBTE S.EUROPEOS (LINDE NORTE) 50.00%
GEOPRIN-EPSA 50.00%
AMINSA-PROINTEC (UTE TRANVIA A LA MAR) 50.00%
Company Direct Interest

Consolidated Annual Accounts 146
UTE PROINTEC-INSERCO (BOMBEO BREÑA II) 50.00%
UTE PROINTEC-IBERINSA 50.00%
PROINTEC-INSTITUTO TECNICO DE MATERIALES Y CONSTRUCCIONES, S.A. (INTEMAC), UTE - UTE AEROP. PALMA MALLORCA
50.00%
GESTION INTEGRAL DEL SUELO-PROINTEC 50.00%
UTE PROINTEC-EYSER 50.00%
PROINTEC-GALOP III 50.00%
PROINTEC-AGROVIAL CONSULTORES (BALSA-CALDERETA) 50.00%
UTE INCOSA-PROINTEC III (AUDITORIO DE BURGOS) 50.00%
PROINTEC-INYSUR (BAJA CENSAL) 50.00%
PROINTEC-PROINTEC EXTREMADURA-ARQUEVCHECK 50.00%
PROINTEC-PROINTEC EXTREMADURA-ARQUEVCHECK 50.00%
PROINTEC - PROINTEC EXTREMADURA, S.L. III 50.00%
PROINTEC - PROINTEC EXTREMADURA, S.L. III 50.00%
MECSA-ESTUDIOS Y PROYECTOS NIP (NIPSA) 50.00%
TRIBUGEST-PROINTEC III 50.00%
UTE PROINTEC-BPG 50.00%
Company Direct Interest

Consolidated Annual Accounts 147
Indra Sistemas, S.A. and Subsidiaries Details of activities jointly operated with third parties at 31 December 2014
GEOPRIN-ICYF, S.A. 50.00%
GEOPRIN-EUROCONSULT ANDALUCIA-EUROCONSULT SA 50.00%
UTE GOC-PROINTEC 50.00%
UTE PROINTEC-G.O.C. 50.00%
PROINTEC-MECSA (UTE ZAL ALMERIA) 50.00%
UTE PROINTEC-ESTUDIO 7 CALDERETA 50.00%
MECSA-SAN ANDRES 50.00%
AGUA Y ESTRUCTURAS, S.A. - PROINTEC (UTE AYEPRO) 50.00%
UTE PROINTEC-INTEMAC (AEROP.MURCIA) 50.00%
UTE PROINTEC-EUSKONTROL 50.00%
UTE PROINTEC-VIGUECONS ESTEVEZ 50.00%
UTE EUSKONTROL-EIPSA 50.00%
INSERCO-PROINTEC, UTE EDAR GUADALHORCE 50.00%
UTE PROINTEC-ALTOARAGONESA INGENIERIA CIVIL (UTE IMPACTO TERRITORIAL) 50.00%
Company Direct interest

Indra • Consolidated Annual Accounts and Management Report
Consolidated Annual Accounts 148
UTE PIV2011 (PROINTEC-GMV SISTEMAS-EORIAN SYSTEMS-ETRALUX 50.58%
UTE INST. DESKARTA 51.00%
UTE INDRA - ETRA 51.00%
UTE JAÉN 52.12%
PROINTEC-EUROESTUDIOS, UTE 55.00%
UTE GISS 7201/14G LOTE 1 57.00%
UTE IMSERSO 59.00%
UTE INDRA EWS/STN ATLAS 60.00%
UTE CEIDECOM 60.00%
UTE TRÁFICO Y SEÑALIZACIÓN VALENCIA 60.00%
UTE ISM LOTE 1 60.00%
UTE INDRA-COMPAÑÍA VASCA DE INGENIERIA 60.00%
Company Direct interest

Indra • Consolidated Annual Accounts and Management Report
Consolidated Annual Accounts 149
UTE CGSI ASTURIAS LOTE 4 60.00%
UTE INDRA - ALBATROS 60.00%
UTE INDRA-UNISYS 60.00%
UTE INDRA-TELVENT 60.00%
UTE INDRA-PWC (ADIF) 60.00%
UTE PROINTEC-PYG MARJAL SUR 60.00%
UTE PROINTEC-E3 SOLINTEG (UTE COMITÉ D'OBRES) 60.00%
PROINTEC-UG 21 (TOCON-ILLORA) 60.00%
Company Direct interest
This appendix forms an integral part of notes 1 and 5 to the consolidated annual accounts, in conjunction with which it should be read.

Consolidated Annual Accounts 150
Indra Sistemas, S.A. and Subsidiaries Details of activities jointly operated with third parties at 31 December 2014
UTE PROINTEC-UG 21 (ALJARAFE II) 60.00%
UTE PROINTEC-EUSKONTROL II (UTE MANUALES) 60.00%
UTE ERNST & YOUNG 60.00%
UTE APIA 21 60.00%
UTE PROINTEC-UG 21 (COIN-ALHAURIN) 60.00%
UTE INDRA - AGFA 61.00%
UTE INDRA SISTEMAS, S.A. - EUROCOPTER ESPAÑA, SA 62.50%
UTE INDRA - IECISA 63.48%
UTE LINEA 9 TRAMO I Y II 64.00%
UTE INDRA - SAINCO 64.00%
UTE LINEA 9 MANTENIMIENTO TRAMO IV 64.00%
UTE INDRA - HP 65.00%
UTE DGT NOROESTE 2014 65.00%
UTE INDRA - LKS 65.00%
Company Direct interest

Indra • Consolidated Annual Accounts and Management Report
Consolidated Annual Accounts 151
UTE OVYCYL INDRA GRUPO NORTE II 66.00%
UTE IECISA - INDRA (SEFCAN) 66.82%
UTE INDRA BMB - T.SOLUCIONES 69.42%
UTE IMD INDRA.TELEF 69.76%
UTE TELECO 70.00%
UTE CGSI ASTURIAS LOTE 3 70.00%
UTE ALG - M & A 70.00%
UTE INDRA - ALFATEC 70.00%
UTE INDRA SISTEMAS, S.A. - UNISYS, S.L.U. 70.00%
UTE PWC - INDRA (EOI) 70.00%
UTE COMUNICACIONES EIBAR - AZITAIN 70.00%
PROINTEC-ALAUDA 70.00%
PROINTEC-MECSA&ARENAS ASOCIADOS (UTE RED ARTERIAL CARTAGENA 70.00%
Company Direct Interest

Indra • Consolidated Annual Accounts and Management Report
Consolidated Annual Accounts 152
MECSA-ESTUDIO TORRE ELORDUY 70.00%
PROINTEC-CONURMA INGENIEROS CONSULTORES, S.L. II 70.00%
PROINTEC - INGENIA SERVICIOS GLOBALES DE INGENIERIA, S.L. (UTE TRAMO 7 PLAYA DEL INGLES) 70.00%
PROINTEC-AQUATICA INGENIERIA CIVIL, SL 70.00%
PROINTEC-INGEPLAN (LINEA 3) 72.50%
PROINTEC-INGEPLAN (BERGARA) 72.50%
UTE MECSA-ACORDE (UTE PLAN FORMACION) 75.00%
UTE INDRA -TELEFÓNICA HDA 78.38%
UTE ITGIPUZKOA 80.00%
UTE INDRA SISTEMAS DE SEGURIDAD-MONTAJES ELECTRICOS ELECTRISUR 80.00%
UTE INDRA - IBM @ DFA 80.00%
UTE INDRA - CESSER 80.00%
UTE INDRA - ARTE 80.00%
UTE INDRA - FONTANERIA RAMOS 80.00%
UTE INDRA-SADIEL 043/2012 80.00%
Company Direct Interest
This appendix forms an integral part of notes 1 and 5 to the consolidated annual accounts, in conjunction with which it should be read.

Indra • Consolidated Annual Accounts and Management Report
Consolidated Annual Accounts 153
Indra Sistemas, S.A. and Subsidiaries Details of activities jointly operated with third parties at 31 December 2014
UTE INDRA-PUENTES Y CALZADAS INFRAESTRUCTURAS 80.00%
UTE CC MOVIMA 80.00%
PROINTEC-CIVILPORT-ENRIQUE AMIGO (UTE TRAMO 2 TREN DEL SUR) 80.00%
PROINTEC - AIRTHINK, S.L. - UTE PLANES DIRECTORES 80.00%
UTE INDRA - SADIEL 81.00%
UTE INDRA - SADIEL 81.00%
UTE INDRA - AVANZIT 82.00%
UTE 3 INDRA - UNITRONICS 85.00%
UTE 3 INDRA - UNITRONICS 4 85.00%
UTE 3 INDRA - UNITRONICS 5 85.00%
Company Direct Interest

Indra • Consolidated Annual Accounts and Management Report
Consolidated Annual Accounts 154
UTE 3 INDRA - UNITRONICS -"DEIF 2" 85.00%
UTE INDRA SISTEMAS, S.A. - SADIEL, S.A. "PROYECTO SADESI" 85.00%
UTE INDRA - AMBAR 85.00%
UTE INDRA-KONECTA 87.00%
UTE INDRA-OESIA 87.00%
UTE INDRA SISTEMAS, SA-AVANTIC ESTUDIO DE INGENIEROS, SL, UTE 89.50%
UTE INDRA - IRON 92.80%
UTE INDRA - SALLEN 70.00%
PROINTEC-PROINTEC EXTREMADURA II 100.00%
This appendix forms an integral part of notes 1 and 5 to the consolidated annual accounts, in conjunction with which it should be read.
Company Direct Interest

Indra • Consolidated Annual Accounts and Management Report
Consolidated Annual Accounts 155
2014 US DollarPound
SterlingMexican
PesoArgentine
PesoChilean Peso
Brazilian Real
Peruvian New Sol
Swiss FrancCanadian
Dollar
Other financial assets 5,724 - - - - - - - -
Total non-current assets 5,724 - - - - - - - -
Trade and other receivables - Non-Group 154,530 10,002 222 2,274 6 177 88
Other financial assets - Non-Group 33 42 - - - - - - -
Debt securities - Non-Group 1,852 - - - - - - - -
Total current assets 156,415 10,044 222 - - 2,274 6 177 88
Total assets 162,139 10,044 222 - - 2,274 6 177 88
Other financial liabilities 19 - - - - - - - -
Total non-current financial liabilities 19 - - - - - - - -
Loans and borrowings 2,581 - - - - - - - -
Trade and other payables 79,772 6,999 - 26 - 68 - 463 107
Total current liabilities 82,353 6,999 - 26 - 68 - 463 107
Total liabilities 82,372 6,999 - 26 - 68 - 463 107
Gross balance sheet exposure 79,767 3,045 222 (26) - 2,206 6 (286) (19)
Sales coverage 290,950 14,241 21,764 - 9,579 50,557 762 805 440
Purchase coverage 41,432 5,057 7 - 370 428 106 335 785
Derivative financial instruments - net hedges 249,518 9,184 21,757 - 9,209 50,129 656 470 (345)
Indra Sistemas, S.A. and SubsidiariesConsolidated Annual Accounts at 31 December 2014

Indra • Consolidated Annual Accounts and Management Report
Consolidated Annual Accounts 156
2014Norwegian
CroneColombian
PesoMoroccan
DirhamPolish Zloty
Australian Dollar
Turkish LiraTunisian
DinarOther
currencyTOTAL
Other financial assets - - - - - 38 - 73 5,835
Total non-current assets - - - - - 38 73 5,835
Trade and other receivables - Non-Group 36 4,579 9,348 3,435 158 7,312 8,133 15,286 215,586
Other financial assets - Non-Group - 445 - - - - 19 189 728
Debt securities - Non-Group - - - - - - - - 1,852
Total current assets 36 5,024 9,348 3,435 158 7,312 8,152 15,475 218,166
Total assets 36 5,024 9,348 3,435 158 7,350 8,152 15,548 224,001
Other financial liabilities - - - - - - - - 19
Total non-current financial liabilities - - - - - - - - 19
Loans and borrowings - - - - - - - - 2,581
Trade and other payables - 6,943 1,572 218 160 160 373 8,755 105,616
Total current liabilities - 6,943 1,572 218 160 160 373 8,755 108,197
Total liabilities - 6,943 1,572 218 160 160 373 8,755 108,216
Gross balance sheet exposure 36 (1,919) 7,776 3,217 158 7,350 8,152 6,793 115,785
Sales coverage 42 3,317 1,430 3,341 1,816 - - 32,388 -
Purchase coverage 1,846 605 108 55 368 - - - -
Derivative financial instruments - net hedges (1,804) 2,712 1,322 3,286 1,448 - - 32,388 -
This appendix forms an integral part of note 37) a) (I) to the consolidated annual accounts, in conjunction with which it should be read.
Indra Sistemas, S.A. and SubsidiariesConsolidated Annual Accounts at 31 December 2014

Indra • Consolidated Annual Accounts and Management Report
Consolidated Annual Accounts 157
Indra Sistemas, S.A. and Subsidiaries Consolidated Annual Accounts at 31 December 2013Group exposure to currency risk
2013 US DollarPound
SterlingMexican
PesoArgentine
PesoChilean
PesoBrazilian
RealPeruvian New Sol
Colombian Peso
Moroccan Dirham
Australian Dollar
Other currency
TOTAL
Other financial assets 120 - - - - - - - 22 - 2 144
Total non-current assets 120 - - - - - - - 22 - 2 144
Trade and other receivables - Non-Group 96,259 10,087 - 4,057 75 3,296 - 19,526 - 188 95,120 228,608
Other financial assets - Non-Group 5 - - - - - - - - - 233 238
Debt securities - Non-Group 2,549 - - - - - - - - - - 2,549
Total current assets 98,813 10,087 - 4,057 75 3,296 - 19,526 - 188 95,353 231,395
Total assets 98,933 10,087 - 4,057 75 3,296 - 19,526 22 188 95,355 231,539
Other financial liabilities - - - - - - - - - - - 0
Total non-current financial liabilities - - - - - - - - - - - -
Loans and borrowings - - - 48 - - - - - - - 48
Trade and other payables 14,432 5,463 1 7 - 239 - 17,984 - 72 38,198
Total current liabilities 14,432 5,463 1 55 - 239 - 17,984 - 72 - 38,246
Total liabilities 14,432 5,463 1 55 - 239 - 17,984 - 72 - 38,246
Gross balance sheet exposure 84,501 4,624 (1) 4,002 75 3,057 - 1,542 22 116 95,355 193,293
Sales coverage 267,166 9,074 19,143 5,690 10,442 14,442 3,981 13,161 - 12,805 17,221 -
Purchase coverage 42,727 6,952 69 22 - 271 1,916 - 32 6,122 -
Derivative financial instruments - net hedges 224,439 2,122 19,073 5,690 10,421 14,442 3,710 11,244 - 12,774 17,221 -
This appendix forms an integral part of note 37) a) (I) to the consolidated annual accounts, in conjunction with which it should be read.

Indra • Consolidated Annual Accounts and Management Report
Consolidated Annual Accounts 158
Indra Sistemas, S.A. and SubsidiariesConsolidated Annual Accounts at 31 December 2014Information on significant non-controlling interests at 31 December 2014 and 2013
2014 Thousands of Euros Indra Philippines Inmize Sistemas Electrica SoluzionaOther
minor companiesTotal
Percentage of non-controlling interest 50% 50% 49%
Information on the statement of financial position -
Non-current assets 2,722 1 91 - 2,814
Non-current liabilities (2,172) - (51) - (2,223)
Total non-current net assets 550 1 40 - 591
Current assets 23,598 7,997 2,925 - 34,520
Current liabilities (11,467) (262) (823) - (12,552)
Total current net assets 12,131 7,735 2,102 - 21,968
Net assets 12,681 7,736 2,142 - 22,559
Carrying amount of non-controlling interests (*) 6,341 3,868 1,056 1,877 13,142
Information on the income statement
Revenues 31,516 594 2,695 - 34,804
Profit/(loss) for the year 2.274 - 544 - 2.818
Total comprehensive income 2.274 64 544 - 2.882
Consolidated profit/(loss) attributable to non-controlling interests 1.137 32 268 71 1.508
(*) Excluding translation differences
This appendix forms an integral part of note 37) a) (I) to the consolidated annual accounts, in conjunction with which it should be read.

Indra • Consolidated Annual Accounts and Management Report
Consolidated Annual Accounts 159
2013 Thousands of Euros Indra Philippines Inmize Sistemas Electrica SoluzionaOther
minor companiesTotal
Percentage of non-controlling interest 50% 50% 49%
Information on the statement of financial position
Non-current assets 2,375 1 212 - 2,588
Non-current liabilities (2,156) - (6) - (2,162)
Total non-current net assets 219 1 206 - 426
Current assets 20,231 8,294 1,914 - 30,439
Current liabilities (10,074) (629) (520) - (11,223)
Total current net assets 10,157 7,665 1,394 - 19,216
Net assets 10,376 7,666 1,600 - 19,642
Carrying amount of non-controlling interests (*) 5,188 3,833 789 1,825 11,635
Information on the income statement
Revenues 31,824 2,712 2,835 - 37,371
Profit/(loss) for the year
Total comprehensive income
Consolidated profit/(loss) attributable to non-controlling interests 2,200 478 233 - 2,911
(*) Excluding translation differences
Indra Sistemas, S.A. and SubsidiariesConsolidated Annual Accounts at 31 December 2014Information on significant non-controlling interests at 31 December 2014 and 2013
This appendix forms an integral part of note 37) a) (I) to the consolidated annual accounts, in conjunction with which it should be read.