Confidence Crisis Exposes Economic Weakness
34
Confidence Crisis Exposes Economic Weakness Pic 1 Russia Economic Report March 2014 | Edition No. 31
-
Upload
colette-collins -
Category
Documents
-
view
28 -
download
0
description
Confidence Crisis Exposes Economic Weakness. Pic 1. Russia Economic Report March 2014 | Edition No. 31. Russia Economic Report No. 31. Recent Economic Developments Outlook and Risks Economic Mobility and Middle Class Formation. Main messages. 1. Russia is in economic downturn - PowerPoint PPT Presentation
Transcript of Confidence Crisis Exposes Economic Weakness

Confidence Crisis Exposes Economic Weakness
Pic 1
Russia Economic Report March 2014 | Edition No. 31

Russia Economic Report No. 31
1. Recent Economic Developments
2. Outlook and Risks
3. Economic Mobility and Middle Class Formation

•Real GDP growth slowed to an estimated 1.3 percent in 2013 from 3.4 percent of 2012
•Lack of structural reforms eroded investors’ confidence - masked by a growth model based on large public demand stimuli and oil revenues.
•Frail domestic demand was a drag on economic growth.
Russia is in economic downturn
as business and consumer sentiments
remain weak
Two lower growth scenarios for Russia in
an environment of more volatile global
markets
•Crimean events have compounded the lingering confidence problem into a crisis and exposed the economic weakness of the growth model.
•World Bank low-risk scenario projects 1.1 percent growth for 2014 (1.3 in 2015), the high-risk scenario -1.8 percent (2.1 in 2015).
•Global risks remain prominent with higher market volatility.
Economic mobility and middle-class
formation could be on hold
• Weaker growth prospects and stabilizing consumption at a lower rate dim the economic mobility outlook.
•Poverty-reduction and middle-class growth was explained by high growth in average incomes and consumption during 2000-2010.
•Middle-class growth needs job creation and higher employment rates.
1
2
3
Crisis response could replace the structural
reform agenda
•To overcome the current confidence crisis and achieve sustained long-term growth, structural reforms would need to resume.
•Risk that policy choices will be about responding to short-term crises and upholding macroeconomic stability, depending on the evolving scenario.
4
Main messages

Recent Economic Developments:Loss of Confidence
Leads to Unfulfilled Expectations

Russia’s Economic Downturn
-12
-8
-4
0
4
8
12
Q1 07Q4 07 Q4 08 Q4 09 Q4 10 Q4 11 Q4 12 Q4 13
Russia OECD HIEU Emerging Other Emerging
World GDP growth, y-o-y, percent

→ Weak Domestic Demand
-23
-15
-7
1
9
17Q
1 08
Q2
08
Q3
08
Q4
08
Q1
09
Q2
09
Q3
09
Q4
09
Q1
10
Q2
10
Q3
10
Q4
10
Q1
11
Q2
11
Q3
11
Q4
11
Q1
12
Q2
12
Q3
12
Q4
12
Q1
13
Q2
13
Q3
13
Consumption GFCF Change in stockExport Import Stat errorGDP growth
Growth composition, percent, y-o-y

→ Confidence Loss: Businesses & Consumers
-5
-4
-3
-2
-1
0
1
2
3
4
-5
-4
-3
-2
-1
0
1
2
3
Jan-12 Jun-12 Nov-12 Apr-13 Sep-13 Feb-14
Industrial Production, m-o-m Business Confidence PMI
-40
-35
-30
-25
-20
-15
-10
-5
0
5
-10
-5
0
5
10
15
20
Consumption growth, y-o-y Consumer Confidence (RHS)

World Bank Outlook for Russia:Two Lower Growth Scenarios

→ Market Response to Crimea Events
35
36
37
38
39
40
41
42
43
44
0
500
1000
1500
2000
2500
3000
3500
1000
1100
1200
1300
1400
1500
1600
Trade volume, mln USD (right axis) RTS index
Exchange rate dynamics, Euro-Dollar basket Stock market reaction

A Questions of Confidence and Geopolitical Risks
Low-risk scenario: Assumes a limited and short-lived effect of the Crimea crisisHigh-risk scenario*: Assumes a more severe shock to economic and investment
activities due to escalation of Crimea crisis
Global real GDP growth, percent
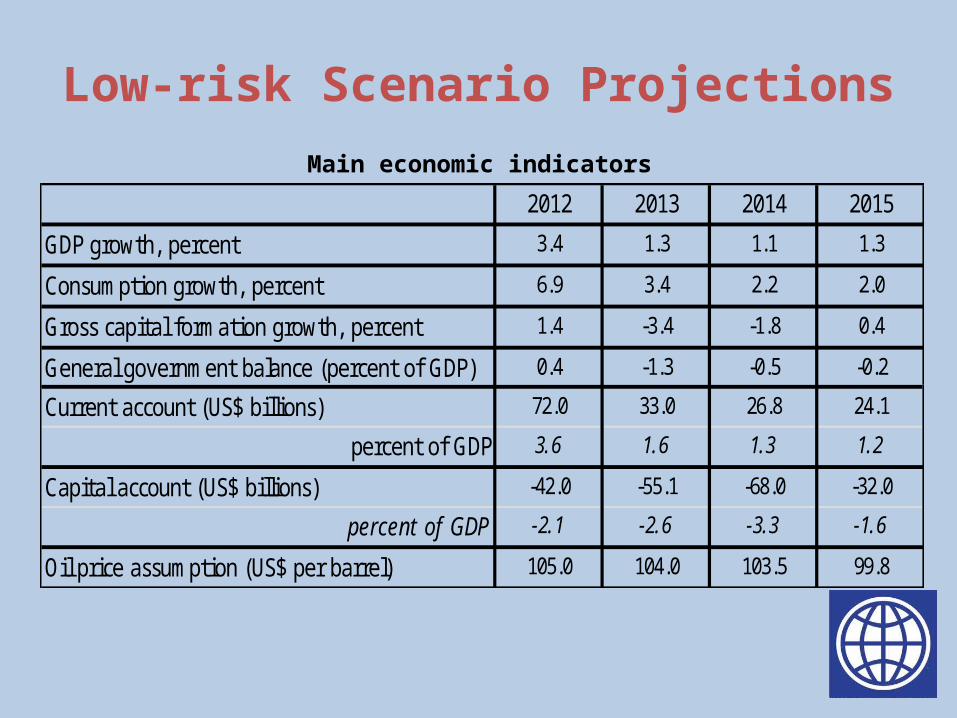
Low-risk Scenario ProjectionsMain economic indicators
2012 2013 2014 2015
GDP growth, percent 3.4 1.3 1.1 1.3
Consumption growth, percent 6.9 3.4 2.2 2.0
Gross capital formation growth, percent 1.4 -3.4 -1.8 0.4
General government balance (percent of GDP) 0.4 -1.3 -0.5 -0.2
Current account (US$ billions) 72.0 33.0 26.8 24.1
percent of GDP 3.6 1.6 1.3 1.2
Capital account (US$ billions) -42.0 -55.1 -68.0 -32.0
percent of GDP -2.1 -2.6 -3.3 -1.6
Oil price assumption (US$ per barrel) 105.0 104.0 103.5 99.8

High-risk Scenario ProjectionsMain economic indicators
2012 2013 2014 2015
GDP growth, percent 3.4 1.3 -1.8 2.1
Consumption growth, percent 6.9 3.4 0.8 1.1
Gross capital formation growth, percent 1.4 -3.4 -10.3 5.0
General government balance (percent of GDP) 0.4 -1.3 -0.9 -0.5
Current account (US$ billions) 72.0 33.0 60.2 49.4
percent of GDP 3.6 1.6 3.0 2.5
Capital account (US$ billions) -42.0 -55.1 -133.0 -62.2
percent of GDP -2.1 -2.6 -6.7 -3.1
Oil price assumption (US$ per barrel) 105.0 104.0 103.5 99.8

→ Higher Global Market VolatilityFed tapering effect on emerging markets
96
97
98
99
100
101
85
87
89
91
93
95
97
99
101
103
105
MSCI EM stock indexEMBIG bond indexEM currency*(right axis)
Note: * Nominal Effective Exchange Rate
Fed "no tapering" announcement Fed "tapering" announcement
Index, reabsed April1, 2013 =100

→ Tight International Financial ConditionsGross capital flows to developing countries

→ Increased Currency Volatility and Credit RiskExchange rate and its bilateral band Credit Growth, percent, y-o-y
273033363942454851
2010 2011 2012 2013 2014
Rb/ USD Rb/ Eur Basket
Lower bound Upper bound
-20
-10
0
10
20
30
40
50
60
Dec-
07Ma
r-08
Jun-
08Se
p-08
Dec-
08Ma
r-09
Jun-
09Se
p-09
Dec-
09Ma
r-10
Jun-
10Se
p-10
Dec-
10Ma
r-11
Jun-
11Se
p-11
Dec-
11Ma
r-12
Jun-
12Se
p-12
Dec-
12Ma
r-13
Jun-
13Se
p-13
Dec-
13
Nonfinancial Organisations Households

Policy Choices for a New Growth Model

Special Focus NoteEconomic Mobility and Middle Class Formation

A few facts about the analysis
• Focus: Emergence and growth of middle class in Russia in 2000-2010, against broader background of economic mobility
• Data: Russian Longitudinal Monitoring Survey (RLMS-HSE, 2000-2010)
• Some conceptsEconomic classes
• Poor: Household per capita income lower than $5/day (2005 PPP)• Vulnerable: Household per capita income between $5/day and $10/day
(2005 PPP)• Middle class: Household per capita income above $10/day (2005 PPP)
Economic mobility• Upwards: Household experience positive real income growth over
period of study• Downwards: Household experience negative real income growth over
period of study

Rapid growth of the middle class, particularly in middle-income regions and countries…
0%10%20%30%40%50%60%70%80%90%
100%
2000s 2010s 2000s 2010s 2000s 2010s 2000s 2010s 2000s 2010s 2000s 2010s
South Asia Middle Eastand North
Africa
Sub SaharanAfrica
East Asia AndPacific
Latin Americaand
Caribbean
Europe andCentral Asia
Per
cent
age
of p
opul
atio
n
extreme poor poor vulnerable middle class
Percentage of population in each income group by region, 2000-2010

…but not all middle-income countries are middle-class societies
Percentage of population in middle class and GDP per capita
02468101214161820
0
10
20
30
40
50
60
70
GD
P p
er c
apita
(PP
P, T
hous
ands
of $
)
Per
cent
age
of p
opul
atio
n
less than 30% 30% - 50% more than 50% GDP per capita (PPP)

The Russian middle class is the largest in Eastern Europe and Central Asia
Percentage of population in each income group by country, 2010
0%
10%
20%
30%
40%
50%
60%
70%
80%
90%
100%
extreme poor poor vulnerable middle class

The size of the middle class in Russia doubled from 2001 to 2010 …
Percentage of population, 2001-2010
0%
10%
20%
30%
40%
50%
60%
70%
2001 2002 2003 2004 2005 2006 2007 2008 2009 2010
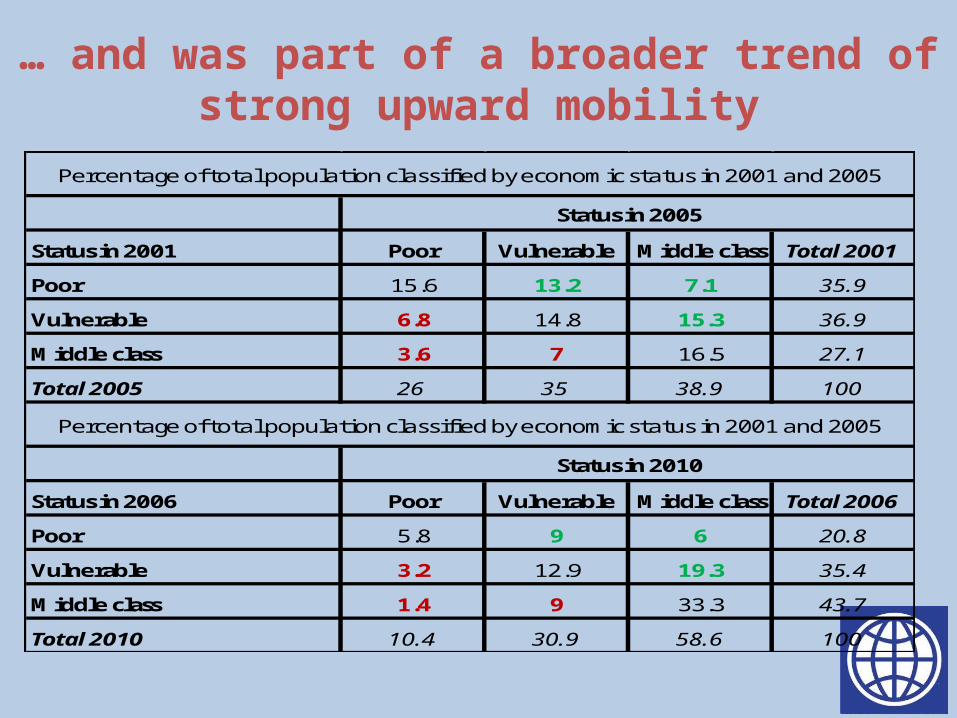
… and was part of a broader trend of strong upward mobility
Status in 2001 Poor Vulnerable Middle class Total 2001
Poor 15.6 13.2 7.1 35.9
Vulnerable 6.8 14.8 15.3 36.9
Middle class 3.6 7 16.5 27.1
Total 2005 26 35 38.9 100
Status in 2006 Poor Vulnerable Middle class Total 2006
Poor 5.8 9 6 20.8
Vulnerable 3.2 12.9 19.3 35.4
Middle class 1.4 9 33.3 43.7
Total 2010 10.4 30.9 58.6 100
Percentage of total population classified by economic status in 2001 and 2005
Status in 2005
Percentage of total population classified by economic status in 2001 and 2005
Status in 2010

Middle-income households have better human capital endowments…
Lower old-age (and child) dependency ratios…
Ratio of household members ages 65 and up to working-age adults
… and higher education levels among working age adults
Percentage of all working-age adults with different levels of education
0%
10%
20%
30%
40%
50%
60%
70%
80%
90%
100%
poor vulnerable middle class
PTU diploma Tekhnikum diploma complete higher
incomplete secondary complete secondary
0.00
0.05
0.10
0.15
0.20
0.25
0.30
0.35
poor vulnerable middle class
2001 2010

… and better access to markets and economic opportunities
• Higher percentage of middle income households resides in urban areas….– 70 percent versus 58 percent (vulnerable) and 37 percent (poor)
… although middle class not exclusively an urban phenomenon
– 25 percent of middle class households resided in rural areas in 2010, compared to 17 percent in 2000
• Better labor market outcomes among middle income households– 70 percent of working age adults in middle class households are employed versus
60 percent (vulnerable) and 50 percent (poor)– 4 percent of active adults are unemployed in middle class households versus 8
percent (vulnerable) and 12 percent (poor)

As a consequence, labor earnings are relatively more important for middle-class households
Better human capital and access to economic opportunities translate into higher shares of labor and capital income in total income among middle class households….Percentage of total income accounted for by different income sources by economic groups, 2010
… although there is an increased share of pensions in total income among middle class households in 2006-2010
Percentage of total households income accounted for by different income sources, 2001 and 2010.
0%10%20%30%40%50%60%70%80%90%
100%
2001 2010
earnings from public employment earnings from private employment
capital income pensions
other social benefits private transfers
other income
0%10%20%30%40%50%60%70%80%90%
100%
poor vulnerable middle class
earnings from public employment earnings from private employment
capital income pensions
other social benefits private transfers
other income

Drivers of middle-class entry in Russia
• Economic rather than demographic factors drove middle class growth in 2001-2010
• Wage and pension growth accounted for over half of observed income growth among middle class entrants
• Relative contribution of wages to income growth decreased between 2001-2005 and 2006-2010 while that of pensions increased -20%
0%
20%
40%
60%
80%
100%
2001 - 2010 2001 - 2005 2006 - 2010
dependency (young)
dependency (old)
employment rate
wage (private)
wage (public)
capital
pensions
other public transfers
private transfers
other income
Contribution to observed inflow into middle class, 2001-2010

Conclusions
28

Thank you!For more information about the World Bank and its
activities in the Russian Federation, please visit: www.worldbank.org/russia
If you would like to be access our Russia Economic Reports, please visit:
www.worldbank.org/eca/rer
For questions and comments relating to this publication, please contact [email protected].

EXTRA SLIDES

Disposable Income Growth DecreasedContribution to income growth, percent, y-o-y
-6-4-202468
1012
1 2 3 4 1 2 3 4 1 2 3 4 1 2 3 4 1 2 3 4*
2009 2010 2011 2012 2013
others business and propertypublic wages and transfers market wagestotal

Gap Between Real Wages and Productivity Differs Across Sectors
Gap between real wages and productivity growth by sector, y-o-y change
90
95
100
105
110
115
120
125
130
135
1 2 3 4 1 2 3 4 1 2 3 4 1 2 3 4 1 2 3 4 1 2 3
2008 2009 2010 2011 2012 2013
Total Tradables Non-tradables Non-market

Ongoing Depreciation Will Impact Inflation DynamicsCPI inflation by component, percent, y-o-y
0
2
4
6
8
10
12
14
16
2007 2008 2009 2010 2011 2012 2013 2014
Food Non-Food Services CPI

Fiscal Impact: Balances under Pressure
Note: The consolidated budget includes the federal budget, the subnational budgets and extra-budgetary funds, e.g. pension and social security.
2011 2012 2013
Actual Actual Preliminary
Federal Budget
Expenditures 20.1 20.6 20.0
Revenues 20.9 20.5 19.5
Balance 0.8 -0.1 -0.5
Consolidated Budget
Expenditures 35.9 36.6 37.4
Revenues 37.5 37.0 36.1
Balance 1.6 0.4 -1.3
Consolidated Subnational Budget
Expenditures 13.8 13.3 13.2
Revenues 13.7 12.9 12.2
Balance -0.1 -0.4 -1.0
percent of GDP