Co-generation Cogeneration is an attractive option for facilities with high electric rates and...
28
Transcript of Co-generation Cogeneration is an attractive option for facilities with high electric rates and...

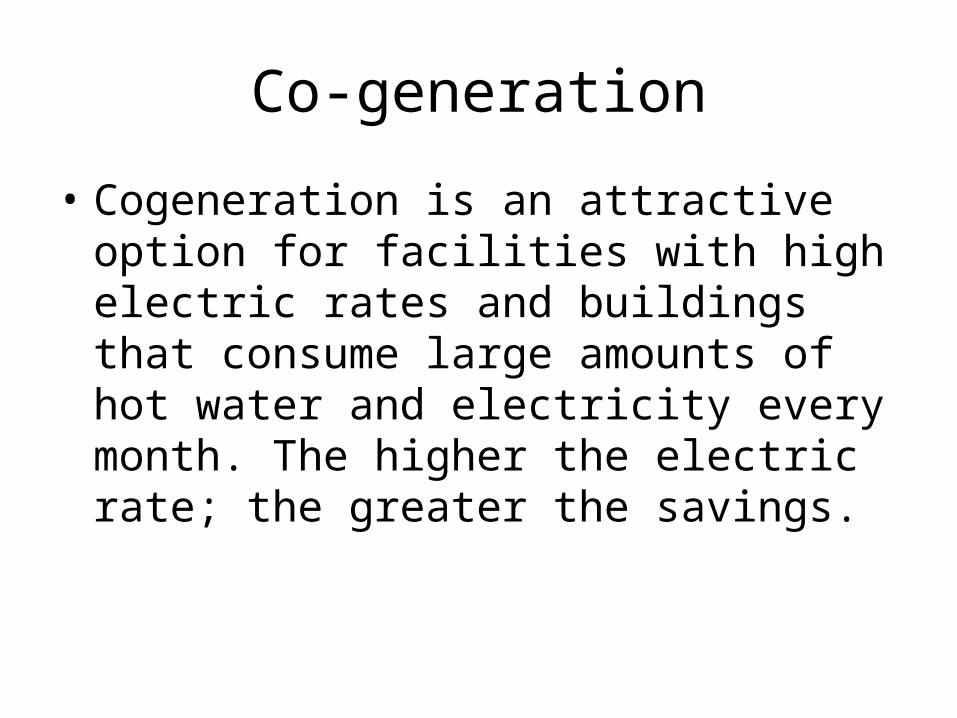
Co-generation
• Cogeneration is an attractive option for facilities with high electric rates and buildings that consume large amounts of hot water and electricity every month. The higher the electric rate; the greater the savings.

Last 3 years of Utility Costs at BHS
310000
320000
330000
340000
350000
360000
370000
380000
390000
400000
410000
1
BHS Utilities CostComparison
2003-2004
2004-2005
2005-2006
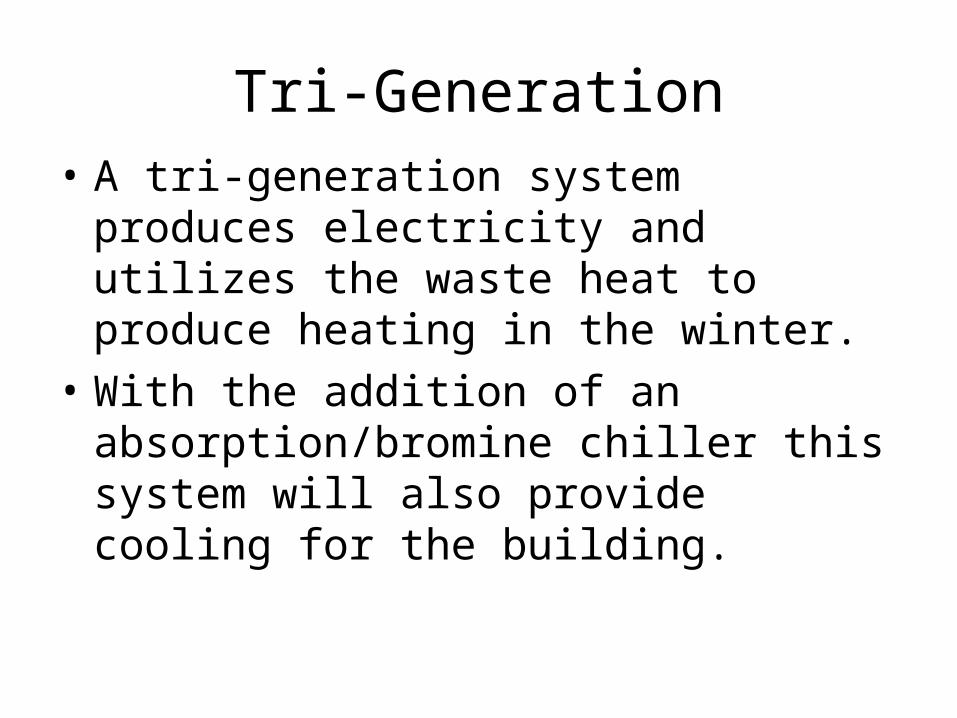
Tri-Generation• A tri-generation system produces
electricity and utilizes the waste heat to produce heating in the winter.
• With the addition of an absorption/bromine chiller this system will also provide cooling for the building.
22’
23’
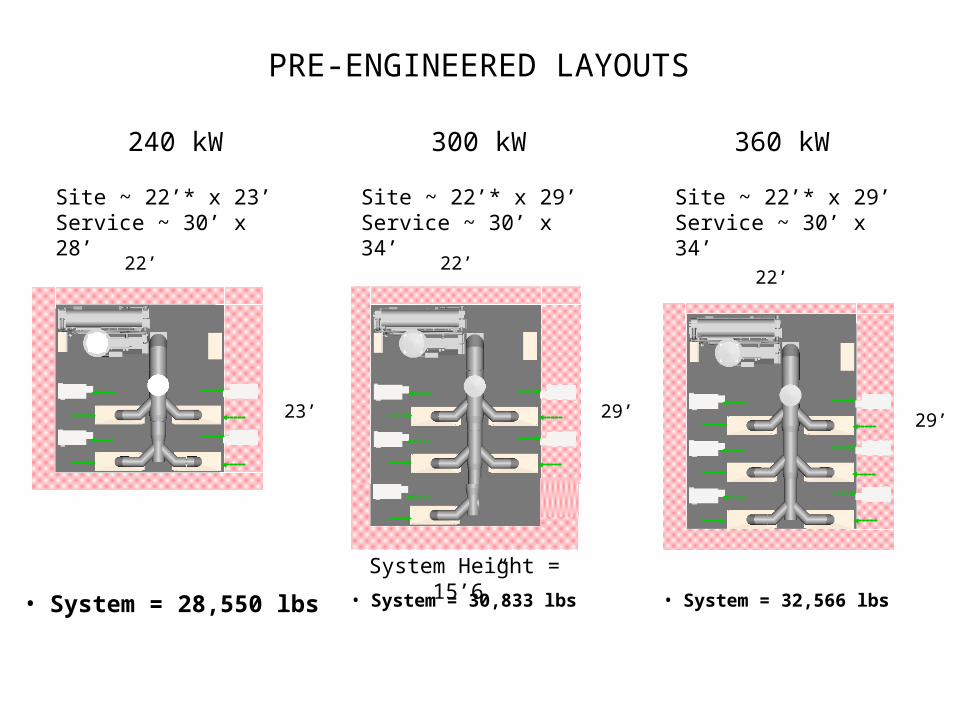
Site ~ 22’* x 23’Service ~ 30’ x 28’
PRE-ENGINEERED LAYOUTS
Site ~ 22’* x 29’Service ~ 30’ x 34’
Site ~ 22’* x 29’Service ~ 30’ x 34’
22’
29’
• System = 28,550 lbs • System = 30,833 lbs • System = 32,566 lbs
29’
System Height = 15’6”
22’
240 kW 300 kW 360 kW

Benefits
• Environmentally friendly• Reduces fossil fuel consumption• Reduces dependency on electrical grid• Produces electricity while also providing
heating or cooling as a by-product• Provides backup generation capabilities• Extends life of existing equipment• Saves Money $$$$$$$$$$$$$$$$$$$$
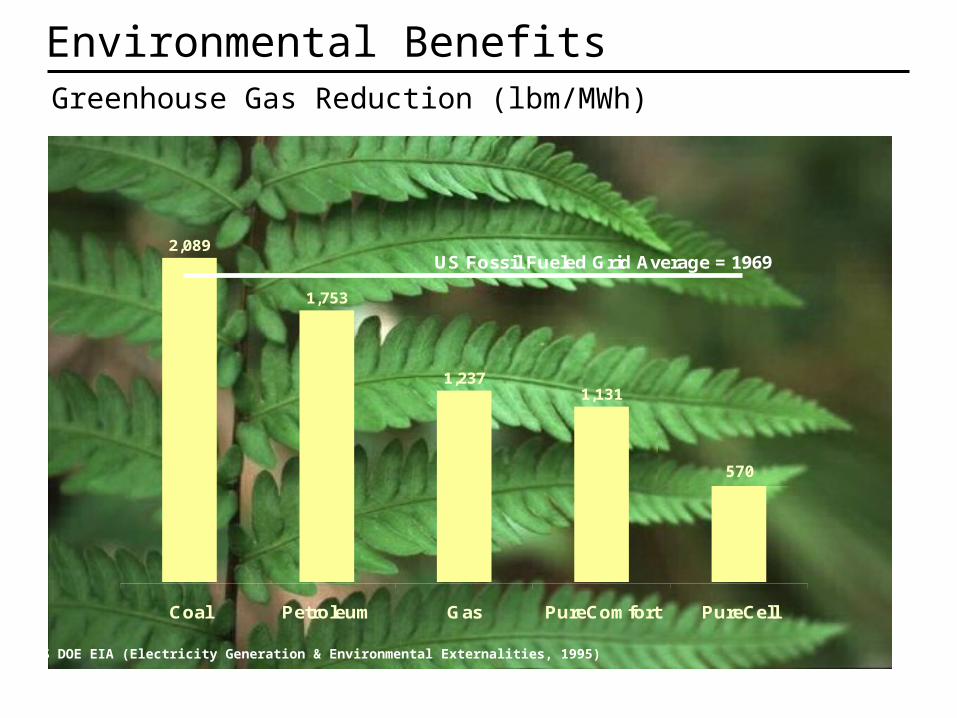
2,089
1,753
1,2371,131 1,128
Coal Petroleum Gas PureComfort PureCell
US Fossil Fueled Grid Average = 1969
570
2,089
1,753
1,2371,131 1,128
Coal Petroleum Gas PureComfort PureCell
US Fossil Fueled Grid Average = 1969
570
Ref: US DOE EIA (Electricity Generation & Environmental Externalities, 1995)
Environmental BenefitsGreenhouse Gas Reduction (lbm/MWh)
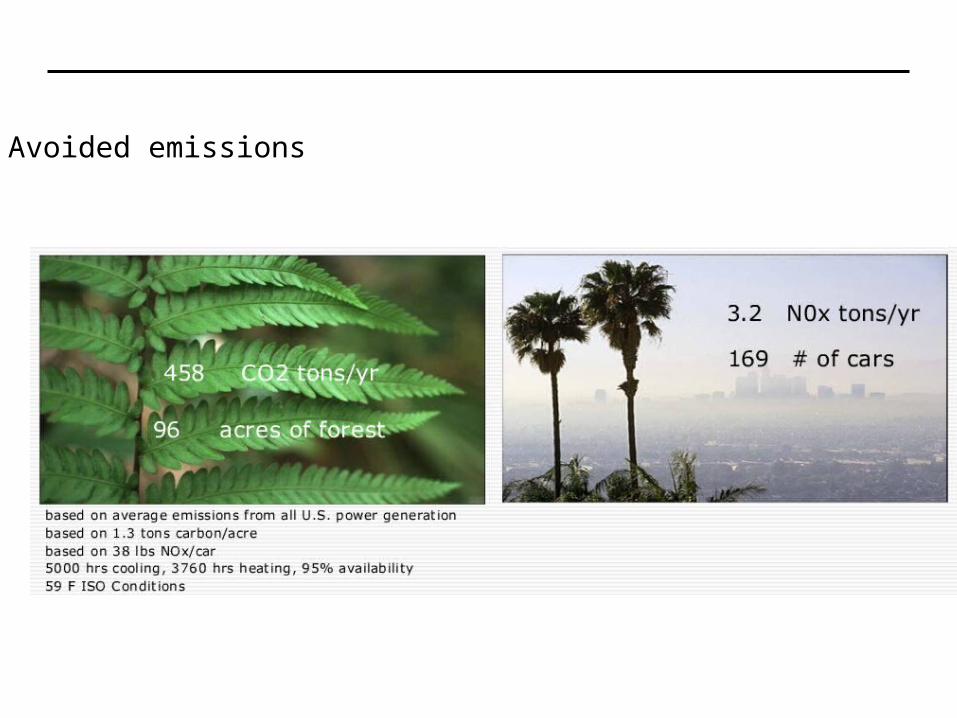
Avoided emissions
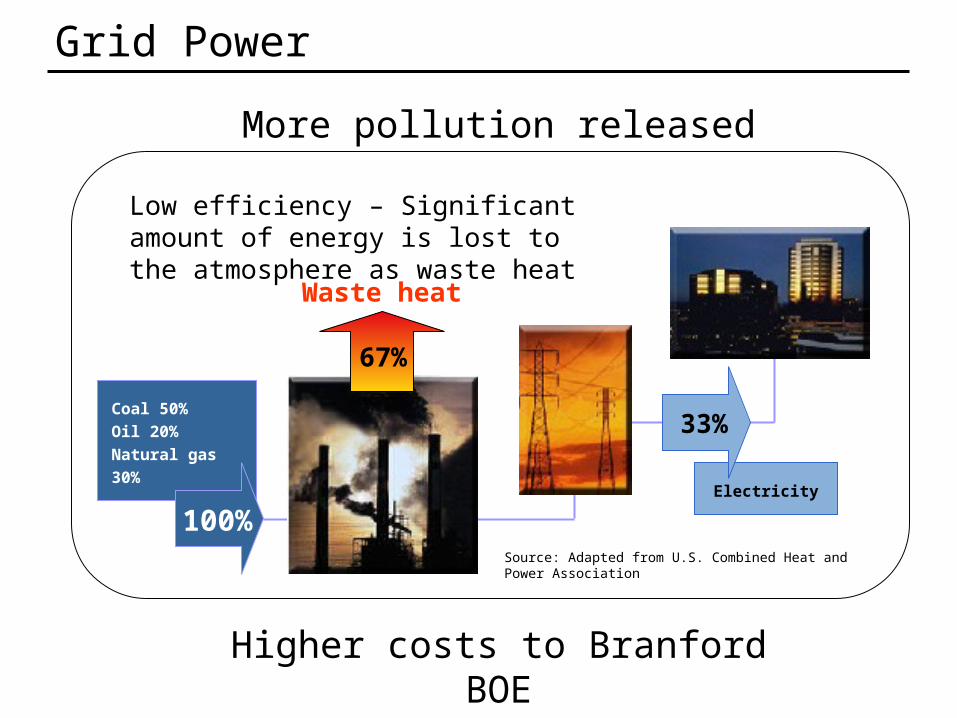
Coal 50%
Oil 20%
Natural gas 30%
Waste heat
Electricity
100%
33%
67%
Low efficiency – Significant amount of energy is lost to the atmosphere as waste heat
Source: Adapted from U.S. Combined Heat and Power Association
More pollution released
Higher costs to Branford BOE
Grid Power

Risks
• Energy costs decrease (Electricity)
• Natural Gas rises/Oil prices fall
• Equipment Failure (Maintenance and replacement costs are built into agreement and calculated into savings)

Energy Rates - Snapshots
http://www.clpenergyinfo.com/stabilize/index.php
http://www.wtrg.com/daily/heatingoilprice.html http://www.wtrg.com/daily/gasprice.html

Costs Associated
• Purchase of Natural Gas
• BOE would seek long term contract on Natural Gas
• Initial Equipment Purchases
• Equipment maintenance
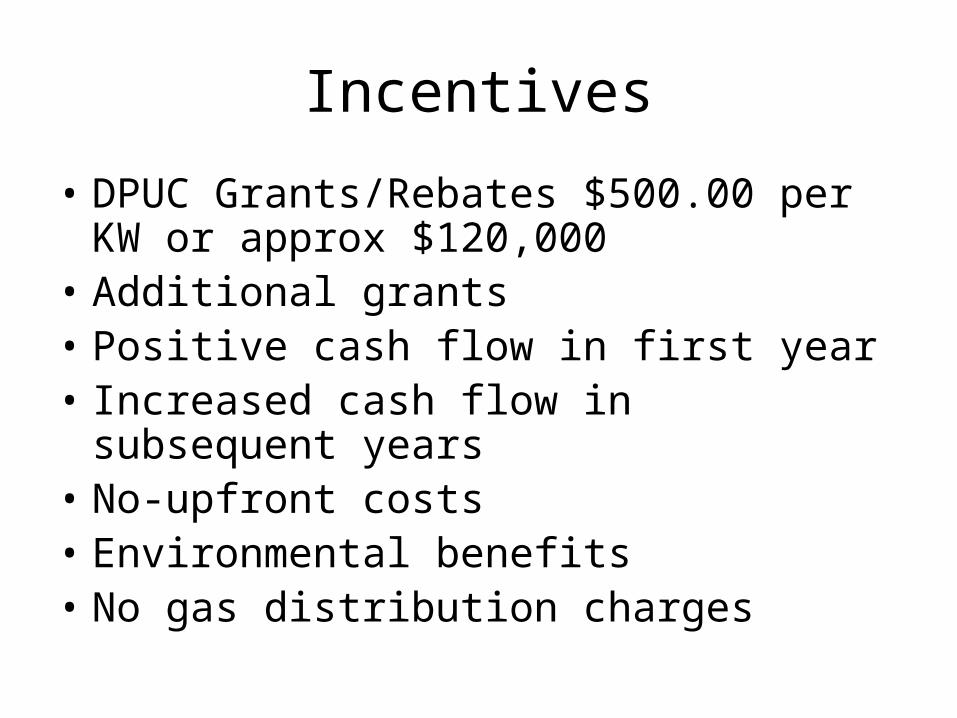
Incentives
• DPUC Grants/Rebates $500.00 per KW or approx $120,000
• Additional grants• Positive cash flow in first year• Increased cash flow in subsequent years • No-upfront costs• Environmental benefits• No gas distribution charges

Natural gas
Waste heat
Electricity
Hot water
Chilled water100%
80%
High efficiency – More waste heat recovered and converted to usable energy
Source: Adapted from U.S. Combined Heat and Power Association
20%
Less pollution released
Lower costs and assured power to the end user
or


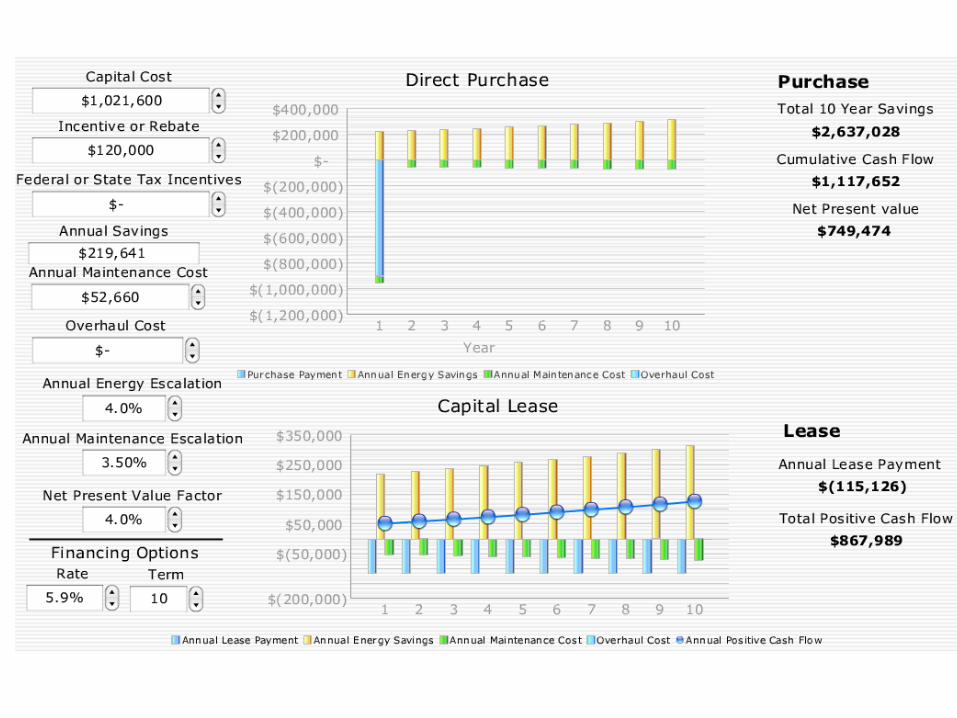
Financial Model
Energy Savings Assumptions:Electrical Power 8,322 Hours Generated
Cooling 2,628 HoursHeating 3,504 Hours
Aux. Thermal Heating 1752 HoursBaseline Electrical Rate 16.70 ¢/kWh
Baseline Natural Gas Rate 9.50$ /MCFBaseline Fuel Oil Rate 2.40$ /gallon
PurchaseCapital Cost 1,029,790$ Incentive or Rebate 120,000$ Net Purchase Price 909,790$
4.4
Year 1 2 3 4 5 6 7 8 9 10 TotalPurchase Payment (909,790)$ (909,790)$ Annual Energy Savings 207,124$ 215,409$ 224,025$ 232,986$ 242,306$ 251,998$ 262,078$ 272,561$ 283,463$ 294,802$ 2,486,753$ Annual Maintence Cost (49,660)$ (51,398)$ (53,197)$ (55,059)$ (56,986)$ (58,981)$ (61,045)$ (63,181)$ (65,393)$ (67,681)$ (582,581)$ Overhaul Cost -$ -$ -$ -$ Annual Positive Cash Flow (Cumulative) (752,326)$ 164,011$ 170,828$ 177,927$ 185,320$ 193,018$ 201,033$ 209,380$ 218,071$ 227,121$ 994,382$
Net Present Value $649,478 @ 4.0%
Capital LeaseCapital Cost 1,029,790$ Incentive or Rebate 120,000$ Net Purchase Price 909,790$
Rate 5.9% annualTerm 10 years
Year 1 2 3 4 5 6 7 8 9 10 TotalAnnual Lease Payment (116,172)$ (116,172)$ (116,172)$ (116,172)$ (116,172)$ (116,172)$ (116,172)$ (116,172)$ (116,172)$ (116,172)$ (1,161,722)$ Annual Energy Savings 207,124$ 215,409$ 224,025$ 232,986$ 242,306$ 251,998$ 262,078$ 272,561$ 283,463$ 294,802$ 2,486,753$ Annual Maintenance Cost (49,660)$ (51,398)$ (53,197)$ (55,059)$ (56,986)$ (58,981)$ (61,045)$ (63,181)$ (65,393)$ (67,681)$ (582,581)$ Overhaul Cost -$ -$ -$ -$ -$ -$ -$ -$ -$ -$ -$ Annual Positive Cash Flow 41,292$ 47,839$ 54,656$ 61,755$ 69,148$ 76,845$ 84,861$ 93,207$ 101,899$ 110,948$ 742,450$
157,464$ 164,011$ 170,828$ 177,927$ 185,320$ 193,018$ 201,033$ 209,380$ 218,071$ 227,121$ AssumptionsAnnual Energy Escalation 4.0%Annual Maintenance Escalation 3.50%

Heating fuel Savings WIS
• Walsh Intermediate HVAC replacement project 2003-2004
• Annual reduction of 60,000 gallons #2 Heating Fuel Oil• The 02-03 heating season used 98,034 gallons of fuel• 03-04, 38,454 gallons used• 04-05, 35,117 gallons used• 05-06, 29,733 gallons used• 06-07, 35,644 gallons used• Fuel Avoidance since project completion 253,188
Gallons or

WIS HVAC WIS Baseline Did Nothing WIS Actual Did Nothing WIS Actual
Utilities 2001/2002 2004/2005 2004/2005 2005/2006 2005/2006
Oil Gallons 98,454.00 98,454.00 35,117.00 98,454.00 29,733.00
Oil Cost Total $85,654.98 $172,294.50 $61,454.75 $201,830.70 $60,952.65
Cost per gallon 0.87 1.75 1.75 2.05 2.05
Electric KWH 2,780,160 2,780,160 1,431,360 2,780,160 1,448,640
Electric Cost $247,933.00 $344,739.84 $178,202.00 $378,101.76 $198,129.00
Electric Rate 0.089 0.124 0.124 0.136 0.136
Totals $333,587.98 $517,034.34 $239,656.75 $579,932.46 $259,081.65
Cost Avoidance $277,377.59 $320,850.81
Capital Lease $1,209,840.00 $120,984.00 $120,984.00
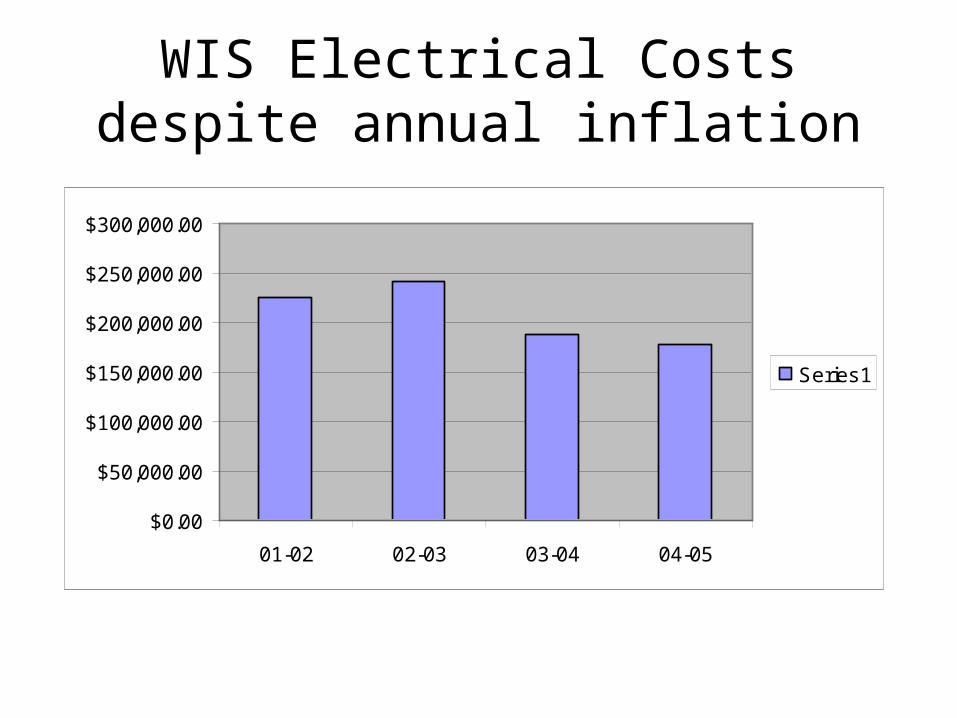
WIS Electrical Costs despite annual inflation
$0.00
$50,000.00
$100,000.00
$150,000.00
$200,000.00
$250,000.00
$300,000.00
01-02 02-03 03-04 04-05
Series1

Other conservation initiatives
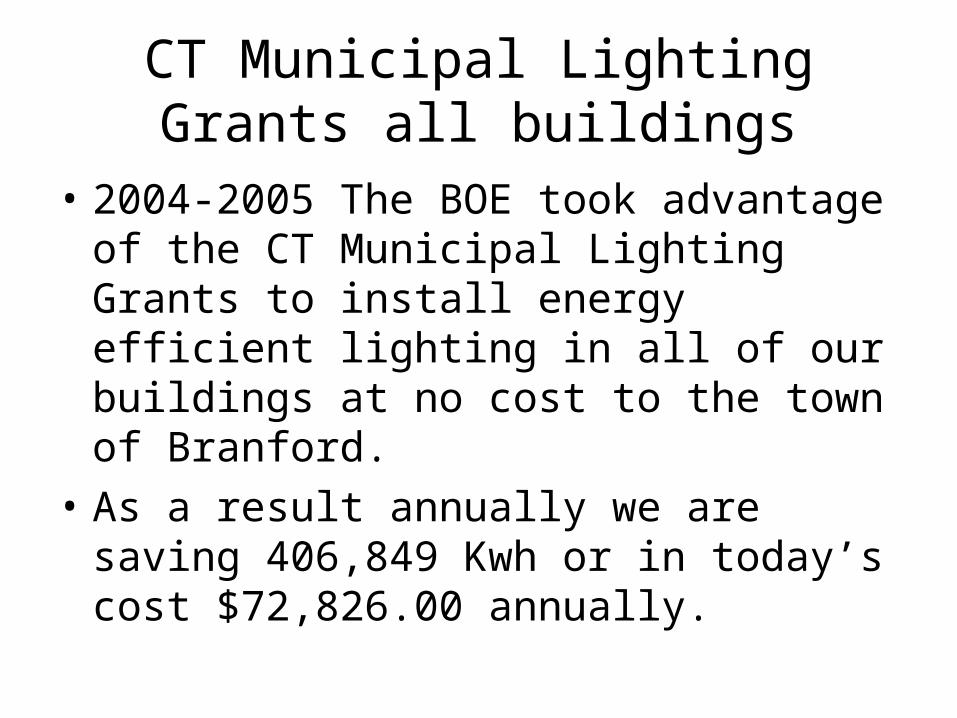
CT Municipal Lighting Grants all buildings
• 2004-2005 The BOE took advantage of the CT Municipal Lighting Grants to install energy efficient lighting in all of our buildings at no cost to the town of Branford.
• As a result annually we are saving 406,849 Kwh or in today’s cost $72,826.00 annually.
EMS at MTM and MRT
• Cost of Project is $43,000.00 per school
• Completed Project November 17, 2006
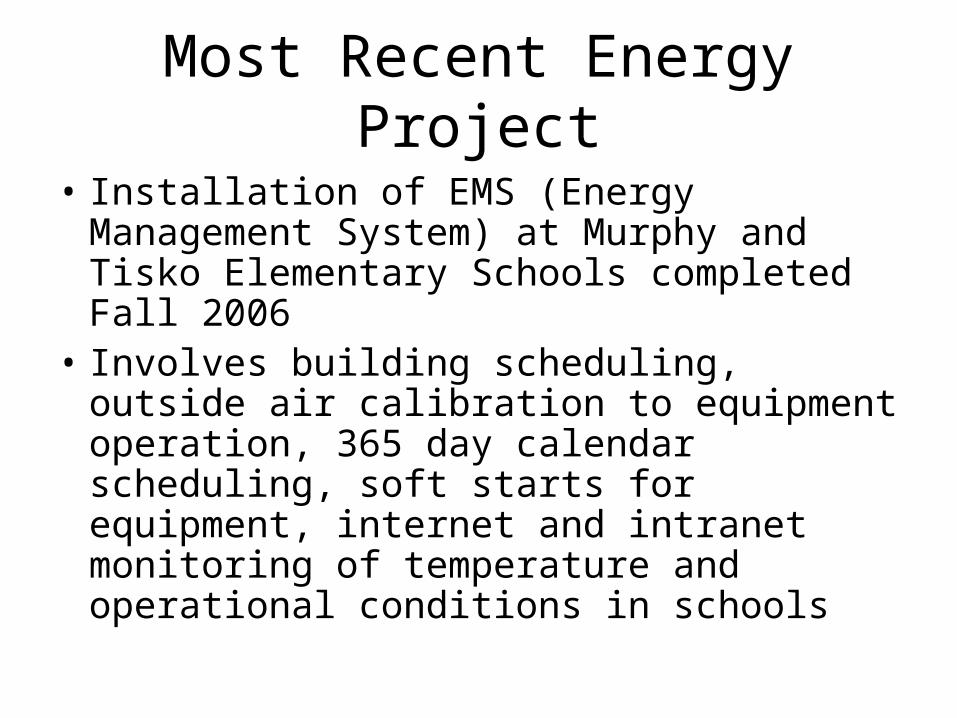
Most Recent Energy Project
• Installation of EMS (Energy Management System) at Murphy and Tisko Elementary Schools completed Fall 2006
• Involves building scheduling, outside air calibration to equipment operation, 365 day calendar scheduling, soft starts for equipment, internet and intranet monitoring of temperature and operational conditions in schools

MTM/MRT Energy Savings
• 2005/2006 Fuel Use 36,251 gallons
• 2006/2007 Fuel Use 17,869 gallons
• Fuel Avoidance 18,382 Gallons
• Cost Avoidance $35,185 in 06/07 dollars
• Although the fiscal year for electricity is not complete we are on track to save 10-15% or approx 72,500 kwh or $12,000.00
• Simple Payback of less than two years

Summary
• We have made strides in reducing our energy consumption and holding the line on our energy costs.
• Next steps toward conservation are much more involved but necessary if we are to operate our schools in an environmentally friendly and economical manner.
• We are seeking opportunities and assistance in continuing our conservation program