Clinical Approach to Patients Tanarat Choon-ngarm MD.
22
Clinical Approach to Patients Tanarat Choon-ngarm MD
-
Upload
shawn-hutchinson -
Category
Documents
-
view
213 -
download
0
Transcript of Clinical Approach to Patients Tanarat Choon-ngarm MD.

Clinical Approach to Patients
Tanarat Choon-ngarm MD
Clinical decision makingClinical reasoningUse of cognitive short cuts1. Representativeness heuristics2. Availability heuristics3. Anchoring heuristics

Diagnostic hypothesis generation A diagnostic hyposthesis sets a context for
diagnostic test to follow and provides testable predictions
Expert clinicians do not follow a fixed pattern in patient examination
Negative findings are often as important as positive ones
Data collection History Physical examination Investigations which depend on the
hypothesis generated from clinical findings Interpretation of results of investigation in
context of the patient Final diagnosis or additional investigations
Fever Fever for one month Fever for one month with heart murmur Fever for one month with heart murmur
and roth spot Provisional diagnosis : infective
endocarditis Essential investigations : echocardiogram,
hemoculture
Dyspnea Cardiac disease Pulmonary disease Metabolic causes Psychiatric disease
Dyspnea Acute dyspnea for one day Acute dyspnea with bilateral wheezing Acute dyspnea with bilateral wheezing and
cardiomegaly and third heart sound Diagnosis : acute heart failure Investigations : ECG and chest X-ray and
echocardiogram
Edema Edema of both legs Edema of both legs and ascites Edema of both legs and ascites and
normal jugular venous pressure Edema of both legs and ascites and
normal jugular venous pressure with spider nevi and jaundice
Diagnosis: chronic liver disease ,probable liver cirrhosis

Approach to heart failure What is the etiology? eg. valvular disease Stage of heart failure? eg. stage A, B, C, or
D Functional class? eg. NYHA FC I-IV Any precipitating factors? Prognosis?
Alteration of consciousnessLocalizing signsNo localizing signs Diffuse brain damage from Encephalitis Metabolic disturbance: hyponatremia
hypernatremia, hypoglycemia, hyperglycemia, hypercalcemia, uremia, hepatic encephalopathy

Approach to neurologic patients Locate the anatomic location of the
disease Determine the etiology Example: acute onset of hemiparesis with
global aphasia indicates the location to be at the frontal and parietal lobe of the dominant hemisphere and the etiology is most likely from vascular disease such as infarction from thrombosis or embolism
Disease assessment Severity or staging Activity Complications or sequele Prognosis Example : CA colon, adenocarcinoma,
stage 4, complication- gut obstuction, 5 year survival 5%

Definite diagnosis Diagnostic criteria What investigation is the gold standard? Example: tissue pathology is the gold
standard for the diagnosis of malignancy A perfect diagnostic test should have a
sensitivity and specificity of 100%

Definition of sensitivity and specificity Sensitivity : The fraction of those with the
disease correctly identified as positive by the test.
Specificity: The fraction of those without the disease correctly identified as negative by the test.
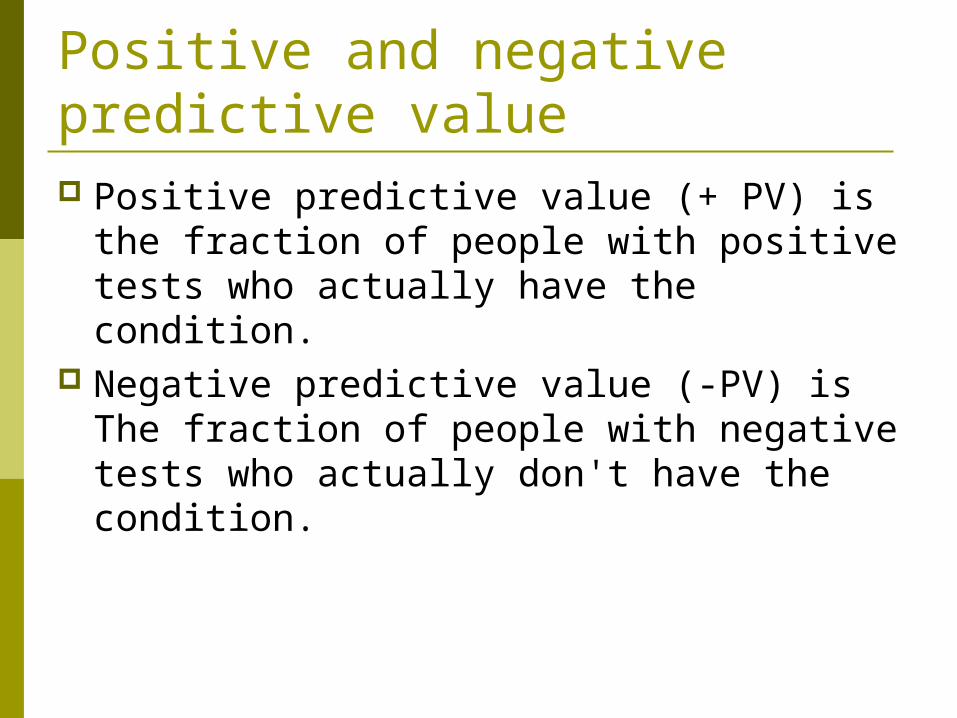
Positive and negative predictive value Positive predictive value (+ PV) is the
fraction of people with positive tests who actually have the condition.
Negative predictive value (-PV) is The fraction of people with negative tests who actually don't have the condition.
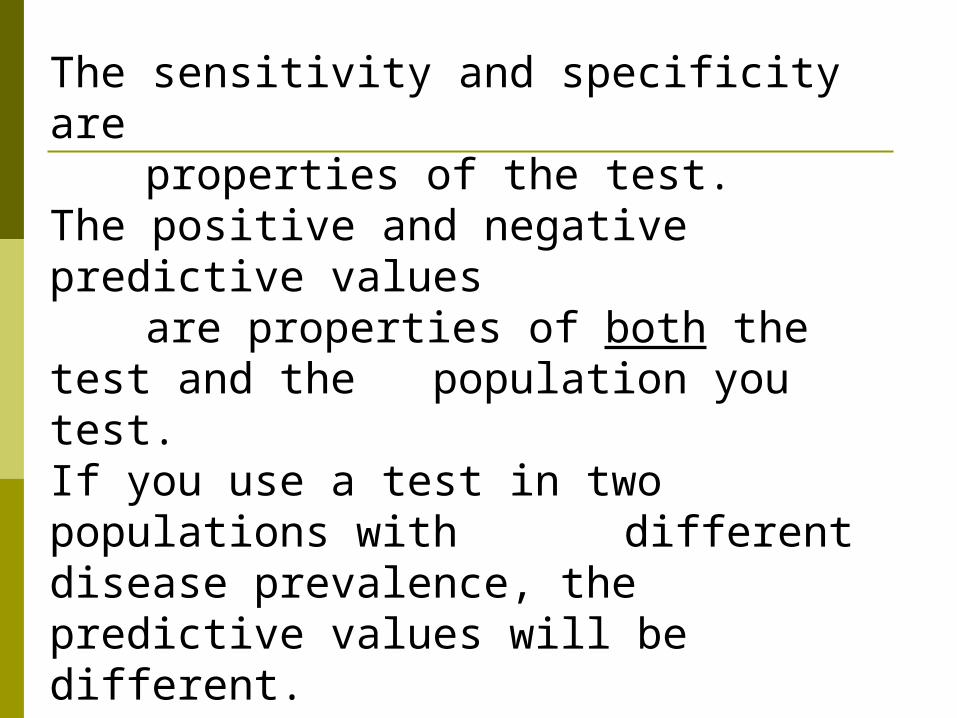
The sensitivity and specificity are properties of the test. The positive and negative predictive values are properties of both the test and the
population you test. If you use a test in two populations with
different disease prevalence, the predictive values will be different. A screening test is most useful if directed to a high-risk population (high prevalence
and high predictive value).
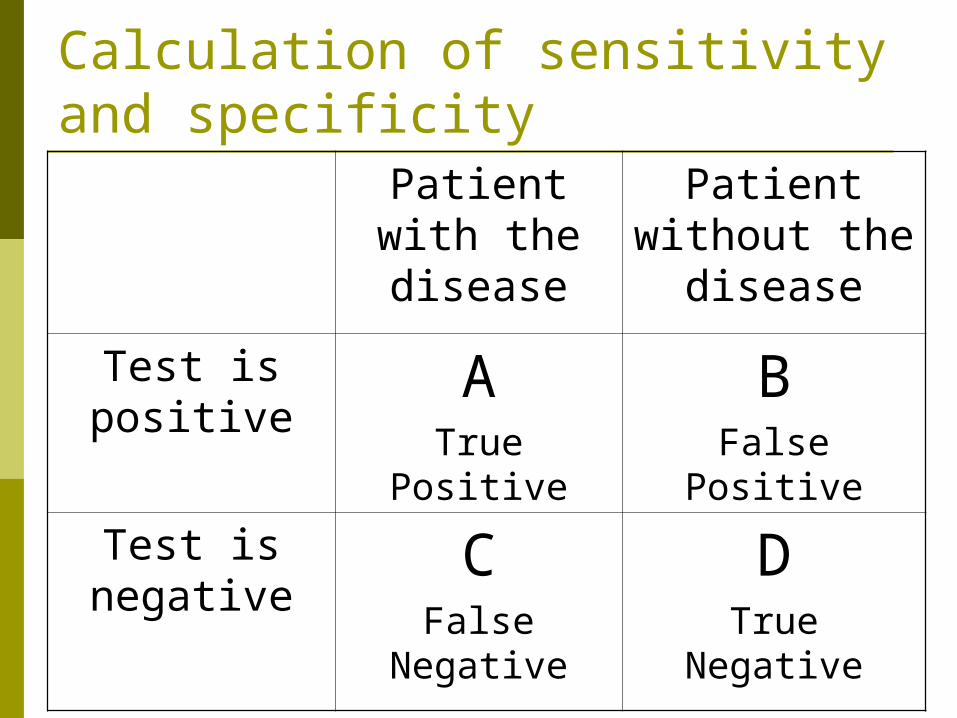
Calculation of sensitivity and specificity
Patient with the disease
Patient without the
disease
Test is positive
ATrue Positive
BFalse Positive
Test is negative
CFalse
Negative
DTrue Negative

Using the 2X2 table you can calculate
Sensitivity = a / (a+c)Specificity = d / (b+d)
+ PV = a/(a+b)- PV = d/(c+d)
Knowing the prevalence of the disease in the population is necessary for
these calculations
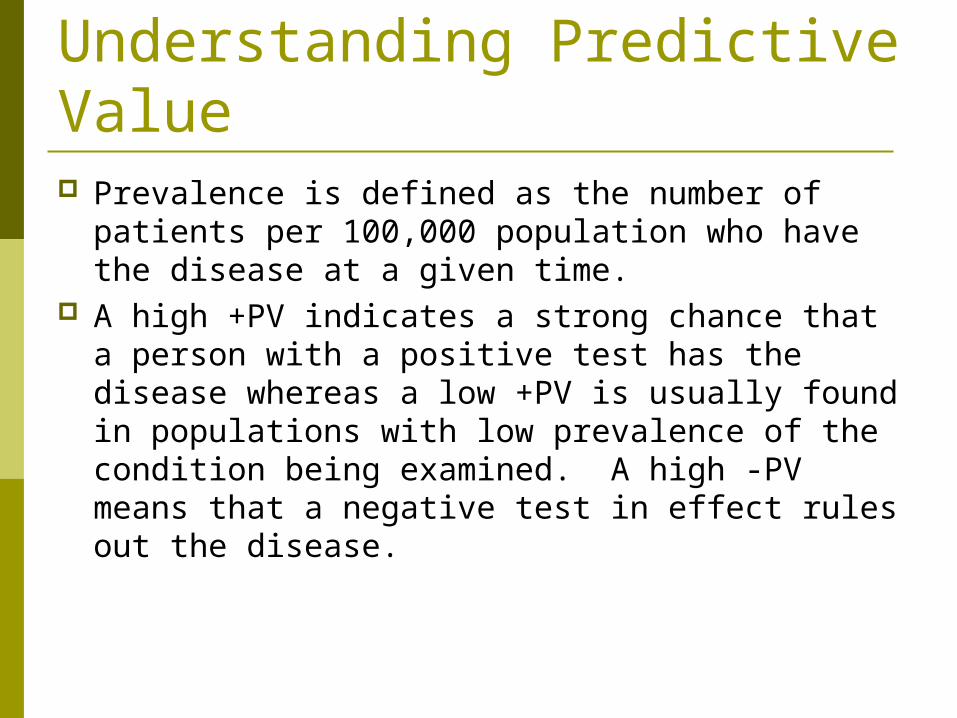
Understanding Predictive Value Prevalence is defined as the number of patients
per 100,000 population who have the disease at a given time.
A high +PV indicates a strong chance that a person with a positive test has the disease whereas a low +PV is usually found in populations with low prevalence of the condition being examined. A high -PV means that a negative test in effect rules out the disease.

Effects of PrevalenceSensitivity=95% Specificity=95%
Population’sPrevalence
0.1%1.0%2.0%5.0%50%
Predictive Value of a Positive Test
1.9%16.1%27.9%50%95%
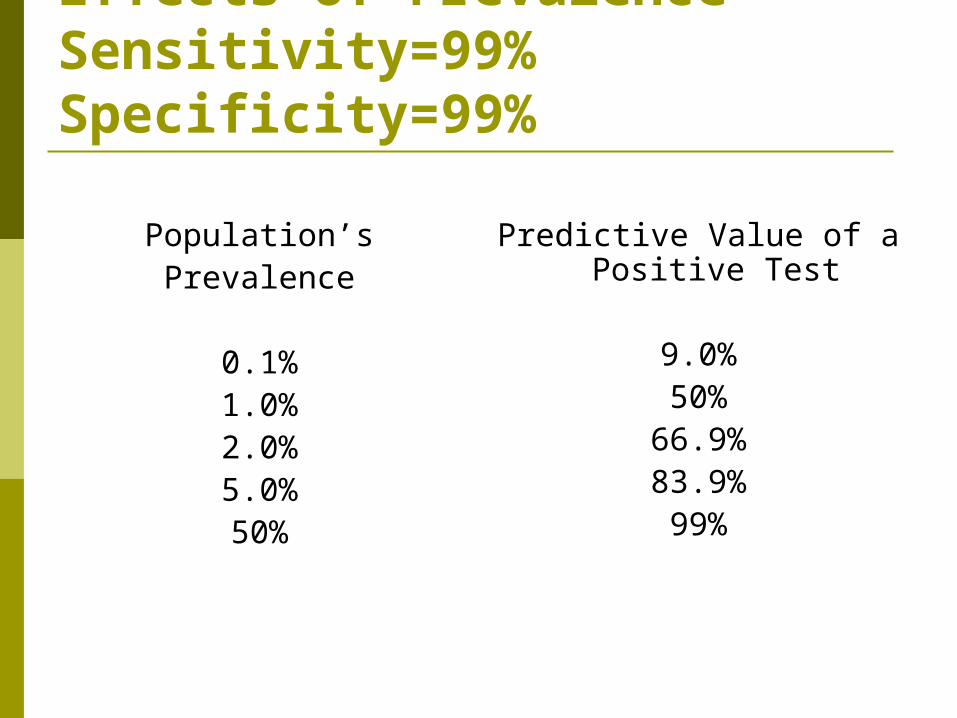
Effects of PrevalenceSensitivity=99% Specificity=99%
Population’sPrevalence
0.1%1.0%2.0%5.0%50%
Predictive Value of a Positive Test
9.0%50%
66.9%83.9%99%
Test interpretation When a sign, test or symptom has an
extremely high specificity (say, over 95%), a positive result tends to rule in the diagnosis.
When a sign, test or symptom has a high sensitivity, a negative result rules out the diagnosis.