Biomass briquetting plant project is perfect alternative source of energy

LUND UNIVERSITY
PO Box 117221 00 Lund+46 46-222 00 00
Climate benefits from alternative energy uses of biomass plantations in Uganda
Zanchi, Giuliana; Frieden, Dorian; Pucker, Johanna; Bird, David Neil; Buchholz, Thomas;Windhorst, KaiPublished in:Biomass & Bioenergy
DOI:10.1016/j.biombioe.2012.03.023
2013
Link to publication
Citation for published version (APA):Zanchi, G., Frieden, D., Pucker, J., Bird, D. N., Buchholz, T., & Windhorst, K. (2013). Climate benefits fromalternative energy uses of biomass plantations in Uganda. Biomass & Bioenergy, 59, 128-136.https://doi.org/10.1016/j.biombioe.2012.03.023
Total number of authors:6
General rightsUnless other specific re-use rights are stated the following general rights apply:Copyright and moral rights for the publications made accessible in the public portal are retained by the authorsand/or other copyright owners and it is a condition of accessing publications that users recognise and abide by thelegal requirements associated with these rights. • Users may download and print one copy of any publication from the public portal for the purpose of private studyor research. • You may not further distribute the material or use it for any profit-making activity or commercial gain • You may freely distribute the URL identifying the publication in the public portal
Read more about Creative commons licenses: https://creativecommons.org/licenses/Take down policyIf you believe that this document breaches copyright please contact us providing details, and we will removeaccess to the work immediately and investigate your claim.
Download date: 03. Dec. 2021

1
CLIMATE BENEFITS FROM ALTERNATIVE ENERGY USES OF BIOMASS 1
PLANTATIONS IN UGANDA 2
3
Giuliana Zanchia*, Dorian Friedena, Johanna Puckera, Neil Birda, Thomas Buchholzb, Kai 4
Windhorst c 5
6
a JOANNEUM RESEARCH Forschungsgesellschaft mbH, Leonhardstraße 59, 8010 Graz, 7
Austria 8
b The Rubenstein School of Environment and Natural Resources, University of Vermont, 81 9
Carrigan Drive, Burlington, VT 05405, USA 10
c UNIQUE forestry consultants Ltd, Schnewlinstraße 10, 79098 Freiburg, Germany 11
12
*Corresponding author: 13
E-mail: [email protected] 14
Tel: +43 316 876 1422; Fax: +43 316 8769 1422 15
16
Present Address of corresponding author: 17
Department of Earth and Ecosystem Sciences 18
Division of Physical Geography and Ecosystem Analysis 19
Lund University 20
Sölvegatan 12, SE-223 62 Lund, Sweden 21
22

2
ABSTRACT 23
24
The establishment of tree plantations in rural areas in Uganda could provide renewable energy 25
to rural communities, while decreasing greenhouse gas emissions from conventional 26
electricity sources and unsustainable forest use. The study evaluates the greenhouse gas 27
benefits that could be produced by biomass based energy systems in Anaka, a rural settlement 28
in the Amuru district in northern Uganda. Two alternative energy uses are explored: a) 29
electricity production through wood gasification and b) traditional fuelwood use. It is 30
estimated that a small-scale wood gasifier could provide electricity for basic community 31
services by planting less than 10 hectares of new short rotation coppices (SRCs). The 32
gasification system could save 50-67% of the GHG emissions produced by traditional diesel 33
based electricity generators in terms of CO2-eq. (0.61-0.83 t MWh-1 or 7.1 t y-1 per hectare of 34
SRCs). It was also estimated that traditional use of fuelwood in households is currently 35
unsustainable, i.e. the consumption of wood is higher than the annual growth from natural 36
wood resources in the study area. It is estimated that 0.02-0.06 ha per capita of plantations 37
could render the current consumption of wood sustainable. In this way, the CO2 emissions 38
produced through unsustainable extraction of wood could be avoided (2.0-7.3 t per capita per 39
year or 50-130 t y-1 per hectare of SRCs). 40
41
KEYWORDS: 42
Bioenergy; Gasification; GHG Balance; Sustainability; Uganda; Short Rotation Coppice 43
44

3
1 INTRODUCTION 45
46
Biomass is the main source of energy in Uganda. National statistics report that 91.5% of 47
energy consumption is derived from the combustion of biomass sources such as fuelwood, 48
charcoal and residues. A very limited share of energy use is covered by electricity (1.1%) and 49
the remaining 7.4% is produced by fossil fuels [1]. 50
Wood biomass will likely remain the dominant household energy source for cooking and 51
heating for several decades in Uganda due to low accessibility to alternative energy sources 52
[2]. In addition, biomass is seen as an option to provide electricity to rural areas where only 53
1% of the population has access to the grid. High electricity prices, frequent power outages, 54
and high line losses pose hurdles to increasing access to the grid over the short to medium 55
term. 56
At the same time, forest statistics report that wood resources in Uganda are constantly 57
decreasing [3]. Consequently, biomass based electricity generation or traditional energy from 58
fuelwood can be expected to be constrained by a decreasing availability of wood from forests 59
and other wooded lands. By contributing to the degradation of natural wood resources, 60
biomass based energy also contributes to increase greenhouse gas (GHG) emissions in the 61
atmosphere and to climate change. 62
The establishment of new plantations in developing countries could guarantee wood 63
availability for the future, supply feedstock to renewable energy systems that are accessible to 64
rural communities and produce GHG benefits as compared to fossil fuel based systems and 65
unsustainable wood extraction. 66
This study assesses the climate mitigation benefits produced by alternative uses of wood 67
plantations, when new Short Rotation Coppices (SRCs) are established on non-forested, low 68
carbon-stock land in Uganda. The comparison of GHG benefits from alternative uses of a 69

4
certain bioenergy source is important to support the most efficient strategies to achieve GHG 70
emission reductions [4] [5]. To the knowledge of the authors, this is the first attempt to make 71
such an assessment from wood plantations in Uganda. 72
Two alternative energy uses of wood plantations in a rural area in Uganda are considered: 73
a) Electricity from wood gasification; and 74
b) Firewood for traditional use in households. 75
The climate mitigation benefits of wood gasification are assessed by applying a GHG balance 76
based on a Life Cycle Assessment methodology. The balance compares the GHG impacts of 77
the gasifier to the impacts of a typical fossil fuel based electricity generation. 78
In parallel, we assessed the area of SRC plantations needed to supply fuelwood to the rural 79
community. The plantations would avoid degradation of natural biomass resources and thus 80
avoid increasing GHG in the atmosphere. An estimate of the avoided emissions is provided. 81
82

5
2 METHODS 83
84
2.1 STUDY AREA 85
86
The study area is located in the Amuru district in the Northern part of Uganda (02°36'0"N, 87
31°57'0"E). The CLIMWAT database [6] reports an annual precipitation of about 1,500 mm 88
y-1 and an average annual temperature of 23°C for the meteorological station in Gulu. 89
Climatic measurements taken in 2005-2007 in Aswa-Lolim, Amuru suggest that the average 90
rainfall could be lower in certain areas of the Amuru district, around 900 to 1,000 mm per 91
annum. [7]. 92
The Anaka refugee camp in Amuru is the settlement chosen for the installation of the gasifier 93
and the assessment of the impacts of traditional use of fuelwood. The Anaka internally 94
displaced people camp (IDP camp) hosts about 22,450 people. Main electricity users in the 95
camp are the hospital and shops. Anaka is located in the north-western part of a water 96
catchment in which the main land uses are grasslands (727 km2), followed by agricultural land 97
(214 km2) and forests (192 km2) [8]. Currently, grasslands are used for hunting. Most likely, 98
in the near future land will return to small holder agriculture and cattle ranching, as they were 99
before the civil war. 100
101
2.2 BIOMASS FOR ELECTRICITY 102
103
Previous investigations showed that small-scale wood gasifiers could be an economically and 104
socially feasible energy system to produce electricity in rural Uganda [9]. This study 105
integrates previous analysis by assessing the mitigation potential of wood gasifiers in Uganda. 106
The GHG benefits of electricity generation by wood gasification as compared to electricity 107

6
originating from diesel generators in the IDP camp of Anaka are evaluated through a GHG 108
balance based on a Life Cycle Assessment methodology. 109
110
2.2.1 GHG BALANCE 111
112
A GHG balance, based on a Life Cycle Assessment (LCA) methodology, includes all 113
processes, which influence GHG emissions from cradle to grave [10].The GHGs included in 114
the study are carbon dioxide (CO2), methane (CH4) and nitrous oxide (N2O). Global Warming 115
Potentials (GWP) on a 100 year time horizon are used to express the contribution of CO2, CH4 116
and N2O to global warming in terms of equivalent amount of CO2 (CO2-eq.) [11]. 117
The GHG balance is performed with the Global Emission Model of Integrated Systems 118
(GEMIS), version 4.5 [12] and project specific data are added to the GEMIS standard data set 119
version 4.5. Two different systems for electricity production are analysed: 120
“Electricity wood gasifier – E-WG”: Production of electricity with a centralized wood 121
gasification system. The biomass used is supplied from Short Rotation Coppices 122
(SRCs) of Eucalyptus grandis Hill ex Maiden. 123
“Electricity diesel generator – E-DG”: Production of the electricity with decentralized 124
diesel generators. 125
The GHG balance is based on process chains which are designed for each investigated 126
system: the wood gasification and the reference fossil fuel system (diesel generator). A 127
process chain describes the complete life cycle, starting with the production of raw materials 128
and ending with the supply of energy to the end user (Figure 1). Emissions or removals from 129
the conversion of grassland to SRCs are also included. 130
131

7
Figure 1 132
133
2.2.2 INPUT DATA 134
135
The electricity demand for the Anaka camp is estimated based on a study conducted in the 136
refugee camp of Kyangwali, Uganda within the project BIOSYRCA [13]. Electricity is used 137
by the hospital and the trading centre of the Anaka camp. In Kyangwali, the electricity 138
demand is estimated to be 25.5 MWh y-1. In this study, a demand of 30 MWh y-1 is assumed 139
as a conservative estimate to include a possible increase of demand in the near future and 140
higher electricity needs for the hospital. 141
The data on the electricity generators are reported in Table 1. The gasifier powers a modified 142
diesel engine that runs on a dual fuel mode. The fuel gas provides 75% of the primary energy 143
input.. Diesel is required for start-up operations and to support the systems. A small power 144
grid must be constructed to supply electricity from the gasifier to the main buildings of the 145
refugee camp. The length of transmission lines is assumed to be 2 km to connect the hospital 146
and shops of the trading centre. In the case of diesel generators each of the buildings that 147
require electricity is equipped with a separate diesel generator. 148
149
Table 1 150
aType Ankur Gasifier WBG-15/GAS-9; data according to [14] and expert judgment. 151
bDecentralized units in the main buildings type PRAMAC P4500-PF322SYA; data according 152
to product specification (www.pramac.com) 153
154
The wood for gasification is supplied by Short Rotation Coppices (SRCs) of E. grandis. It is 155
assumed that the plantation density is 2.5 x 2.5 m or equal to a stem density of 1600 ha-1 the 156

8
maximum rotation length is 6 years [15] and that the annual productivity of the stands ranges 157
between 5 to 15 t ha-1 y-1 on an oven dry basis [13]. It is also assumed that the productivity of 158
the plantations corresponds to the biomass that can be harvested. 159
The total planted area needed for the SRCs is calculated based on the productivity of the 160
plantations and the total amount of wood required by the gasification system. The lower 161
heating value of wood is assumed equal to 18 GJ t-1 and the electrical conversion efficiency 162
15% [13]. It is calculated that a wood supply of 30 t y-1 is needed to produce an electricity 163
output of 30 MWh y-1 from the gasifier, if wood contributes to 75% of the energy input of the 164
dual-mode system. By assuming an annual productivity of 5 to 15 t ha-1 y-1, the final harvest 165
produces 30-90 t ha-1. Therefore the annual demand is met by harvesting 1.0 to 0.33 hectares 166
each year. To guarantee a constant annual supply of wood, a total area of 2.0 to 6.0 ha needs 167
to be converted to Eucalyptus plantations and 1/6 of it is cut every year. 168
Plantations should be established on areas not used for agricultural production in order to 169
exclude competition with other major land uses, primarily food production. Therefore, the 170
SRCs are planted on an area currently covered by grasslands. 171
The annual emissions from planting and harvesting are calculated as an average over 20 years, 172
taking into account that harvesting starts in year six and that the plantations are renewed every 173
three rotation periods. The transport emissions are assessed by assuming a maximum distance 174
of 30 km between the plantations and the gasifier. The emissions caused by transportation for 175
planting and harvesting are calculated based on a daily productivity of a team of 3 to 6 176
workers. It is assumed that each worker plants 220 seedlings per day and harvests 120 trees 177
per day. The fuel consumption of the truck is assumed to be at 0.165 dm3 km-1, i.e. 9.9 dm3 d-178
1. The harvesting is done with chainsaws. A fuel consumption of 12.8 dm3 and an oil 179
consumption of 2.9 dm3 per working day are assumed. The emissions caused by use of 180
herbicide and fertilizer before planting are also included. It is assumed that a manual chipping 181

9
system is used to chip the wood used for the gasifier. Motor driven chippers are very 182
effective, but they require a substantial initial investment, besides constant service and 183
maintenance. Hand operated or spring activated scissors or axes were considered a more 184
suitable option in rural Uganda. 185
An inventory table of the inputs and outputs of the gasification system is reported in the 186
Appendix. 187
188
2.2.3 LAND USE CHANGE EMISSIONS AND REMOVALS 189
190
The carbon (C) stock changes due to the conversion of grasslands to Eucalyptus plantations 191
are included in the GHG balance. The change is calculated as the difference between the 192
carbon stock of the Eucalyptus plantations and the carbon stock of grasslands on hectare 193
basis. The annual change over a conversion period of 20 years is considered [11]: 194
(1) 20
)( RE CCC
195
Where: 196
C: carbon stock change due to land use change (t ha-1 y-1) 197
CE: carbon stock in Eucalyptus SRCs (t ha-1) 198
CR: carbon stock in grasslands (t ha-1) 199
200
Only the carbon stock changes in the biomass are included in the calculation. The conversion 201
of cropland or grassland to plantations will likely increase or maintain unaltered the amount 202
of carbon in soils [16]. Therefore, it is conservatively assumed that the carbon stock changes 203
in the soil are equal to zero [11]. The biomass carbon content of grasslands is derived from 204
IPCC default values (8 t ha-1 of C). The biomass in the SRCs is assessed based on a stand 205

10
productivity of 5-15 t ha-1 and an IPCC default root-to-shoot ratio of 0.24 to convert 206
aboveground biomass to root biomass. A carbon fraction in the biomass of 0.47 is assumed 207
[11]. It was assessed that the new SRCs accumulate 9.3-27.8 t ha-1 of C after 20 years when 208
belowground biomass is included and when the carbon loss from conversion is not taken into 209
account (8 t ha-1 of C). Therefore, the conversion produces a net C sequestration in living 210
biomass of 0.06-1.0 t ha-1 y-1 or a sequestration of 0.4-2.0 t y-1 over the entire area. 211
212
2.3 BIOMASS FOR TRADITIONAL USE 213
214
Most rural households in Uganda strongly depend on fuel wood and the collection of wood 215
for traditional use (mainly cooking) significantly contributes to deforestation and forest 216
degradation in Uganda [8] [17]. Additional plantations may be used to cover a share of this 217
traditional demand for wood. Using the Anaka IDP camp and the district of Gulu as examples, 218
we assess the area of additional plantations needed to supply sufficient wood for traditional 219
use without causing deforestation or degradation of existing forests, i.e. make the use of wood 220
sustainable and help avoiding GHG emissions to the atmosphere. Maintaining the balance 221
between annual forest growth and annual fellings of wood is one of the major indicators of the 222
sustainability concept [18]. When supplying energy from wood in Uganda, it is assumed that 223
the concept of sustainability can be translated as renewability of the energy source. 224
As a first step, data on wood demand are compared to the biomass growth of natural resources 225
to assess the fraction of non-renewable biomass extracted in the study area. We define the 226
non-renewable biomass fraction, FRACNRB as the fraction of wood removals exceeding the 227
vegetation growth on total removals: 228
(2) BD
GBDFRAC NRB
)( 229

11
Where: 230
BD: biomass demand in a certain area (t y-1) 231
G: biomass growth in the same area (t y-1) 232
233
Second, the emissions caused by the non-renewable biomass extracted annually are calculated 234
by converting the non-renewable biomass to CO2 emissions. A wood carbon fraction of 0.47 235
is assumed. Therefore, each tonne of non-renewable biomass burnt releases 1.83 t of CO2 in 236
the atmosphere. 237
Third, the area of plantations needed to substitute the non-renewable biomass and to avoid the 238
related emissions is calculated. The plantation area needed depends on the productivity, the 239
amount of fuelwood that can be extracted from the total biomass and the rotation length of the 240
plantation. The area is estimated by assuming that plantations are similar to the Eucalyptus 241
SRCs previously described with an average productivity of 10 t ha-1 y-1 on an oven dry basis. 242
It is assumed that the total demand of wood in the region remains constant over time and that 243
the renewable fraction of wood is still supplied by natural wood resources. 244
The non-renewable biomass fraction is assessed for the entire Gulu district and for the Anaka 245
IDP camp by using the two following alternative methods. 246
The Amuru district was still part of the Gulu district before 2006 and the available statistics 247
refer to the old administrative borders. Therefore, the assessment of the FRACNRB is done for 248
Gulu and it includes the area of Amuru. The non-renewable biomass fraction in the Gulu 249
district is assessed by using national removal statistics by FAO, representing the demand, and 250
biomass growth data from the National Biomass Study (NBS) of Uganda [8]. 251
Since data on wood removals are not available at the regional level, the national statistics are 252
regionalized to assess the amount of wood demand in Gulu. The fuelwood demand is strongly 253
related to the population residing in a certain area. Therefore, the proportion of the national 254

12
amount of fuelwood extracted in Gulu is calculated by using the percentage of the population 255
in the district (2%). The industrial roundwood extraction in Gulu, instead, is assessed by 256
calculating the proportion of forest biomass in the district of the total forest biomass in 257
Uganda and by assuming that the percentage of industrial roundwood removed would be the 258
same. The wood removals are converted to total biomass with IPCC default factors [11]. 259
The biomass growth is calculated based on information from the NBS of Uganda (Table 2). 260
The total annual growth is equal to the aboveground annual increment converted to total 261
biomass. Also in this case, we used IPCC default factors. 262
263
Table 2 264
265
Alternatively, the FRACNRB is assessed also for the area around the Anaka IDP camp by using 266
a second method. In this area, the fuelwood demand is calculated based on a wood 267
consumption of 601-692 kg of fuelwood per capita [19] [20] and the Anaka population of 268
22,450 people. Based on these data, it is calculated that the total fuelwood demand in Anaka 269
is 13,500 to 15,500 t y-1. The fuelwood demand is converted to biomass affected by 270
harvesting with IPCC conversion factors. 271
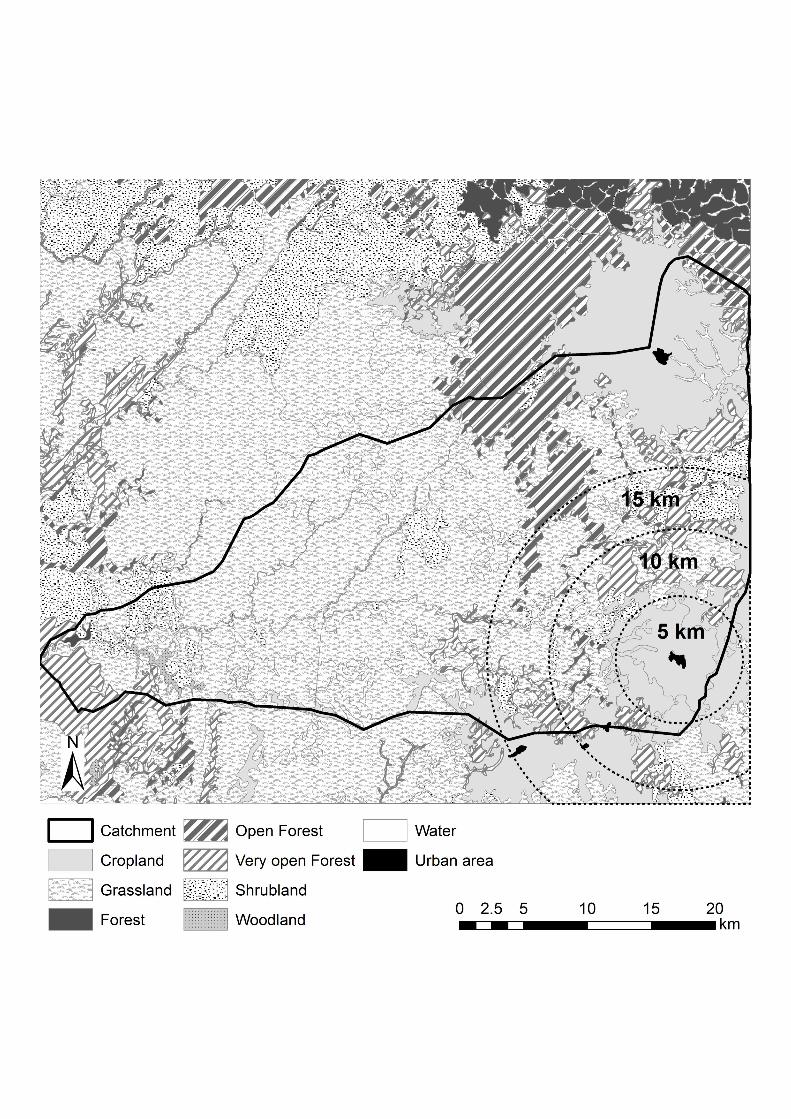
A land use map of the study area and the National Biomass Study (NBS) data on the biomass 272
growth are used to estimate the biomass resources available to the IDP camp. Fuelwood is 273
collected within a certain walking distance usually of one kilometre, but people can cover a 274
20 km distance if needed. Three different areas with radii from the IDP camp of 5 km, 10 km 275
and 15 km respectively are selected to calculate the available amount of wood within variable 276
distances and FRACNRB (Figure 2). It is assumed that all the wood collected or purchased is 277
available within these distances. 278
279

13
Figure 2 280
281

14
3 RESULTS 282
283
3.1 BIOMASS FOR ELECTRICITY GENERATION 284
285
The GHG Balance shows that the wood gasification system produces less GHG emissions 286
than the reference fossil fuel system of diesel generators (Figure 3). When the plantation 287
productivity is low (5 t ha-1 y-1), the gasification system produces about half of the GHG 288
emissions produced by the fossil fuel system (51%). The emissions are even lower if SRCs 289
have higher productivity, i.e. if the average carbon stock of the SRCs is higher. When the 290
plantation produces 15 t ha-1 y-1 of wood, the installation of a gasifier produces about 1/3 of 291
the emissions produced by diesel generators. Therefore, the gasification system saves 18.1-292
24.6 t y-1 or 0.61-0.83 t MWh-1 of CO2-eq. emissions. 293
294
Figure 3 295
296
The overall GHG balance of the gasification system is given by different components (Figure 297
4). Emissions are produced by the management of SRCs (harvesting, fertilization, transport of 298
workers and seeds), the transport of wood, the gasifier (construction material, diesel for the 299
operation of the system), and the construction and operation of the electricity grid. These 300
emissions are partially offset by carbon sequestration due to conversion from grasslands to 301
Eucalyptus plantations (Land Use Change). The extent to which emissions are offset depends 302
on the productivity of the plantations. 303
304
Figure 4 305
306

15
3.2 BIOMASS FOR TRADITIONAL USE 307
308
The National Biomass Study (NBS) clearly shows that the biomass stock of natural wood 309
resources is decreasing all over Uganda. The trend is mainly caused by the gap between the 310
high demand for fuelwood and the biomass increment [8]. 311
By regionalising the national statistics, it is assessed that 722,000 m3 of fuelwood and 19,100 312
m3 of roundwood were removed in Gulu in 2005. By converting these figures to total 313
biomass, it is estimated that 4.84 Mt y-1 of biomass was harvested or 3.23 Mt y-1 when only 314
aboveground biomass is considered. From the supply side, we calculate that the total annual 315
biomass growth in Gulu is equal to 3.82 Mt y-1 (2.55 Mt y-1 aboveground growth). 316
Based on these numbers, the non-renewable fraction of biomass extracted in Gulu (FRACNRB) 317
is 21.1%. 318
319
Similar results are produced for the Anaka IDP camp with the alternative approach described 320
in the Methods. 321
The difference between biomass demand in Anaka and biomass produced on land around the 322
camp shows that the net biomass balance is negative within a distance of 10 km radius from 323
the IDP camp. If the biomass would be extracted homogenously in the 15 km radius area, the 324
fuelwood extracted would be all renewable, but within a 15 km radius there is higher 325
competition of use with other settlements (Figure 2). The percentage of non-renewable 326
biomass that is extracted ranges between 88-89% in the 5 km radius to 18-29% in the 10 km 327
radius (Table 3). 328
329
Table 3 330
331

16
The non-renewable biomass extracted for fuelwood around the Anaka camp produces an 332
annual amount of CO2 emissions equal to: 333
151.5 – 177.6 x 10³ t y-1 if fuelwood is collected within 5 km; or 7.3 t y-1 per capita on 334
average. 335
31.6 – 57.8 x 10³ t y-1 if fuelwood is collected within 10 km; or 2.0 t y-1 per capita on 336
average. 337
zero CO2 emissions if fuelwood is collected within 15 km. 338
These results do not take into account that biomass is declining and that the percentage of 339
non-renewable biomass increases with time. 340
In the Gulu district, the calculated 21% of non-renewable biomass releases each year 1.76 Mt 341
of CO2 emissions in the atmosphere. These emissions could be avoided by promoting the 342
establishment of dedicated plantations or tree farming (e.g. trees around fields) that would 343
substitute the use of non-renewable biomass. 344
By assuming a productivity of 10 t ha-1 y-1, and a per capita fuelwood demand of 647 kg y-1, 345
the required plantation area is 1283 ha within a 5 km radius for a FRACNRB of 88%, while 346
only 348 ha would be required within a 10 km radius for a FRACNRB of 24%. 347
The use of wood in the area would change from unsustainable use to sustainable use due to 348
the additional wood supply from these plantations. 349
Based on the results from the GHG Balance for the wood gasifier, it can be conservatively 350
assumed that the balance between carbon sequestration and emissions due to installation and 351
management of the plantations is zero. 352
353
3.3 EFFICIENCY IN PRODUCING EMISSIONS SAVINGS 354
355

17
The previous sections showed that fast growing plantations could help achieving GHG 356
emission reductions in rural Uganda either if the wood is used to produce electricity or as 357
fuelwood. The efficiency of these two activities in producing emission savings can be 358
compared by calculating the emission reductions achievable on a per hectare basis. 359
A) Gasification system 360
The gasification system saves on average 21.3 t y-1 of CO2-eq. (18.1-24.6 t y-1) compared 361
to diesel generators by planting a total area of 3 ha of SRCs. Therefore the emissions 362
saved by the gasifier are equal to 7.1 t y-1 per hectare of SRCs. 363
B) Fuelwood production 364
A fuelwood demand of 14,515 t y-1 annually required for the Anaka IDP camp produces 365
44,680 t y-1 of CO2 emissions if the fuelwood is converted to total biomass extracted 366
within a distance of 10 km radius from the camp (FRACNRB=24%). The total area of SRCs 367
needed to offset these emissions is equal to 348 ha, meaning that the plantations for 368
fuelwood save 128.2 t ha-1 y-1 of CO2-eq emissions. The same result in terms of GHG 369
saving per hectare is obtained when fuelwood is extracted within an area of 5 km radius 370
from the camp. 371
Therefore, in terms of GHG savings on a per hectare basis, the most efficient use of fast 372
growing plantations in rural Uganda is to replace fuelwood collected in forests managed 373
unsustainably. However, the services provided by the gasification system and the fuelwood 374
plantations are very different. Even if replacement of fuelwood is much more efficient from 375
the point of view of GHG savings per hectare, the electricity services provided by the 376
gasification system bring additional benefits (e.g. social development) that might render the 377
use of plantations for electricity production more beneficial from a socio-economic point of 378
view. The great difference of GHG savings might also depend on the IPCC factors that 379
convert fuelwood to total biomass. According to these factors and the calculations made, the 380

18
collection of fuelwood from natural wood resources is very inefficient, i.e. the amount of 381
biomass affected by harvesting is 3.2 to 8.1 times higher than the amount used for fuelwood 382
(the highest factor of 8.1 is for woodlands). In fact, only certain parts of the trees are collected 383
for fuelwood, but the remaining biomass of the harvested tree remains in the field and starts to 384
decay. Under a more efficient use, when most of the aboveground biomass from natural wood 385
resources is used for fuelwood (about 70%) the CO2 savings would be around 50 t ha-1 y-1. 386
387

19
4 DISCUSSION 388
389
According to the results in this study, wood gasification for electricity production could 390
provide a valid alternative in terms of GHG impacts to diesel generation in rural communities 391
in Uganda. The overall carbon balance shows that wood gasification could provide energy in 392
rural communities that produces at least 50% less GHG emissions than the traditional diesel 393
generators. The GHG balance improves if the productivity of the plantations increases. 394
The productivity of plantations is dependent on the tolerance of the tree species to local 395
climate conditions and to the mortality rate due to fires and pests. In Amuru a short-term trial 396
study showed that the productivity of Eucalyptus in the area could be very low and that a high 397
mortality rate can occur because of fire, low peaks of rainfall and pests [7]. However, more 398
detailed information would be needed to state that Eucalyptus is unsuitable in the study area. 399
Alternative species to E. grandis more adapted to the Amuru area or hybrid Eucalyptus clones 400
that are more resistant to dry conditions, such as E. grandis x E. camaldulensis, could be used. 401
In addition, a different management, such as a different rotation length and tree density, could 402
strongly influence the productivity of the SRCs. 403
Another parameter that should be considered to choose suitable tree species is its water use. It 404
is recognized that Eucalyptus is a species that can produce high evapotranspiration. If planted 405
on large scale areas, Eucalyptus could have negative impacts on the water balance in the 406
catchment and limit water availability [21]. This problem should be addressed especially in 407
zones, such as major parts of Africa, where scarcity of water for human consumption is an 408
important issue. 409
We investigated the possibility to plant a native species such as Markhamia lutea, but data on 410
its productivity were not robust enough to be used in the study. The use of native species 411
could have the advantage to be more resistant to local conditions and therefore guarantee a 412

20
more constant and secure wood supply. In addition negative effects on biodiversity and water 413
balance could be avoided. 414
Major limits to the presented results emerge from the uncertainty of the input data. As 415
illustrated in the previous paragraphs, more precise information on the productivity of the 416
plantations could narrow down the variability of the final results. Emissions or removals in 417
the soil pool from land conversion should also be included, whereas they were neglected in 418
this study due to the lack of more specific data for similar regions. In addition, large part of 419
the input data to the model GEMIS were not specific for Uganda. A further limit of the study 420
is that we focused only on the GHG impact of the gasification system. A complete 421
environmental impact assessment, including more impact categories, would improve the 422
understanding of the sustainability of such systems. Factors that affect the feasibility of 423
implementation of gasification systems in rural areas should also be taken into account. 424
Barriers to technical implantation could be: mechanical and technical problems when running 425
the gasification system, unavailability of dried and chipped wood and social problems [22]. 426
Moreover, public and private investments that provide the initial capital to establish the 427
gasification system and the plantations should be identified to evaluate the feasibility of such 428
installations (e.g. soft loans, microcredits, Clean Development Mechanism projects) [23]. 429
This study encourages further investigations of social, economic and technical viability of 430
such small scale biomass gasification systems for rural electricity production in Uganda. 431
Small-scale biomass gasification systems providing basic electricity services can have many 432
economic and social advantages towards other renewable and non-renewable electricity 433
sources and often constitute the only current economic alternative to diesel generators in rural 434
Uganda. As little as 68 kg of dry wood per capita and year can already provide significant 435
increases in life standards for rural residents in Uganda when used for electricity generation 436
thus keeping the additional environmental pressures low [9]. 437

21
438
The study assessed that the present use of wood for fuel in Amuru district is most likely 439
unsustainable. However, the background data are highly uncertain, in particular the data on 440
removals and the conversion factors to assess the total biomass affected by fuelwood 441
extraction. It is also likely that a significant share of the wood removals is not reported by 442
official statistics. If this is the case, the gap between wood removals and forest growth would 443
be higher. Consequently the non-renewable fraction of biomass would be higher than the one 444
estimated in this study and a larger area of plantations would be needed. In addition, the study 445
does not take into account that the non-renewable fraction of biomass will increase over time 446
if natural wood resources will continue to shrink. On these grounds, the estimates of FRACNRB 447
should be considered conservative. On the other hand, conversion factors to assess the total 448
biomass affected by fuelwood extraction might overestimate FRACNRB. 449
Since wood will still be the main source of energy in Uganda, at least in the short to medium 450
term, solutions to decrease pressure on natural resources should be proposed, including the 451
increase of wood resources through additional forest plantations. An alternative to plantations 452
is the increase of energy use efficiency through, e.g., the use of improved wood stoves. 453
However, it is reported that increased efficiency does not necessarily lead to a decrease of 454
wood consumption [2]; this phenomenon is known as the Jevons paradox [24]. 455
An additional problem linked to the use of woody biomass is indirect land use change. When 456
plantations are established on land that would have been used for other purposes, it is possible 457
that the other uses are displaced somewhere else. The displacement can produce land use 458
changes elsewhere and consequent negative environmental impacts (e.g. GHG emissions, 459
biodiversity loss). For this reason, we suggested to establish the plantations on areas 460
extensively used or that are marginal (grasslands). However, re-distribution of land after the 461

22
civil war could re-convert large areas to agricultural use and compete with the establishment 462
of new plantations. 463
464

23
5 CONCLUSIONS 465
466
The establishment of new tree plantations for energy production could be beneficial for rural 467
communities in Uganda for both GHG emission reductions and the sustainability of biomass 468
supply. 469
The analysis of the GHG benefits of a small-scale gasification system showed that it would be 470
a valid alternative in terms of GHG impact to the diesel generators for areas that will not have 471
access to hydropower or other forms of electricity generation in the short to medium term due 472
to their distance to established electricity grids, low population density, and biophysical and 473
geographical features. Wood gasification could provide electricity for basic community 474
services by planting less than 10 hectares of new Short Rotation Coppices and it could save 475
50-67% of the CO2-eq.emissions produced by traditional diesel based electricity generators 476
(18.1-24.6 t y-1 or 0.61-0.83 t MWh-1). 477
Wood plantations should also be considered to reduce pressure on natural resources due to 478
traditional use of wood in households in Uganda. It was assessed that the fuelwood removals 479
in a rural area in Uganda are unsustainable because the demand for wood exceeds the annual 480
growth from existing forests and other wooded lands. This situation substantially contributes 481
to the degradation of natural biomass resources and, as a consequence, to GHG emissions. 482
The non-renewable fraction of biomass that is extracted (21% in the Gulu district) could be 483
replaced with wood from new plantations to render the overall balance of fuelwood removals 484
sustainable and reduce emissions to the atmosphere. It was assessed that 0.02-0.06 ha per 485
capita of plantations in a rural community in Uganda could avoid the GHG emissions 486
produced through unsustainable extraction of wood (approximately 2.0-7.3 t of CO2 per capita 487
per year). 488
489

24
ACKNOWLEDGEMENTS: 490
The authors wish to thank Maximilian Lauer from JOANNEUM RESEARCH for his advice 491
on the practical implementation of wood gasification systems in developing countries.492

25
[APPENDIX] 493
494

26
REFERENCES
[1] MEMD. Annual Report 2008 [Internet]. Kampala: Editorial Committee of Ministry of
Energy and Mineral Development; 2009 [cited 2011 Jun 6]. Available from:
http://www.energyandminerals.go.ug/
[2] Gore CD. Power and Process: The Politics of Electricity Sector Reform in Uganda
[dissertation]. Toronto, Canada: Department of Political Science, University of Toronto;
2008.
[3] FAO. Global Forest Resource Assessment 2005. Rome, Italy: Food and Agriculture
Organization of the United Nations; 2006. 320 p. Forestry Paper: 147.
[4] Nguyena TLT, Hermansena JE, Sagisaka M. Fossil energy savings potential of sugar cane
bio- energy systems. Appl Energ 2009;86(supp 1):S132-9.
[5] Abbasi T, Abbasi SA. Biomass energy and the environmental impacts associated with its
production and utilization. Renew Sust Energ Rev 2010;14(3):919-37.
[6] FAO [Internet]. Rome, Italy: CLIMWAT 2.0 for CROPWAT [cited 2011 Jun 24].
Available from: http://www.fao.org/nr/water/infores_databases_climwat.html
[7] Seebauer M. Uganda Research Trial Study - Analysis of the Eucalyptus trials in Amuru
district, northern Uganda. Freiburg, Germany: Unique Forestry Consultant GmbH; 2009.
Contract No.: ENV/2007/114431. Funded by EuropeAid of the European Commission.
[8] Drichi P. National Biomass Study Technical Report of 1996-2002. Kampala, Uganda:
Forest Department, Ministry of Water Lands and Environment; 2002. 118 p.
[9] Buchholz T, Da Silva I. Potential of distributed wood-based biopower systems serving
basic electricity needs in rural Uganda. Energ Sustain Dev 2010;14(1):56-61.

27
[10] Cherubini F, Bird DN, Cowie A, Jungmeier G, Schlamadinger B, Woess-Gallasch S.
Energy- and greenhouse gas-based LCA of biofuel and bioenergy systems: key issues, ranges
and recommendations. Resour Conserv Recy 2009;53(8):434-47
[11] IPCC. 2006 IPCC Guidelines for National Greenhouse Gas Inventories. Volume 4.
Agriculture, Forestry and Other Land Uses. Prepared by the National Greenhouse Gas
Inventory Programme, Eggleston HS, Buendia L, Miwa K, Ngara T and Tanabe K, editors.
Japan: IGES; 2006.
[12] Fritsche UR, Schmidt K. Global Emission Model of Integrated System (GEMIS) –
Manual. Darmstadt, Germany: Öko-Institut; 2008.
[13] Buchholz T, Volk T. Designing short-rotation coppice based BIOenergy SYstems for
Rural Communities in east Africa (BIOSYRCA) - Final report. Syracuse (NY): State
University of New York; 2007. 35 p.
[14] Buchholz T, Da Silva I, Volk T, Tennigkeit T. Economics of a Gasification Based Mini
Grid - A Case Study of a 10 kW Unit in Uganda. Proceedings of the Industrial and
Commercial Use of Energy Conference; 2007 May 29-30; Cape Town, South Africa. p. 125-
9.
[15] Jocovelli P, Milligan B, Amumpe A, Nalwadda C, Kakungulu Z, Odeke C, Atuyamba A,
Businge T. Tree planting guidelines for Uganda [Internet]. Kampala, Uganda: SPGS; 2009
[cited 2011 Jun 25]. Available from: http://www.sawlog.ug/
[16] Epron D, Marsden C, M’Bou AT, Saint-André L, d’Annunzio R, Nouvellon Y. Soil
carbon dynamics following afforestation of a tropical savannah with Eucalyptus in Congo.
Plant Soil 2009;323(1-2):309-22.
[17] Kayanja FIB, Byarugaba D. Disappearing forests of Uganda: The way forward. Curr Sci
2001;81(8):936-47.

28
[18] Forest Europe. Resolution H1 - General Guidelines for the Sustainable Management of
Forests in Europe [Internet]. Helsinki, Finland: Second Ministerial Conference on the
Protection of Forests in Europe, Jun 16-17 1993 [cited 2012 Mar 2012]. Available from:
www.foresteurope.org/eng/Commitments/Ministerial_Conferences/
[19] Buyinza M, Teera J. A system approach to fuelwood status in Uganda: a demand supply
nexus. Res J Appl Sci 2008;3(4):264-75.
[20] Naughton-Treves L, Chapman CA. Fuelwood resources and forest regeneration on fallow
land in Uganda. J Sustain Forest 2002;14(4):19-32.
[21] Farley KA, Jobbagy EG, Jackson RB. Effects of afforestation on water yield: a global
synthesis with implications for policy. Glob Change Biol 2005;11(10):1565-76.
[22] Ravindranath NH, Somashekar HI, Dasappa S, Jayasheela Reddy CN. Sustainable
biomass power for rural India: case study of biomass gasifier for village electrification. Curr
Sci 2004;87(7):932-41.
[23] Nuoni MR, Mullick SC, Kandpal TC. Biomass gasifier projects for decentralized power
supply in India: A financial evaluation. Energ policy 2007;35(2):1373-85.
[24] Brookes L. The greenhouse effect: the fallacies in the energy efficiency solution. Energ
Policy 1990:18(2):199-201.

TABLES
Table 1 – Basic data on the power generation systems
Technology Efficiency Life span Operation
hours
Capacity Steel Concrete
(%) (y) (h y-1
) (kW) (kg) (kg)
Wood gasifiera
(bioenergy system)
15 15 3.257 9 500 200
Diesel generatorb
(Reference system)
28 10 3.257 3 100 -
aType Ankur Gasifier WBG-15/GAS-9; data according to [12] and expert judgment.
bDecentralized units in the main buildings type PRAMAC P4500-PF322SYA; data according
to product specification (www.pramac.com)
Table 2 – Data on vegetation types in the Gulu District. The data refer only to the
aboveground biomass (source: NBS)
Vegetation Area Biomass Biomass change Biomass increment
km2 kt t ha
-1 kt y
-1 % t ha
-1 y
-1 kt y
-1
Forest 8 99 131.0 -0.2 -0.2 13.0 9.8
Woodland 4686 14363 30.6 -737.5 -5.1 5.0 2343.1
Bushland 359 420 11.7 -13.6 -3.2 1.0 35.9
Grasslands 1624 1801 11.1 -3.4 -0.2 1.0 162.4
Total 6677 16683 25.0 -754.6 -4.5 n.a. 2551.2
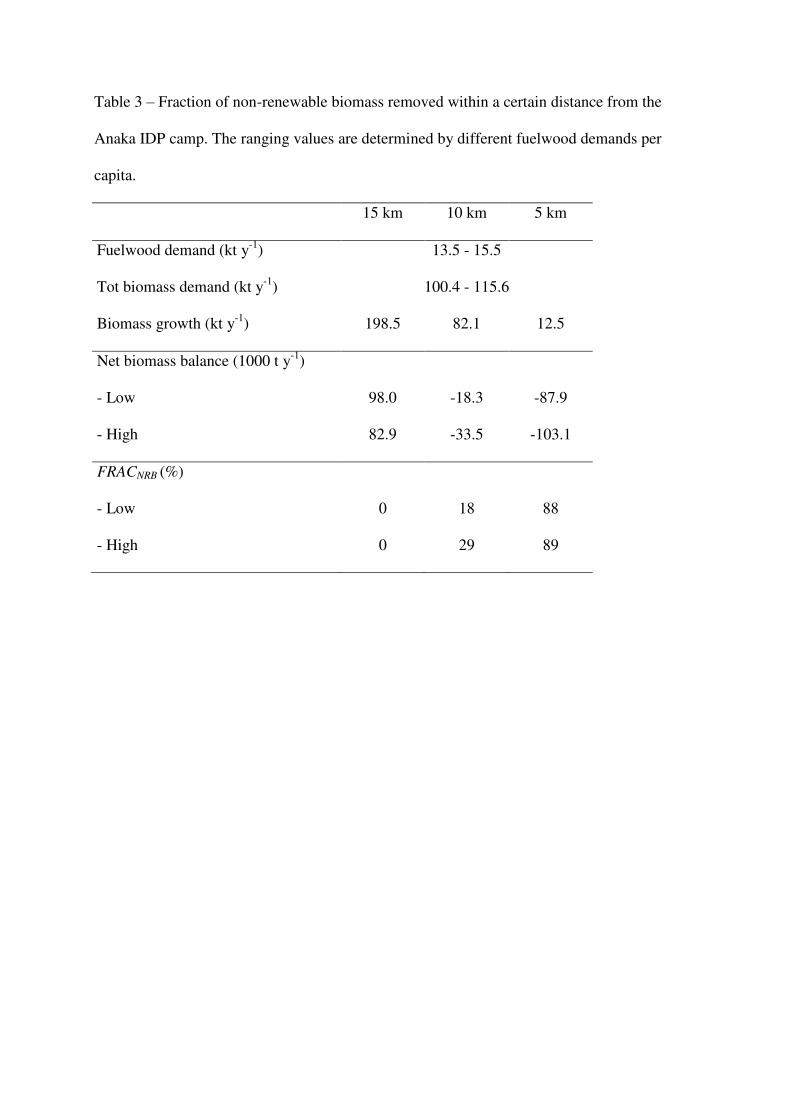
Table 3 – Fraction of non-renewable biomass removed within a certain distance from the
Anaka IDP camp. The ranging values are determined by different fuelwood demands per
capita.
15 km 10 km 5 km
Fuelwood demand (kt y-1
) 13.5 - 15.5
Tot biomass demand (kt y-1
) 100.4 - 115.6
Biomass growth (kt y-1
) 198.5 82.1 12.5
Net biomass balance (1000 t y-1
)
- Low 98.0 -18.3 -87.9
- High 82.9 -33.5 -103.1
FRACNRB (%)
- Low 0 18 88
- High 0 29 89

APPENDIX
Inventory table for the wood gasification systems
Unit Eucalyptus
15 t
Eucalyptus
5 t
SRC Cultivation and
Harvesting
INPUT
Auxiliary energy
Diesel MWh MWh-1
0.0014 0.0029
Petrol MWh MWh-1
0.004 0.012
Auxiliary material
Engine Oil kg MWh-1
0.083 0.250
Phosphate kg MWh-1
0.05 0.15
Herbicides kg MWh-1
0.01 0.04
OUTPUT
Eucalyptus
Yield (fresh matter) t ha-1
y-1
154 51
Water Content % 41.5 41.5
Heating Value MWh t-1
2.64 2.64
SRC Transport
Vehicle Type Small Truck
Loading Capacity t 3.5
Fuel Consumption dm3 km
-1 0.165
Distance km 60
Gasifier
INPUT
Eucalyptus MWh MWh-1
4.87
Auxiliary energy
Diesel MWh MWh-1
1.79
Construction material
Steel t MW-1
56
Concrete t MW-1
22
OUTPUT
Electricity
Power Grid
Transmission Losses % km-1
0.04
Construction material
Steel t km-1
550
Concrete t km-1
45

FIGURE CAPTIONS
Figure 1 – Process chains for the centralized wood gasification system and the fossil reference
system with decentralized diesel generators.
Figure 2 – Land use map of the water catchment in which the Anaka camp is located [8]. The
dotted circles around the camp define the wood supply areas within variable distances.
Figure 3 – Comparison of GHG emissions from the diesel generators (E-DG) and the wood
gasifier (E-WG). The emissions from the gasifier are shown for different levels of
productivity of the plantations (5 and 15 t ha-1
y-1
).
Figure 4 – Emission components of the gasification system (E- WG) according to different
productivities of the Short Rotation Coppices (SRCs).

* decentralized unit
Gasification system
SRC cultivation
and harvesting Area
Gasification
system
Power grid
Electricity
Diesel Generator
Extraction
Distribution
Processing
Diesel
generator*
Extraction
Distribution
Processing
Diesel Wood Diesel
Transport
Grass
Land