Causes and Effects of Rework on the Delivery of Healthcare...
359
Causes and Effects of Rework on the Delivery of Healthcare Facilities in California by Peter Pei-Yin Feng B.S. (University of New Hampshire) 1996 M.S. (Air Force Institute of Technology) 2000 A dissertation submitted in partial satisfaction of the requirements for the degree of Doctor of Philosophy in Engineering - Civil and Environmental Engineering in the Graduate Division of the University of California, Berkeley Committee in charge: Professor Iris D. Tommelein, Chair Professor Glenn Ballard Professor Thomas Rundall Spring 2009
Transcript of Causes and Effects of Rework on the Delivery of Healthcare...

Causes and Effects of Rework on the Delivery of Healthcare Facilities in California
by
Peter Pei-Yin Feng
B.S. (University of New Hampshire) 1996
M.S. (Air Force Institute of Technology) 2000
A dissertation submitted in partial satisfaction of the
requirements for the degree of
Doctor of Philosophy
in
Engineering - Civil and Environmental Engineering
in the
Graduate Division
of the
University of California, Berkeley
Committee in charge:
Professor Iris D. Tommelein, Chair Professor Glenn Ballard
Professor Thomas Rundall
Spring 2009

Causes and Effects of Rework on the Delivery of Healthcare Facilities in California
Copyright 2009
by
Peter Pei-Yin Feng

1
Abstract
Causes and Effects of Rework on the Delivery of Healthcare Facilities in California
by
Peter Pei-Yin Feng
Doctor of Philosophy in Engineering - Civil and Environmental Engineering
University of California, Berkeley
Professor Iris D. Tommelein, Chair
This research focuses on identifying the causes of rework within a design and permitting
process of healthcare facilities in California. Causes of rework were identified and
categorized. Three computer simulations were created to illustrate the effect of rework on
system performance. One explores the throttles affecting a production process. The other
two illustrate the effect of rework on two organizational case studies.
Research extending a taxonomy describes causes of rework in the process. I
obtained data from industry workshops to determine the current state process for the
healthcare construction industry. I used a multi-tier categorization framework to classify
the causes of rework. This laid the foundation for further exploration through computer
simulation.
The first case study, workflow of a mechanical contractor, illustrated the
complexity involved in the process from their point of view. I used computer simulation
to reveal the pressures on the construction process due to incomplete drawings and
changes to them. I determined that implementing a delayed management strategy is one
way to reduce negative rework.

2
Understanding demand and capacity using simulation models provides intuition
on the elements affecting workflow variation in a production process. I identified three
throttles that control production throughput: (1) inflow of projects, (2) resource capacity,
and (3) likelihood of rework. Simulations highlight the tradeoffs management can make
between the latter two.
The second case study, effect of alternative review on workflow, describes both
the current and future state process of a plan review agency. I obtained data from them
and constructed a model to simulate their workflow. Simulations showed that an
alternative review process can improve system performance.
This research showed that negative rework can be detrimental to system
performance. To improve performance we must break free from traditional project roles,
where information is isolated and protected, and move to an environment where we
understand the workflow of others and of all combined. The occurrence of negative
rework can be reduced by engaging more stakeholders, earlier in design, fostering an
integrated and collaborative environment.

i
ACKNOWLEDGMENTS
First and foremost, I want to thank my family for supporting me through this academic
journey. To my wife, Maricar, you are the bedrock in our family and the driving force
behind my accomplishments. You kept me focused on the end goal and always put things
in perspective when I was down; you were a critical piece in finishing this dissertation.
To my son Nolan, you are my inspiration in life. My love for you grows everyday and
you continue to make me a better person. The both of you helped me through all of those
late nights and early mornings as I prepared for my classes, my exams and the writing of
this dissertation. Second, I would like to thank Professor Tommelein for all of her insight.
You pushed me to explore the theoretical underpinnings of my research and I know this
product would not be nearly as good without your help. Third, I would like to thank
Professors Ballard and Rundall for their valuable input. Fourth, I would like to thank my
407 colleagues that provided technical support in developing the research presented in
this dissertation. Finally, I would like to thank my industry partners for answering all of
my questions. Without those mentioned above, I would not have finished this
dissertation, and for that, I am forever grateful.

ii
TABLE OF CONTENTS
Acknowledgments................................................................................................................ i
Table of Contents................................................................................................................ ii
List of Figures ................................................................................................................... vii
List of Tables .................................................................................................................... xii
1. Introduction..................................................................................................................... 1
1.1 Motivation................................................................................................................. 1
1.1.1 Escalating Costs for California Healthcare Facilities ........................................ 4
1.1.2 Rework Definitions ............................................................................................ 7
1.2 Problem Statement.................................................................................................... 8
1.3 Research Objectives.................................................................................................. 9
1.4 Research Questions................................................................................................. 10
1.5 Hypothesis .............................................................................................................. 10
1.6 Methodology........................................................................................................... 11
1.6.1 Qualitative Research ........................................................................................ 11
1.6.2 Quantitative Research ...................................................................................... 18
1.6.3 Sampling .......................................................................................................... 24
1.6.4 Qualitative Validation...................................................................................... 24
1.7 Dissertation Structure ............................................................................................. 26
2. Background and Literature Review .............................................................................. 30
2.1 Rework.................................................................................................................... 33
2.1.1 Rework in the Computer Industry.................................................................... 33
2.1.2 Rework in the Construction Industry ............................................................... 35
iii
2.1.3 Optimizing Batch Sizes and Rework ............................................................... 39
2.1.4 The Liar’s Club ................................................................................................ 41
2.1.5 The Culture of Change..................................................................................... 44
2.1.6 Designing vs. Making ...................................................................................... 47
2.1.7 Strategies to Reduce Negative Rework............................................................ 49
2.1.8 Changes Timing ............................................................................................... 49
2.2 Motivational Theory ............................................................................................... 53
2.3 Quality .................................................................................................................... 60
2.3.1 History of the Quality Movement .................................................................... 60
2.3.2 Deming’s Fourteen Points................................................................................ 61
2.3.3 Pareto Principle ................................................................................................ 62
2.4 Lean Production...................................................................................................... 63
2.4.1 Three Viewpoints of Production Theory ......................................................... 64
2.4.2 Lean Project Delivery SystemTM (LPDS) ........................................................ 65
2.4.3 Types of Waste ................................................................................................ 68
2.4.4 Working Harder vs. Working Smarter............................................................. 69
2.4.5 Built-in Quality ................................................................................................ 72
2.4.6 Lean Perspective of Standard Work ................................................................ 73
2.4.7 Computer Simulation of Lean Concepts.......................................................... 81
2.5 Building Information Modeling (BIM)................................................................... 89
2.5.1 Current Architecture, Engineering, and Construction (AEC) Environment.... 89
2.5.2 What is Not BIM Technology.......................................................................... 91
2.5.3 Design Benefits of BIM ................................................................................... 92

iv
2.5.4 Construction and Fabrication Benefits of BIM................................................ 93
2.5.5 Post-Construction Benefits of BIM ................................................................. 95
2.5.6 Challenges of Implementing BIM ................................................................... 96
2.6 Office of Statewide Health Planning and Development (OSHPD) ........................ 97
2.6.1 Facilities Development Division (FDD).......................................................... 99
2.6.2 Stakeholders in California Healthcare Facility Construction ........................ 100
2.6.3 Project Production Systems Laboratory (P2SL) Healthcare Improvement
Initiative ........................................................................................................ 101
2.6.4 California Healthcare Facility Permitting Processes ..................................... 102
3. Taxonomy of Rework ................................................................................................. 105
3.1 Section Abstract.................................................................................................... 105
3.2 Background and Scope ......................................................................................... 105
3.3 Methodology and Methods ................................................................................... 106
3.4 Data Collection and Rework Classification.......................................................... 106
3.5 Categorization of Rework in Delivery of California Healthcare Facilities .......... 109
3.6 Limitations ............................................................................................................ 114
3.7 Analysis and Results............................................................................................. 115
3.8 Relative Contribution Analysis............................................................................. 116
3.9 Section Acknowledgments ................................................................................... 119
4. Case Study I: Workflow of a Mechanical Contractor................................................. 120
4.1 Section Abstract.................................................................................................... 120
4.2 Background and Scope ......................................................................................... 121
4.3 Methodology and Methods ................................................................................... 123
v
4.4 Types of Contracts ................................................................................................ 123
4.5 Detailing, Fabrication, and Installation DES Model............................................. 138
4.6 Analysis and Results............................................................................................. 145
4.7 Limitations ............................................................................................................ 147
4.8 Section Acknowledgments ................................................................................... 147
5. Understanding Demand and Capacity Using Simulation ........................................... 148
5.1 Section Abstract.................................................................................................... 148
5.2 Background and Scope ......................................................................................... 148
5.3 Simulation of One Rework Cycle......................................................................... 149
5.4 Simulation of Three Rework Cycles..................................................................... 150
5.5 Simulation of Multiple Rework Cycles ................................................................ 150
5.5 Demand and Capacity Analysis............................................................................ 152
5.6 Resource Stabilization Analysis ........................................................................... 158
6. Case Study II: Effect of Alternative Review on Workflow........................................ 168
6.1 Section Abstract.................................................................................................... 168
6.2 Background and Scope ......................................................................................... 170
6.3 Methodology......................................................................................................... 170
6.4 What is Alternative Review? ................................................................................ 171
6.5 Shifting the Design Curve “Left” ......................................................................... 173
6.6 Alternative Review Process .................................................................................. 177
6.7 Alternative Review Discrete Event Simulation Model......................................... 179
6.7.1 Model Objectives ........................................................................................... 179
6.7.2 Model Assumptions ....................................................................................... 179

vi
6.7.3 Model Description ......................................................................................... 180
6.8 Methods ................................................................................................................ 185
6.8.1 Database Analysis .......................................................................................... 186
6.8.2 Discrete Event Simulation ............................................................................. 186
6.8.3 Computer Model Output Analysis ................................................................. 186
6.8.4 Resampling .................................................................................................... 187
6.9 Calibrating the Model ........................................................................................... 187
6.9.1 Loading the System........................................................................................ 188
6.9.2 The Rework Decision .................................................................................... 188
6.9.3 Assigning Rework.......................................................................................... 193
6.9.4 Matching Problem.......................................................................................... 193
6.9.5 Determining the Rework Rate ....................................................................... 194
6.9.6 Determining Review Times ........................................................................... 196
6.9.7 Determining Time to Permit .......................................................................... 206
6.10 Sensitivity Analysis ............................................................................................ 216
6.10.1 Results.......................................................................................................... 222
6.10.2 Limitations ................................................................................................... 231
6.10.3 Validation through Interviews ..................................................................... 232
6.11 Industry Questionnaire........................................................................................ 234
6.12 Section Acknowledgments ................................................................................. 237
7. Conclusions................................................................................................................. 238
7.1 Management Suggestions ..................................................................................... 239
7.2 Research Findings................................................................................................. 242

vii
7.3 Contributions to Knowledge................................................................................. 249
7.3.1 Taxonomy of Rework Contributions ............................................................. 249
7.3.2 Case I Contributions ...................................................................................... 250
7.3.3 Understanding Demand and Capacity Using Simulation Contributions ....... 251
7.3.4 Case II Contributions ..................................................................................... 251
7.4 Future Research .................................................................................................... 253
References....................................................................................................................... 258
Appendix A Causes of Rework Data .............................................................................. 273
Appendix B STROBOSCOPE Code for Demand and Capacity Simulations ................ 285
Appendix C STROBOSCOPE Code for Effect of Alternative Review on Workflow... 292
Appendix D Validation Output Information................................................................... 321
Appendix E Resampling Code for Case II...................................................................... 329
Category I (Less than $50K)....................................................................................... 332
Category II (Greater than $50K and less than or equal to $1M) ................................ 334
Category III (Greater than $1M and less than or equal to $10M) .............................. 336
Category IV (Greater than $10M) .............................................................................. 338
LIST OF FIGURES
Figure 1-1 Cost Escalation of Construction in Northern California (modified from Morris
2007) ................................................................................................................. 5
Figure 1-2 California vs. Non-California Cost of Construction (modified from Morris
2007) ................................................................................................................. 5
Figure 1-3 Construction Employment in California (Bureau of Labor Statistics 2007)..... 6
viii
Figure 1-4 System Model Taxonomy (Leemis 2006)....................................................... 19
Figure 1-5 Bounded Activity ............................................................................................ 21
Figure 1-6 Conditional Activity........................................................................................ 22
Figure 1-7 Dissertation Structure...................................................................................... 27
Figure 2-1 Map of Research Literature............................................................................. 31
Figure 2-2 Causes of Rework in Construction (Fayek et al. 2004) .................................. 35
Figure 2-3 Schematic Structure of the Production System (Inderfurth et al. 2005) ......... 40
Figure 2-4 Changes Timing .............................................................................................. 51
Figure 2-4 Maslow’s Hierarchy of Needs (Gaspar 2003)................................................. 55
Figure 2-5 Lean Project Delivery SystemTM (Ballard et al. 2002) ................................... 66
Figure 2-6 Balancing Loop (Repenning and Sterman 2001) ............................................ 70
Figure 2-7 Simulation of Working Harder and Working Smarter (Repenning and Sterman
2001) ............................................................................................................... 71
Figure 2-8 Toyota’s Human System Model (Figure 2-3 in Liker and Hoseus 2008)....... 75
Figure 2-9 Classifying Types of Work (modified Figure 1 in Perrow 1967) ................... 76
Figure 2-10 Relationship of Standardized Work to Job Instruction (Figure 6-1 in Liker
and Meier 2007)............................................................................................ 79
Figure 2-11 Stakeholders Involved with Healthcare Facility Construction in California
......................................................................................................................................... 101
Figure 3-1 Rework Cause and Effect Diagram............................................................... 108
Figure 3-2 Relative Contribution of Rework .................................................................. 119
Figure 4-1 Scale of Contractual Risk Distribution (Collier 2001).................................. 128
Figure 4-2 Costs of Work (Collier 2001)........................................................................ 130

ix
Figure 4-3 Flow Diagram of Mechanical Contractor Process ........................................ 140
Figure 4-4 Rework Potential........................................................................................... 142
Figure 4-5 Discrete Event Simulation of Detailing, Fabrication, and Installation ......... 143
Figure 4-6 Line of Balance for Detailing, Fabrication, and Installation......................... 146
Figure 5-1 Rework Cycle (One Rework Cycle) ............................................................. 150
Figure 5-2 Basic Rework (Multiple Rework Cycles) ..................................................... 151
Figure 5-3 Drawing Table Queue vs. Time (One Rework Cycle).................................. 152
Figure 5-4 Drawing Table Queue vs. Time (Multiple Rework Cycles) ......................... 153
Figure 5-5 Lead Time to Complete Project Review vs. Drawing Table Queue (One
Rework Cycle) .............................................................................................. 154
Figure 5-6 Lead Time to Complete Project Review vs. Drawing Table Queue Size
(Multiple Rework Cycles)............................................................................. 155
Figure 5-7 Lead Time to Complete Project Review vs. Simulation Time (One Rework
Cycle)............................................................................................................ 156
Figure 5-8 Lead Time to Complete Project Review vs. Time (Multiple Rework Cycles)
......................................................................................................................................... 157
Figure 5-9 Resources to Stabilize System (Multiple Rework Cycles) ........................... 158
Figure 5-10 Resources to Stabilize System (Multiple Rework Cycles) ......................... 159
Figure 5-11 Queue Stabilization (80% Rework, 3 Reviewers, 3 Rework Cycles) ......... 160
Figure 5-12 Queue Stabilization (80% Rework, 6 Reviewers, Multiple Rework Cycles)
......................................................................................................................................... 161
Figure 5-13 Queue Stabilization (80% Rework, 5 Reviewers, Multiple Rework Cycles,
30 Iterations) ............................................................................................... 162

x
Figure 5-14 Queue Stabilization (80% Rework, 6 Reviewers, Multiple Rework Cycles,
30 Iterations) ............................................................................................... 163
Figure 5-15 Lead Time (80% Rework, 5 Reviewers, Multiple Rework Cycles,
30 Iterations) ............................................................................................... 164
Figure 5-16 Lead Time (80% Rework, 6 Reviewers, Multiple Rework Cycles,
30 Iterations) ............................................................................................... 165
Figure 6-1 Level of Common Understanding Developed During Traditional Project
Delivery (Modified from Lichtig 2008)........................................................ 172
Figure 6-2 Level of Common Understanding Developed During Integrated Project
Delivery (Modified from Lichtig 2008)........................................................ 173
Figure 6-3 Shifting the Design Curve (Modified Figure 1 in Cook et al. 2007) ............ 174
Figure 6-4 Discrete-Event Simulation of Current and Alternative review process
(Model 1) ...................................................................................................... 181
Figure 6-5 Discrete-Event Simulation of Current and Alternative Review Process
Utilizing a Dedicated Rework Team (Model 2) ............................................................. 185
Figure 6-6 Likelihood of Rework vs. Number of Rework Iterations ............................. 191
Figure 6-7 Project Review Scenarios.............................................................................. 194
Figure 6-8 Likelihood of Rework per Category ............................................................. 196
Figure 6-9 Logbook Access Database Relationships...................................................... 198
Figure 6-10 Example of the Query Constructed from Logbook..................................... 199
Figure 6-11. Example of Access Query for Category III................................................ 200
Figure 6-12 Spreadsheet of Values ................................................................................. 202
Figure 6-13 Spreadsheet of FLSMuSD Category III (1M - 10M).................................. 204
xi
Figure 6-14 Mean Times for Initial Review and Re-Review by Discipline ................... 206
Figure 6-15 Simulation Output Showing Project Numbers, Number of Rework Cycles,
Approval Time and Owner Rework Time in Days..................................... 207
Figure 6-16 Mean Time to Permit Analysis Comparing FDD Data to Simulation Model
Output ......................................................................................................... 209
Figure 6-17 Real Time Category II................................................................................. 210
Figure 6-18 Real Time Category II (4 Week Moving Average) .................................... 211
Figure 6-19 Real Time Category III ............................................................................... 212
Figure 6-20 Real Time Category III (4-Week Moving Average)................................... 213
Figure 6-21 Real Time Category IV ............................................................................... 214
Figure 6-22 Real Time Category IV (4-Week Moving Average)................................... 214
Figure 6-23 (1:1) Ratio Sensitivity Analysis .................................................................. 223
Figure 6-24 (1:2) Ratio Sensitivity Analysis .................................................................. 224
Figure 6-25 (2:1) Ratio Sensitivity Analysis .................................................................. 225
Figure 6-26 (1:4) Ratio Sensitivity Analysis .................................................................. 226
Figure 6-27 (4:1) Ratio Sensitivity Analysis .................................................................. 227
Figure 6-28 Mean Time to Permit for Three Scenarios (N = 1000) ............................... 229
Figure 6-29 Mean Time to Permit for FDD and Simulation data................................... 230
Figure 6-30 Other Category Rework Reduction with Category IV at 30% Effort Level231
Figure 7-1 Consolidated Research .................................................................................. 243
Figure D-1 Loading System, No Sorting Key ................................................................ 321
Figure D-2 Loading System With a Sorting Key Random............................................. 323
Figure D-3 Dynamic Rework.......................................................................................... 324
xii
Figure D-4 Example of Multiple Rework Cycles ........................................................... 325
Figure D-5 Error Assignment ......................................................................................... 326
Figure E-1 Sample Output from Resampling Code........................................................ 330
Figure E-2 Sample Histogram ........................................................................................ 331
LIST OF TABLES
Table 1-1 Six Sources of Data: Strengths and Weaknesses (Yin 2002) ........................... 15
Table 2-1 Types of Rework - Software Industry (adopted from Fairley and Willshire
2005) ................................................................................................................. 34
Table 2-2 Designing vs. Making (Ballard 1999) .............................................................. 48
Table 2-3 Strategies for Reducing Negative Rework (Ballard 1999)............................... 49
Table 2-4 TFV Theory of Production (Koskela 2000) ..................................................... 65
Table 2-5 People Development Requirements for Different Types of Jobs (Table 5-1 in
Liker and Meier 2007) ...................................................................................... 77
Table 2-6 Breakdown of Work Tasks by Importance (Table 7-3 in Liker and Meier 2007)
........................................................................................................................... 80
Table 2-7 Types of Key Points (modified from Liker and Meier 2007) .......................... 81
Table 4-1 Model Input Parameters (No Rework) ........................................................... 145
Table 6-1 Traditional vs. Integrated vs. Lean Project Delivery (modified from Cook et al.
2007, Lichtig 2005)......................................................................................... 176
Table 6-2 Proposed Discrete-Event Simulation Models for OSHPD............................. 178
Table 6-3 Project Categories and Review Strategy ........................................................ 182
Table 6-4 Category of Projects ....................................................................................... 189
Table 6-5 Data for Rework Rate (Simulated) ................................................................. 192

xiii
Table 6-6 Data for Rework Rate..................................................................................... 195
Table 6-7 Consolidated First Review Mean and Standard Deviation............................. 203
Table 6-8 Consolidated First Review Mean and Standard Deviation............................. 203
Table 6-9 Consolidated Mean and Standard Deviation Re-Review ............................... 205
Table 6-10 Consolidated Mean and Standard Deviation Re-Review ............................. 205
Table 6-11 Mean Time to Permit.................................................................................... 208
Table 6-12 Category I: Approval and Owner Rework Time (days), Models 1 and 2 .... 215
Table 6-13 Category II: Approval and Owner Rework Time (days), Models 1 and 2 ... 215
Table 6-14 Category III: Approval and Owner Rework Time (days), Models 1 and 2.. 216
Table 6-15 Category IV: Approval and Owner Rework Time (days), Models 1 and 2 . 216
Table 6-16 (1:1) Sensitivity Analysis Ratios for First Review....................................... 217
Table 6-17 (1:1) Sensitivity Analysis Ratios for Re-Review ......................................... 217
Table 6-18 (1:2) Sensitivity Analysis Ratios for First Review....................................... 219
Table 6-19 (1:2) Sensitivity Analysis Ratios for Re-Review ......................................... 219
Table 6-20 (1:4) Sensitivity Analysis Ratios for First Review....................................... 220
Table 6-21 (1:4) Sensitivity Analysis Ratios for Re-Review ......................................... 220
Table 6-22 (2:1) Sensitivity Analysis Ratios for First Review....................................... 221
Table 6-23 (2:1) Sensitivity Analysis Ratios for Re-Review ......................................... 221
Table 6-24 (4:1) Sensitivity Analysis Ratios for First Review....................................... 222
Table 6-25 (4:1) Sensitivity Analysis Ratios for Re-Review ......................................... 222

1
1. INTRODUCTION
1.1 Motivation
I am a commissioned officer in the United States Air Force and have served our country
for over 12 years. This research effort is grounded in the experiences that I have had in
the military. Specifically, after the events of September 11, 2001, I was deployed to the
United Arab Emirates, to an airbase to construct an 1,140’ by 780’ aircraft parking ramp
that would support the air campaign in Operation Enduring Freedom to drive the Taliban
from power in Afghanistan. As the officer in charge, I was responsible for the entire
design, construction, and procurement of the $26M project. This aircraft parking ramp
had to be ready for operation in less than six months to include taxiways, apron, airfield
lighting, a fire station, two warehouses, and all supporting utilities like water, sewer,
electricity, and HVAC.
Due to the time constraint, the team of 300 personnel I was responsible for was
extremely motivated to support the mission of the United States. I was deployed to
location two months earlier to start the design and was involved with soil borings to
determine the foundation requirements. The entire site would have to be elevated over six
feet with various amounts of soil. Also, design standards were developed to mitigate the
harsh soil conditions. I was able to complete the design in less than two months.
In the back of my mind, I kept thinking about how to prevent rework on this
project because time was ticking and we did not have the time to spare. One way to
ensure that the design drawings would be completed without large errors was to include
various design professionals and tradesmen in my design team. The design engineers
included a mechanical and electrical engineer. However, some of the most valuable

2
members were the craftsmen, including a pavement engineer familiar with asphalt and
concrete, an airfield lighting expert, a utility specialist, a structural specialist, and a
contracting specialist.
Building in a foreign country posed a difficulty none of my personnel had faced
before. Our goal was to build a ramp and supporting infrastructure to the highest quality
possible. In order to build a project that would stand the test of time, we consulted local
industry members; fortunately, Bechtel was more than willing to help in this situation.
They alerted us to significant errors they had made in the past when constructing large
concrete projects in the Middle East and they pointed out the importance of tending to
two issues. The first issue was the use of British standards for concrete design and
testing, something that would require us to develop an understanding of block testing
(versus cylinder testing as specified by the American Concrete Institute (ACI)). The
second issue was aggregate. In the Middle East, much of the aggregate is river rock:
smooth and rounded. By contrast, American engineers learn to use aggregate with
fractured faces to ensure interlocking forces occur. Also, in the Middle East, aggregate is
not washed for fines because the sheer amount of dust in the area would make such an
action futile. In other words, we would have to abandon ACI standards and work with the
local engineers to understand the implications of these issues, using higher moisture
content in the concrete mix and hot weather concreting procedures. It was this upfront
acceptance of working in a foreign situation that aided us greatly. We did not come into
the situation requiring the job be completed to ACI specifications.
An additional difficulty of building in a foreign country is overcoming language
and cultural barriers. Furthermore, we had to obtain approval of the design drawings

3
through both the local and the military building departments. We engaged their
departments very early and explained that we were building to a specific set of airfield
standards. In other words, we involved local industry as much as possible to get their
expert help. This greatly reduced the number of errors that might have otherwise
occurred. In retrospect, our decision to involve local experts early on was likely the most
important reason the project moved so smoothly without needing rework.
During the construction phase, specifically during concrete placement, we
operated 24 hours a day. There was no room for rework. To prevent rework, we met
extensively during the day and night to ensure concrete quality was up to standard, and
we constantly poured and tested cubes throughout the project. In the field we developed
built-in quality procedures for dowel placement which helped considerably during the
30,000 dowel installation.
This project was extremely successful, requiring minimal amounts of rework.
This kept the team’s motivation very high throughout the project and I believe the
synergies created allowed this project to succeed.
When I entered the military, my goal was to obtain my PhD and become a
professor like my father. His love for teaching lasted over 26 years. As a result, I
competed and successfully won the opportunity to obtain my PhD through the US Air
Force. The US Air Force will draw down its work force over the next few years and is
using lean concepts to improve process efficiencies. I knew I wanted to study lean
concepts for my PhD. Therefore, with the concept of understanding rework and its
impact, and the ability to apply lean concepts to mitigate rework effects became the focus
of my research.
4
I also wanted to focus my research on a government agency because I work for a
large government agency. Government agencies are similar in many ways and what I
learn from one agency, can be applied to another agency. These similarities include: not
being able to hire and fire people because all procurement must be competitively bid out,
and being required to deal with the lowest common denominator so as not to exclude a
population. Avoiding the embedding of errors can have an enormous impact on design,
permitting, and construction schedules. Studying how this can be done systematically is
the subject of this dissertation research.
I decided to focus on the permitting process for construction of California
healthcare facilities because of the government agency tie and the opportunity I had to
gain access to research data. In addition, my professors, Dr. Glenn Ballard and Dr. Iris
Tommelein, with members of the Project Production Systems Laboratory have reached
out to the healthcare facility industry in California to help improve production processes.
One process that needs improvement is the permitting process which involves owners,
designers, contractors, and regulators.
1.1.1 Escalating Costs for California Healthcare Facilities
The cost of constructing healthcare facilities is escalating in the state of California: for
example, in northern California, it has risen from $330/GSF to around $620/GSF from
2003 to 2007 (figure 1-1), an increase of 88% in four years. This cost increase is linked to
the seismic requirements imposed by the Healthcare facility Safety Seismic Act of 1973,
the cost of land, and escalation of construction costs.

5
0
100
200
300
400
500
600
700
Jan-
91
Jan-
93
Jan-
95
Jan-
97
Jan-
99
Jan-
01
Jan-
03
Jan-
05
Jan-
07
Time (years)
Hos
pita
l Con
stru
ctio
n C
ost
$/
GSF
Figure 1-1 Cost Escalation of Construction in Northern California (modified from Morris
2007)
This rise in cost for California healthcare facilities is more pronounced than it is
for non-California healthcare facilities (figure 1-2).
0
100
200
300
400
500
600
2004 2005 2006
Time (years)
Hos
pita
l Con
struc
tion
Cos
t a
$/G
SF
California
Non California
0
100
200
300
400
500
600
2004 2005 2006
Time (years)
Hos
pita
l Con
struc
tion
Cos
t a
$/G
SF
California
Non California
Figure 1-2 California vs. Non-California Cost of Construction (modified from Morris
2007)
The high demand for construction services in California is one major contributor
to the cost escalation. Figure 1-3 reflects this demand by showing an increase in
employment of construction personnel in California for every year since 1997, except

6
between 2002 and 2003. Even during the dot com crash of 2001, construction
employment continued to increase for about another year.
-5
0
5
10
15
20
1997 1998 1999 2000 2001 2002 2003 2004 2005 2006 2007
Time (years)
Cha
nge
in C
onstr
uctio
n Em
ploy
men
t (a
s a p
erce
nt c
hang
e ye
ar to
yea
r)
Figure 1-3 Construction Employment in California (Bureau of Labor Statistics 2007)
A reduction of available contractors to work on healthcare facility projects occurs
due to several reasons including: (1) healthcare facility construction is a complex process
and requires experienced, specialized contractors, (2) the qualification and experience
requirements, with respect to bonding and insurance, created a large barrier to entry for
new contractors, and (3) industry member perception of the extensive regulatory, review,
and inspection required by the state of California limits the number of contractors willing
to take on healthcare facility construction. Therefore, due to small numbers, it is possible
to affect change in the permitting process by engaging those involved to develop a new
process that can reduce, if not totally eliminate rework. Additional information on the
issue surrounding California healthcare facility construction is located in section 2.6.
Rework means different things to different people. The following section defines rework
in the context of this dissertation.

7
1.1.2 Rework Definitions
Some practitioners speculate that a major contributing factor to the rising cost of
healthcare facility construction is the rework that occurs in the upfront planning, design,
and permitting phases. What rework are they referring to? Following are four definitions
of rework:
1. Total direct cost of redoing work in the field regardless of initiating cause
(Construction Owners Association of Alberta 2001).
2. Activities in the field that have to be done more than once or activities that remove
work previously installed as part of the project (Rogge et al. 2001).
3. The unnecessary effort of redoing a process or activity that was incorrectly
implemented the first time (Love et al. 2000).
4. Negative iterations of work that can be eliminated without loss of value or without
causing failure to complete the project (Ballard 1999). Ballard classifies rework as
either positive or negative. Positive rework adds value; for example, it occurs when
designs are reworked and participants in the design process leave with a better
understanding of customer requirements. Negative rework does not add value; for
example, it occurs when duct work is initially installed and then has to be removed
because interior walls were moved to accommodate a design change. Negative
rework extends projects schedules.
The definition by Ballard is used in this research.As the facility delivery process
from conception to construction completion is extended, the total cost increases. One way
to control such costs is to reduce the upfront planning, design, and permitting phase,
which in California can take on the order of two to five years for a new healthcare

8
facility. This upfront process involves many different organizations to include the
owners, architects, engineers, and in California, the Office of Statewide Health Planning
and Development (OSHPD), and the Department of Health Services (DHS). The role of
OSHPD and DHS is described in section 2.6.
The iterative process of the upfront design and permitting process can be both
positive and negative in nature. However, increased design iterations may create delays
leading to cost escalation and add time to project schedules. Iterations may be due to
owner changes, changing regulations, and the handoffs between the different
organizations as mentioned. The information required to design a healthcare facility
flows in large batches or chunks of work that, when taken together, add to the delays.
Introduce an error in the design and the delays exacerbate. Rising cost and schedule
growth of projects is directly correlated with rework, due to the added effort it takes to
resolve and mitigate the rework (Love 2002).
1.2 Problem Statement
Healthcare facilities are complex systems requiring significant effort in planning,
permitting, and construction. Due to (1) intricate designs, (2) stringent seismic (upgrade)
requirements in California, (3) cost escalation, (4) labor shortages, and (5) compressed
schedules, cost and schedule overruns are prevalent and customer value is reduced.
Construction costs in California have escalated at a rate between 8 - 12% per year
and are projected to further increase in 2009 and 2010 (CHA 2008). Therefore, it is
reasonable to assume a 1% per month cost escalation for California healthcare facility
construction. Previous studies have found the cost of rework in design and construction to

9
range from 2% to 12% of the contract cost (Burati et al. 1992, Josephson and
Hammarlund 1999, Love et al. 2000). For example, it costs approximately $2M per bed
to construct a new healthcare facility, therefore, a 50-bed healthcare facility costs on the
order of $100M. Using a cost escalation of 1% per month equates to $1M per month of
delay. Informal surveys of design teams have revealed estimates as high as 50% of design
time spent on needless (negative) iteration (rework) (Ballard 1999). Reducing the time to
design and permit a healthcare facility in California can reduce the overall time to deliver
a healthcare facility which improves business plans.
1.3 Research Objectives
This research has six objectives.
1. Develop a taxonomy of rework as it applies to the California healthcare facility
industry, building on existing literature where possible.
2. Develop a computational model to understand how a management strategy affects
field construction variation while operating in a continually changing design
environment.
3. Develop a computational model to understand demand and capacity and the influence
that rework has on a simple production model.
4. Explore throttles on a production model and how they might relate to a state
permitting agency.
5. Develop a computational model of a California facility permitting agency to
understand how an alternative review process affects organizational workflow.
6. Reveal process inefficiencies by studying an existing design review process.
10
1.4 Research Questions
This research poses eight questions.
1. What are the root causes of rework in the healthcare facility construction industry?
2. What strategy should a mechanical contractor adopt to avoid negative rework during
the construction phase?
3. What are the throttles on a simple design review process and how are they controlled?
4. What is revealed from a sensitivity analysis conducted on a plan review simulation?
5. How can a plan review system be stabilized for mean time to permit and improve
predictability?
6. How can errors in healthcare facility design be detected and corrected?
7. What is the effect on the plan review agency if benefits from an alternative review
process are not realized?
8. What strategy should a plan review agency adopt to avoid negative rework during the
design and permitting phase?
1.5 Hypothesis
This research poses two hypotheses.
1. Reducing rework in the planning, designing, and permitting phases reduces the lead
time to deliver healthcare facilities.
2. Implementing an alternative review process reduces embedded design errors and
reduces the time to permit healthcare facility designs.

11
1.6 Methodology
This research uses qualitative and quantitative techniques to understand the impact of
rework on the delivery of healthcare facilities in California. Qualitatively, I used
purposeful sampling to obtain the data samples. I used cause and effect diagrams to
expand an existing taxonomy of rework. Also, I used in depth interviews to develop a
reflective survey for design and construction personnel and to validate the two computer
models presented in chapters 4 and 5. Quantitatively, I used computer simulation,
specifically discrete event simulation to research two types of organizational workflow
and lean production theory to demonstrate the impact rwork can have on process
efficiency. I analyzed the database in conjunction with resampling techniques to obtain
sample statistics used in the discrete event simulation presented in chapter 6.
1.6.1 Qualitative Research
Five types of qualitative research exist: (1) narrative-biography, (2) phenomenology, (3)
ethnography, (4) grounded theory, and (5) case studies (Creswell 2007).
1. A Narrative-biography consists of interviewing a few individuals where data is
collected through their stories and experiences, and then chronologically ordering
them. Narrative-biographical research has its roots in literature, history, anthropology,
sociology, sociolinguistics, and education (Chase 2005). The challenge of this type of
research is accounting/correcting for the biases involved. The researcher must
understand the context of the individual’s life, for example, what is their personal and
political background (Creswell 2007). Issues dealing with collecting, analyzing, and
reporting the individual stories must also be addressed, such as: Who owns the story?

12
Who can tell it? Who can change it? Whose version is convincing? What happens
when narratives compete? As a community, what do stories do among us? These
questions must be addressed prior to completing a successful narrative-biographical
study (Pinnegar and Daynes 2006).
2. Phenomenology research differs slightly from a narrative-biographical study in that it
describes a concept or phenomenon through multiple subjects through their life
experiences. This research attempts to describe what all of the participants have in
common, for example, how people experience grief, anger, or insomnia (Creswell
2007). The purpose is to reduce life experiences from a phenomenon into a
universally understood situation. This type of research ultimately describes what
people experience and how they experience it (Moustakas 1994). Phenomenological
studies are primarily used in sociology, psychology, nursing and education (Borgatta
and Borgatta 1992, Giorgi 1985, Oiler 1986, Tesch 1988). The challenges are that the
researcher must have a broad understanding of the assumptions; the participants must
be carefully selected so that they have experienced the phenomena so a common
understanding can be achieved, and finally it can be difficult to put boundaries on the
personal experiences obtained in the study (Creswell 2007).
3. An ethnography focuses on a cultural group to examine shared patterns. These
groups, for example, can be teachers in an entire city or construction workers who are
involved with healthcare facilities, which are studied over time to understand their
interactions. Behaviors, beliefs, and languages are examples of potentially shared
patterns within a cultural group. An ethnography uses participant observation to
collect data where the researcher is involved with the day-to-day lives of the people

13
and records observations and interviews with the cultural group. The challenge with
ethnographies is the extensive time required to complete them, with much of that time
occurring in the field. The researcher must maintain objectivity but many times
becomes extremely biased in the information that is presented in an ethnographic
study (Creswell 2007).
4. Grounded theory research attempts to go beyond describing a common experience
that a phenomenological study provides and tries to generate or discover a theory, an
abstract analytical scheme of a process, action, or interaction through the views of a
large number of participants. The key difference is that the theory is not just
developed, but it is grounded in data from participants who have experienced the
process (Strauss and Corbin 1998). This research method is also used in sociology,
nursing, education, and psychology. The challenges with grounded theory research
are that theoretical ideas must be set aside so the proposed theory can evolve. The
research is difficult to conduct because it is difficult to know whether or not enough
and sufficiently detailed information about the theory has been obtained. One
technique that can be used to determine if data is sufficient is to collect another
sample that is completely independent from the original sample (Creswell 2007).
5. Case studies are a common research method in psychology, sociology, political
science, social work (Gilgun 1994), business (Ghauri and Gronhaug 2002), and city
and regional planning (Legates and Stout 2007). Case studies are a useful research
method to conduct experiments in order to understand how and why a phenomenon
occurs, where behavioral events are not controlled and the event is occurring in real
time. Case studies try to understand complex social phenomena that can not be

14
studied or replicated in a laboratory setting. The case study allows the meaningful
characteristics of real life events, such as organizational, leadership, and managerial
decisions and processes to be retained and evaluated in a systematic way (Yin 2002).
Case studies are the focus of this dissertation.
This dissertation will focus its data collection on documents, interviews, direct
observation, and participant observation. Table 1-1 shows the strengths and weaknesses
of each of these data sources.

15
Source of data Strengths Weaknesses Documentation • Stable - can be reviewed
repeatedly • Unobtrusive - not created as a
result of the case study • Exact - contains exact names,
references, and details of an event
• Broad coverage - long span of tie, many events, and many settings
• Retrievability - can be low • Biased selectivity, if
collection is incomplete • Reporting bias - reflects
(unknown) bias of author • Access - may be deliberately
blocked
Archival records
• (Same as above for documentation)
• Precise and quantitative
• (Same as above for documentation)
• Accessibility due to privacy reasons
Interviews • Targeted - focuses directly on case study topic
• Insightful - provides perceived causal inferences
• Bias due to poorly constructed questions
• Response bias • Inaccurate due to poor recall • Reflexivity - interviewee
gives what interviewers want to hear
Direct observation
• Reality - covers events in real time
• Contextual - covers context of event
• Time consuming • Selectivity - unless broad
coverage • Reflexivity - event may
proceed differently because it is being observed
• Cost - hours needed by human observers
Participant observation
• (Same as above for direct observations)
• Insightful into interpersonal behavior and motives
• (Same as above for direct observations)
• Bias due to investigator’s manipulation of events
Physical artifacts
• Insightful into cultural features • Insightful into technical
operations
• Selectivity • Availability
Table 1-1 Six Sources of Data: Strengths and Weaknesses (Yin 2002)
Case study documentation is used to corroborate and augment data from other
sources. Documentation can come in the forms of letters, agendas, announcements,
meeting minutes, proposals, progress reports, formal studies, newspaper articles, and
16
internet websites. Documents clarify names and titles within organizations. They can also
provide specific verification of other data sources and inferences can be made from them.
For example, understanding how documents are distributed throughout an organization
can provide information on how formal and informal communication works. However,
one must be careful in developing theory based on such inferences because they can
easily be wrong. This type of data will be used in this dissertation.
Archival records encompass service records, organizational records, maps, charts,
lists, survey data, and personal records. The strengths and weaknesses are similar to
documentation yet differ in that privacy issues may prohibit access. These types of
records are produced with an audience in mind and that must be considered in
understanding their bias, usefulness, and accuracy. This type of data will not be used in
this dissertation.
Interviews will be a source of validation for the case study research. Interviews
differ from surveys in that the question and conversation is allowed to flow through
different topics as long as the main points of questioning are addressed. An interview
may provide the researcher with information they did not intend to collect (Rubin and
Rubin 2005). Questions posed in a semi-structured manner produce data with less bias.
For example, asking “why” a particular process has occurred may put the interviewee on
the defensive, while asking “how” a process occurs retrieves more accurate information
(Becker 1998). Four types exist: (1) open ended, (2) semi-structured, (3) structured, and
(4) focused. Open ended interviews consist of questions that leave the answer entirely up
to the respondent. Semi-structured as mentioned above allows for more of a conversation
to occur between the participant and the researcher. Structured interviews have a set of

17
questions and the interview does not deviate from that set of questions. Focused
interviews are typically set up to occur within a certain time frame, an hour for example.
This dissertation used semi-structured interviews.
Direct observation can range from formal to casual. Formal observation occurs
through a defined protocol that allows the field worker to measure for example the
number of times a certain behavior occurs during the observational period (Yin 2002).
Casual observation does not require a specific protocol of what needs to be observed. The
researcher is generally observing a situation and recording data that is important to
him/her. This dissertation will not use direct observation.
Participant observation is a special mode of observation in which the researcher is
directly involved with the action that is being observed. This type of observation occurs
in many city and regional planning studies. For example, in The Urban Villagers, Gans
(1962) studied the life of Italian Americans as a participant observer. The data was
collected from a neighborhood in which he was a long time resident. A major strength of
participant observation is that it allows the researcher to gain access to areas people
conducting direct observations may not have access to. In addition, it provides the ability
of the researcher to perceive reality from someone who is “inside” the case study.
However, this type of data can be biased and the participant observer may become a
supporter of the group or organization being studied (Yin 2002). This dissertation will not
use participant observation.
Physical artifacts may be collected during site visits and may allow the researcher
to understand current policy and procedures that govern an organization (Yin 2002).

18
Project schedules, change orders, and faxes are examples of physical artifacts. This
dissertation will not collect physical artifacts.
1.6.2 Quantitative Research
The quantitative research techniques used in this work centers on discrete event
simulation and database analysis. System models are divided into two categories:
(1) deterministic and (2) stochastic (figure 1-4). Deterministic system models have no
random components. For example, when modeling a chair lift servicing a ski resort,
assuming that the chair lift machinery never fails and the queue is always full, a constant-
velocity model can be developed that will determine how many people reach the top in a
certain time frame. However, at some level a system model involves randomness. A
stochastic model brings random behavior into the picture, for example, engines fail,
people fall off the chair lift, and people show up at the lift at random times.

19
System Model
Deterministic Stochastic
Static Dynamic
Continuous Discrete
StaticMonte Carlo Simulation
Dynamic
ContinuousSystems Dynamics
Simulation
DiscreteDiscrete Event
Simulation
Figure 1-4 System Model Taxonomy (Leemis 2006)
The advantage of a discrete event simulation is it can accommodate randomness and be
used when other mathematical characterization is too complex to give a closed-form
solution.
Stochastic system models are either static or dynamic. A static system model is
one where time is not a concern. A well known static stochastic model is a Monte Carlo
simulation which uses a random number generator (Law 2007).For example, if the
question is “Five million people shop at a chain retail outlet, what is the probability that
each one spends over $1,000 dollars?” the simulation program developed to answer this
question should be a static model because it doesn’t matter when during that week the
shoppers made their purchases. However, if the question is “What is the probability that a
shopper will spend over $1,000 dollars as the weeks approach Christmas?” then the
simulation program should be a dynamic model. This occurs because shoppers are more
inclined to spend money as the holiday season arrives. A dynamic model should be
considered where time is important to the system (Leemis and Park 2006).
20
A dynamic stochastic model can be continuous or discrete. Continuous dynamic
models are best represented by classical mechanical systems that have continuously
evolving variables and by systems dynamics models (e.g., Sterman 2002). An
accelerating vehicle, a skier moving downhill, or a block sliding down are examples of
models where continuous movement is described by differential equations that model
continuous changes over time. Systems that perform piecewise functions, as in
transforming raw metal into a HVAC duct or conducting a review of healthcare facility
drawings, are best described using a discrete event simulation model. These models are
stochastic because they can experience randomness in the variables. They are dynamic
because the evolution of time is important in understanding the system. Finally, they are
‘discrete event’ because significant changes in the variables are associated with events
that each occur at a specific time during the operation (Leemis and Park 2006).
Discrete event simulation models can also be used to model project schedules.
These models implement a network form to communicate complex concepts. Project
planning using the Critical Path Method (CPM) and the Project Evaluation and Review
Technique (PERT) are examples of network models that convey complex situations.
Discrete event simulations may use an activity on node representation with use
nodes (Activities and Queues) connected to each other through arcs or links to describe
the network(e.g., STROBOSCOPE CPM, Martinez 1996). Following is a brief
description of a few simulation models.
The General Simulation Program (GSP) (Tocher and Owen 1960) introduced the
concept of bound and conditional activities. An activity is considered bounded when it
can start as soon as the predecessor event finishes. For example, figure 1-5 illustrates a

21
discrete event simulation model where the activity is bounded, when a pallet is fully
loaded then it can be packaged for shipment. This illustration uses the EZStrobe graphical
interface (Martinez 1996). The “1” represents the number of units that will pass to
Package Pallet when Load Pallet is complete.
Load Pallet
Package Pallet
1
Figure 1-5 Bounded Activity
Conditional activities require at least two conditions to be met prior to the
execution of the activity. For example, figure 1-6 illustrates workers and bricks both
being needed for the activity of stacking to occur. The “>0, 1” located on each of the
links from the workers and bricks queues controls the flow of resources. If one or more
resources exist in the queue, then 1 resource is allowed to flow into the stack bricks
activity.

22
Workers
Bricks
>0 , 1
Stack Bricks
>0 , 1
Figure 1-6 Conditional Activity
The Cyclic Operations Network (CYCLONE) was developed to model
construction processes (Halpin and Woodhead 1976). CYCLONE is a simple computer
model that is network based. Many other construction process models were built upon the
CYCLONE model. Improvements to CYCLONE were developed by Ioannou (1989)
with UM-CYCLONE and Halpin (1990) with Micro-CYCLONE. Three limitations are
noted with the CYCLONE simulation engine: (1) unable to distinguish resource
differences, (2) unable to determine the state of the process, and (3) unable to use
resource properties dynamically to change model behavior (Martinez 1996).
The COOPS construction simulation system (Liu 1991) uses a graphical interface
to allow users to draw activities, queues, and links on a computer screen. These network
models allow users to create specific resources and implement statistical information on
how the resources are used.
The CIPROS construction simulation system offers object hierarchies to link the
simulation model to a CPM based project schedule (Tommelein et al. 1994).

23
The STROBOSCOPE (Martinez 1996) simulation engine, is made up of activities
or processing steps (called ‘Combis’ = rectangles with cut-offs in the top-left corner, or
‘Normals’ = rectangles), holding places for resources while they are not in use and thus
accumulate (Queues), symbols to model flow (arrows), and stochastic, or deterministic
branching (Forks). Microsoft Visio integrates the STROBOSCOPE elements into a
graphical interface as a macro and allows construction of a variety of processes.
STROBOSCOPE (1) allows the state of the simulation to control the sequence of tasks
and their relative priorities, (2) models resource selection schemes so that they resemble
the way resources are selected for tasks in actual operations, and (3) models probabilistic
material utilization, consumption, and production.
I have selected STROBOSCOPE as the programming language for this
dissertation because the software is free to academic users, and it is used by various other
construction researchers, among whom these terms are known. This makes it easier for
models to be replicated, evaluated, and experimented with by academic and industry
peers. STROBOSCOPE has been used to model ‘lean’ applications such as ‘pull’ in pipe-
spool supply and installation (Tommelein 1998) and the airplane game (Rybkowski et al.
2008), multi-tasking and batching in the delivery of pipe supports (Arbulu et al. 2002),
product standardization (Alves and Tommelein 2006), feedback in planning, fabrication,
shipping, and installation of duct work (Alves and Tommelein 2006), and various lean
production management principles applied to high-rise apartment construction (Sacks et
al. 2007).

24
1.6.3 Sampling
Data sampling is discussed in this section. This dissertation sampled data in three ways.
The first way I collected data was qualitatively by compiling information from a series of
industry workshops. This data lists the waste or inefficient items within an existing
process.
The second way I collected data was through interviews with employees of a
mechanical contractor. From these interviews, I constructed a discrete event simulation
model. The interview information consisted of how work flowed through their detailing,
fabrication, and installation phases. I then developed a process map from this information
and simplified it into a computer model. I did not calibrate the computer model because
the organization did not record the amount of rework that occurred within their
organization. However, the model still provides insight on the impact rework that occurs
at different stages has on a process.
The third way I collected data was through both qualitative and quantitative
methods. I conducted in-depth interviews with members involved with healthcare facility
construction in California to understand how the facilities are permitted. I analyzed this
data to construct a discrete event simulation model. I calibrated the model to existing data
and then made a change to the process to understand how the changes can impact the
time to permit a healthcare facility.
1.6.4 Qualitative Validation
I used in-depth interviews to validate the computer models developed in chapters 4 and 5.
Through these interviews, I obtained field expert thoughts on how my computer

25
simulation models reflect the reality of their processes. The interviews validated
questions I had in analyzing existing organizational data presented in chapter 5.
Two types of error are encountered when performing in depth interviews:
(1) sampling and (2) measurement error. A brief description of these types of errors is
provided below.
1. Sampling error occurs when researchers interview only a subset of the available
population (Salant and Dillman 1994). This error is intrinsic to the sampling process.
One way to reduce sampling error is to increase the sample population, but error can
never be eliminated unless the total population is interviewed. This would not be
feasible in this work. I had access to a limited number of OSHPD officials that were
willing to work and provide feedback but could not possibly contact all (200+)
OSHPD personnel. However, the ability to estimate with a fair amount of accuracy
the central tendency of a population by obtaining data from only a small portion of
the population is what distinguishes interviews from all other research methods
(Dillman 2007).
2. Measurement error occurs when respondents of questions provide inaccurate,
imprecise or incomparable answers. Two sources of measurement error exist.
2.1 Measurement error can be due to the interviewer, e.g., leading the respondent by
suggesting an answer. For example: “Rework is a major source of motivational
and productivity impacts. Don’t you think that is right?” This error can be reduced
by carefully scripting out what the interviewer says.
2.2 The respondent can add to measurement error. An example commonly occurs
when asking for salary information. A simple question such as “What was your

26
annual salary last year?” can provide many different answers. One respondent
may not think this is relevant and may answer zero or $5 million, both answers
may be true but it is more probable, that the answers provided are incorrect. These
answers are typically noted as outliers and may be eliminated from the data set
when reviewed by the researcher. The best mitigation technique for respondent
error is to write clear, concise, and unambiguous questions that people can and
want to answer (Salant and Dillman 1994).
This research uses a focus group to acquire a general understanding of the impact
that rework has on the design and construction industry. A focus group is a small subset
of the target population including individuals who can provide ideas about the topic
(Salant and Dillman 1994).
The interviews consist of open-ended questions that leave the answer entirely up
to the respondent. An example in this research would be “What is the major cause of
rework that you encounter?” This type of question can provide broad answers. The
strength of an open ended question is that it allows the respondent to provide their own
input which the researcher may not have anticipated. When compared to structured
questions, open ended questions offer a greater amount of answer diversity.
1.7 Dissertation Structure
Figure 1-7 shows the six additional chapters of this dissertation.

27
Chapter 1: IntroductionMotivation Problem Statement Hypothesis Research Questions Research
Objectives Methodology
Chapter 2: Background and Literature ReviewRework Motivational Theory Quality Lean Production Building
Information Modeling OSHPD
Chapter 3: Taxonomy of ReworkData Collection Categorization Relative Contribution Analysis
Management Suggestions
Chapter 4: Case I: Workflow of a Mechanical Contractor (Supporting Case)Types of Contracts Discrete Event Simulation Model Analysis
Chapter 6: Case II: Effect of Alternative Review on Workflow (Primary Case)Alternative Review Process Database Analysis Discrete Event Simulation
Model Model Calibration Sensitivity Analysis Validation
Chapter 7: ConclusionsFindings Contributions to Knowledge Future Research
Chapter 5: Understanding Demand and Capacity (Supporting Case)One Rework Cycle Multiple Rework Cycles Demand and Capacity Analysis
Resource Stability Analysis
Figure 1-7 Dissertation Structure
Chapter 2 titled “Background and Literature Review” consolidates the relative
literature needed to support the research effort. It contains information on what rework,

28
lean, quality, motivational theory is and related research that has been conducted by
others.
Chapter 3 titled “Taxonomy of Rework” analyzes data obtained from a series of
industry workshops to determine the current state of design and permitting in the
healthcare facility construction industry. It takes a number of rework occurrences and
categorizes them using an existing multi-tiered framework. This chapter describes the
causes of rework that exist and the need to improve the current state of delivering
healthcare facilities. This chapter will help to answer research question one.
Chapter 4 titled “Case Study I: Workflow of a Mechanical Contractor” illustrates
complexity in the design and permitting of healthcare facilities from the point of view of
one discipline, the mechanical contractor. It describes the pressures on the system, and
why in many situations drawings are submitted for review before they are completely
done. It illustrates that it is possible to use computer modeling (specifically using discrete
event simulation) to describe workflow through an organization. This will help to answer
questions two and three.
Chapter 5 titled “Understanding Demand and Capacity Using Simulation”
illustrates the complexity rework adds to a simple production system. This production
system explores three throttles that influence lead time, queue size, and system
stabilization, namely: (1) inflow, (2) review resources, and (3) the likelihood of rework.
A series of simulation models were created to provide intuition on how the three throttles
can be controlled. This chapter illustrates the tradeoffs that must be made to balance
demand and capacity under the pressure of increasing rework. This chapter will help to
answer questions two, three, and four.

29
Chapter 6 titled “Case Study II: Effect of Alternative Review on Workflow”
analyzes the workflow of OSHPD. It describes their current state process and how the
future state process may be affected by implementing an alternative way of reviewing
drawings with the paradigm shift of avoiding the embedding of errors early. This chapter
is linked to chapters 3, 4, and 5 because it extends computer modeling of an organization.
It also shows that by implementing an alternative review process many causes of rework
revealed in chapter 3 can be eliminated. This chapter will help to answer questions two,
three, four, and five.
Chapter 7 titled “Conclusions” wraps up the efforts conducted in this research. It
provides management suggestions, presents research findings, and consolidates the
contributions to academic knowledge. Chapter 7 ends with additional research questions
that surfaced from conducting this research.

30
2. BACKGROUND AND LITERATURE REVIEW
The literature review presented here in chapter 2 has three main topics covering
(1) rework, (2) motivation, and (3) quality as shown in figure 2-1. The purpose of figure
2-1 is to present literature that supports the research described in chapters 3, 4, 5, and 6.
This figure shows the topics that classify rework in the AEC industry and how lean
production theory can be implemented and studied through simulation modeling. Figure
2-1 starts with “causes and effects of rework on the delivery of healthcare facilities in
California” and explores the literature through costs, classification, and rework
descriptions. Ng et al. (2004) and Love et al. (2000) studied the direct cost of rework
through contract costs.

31
Figure 2-1 Map of Research Literature
Defining rework provides a foundation for the research presented in this
dissertation. A literature review provided many definitions of rework; however, the four
shown are the most appropriate for work within the AEC industry. The definition
developed by Ballard (1999) describing both positive and negative (iteration) rework is
used in the research presented in subsequent chapters.
Many different ways to classify rework exist within any industry; however,
Fayek’s work is specifically tied to the AEC industry. Other types of rework are

32
described in section 2.1.1. However, Fayek’s work is concentrated on classifying rework
that occurs within the physical construction of the facility. The research presented in
chapter 3 attempts to extend Fayek’s work into the design and permitting phase of
healthcare facilities.
A historical approach is used to describe the transformation of motivational
theory throughout the 20th century. It starts with scientific management and follows
through to more contemporary management theories developed by Simon (1946). His
theory of “satisficing” and bounded rationality are used to frame how industry members
within the AEC industry behave. Section 2.2 provides additional information on this
topic.
Understanding the history of the quality movement is also necessary as a
foundation to this research. One specific topic of lean production is used extensively,
specifically the theory of transformation, flow, and value (TFV) developed by Koskela
(1992) is used as a way to understand facility construction. This theory is used in chapter
4 and 6 to describe how a change in management decisions affects organizational
workflow.
Understanding building information modeling (BIM) and its ties to the AEC
industry are important to the research presented in chapter 6. BIM is a tool that aides the
development of design drawings. The research presented in this dissertation is supported
by three topics required to accomplish the work, (1) building information modeling
(BIM), (2) discrete event simulation, and (3) Office of Statewide Health Planning and
Development (OSHPD).

33
The solid lines in figure 2-1 represent direct links of research that have been
accomplished in those areas. The dashed lines from the hatched boxes represent work that
needs to be explored. As shown, research in classifying rework and modeling workflow
needs to be explored further.
2.1 Rework
Negative rework is the focus of this research. Ballard (1999) defined ‘negative rework’ as
that which “can be eliminated without loss of value or causing failure to complete the
project.” An example of negative rework occurs when a plumbing system fails pressure
testing and has to be removed and modified, while an example of positive rework occurs
when participants in the design process leave with a better understanding of customer
requirements when an item of work is re-accomplished.
Negative rework is costly and wastes time especially from a lean perspective
where the target is rework elimination. The current literature on rework in general
includes work in quantifying the direct cost of rework (Ng et al. 2004, Love 2002): it
targets the cost that was incurred because of incorrect installation procedures or owner
required changes and does not adequately address how to avoid rework. The research
presented in this dissertation focuses on the impact of eliminating rework in
organizational workflow.
2.1.1 Rework in the Computer Industry
Rework is a phenomenon that occurs in other industries as well. For example in the
computer software industry it has been classified into three types: (1) evolutionary,

34
(2) avoidable retrospective, and (3) avoidable corrective. Table 2-1 characterizes these
types of rework.
Type of Rework Characteristics Comments Evolutionary Work performed on a
previous version of an evolving software product or system to enhance and add value to it
This is good if it adds value without violating a cost or schedule constraint
Avoidable Retrospective Work performed on a previous version of an evolving software product or system that developers should have performed previously
This may be good if small amounts are dealt with now instead of later. However, if excessive, it indicates a need to revise work processes
Avoidable Corrective Work performed to fix defects in the current and previous versions of an evolving software product or system
This may be good if total rework is kept within control limits
Table 2-1 Types of Rework - Software Industry (adopted from Fairley and Willshire
2005)
In the software industry, Fairley and Willshire (2005) claim that rework is a given
phenomenon, is needed for quality, and ranges between 10 to 20 percent of the total
effort, which includes all three types of rework mentioned in table 2-1. In other words,
the 10 to 20 percent includes both positive and negative rework. They discuss the
importance of keeping rework within control limits based on statistical process control
(SPC). SPC monitors the process using control charts to understand the variation of
recurring events. However, SPC is ineffective in improving unstable processes. In their
work, evolutionary rework can be linked to positive rework while the two avoidable types
of rework can be linked to negative rework. From the lean perspective, negative rework
should be eliminated at all costs and is not seen as inherent to the process. This
perspective requires and forces a change in organizational relationships because negative

35
rework must be actively pursued, corrected, and eliminated versus hidden, covered up,
and not mentioned.
2.1.2 Rework in the Construction Industry
Many sources of rework have been identified in the construction industry. A cause and
effect diagram (figure 2-2), shows the causes of rework in the construction phase of a
project. It shows five main causes of rework: (1) human resource capability,
(2) leadership and communication, (3) engineering and review, (4) construction planning
and scheduling, and (5) material and equipment supply.
Figure 2-2 Causes of Rework in Construction (Fayek et al. 2004)
The work presented in this dissertation defines the five main causes of rework in
the following manner.
1. Human resource capability categorizes rework that deals with the capabilities of the
engineers, contractors, and subcontractors that are involved with the project.
Untrained personnel working on a facility can lead to rework.

36
2. Leadership and communication includes the management of the project team and
information flow to and from the field workers. Also included is how the project will
be checked for quality.
3. Engineering and review has four subcategories of poor document control, errors and
omissions, late design changes, and scope changes. This category deals with the
causes of rework that pertain to the decision making and flow of information within
the discipline engineers and the owner.
4. Construction planning and scheduling categorizes rework within the construction
project management phase of the process. The facility is in the construction phase and
inappropriate processes are categorized in this rework cause.
5. Material and equipment supply categorizes rework that applies to the physical items
that make up the project. It includes incorrect ordering and incorrect timing of when
materials are to be received at the project site.
Hanna (2002, 1999, 1997) researched rework occurring within the mechanical and
electrical trades to understand the direct cost impact of construction changes. He
concentrated on quantifying whether or not a project was impacted by change orders.
Hanna identified an impacted project as one where change orders have a negative effect
on labor productivity on the base contract. His research utilized a pilot study and
quantitative surveys. His survey focused on three areas (1) general background questions,
(2) on-budget project questions, and (3) over-budget project questions.
Hanna collected actual and estimated manpower loading curves or weekly labor
hours for each project in the survey along with associated change orders. He summarized
the factors that affect a project in the planning, design, and construction phases. In the

37
planning phase, a larger project is more likely to be impacted by change orders than
smaller projects. In the design phase, impacted projects averaged 50% of their change
orders from design problems as opposed to un-impacted projects averaged 38% of their
change from design problems. In the construction phase, when overtime and over-
manning were used to compress or accelerate the project due to change orders, the project
is likely to be impacted. In addition, when absenteeism and turnover were high, the
project would be impacted by an increase in change orders. Hanna (2002) drew this
conclusion from a series of questionnaires disseminated to 200 randomly selected
electrical contractors throughout the United States. The questionnaire had three sections:
(1) company specific information, (2) project specific information, and (3) change order
information. The first gathered information on the company details. The second collected
data from projects they were willing to submit. The third collected the impact of change
orders on the projects provided in section 2.
Hanna’s research provides a framework to understand some of the factors that can
impact productivity during the construction of a project. Many of these impacts were due
to design issues. Driving out errors in the design phase improves construction phase
productivity.
Many types of errors exist, for example, Hirano and Shimbun (1989) describe 10
categories of errors.
1. Forgetfulness errors occur when the operator is not concentrating on the task at hand.
2. Errors due to misunderstanding occur when a person makes a wrong conclusion
without knowing all of the required information.

38
3. Errors in identification occur when a decision is made without seeing the entire
situation at hand.
4. Errors made by amateurs occur through the lack of experience.
5. Willful errors occur when an individual decides to ignore the rules under certain
circumstances.
6. Inadvertent errors occur when a mistake is made without knowing how they occurred.
7. Errors due to slowness occur when actions are slowed down by delays in judgment.
8. Errors due to lack of standards occur when no clear instructions on how to
accomplish the task at hand exist.
9. Surprise errors occur when items perform in an unexpected manner or outside
operating parameters.
10. Intentional errors occur when people make mistakes on purpose to sabotage the
process or product.
This is only one such list of categories, many more exist but in the end, it is the view
point of the researcher of this dissertation that most if not all errors can be prevented if
the time is taken to identify, investigate, correct, and learn from errors.
A tenet of lean is to work towards one piece flow where an item can be produced
almost instantly without inventory. This lean ideal situation may not be realizable, but
reducing workflow batch sizes reduces errors. The following research discusses a
potential scenario on how to evaluate batch sizing within a manufacturing setting. This
work is carried over to the research presented later, which reduces the batch sizes of
design drawings to ensure errors are not embedded into healthcare facility design.

39
2.1.3 Optimizing Batch Sizes and Rework
In Lean manufacturing, reducing batch sizes is one way to increase flow and quality.
Inderfurth et al. (2005) studied the effect of batch sizes on rework and product
deterioration in a production system. Their work determined how many units should be
produced prior to switching over to completing rework items taking into consideration
setup times and product deterioration. Their research developed a static deterministic lot-
size model for a single product, which focused on a two-stage manufacturing system.
Figure 2-3 shows the basic structure of the model they used to evaluate the optimal lot
size. Their goal in optimization is to minimize the total cost per unit time. Using this
model, they determined that the rework cost per unit time was linearly related to the
production lot size. They concluded that the relationship of per unit holding costs for
reworkable items has a major influence in determining the optimal lot size. The research
explored in this dissertation uses the theory of reducing batch sizes presented by
Inderfurth et al. (2005). However, it does not utilize the optimization of rework per-unit
time; instead, it focuses on driving out the errors that exist due to the exchange of large
batches of design drawings in healthcare facility construction.

40
Figure 2-3 Schematic Structure of the Production System (Inderfurth et al. 2005)
Buscher and Lindner (2007) developed a simulation model to optimize a
production system by varying rework and batch sizes. The work focused on minimizing
economic cost and rework quantity by determining batch sizes for production and
rework. The model used is similar to Inderfurth et al.’s in that it used a static
deterministic lot-size model for a single product using a two stage manufacturing system
where both production and rework occur. They found the production and rework sizes
can be determined simultaneously. They determined that the cost of rework is directly
related to the lot size and concluded that a policy of fabricating two items prior to
performing a rework lot in manufacturing should be a pre-specified policy.
What is clear from these two examples of simulating rework in production is that
rework is taken as a given phenomena much like in the computer industry. However, I
take the viewpoint that rework is avoidable, e.g., by reducing batch sizes to ensure errors
Production & Rework
Good Quality Items
Defective Units
Recoverable Inventory
Demand
Inventory

41
are not embedded into design drawing early in the process thereby precluding
downstream errors from occurring.
2.1.4 The Liar’s Club
Rework has been researched with respect to concurrent product development. The move
by many industries towards concurrent product development is predicated on the need to
bring products to market earlier and deliver facilities on a compressed schedule.
Developing products faster than your competitors can increase market share, profit, and a
long-term competitive advantage (Wheelwright and Clark 1992, Meyer 1993, Patterson
1993). Concurrent development has been shown to dramatically reduce cycle times but
has proven difficult for many to implement (Backhouse and Brookes 1996, Wheelwright
and Clark 1992, Womack et al. 1990, and Nevins and Whitney 1989). Concurrent
development increases the frequency and the number of handoffs between project phases,
which increases complexity. More tasks are started with incomplete or preliminary
information which increases the amount of rework (Ford and Sterman 2003).
In many situations the project stays on schedule until 90% completion and it then
stalls, leading to schedule delays; Ford and Sterman (2003) call this situation the 90%
syndrome. A senior manager in one company noted “the average time to develop a new
product took approximately 225% of the projected time plus or minus 85%. We can tell
you how long it will take, plus or minus a project (Ford et al. 1993).” The 90% syndrome
is common in the software, construction, consumer electronics and semiconductor
industries (Abdel-Hamid 1988, Demarco 1982, Kiewel 1998).

42
One practice contributing to the 90% syndrome is the practice of concealment, or
what Ford and Sterman (2003) call the “liar’s club.” The liar’s club refers to an
organization where concealment is standard practice. Project managers of subsystems
hold information back on what their real schedule is and how much rework they
encounter and push downstream. Project teams hold information in hopes someone else
among the project teams will eventually have to come forward and state they are behind
schedule. Then the rest of the project team can add time to their schedules allowing them
to cover up errors. Such practices extend the completion time and produce the 90%
syndrome. This situation occurs in construction projects in part due to the multiple
handoffs between the project players. Each player says they are on schedule yet may be
behind—hoping to find time to correct errors—and delaying the release of more complete
information.
Managers conceal information for six reasons (Ford and Sterman 2003): Concealing
1. Reduces the need for iteration (temporarily), which increases leaderships’ perception
of schedule completion. This occurs because the typical management perception of
any iteration is negative which it does not need to be.
2. Allows downstream players to continue to work and therefore reduces the pressure of
the upstream player to release work faster. If a downstream player is not receiving
enough work, they could raise it to leadership’s attention which would then focus the
spotlight onto the upstream player. Leaders in this culture avoid this at all costs even
if errors are known to be present.
3. Reduces the amount of known work that needs to be reworked and further
coordinated, improving apparent project quality.

43
4. Delays coordination so that rework spreads the work over a longer period of time,
reducing peak resource needs.
5. Leads to rework that increases the chance that schedule delays by other phases will
allow managers and engineers to solve their own issues.
6. Enhances the manager’s job security because leadership will not be focused on their
work.
Ford and Sterman (2003) developed and simulated the effect concealment had on
a project. They determined increasing concealment:
1. Significantly lengthens project durations, increases cost, and reduces quality.
2. Leads to smaller cycle time reductions experienced by concurrent development.
3. Has a greater impact when high concurrence occurs because more work has been
done with errors that are concealed until finally detected at the end of the project.
This greater impact is illustrated using a series of simulation models where
concealment is varied between 0% and 100%.
Changing the paradigm from phase efficiency to system optimization is a way to
mitigate the liar’s club and 90% syndrome. Leadership must address both technical and
behavioral issues to find a solution to this problem (Ford and Sterman 2003).
Repenning and Sterman (2001) highlighted an issue with organizational culture,
namely that people do not get credit for correcting errors that never occur. They
conducted in-depth case studies with industries to include telecommunications, semi-
conductors, chemical, oil, automobile, and recreational products and found process
improvements were quickly abandoned because of process variability. They state that
many organizations reward heroes that can come in and fix a process under duress, rather

44
than cultivate a spirit of team members working to consistently improve the process. For
example, a mechanical contractor may have to re-detail design drawings multiple times
(negative iteration) before the change is finalized. The mechanical contractor must invest
additional resources to reconcile design changes and does not get compensated for the
additional work or for improving the design (Feng et al. 2008).
2.1.5 The Culture of Change
In talking about changes to an organization, the resistance to change must be addressed.
Lawrence (1969) discussed the two aspects, (1) technical and (2) social, that must be
identified prior to dealing with the resistance to change.
1. The technical aspect to the resistance to change deals with the actual skills that the
personnel must have to perform after the change has occurred. For example,
personnel will resist a change to a new computer system because they do not have the
skills to perform the new computer work and, fearing they will lose their job, will
resist this technological change.
2. The social aspect to the resistance to change deals with personnel interactions within
the new process. For example, a process change will require regulatory reviewers to
meet with and discuss design options with the design team. However, the regulatory
reviewer is shy and introverted. Therefore, this new process where they have to
interact with the design personnel is foreign to how they work and therefore, they will
resist this process change.
Lawrence (1969) makes this distinction to ensure senior leaders know how to deal
with the resistance to change and that many times, senior leaders overlook this simple

45
distinction. For example, take the regulatory reviewer in the aforementioned example,
even if senior leaders offered the individual more money to work in the new process, they
will continue to resist because they are uncomfortable working with the other design
professionals. Therefore, to overcome this social aspect, senior leaders will have to
provide training to the individual that will make them more comfortable so they can
overcome their shyness and introvertedness.
Literature has identified four reasons in which people in an organization resist
change: (1) self interest, (2) misunderstanding and lack of trust, (3) different assessments,
and (4) low tolerance for change (Kotter and Schlesinger 1979).
1. Self interest is a major resistance to change because people enduring the change fear
they will lose something of value. The resistance occurs because people are looking
out for their best interests and not for the best interests of the organization. For
example, a new technology is introduced to improve production efficiency. However,
during this implementation, some personnel will have to be moved to another
department. Fearing they will lose their jobs or the value they create, the personnel
resist the new technology.
2. Personnel resist change when they do not understand what the impact of the change
will be and think that the cost is greater than the benefits they will receive. For
example, senior leaders of an organization decide to implement a flexible work
schedule to make the organization more attractive to potential employees. Current
employees resist the change, because they believe, the new flexible work schedule
means they would be on call by their supervisors to work when they are needed the

46
most. Therefore, the current employees resist the new flexible work policy because
they misunderstand the policy tenets.
3. Personnel may also resist change because they assess the potential improvements of
the change differently from their supervisors. They see more costs involved with the
change, both individually and to the organization, than benefits. For example an
organizational executive gets a report that a business unit is producing a toxic waste
that is poisoning a nearby town and decides to shut down the department. The only
person informed about the toxic waste is the senior plant manager. The plant is going
to be shut down and the personnel will be retrained. However, the personnel resist the
change because they don’t see the benefit of not producing toxic waste.
4. Finally, personnel resist change simply because they have a low tolerance for change.
These personnel fear they do not have the new skill or behavior to adapt to the
proposed change.
Kotter and Schlesinger (1979) present five techniques to deal with the resistance
to change: (1) education and communication, (2) participation and involvement,
(3) facilitation and support, (4) negotiation and agreement, and (5) manipulation and co-
optation.
1. Use of education and communication is one of the most common ways of dealing
with the resistance to change. Simply communicating what the change is and how it
will really affect organizational personnel will make great strides in reducing the
resistance to change. This education can occur through many types of media, such as
one-on-one discussions, group presentations, emails, teleconferencing, memos, and
reports. The information presented in this dissertation is one way to reduce the

47
resistance to change. It will provide insight to how the change can improve
organizational process efficiencies.
2. Participation and involvement reduces the resistance to change by including those
who will or may resist the change in the design and implementation of the change.
Senior leadership listens to the personnel and takes into consideration their concerns
with the change.
3. Senior leaders can reduce the resistance to change by providing new skill training or
giving personnel incentives after demanding work sessions. This technique to reduce
the resistance to change is called facilitation and support.
4. Senior leaders can offer incentives to those that resist the change. This can be in the
manner of higher wages for personnel that accept the organizational process changes.
This technique is called negotiation and agreement.
5. As a last resort managers can turn to covert attempts to influence others to reduce the
resistance to change. These types of managers use selective information to keep
power over their personnel so their personnel do not know exactly what the change is
and how it will affect them. One form of manipulation is co-optation which occurs
when senior leaders offer a new position to those that resist ensuring they are on
board with the process changes.
2.1.6 Designing vs. Making
Process variation exists in both design and construction and it is important to recognize
the differences that exist between the two. Table 2-2 shows a few differences between
designing and making.

48
Designing Making Produces the recipe Prepares the meal Quality is realization of purpose Quality is conformance to requirements Variability of outcomes is desirable Variability of outcomes is not desirable Iteration can generate value Iteration generates waste
Table 2-2 Designing vs. Making (Ballard 1999)
1. A design is used to make an item; much like a recipe is followed to make a meal. A
design exists in the thought processes of individuals while the item exists in the
material world.
2. A design is judged against its fitness for use or how well it meets the purpose (Juran
and Gryna 1986). Quality of the item is judged by how well it meets the requirements
stated by the design, assuming the design meets necessary quality specifications
(Ballard 1999).
3. Having variation in design can be desirable, while in making it is not desirable. Hopp
and Spearman (2004) distinguish value added versus non-value added variation in
design.
4. Iteration in design can generate value for the customer. Such iteration or positive
rework in design has been compared to having a good conversation where the players
leave with a better understanding of what is required (Ballard 1999). Iteration in
making is considered waste because it does not generate value for the customer and
should be avoided.

49
2.1.7 Strategies to Reduce Negative Rework
The focus of the research presented in this dissertation is specifically on reducing
negative rework. Table 2-3 illustrates some strategies that can reduce negative rework in
design.
Restructure the design process • Use Design Structure Matrix (DSM) to resequence activities to
reduce interdependencies • Use pull scheduling while reducing batch sizes • Work to achieve greater concurrency
Reorganize the design process • Make cross-functional teams the organizational unit • Use team problem solving (e.g., call a meeting) • Share ranges of acceptable solutions
Change how the design process is managed • Pursue a least commitment strategy • Practice set-based design • Use the Last PlannerTM system of production control
Overdesign (design redundancy) when all else fails
Table 2-3 Strategies for Reducing Negative Rework (Ballard 1999)
The research presented in this dissertation focuses on restructuring and
reorganizing the design process. Specifically, (1) reducing the batch sizes of design
reviews, (2) increasing team problem solving techniques, and (3) implementing a
specialized design review team will be analyzed in the alternative review processes. A
sensitivity analysis on input parameters will be used to study the impact of these
techniques on organizational workflow.
2.1.8 Changes Timing
Change often leads to rework and negative rework is wasteful, by definition, if it can be
eliminated without loss of value or causing failure to complete the project (Ballard 2000).
Changes are identified as any variation from the original project scope (Ibbs 2005), they
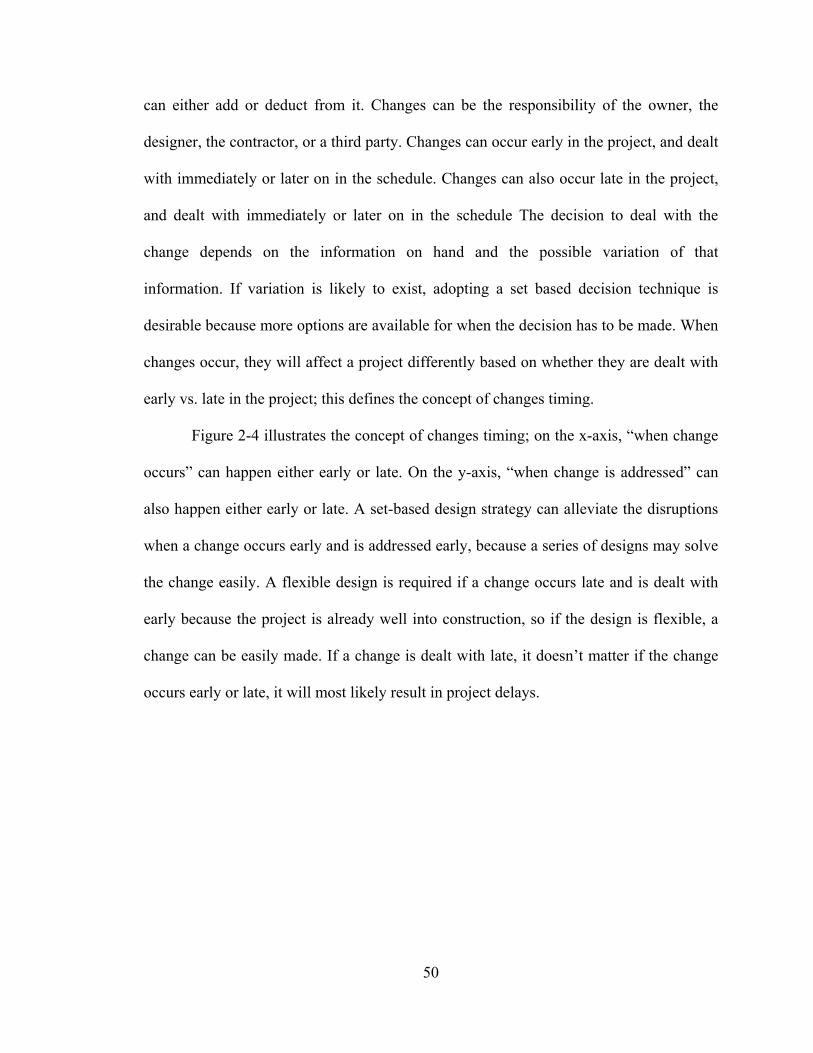
50
can either add or deduct from it. Changes can be the responsibility of the owner, the
designer, the contractor, or a third party. Changes can occur early in the project, and dealt
with immediately or later on in the schedule. Changes can also occur late in the project,
and dealt with immediately or later on in the schedule The decision to deal with the
change depends on the information on hand and the possible variation of that
information. If variation is likely to exist, adopting a set based decision technique is
desirable because more options are available for when the decision has to be made. When
changes occur, they will affect a project differently based on whether they are dealt with
early vs. late in the project; this defines the concept of changes timing.
Figure 2-4 illustrates the concept of changes timing; on the x-axis, “when change
occurs” can happen either early or late. On the y-axis, “when change is addressed” can
also happen either early or late. A set-based design strategy can alleviate the disruptions
when a change occurs early and is addressed early, because a series of designs may solve
the change easily. A flexible design is required if a change occurs late and is dealt with
early because the project is already well into construction, so if the design is flexible, a
change can be easily made. If a change is dealt with late, it doesn’t matter if the change
occurs early or late, it will most likely result in project delays.

51
Early Late
Ear
lyLa
te
When Change Occurs
Whe
n C
hang
e is
Add
ress
ed
Flexibility in Design
Set-Based Design
Project Delays Project Delays
Early Late
Ear
lyLa
te
When Change Occurs
Whe
n C
hang
e is
Add
ress
ed
Flexibility in Design
Set-Based Design
Project Delays Project Delays
Figure 2-4 Changes Timing
The impact of changes on project delivery has been studied in different ways.
Leonard et al. (1991) used 90 cases that resulted in owner/contractor disputes to quantify
the effect of change orders on labor efficiency. Change-order impacts were placed in
three categories: (1) minor, (2) medium, and (3) high. Ibbs and Allen’s (1995) CII report
presented data from 89 cases to research three hypotheses: (1) Changes that occur late in
a project are implemented less efficiently than those that occur early in a project. (2) The
more change exists on a project, the greater its negative impact on labor productivity.
(3) The hidden or unforeseeable costs of change increase with an increase in project
change. They could not statistically prove hypothesis 1 but determined four critical
variables (1) permanent material installed, (2) construction labor for change

52
implementation, (3) engineering labor for change implementation, and (4) total change
costs. They were able to statistically prove hypothesis 2 with a 10% confidence level. For
hypothesis 3, a ratio of hidden costs divided by the final control budget was developed.
Qualitatively, they found most project managers have no process to quantify indirect
impacts of change orders and doing so is nearly impossible when multiple change orders
are involved.
Hanna et al. (1999) looked at the loss of efficiency of labor productivity through
four independent variables and presented a model to estimate the loss of efficiency. Ibbs
(2005) studied the impact of changes on project productivity on early, normal, and late
timing situations. He found that late changes impact project productivity more than early
changes. Therefore, if changes are needed at all, early changes should be encouraged and
late changes discouraged. Isaac and Navon (2008) present a change control tool that
identified the implication of change. The tool notifies stakeholders if the proposed change
has the possibility of delaying the project. This allows the project management team time
to reduce the impact of the change.
Changes have a different impact depending on when they occur in a process. The
concept of making decisions at the last responsible moment (defined as “the moment at
which failing to make a decision eliminates an important alternative” (Poppendieck 2003,
Ballard 1999)) affects the impact of changes. Presumably, changes occurring before the
last responsible moment in design has been reached, will have less of a process impact
than those same changes occurring later. Using the last responsible moment allows
decision makers to carry more alternatives forward leaving more time to gather
information on each alternative, ultimately allowing for a better decision to be made. For

53
example, a mechanical contractor can carry multiple options for placement of large
chiller units in the basement until the final structural column design is finalized. Once
column locations are known, a decision on final chiller equipment type and location can
be finalized.
Therefore, it is important to drive out potential errors as early as possible. In the
case of healthcare facility design, ensuring no errors exist in the layout and fire, life, and
safety design is critical to avoid major negative rework later on in design and
construction. A way to avoid the embedding of errors is to conduct concurrent design and
government review which ensure all parties are in alignment on design decisions which
will ultimately reduce negative rework.
2.2 Motivational Theory
Motivation of the work force impacts labor productivity. Negative rework and when it
occurs not only impacts productivity but also affects motivation. Theories by Taylor,
Maslow, McGregor, Vroom, Porter, Lawler, and Ouchi among others describe human
factors that influence motivation and productivity (Gaspar 2006). However, research of
the construction industry has not taken the perspective of using these motivational
theories.
Many motivational theories have been developed throughout history starting with
Taylor’s scientific management, the Hawthorne studies, Maslow’s hierarchy of needs,
Herzberg’s hygiene theory, McGregor’s theory X and Y, Ouchi’s Theory Z and then the
more contemporary theories of expectancy, equity, and reinforcement.

54
Taylor’s scientific management (1911), focused on process improvement by
determining the best way to get the job completed. This theory assumed workers were
mainly motivated by money and they needed to be strictly managed by their
organizations (Gaspar 2006).
The Hawthorne studies conducted from 1925 to 1932 established that the work
environment was important to worker productivity. Paying attention to the worker was a
way to improve productivity (Landsberger 1958).
Maslow’s hierarchy of needs (1943) discusses the need of workers to work their
way up five different stages as shown in figure 2-4. Meeting the first three needs, namely
physiological, safety, and social needs, then allowed workers to seek higher needs and
eventually reaching self-actualization which means to seek out one’s full potential.

55
SelfActualization
Needs(drive to realize
one’s full potential)
Esteem Needs(performance-based awards and recognition)
Social Needs(membership in social and professional clubs or groups)
Safety Needs(health insurance, pension benefits, job security, and safe working conditions)
Physiological Needs(food, clothing, and shelter)
Figure 2-4 Maslow’s Hierarchy of Needs (Gaspar 2003)
Herzberg’s hygiene theory (1964) posited that job enrichment factors increase
motivation whereas hygiene factors de-motivate individuals. The job enrichment factors
are (1) achievement, (2) recognition, (3) responsibility, (4) freedom, and (5)
advancement. The hygiene factors are (1) work conditions, (2) policies, (3) administrative
efficiency, (4) style of supervision, and (5) relationship between employees (Halepota
2005).
McGregor (1967) presented two theories based on juxtaposed situations of human
behavior and then discussed which management practices would be efficient in each
situation. His theory X presupposes that human laborers are indolent, lack aspiration, and
avoid work whenever possible (Halepota 2005). In this situation, management must be
extremely strong to control the resources it has on hand. I think this management

56
technique is not functional because the assumptions on human behavior are incorrect. I
believe human laborers seek to accomplish quality work as long as it is convenient or
makes sense for them to do so.
In theory Y, workers are determined to be hardworking and self-driven which
requires a very different type of management style. This theory suggests poor
management and manager’s policies are the reason why workers do not perform (Gaspar
2006).
In the early 1960’s, Vroom developed expectancy theory which states that
individual motivation is tied to the individual’s perception regarding his or her capability
to perform the particular job, the reward associated with it, and the value the individual
places on these rewards. The theory puts forth three variables: (1) valence,
(2) instrumentality, and (3) expectancy. Valence refers to the attitude an individual has
towards rewards whether extrinsic (money, promotion, time off) or intrinsic (self-esteem,
fulfillment, satisfaction of a job well done). Instrumentality refers to an individual’s
perceptions as to whether or not they really get the desired reward. For example, an
individual may trust there will be a pay bonus upon completion of work because it was
given the last time for good performance. Expectancy refers to an individual’s
expectations of what is achievable and their level of confidence in completing that task.
For example, if a project is extremely difficult and unachievable, a person may not take
on the project even if the reward is desired because failure is likely (Vroom 1964). The
key idea is: the more attractive a reward is the stronger perception the individual will
place on it to succeed (Halepota 2005).

57
In the early 1980s, Ouchi developed a theory Z that looked at the different types
of firms prevalent in the United States and Japan. Type A firms of the United States
focused on short-term results, with employees focused on merely achieving greater
productivity rates. Type J firms of Japan focused on long-term results, by investing in
employees for lifetime employment, focusing on job rotation to allow people to respect
others’ work, practicing collective decision making, and having a concern for worker
welfare. In this theory, Ouchi proposed that firms adopt a little from each of these two
firm types in order to evolve a firm that advocates lifetime employment, more specialized
career path, and collective decision making allowing all people within the company to
participate in managing the company (Gaspar 2006).
An example is the Wallace Company, which won the Baldridge National Quality
Award in 1990. The Wallace Company, an industrial distribution company, was known
to empower their employees and trained them to improve the quality of each of their
processes. They made it known the reward could possibly be the Baldridge award which
the workers held in high regard, and which in turn kept them motivated to continue
working hard (Braddock et al. 1993). The organization that is the focus of the research
presented in this dissertation is also applying for the Baldridge Award; many of their
employees are motivated to institute organizational process change to improve the quality
of their permitting review and reduce cycle time.
Motivation has been classified into two categories, (1) intrinsic and (2) extrinsic.
Intrinsic motivation is driven by an employee’s belief that the work itself is interesting,
engaging, and satisfying. Extrinsic motivation is driven by financial rewards and formal
or informal recognition. Much research has been conducted in the area of intrinsic
58
motivation in an attempt to explain behavior such as exploration and seeking the hardest
challenges (Berlyne 1971; Harlow et al. 1950; Hunt 1965; Montgomery 1954; White
1959). Theory has been proposed, stating that self determination and competence are
trademarks of intrinsic motivation (Deci and Ryan 1985). These two types of motivation
have led to research documenting striking differences in task performance between
intrinsically and extrinsically motivated individuals (Amabile et al. 1994).
Simon presented a theory on administrative behavior in 1946. His theory explores
how organizations make decisions. Decisions should be correct, efficient, and
implementable. Decisions are deemed correct given a specific objective; however, a
change in objective implies a change in evaluation of whether the decision is correct or
not (Simon 1976). Simon proposes that administrative personnel making decisions in
pursuit of self-interests are aware of only some of the possible alternatives, and are
willing to settle for an adequate solution rather than an optimal solution. Simon coined
this action as “satisficing.” In conjunction with his theory on “bounded rationality” which
states that people can not know all the information around a decision and therefore, are
bounded in some way when decisions are made. He believed humans do not have the
mental ability to maximize solutions because we cannot evaluate all outcomes with
sufficient precision.
Following are some examples that illustrate “satisficing.” One example is the
simple task of sewing a button onto a shirt. Let us suppose the best needle to use in this
situation is two inches long with a 4 mm eye. This needle is hidden in a box with a 100
other needles varying in size. In “satisficing,” the first needle that can sew the button onto

59
the shirt is the one that should be used. Spending the extra effort to search for the optimal
needle is a waste of energy.
Another example of “satisficing” occurs when you enter a convenience store
looking for a Red Bull energy drink. After searching the entire store, you are unable to
find it and eventually decide to buy a Gatorade. You are satisfied with this choice
because searching any further is again a waste of time and energy.
A final example of “satisficing” occurs in consensus building when a group of
individuals looks to a solution that everyone can live with. For example, a healthcare
facility owner team is trying to determine what the budget for a new healthcare facility
should be. The team spends hours determining what the revenues will be from different
services provided. Eventually, the team reaches an agreement on the budget for the
healthcare facility but one person questions if one of the revenue streams is correct.
When the group becomes upset with this question they decide to keep the number, not
because the person was wrong in raising the point, but rather, they have converged on an
acceptable solution and decided it is good enough.
The research presented in this dissertation uses administrative behavior as a
foundation of how decisions are made within organizations. Decisions made during the
design of a healthcare facility are made in a “satisficing” manner. This occurs because of
project constraints such as cost, location, materials, equipment, and other design
disciplines. Therefore, design engineers may make concessions on optimal designs
because of these project constraints. However, in many situations this satisficing is done
without all the necessary players involved in the decision. For example, in many
healthcare facility designs, the layout, exiting, fire, life, and safety layout are completed

60
by the owner, architect and structural engineer without consulting the government
reviewers. Then, as the design proceeds ahead, while the previous decisions were
“satisficed,” they do not meet code requirements and therefore must be reworked. This is
negative rework and should be eliminated.
2.3 Quality
The work of Shewhart, Deming, Juran, and the Training within Industry effort have been
extensively researched and applied to manufacturing processes (Gaspar 2006, Dinero
2005). This work led to the development of the Toyota Production System which has
become an icon for manufacturing processes.
2.3.1 History of the Quality Movement
The quality movement to improve production capability began in the early 1900s through
the work of Shewhart and continued through Deming and Juran. Shewhart is known as
the “father of statistical controls” and was the originator of the Plan, Do, Check, Act
(PDCA) continuous improvement cycle. This cycle was renamed to Plan, Do, Study, Act
(PDSA) and has created many other continuous improvement cycles like Observe,
Orient, Decide, Act (OODA) and Define, Measure, Analyze, Improve, Control (DMAIC)
which is the basis for Six Sigma. Many organizations have adopted the OODA cycle,
especially the military which has incorporated it into military tactics. A former Chief of
the Staff of the Air Force, General Moseley mentioned that air power and reconnaissance
capabilities allow the US military to get inside an enemy’s OODA loop, allowing the US
military to shape the battlefield through improved decision analysis.

61
2.3.2 Deming’s Fourteen Points
Deming taught the Japanese project management techniques after World War II (between
1950 and 1965) which allowed them to become a major manufacturing powerhouse in the
global economy. His 14 points focuses on long-term improvement for all organizations.
They are necessary for an organization to survive and should be presented to the entire
organization. Deming’s 14 points are (Deming 1982):
1. “Create constancy of purpose towards improvement.” Replace short-term reaction
with long-term planning.
2. “Adopt the new philosophy.” The implication is that management should adopt his
philosophy, not only the workforce.
3. “Cease dependence on inspection to achieve quality.” If variation is reduced,
inspection of manufactured items for defects is not needed, because there won’t be
any defects.
4. “Move towards a single supplier for any one item.” The use of multiple suppliers
leads to variation of delivered supplies.
5. “Improve constantly and forever.” Constantly strive to reduce variation.
6. “Institute training on the job.” If people are inadequately trained, they will not all
work the same way, and this will introduce variation.
7. “Institute leadership.” The aim of supervision should be to help people and machines
and gadgets do a better job.
8. “Drive out fear.” Deming sees management by fear as counter-productive in the long
term, because it prevents workers from acting in the organization’s best interests.

62
9. “Break down barriers between departments.” Another idea central to Total Quality
Management (TQM) is the concept of the ‘internal customer’, each department serves
not the management, but the other departments that use its outputs.
10. “Eliminate slogans, exhortations, and targets for the work force asking for zero
defects and new levels of productivity.”
11. “Eliminate management by objectives.” Deming saw production targets as
encouraging the delivery of poor-quality goods.
12. “Remove barriers to pride of workmanship.” Many of the other problems outlined
reduce worker satisfaction.
13. “Institute education and self-improvement.”
14. “The transformation is everyone’s job.”
Deming’s third point of ceasing the dependence on inspection to achieve quality
is a major tenet in this dissertation. As I illustrate in chapter 6, in many instances the
regulatory agency’s reviews are viewed as an inspection process thatcauses many delays
in the permitting process. Implementing a new process where inspection is less relied on,
while still producing quality drawings, is a major point of this work.
2.3.3 Pareto Principle
Juran is known for his focus of training top- and middle managers on the idea of quality
management; it was imperative to get leadership to “buy-in” to continuous improvement.
He also explored the Pareto principle and its application to management requirements.
The Pareto principle refers to “80 percent of the problems arises from 20 percent of the
defects,” but this principle has wider applications ranging from the science of

63
management to the physical world. An example is 20 percent of your stock will take up
80 percent of your warehouse, and 20 percent of your workforce will provide 80 percent
of the production. In addition to many of his research interests, Juran explored concurrent
engineering, which is a concept where all those involved with design have access to
information and the ability to influence the final design in order to identify and prevent
future problems (Gryna et al. 2007).
The Pareto Principle is at work within the regulatory agency studied in this
dissertation. The review of the largest drawing sets represents a small portion of the
incoming work, however, the majority of the agency resources are dedicated to these
projects. The majority of work that the agency receives is not a focus of the large
healthcare owners or state politicians.
2.4 Lean Production
Lean production provides a common structure in which people can discuss ways to
analyze, design and control production processes. Koskela et al. (2003) presents three
general actions for lean production theory:
1. Design the production system.
2. Control the production system in order to realize the production intended.
3. Improve the production system.
The goals of all production systems are to (1) produce products, (2) reduce costs,
time, and materials for the production system, and (3) deliver customer needs based on
quality, reliability and flexibility. Therefore, the knowledge and application of this theory
should allow practitioners to improve their production capabilities.

64
2.4.1 Three Viewpoints of Production Theory
Production theory has been studied from three different views. The first, the
transformation view of production, dominated production theory in the twentieth century.
Developed and unchallenged in economics, the transformation view focuses on
production as a transformation of inputs to outputs. This viewpoint suggests breaking
down the entire process into smaller pieces and then optimizing each step independently
of each other step (Porter 1985, Wortmann 1992). The transformation view has two
flaws: (1) it does not address other issues inherent in production other than
transformation and (2) it does not address customer needs in the transformation when the
value of a product must conform to customer requirements (Koskela et al. 2002).
The second, the flow view, strives to eliminate waste from the flow of processes
(Gilbreth and Gilbreth 1922). This flow view is central to Lean production, a term
developed by John Krafcik in describing the Toyota manufacturing processes (Womack
et al. 1990). The flow view uses principles of lead time reduction, variability reduction,
and simplification (Koskela et al. 2002). This flow view was adopted by the Japanese for
production in the 1940’s and has been used in automobile manufacturing by Toyota.
The third, the value view, seeks to maximize the best possible value from the
customer’s point of view (Shewhart 1931). This theory has been used extensively in the
quality movement which uses requirement analysis and systemized flow-down of
requirements (Koskela et al. 2002).
Koskela (1992, 2000) recognized that these three views were complementary to
each other, yet cause problems in production when one tries to adopt all three at the same
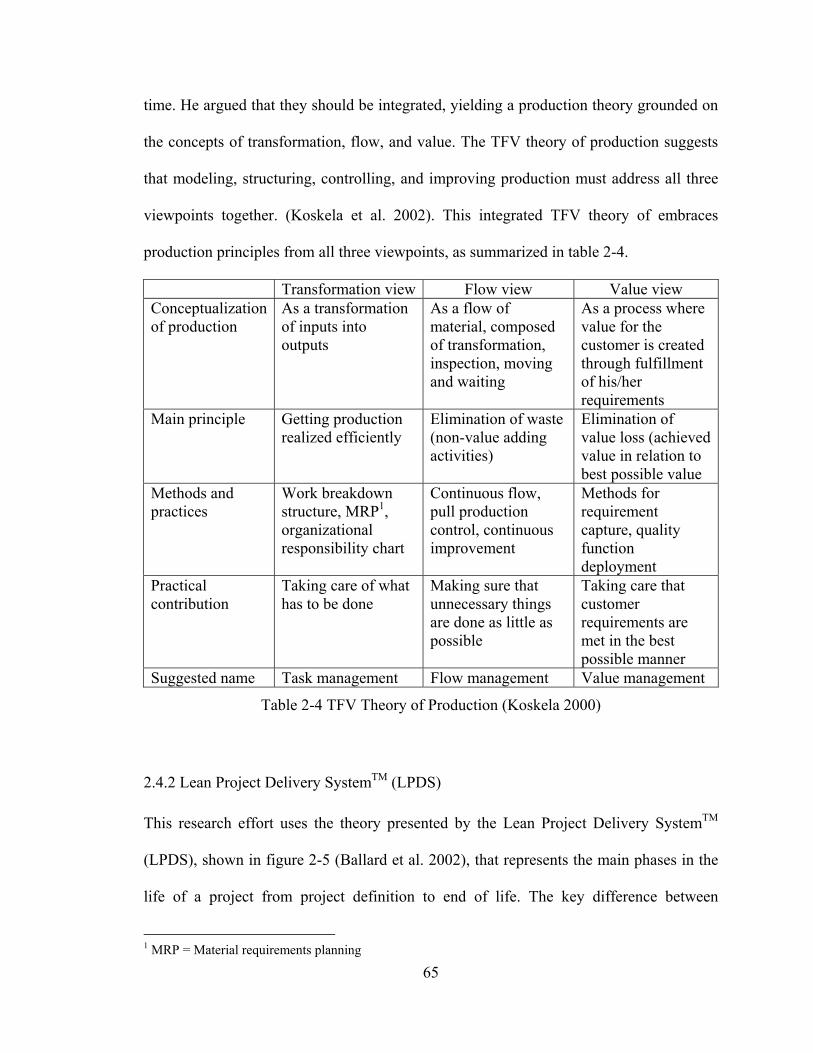
65
time. He argued that they should be integrated, yielding a production theory grounded on
the concepts of transformation, flow, and value. The TFV theory of production suggests
that modeling, structuring, controlling, and improving production must address all three
viewpoints together. (Koskela et al. 2002). This integrated TFV theory of embraces
production principles from all three viewpoints, as summarized in table 2-4.
Transformation view Flow view Value view Conceptualization of production
As a transformation of inputs into outputs
As a flow of material, composed of transformation, inspection, moving and waiting
As a process where value for the customer is created through fulfillment of his/her requirements
Main principle Getting production realized efficiently
Elimination of waste (non-value adding activities)
Elimination of value loss (achieved value in relation to best possible value
Methods and practices
Work breakdown structure, MRP1, organizational responsibility chart
Continuous flow, pull production control, continuous improvement
Methods for requirement capture, quality function deployment
Practical contribution
Taking care of what has to be done
Making sure that unnecessary things are done as little as possible
Taking care that customer requirements are met in the best possible manner
Suggested name Task management Flow management Value management
Table 2-4 TFV Theory of Production (Koskela 2000)
2.4.2 Lean Project Delivery SystemTM (LPDS)
This research effort uses the theory presented by the Lean Project Delivery SystemTM
(LPDS), shown in figure 2-5 (Ballard et al. 2002), that represents the main phases in the
life of a project from project definition to end of life. The key difference between
1 MRP = Material requirements planning

66
traditional project delivery and the LPDSTM is the relationship between each of the
phases and the participants in each phase.
Purposes
DesignCriteria
DesignConcepts
ProcessDesign
ProductDesign
DetailedEngineering
Fabrication& Logistics
Installation
Commissioning
Operations & Maintenance
Alteration &Alteration &DecommissioningDecommissioning
Project Definition
Lean Design Lean Supply Lean Assembly Use
Production ControlWork Structuring
LearningLoops
Figure 2-5 Lean Project Delivery SystemTM (Ballard et al. 2002)
In LPDS, representatives from each of the phases are involved in the decision
making process, including members from the production team that designs and builds the
facility. Following the concept in line with the LPDS’s incorporating product and process
together and deferring decisions to the last responsible moment in theory reduces the
amount of rework experienced by members of the production system. A fundamental in
LPDS is the use of work structuring that integrates product and process together. This
concept understands how the actual product will be used in the production phase and
ensures that the two complement each other.
The Lean Project Delivery SystemTM uses some terms not used in traditional
project management. The first concept is takt time. Takt is a German word for rhythm or

67
meter. Takt is the rate of downstream demand (Liker 2004). In Lean manufacturing, takt
refers to the rate at which the customer is buying the product, i.e. the “pull” of the
customer. In production system design takt is used to set the pace of production and
inform workers whenever they are getting ahead or behind and all effort is aimed at
completing work within the takt time allowed for it. In construction, each phase of work
is given a certain amount of time to complete a task with little thought given to how the
work is to be handed off to the subsequent downstream player. In construction, large
batches of work are released to the following trade. For example, an entire floor or
section will be turned over to the finishing crews once the concrete, mechanical,
electrical and wall systems are completed.
The second concept is zero defects. In many construction scenarios, zero defects
deals with the project at the turnover to the owner or client. Most construction companies
are going through punch list items prior to turning the project over as completed. This
differs with the concept of zero defects in the LPDS. Lean Project Delivery Systems
strive to determine defects as close to when they occurred and then follow through with a
root cause analysis to determine what real issue must be addressed and correct
immediately.
The LPDS concept of zero defects is used in this dissertation research.
Implementation of alternative regulatory agency processes aim to eliminate the error as
close to the point of occurrence as possible to ensure after the fact punch list items are
avoided.

68
2.4.3 Types of Waste
Lean defines eight major types of non-value adding wastes in business or manufacturing
processes (Ohno 1998, Liker 2004).
1. Overproduction - Producing items with no associated orders leads to overstaffing,
storage, transportation because of excess inventory.
2. Waiting - Waste occurs when employees are used to watch automated systems or wait
on the next processing step.
3. Unnecessary transportation - Carrying work in progress (WIP) long distances, which
creates inefficient transportation or moving items into and out of storage.
4. Overprocessing or incorrect processing - Taking unneeded steps to process the parts.
When installation is an afterthought to the design of the product field corrections are
developed to deal with design issues.
5. Excess inventory - Excess raw material, or finished goods that require transportation
and storage costs. Also inventory can get damaged or become obsolete as it sits and
waits. In addition, excess inventory hides late deliveries from suppliers, defects,
equipment downtime, and long setup times.
6. Unnecessary movement - Wasted motions by the employee whether it is excessive
walking or unnecessary reaching for or looking for tools or parts.
7. Defects - Production of defects results in rework, scrap, and replacement production.
8. Unused employee creativity - Losing time, ideas, skills, improvements by not
engaging or listening to your employees.

69
Additional waste items have been identified, such as “making do” - a situation
where a task is started without all its inputs, or the execution of a task is continued
although the availability of at least one input has ceased. (Koskela 2004)
All of these wastes are part of the processes studied in this dissertation. The
presence of defects, especially in the development of design drawings leads to rework
that ultimately leads to delays in the process.
2.4.4 Working Harder vs. Working Smarter
A systems dynamic model is shown in figure 2-6 that describes the phenomena of
working harder vs. working smarter and its impact on process capability. Capability is an
investment in resources that create a stockpile to draw from and it degrades over time
(i.e., machines wear out, people change jobs). Management increases desired
performance over actual performance, thereby creating a performance gap.

70
Figure 2-6 Balancing Loop (Repenning and Sterman 2001)
Managers have two ways to deal with this performance gap: (1) work harder,
cycle B1, where the manager increases pressure to do work and allocates more time to
working which in turn increases actual performance or (2) work smarter, cycle B2, where
the manager puts pressure to increase capability and time spent to improve which
increases the capability stockpile and actual performance. However, it is important to
note the delay in cycle B2 to increase actual performance: where this delay may be quite
extensive, managers invest in working harder to get immediate results (Repenning and
Sterman 2001).
Repenning and Sterman (2001) conducted simulations using the systems dynamic
model in figure 2-6 and produced the system responses in figure 2-7.

71
Figure 2-7 Simulation of Working Harder and Working Smarter (Repenning and Sterman
2001)
System performance is based on effort and capability. The first column in figure
2-7, working harder, shows initial performance increases as more time is spent on
working and less time on improving capability. However, over time, performance
declines as process capability declines. The second column, working smarter, shows an
initial dip in performance as more time is developing capability than spent working.
However, over time, performance increases as the process capability increases
(Repenning and Sterman 2001).

72
The effect of working harder occurs in the case studies presented in this
dissertation. In these situations, organizational personnel must put more effort to get
similar results. In turn, due to working harder, the personnel do not have time to improve
the system process.
2.4.5 Built-in Quality
Built-in quality is a concept derived from the works of Shewhart, Deming, and Juran and
is embedded in the manufacturing of vehicles for some of the leading car companies,
specifically Toyota Motor Company. The idea of built-in quality is to identify defects as
close to the point of origin and design processes that are robust enough to detect during
production. The idea of this research is to use the concept of built in quality and standard
work to avoid rework.
In the Toyota Production System each member on the manufacturing line has the
ability and duty to stop the line if a defect is detected, this is pulling the “Andon” cord
(Liker 2004). When pulling the Andon cord, the entire production system will come to a
halt if the error can not be corrected within the takt time. When the defect is corrected,
the line is again permitted to proceed, however, the root cause of the defect is sought out
and corrected immediately.
Another system of built-in quality exists within in the software programming
community and it is called Pair Programming. In Pair Programming, software
development is taken on by two team members. The team works on only one computer,
with one keyboard, where one team member is producing the code, while the other team
member is constantly reviewing the work for quality issues. This process has shown to

73
increase quality in the programming design phase and reduces the need for after the fact
quality assurance and quality control measures (Winkler and Biffl 2006).
Standard work and control methods for training instruction have been explored to
determine its ability to improve production processes (Liker and Meier 2007, Dinero
2005, Mann 2005). They suggest that implementation of these techniques allow and can
ensure that quality, cost, and schedule are maintained. Those authors believe that the
elements of standard work are at the heart of the quality initiative.
Mistake proofing is an integral concept to lean production. Mistake-proofing is
the use of process or design features to prevent errors or the negative impact of errors. It
is known in Japanese as poka-yoke, which means to avoid inadvertent errors. Mistake-
proofing was formalized into the Toyota Production System by Shigeo Shingo (Grout
2007).
The concept of built-in quality is used in developing a new review process for the
regulatory agency to decrease rework. Currently, the agency experiences high rates of
rework as discussed in chapter 6.
2.4.6 Lean Perspective of Standard Work
Standard work procedures are prevalent in many organizations; however the following
quote describes how typical standard work and training occurs in many companies. It is
important to note that standard work procedures are not only for the worker but for the
supervisor to determine if the work is being done in a prescribed format.

74
“Every large company has some type of training program in a large variety of
area…Yet, go where the actual work is being done and ask people how they learned their
jobs and you get a different picture (Liker and Meier 2007).”
This quote describes a situation common to the construction industry, where many
people are considered well trained but learn how to build projects without a prescribed
method. Typically, each company will have a prescribed way of performing a process,
however, these processes are hardly ever an industry standard. Construction projects are
known to be custom and different project to project, however, many construction
processes are repeated again and again.
One example is batter board installation, which occurs at every construction
project. Batter boards frame the extent of a project and is one of the first tasks completed
once the site is properly graded. Having a standard work procedure to install batter
boards can facilitate and improve construction efficiency. An example of standard work
occurs within the Toyota Production System, where the standard work procedures are
written on a board that faces away from the workers. The workers know their process, the
boards are used by the supervisors to monitor if work is being done by the prescribed
format or if workers are deviating from the standard. If the latter, the supervisor must ask
why they are deviating. This analysis can lead to better performing procedures which can
be documented, disseminated, and repeated. This creates a continuous learning cycle.
Standard work is a foundation to Lean production. The Toyota human
development system is a continuous improvement system (figure 2-8). The system has
two supporting processes (1) organizational and (2) people. The two support systems
each have four parts. Organizational supporting processes are (1) stable employment

75
manpower-management, (2) fair and consistent human relations, (3) recognition and
corrective, and (4) hoshin kanri policy deployment. People supporting processes of
servant leadership are (1) teamwork, (2) clean and safe workplace, (3) two-way
communication and, (4) Toyota way leadership.
INPUTSPhilosophy,
Values, Production
System Principles, ID
Key Competencies, Eligible Human
Resources
- Recruitment- Selection
- Initial Orientation
- Train/Coach- On the Job
- Development Roles
- Follow Standards- Improve Standards
- Problem Solving- ID with Team
- Sharing, Success- Career Development
- Community/Family Focus- ID with Company
OUTPUTSCulture of Quality: People
Producing High-
Quality, Low-cost, & On-time Products
PURPOSECompetitive Advantage &
Long-term Mutual
Prosperity
Fair and Consistent HR Policies and
PracticesStable Employment Manpower-Management
Recognition and Corrective Action
Hoshin Kanri Policy Deployment
Clean and Safe Workplace
TeamworkTwo-way
Communication
Toyota Way Leadership
Organizational Supporting Processes
People Supporting Processes Servant Leadership
Attract Develop Engage Enroll Practice
Trainable Able Improving Committed
Quality People Value
Stream
Trust & Continuous Improvement via Plan-Do-Check-Act
PDCA
Figure 2-8 Toyota’s Human System Model (Figure 2-3 in Liker and Hoseus 2008)
The goal of the human system is to obtain a competitive advantage and long-term
mutual prosperity. The human value stream contains five steps: (1) attract, (2) develop,
(3) engage, (4) enroll, and (5) practice. In the development phase, training and coaching
are primary tasks. In the engagement phase, the standards trained in the development
phase are implemented. In the enrollment phase, sharing of what works and does not
work from the standards are passed on in the organization. In the practice phase, the
standard is implemented and a continuous improvement procedure is followed. Standard
work provides a process with less variation which then allows managers to make changes

76
with a baseline in mind. Knowing the baseline process is imperative to understand the
impact of process changes.
To develop standard work, it is important to first understand and classify what
characteristics are associated with the process in question. A framework for classifying
work is presented in figure 2-9.
Hig
hLo
w
Task
ana
lyza
bilit
y
Figure 2-9 Classifying Types of Work (modified Figure 1 in Perrow 1967)
On the x-axis is task variety ranging left to right from low to high. The y-axis is
task analyzability ranging bottom to top from high to low. The lower left quadrant
represents routine work which has low task variety and high task analyzability. Routine

77
work is done for example by assembly line workers, fast-food servers, bank tellers and
data entry clerks as shown in table 2-5.
Type of work Example jobs What can be standardized
Accumulated know-how
requirements Routine (low variety, high analyzability)
Assembly line work, fast food server, bank teller, data entry clerk
Work elements, sequence, timing, fundamental skills, product specifications, workplace layout tools
Recognition of problems, problem response, problem solving
Technician (high variety, high analyzability)
Inspection, material handling, lab data analyst, computer technical support work, equipment maintenance
Generic procedures, core processes, fundamental skills, product specifications, workplace layout tools
Troubleshooting ability, intuitive problem solving, mental map of problem situations
Craft (low variety, low analyzability)
Group leader, nurse, buyer, some engineering jobs
Generic procedures, fundamental skills, product guidelines, workplace layout tools
Intuitive problem solving, reading situations
Nonroutine (high variety, low analyzability)
Program manager, R&D scientist, development engineer, surgeon
Generic procedures, fundamental skills, product criteria, workplace layout tools
Creative-innovative ability, intuitive problem solving, reading situations
Table 2-5 People Development Requirements for Different Types of Jobs (Table 5-1 in
Liker and Meier 2007)
The lower right quadrant represents technician work which has a high task variety
and high task analyzability. Examples of technician work are inspections, material
handling, lab data analysis, computer technical support work, and equipment
maintenance (table 2-5). The upper left quadrant represents craft work which has a low
task variety, and low task analyzability. The upper right quadrant represents nonroutine
work which is high variety, low analyzability. This research places design and

78
construction within the technician and craft work from lower right to upper left. An
example of technician work is brazing copper pipe. This process has high standardization
because all copper pipes have the same properties and a proven way to connect copper
pipe so it does not leak exists. An example of craft work would be architectural sheet
metal for an asymmetric building façade. The requirement for each piece to be
individually measured and custom produced requiring much of the workers to have a
deep understanding of how the metal and façade interact.
A relationship exists between standardized work and training (figure 2-10). Lean
production puts standardized work first then transfers knowledge using the four-step Job
Instruction method. The four steps are: (1) prepare the worker, (2) present the operation,
(3) try out performance, and (4) follow-up. Standardized work is analyzed to eliminate
waste and develop a best method. This becomes a baseline for continuous improvement
that is accomplished through task redesign. The best method is transferred to the Job
Instruction training program and is taught to employees resulting in consistent
performance, results and provides the ability to measure deviation from the best method.
The Job Instruction training program includes other skills required by the job and
incorporates it in the transfer of knowledge. The Job Instruction method requires that
work elements and key points be identified for proper training and this is a continuous
cycle with best methods. This cycle resembles a PDCA loop or continuous improvement
cycle, which is a common theme in lean production theory.

79
Standardized work
Analysis tool
Eliminate waste
Best method
Job Instruction Training
Teaching
Skilled employees
Consistent performance and
results
Work elements and key points
Other knowledge required for job
Baseline for continuous
improvement
Task redesign
Figure 2-10 Relationship of Standardized Work to Job Instruction (Figure 6-1 in Liker
and Meier 2007)
In understanding standard work, all processes have three types of tasks:
(1) routine core, (2) nonroutine core, and (3) ancillary. Routine core tasks should be
annotated on the job breakdown worksheet. Nonroutine core and ancillary tasks are
necessary to support the overall work but can have multiple ways of completion (Liker
and Meier 2007). Ancillary tasks are more random in nature and take place on an as-
needed basis.

80
Standardizing work does not mean making all tasks highly repetitive; rather the
intent is to define the best process and to reduce variation in the work process as much as
possible (Liker and Meier 2007). Repeatability is not as important for nonroutine work as
it is for routine work. Focusing on the entire system is a requirement to ensure that local
optimization does not occur.
To avoid overanalyzing a system, tasks should be classified according to table 2-6.
Percentage of steps in the work
process
Importance Effect on work
15 - 20% Critical - work must be highly consistent
Definite effect on results if performed out of range
60% Important - work must be consistent within a slightly wider range
Probable effect on results if performed out of range
20% Low importance - work method may be variable
Not likely to effect results regardless of method
Table 2-6 Breakdown of Work Tasks by Importance (Table 7-3 in Liker and Meier 2007)
Critical work steps are by definition vital to the product and must be performed
with a high level of quality and consistency. If the critical steps are not performed well,
rework may occur. Liker and Meier (2007) say critical steps make up between 15 and
20% of the entire work. The bulk of work falls under important. Important work has a
wider tolerance for acceptance but must maintain a high level of consistency to ensure the
final product is not defective. Low important work can be accomplished in a variety of
ways and will not affect the results of the final product. The key is to (1) identify the
critical steps, (2) define a best standard method, and (3) then train all personnel to that
method (Liker and Meier 2007). Management should focus on the critical steps and stress
that the standard work procedures be followed. Lesser important tasks should operate
within a larger defined range as long as the variation does not negatively affect the
quality of the product.

81
Identifying key points to a process and reasons why they exist is a major step in
developing standardized work procedures. The key points should be stated in positive
“how to” language rather than in negative voice. Liker and Meier (2007) identify five
types of key points exist (1) safety, (2) quality, (3) productivity, (4) special technique,
and (5) cost control. Table 2-7 describes each category.
Category Description Safety Primarily related to injury avoidance or repetitive stress injuries Quality Provide specific instructions on how to perform a step without
making mistakes that cause defects Productivity Techniques to ensure process is performed within the correct
amount of time Special technique
Aspects of a job that require special finesse
Cost control Methods that are necessary to maintain the standard cost of products
Table 2-7 Types of Key Points (modified from Liker and Meier 2007)
From my point of view, the construction industry lacks standard work. Too often
in the construction industry, processes are recreated each time a new project starts. One
reason for this is that the team that manages and constructs each project is different.
Management teams are different and all personnel must determine how they will work
with each other, creating an ad-hoc process to accomplish communication. Then, when
the project is complete, and a new one starts up, a new process is created. This creates
rework.
2.4.7 Computer Simulation of Lean Concepts
Lean techniques have been explored through several different simulations. Tommelein
(1998) explored pull-driven scheduling by modeling materials management of pipe
spools for process plant construction. She developed three models to illustrate the

82
improvement that pull-driven scheduling can accomplish. The first model explores the
process under no coordination, the second model explores the process through perfect
coordination, and the third model utilizes real-time feedback to the fabricator so pipe
spool delivery can be re-sequenced. By implementing pull-driven scheduling, buffers and
inventory can be reduced while improving project timelines.
Modeling organizations with an ability to determine how organization was
accomplished through the virtual design team (VDT). VDT is a multiple set of computer
models that began in the early 1980’s. This software extends Galbraith’s (1977)
qualitative concept of first order determinants impact on organizational success. The first
order determinants are direct work, coordinated work, and institutional work. This
research program views these three types of work as quantities of information to be
processed by workers and managers in the organization. VDT analyzes how activity
interdependencies raise coordination needs and how organization design and
communication tools change team coordination capacity and project performance (Levitt
2002).
Halpin and Kueckmann (2002) explored lean construction through computer
simulation. They describe the challenges to implementing lean construction techniques
but offer simulation as a tool to accomplish a form of validation. They discuss the trend
of making the product servant to the process because cost and quality improve. While in
the construction industry, the process is servant to the product where the focus is on the
end product and from there, the methods or processes to achieve the end state are
generated (Halpin and Kueckmann 2002).

83
Deleris and Erhun (2005) used simulation to analyze risk management of a supply
network for a Silicon Valley high-tech firm. The company questioned the adequacy of
their supply network that was developed through partnerships and their geographical
location. The goal of the research is to determine the robustness of the company’s supply
chain, not an optimal solution of the supply chain. They define robustness as the ability
for the system to stabilize under a variety of disrupting events. A supply chain in this
research is a set of sites connected through a network. This network is made up of
suppliers, assembly/subassembly facilities or distribution centers. The simulation was
used in two ways: (1) A loss evaluation tool for what-if scenarios for strategic discussion
and (2) the basis for a risk assessment of the network based on Monte Carlo simulations.
To evaluate robustness of the supply network Deleris and Erhun evaluated four
scenarios: (1) possibility of employee strikes, (2) shortage of components, (3) severe
political instability in various regions, and (4) disruptions caused by hurricanes. The
simulations were run using ad-hoc estimators for the likelihood of each of these
scenarios. However, the research recommends a sensitivity analysis be conducted to
understand the impact of each of the scenarios on the robustness of the company’s supply
network.
Agbulos et al. (2006) explored lean concepts and used computer simulation
analysis to improve efficiency of drainage operations maintenance crews. They
concentrated on six types of maintenance crews: (1) cleaning mains by low pressure
flushing (LPF), (2) cleaning mains by high pressure flushing, (3) scheduled mechanical
cleaning of catch basins (CBC), (4) inspecting mains by televising, (5) commercial
establishment investigation, and (6) service-line rodding and televising. This research

84
describes the application of an industrial engineering philosophy of work measurement,
lean production theory, and simulation to capture current work methods, generate and test
alternative methods, and develop new productivity standards for drainage maintenance
operations crews (Agbulos et al 2006).
Each step of the work was determined using a work breakdown structure. They
observed and recorded each the average time for each step. Agbulos et al. then labeled
each step as value added or non-value added. They determined 63% of the processes
were non-value added. They suggested two improvements: (1) eliminate initial surface
inspection and (2) include parallel inspection of manholes during the flushing activity.
The process was re-designed and a simulation model estimated 16% productivity
improvement. When the re-designed process was applied to the real system a 10%
increase in productivity was realized (Agbulos et al. 2006). This research reinforces that
simulation can be used to predict improvements of a re-design process.
Yu et al. (2007) researched a hybrid approach that combines process flowcharting
and simulation to analyze and improve production processes of prefabricators. They
focused on factory-built structural components for house construction that large volume
builder’s use. Their research methodology includes seven steps: (1) Collect the
information needed for process flowcharting, (2) create process flowcharts, in
collaboration with the prefabrication plant manager, (3) gather operation data, (4) build a
simulation model based on process flowchart and operation data analysis, (5) identify
opportunities for process improvement, (6) create a new process flowchart depicting the
improved processes, and (7) simulate the new processes to predict improved productivity

85
(Yu et al 2007). The research illustrates the use of computer simulation as an effective
tool to plan process improvements.
The process to deliver factory-built structural components in their research is a
make-to-order process. Structural components are fabricated only when site managers
make a request for an item. In lean production, this technique is called pull, where an
item is pulled into manufacturing by the downstream player. The use of pull reduces the
amount of inventory that is required to be on hand but increases the lead time from order
to delivery. The computer simulation showed a 6.5 day lead time from ordering to
erection and was validated through observational data.
The utilization rate of the manufacturing facilities was calculated to be 35% and a
value added ratio of 67%. Yu et al. (2007) determined that several factors were the cause
of low utilization and value added ratio. These factors include absenteeism of key
employees, low work efficiency, materials not available when needed, improper
manufacturing schedule, low morale, no job design or clear definition for each work
position and poor facility layout.
Yu et al. developed five process suggestions: (1) change the structure of the
workforce, clarify the job definition and reorganize into self-managed teams, (2) train a
specialized work force to increase efficiency, (3) change the process from make-to-order
to make-to-schedule and establish a production schedule to allocate resources and
develop a weekly work plan for each job assignment, (4) redesign the facility layout to
reduce material movement, (5) build lasting partnerships with suppliers and share the
benefits of just-in-time supply. These five suggestions are complementary to the
philosophy of lean production, specifically suggestions 3, 4 and 5. It is imperative that

86
production processes look to a weekly work plan to determine the reliable work planning.
As mentioned in the pipe spool model by Tommelein (1998) seeking the use of standard
products improves process efficiency which can also be applied to this situation.
Yu et al created three simulations using the following scenarios. (1) The house
components are fabricated following the improved process. (2) Job time of each task,
except transportation is improved by 20% due to management improvement suggestions.
(3) The improved production process has operated for one year, and the job time of each
task decreases following a standard learning curve outlined by Steward et al. (1995).
The results of the scenarios reduced the lead time to 6.5 days. The first scenario
reduced the lead time to 5.0 days. The second scenario reduced the lead time to 3 days
which matched the cost breakeven point for the production plant. Achieving this lead
time reduction required worker productivity to increase 20%. The third scenario provided
only a minor improvement over scenario two, because the facility design (scenario 1) and
production method (scenario 2) provide the most improvement (Yu et al. 2007).
Schroer et al. (2007) evaluates several critical factors affecting manufacturing
through simulation. They take a manufacturing line with six process cells and evaluate
takt time, line balancing, kanban capacity, and vendor managed inventory (VMI).
To evaluate kanban, which is the amount of parts allowed to be at each work
station, another set of simulations were conducted. It was found in this situation that
increasing kanban resulted in diminishing returns because the process flow was matched.
Therefore, if the process flow has little variation, increasing kanban does not improve
system flow.

87
To evaluate vendor managed inventory, Schroer et al. (2007) evaluated a series of
changes to the supply chain and made the following conclusions.
1. The reduction of all inventory is not feasible in situations with high levels of
variability.
2. Production is sensitive to the Kanban size between stations.
3. Line balancing to takt time is critical to meet customer demand.
4. Location of fulfillment centers, along with reorder point and reorder quantity impact
production.
Mao and Zhang (2008) defined normal and interactive activities instead of
traditional value added and non-value added steps to develop a framework to reengineer
processes. Computer simulation was implemented to explore the process changes. The
framework was applied to studying tunneling operations. The research evaluated a
current-state process and then proposed an alternate process that improved flow and
introduced a different technique to remove material from the tunnel (Mao and Zhang
2008). They define a normal activity as serving only one workflow while an interactive
activity serves more than one workflow. An interactive activity joins different workflows
together and cannot occur until all of its requirements are met and can lead to the
variability in a system.
Mao and Zhang (2008) established ten steps to their framework.
1. Develop work breakdown structure
2. Abstract project activities
3. Model construction process
4. Reduce supportive activities

88
5. Reduce interactive activities and minimize their interactions
6. Determine and modify critical workflows
7. Reduce activity duration
8. Reengineer construction process
9. Evaluate the reengineered construction process through computer simulation
10. Technologically evaluate the reengineered construction process
This framework revealed four improvements to the tunneling operation
1. The TBM excavation activity can be linked to the dirt removal activity improving the
flow of the system
2. The survey activity is merged into the TBM excavation activity
3. Eliminate the vertical movement cycle because the continuous dirt removal system
transports dirt from the face of the TBM continuously to the surface.
4. Reengineer a typical tunneling process that reduces liner installation duration.
The research presented in this section combines real world situations with
computer simulation as a way to improve processes. This is what the research in this
dissertation is trying to accomplish. It will take a baseline process, calibrate a model to fit
data provided by the organization. Then I will make a change to the process and use
simulation as a predictive management tool.
One major tool used in the design and construction of healthcare facilities is a
computer technology that allows the building to be constructed in a virtual space. The
next section provides further information on this modeling technology.

89
2.5 Building Information Modeling (BIM)
Building information modeling (BIM) is the process of generating and managing building
data during its life cycle (Eastman et al. 2008). It allows design teams to construct an
accurate virtual model of a building in a digital environment. This digital rendering of the
project contains information that can be used for construction, fabrication, procurement
and project management activities. BIM can also be used to understand the lifecycle of
the facility and if used correctly, provide a higher quality project at a lower cost and
shorter project duration. Eastman et al. (2008) consider BIM as a process of human
interaction that involve broad process changes from an isolated design process to a
collaborative design process and not just a tool to convey design drawings.
Currently the use of BIM as a communicative tool is centered on the design team.
In California, the regulatory agency is not currently using BIM as a tool to expedite plan
review, however, since BIM is widely used in the design and construction industry it is
important to know the current state of this emerging technology.
2.5.1 Current Architecture, Engineering, and Construction (AEC) Environment
The current AEC industry is fragmented and depends on time consuming and unwieldy
modes of communication such as email, fax, and paper-based design drawings. Errors
and omissions involved with paper-based processes increase delays, costs, rework, and
lawsuits, evidenced by the high cost to obtain errors and omissions insurance. New
technologies such as 3D CAD have been under development over the past three decades.
However, the advance in technology for information exchange is mired in inefficiency

90
and has not mitigated the conflicts that arise from a paper-based document system
(Eastman et al. 2008).
A common problem with a paper-based process is the time it takes to develop
critical assessment information from the design documents such as cost estimates, energy
analysis, architectural elements, structural details, etc. These analyses occur late in the
design process resulting in the need to perform value engineering which in many
instances detracts from the original design intent (Eastman et al. 2008). Value
engineering is the process of finding cost savings in the design to reduce total project
costs.
Maged, Abdelsayed, Tardif, Murray & Associates, a construction company
located in Quebec, Canada collected the following data to illustrate the deficiencies in the
current design and construction process (Hendrickson 2003):
• Number of participants (companies): 420 (including all suppliers and sub-sub-
contractors)
• Number of participants (individuals): 850
• Number of different types of documents generated: 50
• Number of pages of documents: 56,000
Managing this amount of information and people is a difficult task and is
amplified if the project is more complex such as in healthcare facility construction due to
the other participants involved. A system that can simplify the different types of
documents generated and the number of documents will certainly improve the design and
construction process. I believe that the system that can accomplish this simplification is

91
BIM. Many types of computer software claiming to be BIM technology exist and it is
important to understand what is not BIM technology.
2.5.2 What is Not BIM Technology
Many manufacturers boast about their BIM technology which causes confusion of what
BIM technology is. Therefore it is important to describe what does not constitute BIM
technology.
Models that contain 3D data only and do not have attributes assigned to objects
within the drawings is not BIM technology. These models are purely used for graphical
visualization and contain no intelligent tags of what objects are within the drawings.
These types of drawings cannot support data integration and design analysis (Eastman et
al. 2008)
Eastman et al. (2008) considers systems that support change behavior as BIM
technology. Drawings that contain object information but cannot adjust their information
when changed is not considered BIM technology. Without the ability to automatically
adjust model information, during a change and to inform the design team of issues, an
environment of inconsistent information will arise.
Eastman et al. (2008) do not consider it a BIM technology if the model simply
builds upon multiple 2D CAD reference files to construct a 3D model of the project. This
process does not guarantee the 3D model is feasible, consistent, and countable.
Eastman et al. (2008) do not consider it a BIM technology if the model can not
update dimensions in one view and reflect the changes in all other views. This creates an

92
environment where errors will propagate and misinformation will be disseminated to the
design team.
2.5.3 Design Benefits of BIM
Eastman et al. (2008) describe seven design benefits of BIM technology.
1. Earlier and more accurate visualizations of a design - The 3D model generated by the
BIM technology is not built up from 2D drawing views. The design from the start is
constructed in a 3D manner allowing visualization of the design at any stage and the
information presented will be dimensionally consistent in every view
2. Automatic low-level corrections when changes are made to design - The objects used
in design are controlled by intelligent information to ensure proper alignment (e.g.,
map to grid). This reduces the user’s need to manage the design changes.
3. Generate accurate and consistent 2D drawings at any stage of the design - 2D
drawings that are accurate, consistent, and without errors can be extracted from the
BIM technology at any time. This reduces the time to generate construction drawings
for the design team. When changes are required, the drawings can be generated as
soon as the design changes are implemented into the 3D model.
4. Earlier collaboration of multiple design disciplines - BIM technology enhances the
ability for multiple design engineers to work on the model simultaneously. This
ability reduces design errors and omissions. It also provides an avenue for earlier
insight into potential design problems and allows for continuous improvement of the
drawings. This is more efficient than applying value engineering to the design after
the major design decisions have been made.

93
5. Easily check against the design intent - BIM technology provides 3D visualizations of
the project earlier to accommodate space utilization, cost estimates, and material
quantity take offs. In technical facilities such as healthcare facilities the design intent
can be checked against code requirements. Space use of the facility can also be
checked to ensure correct space allocation.
6. Extract cost estimates during the design stage - At any time during the design, BIM
technology can extract accurate material quantities for cost estimates. In early stages
of a design, a cost estimate is based on square footage. However, using BIM
technology, costs of the facility can evolve rapidly and the cost impact of design
decisions can be easily obtained before a specific design is detailed at the
construction level. As a result, better decisions can be made regarding costs using
BIM technology.
7. Improve energy efficiency and sustainability - Linking the model to energy
information can provide an evaluation tool of the cost to operate the project. This is
not possible with a 2D design. In a 2D design, the thought of energy use is typically
performed at the end of the design stage. The ability to tie the 3D BIM technology to
energy analysis tools makes it possible to build higher quality facilities that are also
energy efficient.
2.5.4 Construction and Fabrication Benefits of BIM
Eastman et al. (2008) describe six construction and fabrication benefits of BIM
technology.

94
1. Synchronize design and construction planning - The ability to tie the 3D model to the
construction schedule provide insights into what the project will look like day to day.
This ability to see day-to-day progression reveals sources of problems such as site
access, crew safety, and space conflicts. Such pre-planning is not possible using 2D
(bid) documents. The 3D model can be improved if temporary construction items are
included such as shoring, scaffolding, cranes, major access avenues and these items
can be linked into the construction schedule to appear at the appropriate time.
2. Discover design errors and omissions before construction - Because the 3D model is
the source of all 2D drawings, the model can highlight design errors due to clashes.
Since all the disciplines are involved with placing their systems into the model, the
multi-system interfaces are easily checked. Timing of which system goes before
another can also be revealed using BIM technology through the use of first run
studies.
3. React quickly to design or site problems - The impact of a suggested design change
during construction can easily be entered into the building model and the model will
update instantly informing all players affected by the change. Project production is
not disrupted because design changes are resolved quickly.
4. Use design model as basis for fabricated components - BIM technology can be used
to provide fabrication level detail so additional drawings are not created. If the
building information model contains this fine level of data, the information can be
sent to a fabrication unit directly and the item can be made without delay, increasing
project productivity.

95
5. Better implementation of lean construction techniques - Lean construction techniques
require tight coordination between the owner, design team, general contractor and
subcontractors to ensure work is performed when appropriate with available
resources. BIM provides an accurate model of the design and required materials
which provides the foundation for improved planning and scheduling. BIM
technology can improve just-in-time delivery resulting in reduced inventories. This
reduces the cost and allows for better job site collaboration.
6. Synchronize procurement with design and construction - An accurate list of materials
makes it possible to work with suppliers on what is needed for the project. The
quantities, specifications, and properties can be sent directly to the suppliers to avoid
mishandling of information.
2.5.5 Post-Construction Benefits of BIM
Eastman et al. (2008) describe two-post construction benefits of BIM technology:
1. Better manage and operate facilities - The owner can be provided a building model
that consolidates the information of all mechanical equipment, control systems, and
other large facility purchases. The owner can use this information to ensure the
facility is operating within the intended design requirements.
2. Integrate with facility operation and management systems - An updated building
model at the end of construction provides a source of information about the as-built
spaces and systems and can be used as a starting point for facility operation. The
model can be integrated with facility system sensors to allow the facilities to be
operated remotely.

96
2.5.6 Challenges of Implementing BIM
Eastman et al. (2008) describe four challenges to implementing BIM technology:
1. This new technology has not been adopted by every firm and a standardized platform
has not been adopted. Therefore, getting design team members to use a specific BIM
technology is challenging. If members of the design team use different modeling
tools, then additional effort is required to transfer the models from one platform to
another which can also lead to information errors.
2. Legal changes to documentation ownership and production are likely to occur
because a legal debate arises, on who owns the multi-discipline, fabrication, analysis,
and construction data information and who pays for them. Also, who is ultimately
responsible for the accuracy of the building model? Facility owners are slowly
resolving these issues because they see the benefit of using BIM technology and are
contractually requiring the use of BIM technology on their projects. Professional
groups such as AIA and AGC are developing guidelines and contract verbiage to
cover issues arising from using BIM technology.
3. The use of BIM technology requires construction information to be used early on in
the design process. This requires a change in current practice and organizations resist
change. However, as BIM gets to be more widely used, information sharing will
become easier, but sharing the building model is not a natural process for many
design and construction firms.
4. Implementation issues arise when changing from a 2D to 3D environment. It isn’t as
easy as changing the software. To correctly implement BIM technology, the process

97
of information flow must be understood prior to adopting BIM technology. Firms
have to decide which software to use, acquire the software, and train personnel, which
is expensive.
BIM technology is certainly a technology that is here to stay and enables
improvements to facility construction. However, more standardization and education of
BIM technology implementation is required. One such construction player that needs
education on BIM is regulatory agencies. These agencies are an intermediate user of the
drawings produced using BIM. One such organization that is trying to understand where
BIM fits into their review process is the Office of Statewide Health Planning and
Development. The history and how the organization currently works is discussed in the
next section.
2.6 Office of Statewide Health Planning and Development (OSHPD)
The Office of Statewide Health Planning and Development (OSHPD) is the focus of this
dissertation research. Following is a brief discussion on OSHPD. The Sylmar earthquake
of 1971 was a 6.6 magnitude earthquake that caused severe damage in four major
healthcare facility campuses in California. Two healthcare facility buildings collapsed
killing forty-seven people and three others were killed in another healthcare facility that
nearly collapsed (Seismic Gov 2001). To ensure that facilities could withstand a seismic
event, the State of California enacted the Alfred E. Alquist Hospital Seismic Safety Act
in 1973.
In approving the Act, the Legislature noted:

98
“[H]ospitals, that house patients who have less than the capacity of normally
healthy persons to protect themselves, and that must be reasonably capable of providing
services to the public after a disaster, shall be designed and constructed to resist, insofar
as practical, the forces generated by earthquakes, gravity and winds.” (Health and Safety
Code Section 129680)
A major modification to the Hospital Seismic Safety Act occurred after the 1994
Northridge earthquake where 23 healthcare facilities had to suspend operations due to
over $3B in damages (Calhealth 2008). In response to this seismic event, SB 1953 was
passed requiring healthcare facilities to comply with three seismic safety deadlines:
1. 2002: major non-structural systems such as backup generators, exit lighting, etc. must
be braced
2. 2013: all general acute-care inpatient buildings at risk of collapsing during a strong
earthquake must be rebuilt, retrofitted, or closed; and
3. 2030: all healthcare facility buildings in the state must be operational following a
major earthquake.
2,700 general acute-care inpatient healthcare facility buildings are required to
meet the mandates of SB 1953 with an estimate construction cost of $24B. In addition, a
study shows that 66% or two out of every three healthcare facilities are losing money
from operations. Additional data shows that approximately one third of the state’s urban
healthcare facilities and more than half of rural and inner-city healthcare facilities are
losing money from all sources of income (Calhealth 2008). Healthcare facility owners
facing tighter budgets require new or renovated hospitals to come into service as quick as
possible to start the revenue stream. This puts strains on the design, permitting, and

99
construction which is a major reason for this research. Improving the permitting process
as shown later in this dissertation can improve the economic programs and ultimately
improve healthcare across the State of California.
The Office of Statewide Health Planning and Development (OSHPD) is charged
to oversee the implementation of SB 1953, more specifically, the Facilities Development
Division which is further explained in the next section.
2.6.1 Facilities Development Division (FDD)
The Facilities Development Division (FDD) of the Office of Statewide Health Planning
and Development is responsible for the permitting of all healthcare facility construction
in California, both new construction and renovation. This agency ensures healthcare
facilities meet a certain level of seismic performance, in order to ensure they remain
functional during and immediately following a major catastrophe (specifically an
earthquake). Obtaining drawing approval for new construction or renovation of a
healthcare facility can take up to two years, which is detrimental to a healthcare facility
owner’s business plans. A common scenario is that owners want to fast-track their
projects, i.e., start construction early while parts of the design remain to be checked for
quality. The FDD continues to review the project; however, if information is missing or
errors are evident, the FDD returns the drawings to the design team for correction. This is
known as a “back-check.” Back-checks add time to final permitting and cause variation
in the flow of information. This scenario is riddled with rework cycles. These projects are
reviewed by seven different sections of the FDD.

100
The staffing of each geographic region depends on the workload they have
historical experienced. The coastal region due to population density has more healthcare
facilities and reviews the most drawings while the south and north regions review fewer
drawings. The FDD consists of 235 personnel and is divided into seven different
geographic regions.
2.6.2 Stakeholders in California Healthcare Facility Construction
In addition to healthcare facility project team members and OSHPD, many other
government and industry agencies are involved with construction of a healthcare facility
in California (Figure 2-11). Industry project participants include the contractor and sub-
trades and the owner and owner representatives. Government oversight of healthcare
facility construction is accomplished not only by OSHPD but also by local government,
Department of Health Services, and the Department of Geologic Services.

101
Hospital Construction
OSHPDArchitectural
StructuralMechanicalElectricalPlumbing
Fire, life, safety
Design TeamArchitectStructural
Civil engineerMechanicalElectricalPlumbing
Fire, life, safetyGeotech
OwnerCEOCFO
Project managerAdministration
Patient care servicesAccountant
Organizational support services
Diagnostic & therapeutic services
Program coordinatorLegal
CommunicationEngineeringBiomedical
DHSLicensing
CityEngineers
City plannersCity council
Fire marshallPublic works
ContractorGeneral
FoundationFrame
MechanicalElectricalPlumbingHospital
equipment
And more...Bonding Company
UnionsOther businesses
etc.
Figure 2-11 Stakeholders Involved with Healthcare Facility Construction in California
2.6.3 Project Production Systems Laboratory (P2SL) Healthcare Improvement Initiative
Starting in October 2006, P2SL commenced an initiative to improve healthcare facility
permitting in the state of California. This initiative included healthcare facility owners,
architects, engineers, contractors and OSHPD. During the first five meetings, teams
developed a current state map of how four major healthcare facility owners delivered
projects to OSHPD for review.
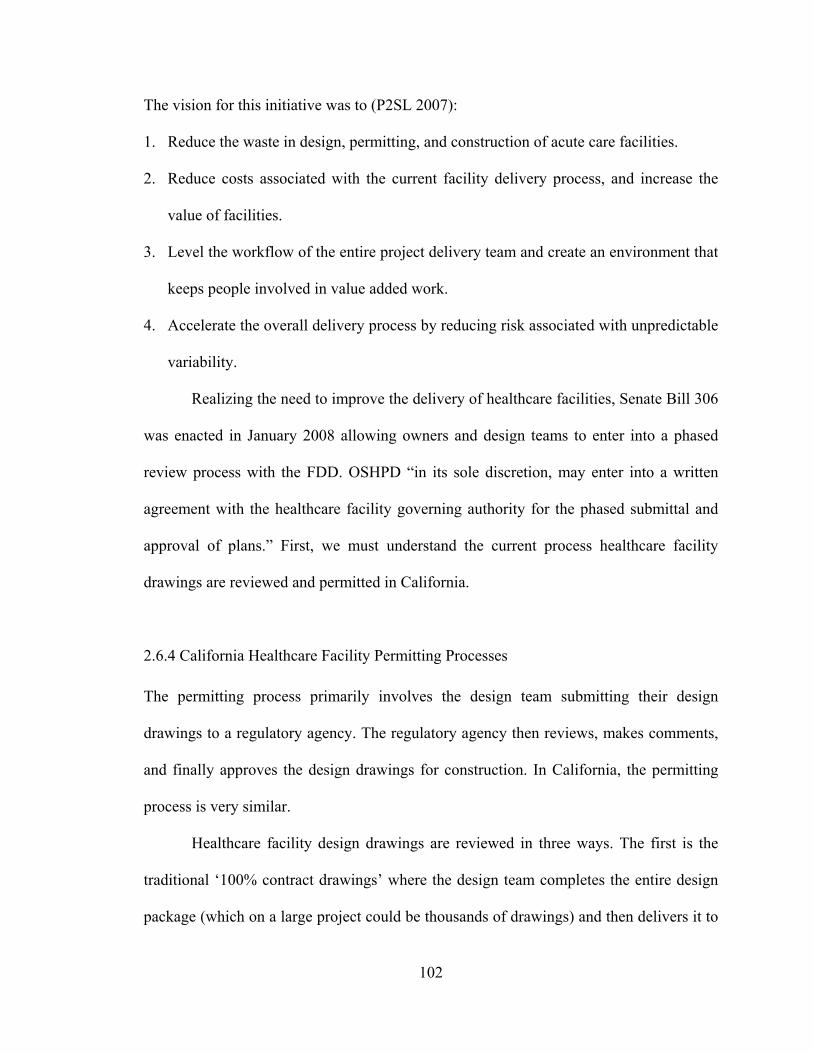
102
The vision for this initiative was to (P2SL 2007):
1. Reduce the waste in design, permitting, and construction of acute care facilities.
2. Reduce costs associated with the current facility delivery process, and increase the
value of facilities.
3. Level the workflow of the entire project delivery team and create an environment that
keeps people involved in value added work.
4. Accelerate the overall delivery process by reducing risk associated with unpredictable
variability.
Realizing the need to improve the delivery of healthcare facilities, Senate Bill 306
was enacted in January 2008 allowing owners and design teams to enter into a phased
review process with the FDD. OSHPD “in its sole discretion, may enter into a written
agreement with the healthcare facility governing authority for the phased submittal and
approval of plans.” First, we must understand the current process healthcare facility
drawings are reviewed and permitted in California.
2.6.4 California Healthcare Facility Permitting Processes
The permitting process primarily involves the design team submitting their design
drawings to a regulatory agency. The regulatory agency then reviews, makes comments,
and finally approves the design drawings for construction. In California, the permitting
process is very similar.
Healthcare facility design drawings are reviewed in three ways. The first is the
traditional ‘100% contract drawings’ where the design team completes the entire design
package (which on a large project could be thousands of drawings) and then delivers it to

103
OSHPD/FDD for review. FDD plan reviewers comment on non-compliance issues and
then send the set back for correction by the design team. This cycle continues many times
until the drawings are deemed code compliant, whereupon FDD approves them. If the
drawings fully comply with the California building code from the start of review, this is
the most efficient way for the drawings to be permitted through the agency. However,
this situation rarely occurs.
The second and most often used way to review and approve drawings is to break
the project down into phases. A ‘phased project’ divides the project into major systems,
to include underlying utilities, foundation, structure, mechanical systems, and roof
systems. This way differs from the ‘100% contract drawings’ in that the design team can
submit each phase as soon as it is complete. This process decreases the batch size of the
design drawing submittals but it increases the number of project reviews FDD has to
perform.
The third way is to request ‘partial permits.’ This differs from the phased
approach in that each phase separately can be approved and permitted to construct. The
upside is this approach allows the construction process to begin earlier by reducing batch
sizes, but it also increases the number of reviews. The downside is the difficulty of
determining which parts of the drawings are approved with permits and which are not.
An example of this is: Where do underground utilities start and stop in relation to the
foundation?
The current batch process of healthcare facility permitting does not create an
environment where errors are easily detected, analyzed, and corrected. In fact, this system
works against the culture of working together to detect errors because many designers

104
make their systems work, and hopefully the plan checkers do not catch any minor errors.
Minor errors are easily missed because of the very large number of drawing sheets
included in a healthcare facility design; something in excess of 3,000 sheets for a
healthcare facility construction project. All of these processes create substantial rework,
pushing back construction schedules and leading to significant cost escalation (e.g.,
Morris (2007) estimates escalation at about 12% per year). In addition, the FDD has a
large amount of work resulting in a backlog of reviews, causing delays affecting business
plans of large healthcare facility providers.
I believe that implementing a different way of designing and reviewing healthcare
facility drawings can improve the time to receive drawing approval. This research uses
Lean production theory, to establish an alternative way of permitting healthcare facility
designs. Many issues arise with the FDD review process because members within
industry do not understand the process of how healthcare facility drawings are approved.
During the design process, the development of a healthcare facility proceeds through the
business case/feasibility study, programming, schematic design, design development,
construction documents, and permitting. This process can take upwards of two years to
complete which severely alters healthcare facility business plans and must be considered
prior to constructing a new healthcare facility. The plan review process can involve as
many as ten different organizations from the owner, architect, designers and the
subcontractors (civil, electrical, mechanical), general contractor, FDD and other
government agencies.

105
3. TAXONOMY OF REWORK
3.1 Section Abstract
Based on the premise that healthcare facility design and construction costs are escalating
due to rework in upfront (1) planning, (2) programming, (3) design, and (4) permitting
phases a study to understand where waste occurs performed by a group of healthcare
facility owners, architects, designers, contractors and state permitting personnel. This
study identified 158 process waste items. Chapter 4 categorizes these 158 waste items
using an existing taxonomy of rework and extending it as needed. An existing taxonomy
of rework contains five categories: (1) human resource capability, (2) leadership and
communication, (3) engineering and reviews, (4) construction, planning, and scheduling,
and (5) material and equipment supply. The extension includes three new categories:
(1) planning, programming, and budgeting, (2) design planning and scheduling, and
(3) design review.
Chapter 3 identifies what causes of rework are within the California healthcare
facility design and permitting phases. Understanding these waste items provides a
foundation on which to build new practices that avoid costly design and permitting
delays. The proposed categories were presented to industry members in two workshop
presentations to validate the three category extensions.
3.2 Background and Scope
As mentioned in section 2.6, the work in this chapter builds on the process centered on
OSHPD. To understand the delivery of healthcare facilities in California, it is important

106
to capture the current state of operations. Four hospital owners were present at the
initiative. After mapping their current process it was determined that each owner had a
different way of delivering healthcare facilities in California. These process maps were
consolidated and waste items were identified and documented. The consolidated map and
waste items serve as the basis for the work presented in this section.
3.3 Methodology and Methods
Qualitative research explored the causes of rework within the state of California
healthcare facility design, permitting, and construction industry. A cause and effect
diagram categorizes the causes of rework under Fayek et al. (2004) original five headings
and three additional headings. Data was sampled from a series of workshops that
developed current and future state maps. The identified waste items were screened for
duplication and placed into a two-tiered categorization system.
3.4 Data Collection and Rework Classification
Kauro Ishikawa (1982) developed the “fishbone” diagram or cause and effect diagram as
a qualitative tool to present cause and effect relationships. In developing process
improvements, quantitative tools (such as multiple regression, analysis of variance, and
multi-variate charts) can be used to analyze cause and effect relationships. However, use
of quantitative tools should be preceded by qualitative analysis to ensure existing
knowledge is acquired and quantitative tools are focused in the right direction (Schippers
1999).

107
Rework has many sources in the construction industry. Figure 3-1 shows a cause
and effect diagram documenting the causes of rework in a facility project. To the right of
the dashed line, it shows five categories of rework: (1) human resource capability,
(2) leadership and communication, (3) engineering and reviews, (4) construction planning
and scheduling, and (5) material and equipment supply.
This taxonomy of rework (figure 3-1) shows two levels of categories, the first
level represents the five main branch headings and the second level the horizontal arrows
from each branch of the cause and effect diagram. Fayek et al. (2004) further described
the secondary level by a third level of detail (not shown). Their extensive work in the
causes of rework lacks causes tied to the design and permitting phases of a project.
Following are my interpretations of the five categories proposed by Fayek et al (2004).
A. Human Resource and Capability focuses on the physical work that is conducted to
complete the construction project. It includes the direct supervision of field work.
B. Leadership and Communication focuses on the project management team and
subsequent communications amongst the team members. It also includes end user buy
in, however, it does not include the programming and budgeting process that owners
participate in.
C. Engineering and Reviews focuses on the process that occurs between design
engineers and how scope changes cause rework. It does not include the interaction
that the design engineers have with regulatory agencies.
D. Construction Planning and Scheduling focuses on the execution of field work where
designs are implemented. It does not include rework that occurs within the design
phase of the project.

108
Pro
pose
dO
rigin
alP
ropo
sed
Orig
inal
Figure 3-1 Rework Cause and Effect Diagram

109
E. Material and Equipment Supply focuses on the physical items that are utilized in the
construction effort.
3.5 Categorization of Rework in Delivery of California Healthcare Facilities
The research presented here proposes three main categories be added to the existing
taxonomy as presented by Fayek et al (2004). Figure 3-1 shows a consolidated cause and
effect diagram, integrating my proposed three categories with Fayek’s original five. It
shows the three proposed categories to the left of the original five because the design and
permitting phases occur prior to construction.
1. Planning, Programming, and Budgeting (PP&B) focuses on upfront actions including
plan validation, a process where major stakeholders verify project budgets, timelines,
scope, design, and labor and material costs. This category captures the causes of
rework as it pertains to the owner’s involvement with the project. This category has
six second-level categories.
1.1 Change in User Groups causes rework because the design team may have to
change the facility layout and functions to accommodate new representatives of
the staff. For example, a healthcare facility is trying to persuade a specific doctor
to join their staff and promised to provide what he/she wants in a functional
space. This leads to late changes in the design and multiple rework iterations
because of the long lead time to delivery a facility while staffing occurs in a short
lead time.
1.2 Lack of Owner Commitment causes rework because the design team does not have
clear direction of what user requirements will be. For example, rework may occur

110
because an owner will ask the design team to explore multiple options and then
not commit to a specific design because the owner has not committed to a single
vision of the facility.
1.3 Lack of Flexibility and Knowledge causes rework because the owner will not
make concessions on different design options that could support a particular
requirement. The design team then makes changes to the design to accommodate
owner requirements. For example, an owner initially requests a specific type of
medical equipment for a surgical room. The design team accommodates this piece
of equipment into the contract drawings. Then, as the facility is in construction,
the owner requires a new type of medical equipment and is not flexible in using
the original piece of equipment. This issue results in the cycle of technological
innovation versus the time it takes to deliver a facility. As the project is being
designed and constructed, new medical technology gets developed. Therefore,
owners, wanting to provide state-of-the-art medical care will want to decide
relatively late in the project to obtain the latest technology, however, this new
equipment may require different design requirements resulting in rework. This
situation is not unique to healthcare facility construction; Gil et al. (2004)
researched this phenomenon in the semiconductor industry. He advocates a
judicious postponement of design commitments to reduce waste and increase the
reliability of the development process. Design teams can adopt a wider range of
initial design criteria, that accommodates potential technological innovation to
prevent downstream rework. However, if not managed properly, an increase in
construction rework is likely.

111
1.4 Change in Business Case occurs when an owner revises the business plan which
changes the services that the healthcare facility will provide, in response to
market forces. For example an owner may change areas to support an additional
surgical ward because a nearby hospital closes.
1.5 Escalation Costs cause rework. For example, when an owner does not adequately
plan for cost escalation, as the project progresses, changes to design have to occur
because the current budget cannot support the future facility and the revised
business plan.
1.6 Poor Communication causes rework. For example, when the needs of the owner
are not conveyed to the design team, the design team then has to make
assumptions in order to proceed, likely resulting in rework later when owner
needs are revealed.
2. Design Planning and Scheduling (DP&S) focuses on the design team and how they
process information to complete the facility design. This category captures the rework
associated with the design team, and any additional players such as contractors and
specialty contractors. This category has seven subcategories.
2.1 Design Changes cause rework because the discipline engineers have to rework
their designs to accommodate them. These design changes do not include owner
driven changes which are a focus of another category.
2.2 An Inappropriate Design Process causes rework when information is not properly
obtained by discipline engineers. For example, in mechanical design, a pressure
exists to submit design drawings before they are completed for two reasons (1) to
obtain regulatory agency approval and (2) to allow the sheetrock contractor to

112
provide an estimate for their work. Regulatory agency approval is required before
a construction permit is granted. Delays in obtaining this permit ultimately delays
project completion. The sheetrock estimate is provided to the general contractor
and owner to determine the project budget. Then, as the mechanical design is
finalized, the completed design can differ from what was shown in previous
design iterations which in turn will require another regulatory agency review and
rework of the sheetrock estimate.
2.3 Poor Document Control causes rework because discipline engineers are not
working off the latest set of design assumptions and criteria. For example, in
foundation design, a geotechnical report can provide many seismic loading
scenarios. Rework occurs when the structural engineer does not have the latest
loading scenarios to design the foundation.
2.4 Unrealistic Schedule is likely to occur when the design team and other project
members do not complete a well thought-out reverse phase schedule. A reverse
phase schedule works backward from required intermediate and schedule
completion dates. All project members participate in understanding how long
each of their design and construction requirements will take. This information is
then posted for all to see and information handoffs are clarified and agreed upon.
A final schedule is then developed by all project members. A poorly planned
reverse phase schedule results in poorly defined handoffs of information between
design engineers; which causes rework.
2.5 Inappropriate Batch Size refers to the number of drawings that are transferred
between discipline engineers or a regulatory agency. For example, a regulatory
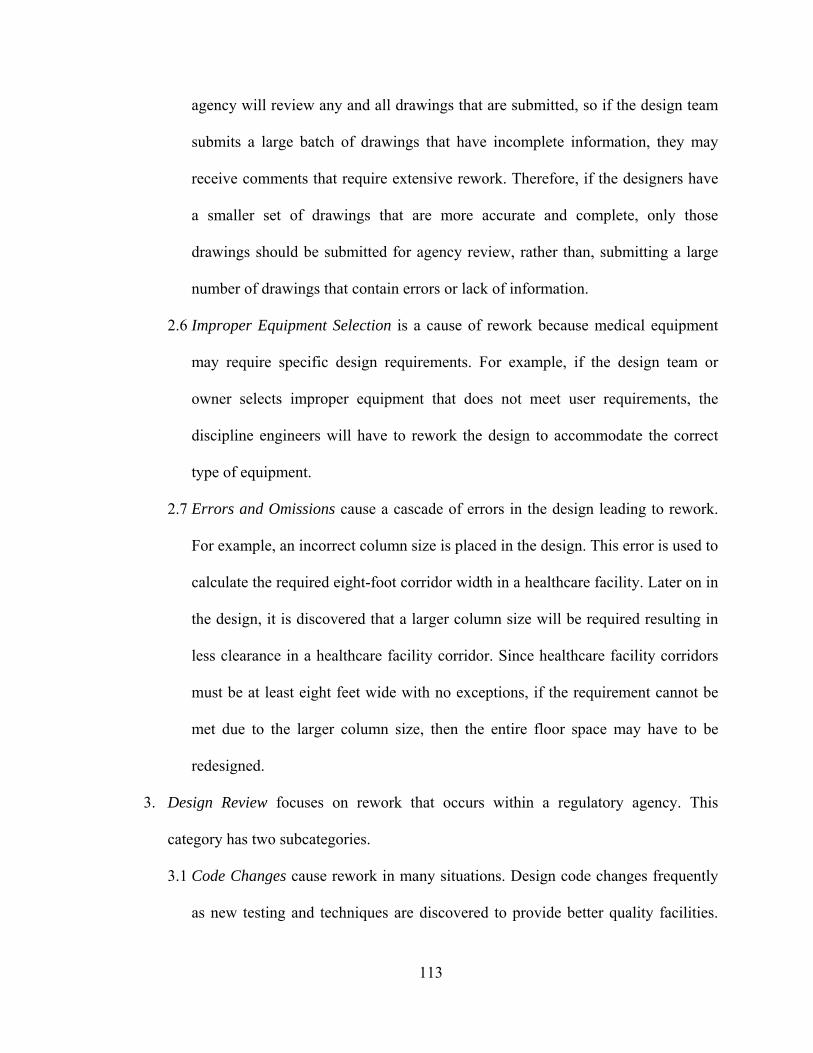
113
agency will review any and all drawings that are submitted, so if the design team
submits a large batch of drawings that have incomplete information, they may
receive comments that require extensive rework. Therefore, if the designers have
a smaller set of drawings that are more accurate and complete, only those
drawings should be submitted for agency review, rather than, submitting a large
number of drawings that contain errors or lack of information.
2.6 Improper Equipment Selection is a cause of rework because medical equipment
may require specific design requirements. For example, if the design team or
owner selects improper equipment that does not meet user requirements, the
discipline engineers will have to rework the design to accommodate the correct
type of equipment.
2.7 Errors and Omissions cause a cascade of errors in the design leading to rework.
For example, an incorrect column size is placed in the design. This error is used to
calculate the required eight-foot corridor width in a healthcare facility. Later on in
the design, it is discovered that a larger column size will be required resulting in
less clearance in a healthcare facility corridor. Since healthcare facility corridors
must be at least eight feet wide with no exceptions, if the requirement cannot be
met due to the larger column size, then the entire floor space may have to be
redesigned.
3. Design Review focuses on rework that occurs within a regulatory agency. This
category has two subcategories.
3.1 Code Changes cause rework in many situations. Design code changes frequently
as new testing and techniques are discovered to provide better quality facilities.

114
For example, a code change may force a structural design change when a new
geotechnical analysis is developed that is technologically advanced to calculate
seismic loadings. The national geotechnical code requires a geotechnical report
for a healthcare facility use the latest analysis techniques. However, the state
review code will not adopt the new geotechnical analysis until 2012. This
situation causes confusion which leads to the design team not knowing which
code to use and ultimately having to conduct rework to analyze the structure using
the correct code requirements.
3.2 An Inappropriate Review Process causes rework. For example, the fire, life, and
safety reviewer requires the design team to provide explicit information on the
door hardware, when designers are not yet ready to provide it. If the design team
provides that information to accommodate the plan reviewer and the door
hardware has to be changed, rework for the design team and the plan reviewer
will occur.
3.6 Limitations
Following are the limitations of this research.
1. This section does not contain all possible causes of rework, these rework causes
capture the ones identified by the industry group, there could be more causes of
rework present in the California healthcare facility construction industry.
2. This data is qualitative; it does not have quantitative information showing the overall
impact of the causes of rework. This research does not attempt to show cost impact of

115
the causes of rework. This could be put into future work to determine the financial
impact of each of these categories.
3. This research does not attempt to determine the quantitative impact due to the causes
of rework. This includes the time impact to the project design and construction
schedule.
3.7 Analysis and Results
I categorized the 158 waste items and developed figure 3-2 to show the relative
contributions of each of the rework categories. For example, planning, programming, and
budgeting resulted in 28% (42 items) of the 158 waste items.
Figure 3-2 shows six categories, three from the original taxonomy framework and
the three extension categories. The two original categories of (1) human resource
capability and (2) engineering and reviews were not necessary in categorizing the causes
of rework in California healthcare facility design and permitting because no occurrences
met those category descriptions. The three original taxonomy categories used in this
research are (1) construction, planning, and scheduling <1%, (2) material and equipment
supply 3%, and (3) leadership and communication 1%.
Figure 3-2 shows the largest contributors of rework in the design and permitting
phase of a project are (1) Design Planning and Scheduling 51%, (2) Planning,
Programming, and Budgeting 28%, and (3) Design Review 17%. This figure reinforces
industry comments in regards to rework, “we do it to ourselves,” because much of the
rework is in the control of the design team. Controlling the Planning, Programming, and
Budgeting aspects of facility construction are directly attributable to facility owners, yet a

116
need or want for flexible programs always exists. I do not propose that business case
programs be inflexible, in fact, I support flexible programs that will ensure state of the art
healthcare services, nevertheless, owners must understand there can be a price for
program flexibility such as increases in rework, project cost, and project delay. However,
the impact of program flexibility may be reduced if proper set-based design techniques or
delayed commitments strategies are applied. Design Planning and Scheduling is
responsible for 51% of the causes of rework. The design process contains many areas
where waste can be eliminated.
Design Review makes up 17% of the rework causes. An effort by a state
regulatory agency to improve the review process that will remove causes of rework from
all three proposed categories is currently underway. However, improving Design
Planning and Scheduling may have the greatest effect in reducing rework in the process
of permitting healthcare facilities. Improving can occur if owners take the time to
properly plan, program, and budget for their facilities, (which will reduce the time to
permit).
3.8 Relative Contribution Analysis
The relative contribution analysis mirrors the process, analysis and results conducted by
Fayek et al. (2004). The analysis is based on the contribution of each rework cause to the
overall number of rework occurrences (158). The sum of all rework percentages is equal
to 100%. Figure 3-2 shows the percentages of the second level causes that contribute to
the first level cause of rework. For example in figure 3-2, Planning, Programming, and
Budgeting (PPB) contributes 28% to the total rework causes. We attributed 10% of the

117
28%, to Lack of Owner Commitment, 4% to Owner Changes, 4% to Change in Business
Case, and 4% to Change in User Groups. A Lack of Owner Commitment occurs when the
design team is waiting for owner decisions and approvals. Healthcare facility owners
want to provide the best, most appropriate healthcare facility and may require additional
effort in making final design decisions; however, this delay can impact project design.
For example, conflicts between multiple owners on space use decisions can cause rework.
This conflict may arise, for example, from an unresolved business program, poor project
definition, and lack of commitment to facility scope.
Design Review resulted in 17% of the rework causes, 13% is due to Inappropriate
Review Processes, and 4% to Code Changes. Some examples of Inappropriate Review
Processes are incomplete reviews, inappropriate coordination of review, lack of
documentation and agreements on code interpretation, and reviewer preference of
solutions.
An inappropriate review process also includes lack of consistency in review staff,
interpretation of code by field staff, and gaps between reviews (loss of knowledge or
familiarity). Design Planning and Scheduling resulted in the majority of rework causes at
51%. Of this 51%, 34% is due to Inappropriate Design Processes, 6% to Poor Document
Control and 4% to Inappropriate Review Processes of drawings prior to regulatory
agency submission.

118

119
Figure 3-2 Relative Contribution of Rework
An Inappropriate Design Process includes incomplete designs, e.g., where
drawings are not complete due to a lack of coordination between design team members. It
also includes exploring design options outside of project scope and failing to identify
alternative methods of compliance. An alternative method of compliance is where the
design team feels they can meet a code requirement using a different method from a
prescribed standard design solution, however, the approval process for an alternative
method of compliance can take up to one year. In California, depending on the situation,
an alternative method of compliance can require additional regulatory agencies to review
the proposed design solution for code adequacy. These additional regulatory reviews add
time to the design and permitting process. However, during this regulatory review time,
the design team continues to design the facility. If the alternative method of compliance
is determined inadequate, the design team must find another design solution. Therefore,
failing to identify alternative methods of compliance early in the design and permitting
process is a major cause of rework. Other causes falling under an Inappropriate Design
Process are improper timing of equipment selections, undefined information needed by
team members, and incorrect drawings provided for a desired purpose.
3.9 Section Acknowledgments
Thanks to all that have and are participating in the California Healthcare facility
Initiative. This research could not occur without the help of all P2SL member companies.

120
4. CASE STUDY I: WORKFLOW OF A MECHANICAL
CONTRACTOR
4.1 Section Abstract
Design and construction changes often cause rework, increase a project’s cost, and delay
its delivery. I obtained data from a mechanical contractor in order to study rework timing
and how it disrupts their detailing, fabrication, and installation processes. A set of
simulation models illustrate the impact of rework timing. The focus is on early changes,
that is, changes that become known when the contractor is detailing, so they can be dealt
with either (1) right away during detailing, (2) during fabrication, or (3) during on-site
installation. One model shows that dealing with changes in the detailing phase not only
affects that phase but can have negative impacts on installation as well. Another model
shows that detailing a project to a set of approved drawings and maintaining those until
project completion, forces changes to be pushed downstream to site installation, which
makes the impact of those changes more transparent to all players involved and can
reduce negative iteration.
The question addressed in this chapter is: When early changes occur, is there
benefit to incorporating them during site installation instead of trying to capture, re-detail,
and change drawings? Practitioners can use this research to assess resources to avoid
rework.

121
4.2 Background and Scope
This chapter focuses on how a mechanical contractor deals with changes in construction
of a healthcare facility that requires a state-agency building permit. These concepts of
changes timing, last responsible moment, not getting credit for correcting errors that do
not occur, and the 90% syndrome contribute to making project management of such
facilities complex. To deal with this complexity the mechanical contractor implements
the last responsible moment to detail changes. This last responsible moment is when the
change is needed in site installation. Once the site installers are ready to implement the
agreed upon change is when the upstream process of detailing and fabrication occurs.
This reduces the amount of delay between processes and makes the cost of change more
explicit.
Changes in a construction project not only cause rework but they also can lead to
significant cost overruns and schedule delays. Changes stem from owner-modified
project requirements, design errors, omissions, etc. (Love and Li 2000). Research has
shown that if changes are identified and handled as early as possible, it will pay dividends
in future work (Ibbs 2005). This idea also is grounded in lean production theory (i.e., it is
akin to stopping the assembly line as soon as a quality defect has been detected, and
fixing it right there and then). Change in design is known to be less costly than change in
construction, however, change in design might be needed several times particularly when
the corresponding costs are perceived to be minimal. Because certain changes and
especially those in the course of construction tend to be costly, some owners prefer to not
invoke them but instead complete their project as planned and immediately thereafter
initiate a ‘tenant improvement’ project to handle the previously-identified changes.

122
In the case studied here, a mechanical contractor (a subcontractor to a general
contractor) decided to allow changes to design drawings to be pushed down the line and
dealt with during site installation instead of dealing with them in the detailing phase.
“We do it to ourselves by detailing too early … I can see when a project will
require rework when we detail without complete information … We end up chasing our
own tail trying to catch the numerous changes that occur (Mohar 2008).”
On one project, this contractor tried to catch all of the changes to drawings as
soon as possible and determine the effect of those changes prior to fabrication and site
installation of materials. However, they had to work hard to track down where the
drawings were and what items were in fabrication vs. what items had been sent to the site
for installation. In addition, they had to put in extra effort to ensure that the site installers
had the most up-to-date drawings to work from.
“It is extremely difficult to get drawings out of the field once they are sent out
because the field personnel make a lot of notes on them. I have to physically go to each
of the sites and pull them out of the trailers (Heier 2008).”
This caused communication errors to occur and, ultimately, some incorrect items
did get installed so that some site rework had to be accomplished anyway. This case
study discusses how early vs. late handling of changes can be modelled and reveals
benefits of dealing with changes at the site. The benefits are (1) ease of more explicit
accounting for costs incurred due to changes and (2) less negative iteration in the process.

123
4.3 Methodology and Methods
Purposeful sampling of the case study was used to select the mechanical subcontractor.
This mechanical contractor is an expert in both dry side and wet side heating, ventilation
and air conditioning installations and an expert in healthcare facility construction in
California. In depth interviews were then used to collect information on their internal
process from which a flow diagram is created. Data is obtained from the organization that
was then used to construct a discrete event simulation model. The model was validated
through an in depth interview with key members of the organization.
4.4 Types of Contracts
Different types of contracts are used to legally bind members together in producing a
construction project. Following is a synopsis of the types of contracts, the role of the
contractor, owner, designer and subcontractor in each contract type, their advantages,
disadvantages and parallels to other industries. One statement can be made for every
contract which is “few things are absolute, and almost always there are exceptions
(Collier 2001).”
The first type is the firm fixed price contract also known as lump-sum and
stipulated sum contracts. It has been the most common type of contract over the past 100
years however; today many of the larger construction contracts are not firm fixed price
(Collier 2001). The concept of this contract type is to provide a complete and useable
facility for a fixed price. This type of contract worked fairly well in dealing with a
simple, complicated project, for example a small house. The contract along with the
reputation of the builder and subcontractors and the availability of materials pretty much

124
ensured that the owner would receive a house that was suitable and ready for occupancy.
The house would be of a certain quality with all of the additional items of finishes,
fixtures, fittings, and services despite it being clearly written in the contract. This concept
of a lump-sum contract still exists today which requires the contractor to provide and
install work that “is reasonably inferable from them (the contract documents) as being
necessary to produce the intended results.” The wording provides for many different
interpretations, but it is the interpretations by the courts which bind the contractor.
However, one main interpretation exists from the firm fixed price contract. A contractor
is required to provide completed work for the general purpose for which it is designed
and intended. For example, if a bathroom was located on the drawings on the second
floor of a building but no design was done for the mechanical, electrical or plumbing, the
contractor would still be responsible for installing those required materials to make that
work function.
An owner’s two primary tasks in any type of construction contract are:
1. Provide information and access to the construction site.
2. Pay the contractor according to the agreement and conditions of the contract.
The owner has very few primary tasks in a construction contract because most of
the duties are passed to the architect and design engineers. The owner has more rights
than tasks in a contract that include the ability to stop work if deficient work is being
done or the contractor fails to provide adequate materials to the project. In addition, if
this occurs, the owner has the ability to get the changes made at the cost of the contractor.
In that same line, the owner has the right to terminate the construction contract if the
contractor continually fails to meet the requirements of general conditions. However, the

125
owner must get approval of just cause from the engineers. This shows the interrelatedness
that the owner, architect, designers and contractors have with each other. The owner also
has the right to accept defective or deficient work in most cases. However, in healthcare
facility construction, this is not the case, an owner and contractor must abide by the
building codes established by the state regulatory agency. Finally, an owner can establish
a liquidated damages clause that penalizes the contractor if they fail to deliver the project
on the requested timeline.
The architect or engineer has the primary role of being the owner’s agent
representative and is mostly involved with payment issues during the construction phase.
Also, the architect or engineer acts as an arbiter between the owner and the contractor. In
the design phase, typically the architects and design engineers are reimbursed as a
percentage of the total construction project. In addition, the architect and engineers are
responsible for clarifying information that is requested by either the owner or contractor
during construction. This is called a request for information (RFI) and must be answered
by the architect or design engineers. The architect or engineer is able to make a minor
change within the construction phase without it affecting the lump sum cost or delivery of
the project. However, if the work is above and beyond what is reasonably expected a
change order can be processed for cost and schedule impacts. The designer and contractor
have a joint responsibility to ensure that the work is constructed in the proper way which
can become a source of dispute. These disputes are primarily based on whose
responsibility it was that caused the error of work to occur. Other responsibilities of the
architect or engineer are to provide certification of substantial work and also to issue the
final certificate of payment.

126
The subcontractor has no obligations in a primary contract between the owner and
the contractor because they are not a party to the primary contract. However, the contract
between the contractor and subcontractor are typically lump sum contracts. The
subcontractor’s obligations are linked to the primary contract in which the contractor
must ensure the work provided conforms to the contract drawings. Basically the
subcontract and its obligations must mirror the primary contract to the extent appropriate
to the work provided by the subcontractor. However, in many instances the subcontractor
never reads or knows what is in the primary contract.
The supplier also has no obligation in the primary contract between the owner and
the contractor. A supplier is much like the subcontractor in that they are an integral piece
to the project and are affected by the primary contract. In the past, the supplier is farther
removed than the subcontractor, but this is changing. In many instances the distinction
between supplier and subcontractor is fading, with many construction products being
prefabricated by the supplier prior to delivery to the construction project. Therefore, new
contracts should recognize that this situation occurs and that suppliers may be redefined
as specialty subcontractors who supply materials or components worked to a special
design (Collier 2001).
The primary advantage of a lump sum contract to the owner is that he/she can
examine all of the bids received and select the contractor that can deliver the work within
their prescribed budget (if the design team has done their job). If the designer has done a
good job in developing the contract drawings and writing specifications and the owner
can resist making changes, it is possible to perform a firm-fixed price contract for the
advertised price. However, this is hardly the case and changes can severely hurt the

127
economics to the owner because the additional work has to be paid to the contractor
based on a negotiated agreement. It is generally accepted that changes are a source of
profit for the subcontractor rather than a loss (Berends and Dhillon 2004). The main
disadvantage with the lump-sum contract is that complete design information must be
developed prior to receiving bids from the contractors. This can significantly increase the
time until construction start which has cost escalation impacts. Also, for bidders to make
adequate estimates, all of the prescribed work must be detailed in the contract drawings.
Any required changes during the construction phase will trigger a change order that will
increase the total construction costs. Even the most dedicated and experience architects
and engineers realize that not all of the design information can be known ahead of
construction, but once the detail is drawn and specifications written, they become part of
the entire primary contract and changes will result in cost impact to the owner. These cost
impacts can threaten the project if they become too large for the owner to handle.
Another disadvantage is the owner is deprived access to the expertise that the contractor
possesses on how to build projects. They are not consulted during the design phase and
do not have time or the inclination to provide design suggestions when the bid is put
together. The contractor’s main concern is production of work already designed and is
not concerned with creative alternatives of work.
On the other side of the spectrum lies cost plus fee (CPF) contracts which reduce
the risk held by the contractor and shifts it to the owner. Figure 4-1 shows a gradual shift
of risk from contractor to owner in seven different types of contracts.

128
RiskRisk
RiskRisk
RiskRisk
RiskRisk
RiskRisk
RiskRisk
RiskRisk
(1) (2) (3) (4) (5) (6) (7)
Cost Plus Fixed Fee Contract
Cost Plus Percent Fee Contract
Contractor
Lump Sum Contract (Some
Changes in Contract)
Lump Sum Contract (Many
Changes) or Max. Cost Plus Fee
Maximum Cost Plus Fee Contract
With Sharing Clause (50/50)
Maximum Cost Plus Fee Contract
With Sharing Clause (75/25)
Contract Type
Owner
Lump Sum Contract (No Changes in
Contract
Figure 4-1 Scale of Contractual Risk Distribution (Collier 2001)
Notes:
(1) Only slight risk to owner.
(2) Some changes in contract change nature of lump-sum contract and introduce more
risk of loss for owner.
(3) Many changes in contract may alter nature of contract and risk distribution
considerably.
(4) Theoretical (not practical) distribution of risk about equal (50/50).
(5) Variation in risk distribution depends on many things, including level of maximum
cost, distribution in sharing of savings/losses, etc.
(6) Some risk to contractor. (i.e., is fixed fee adequate if scope of contract increases?)
(7) Only slight risk to contractor. (i.e., is percent fee adequate?)

129
Figure 4-1 shows that the lump sum and cost plus percent fee contract lie on
opposite sides of the contractual risk scale. The cost plus fee contract binds the owner to
pay for all work completed plus a fee to cover operating overhead and profit. Here the
owner takes on the majority of risk which is widely different from the lump sum contract
(Berends and Dhillon 2004). Risk can be inversely proportional to the amount of design
information available. If the owner has no design information available and if they want
the work completed, they must agree to pay for all the costs increasing the risk to the
owner. As more design information becomes available, bidders can make better estimates
on the cost which reduces the risk to the owner. By entering into a cost plus fee
contractor, the owner agrees to pay all of the costs and an additional fee but essentially
puts himself at the mercy of the contractor. Therefore, an owner should only enter this
type of contract if they have a good working relationship with the contractor. A cost plus
fee contract calls for more trust and confidence between the owner and the contractor. If
the contractor is efficient and careful, the owner can realize cost savings however, if the
contractor is inefficient and careless, then owner can experience great financial trouble
(Berends and Dhillon 2004).
Cost plus fee contracts use the items of work concept. Items of work are the basic
units of construction used to estimate cost. A cost estimate is based on the breakdown of
all the materials taken from the drawings and priced with a percentage added on for labor
costs or man hours calculated priced at current wages. This type of cost estimate is
typically done in the electrical and mechanical trades, however for most estimating it is
not the basis for the bills of materials used in quantities method of contracting (Collier
2001). A good example of an item of work is a brick wall being constructed by a

130
craftsman and a helper. The item of work is the unit of “brick wall built in place,”
because the costs to build the wall can be isolated and linked to the wall versus the brick
or mortar alone. The amount of square feet of wall built can then be tied to the amount
materials, labor and equipment such as the scaffolding. Work is important in the
determination of progress and payment throughout a construction project and is defined
in standard contracts. According to AIA Document A201-1997, 1.1.3, “work” means the
construction and services required by the Contract Documents, whether completed or
partially completed, and includes all other labor, materials, equipment and services
provided or to be provided by the contractor…” The term work deals with labor,
materials, tools, equipment, and all other services required of the contractor in the
contract. Work is one part of the contract and payment of the described work is another.
Figure 4-2 shows two ways to define the cost of work. Direct work is
reimbursable costs which include, labor, material, tools and job overhead costs. An
indirect cost is non-reimbursable and includes operating overhead costs and profit.
Material Costs of Items of Work
Labor Costs of Items of Work
Equipment Costs of Items of Work
Cos
t of W
ork
(as
defin
ed in
Cos
t Pl
us F
ee
Con
tract
)
Fee
(%)
or
Lum
psum
Tota
l Cos
ts o
f Con
stru
ctio
n W
orkJob Overhead Costs
Operating Overhead Costs
ProfitIndirect Costs
Direct Costs
Figure 4-2 Costs of Work (Collier 2001)
Direct costs are easily reported by the project and the specific site that it takes place at.
Indirect costs are related to the construction company as a whole and all of its projects
that it has underway. Direct costs are paid for by the owner in a cost plus fee contract.

131
While indirect costs are not directly reimbursed by the owner because they can not be
attributed to a particular project and would exist even if the contractor had no projects.
Indirect costs are considered the costs of doing business.
In a cost plus fee contract, a contractor’s operating overhead costs and profit are
collected in the fee whether it is a percentage of the direct work or a lump sum. While in
a fixed firm price contract, these costs are collected in the form of a markup that the
contractor places in the total cost of the contract. The difficulty in a cost plus fee contract
is distinguishing between what constitutes job overhead costs and operating overhead
costs (Clough and Sears 1994). Therefore, an owner must ensure that this is clearly stated
in the contract otherwise, costs overruns are likely to occur. An owner therefore is very
interested in all the direct costs incurred under a cost plus fee contract (Halpin and
Woodhead 1998).
The contractor’s main responsibility in a cost plus fee contract is to perform the
work in accordance with the contract documents and properly record all direct costs to
ensure prompt payment by the owner. Trust and confidence between the owner, designer
and contractor must be present for a cost plus fee contract to be worthwhile and a bargain
for all parties involved. The contractor should perform work as efficiently as possible and
not incur needless direct costs. Therefore, the job should not be overstaffed; equipment
and materials should be properly obtained at market prices and should be used in the best
interest of the owner. It can be seen here that there is plenty of room for interpretation
which enforces the idea that the owner should have a relatively good working
relationship with a contractor prior to entering into a cost plus fee contract. The
contractor is also responsible for keeping records of all reimbursable transactions to the

132
satisfaction of the owner (Clough and Sears 1994). In addition, the contractor shall pay
the costs to rectify any defective work that is installed.
The owner’s responsibilities in a cost plus fee contract are similar to the lump sum
or fixed price contract in that they will pay for work according to the terms of the
contract, provide information and access to the site and provide a design team that will
furnish information to the contractor. The owner’s rights are also similar to the fixed
price contract in that they can stop work with appropriate cause and they can terminate
the contract. In a cost plus fee contract the owner usually has the right to do work that is
otherwise neglected by the contractor or if the contractor fails to do the work correctly.
The designer’s obligations under a cost plus fee contract mirror those of the firm
fixed price contract in that they act as the owner’s agent; he also acts as the interpreter of
the contract and will seek proper performance of the contract by both the owner and the
contractor. However, in a cost plus fee contract, the designer may be more involved with
work at the site to include preparing working drawings and specifications during the
progress of work but also because the contract is more flexible, the owner and contractor
will look to the designer for more information. Therefore it is quite common for a
designer to place a full time manager at the construction site to oversee a cost plus fee
contract (Collier 2001).
The subcontractor’s responsibilities are also similar to the firm fixed price
contract in that they are typically lump sum contracts with the contractor. However, since
the subcontracts are considered direct costs to the project, the owner is more interested in
how those subcontracts are made. Typically the owner, designer and contractor are
involved with selecting the subcontractors so they are all in agreement with who will be

133
working on the site. A supplier’s role is also similar to the firm fixed price contract,
where the primary difference is the involvement of the owner in the selection process.
The advantage of a cost plus fee contract to the owner is work can start earlier
with incomplete design information because they are accepting the risk. Therefore the
owner can get work done in a situation where the firm fixed price contract would not get
done. In addition, the type of contract is very flexible for the owner; however, it comes
with the potential of very high prices. The biggest disadvantage is the owner does not
know what the final price of the project will be. To reduce this risk, the owner should
make it a priority to obtain as much complete design information as possible (Bennett
2003).
Unit price contract is another avenue for construction project procurement. Unit
price typically refers to the common unit in which the building material is sold with a
markup for overhead, contingency and profit (Bennett 2003). This type of contract works
well with items that have typical measurement units. For example, excavation, fill
materials and cast in place concrete are all measured in cubic yards. However, this
method may not work well with structural steel where labor becomes a majority of the
fee to put the item into place. In addition, steel installation does not have a standard of
determining the units of measurement. Unit pricing reflects the average of direct and
indirect costs or the total costs divided by the number of units installed. Unit prices are
highly influenced by the amount of work that is to be installed. An inverse relationship
exists where the unit price increases as the quantity of work decreases (Collier 2001).
This type of contract is exists for a few different construction items like heavy

134
construction such as pipeline installation, sewers, roads and dams and major site work
that is contracted separately from a building.
The contractor’s obligations under a unit price contract are unchanged from the
previous two contracts which are to produce the work in accordance to the contract and to
be reimbursed for that effort. The unit price contract is similar to the lump sum contract
except that it separates out individual items of construction. Measurement of work
accomplished is performed by both the owner and contractor. However, this situation can
lead to miscommunication and disagreement on how much actual work was
accomplished.
The owner’s responsibility is essentially the same as the previous two contracts:
duty to pay for accomplished work, provide information and access to the site and to
retain a designer to provide information to the contractor. However, one major difference
is that the owner has the ability to change the amount of work accomplished by each type
of work and can typically alter this amount by as much as 15% of original contract
quantities (Collier 2001).
The designer’s obligations are similar to the previous two contracts; however,
their most important role is to verify the quantities of work performed by the contractor.
One fundamental responsibility of the designer is to verify the schedule of unit prices
submitted with the contractors bid. They should check the bid for arithmetic accuracy, in
addition to the amounts of the prices themselves, their appropriateness and relative
magnitudes. This occurs because an experienced contractor may overprice some unit
prices and under price other items knowing which ones may increase in work during the
construction phase. This is also done by an experienced contractor to front load the

135
project and to extract more money out of the preliminary tasks. The designer has the
responsibility of ensuring that those situations do not occur on a construction project
utilizing a unit price contract.
The main advantage of unit pricing is an owner can proceed ahead with work
when quantities of work are not adequately determined. The main disadvantage is
inaccurate unit prices can be submitted by the contractor which leads to serious cost
overruns. In addition, unit price contracts are used with work that is highly variable such
as excavation where subsurface soil conditions can change rapidly. With this uncertainty,
the owner is at a disadvantage with the contractor and will typically have to succumb to
his unit pricing to complete work or suffer major financial losses. For the contractor, this
type of contract is similar to a lump sum contract except if they gamble correctly, they
can front load the project and extract more funds out early (Bennett 2003).
The fourth type of contract uses the concept of relational contracting. Striving for
strong relationships and fostering team building can lead to improved project
performance (Egan 1998). Relational contracts place emphasis on building relationships
between the owner, architect and general contractor which allows the team to explore
potential future work together (Macneil 1974). In addition a relational contract allows for
flexiblility, reduces transactional barriers and allows for a rational way of selecting
project teams (Rahman and Kumaraswamy 2004). Zaghloul and Hartman (2003)
observed that contractors add between 8% and 20% to their bid estimates to cover their
perceptions of high risk and uncertainty in construction contracts.
Relational contracting is facilitated by five factors (Rahman et al. 2007).
1. Client and top management must support the initiative

136
2. Appropriate contractual incentives must be in place
3. Team objectives must be clearly stated and in alignment
4. Relationship-building protocols
5. Proper resource utilization
Lichtig (2005) has developed a contract that is currently being used by a major
California health provider, Sutter Health. This contract has many differences compared to
the above mentioned lump sum, cost plus fee and unit price contracts. First and foremost
this contract uses a team performance contingency which is allocated to the project. This
contingency is used by all the entire project team which changes the incentive during the
construction phase. This allows money to cross organizational boundaries where the
project delivery team shares in the contingency that is in reserve once the project is
complete. In addition, this type of contract uses the concepts of Last Planner and requires
built-in quality plans which are key concepts to Lean construction. Another aspect is that
it incorporates downstream players in upstream decisions with the goal of reducing the
issues that are encountered during the construction phase.
The types of contracts previously mentioned can impact how a project is finally
delivered and it is believed that establishing trust among owners, architects and general
contractors can facilitate project delivery. In addition, sharing and allowing funds to cross
organizational barriers where the entire project delivery team experiences the pains and
gains of cooperation will facilitate project delivery. Aligning the goals amongst the
project delivery team also facilitates project delivery and effects how each of the players
interact with each other.

137
Changes in projects can be defined as any event that causes a modification in the
original scope, execution time, cost, and/or quality of work (Revay 2003). These changes
are further defined by five categories: change in scope, differing site conditions, delays,
suspensions, and acceleration (Sweet 2004). It has been shown that increased change
order hours have a direct impact on contract hours (Leonard 1987). Research has also
shown that the greater amount of change, the less efficient workers are on a project and
late project change has a greater effect on labor productivity than early change (Ibbs
2005). Changes can take place at any phase of a project. However, determining how to
quantify the changes that effect contractors and subcontractors is a difficult task. One
example deals with how changes are dealt with in a mechanical contractor. In this
example a healthcare facility is being constructed and changes to the mechanical systems
were flowed down to the mechanical contractor. Once this change was known, the
detailing portion of the mechanical contractor tried to capture the change, rework shop
drawings and reorder the material. This material would then be fabricated at the shop and
sent to the field for installation. However, this did not have the desired effect because the
field was getting confused on what materials could and could not be installed resulting in
situations where the mechanical work had to be installed twice. Therefore, the
mechanical contractor decided to implement a different model that forced all of the
changes and rework to be done and collected by the field. No additional effort by the
detailing entity would be done unless called for from the field. This resulted in better cost
tracking for changes and rework. In this case study, once the costs of the changes and
rework reached the owner, the owner decided to not go through with the stated changes
because the cost increase was too large.

138
Construction contracts play a major role in how people behave on projects.
Changes can be a major source of funding to contractors and can significantly increase
profits. Typically, changes are quantified by the total cost to install a new product.
However, the full cost of the change may not be captured because it may not include the
total time for a detailer to catch what the change is, to re-accomplish and de-conflict the
drawings, and then re-fabricate the item. Owners do not pay for additional work a
contractor does behind the scenes. This is the phenomenon of not getting credit for
correcting errors that never happen (Repenning and Sterman 2001). However, by pushing
changes to the site, the costs are more explicit and in some instances will be higher than
the owner is willing to pay for.
“By building to an agreed upon set of drawings, the cost of change becomes more
transparent when the owner can physically see us replacing material with the change that
they requested (Slane 2008).”
Therefore, with a traditional contract and risk-and-reward system in place, it is in
the best interest of the mechanical contractor to delay dealing with the changes to site
installation.
4.5 Detailing, Fabrication, and Installation DES Model
Figure 4-3 shows a flow diagram for a mechanical contractor from when it receives
approved design drawings to final installation of product. Upstream pressure occurs
because design drawings are due to the state agency for approval. As mentioned, this
review process can be lengthy, therefore, to ensure drawings can be approved; the design
engineers push to submit as early as possible. As a result, the design drawings may be

139
adequate for permitting purposes, but even so, they may lack the required information for
a contractor to fully detail the mechanical system. This results in the mechanical
contractor receiving multiple sets of drawings which then have to be reworked to get the
desired shop drawings for designer (architect and engineer or A&E) approval. The
process in the dashed box can take up to 10 weeks, with each rework cycle adding three
weeks to the process.
Downstream pressure on the mechanical contractor occurs from the general
contractor’s date to place concrete for the healthcare facility floor slabs. The reason is
that it is much more economical to drop inserts (straps from which duct will be hung)
through metal decking before the concrete slab is cast over it, than to drill and secure
straps into a hardened concrete slab, but this means that duct locations have to be locked
in prior to concrete placing. From this date, the mechanical contractor typically tries to
start the insert drawing four weeks in advance with the goal of having a complete insert
drawing two weeks prior to deck placement. However, insert drawings cannot be
completed until the layout of the mechanical system is finalized. If the layout continues
to change, the insert drawings cannot be completed. The mechanical contractor wrestles
with these two pressures constantly throughout project construction.

140
Receive drawing
Coordination w/ GC and other subcontractors
In-house clash detectionStructural layout
Kickoff meetingSchedule update
to General Contractor
Update costs
Place deck concretePlace deck insertsInsert layout
material list
Shop drawings for A&E approval
Transport to fieldFabricationDetermine order of fabrication
Spool meeting
Installation
Upstream pressure to submit drawingsfor state agency approval
Downstream pressure to install insertsprior to concrete deck placement
Rework
Figure 4-3 Flow Diagram of Mechanical Contractor Process
The model developed shows work that flows through three stages. First, the
mechanical contractor details the required parts and pieces from the design drawings.
This is an extensive effort to take single line design drawings and fill in three
dimensional pipe and ductwork that shows all of the pieces needed for actual
construction. This work has been facilitated by the use of computer renderings showing
how pipe and ductwork is installed in a facility. For a large project, the mechanical
contractor is responsible for coordinating the drawings with outside contractors, such as
fire, life, and safety, electrical and structural engineers. Once the drawings have been
coordinated, the materials can then be fabricated for site installation. This contractor uses

141
in-house capabilities to produce the majority of project materials. Once fabricated, parts
can be shipped and installed.
Site preparatory work must be completed prior to installation. In the example of
ductwork, hangers and straps are inserted a few days prior to placement of concrete.
However, the layout of the ductwork occurs many months prior to fabrication. During
that time, design changes will invalidate existing layouts. In an effort to reduce rework,
the mechanical contractor tries to detail the hangers and straps at the last responsible
moment. Their goal is to have fully coordinated insert drawings two weeks prior to
concrete placement. These inserts are then fabricated and installed 3-5 days prior to
concrete placement. Once concrete is placed, if the layout changes, the mechanical
contractor must drill into the concrete to place new hangers.
In each of the phases of work, changes can occur. Figure 4-4 shows the potential
rework caused by a change introduced during the project timeline. Each detail has to be
looked at to determine if it was affected. There could be fabrication changes and on-site
material changes as well. The figure shows the potential for large amount of rework when
a change occurs.

142
Detail
Fabricate
On-siteMaterial
Detail
Fabricate
On-siteMaterial
Detail
Fabricate
On-siteMaterial
Change Introduced
Project Timeline
Potential Rework
Detail
Fabricate
On-siteMaterial
Detail
Fabricate
On-siteMaterial
Detail
Fabricate
On-siteMaterial
Change Introduced
Project Timeline
Potential Rework
Figure 4-4 Rework Potential
In the detailing phase, many times, the mechanical engineer of record (i.e., the
licensed engineer) is not done with their design, leaving gaps of information for which
the detailers can not finalize. If the detailer has completed the drawings and the
mechanical engineer makes changes, then the drawings have to be re-detailed. This takes
extra effort by the detailers to first interpret what the changes are and determine how the
drawings change. These changes can be small or large and may take time for the detailers
to fully understand and capture all of the changes.
Changes can also occur in the fabrication phase when an item is in the midst of
being made and changes to the original design are found. This requires the item to be re-
detailed and re-fabricated. Changes can also be found when the item is on-site and the
design changes, again, this requires the item to be re-detailed, re-fabricated and re-sent to
the site. Figure 4-5 captures this situation in a discrete event simulation model.

143
Fabr
icat
ion
Det
ailin
gIn
stal
latio
nFa
bric
atio
nD
etai
ling
Inst
alla
tion
Figure 4-5 Discrete Event Simulation of Detailing, Fabrication, and Installation

144
As mentioned, within healthcare facility construction, the permitting process may
require the design engineers to complete a back-check by clarifying or correcting the
design. However, the mechanical contractor, in an effort to expedite the process and meet
the pressure of the concrete placement schedule, may detail from the original drawings
and deal with the changes as they arise through each of the back-checks. This creates
rework for the detailers, fabricators, and installers. The model simulates this scenario by
allowing rework to occur at each of the phases.
Table 4-1 shows the input parameters used for an iteration of the model. It
describes that there are 4,500 T (10,000 lbs) of material that must be completed. Rework
has been set to zero percent, which means that as each piece of resource flows through
the decision fork, none of the material will be required to be reworked. The model user
can easily reset this parameter to study the impact of different degrees of rework. It is
important to note that in this model, an item is only reworked once and then allowed to
continue (a more complex model could be developed to include repeated cycling). The
model allows you to input how many personnel are available to accomplish each stage of
work in detailing, fabrication, and installation. It also allows you to determine how many
workers are needed to accomplish each work package; in this scenario one worker is
required at each stage. Finally, the model allows the user to vary the batch size at each
stage. When batch size increases, the modeler must also change the time in each of the
production activities, otherwise, it appears that workers can accomplish more work items
per unit time.

145
Table 4-1 Model Input Parameters (No Rework)
In the detailing phase (figure 4-5), the first queue holds the total amount of
material needed for the project. The work flows into a Combi called detailing and then
one worker is drawn from a pool of workers and the item is detailed. The work then flows
into a decision fork to determine if the item passes a quality check or has to be reworked.
If the item passes, the work package flows into the able to fabricate queue. If it has to be
reworked it flows into a Combi that draws from the available manpower and completes
the rework.
This framework is replicated in the stages of fabrication and installation as shown
in figure 4-5. However, items requiring rework in site installation have to be re-
fabricated, so the item returns back to fabrication and once completed it is shipped back
to the site for installation.
4.6 Analysis and Results
A line of balance chart shows the relative speeds of these sub-processes. Steep lines
represent fast processes. Less steep lines represent slower processes. The horizontal
distance between the top of a line to the bottom of the next line represents the relative
delay to the start of the following process. Large distances represent longer delays while
shorter ones represent processes that start right after each other.

146
Figure 4-6 shows a line of balance of the data collected from the model. It has
four scenarios: (1) no rework (ideal situation), (2) 10% rework in each phase, (3) 20%
rework in installation only, and (4) 30% rework in installation only. Scenarios (3) and
(4) represent the paradigm of pushing changes to the installation phase.
0%
20%
40%
60%
80%
100%
0 200 400 600 800 1000 1200
Hours
Perc
ent C
ompl
ete
Detailing no reworkFabrication no reworkInstallation no reworkDetailing 10%Fabrication 10%Installation 10%Installation 20%Installation 30%
Detailing Fabrication Installation
Delay
0%
20%
40%
60%
80%
100%
0 200 400 600 800 1000 1200
Hours
Perc
ent C
ompl
ete
Detailing no reworkFabrication no reworkInstallation no reworkDetailing 10%Fabrication 10%Installation 10%Installation 20%Installation 30%
Detailing Fabrication Installation
Delay
Figure 4-6 Line of Balance for Detailing, Fabrication, and Installation
In figure 4-6, detailing can occur rapidly if no changes to the design exist and the
team is allowed to go through the entire set of drawings. Fabrication of items is also a
steep line, because once requested, mechanical parts can be produced rapidly. This figure
also shows that the detailing and fabrication phases could be delayed and do not affect
the start of installation. Installation, however, is a less steep line in comparison to
detailing and installation.
The concept the mechanical contractor implemented was to wait to work on the
changes which reduced variation. The cost of rework, then, can be revealed through
modelling as shown by the two vertical lines in figure 4-6. One line at 1,000 hours, the
other at 1,150 hours, translates into dollars by multiplying the difference, 150 hours by an
hourly labor rate. Assuming the man hour rate is 65 $/hr, the cost of change is $9,750.

147
I developed a discrete event simulation model that begins to quantify process
costs of rework in construction and highlights the need to improve process management
on projects. This research shows that it can be more efficient to let changes occur at site
installation and avoid them in the detailing and fabrication phases, especially when a
traditional contract and risk-and-reward system are being used. In the absence of final
design drawings, mechanical contractors can follow the process described in this chapter
as a way to reduce variation.
4.7 Limitations
Three limitations are identified for workflow research of a mechanical subcontractor.
1. The case study is of only one mechanical subcontractor and may not be representative
of the entire population of mechanical contractors dealing with healthcare facility
construction in northern California.
2. Data is representative of a generic resource. No distinction was made for different
types of mechanical work that is produced by the contractor.
3. The rework cycle for each of the phases is allowed to occur only once. Also, the
rework cycle is not dynamic; it is a static percentage when evaluating each piece of
work for rework. However, this situation is addressed in chapter 5.
4.8 Section Acknowledgments
This work was funded in part by industry contributions made in support of the Project
Production Systems Laboratory at U.C. Berkeley. All support is gratefully appreciated.

148
5. UNDERSTANDING DEMAND AND CAPACITY USING
SIMULATION
5.1 Section Abstract
The purpose of this section is to illustrate the complexity that rework adds to a simple
production process. The production process includes an initial review activity, a decision
fork, and a re-review activity. Simulation models show the impact of rework on this
simple production process and how it affects the time to permit. I discuss three models in
this section: (1) a simulation model where rework is allowed to occur only once, (2) a
simulation model where rework is allowed to occur three times, and (3) a simulation
model where rework is allowed to occur indefinitely. For one rework cycle, to stabilize
the simulation stabilizes two review resources are required for the entire range of the
likelihood of rework. For multiple rework cycles, the number of resources required to
stabilize the system increases dramatically. While for three rework cycles, the resources
required to stabilize the system lies in between. This section illustrates the trade-off
between stabilizing the system and the amount of rework that occurs within the system.
The simulation models also illustrate that the increase in rework requires substantially
more review resources to stabilize the system.
5.2 Background and Scope
This chapter describes the model of a simple production system developed to illustrate
the complexity that rework adds to production systems. The model shows a state
permitting agency receiving projects and reviewing them. If errors are detected, rework is

149
necessary, if not, the projects are approved. This model is to provide intuition on how
rework affects a production system. A more complex and applied case study that expands
on the simple model discussed here is presented in chapter 6.
5.3 Simulation of One Rework Cycle
Figure 5-1 shows a simple production system, that models project reviews. Projects enter
the review process at a constant rate of one per day. All projects are identical in nature.
Once in the system, a reviewer conducts the Initial Review. Once this activity is
complete, the project moves into a decision node to determine if rework is required. If
rework is not required, the projects flow into the Complete queue. If rework is required,
the projects flow into the Re-Review activity. Once there, the Re-Review activity takes
priority over the Initial Review activity and when available, a review resource re-reviews
the projects. Upon completion, the projects flow into the Complete queue. This
simulation allows only one rework cycle to occur.
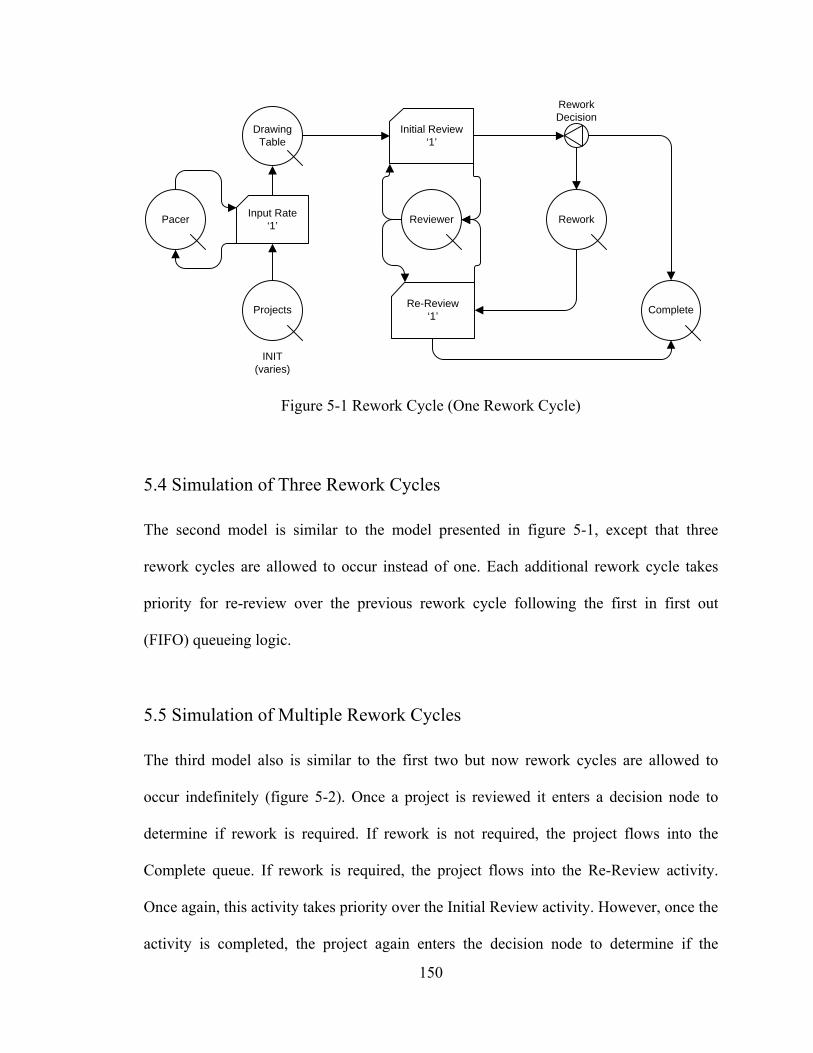
150
Projects
Input Rate‘1’
Drawing Table
Initial Review‘1’
Reviewer
Complete
Rework
Rework Decision
Re-Review‘1’
INIT (varies)
Pacer
Figure 5-1 Rework Cycle (One Rework Cycle)
5.4 Simulation of Three Rework Cycles
The second model is similar to the model presented in figure 5-1, except that three
rework cycles are allowed to occur instead of one. Each additional rework cycle takes
priority for re-review over the previous rework cycle following the first in first out
(FIFO) queueing logic.
5.5 Simulation of Multiple Rework Cycles
The third model also is similar to the first two but now rework cycles are allowed to
occur indefinitely (figure 5-2). Once a project is reviewed it enters a decision node to
determine if rework is required. If rework is not required, the project flows into the
Complete queue. If rework is required, the project flows into the Re-Review activity.
Once again, this activity takes priority over the Initial Review activity. However, once the
activity is completed, the project again enters the decision node to determine if the

151
project requires rework. In this simulation, the percentage of rework assigned to the
Rework Decision does not change.
Projects
Input Rate‘1’
Drawing Table
Initial Review‘1’
Reviewer
Complete
Rework
Rework Decision
Re-Review‘1’
INIT (varies)
Pacer
Figure 5-2 Basic Rework (Multiple Rework Cycles)

152
5.5 Demand and Capacity Analysis
Figure 5-3 shows output for one rework cycle. It shows the Drawing Table queue size
versus time. In this example, with one rework cycle and 100% rework, each project
requires two days to travel through the system. If only one reviewer is available, the
Drawing Table queue increases by one every two days. Therefore, with an inflow of 1
project per day to the Drawing Table, the resulting Drawing Table queue size will be 500
after 1,000 days.
0
100
200
300
400
500
600
0 200 400 600 800 1000Time (days)
Que
ue S
ize
100% Rework50% Rework10% Rework
Figure 5-3 Drawing Table Queue vs. Time (One Rework Cycle)

153
Figure 5-4 shows the Drawing Table queue size versus time for multiple rework
cycles. As rework approaches 100%, the Drawing Table queue size will grow by one
each day. This occurs because projects remain in the system almost indefinitely and
therefore, the queue will grow at the same rate as the inflow of projects, which in this
situation is one project per day.
0
200
400
600
800
1000
1200
0 200 400 600 800 1000Time
Que
ue S
ize
99% Rework50% Rework10% Rework
Figure 5-4 Drawing Table Queue vs. Time (Multiple Rework Cycles)

154
Figure 5-5 shows lead time to complete project review versus Drawing Table
queue size for one rework cycle. It shows similar information as figure 5-3. As the
Drawing Table queue size increases, the time for a project to proceed through the system
also increases. For example for a scenario of 100% rework, the lead time for each project
increases by two days for each addition to the queue. The 50% and 10% lines are
truncated because the simulation time is the same for each scenario. The truncation of the
50% and 10% lines show the lead time for completion at the end of the simulation time.
0
200
400
600
800
1000
1200
0 100 200 300 400 500Queue
Lead
Tim
e (d
ays)
100% Rework50% Rework10% Rework
Figure 5-5 Lead Time to Complete Project Review vs. Drawing Table Queue (One
Rework Cycle)

155
Figure 5-6 shows the lead time to complete project review versus Drawing Table
queue size for multiple rework cycles. Due to the large differences in lead times, the y-
axis is converted to a logarithmic scale to show the different rates of increase to lead time
due to the rework rate. As the likelihood of rework approaches 100%, the lead time
grows significantly, again, because projects remain in the system indefinitely.
1
10
100
1000
10000
100000
0 200 400 600 800 1000Queue Size
Lead
Tim
e (d
ays)
99% Rework50% Rework10% Rework
Figure 5-6 Lead Time to Complete Project Review vs. Drawing Table Queue Size
(Multiple Rework Cycles)

156
Figure 5-7 shows the lead time to complete project review versus simulation time.
For one rework cycle, the increase in time is linear and the maximum rate of lead time
increase is limited by the inflow of projects. This means that for 100% rework, the lead
time increases by one day with each additional day that passes.
0
200
400
600
800
1000
1200
0 200 400 600 800 1000Time
Lead
Tim
e (d
ays)
100% Rework50% Rework10% Rework
Figure 5-7 Lead Time to Complete Project Review vs. Simulation Time (One Rework
Cycle)
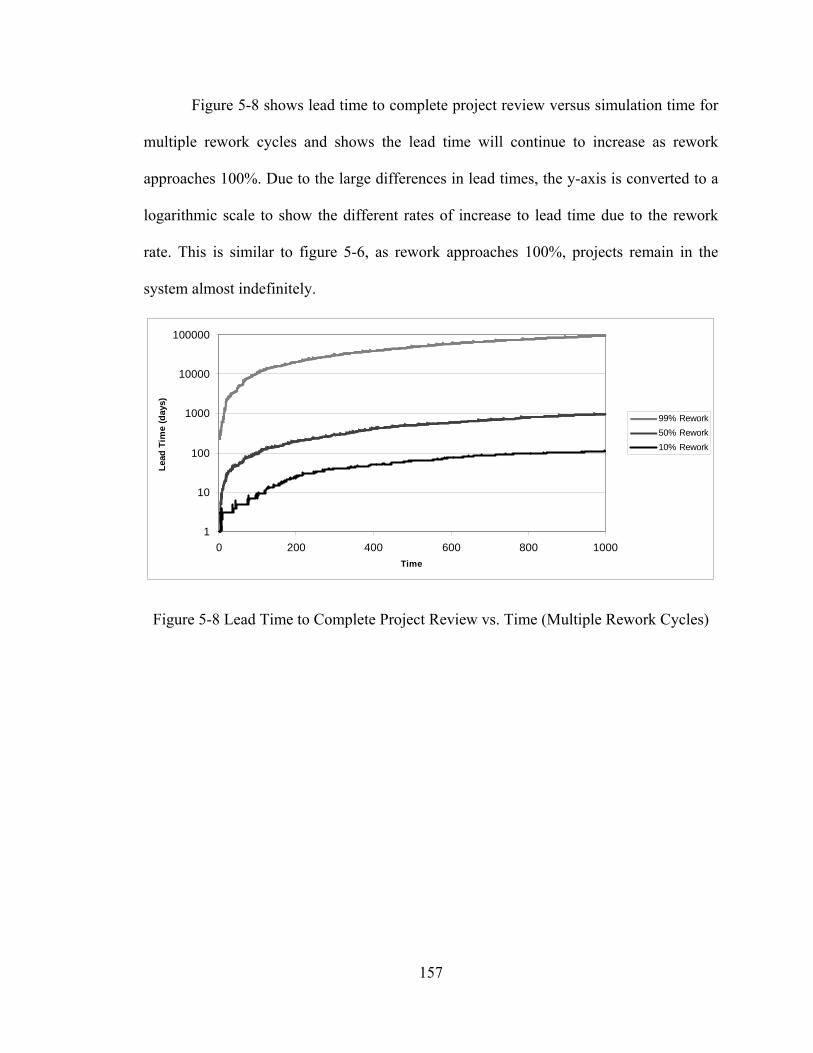
157
Figure 5-8 shows lead time to complete project review versus simulation time for
multiple rework cycles and shows the lead time will continue to increase as rework
approaches 100%. Due to the large differences in lead times, the y-axis is converted to a
logarithmic scale to show the different rates of increase to lead time due to the rework
rate. This is similar to figure 5-6, as rework approaches 100%, projects remain in the
system almost indefinitely.
1
10
100
1000
10000
100000
0 200 400 600 800 1000Time
Lead
Tim
e (d
ays)
99% Rework50% Rework10% Rework
Figure 5-8 Lead Time to Complete Project Review vs. Time (Multiple Rework Cycles)

158
5.6 Resource Stabilization Analysis
Figure 5-9 shows the resources required to stabilize the system when rework is allowed to
occur indefinitely. A stabilized system is defined here as one in which the queue size and
lead time do not grow indefinitely over time: it remains in control when enough resources
are allocated to offset the increase in the likelihood of rework. On the x-axis is the
likelihood of rework, on the y-axis, the number of review resources required to stabilize
the number in the Drawing Table queue and lead time to complete project review. Figure
5-9 shows that the number of resources dramatically increases as the likelihood of rework
approaches 100%.
0
20
40
60
80
100
0 10 20 30 40 50 60 70 80 90 99Likelihood of Rework (%)
Res
ourc
es R
equi
red
to S
tabi
lize
Que
ue
Figure 5-9 Resources to Stabilize System (Multiple Rework Cycles)

159
Figure 5-10 shows the number of resources required to stabilize the system for
one, three, and multiple rework cycles up to 90% rework. For one rework cycle, only two
resources are required to stabilize the system for any likelihood of rework. For multiple
rework cycles, the number of required resources increases dramatically when the
likelihood of rework increases. For three rework cycles, the number of resources required
falls in between, which is an expected outcome.
0
2
4
6
8
10
12
0 10 20 30 40 50 60 70 80 90
Likelihood of Rework (%)
Res
ourc
es R
equi
red
to S
tabi
lize
Que
ue
One Rework CycleThree Rework CyclesMultiple Rework Cycles
Figure 5-10 Resources to Stabilize System (Multiple Rework Cycles)

160
Figure 5-11 shows an example of what queue stabilization resembles for 80%
rework, 3 reviewers, and 3 rework cycles. It shows that the queue size does vary over
time, ranging between 0 and 15 projects.
0
5
10
15
20
25
0 100 200 300 400 500 600 700 800 900 1000
Time (days)
Que
ue S
ize
Figure 5-11 Queue Stabilization (80% Rework, 3 Reviewers, 3 Rework Cycles)
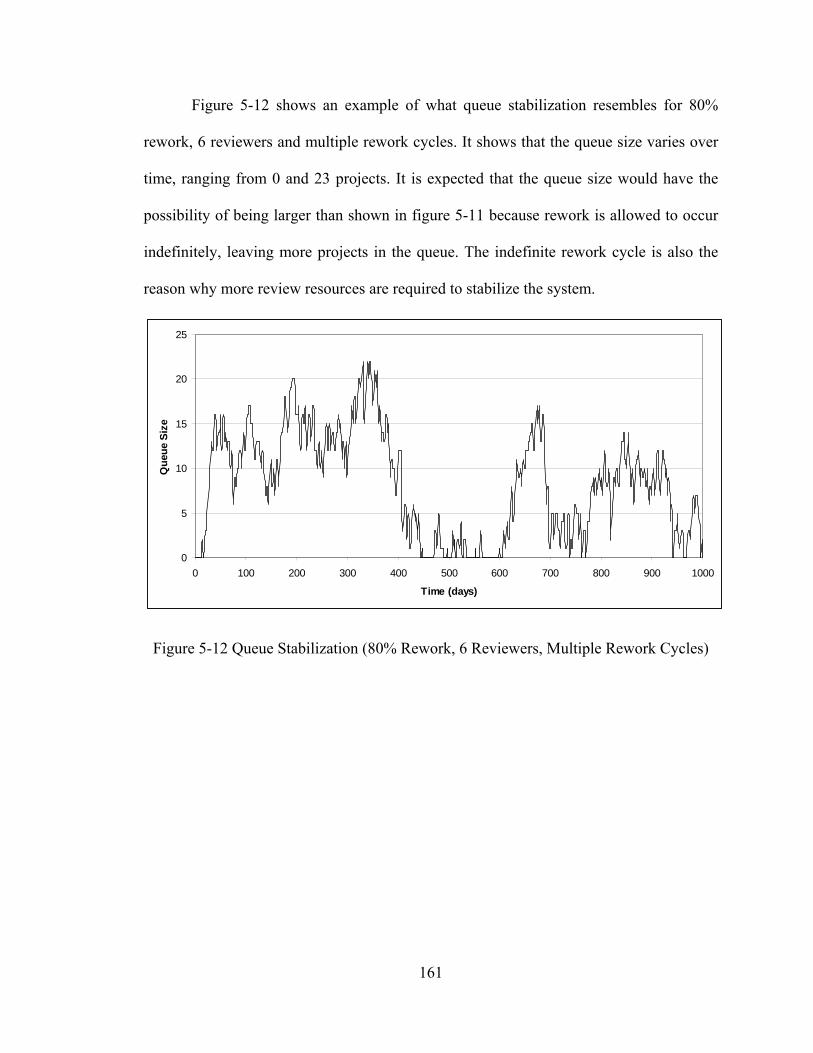
161
Figure 5-12 shows an example of what queue stabilization resembles for 80%
rework, 6 reviewers and multiple rework cycles. It shows that the queue size varies over
time, ranging from 0 and 23 projects. It is expected that the queue size would have the
possibility of being larger than shown in figure 5-11 because rework is allowed to occur
indefinitely, leaving more projects in the queue. The indefinite rework cycle is also the
reason why more review resources are required to stabilize the system.
0
5
10
15
20
25
0 100 200 300 400 500 600 700 800 900 1000
Time (days)
Que
ue S
ize
Figure 5-12 Queue Stabilization (80% Rework, 6 Reviewers, Multiple Rework Cycles)

162
Figures 5-13 to 5-16 illustrate the impact that small increases in resource capacity
can have on queue size and lead time. Figures 5-13 and 5-14 show the queue size versus
time for a series of 30 computer simulations. The middle line in each figure represents the
mean queue size over time. The dark lines above and below the mean line represent one
standard deviation. It shows that with five resources, the queue size continues to grow.
However, figure 5-14 shows that by adding one resource, totaling six resources, the
queue size stabilizes between two and four.
0
10
20
30
40
50
0 200 400 600 800 1000Time (days)
Que
ue S
ize
+1 SDMean-1 SD
Figure 5-13 Queue Stabilization (80% Rework, 5 Reviewers, Multiple Rework Cycles,
30 Iterations)
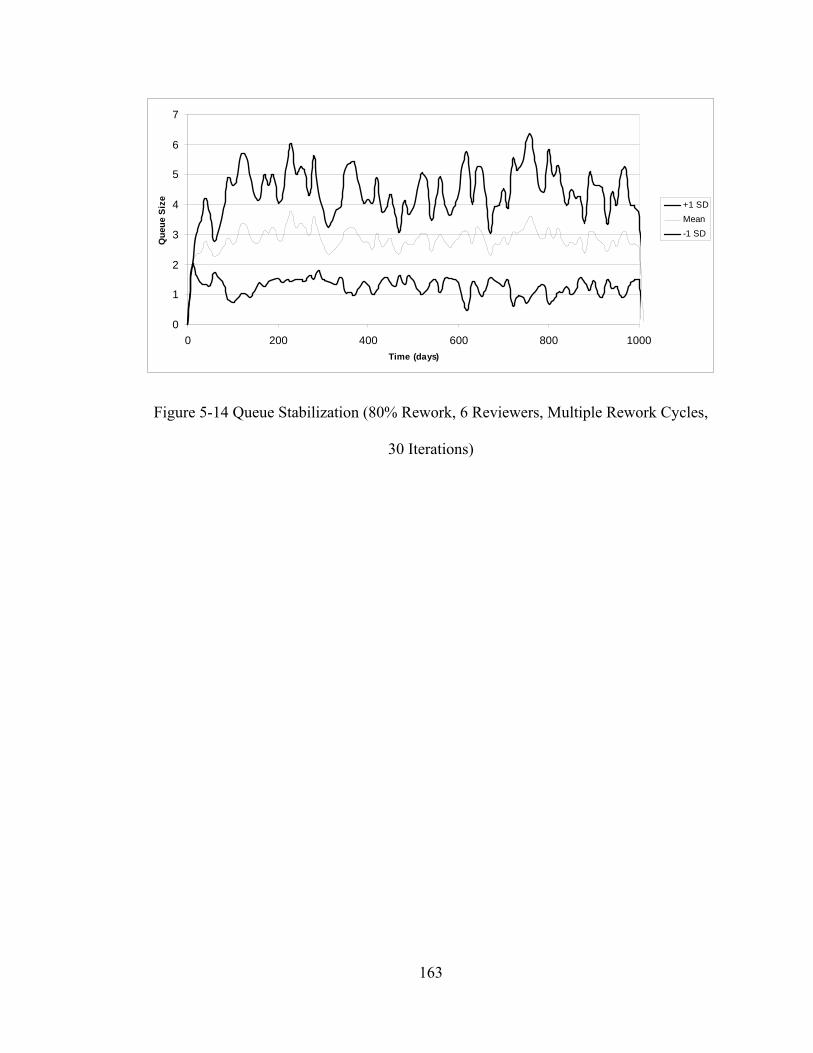
163
0
1
2
3
4
5
6
7
0 200 400 600 800 1000Time (days)
Que
ue S
ize
+1 SDMean-1 SD
Figure 5-14 Queue Stabilization (80% Rework, 6 Reviewers, Multiple Rework Cycles,
30 Iterations)

164
Figures 5-15 and 5-16 show the lead time versus time for a series of 30 computer
simulations. The middle line in each figure represents the mean lead time over time. The
dark lines above and below the mean line represent one standard deviation. It shows that
with five resources, the lead time continues to grow. However, figure 5-16 shows that by
adding one resource, totaling six resources, the lead time stabilizes between six and eight
days.
0
10
20
30
40
50
60
0 200 400 600 800 1000Time (days)
Lead
Tim
e (d
ays)
+1 SDMean-1 SD
Figure 5-15 Lead Time (80% Rework, 5 Reviewers, Multiple Rework Cycles,
30 Iterations)

165
0
2
4
6
8
10
12
14
0 200 400 600 800 1000Time (days)
Lead
Tim
e (d
ays)
+1 SDMean-1 SD
Figure 5-16 Lead Time (80% Rework, 6 Reviewers, Multiple Rework Cycles,
30 Iterations)
The production system illustrated in this chapter has three controllable throttles:
(1) inflow of projects, (2) the number of review resources, and (3) the likelihood of
rework. The first throttle of incoming projects is more difficult to control than the other
two throttles. A major influence on the inflow of projects is political legislation. For
example in California, legislation exists which requires healthcare facilities meet seismic
upgrade requirements by 2030. To meet this requirement many hospitals have to be
renovated or reconstructed which increases the number of projects submitted for state
permits.
It is difficult to change legislation requiring stricter building codes because their
requirements stem from failure situations. As mentioned in section 2.6, the role of
OSHPD evolved over time. After a few healthcare facilities failed during seismic events,
it was determined that the state government should play a larger role in regulating their
design and construction.

166
On one hand the general public demands healthcare facilities remain open after a
seismic event. On the other hand, the general public demands affordable healthcare.
Therefore we must strike a balance between a technologically advanced healthcare
facility and the cost to construct the facility. A facility can be constructed to meet higher
seismic requirements; however, the cost to build that facility may make it infeasible. A
complex situation arises between what the owner can expect to receive from providing a
service and the funds they can allocate to construct those services. If this balance is not
made, the facility may never be built or the healthcare provider will lose money.
It is also difficult to change legislation because it takes a long time to convince
people a change is required. This is particularly true for legislation that deals with the
safety of the general population. It is hard to convince a person that a healthcare provider
should be given more time to upgrade their facilities to meet seismic requirements
because the general population sees that as a cost of doing business in a state that
experiences large seismic events. The majority of people in California accept that
earthquakes happen and that an important buildings such as a healthcare facility need to
remain operational after a seismic event. Therefore, legislation that would ease the
seismic requirement for California healthcare providers would not be politically
supported.
The second throttle on the system is the amount of resources the state permitting
agency can dedicate to the review of incoming projects. The amount of resources
available to any state review agency is limited, but knowing the limits on this resource is
helpful to determine the impact when increasing review resources. However, it is possible
for a state agency to reorganize the organization in a way to best utilize the available

167
resources. For example, the review agency could provide training to industry engineers
on the proper way to design and submit healthcare design projects. This upfront
investment of time could improve the review process because the industry engineers
would know the expectations of the reviewers.
The third throttle on the system is the likelihood of rework. This throttle can be
controlled by providing higher quality drawings to the review agency. When this occurs
the time to permit becomes more predictable for the owner and design team. If system
performance is improved, who should pay for the added costs? In California, healthcare
owners must pay for their projects to be reviewed. The cost is based on the total
estimated construction cost. Once the review agency receives the funds, they decide how
the funds will be expended. In their current system, the funds are spent to review the
project in its entirety. However, it is possible to involve the review agency earlier. This
early involvement process includes all the discipline engineers to eliminate errors that
occur early in design. This entire review process becomes more complex as additional
reviewers are added with different types of project sizes. This situation is explored in
chapter 6.

168
6. CASE STUDY II: EFFECT OF ALTERNATIVE REVIEW ON
WORKFLOW
6.1 Section Abstract
The purpose of the research presented here is to describe workflow through an
organization that reviews submissions for building permit approval and understand the
effect of an alternative review process on the time to permit assuming a certain level of
staffing conducting the review. A ‘normal’ review process starts upon submission of a
complete set of project drawings. The alternative review process that is considered here
engages the state review agency early in reviewing the design with the owner, architect,
engineer, and contractor.
I obtained data from a state permitting agency and developed a simulation model
of an alternative review process to evaluate the disruption rework causes on the
permitting approval process. This simulation model shows that incorporating the
alternative review process considered can shorten the overall time to permit a healthcare
facility. This alternative review process shifts the design and permitting curve, reducing
the time to permit, while increasing the workload up-front. This research recognizes that
such an alternative review process does not suit all projects, and that permitting agencies
who adopt it must judiciously decide how to staff their organization to support process
implementation.
This research uses data obtained from OSHPD to construct and test a current-state
model of the organization. The model has been validated through in depth interviews
with senior members of OSHPD. This research is limited to the California healthcare

169
facility industry and to a data set acquired from OSHPD that contains data from July
2005 to July 2007 for all Facilities Development Division geographic regions. The
findings are not compared to healthcare facility permitting agencies in other states and
the adoption of the alternative review processes by OSHPD is outside the scope of this
research.
A current state model of how healthcare facility projects “flow” through OSHPD
for approval is developed using a portion of OSHPD’s data. This model shows how plan
review for permitting of a project flows through the architect, mechanical, electrical,
structural and fire and life safety engineers. This current state model provides a
foundation to study an alternative review process and its effect on workflow through
OSHPD. This study does not simulate the construction and field review portion of the
process. During the construction of a healthcare facility in California, government review
is necessary to verify building codes are followed. The actions to accomplish this
simulation are further elaborated on in the methodology section.
Modeling OSHPD processes reveals how rework affects the overall time to permit
a healthcare facility design. For OSHPD, rework (or back checks as they are called within
the industry), affects how long it takes a project to process through the plan review cycle.
The research presented here shows a process that can improve the time to approve
healthcare facility designs. Further framing of the organization and the boundaries of this
research are presented in the next section.

170
6.2 Background and Scope
This research uses Lean production theory as a foundation to establish an alternative way
of permitting healthcare facility designs. As mentioned in section 2.6, the OSHPD
process is the focus of this section. I developed a computer simulation to model the time
to permit drawings through OSHPD and I evaluated an alternative process to determine
the reduction in permitting time.
6.3 Methodology
I used qualitative sampling by selecting OSHPD because it is the only state agency in
California that permits healthcare facilities. In-depth interviews were conducted to
understand how the current organization operates. I used quantitative methods to analyze
existing operational data and then I developed a discrete event simulation model. This
model allows us to understand changes in the existing system. I used in-depth interviews
with members of OSHPD to qualitatively validate simulation findings.
I used discrete event simulation as the modeling engine. Discrete event
simulations are well suited for this type of research because individual handoff events of
information can be determined. An analytical model was not chosen because it is not well
suited to process information that may not have similar units of measure. A numerical
model was not chosen because distinct equations could not capture the dynamic nature of
this research.
California healthcare facilities were chosen as a good example of how rework can
affect the productivity of design and construction because they are complex facilities that
require all engineering disciplines to participate in the process. Second, many

171
stakeholders are involved with decision making during the course of facility
development. Third, healthcare facility design and construction requires extensive
government involvement to deliver the facility. These three parts are why healthcare
facility construction is so complex and that the findings from this research are applicable
to less complex construction projects.
6.4 What is Alternative Review?
An alternative form of review is to involve major stakeholders in facility procurement as
early as possible in order to avoid the generation of non-code-compliant designs. A
critical piece to accomplishing this process is for the team to acquire common
understanding of the project scope, objectives, value proposition, etc. Common
understanding stems from creating shared meanings through communication or collective
experiences. Makela (2002) characterized common understanding as comprising of five
elements: (1) shared ways of thinking, (2) shared ways of operating, (3) shared
knowledge, (4) shared goals, and (5) trust.
On projects, common understanding occurs in two ways depending on project
delivery (Lichtig 2008). In reference to facility construction projects, figure 6-1
represents traditional project delivery. Here the owner selects the architect early; they
produce a concept or schematic design for the facility that is approved by the owner.
Engineers are then hired to design the foundation, structural system, mechanical-,
electrical- and fire, life, safety systems in the course design development. During this
time, the common understanding of the facility increases among those involved in
designing thus far. As this occurs, the owner brings on a construction management team

172
or general contractor that will execute facility construction to get familiar with the design.
Then, in the instance of healthcare facilities, once the design drawings are completed,
they are submitted to FDD for review. During this time, major trade contractors may be
hired to contribute to the creation of the contract documents. As this occurs the common
understanding of the facility among project participants’ approaches 100%.
Com
mon
Und
erst
andi
ng
Pre-Construction Services
≤100%
SD DD CDTime
Architect Hired
Engineers Hired
CM/GC Hired
Major Trades Hired
Construction
Government Review
Figure 6-1 Level of Common Understanding Developed During Traditional Project
Delivery (Modified from Lichtig 2008)
In contrast, figure 6-2 represents the integrated project delivery approach. Here
the common understanding among project participants increases dramatically early on
because the architect and construction manager or general contractor are hired early onto
the project. In addition, engineers, major trade contractors, and government agencies are
brought in early as well. This project delivery system has many benefits such as less
rework, involvement of downstream players in upstream decisions, and better cost
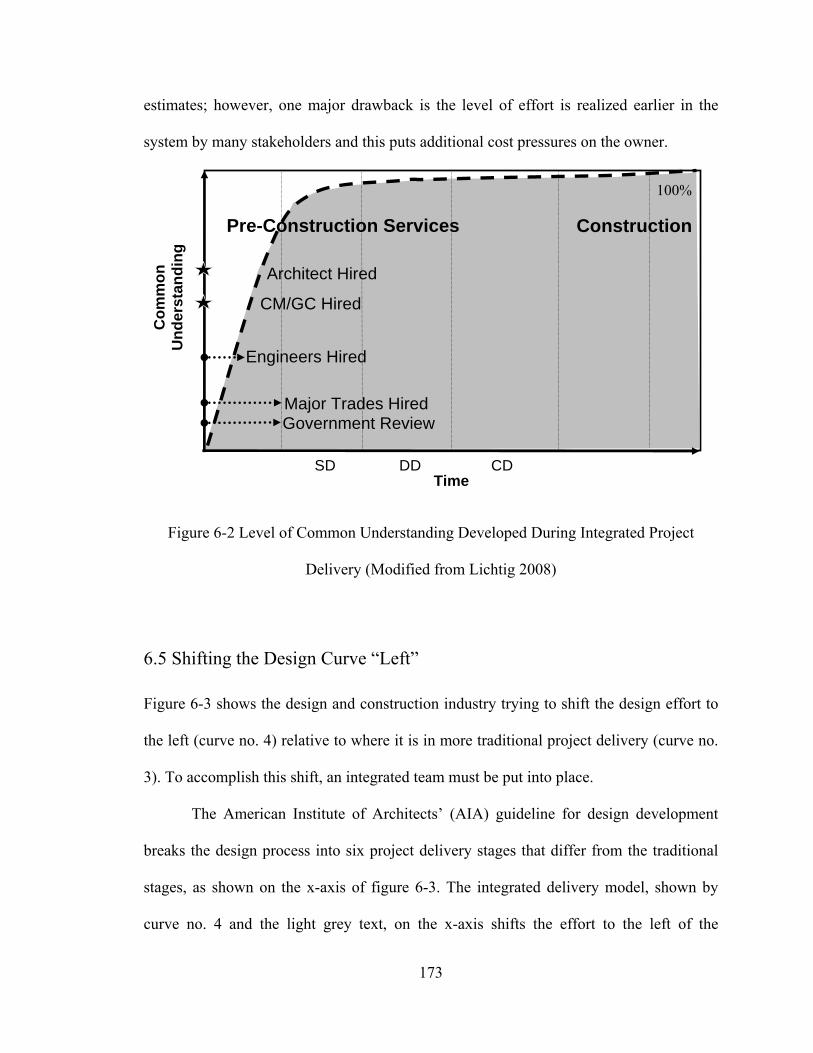
173
estimates; however, one major drawback is the level of effort is realized earlier in the
system by many stakeholders and this puts additional cost pressures on the owner.
Time
Com
mon
Und
erst
andi
ng
CM/GC Hired
Construction
Architect Hired
Engineers Hired
100%
Major Trades Hired
Pre-Construction Services
TimeSD DD CD
Government Review
Figure 6-2 Level of Common Understanding Developed During Integrated Project
Delivery (Modified from Lichtig 2008)
6.5 Shifting the Design Curve “Left”
Figure 6-3 shows the design and construction industry trying to shift the design effort to
the left (curve no. 4) relative to where it is in more traditional project delivery (curve no.
3). To accomplish this shift, an integrated team must be put into place.
The American Institute of Architects’ (AIA) guideline for design development
breaks the design process into six project delivery stages that differ from the traditional
stages, as shown on the x-axis of figure 6-3. The integrated delivery model, shown by
curve no. 4 and the light grey text, on the x-axis shifts the effort to the left of the
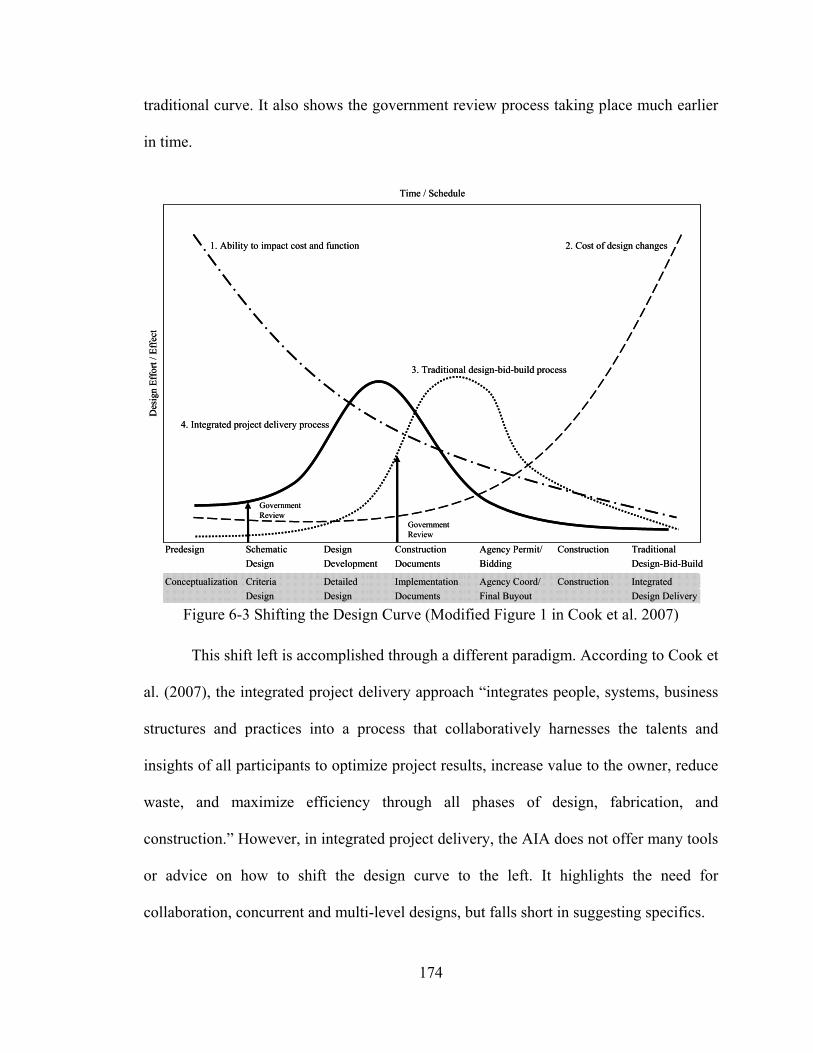
174
traditional curve. It also shows the government review process taking place much earlier
in time.
Time / Schedule
Des
ign
Effo
rt / E
ffec
t
Government Review
Government Review
1. Ability to impact cost and function 2. Cost of design changes
4. Integrated project delivery process
3. Traditional design-bid-build process
Predesign SchematicDesign
DesignDevelopment
ConstructionDocuments
Agency Permit/Bidding
Construction Traditional Design-Bid-Build
Conceptualization CriteriaDesign
DetailedDesign
ImplementationDocuments
Agency Coord/Final Buyout
Construction Integrated Design Delivery
Figure 6-3 Shifting the Design Curve (Modified Figure 1 in Cook et al. 2007)
This shift left is accomplished through a different paradigm. According to Cook et
al. (2007), the integrated project delivery approach “integrates people, systems, business
structures and practices into a process that collaboratively harnesses the talents and
insights of all participants to optimize project results, increase value to the owner, reduce
waste, and maximize efficiency through all phases of design, fabrication, and
construction.” However, in integrated project delivery, the AIA does not offer many tools
or advice on how to shift the design curve to the left. It highlights the need for
collaboration, concurrent and multi-level designs, but falls short in suggesting specifics.

175
In contrast, this research, inline with the integrated form of agreement (IFOA),
promotes the need for the Last Planner System™, reverse phase scheduling, target value
design, built in quality, and work structuring. These techniques provide a basic
framework for how owners, architects, designers, and contractors should interact with
each other. The Last Planner System™ provides a framework to increase workflow
predictability and provides simple to use metrics. Reverse phase scheduling provides a
framework for working backwards from required milestones but more importantly to get
all required stakeholders to buy into the schedule of deliverables and to understand
handoffs between them. Target value design provides a framework to understand the
costs involved with designing a facility. Built in quality provides a framework to develop
processes that eliminate negative rework from facility design and construction. Work
structuring provides a framework to think about how product and process fit together to
ensure parts used in design are easily integrated into construction.
Table 6-1 shows the differences between traditional-, integrated-, and lean project
delivery on various topics.

176
Category Traditional Project Delivery
Integrated Project Delivery
Lean Project Delivery
Teams Fragmented, assembled on “just-as-needed” or “minimum-necessary” basis, strongly hierarchical, controlled
An integrated team entity composed key project stakeholders, assembled early in the process, open, collaborative
An integrated team, assembled early, openly share information and cooperatively collaborate
Process Linear, distinct, segregated; knowledge gathered “just-as-needed”; information hoarded; silos of knowledge and expertise
Concurrent and multi-level; early contributions of knowledge and expertise; information openly shared; stakeholder trust and respect
Concurrent, multi-level and interdisciplinary; use of Last Planner SystemTM, target value design, and built in quality, work structuring
Risk Individually managed, transferred to the greatest extent possible
Collectively managed, appropriately shared
Collectively managed / shared allocation of contingency funds
Compensation & reward
Individually pursued; minimum effort for maximum return; (usually) first-cost based
Team success tied to project success; value-based
Team success tied to project success; value-based
Communications & technology
Paper-based, two- dimensional; analog
Digitally based, virtual; Building Information Modeling (BIM) (3, 4 and 5 dimensional)
Digitally based, virtual; BIM (3, 4 & 5 dimensional), core group development and decision matrix
Agreements Encourage unilateral effort; allocate and transfer risk; no sharing
Encourage, foster, promote and support multi-lateral open sharing and collaboration; risk sharing
Require, encourage, foster, promote and support multi-lateral open sharing and collaboration; risk sharing
Table 6-1 Traditional vs. Integrated vs. Lean Project Delivery (modified from Cook et al.
2007, Lichtig 2005)
How are the concepts of lean project delivery as described in table 6-1
implemented into an alternative review process? As previously mentioned, the FDD
177
reviews design drawings in three ways: (1) ’100%’ contract drawings, (2) ‘phased’ and,
(3) ’partial permits’. What is missing from these three processes is the early involvement
of the plan reviewers to avoid the embedding of errors. These three processes place the
plan reviewers in purely a reactive manner in which the plan checkers receive drawings
and react by catching errors. This has created a culture where the government reviewers
have become part of the quality control process. This is counter to the culture of lean
where, the intent is to develop products without defects. On the one hand, an alternative
review process allows the plan checkers to be interactive to call out concerns about the
design while the process is actually occurring, which is a major reason the design curve
can be shifted to the left. The government reviewers are not required to provide this
input, however, understanding what the reviewers are going to look at and what errors
they tend to catch is a requirement to develop designs without defects.
It is difficult to forecast how a change will affect an organization. Therefore,
making a change in this organization takes time and it will take even more time to
understand the results. Computer simulation is relatively inexpensive and can provide
insight on the effect of change on the organization. This research utilized discrete event
simulation to model the effect of an alternative review process.
6.6 Alternative Review Process
Through my discussion with personnel at all levels in the Facilities Development
Division (FDD) I determined that two discrete event simulation models be developed to
show how different permitting models can affect the throughput of healthcare facility
permitting. The first model describes the current state of the organization and the

178
collected data will be used to validate how the entire system behaves. This model will
simulate the permitting process across the seven different geographical divisions that
make up the FDD. The second model simulates the effect early involvement can have on
the time to permit. Early involvement of the governmental plan reviewers (i.e., FDD’s
architects, electrical, mechanical, structural and fire, life, safety engineers) with the
owner, architect, and design engineers can affect the delivery of healthcare facility
permits. Synopses of the two models are shown in table 6-2.
Model Type FDD Review Current state Final contract drawings reviewed by FDD Early involvement Input given on initial assumptions
Table 6-2 Proposed Discrete-Event Simulation Models for OSHPD
This alternative review process differs in at least five ways from existing OSHPD
practice. The first difference is the idea of zero quality control which eliminates
embedded errors early on in the design process by all process stakeholders, to include
FDD personnel, owners, architects, and designers. The second is to involve the structural
reviewers in the siting, blocking and stacking, and fire, life, and safety phases of the
design which occur very early on. The third difference is the involvement of geotechnical
engineers with the design criteria. The fourth is a schedule for design submittals with
defined deliverables and times. The fifth is the ideal of a deal breaker. A deal breaker is a
term used for a project that does not fulfill its promise to the owner and design team.
These differences can occur because the process involves major stakeholders as early as
possible in project delivery in order to accomplish zero quality checks in the design. This
alternative review process reduces downstream rework.

179
6.7 Alternative Review Discrete Event Simulation Model
6.7.1 Model Objectives
The simulation was created to illustrate the concept of an alternative review process of
reviewing and permitting drawings. By creating this simulation, I wanted to understand
the impact of an alternative review process on rework and permitting time. Finally, as the
purpose for all models, I wanted to utilize discrete event simulation for organization
decision making. Two specific questions are posed for this computer simulation. The first
is should we use an alternative review process? If the answer is yes then how much time
can an alternative review process save?
6.7.2 Model Assumptions
Four assumptions were used in developing the computer simulation. The first is the
model developed represents one out of seven plan review regions. All of the plan review
regions have the same organizational layout for how drawings are approved and
permitted within OSHPD. The second is the assumption that all plan reviewers are fully
trained. This was made, because the majority of the personnel that work at the
organization are long time employees of OSHPD. The third assumption is reworked
items have a higher priority than items that have not been reviewed yet. This assumption
was made because that is how the regions process their workflow. Finally, it was
assumed that projects can be reworked indefinitely, which is supported by interviews
from OSHPD personnel.

180
6.7.3 Model Description
Figure 6-4 shows a simple discrete event simulation model that illustrates the review
process for healthcare facility design in California. One part of the model, highlighted
and noted with the number ‘1’ shows the first review process. Drawings are located in the
Drawing Table queue. Review personnel are categorized into five disciplines
representing the (1) Architect, (2) Structural Engineer, (3) Mechanical Engineer,
(4) Electrical Engineer, and (5) Fire, Life, and Safety Engineer. Each personnel queue
contains one individual.

181
1
2
Figure 6-4 Discrete-Event Simulation of Current and Alternative review process
(Model 1)
The personnel queues are associated with discipline review activities. The review
activity times are normally distributed and depend on project size; larger projects have
larger review times. The process of calculating the review times are discussed in section
6.9.6. Project categories, cost range and review strategy are shown in table 6-3.

182
Category Project Cost Range Review Strategy I Less than $50K Traditional Plan Review II Between $50K and $1M Traditional Plan Review III Between $1M and $10M Traditional Plan Review IV Greater than $10M Traditional Plan Review / Partial Plan Review
Table 6-3 Project Categories and Review Strategy
Projects enter the system in random order and are reviewed following a first in
first out (FIFO) scheme. Each project must be reviewed five times, one for each review
discipline and once completed, the project flows into the second part of the simulation
model.
The second part of the model highlighted and noted with the number ‘2’ shows a
dynamic rework cycle. The first part of this cycle is to determine if rework is required.
Each project size has a different chance of being subjected to rework. The process of
calculating rework rates are discussed in section 6.9.5. If the project does require rework
it is placed in the rework queue; otherwise it is placed into the complete queue.
Upon entering the rework queue, the simulation engine randomly determines
which discipline will require re-review. This information is tracked for each individual
project. The project then goes into the owner rework activity. This simulates the drawings
going back to the design team to correct errors. The owner rework time is category
specific. Larger projects require more owner rework time while smaller projects require
less. The duration of owner rework is sampled from a normal distribution.
Upon owner rework completion, the project flows into the resubmit queue
awaiting re-review by the previously determined discipline. The simulation matches the
assigned error with the correct discipline and then draws the appropriate reviewer into the
re-review activity. Upon re-review completion the project re-enters the rework decision
fork again. A project requiring re-review has a higher priority than a first review

183
continuing first in first out, so that projects that have been in the system longer are
completed earlier.
The rework cycle continues until the project is determined to not require rework,
and thus gets approved. The chance of rework decreases with each rework cycle
simulating the improvement of design drawings which is also modeled by Gil (2003).
The means and standard deviations acquired from data collected by OSHPD. I
categorized projects into five categories that represent how OSHPD tracks their projects.
In addition, each project carries a characteristic that determines whether or not it was
reviewed using an alternative review process. Finally, the characterized resource carries
with it saved properties to include how many times it was reviewed and reworked.
Figure 6-5 represents a variation of the review process utilizing a dedicated
rework team. This model increases personnel resources and allows the first review of
projects to continue uninterrupted because rework is handled by another set of review
personnel. One theory utilized within lean production theory is to have one team continue
with production and all subsequent rework is handled by another team. This allows the
production team to continue uninterrupted. One example in construction occurs with duct
work installation. One team is dedicated to duct work installation and is not required to
perform rework. Then, if rework is required, another team is assigned to accomplish the
rework tasks. Uninterrupted workflow increases productivity because the installation
team does not have to breakdown work areas and reset them up to conduct rework in
parts of the facility that have been completed. This duct work installation process
increases productivity, decreases setup times and increases in motivation. Setup times are
decreased because a substantial amount of transportation and installation of scaffolding is

184
required for ductwork. Once setup, it is difficult to take down and slows down
production. Increased motivation occurs, because the workers can see their progress and
feel that more is being accomplished. Workers are de-motivated by negative rework. If
negative rework exists that must be addressed, a separate team that is not familiar with
the work of the first team is then used to correct negative rework. This rework team can
then see the work in front of them as another production line. However, following this
duct work installation process may not provide the appropriate level of continuity to the
rework team. They may not know what deviations may have been completed by the
installation team.
In the plan review scenario the benefits of the process is increased productivity.
Increased productivity occurs because a review team concentrates on looking at all of the
drawings to complete the first review. Subsequent changes to drawings are then only
reviewed by the rework team. The downside to this process, like the one mentioned
earlier is the continuity of the information. For example, the rework team may not be
familiar or understand what changes are needed to the drawings.

185
1
2
1
2
Figure 6-5 Discrete-Event Simulation of Current and Alternative Review Process
Utilizing a Dedicated Rework Team (Model 2)
6.8 Methods
The following methods were used to develop and understand the presented discrete event
simulation models:
1. Database analysis

186
2. Resampling
3. Discrete event simulation programming engine
4. Computer model output analysis
6.8.1 Database Analysis
The database obtained from the FDD had been constructed using Microsoft Structured
Query Language (SQL). The database contained over 100,000 points of information and
was linked by five primary tables. This database was exported into Microsoft Access and
analyzed using queries. Multiple queries were developed to determine mean times of
review and re-review, the number and size of project categories and the rate of rework
occurrences. Further description of the analysis is found in section 6.9.6.
6.8.2 Discrete Event Simulation
STROBOSCOPE is the computer language used to develop the discrete event simulation
model of FDD current and future review processes. The computer language was tailored
and written to accommodate a number of processing realities. More specifics on the use
of the computer language are in section 6.9. The models’ computer code is located in
appendix C.
6.8.3 Computer Model Output Analysis
Data obtained from the simulation model was imported into Microsoft Excel to build a
text file that was used to run resampling statistics using a free educational software called
R. R output is used to construct normal distributions of mean time to permit, standard

187
deviations, and instances of rework occurrences. This information was used to analyze
the changes to the mean time to permit using different input scenarios and stability of the
system due to those changes.
6.8.4 Resampling
Resampling generates additional data points using simulation. Two types of resampling
exist; (1) jackknife and (2) bootstrapping. Jackknife uses subsets of available data to
obtain sample statistics. Bootstrapping samples from a data set with replacement and then
creates sample statistics from the new data sets. Bootstrapping is the technique employed
in this research to create first review and re-review activity times within the discrete
event simulation. The technique is used to determine the mean time to permit for the
sensitivity analysis simulation scenarios.
6.9 Calibrating the Model
Calibrating a simulation model to real-world data is essential. This ensures that changes
to simulation inputs will provide realistic system behavior. The discrete event simulation
model was calibrated to existing data in seven steps:
1. Loading the system
2. The rework decision
3. Assigning rework
4. Matching problem
5. The rework rate
6. Determining the review times

188
7. Time to permit
These seven steps are used to calibrate the time to permit
6.9.1 Loading the System
Loading the system with projects must emulate how the organization deals with different
types of work. Since not all work is the same and work can come into the system at
different times it was important to allow for this randomness of when projects are
received by the organization. In the model the amount of projects must be initially
defined.
The code initializes the system with 10 projects for categories I - IV. By default,
the projects will enter the system in a first in first out fashion. This means that all
category I projects will be worked on first, all category II projects next, all category III
projects next, and finally all category IV projects last. This default was changed to
randomize how projects enter the system by assigning random numbers to each project.
The projects are then sorted according to this randomly assigned number.
6.9.2 The Rework Decision
Whether or not a project requires rework is decided dynamically within the simulation
model. As a project completes its first review it enters the rework decision fork. A
characteristic r assigned for each project category represents the percent chance that the
project will require rework. Table 6-4 shows the likelihood of rework for each of the
categories.

189
Category Likelihood of Rework (%)
I 90 II 99 III 93 IV 88
IV using PPR Varies
Table 6-4 Category of Projects
Table 6-4 shows that a majority of projects that enter the system require rework.
This high percentage of rework was qualitatively confirmed through conversations with
senior members of the FDD. Category IV using PPR varies because this value is changed
for the sensitivity analysis.
The rework decision contains a provision that reduces the chance of rework each
time the project is reworked. This reflects the assumption that as the project is reworked,
the quality of design drawings improves and has a lesser chance of needing rework. This
is shown in the partial code below.
STRENGTH RD3 100-Review1.DrawingSet.r/Review1.DrawingSet.ReworkFactor;
STRENGTH RD4 ‘Review1.DrawingSet.r/Review1.DrawingSet.ReworkFactor’;
This code dynamically assigns the strength of each link flowing out of the
Rework Decision Fork. As projects flow into the Rework Decision each project is
evaluated using the r characteristic. In addition a Rework Factor is initiated to the value
of 1. On the first pass the project enters Rework Decision, the r characteristic is pulled
into the equation and divided by the ReworkFactor. If a category I project is being
cursored then the percent chance of rework will be 90, 90 divided by 1. If it is determined
that the project will require rework it will flow through the rest of the rework queues and
activities.

190
Once the project is re-reviewed by one of the disciplines it is released back into
the rework decision loop. Upon being released, the ReworkFactor is increased by one.
When the project is reevaluated in ReworkDecision, the percent chance that it will
require rework is now 45, 90 divided by 2. If rework is again required, once the re-review
is completed the chance of rework is now 30, 90 divided by 3. This dynamic rework
cycle can occur indefinitely however this is rare. During simulations, projects reworked
more than four or five times is rare.
This rework loop was then tested to ensure it follows the intended purpose. To
test this scenario five category I projects were loaded into the system and the r (rework)
characteristic was set to 100, representing a 100% chance on the first pass that the project
will require rework. Therefore, all projects will require at least one loop of rework.
Figure 6-6 shows the likelihood of rework versus the number of rework iterations. On the
second pass the likelihood of rework is 50%, on the third pass the likelihood is 33%.

191
0
20
40
60
80
100
120
1 2 3 4 5 6
Number of Rework Iterations
Like
lihoo
d of
Rew
ork
(%)
Figure 6-6 Likelihood of Rework vs. Number of Rework Iterations
Table 6-5 and figure 6-7 show the rework rates used in the computer simulation.
The algorithm used to calculate the rework rate works by taking the first review
percentage and dividing it by the current rework cycle. For example in category IV, the
percentage chance of rework is 90%.
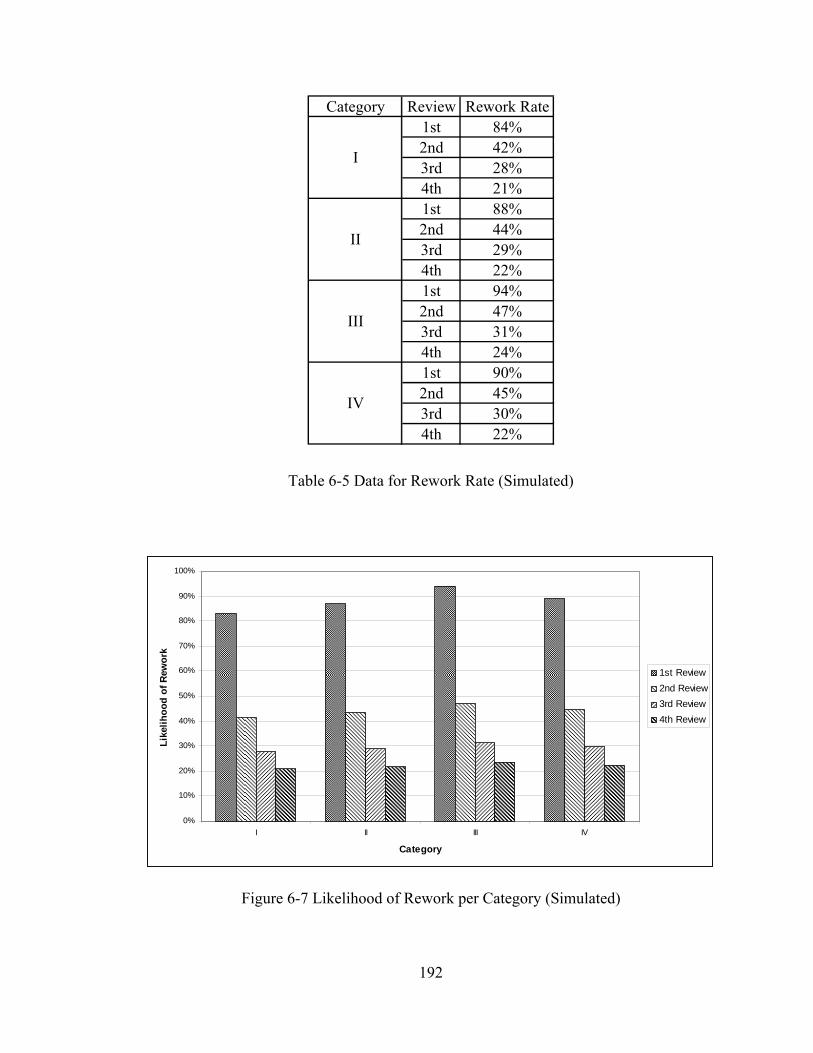
192
Category Review Rework Rate1st 84%2nd 42%3rd 28%4th 21%1st 88%2nd 44%3rd 29%4th 22%1st 94%2nd 47%3rd 31%4th 24%1st 90%2nd 45%3rd 30%4th 22%
I
II
III
IV
Table 6-5 Data for Rework Rate (Simulated)
0%
10%
20%
30%
40%
50%
60%
70%
80%
90%
100%
I II III IV
Category
Like
lihoo
d of
Rew
ork
1st Review2nd Review3rd Review4th Review
Figure 6-7 Likelihood of Rework per Category (Simulated)

193
6.9.3 Assigning Rework
As an error is discovered in the review process it has to be assigned to a specific
discipline. This error is associated with a certain discipline whether it be architect,
structural, mechanical, electrical or fire, life, and safety rework. For example, a rework
cycle may be triggered by the fire, life, and safety reviewer finding an error in the layout
of the exiting plan for the healthcare facility which requires the sprinkler locations be
changed. Corrected errors are then resubmitted for review. Upon the second review, a
mechanical error was detected in which the size of the pipe supporting the change in fire
sprinkler location is not adequate and then needs to be corrected. The design team again
corrects the issue and sends it back for review. Upon the third review, another error is
detected, the new fire sprinkler locations do not coincide with the proper skin of the
material and has to be reworked. Finally, the design team corrects all deficiencies and the
project is reviewed with no further errors and is completed on day 283. Note: in this
simulation, project 20 was first reviewed on day 10 resulting in an overall time to permit
of 273 days.
One limitation of the simulation is that the project could have multiple errors after
the first review. The model does not account for this situation, however the project is
allowed to be reworked more than once.
6.9.4 Matching Problem
As mentioned in the previous section the error is randomly assigned to a discipline. As
the project flows through the Resubmit queue the error assigned to the project is matched
up to the correct review discipline through the following code fragments.

194
6.9.5 Determining the Rework Rate
I analyzed the OSHPD logbook data to extract the rework rate and calculated the number
of rework cycles category I to IV. Figure 6-7 shows the different states that a project can
be in for the two year period of data analysis. Multiple scenarios exist where a project is
considered approved. In these scenarios, all projects are considered approved with the
following results. Two projects approved with no rework cycles, two approved with one
rework cycle, two approved with two rework cycles, and three approved with three
rework cycles. I realize that this process could produce inaccurate rework rates from
existing data, however, senior members of the FDD confirmed that the rework rates were
accurate.
Jan
2006
Dec
200
7
Figure 6-7 Project Review Scenarios
Table 6-6 shows the category rework rates for first, second, third and fourth reviews.

195
Category No. of Projects Review Rework Rate1st 83%2nd 42%3rd 9%4th 2%1st 87%2nd 42%3rd 13%4th 3%1st 94%2nd 50%3rd 16%4th 2%1st 89%2nd 52%3rd 26%4th 7%
763
1225
235
73
I
II
III
IV
Table 6-6 Data for Rework Rate
In table 6-6, column one shows the category and the number of projects evaluated
from the OSHPD database. For example, in category I, 763 projects were evaluated.
After the first review 83% required rework. 42% of the projects require rework after the
second review. 9% of the projects require rework after the third review and only 2% of
the projects require more than four rework cycles. Figure 6-8 is a graphical representation
of the data calculated from the OSHPD database.

196
0%
10%
20%
30%
40%
50%
60%
70%
80%
90%
100%
I II III IV
Category
Like
lihoo
d of
Rew
ork
1st Review2nd Review3rd Review4th Review
Figure 6-8 Likelihood of Rework per Category
In all four categories, the rework rate for the first review is above 80% and then
declines. In most instances, the rework rate for the second review is approximately half
the rework rate for the first review. The rework rate continues to decline for the third and
fourth reviews. This also shows that very few projects get approved on their first review
and in many instances the project is reworked multiple times. The information provided
in table 13 and figure 6-9 represent calculated data from the OSHPD logbook database.
6.9.6 Determining Review Times
This organization collects and places all of its data entry into a large database. The data
obtained tracks over six years of workflow through the organization. An Access database
obtained from OSHPD dated 15 June 2007 was used to extract activity durations that
were used in the discrete event simulation model. This database contains five different
tables (1) Counties, (2) Facility, (3) Projects, (4) Reviews, and (5) RvwAct (Review

197
Activity). Figure 6-9 shows the five tables in the Logbook Access database and their
relationships to each other and is read from left to right. The data in the Counties Table is
linked to the Facility table through the CountyID key. The Facility table is linked to the
Projects table through the Facno key which is the facility number. Each California
healthcare facility (existing and proposed) receives a unique identifier. The Projects table
is linked to the Reviews table through two fields the ProjNum (Project Number) and
SubNum (Submission Number). Each new project entered into the FDD system is given a
unique identifier for tracking purposes. The Reviews table is linked to the RvwAct
(Review Activity) through the ACT field. The ACT field represents the activity code (a
type of review) that was conducted on the project.

198
Figure 6-9 Logbook Access Database Relationships
Figure 6-10 shows queries from the database that were constructed from two
tables (Projects and Reviews). In this example, projects were filtered to show (1) a
construction cost of less than $50K (2) have ACT review codes of either 33* or 34*, and
(3) be logged in to the system between 1 January 2006 and 31 December 2007. The 33*
series numbers represent the first review of the project while the 34* series numbers
represent any subsequent backchecks or rework of the project documents. The criteria

199
33* and 34* filters all projects with 331, 332, 333….349. A backcheck is any defined
defect where the project had to be returned to the design team for correction of errors.
Figure 6-10 Example of the Query Constructed from Logbook
Figure 6-11 shows a query for projects that cost more than $1M and less than or
equal to $10M. The first column represents the unique project number associated with the
project. The second column is the activity, for example the first row shows an ACT of
331 which stands for the first review. The third column ARCHI shows when the architect
took in the project which was 28 February 2007, the fourth was then logged out on 1

200
March 2007. The fifth column ARCHDF shows the letter D which means the reviewer
defected the drawing; therefore, this drawing set would have been returned to the design
team for corrections. ARCHRS represents the total hours to review the drawings, 6.5
hours. ARCHERH represents the hours estimated to review, 12 hours. This information
was then exported to Excel and sorted so that all the 33* activity codes would be together
and the 34* codes would be together.
Figure 6-11. Example of Access Query for Category III
For each project cost category five spreadsheets for the Architect, Electrical,
Mechanical, Structural and Fire, Life, and Safety reviewer was created, resulting in a
total of twenty spreadsheets. Figure 6-12 shows a screenshot from the spreadsheet for
construction projects greater than $1M and less than or equal to $10M. This particular
spreadsheet of data is for the structural review. Highlighted is row 27, this information

201
comes from the Access database except for column I (Days column) which shows the
computed number of days between when the structural reviewer finished their project
review. In this instance, the number of days is twenty.
The number of days is calculated for thirty data points for each of the disciplines
and is the data set that is then used to run a resampling analysis to obtain the mean and
standard deviation for each of the review times in each of the categories.

202
Figure 6-12 Spreadsheet of Values
Tables 6-7 and 6-8 show the consolidated review times and standard deviations
for the first review used in the discrete event simulation for alternative review.
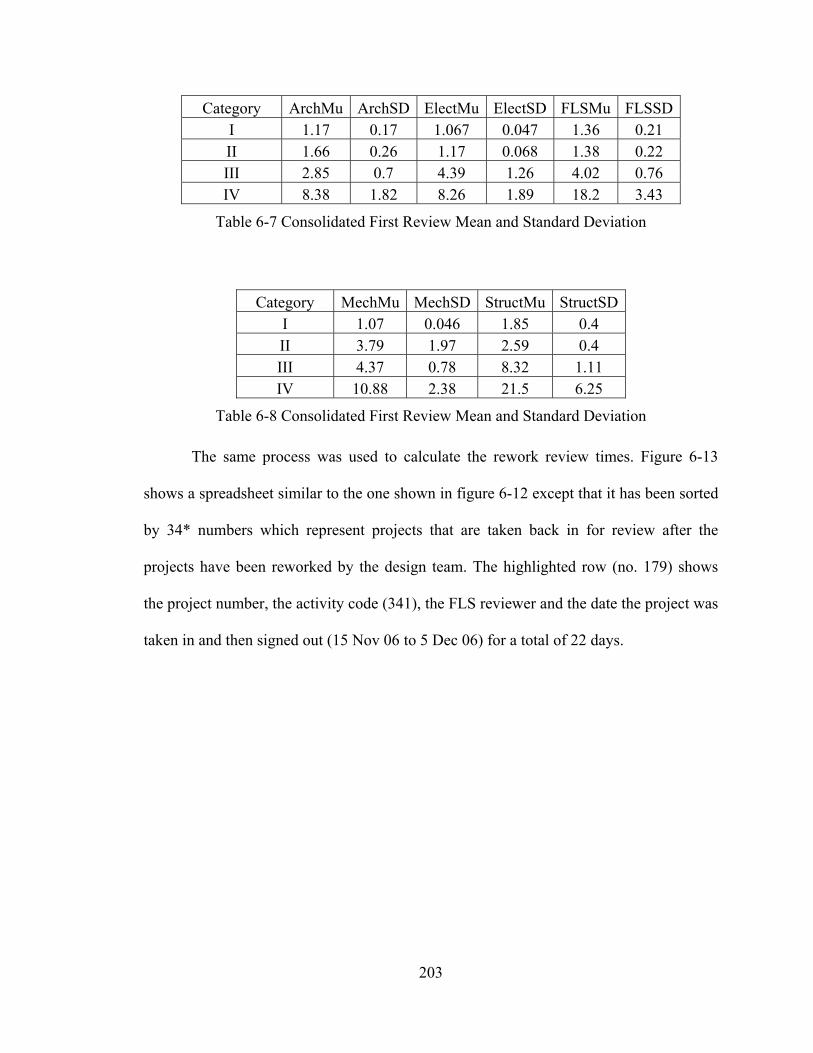
203
Category ArchMu ArchSD ElectMu ElectSD FLSMu FLSSDI 1.17 0.17 1.067 0.047 1.36 0.21 II 1.66 0.26 1.17 0.068 1.38 0.22 III 2.85 0.7 4.39 1.26 4.02 0.76 IV 8.38 1.82 8.26 1.89 18.2 3.43
Table 6-7 Consolidated First Review Mean and Standard Deviation
Category MechMu MechSD StructMu StructSD I 1.07 0.046 1.85 0.4 II 3.79 1.97 2.59 0.4 III 4.37 0.78 8.32 1.11 IV 10.88 2.38 21.5 6.25
Table 6-8 Consolidated First Review Mean and Standard Deviation
The same process was used to calculate the rework review times. Figure 6-13
shows a spreadsheet similar to the one shown in figure 6-12 except that it has been sorted
by 34* numbers which represent projects that are taken back in for review after the
projects have been reworked by the design team. The highlighted row (no. 179) shows
the project number, the activity code (341), the FLS reviewer and the date the project was
taken in and then signed out (15 Nov 06 to 5 Dec 06) for a total of 22 days.

204
Figure 6-13 Spreadsheet of FLSMuSD Category III (1M - 10M)
A similar resampling technique was used to get the mean and standard deviations
for the time to re-review projects that had to be reworked. A summary of those values is
listed in Table 6-9 and 6-10.

205
Category ArchMu ArchSD ElectMu ElectSD FLSMu FLSSDI 1.44 0.42 1.03 0.03 1.34 0.19 II 1.68 0.26 1.07 0.04 1.96 0.32 III 1.6 0.29 1.44 0.2 4.19 1.17 IV 4.05 1.53 2.7 0.72 7.57 1.8
Table 6-9 Consolidated Mean and Standard Deviation Re-Review
Category MechMu MechSD StructMu StructSD I 1.39 0.25 1.17 0.09 II 1.17 0.2 2.3 0.49 III 1.82 0.45 6.04 0.92 IV 4.8 1.51 10.8 2.9
Table 6-10 Consolidated Mean and Standard Deviation Re-Review
Figure 6-14 compares the first review times with the re-review times. For
categories I and II the first and re-review times are relatively unchanged. This makes
sense because the drawings are not as complex as the higher category projects and since
the data in the logbook is kept by days a project is very likely to take around a day to a
day-and-half to review. However, category IV projects the mean time for re-review are
dramatically smaller than the mean time for the first review. This is consistent with the
organization since the re-review is conducted by the same reviewer so he/she already has
a sense of the design drawings the re-review times are expected to be less.

206
0
5
10
15
20
25
I II III IV
Category
Rev
iew
Tim
e (d
ays)
Elect (I)Arch (R)Mech (I)Mech (R)Elect (I)Elect (R)Struct (I)Struct (R)FLS (I)FLS (R)
Figure 6-14 Mean Times for Initial Review and Re-Review by Discipline
6.9.7 Determining Time to Permit
Ultimately, the goal of the simulation models is to determine the time to permit a drawing
set and determine the impact of process changes through multiple iterations. Figure 6-15
shows example model output where the model is loaded with 205 projects. Category I has
50 projects, category II has 100 projects, category III has 35 projects and category IV has
20 projects. Figure 6-15 shows the projects sorted by project number. The completion
time is calculated by subtracting the complete time from the first time that the project was
reviewed. For example project number 205 is completed in 489.4 or 490 days. In
addition, the number of times a project is reworked versus its overall time to permit is
also evaluated.

207
Figure 6-15 Simulation Output Showing Project Numbers, Number of Rework Cycles,
Approval Time and Owner Rework Time in Days
Table 6-11 is a compilation of mean time to permit for three situations. The first
column represents the four categories of projects. The second column represents data
taken from the FDD on the mean time to permit for 2007. The third and fourth columns
show the mean time to permit and the standard deviation of model 1. Model 1 represents
one plan review region with constrained personnel resources. The fifth and sixth columns
show the mean time to permit and the standard deviations of model 2. Model 2 represents
one plan review region but has double the review personnel. These additional review
personnel are dedicated to reviewing projects requiring rework.

208
Category Mean (FDD) Mean (Model 1) SD Mean (Model 2) SDI 36 36 14.4 32 12.4II 180 188 80.9 160 70.2III 480 572 151.0 449 104.6IV 660 636 181.0 508 110.5
Table 6-11 Mean Time to Permit
Figure 6-16 graphically represents the data shown in table 6-11. Along the x-axis
are the four categories of projects. The y-axis represents the mean time to permit
expressed in days. The first column of each category represents the 2007 data obtained
from the FDD. The second column represents the mean time to permit for model 1. The
third column represents the same for model 2. Included are the standard deviations for
each of the categories.
Figure 6-16 shows that model 1 matches the FDD data relatively well. Indeed it
was the intent to calibrate model 1 with real data. Model 2 shows mean times to permit
lower than model 1. This result is expected because model 2 has more personnel
resources available, and this personally reduces the time to permit. Figure 6-16 provides
confidence the two models realistically simulate system behavior of the FDD.

209
0
100
200
300
400
500
600
700
800
900
I II III IV
Category
Tim
e (d
ays)
Mean (FDD)Mean (Model 1)Mean (Model 2)
Figure 6-16 Mean Time to Permit Analysis Comparing FDD Data to Simulation Model
Output
Figure 6-17 shows projects in category II, costing between $50K and $1M. The
graph shows the average time to permit is 180 days but it also shows gaps at times when
no project permits are issued (e.g., during the New Year and the Fourth of July). The
vertical lines on figure 6-17 show the overall time to permit for a project and when the
project was approved.

210
0
100
200
300
400
500
600
7/1/
06
7/15
/06
7/29
/06
8/12
/06
8/26
/06
9/9/
06
9/23
/06
10/7
/06
10/2
1/06
11/4
/06
11/1
8/06
12/2
/06
12/1
6/06
12/3
0/06
1/13
/07
1/27
/07
2/10
/07
2/24
/07
3/10
/07
3/24
/07
4/7/
07
4/21
/07
5/5/
07
5/19
/07
6/2/
07
6/16
/07
6/30
/07
7/14
/07
7/28
/07
Tim
e (d
ays)
100 project moving average
Figure 6-17 Real Time Category II
Figure 6-18 shows a sliding four week scale of the time to permit a healthcare
facility. The two light grey lines above and below the black line, represent one standard
deviation from the mean time to permit for category II. The time to permit hovers around
180 days and the graph shows no significant seasonal effects.

211
0
100
200
300
400
500
600
7/1/
06
7/15
/06
7/29
/06
8/12
/06
8/26
/06
9/9/
06
9/23
/06
10/7
/06
10/2
1/06
11/4
/06
11/1
8/06
12/2
/06
12/1
6/06
12/3
0/06
1/13
/07
1/27
/07
2/10
/07
2/24
/07
3/10
/07
3/24
/07
4/7/
07
4/21
/07
5/5/
07
5/19
/07
6/2/
07
6/16
/07
6/30
/07
7/14
/07
7/28
/07
Tim
e (d
ays)
Figure 6-18 Real Time Category II (4 Week Moving Average)
Figure 6-19 shows when individual category III projects were permitted and how
much time the review required. This category represents larger projects over a two year
time frame. The average time to permit is approximately 200 days. No seasonal effects
appear to affect the time to permit.

212
0
100
200
300
400
500
600
7/1/
06
7/15
/06
7/29
/06
8/12
/06
8/26
/06
9/9/
06
9/23
/06
10/7
/06
10/2
1/06
11/4
/06
11/1
8/06
12/2
/06
12/1
6/06
12/3
0/06
1/13
/07
1/27
/07
2/10
/07
2/24
/07
3/10
/07
3/24
/07
4/7/
07
4/21
/07
5/5/
07
5/19
/07
6/2/
07
6/16
/07
6/30
/07
7/14
/07
7/28
/07
Tim
e (d
ays)
30 project moving average
Figure 6-19 Real Time Category III
Figure 6-20 shows a four-week moving scale of the time to permit healthcare
facility drawings for category III projects. Again the data does not provide any insight
into seasonal effects to the time to permit a healthcare facility. The light grey lines
represent plus and minus one standard deviation of the sample data.

213
0
100
200
300
400
500
600
7/1/
06
7/15
/06
7/29
/06
8/12
/06
8/26
/06
9/9/
06
9/23
/06
10/7
/06
10/2
1/06
11/4
/06
11/1
8/06
12/2
/06
12/1
6/06
12/3
0/06
1/13
/07
1/27
/07
2/10
/07
2/24
/07
3/10
/07
3/24
/07
4/7/
07
4/21
/07
5/5/
07
5/19
/07
6/2/
07
6/16
/07
6/30
/07
7/14
/07
7/28
/07
Tim
e (d
ays)
Figure 6-20 Real Time Category III (4-Week Moving Average)
Figure 6-21 shows a ten project moving average for category IV projects. A larger
time between projects is the result of fewer projects within the category versus the other
three categories requiring approval. This data presents the time to permit reaching 400
days. The increase in the time to permit may be attributed to the increase in the number of
category IV projects being submitted, thereby requiring more staff time for their review.
As the workload increases, the time to permit increases as well all other things being
equal.

214
0
100
200
300
400
500
600
7/1/
06
7/15
/06
7/29
/06
8/12
/06
8/26
/06
9/9/
06
9/23
/06
10/7
/06
10/2
1/06
11/4
/06
11/1
8/06
12/2
/06
12/1
6/06
12/3
0/06
1/13
/07
1/27
/07
2/10
/07
2/24
/07
3/10
/07
3/24
/07
4/7/
07
4/21
/07
5/5/
07
5/19
/07
6/2/
07
6/16
/07
6/30
/07
7/14
/07
7/28
/07
Tim
e (d
ays)
10 project moving average
Figure 6-21 Real Time Category IV
Figure 6-22 shows a real time moving average for category IV projects. The data
is not smooth due to the limited number of projects that fall into this category. However,
the average time to permit is similar to figure 6-21.
0
100
200
300
400
500
600
7/1/
06
7/15
/06
7/29
/06
8/12
/06
8/26
/06
9/9/
06
9/23
/06
10/7
/06
10/2
1/06
11/4
/06
11/1
8/06
12/2
/06
12/1
6/06
12/3
0/06
1/13
/07
1/27
/07
2/10
/07
2/24
/07
3/10
/07
3/24
/07
4/7/
07
4/21
/07
5/5/
07
5/19
/07
6/2/
07
6/16
/07
6/30
/07
7/14
/07
7/28
/07
Tim
e (d
ays)
Figure 6-22 Real Time Category IV (4-Week Moving Average)
Tables 6-12 to 6-15 show the mean time to permit and the corresponding owner
rework time for each of the four categories. The tables break down the approval times by

215
number of rework instances. For example I (1R) stands for category I with one instance
of rework. The tables show the mean time to permit and owner rework time increases
with the number of rework cycles. This is an expected result.
Category Approval SD Owner SD Approval SD Owner SDI (All) 36 14.4 6 5.0 32 12.4 8 4.8I (0R) 30 13.7 N/A N/A 8 9.1 N/A N/AI (1R) 34 13.1 5 1.0 29 10.4 5 1.0I (2R) 42 13.0 10 1.3 37 11.0 10 1.4
I (3+R) 46 15.7 16 3.5 46 11.5 16 1.9
Model 1 Model 2
Table 6-12 Category I: Approval and Owner Rework Time (days), Models 1 and 2
Category Approval SD Owner SD Approval SD Owner SDII (All) 188 80.9 17 11.3 160 70.2 16 9.7II (0R) 147 73.9 N/A N/A 134 63.2 N/A N/AII (1R) 172 75.8 10 2.0 151 67.2 10 2.0II (2R) 196 78.8 20 2.8 164 69.5 20 2.6
II (3+R) 222 81.5 34 7.7 186 75.3 33 6.6
Model 1 Model 2
Table 6-13 Category II: Approval and Owner Rework Time (days), Models 1 and 2

216
Category Approval SD Owner SD Approval SD Owner SDIII (All) 572 151.0 40 25.6 449 104.6 33 17.4III (0R) 314 9.1 N/A N/A 465 50.8 N/A N/AIII (1R) 534 148.9 20 2.9 440 102.0 20 2.8III (2R) 585 128.5 40 4.2 440 108.4 40 4.1
III (3+R) 633 149.4 75 21.7 488 102.8 63 7.5
Model 1 Model 2
Table 6-14 Category III: Approval and Owner Rework Time (days), Models 1 and 2
Category Approval SD Owner SD Approval SD Owner SDIV (All) 636 181.1 115 80.4 508 110.5 94 63.8IV (0R) 466 168.9 N/A N/A 458 100.6 N/A N/AIV (1R) 584 157.2 70 4.4 484 102.5 70 4.5IV (2R) 696 149.7 142 6.4 534 100.0 139 7.0
IV (3+R) 786 172.3 260 59.8 621 110.1 224 30.5
Model 1 Model 2
Table 6-15 Category IV: Approval and Owner Rework Time (days), Models 1 and 2
6.10 Sensitivity Analysis
I conducted five sensitivity analyses to determine the effect of an alternative review
process on the time to permit. The first sensitivity analyses utilized a one to one
relationship. Realizing that to shift the design curve to the left requires more work
upfront, I wanted to determine what would happen if the first review times were
increased with a corresponding one to one (1:1) relationship in the decrease in rework
percentage and re-review times. Therefore a 10% increase in the first review would result
in a 10% reduction in the chance for rework to occur and 10% reduction in the
subsequent re-review time. The sensitivity analysis will only occur with category IV.
This occurs because currently the alternative review process through OSHPD is limited to

217
large projects. Therefore category IV review times and rework will be used for category
five and then varied between 10% and 50%.
Variable Initial 10% 20% 30% 40% 50% 60% 70% 80% 90% 99%ArchMu 8.38 9.22 10.06 10.89 11.73 12.57 13.41 14.25 15.08 15.92 16.68ArchSD 1.82 1.64 1.46 1.27 1.09 0.91 0.73 0.55 0.36 0.18 0.02StructMu 21.50 23.65 25.80 27.95 30.10 32.25 34.40 36.55 38.70 40.85 42.79StructSD 6.25 5.63 5.00 4.38 3.75 3.13 2.50 1.88 1.25 0.63 0.06MechMu 10.90 11.99 13.08 14.17 15.26 16.35 17.44 18.53 19.62 20.71 21.69MechSD 2.38 2.14 1.90 1.67 1.43 1.19 0.95 0.71 0.48 0.24 0.02ElectMu 8.27 9.10 9.92 10.75 11.58 12.41 13.23 14.06 14.89 15.71 16.46ElectSD 1.94 1.75 1.55 1.36 1.16 0.97 0.78 0.58 0.39 0.19 0.02FLSMu 18.20 20.02 21.84 23.66 25.48 27.30 29.12 30.94 32.76 34.58 36.22FLSSD 3.43 3.09 2.74 2.40 2.06 1.72 1.37 1.03 0.69 0.34 0.03
Table 6-16 (1:1) Sensitivity Analysis Ratios for First Review
Table 6-16 shows the first review variables. The second column shows the initial
times used for category IV characteristics. The additional columns represent the numbers
used for the sensitivity analysis. Table 6-17 shows the re-review variables.
Variable Initial -10% -20% -30% -40% -50% -60% -70% -80% -90% -99%r 88 79.2 70.4 61.6 52.8 44 35.2 26.4 17.6 8.8 0.88ORewMu 70 63 56 49 42 35 28 21 14 7 0.7RRevAMu 4.05 3.65 3.24 2.84 2.43 2.03 1.62 1.22 0.81 0.41 0.04RRevASD 1.53 1.38 1.22 1.07 0.92 0.77 0.61 0.46 0.31 0.15 0.02RRevSMu 10.80 9.72 8.64 7.56 6.48 5.40 4.32 3.24 2.16 1.08 0.11RRevSSD 2.90 2.61 2.32 2.03 1.74 1.45 1.16 0.87 0.58 0.29 0.03RRevMMu 4.80 4.32 3.84 3.36 2.88 2.40 1.92 1.44 0.96 0.48 0.05RRevMSD 1.51 1.36 1.21 1.06 0.91 0.76 0.60 0.45 0.30 0.15 0.02RRevEMu 2.70 2.43 2.16 1.89 1.62 1.35 1.08 0.81 0.54 0.27 0.03RRevESD 0.72 0.65 0.58 0.50 0.43 0.36 0.29 0.22 0.14 0.07 0.01RRevFMu 7.60 6.84 6.08 5.32 4.56 3.80 3.04 2.28 1.52 0.76 0.08RRevFSD 1.80 1.62 1.44 1.26 1.08 0.90 0.72 0.54 0.36 0.18 0.02
Table 6-17 (1:1) Sensitivity Analysis Ratios for Re-Review

218
To test the effect of rework and alternative on review on the system a sensitivity
analysis was conducted to determine the impact of variables on the system. The following
table shows the variable of concern and the range of which the analysis was conducted.
To summarize, the first review times were considered to vary from 10 - 50%. The re-
review times were also set to vary from 10 - 50%. The owner rework time was also
varied from 10 - 50% and the rework factor was also changed to conduct the sensitivity
analysis.
Recognizing the fact that alternative review takes up more time initially
constitutes the reason why the first review times are increased from 10 - 50%.
Conversely, with alternative review, the time to conduct a rework cycle and for re-review
to occur will be less. In this sensitivity analysis the factors were used in a linear fashion.
For example, with an increase of 10% in first review results in a 10% decrease in the time
for owner rework, re-review, and a rework factor.
The second sensitivity analysis utilized a one to two (1:2) ratio. Whereby a 10%
increase in first review results in a 20% reduction in the chance of rework and 20%
reduction in the re-review time. Located in tables 6-18 and 6-19 are the category IV
inputs.

219
Variable Initial 5% 10% 15% 20% 25% 30% 35% 40% 45% 50%ArchMu 8.38 8.80 9.22 9.64 10.06 10.48 10.89 11.31 11.73 12.15 12.57ArchSD 1.82 1.73 1.64 1.55 1.46 1.37 1.27 1.18 1.09 1.00 0.91StructMu 21.50 22.58 23.65 24.73 25.80 26.88 27.95 29.03 30.10 31.18 32.25StructSD 6.25 5.94 5.63 5.31 5.00 4.69 4.38 4.06 3.75 3.44 3.13MechMu 10.90 11.45 11.99 12.54 13.08 13.63 14.17 14.72 15.26 15.81 16.35MechSD 2.38 2.26 2.14 2.02 1.90 1.79 1.67 1.55 1.43 1.31 1.19ElectMu 8.27 8.68 9.10 9.51 9.92 10.34 10.75 11.16 11.58 11.99 12.41ElectSD 1.94 1.84 1.75 1.65 1.55 1.46 1.36 1.26 1.16 1.07 0.97FLSMu 18.20 19.11 20.02 20.93 21.84 22.75 23.66 24.57 25.48 26.39 27.30FLSSD 3.43 3.26 3.09 2.92 2.74 2.57 2.40 2.23 2.06 1.89 1.72
Table 6-18 (1:2) Sensitivity Analysis Ratios for First Review
Variable Initial -10% -20% -30% -40% -50% -60% -70% -80% -90% -99%r 88 79.2 70.4 61.6 52.8 44 35.2 26.4 17.6 8.8 0.88ORewMu 70 63 56 49 42 35 28 21 14 7 0.7RRevAMu 4.05 3.65 3.24 2.84 2.43 2.03 1.62 1.22 0.81 0.41 0.04RRevASD 1.53 1.38 1.22 1.07 0.92 0.77 0.61 0.46 0.31 0.15 0.02RRevSMu 10.80 9.72 8.64 7.56 6.48 5.40 4.32 3.24 2.16 1.08 0.03RRevSSD 2.90 2.61 2.32 2.03 1.74 1.45 1.16 0.87 0.58 0.29 0.11RRevMMu 4.80 4.32 3.84 3.36 2.88 2.40 1.92 1.44 0.96 0.48 0.05RRevMSD 1.51 1.36 1.21 1.06 0.91 0.76 0.60 0.45 0.30 0.15 0.02RRevEMu 2.70 2.43 2.16 1.89 1.62 1.35 1.08 0.81 0.54 0.27 0.01RRevESD 0.72 0.65 0.58 0.50 0.43 0.36 0.29 0.22 0.14 0.07 0.03RRevFMu 7.60 6.84 6.08 5.32 4.56 3.80 3.04 2.28 1.52 0.76 0.08RRevFSD 1.8 1.62 1.44 1.26 1.08 0.90 0.72 0.54 0.36 0.18 0.02
Table 6-19 (1:2) Sensitivity Analysis Ratios for Re-Review
The third sensitivity analysis utilized a one to four (1:4) ratio. Whereby a 10%
increase in first review results in a 40% reduction in the chance of rework and a 40%
reduction in the re-review time. Located in tables 6-20 and 6-21 are the category IV
inputs.

220
Variable Initial 5% 10% 15% 20% 25%ArchMu 8.38 8.80 9.22 9.64 10.06 10.48ArchSD 1.82 1.91 2.00 2.09 2.18 2.28StructMu 21.50 22.58 23.65 24.73 25.80 26.88StructSD 6.25 6.56 6.88 7.19 7.50 7.81MechMu 10.90 11.45 11.99 12.54 13.08 13.63MechSD 2.38 2.50 2.62 2.74 2.86 2.98ElectMu 8.27 8.68 9.10 9.51 9.92 10.34ElectSD 1.94 2.04 2.13 2.23 2.33 2.43FLSMu 18.20 19.11 20.02 20.93 21.84 22.75FLSSD 3.43 3.60 3.77 3.94 4.12 4.29
Table 6-20 (1:4) Sensitivity Analysis Ratios for First Review
Variable Initial -20% -40% -60% -80% -99%r 88 70.4 52.8 35.2 17.6 0.88ORewMu 70 56 42 28 14 0.7RRevAMu 4.05 3.24 2.43 1.62 0.81 0.04RRevASD 1.53 1.22 0.92 0.61 0.31 0.02RRevSMu 10.80 8.64 6.48 4.32 2.16 0.11RRevSSD 2.90 2.32 1.74 1.16 0.58 0.03RRevMMu 4.80 3.84 2.88 1.92 0.96 0.05RRevMSD 1.51 1.21 0.91 0.60 0.30 0.02RRevEMu 2.70 2.16 1.62 1.08 0.54 0.03RRevESD 0.72 0.58 0.43 0.29 0.14 0.01RRevFMu 7.60 6.08 4.56 3.04 1.52 0.08RRevFSD 1.8 1.44 1.08 0.72 0.36 0.018
Table 6-21 (1:4) Sensitivity Analysis Ratios for Re-Review
These scenarios are realistic in that by shifting the design curve to the left and
spending additional time upfront avoids the embedding of errors early resulting in a
reduced chance for rework and a reduced time to re-review drawings. This occurs
because of less embedded errors and the plan reviewers are familiar with the design
drawings because they have been involved from the first major decisions of the facility.
Two scenarios where the reverse ratio occurs were also evaluated. The fourth
scenario is a 2 to 1 ratio where the initial review results in a half reduction in the re-

221
review. Therefore, twice the effort in the phased plan review process only results in half
the reduction in rework percentage and re-reviews times. Table 6-22 and 6-22 show the
category inputs.
Variable Initial 10% 20% 30% 40% 50% 60% 70% 80% 90% 100%ArchMu 8.38 9.22 10.06 10.89 11.73 12.57 13.41 14.25 15.08 15.92 16.76ArchSD 1.82 2.00 2.18 2.37 2.55 2.73 2.91 3.09 3.28 3.46 3.64StructMu 21.50 23.65 25.80 27.95 30.10 32.25 34.40 36.55 38.70 40.85 43.00StructSD 6.25 6.88 7.50 8.13 8.75 9.38 10.00 10.63 11.25 11.88 12.50MechMu 10.90 11.99 13.08 14.17 15.26 16.35 17.44 18.53 19.62 20.71 21.80MechSD 2.38 2.62 2.86 3.09 3.33 3.57 3.81 4.05 4.28 4.52 4.76ElectMu 8.27 9.10 9.92 10.75 11.58 12.41 13.23 14.06 14.89 15.71 16.54ElectSD 1.94 2.13 2.33 2.52 2.72 2.91 3.10 3.30 3.49 3.69 3.88FLSMu 18.20 20.02 21.84 23.66 25.48 27.30 29.12 30.94 32.76 34.58 36.40FLSSD 3.43 3.77 4.12 4.46 4.80 5.15 5.49 5.83 6.17 6.52 6.86
Table 6-22 (2:1) Sensitivity Analysis Ratios for First Review
Variable Initial -5% -10% -15% -20% -25% -30% -35% -40% -45% -50%r 88 83.60 79.20 74.80 70.40 66.00 61.60 57.20 52.80 48.40 44.00ORewMu 70 66.50 63.00 59.50 56.00 52.50 49.00 45.50 42.00 38.50 35.00RRevAMu 4.05 3.85 3.65 3.44 3.24 3.04 2.84 2.63 2.43 2.23 2.03RRevASD 1.53 1.45 1.38 1.30 1.22 1.15 1.07 0.99 0.92 0.84 0.77RRevSMu 10.80 10.26 9.72 9.18 8.64 8.10 7.56 7.02 6.48 5.94 5.40RRevSSD 2.90 2.76 2.61 2.47 2.32 2.18 2.03 1.89 1.74 1.60 1.45RRevMMu 4.80 4.56 4.32 4.08 3.84 3.60 3.36 3.12 2.88 2.64 2.40RRevMSD 1.51 1.43 1.36 1.28 1.21 1.13 1.06 0.98 0.91 0.83 0.76RRevEMu 2.70 2.57 2.43 2.30 2.16 2.03 1.89 1.76 1.62 1.49 1.35RRevESD 0.72 0.68 0.65 0.61 0.58 0.54 0.50 0.47 0.43 0.40 0.36RRevFMu 7.60 7.22 6.84 6.46 6.08 5.70 5.32 4.94 4.56 4.18 3.80RRevFSD 1.8 1.71 1.62 1.53 1.44 1.35 1.26 1.17 1.08 0.99 0.90
Table 6-23 (2:1) Sensitivity Analysis Ratios for Re-Review
The fifth scenario is a 4 to 1 ratio where the initial review results in a quarter
reduction in the re-review. Therefore, four times the effort in the phased plan review
process only results in a quarter reduction in rework percentage and re-review times.
Table 6-24 and 6-25 show the category inputs.

222
Variable Initial 20% 40% 60% 80% 99%ArchMu 8.38 10.06 11.73 13.41 15.08 16.76ArchSD 1.82 2.18 2.55 2.91 3.28 3.64StructMu 21.50 25.80 30.10 34.40 38.70 43.00StructSD 6.25 7.50 8.75 10.00 11.25 12.50MechMu 10.90 13.08 15.26 17.44 19.62 21.80MechSD 2.38 2.86 3.33 3.81 4.28 4.76ElectMu 8.27 9.92 11.58 13.23 14.89 16.54ElectSD 1.94 2.33 2.72 3.10 3.49 3.88FLSMu 18.20 21.84 25.48 29.12 32.76 36.40FLSSD 3.43 4.12 4.80 5.49 6.17 6.86
Table 6-24 (4:1) Sensitivity Analysis Ratios for First Review
Variable Initial -5% -10% -15% -20% -25%r 88 83.60 79.20 74.80 70.40 66.00ORewMu 70 66.50 63.00 59.50 56.00 52.50RRevAMu 4.05 3.85 3.65 3.44 3.24 3.04RRevASD 1.53 1.45 1.38 1.30 1.22 1.15RRevSMu 10.80 10.26 9.72 9.18 8.64 8.10RRevSSD 2.90 2.76 2.61 2.47 2.32 2.18RRevMMu 4.80 4.56 4.32 4.08 3.84 3.60RRevMSD 1.51 1.43 1.36 1.28 1.21 1.13RRevEMu 2.70 2.57 2.43 2.30 2.16 2.03RRevESD 0.72 0.68 0.65 0.61 0.58 0.54RRevFMu 7.60 7.22 6.84 6.46 6.08 5.70RRevFSD 1.8 1.71 1.62 1.53 1.44 1.35
Table 6-25 (4:1) Sensitivity Analysis Ratios for Re-Review
6.10.1 Results
The results of the five sensitivity analysis are shown in figures 6-23 to 6-27. The first
shows the figure resulting from the one to one (1:1) ratio.

223
400
450
500
550
600
650
700
750
800
850
Model1
10% 20% 30% 40% 50% 60% 70% 80% 90% 99%
Category
Tim
e (d
ays)
0
20
40
60
80
100
120
140
160
180
200
Instances (0R)Instances (1R)Instances (2R)Instances (3+R)Approval (0R)Approval (1R)Approval (2R)Approval (3+R)Approval (all)
400
450
500
550
600
650
700
750
800
850
Model1
10% 20% 30% 40% 50% 60% 70% 80% 90% 99%
Category
Tim
e (d
ays)
0
20
40
60
80
100
120
140
160
180
200
Instances (0R)Instances (1R)Instances (2R)Instances (3+R)Approval (0R)Approval (1R)Approval (2R)Approval (3+R)Approval (all)
Figure 6-23 (1:1) Ratio Sensitivity Analysis
Here it can be seen that the overall time to permit remains about the same,
however, an increase in predictability exists because the number of projects permitted
with zero rework increases by six times, 20 instances to 120 instances. Increasing zero
rework instances also reduces additional rework cycles. This reduces the amount of risk
that the owner is exposed to by allowing them a better planning horizon to set their
expectations to when the design drawings will be approved.

224
Figure 6-24 shows the second sensitivity analysis utilizing a one to two (1:2)
ratio.
400
450
500
550
600
650
700
750
800
850
Model1
5% 10% 15% 20% 25% 30% 35% 40% 45% 50%
Category
Tim
e (d
ays)
0
20
40
60
80
100
120
140
160
180
200
Instances (0R)Instances (1R)Instances (2R)Instances (3+R)Approval (0R)Approval (1R)Approval (2R)Approval (3+R)Approval (All)
Figure 6-24 (1:2) Ratio Sensitivity Analysis
Figure 6-24 shows the mean time to permit of all projects decreases as the level of
upfront effort reaches the 20% category but then shows diminished returns in the mean
time to permit. However, with the increased upfront effort the system becomes more
predictable with the number of projects requiring zero rework increasing linearly with
each category. This result is expected and that no rework instances would occur at the
50% upfront effort because due to the double ratio, the chance for rework is zero. The
biggest impacts to the time to permit occur with the two and three rework mean times to
permit.

225
Figure 6-25 shows the opposite of a one to two relationship. It shows that the time
to permit increases as the initial effort increases.
400
450
500
550
600
650
700
750
800
850
Model1
10% 20% 30% 40% 50% 60% 70% 80% 90% 100%
Category
Tim
e (d
ays)
0
20
40
60
80
100
120
140
160
180
200
Instances (0R)Instances (1R)Instances (2R)Instances (3+R)Approval (0R)Approval (1R)Approval (2R)Approval (3+R)Approval (All)
400
450
500
550
600
650
700
750
800
850
Model1
10% 20% 30% 40% 50% 60% 70% 80% 90% 100%
Category
Tim
e (d
ays)
0
20
40
60
80
100
120
140
160
180
200
Instances (0R)Instances (1R)Instances (2R)Instances (3+R)Approval (0R)Approval (1R)Approval (2R)Approval (3+R)Approval (All)
Figure 6-25 (2:1) Ratio Sensitivity Analysis

226
Figures 6-26 shows the third sensitivity analysis utilizing a one to four (1:4) ratio.
400
450
500
550
600
650
700
750
800
850
Model 1 5% 10% 15% 20% 25%
Category
Tim
e (d
ays)
0
20
40
60
80
100
120
140
160
180
200
Instances (0R)Instances (1R)Instances (2R)Instances (3+R)Approval (0R)Approval (1R)Approval (2R)Approval (3+R)Approval (All)
Figure 6-26 (1:4) Ratio Sensitivity Analysis
Figure 6-27 shows a four to one relationship where 20 percent increase in initial
review effort results in only a 5 percent decrease in re-review times and rework rate. It
shows that the overall time to permit increases and more points are above the 650 days to
permit line that is consistent in figure 6-25.

227
450
500
550
600
650
700
750
800
850
Model 1 20% 40% 60% 80% 100%
Category
Tim
e (d
ays)
0
20
40
60
80
100
120
140
160
180
200
Instances (0R)Instances (1R)Instances (2R)Instances (3+R)Approval (0R)Approval (1R)Approval (2R)Approval (3+R)Approval (All)
450
500
550
600
650
700
750
800
850
Model 1 20% 40% 60% 80% 100%
Category
Tim
e (d
ays)
0
20
40
60
80
100
120
140
160
180
200
Instances (0R)Instances (1R)Instances (2R)Instances (3+R)Approval (0R)Approval (1R)Approval (2R)Approval (3+R)Approval (All)
Figure 6-27 (4:1) Ratio Sensitivity Analysis
Three scenarios were conducted to determine the impact of an alternative review
process. Projects are placed into four categories and entered into the simulation model.
The original model represents the current organizational process receives approximately
50 category I projects, 100 category II, 35 category III, and 20 category IV projects in a
six month time frame. The second and third scenarios focused on a dedicated team to
perform alternative review only. This was a request by the Facilities Development
Division which intends to put this team into practice and wanted to know the impact to
the mean time to permit for the largest projects that the organization encounters. These
two scenarios of a dedicated alternative review process were loaded with 40 and 50
category IV projects and are referred to as DA40 and DA50 respectively.
Figure 6-28 shows normal distributions for three simulation scenarios. From left
to right the first two represent a dedicated review team that only performs an alternative
review process (40 and 50 projects respectively). The third curve represents the time to

228
permit for the original organizational structure (20 projects). Each scenario utilized a
sample size of 1,000 simulations.
The decreased mean time to permit represents only a portion of the benefits of an
alternative review process that engages major stakeholders early. Additional benefits of
the alternative review process include (1) reduced probability of rework, (2) if rework
does occur, the time to correct, resubmit and re-review is reduced, and (3) increased job
satisfaction for the plan reviewers. Increased job satisfaction occurs because the plan
reviewers are now integral members of a design team and are involved in a proactive
process to design a healthcare facility versus the reactive process where they constantly
catch design errors.
I performed a statistical analysis to compare DA40 and DA50 with the original
mean time to permit. DA40 (mean 450 days, SD 192) and DA50 (mean 530 days, SD
212) were compared to the original model (mean 650 days, SD 181) resulting in a p-value
of 0.0001 for both scenarios.
This research and supporting simulation results recommends utilizing a separate
review team to handle alternative review projects resulting in an overall mean time to
permit savings of approximately six months. However, this dedicated review team should
maintain a threshold of 40 to 50 projects in its queue, otherwise, diminishing returns on
the mean time to permit occurs.

229
0
0.0005
0.001
0.0015
0.002
0.0025
0 500 1000 1500Days
Prob
abili
ty D
ensi
tyDA 40
DA 50
Original
450/192
530/212
640/1810
0.0005
0.001
0.0015
0.002
0.0025
0 500 1000 1500Days
Prob
abili
ty D
ensi
tyDA 40
DA 50
Original
450/192
530/212
640/181
Figure 6-28 Mean Time to Permit for Three Scenarios (N = 1000)
Figure 6-29 shows mean time and stability. Along the x-axis is a series of projects
from three sources. The first two series of projects compile the mean time to permit
obtained from simulations runs of a dedicated review team loaded with 40 and 50
projects. The third series of projects compile the mean time to permit from the FDD
database. These times are individually plotted with the time to permit on the y-axis. This
graph shows a reduction in the mean time to permit as well as more stability and
predictability due to a dedicated alternative review team. The FDD project mean time to
permit is approximately 610 days with a standard deviation of 390 days indicating large
variation in the time to permit.
While the simulation data shows a reduced mean time to permit of 450 days and a
reduced standard deviation of 190 days an improvement of 25% permitting time and 50%
improvement in standard deviation. The 50 project simulation data shows a reduced mean

230
time to permit of 530 days and a reduced standard deviation of 210 days an improvement
of 13% permitting time and 26% improvement in standard deviation.
0
200
400
600
800
1000
1200
1400
16001 10 19 28 37 46 55 64 73 82 91 100
109
118
127
136
145
154
163
172
181
190
199
208
217
226
235
244
253
262
271
280
Projects
Tim
e (d
ays)
DA40 DA50 FDDMean 610
±1σ 1000/220
Mean 530
±1σ 740/320
Mean 450
±1σ 640/260
0
200
400
600
800
1000
1200
1400
16001 10 19 28 37 46 55 64 73 82 91 100
109
118
127
136
145
154
163
172
181
190
199
208
217
226
235
244
253
262
271
280
Projects
Tim
e (d
ays)
DA40 DA50 FDDMean 610
±1σ 1000/220
Mean 530
±1σ 740/320
Mean 450
±1σ 640/260
DA40 DA50 FDDMean 610
±1σ 1000/220
Mean 530
±1σ 740/320
Mean 450
±1σ 640/260
Figure 6-29 Mean Time to Permit for FDD and Simulation data
I realize the number of personnel increases in the system, but it is the
organizational makeup that makes the difference here. Politically, the organization
receives a lot of attention for those large projects and to be able to save six months of cost
escalation will prove very beneficial to the organization in terms of providing the best
customer service to their constituents. In turn, this will help the organization politically
because less interest will come from the state politicians.
Realizing that system behavior can affect the largest project category’s mean time
to permit, another model was conducted to evaluate system behavior. This scenario
reduced categories one, two and three by a series of percentages ranging from 10% to
50%. The fourth category implemented an alternative review process utilizing a 30%
increase in initial effort resulting in a 30% decrease in category rework and re-review
time. Figure 6-30 shows the result of this scenario.

231
0
100
200
300
400
500
600
700
800
Cat 5 30% 10% 20% 30% 40% 50%
Percent Reduction
Tim
e (d
ays)
0
20
40
60
80
100
120
140
160
180
200
Inst
ance
s
Instances (0R)Instances (1R)Instances (2R)Instances (3+R)Approval (0R)Approval (1R)Approval (2R)Approval (3+R)Approval (All)
Figure 6-30 Other Category Rework Reduction with Category IV at 30% Effort Level
In general each of the mean times to permit for category IV are reduced due to
less rework in categories one, two, and three. This is expected decrease in mean time to
permit for category IV occurs because the plan reviewers have less overall work because
they do not have to deal with rework situations in categories one, two, and three.
The number of rework instances for category IV is expected to remain constant because
category IV rework percentages remains the same. More system behavior confidence is
realized due to expected results.
6.10.2 Limitations
Four limitations are identified for research in discrete event simulations.
1. Simulating an organization using a discrete event simulation is difficult because
modeling human behavior is complex. Understanding human capabilities through
simulation alone can not solve problems (Chung 2004).
2. Organizations change over time, they can exist in different formats from functional to
matrix to project specific models and the data retrieved from the organization is a
232
historical picture in time. Change occurs because people in an organization get fired,
retire or move on and new personnel are hired. The change of personnel can
significantly influence how the organization behaves.
3. A large database has been obtained that measures the workflow through the
organization; some of the data may not be reliable. Data is only as reliable as the
people that input the information. Therefore some of the data is inaccurate. In some
instances, projects were closed out as finished when in reality they were not
complete. This data will be removed from the simulation analysis.
4. OSHPD is a unique organization primarily staffed with architects and engineers
which may make it difficult to apply findings to another organization.
6.10.3 Validation through Interviews
The work completed in case study II was validated through an in-depth interview and
presentation to the Deputy Director of the Facility Development Division. Qualitative
validations for four points are discussed next.
The high rework rate calculated for the four model categories required validation
since each category had a rework rate above 85%. I was concerned if this adequately
represented what occurs with drawings reviewed by the FDD. The deputy director
confirmed that the rework rates were accurate and he expected the rework rates to be
higher than what I had calculated.
In two additional interviews with regional plan supervisors the high rework rates
were accurate. Both supervisors agreed the rework rate is above 85% for all categories

233
and one stated “it is a very rare occurrence that a set of drawings are approved the first
time (Ring 2008).”
The dynamic rework cycle required validation because the simulation model
allows projects to be reworked indefinitely, in which the deputy director stated “That is
for sure! (sarcastic tone) (Gillengerten 2008).” He inquired about the number of rework
cycles that typically occur in the computer simulation. I responded with, “it is rare that a
project is reworked more than four or five times.” The deputy director agreed with this
statement and has a policy, that once drawings reach the fourth rework cycle, “I call the
owner and design team and explain that their project is in jeopardy of being rejected
entirely from the review process so it is a good thing that the computer model does not
have more than three or four rework cycles (Gillengerten 2008).”
Plan review times required validation to accurately model system behavior. The
deputy director agreed that review times increase with larger categories of work and that
the structural and fire, life, and safety reviews take the longest. He has always believed
that structural and fire, life, and safety reviews were the longest and that it was good to
see the data from his database supported that notion.
Ultimately, the deputy director believed that the computer simulation accurately
showed the system behavior of his organization and closed with the statement that this
research effort helps him “manage by fact (Gillengerten 2008).”
I identified two limitations through validation interviews.
1. Small sample size does not allow for a quantitative analysis, therefore the validation
process must be accomplished through in depth interviews. To address this limitation

234
multiple interviews were conducted with three leaders within the organization to
understand their opinions about the results of the computer model.
2. Biased answers from the interviewees because they have a vested interest in the
organization. Also, the interviewees may be biased because they have worked with
the researcher and may report only the positives of the research accomplished. To
address this limitation, I ensured that the simulation model was created and analyzed
from existing data on the organization so they would feel free to comment openly and
honestly on the work.
6.11 Industry Questionnaire
I developed with input from OSHPD regulators, owners, architects, engineers and
contractors to explore the characteristics necessary to succeed in mitigating rework
within the healthcare facility construction industry. A series of in depth interviews were
conducted to develop thirteen questions owners and design teams should reflect on prior
to engaging OSHPD in a new process of alternative review.
1. Do you have design phase schedule? It is imperative to detail on the design activities
to understand the handoffs of information to each discipline engineer.
2. Is your project going to be reviewed in house or third party contract review? In house
review by OSHPD has an impact because the reviewers are required to review other
work and may not have the ability to dedicate as much time to the review. While, a
third party contract review will be able to allocate more reviewers based on the needs
of the project schedule because they sign a contract to provide information on a
scheduled basis.

235
3. Are you willing to adopt integrated project delivery teams, lean, BIM? The members
interviewed believe it is imperative to adopt integrated project delivery teams, lean
and BIM to be successful in using an alternative review process. The alternative
review process requires coordination between owners, designers and contractors to
understand how the facility is constructed and using BIM readily facilitates the
process.
4. Do you have contractors on board, which ones and describe their breadth of
responsibility? If not, when will they be brought on and what is expected of them?
Without contractors on board early, uncertainty increases in whether the design can
be constructed and what the costs of the design is. Also, just having them on to do
costing is not enough; contractors must work with designers and owners to
incorporate the process of installation with the products that will be used.
5. Have members of your team received the informational session on phased plan
review? The healthcare facility industry along with state regulators developed an
informational session on the specifics to alternative review process. Receiving the
information presented in the forums give industry members direct insight into how
the alternative review process works.
6. Is an expectations matrix established? An expectations matrix details out the
information that the design team must provide at each phase of the alternative review
process. The matrix makes it explicit what is to be provided and what is to be
reviewed.
236
7. Can you provide a description of how the design team will involve owners in decision
making both operational and budget? Owners have an impact on project delivery and
therefore is an important to reducing variability in the decision making process. How
many owners will be addressed and who makes the final decision is important to ask
prior to beginning the design process.
8. Can you present a methodology on team decision making? This question details out
how the design team will make decisions on major issues. Are decisions made by
consensus or does the owner have final say. What tools will be used to make educated
decisions.
9. Is the owner willing to self certify the budget for the facility that it can meet future
construction costs, fees, and entitlements? This question makes the owners think
about their business plans in depth to ensure that they have captured all possibilities
that may affect the project budget.
10. Is the owner willing to self certify the space utilization plan for the facility? Change
in floor plans and space use is a source of cost increase. Therefore, limiting the
changes is necessary to utilize the alternative review process.
11. Is the owner willing to self certify that the program for the facility is closed and will
not be reopened? This requires the owner to keep the business plan closed once it is
determined. Changing what services to provide mid-stream through the design will
prove detrimental to the alternative review process. Most likely, the project will not
be able to proceed through the alternative review process and will resort back to the
standard of providing 100% contract drawings for review by the regulators.

237
12. Are you able to present which items you believe will require peer review or alternate
means of compliance? Identifying items that will require additional peer review and
alternate means of compliance is imperative because they are long lead items and
require agencies outside of OSHPD to help in the decision making. Thinking about
this ahead of time can keep the project going in an alternative review process.
13. If your firm is not familiar with OSHPD procedures, are you willing to partner with a
firm that has experience with OSHPD permitting processes? Gaining experience and
help from another firm will improve the design process pursuing alternative review
and having projects that do not flow through efficiently is detrimental to the entire
system. The permitting process is complex and therefore partnering with an
experienced firm will greatly enhance the success of the project.
6.12 Section Acknowledgments
I would like to thank the members at OSHPD for their insight, without their help, this
work would have never occurred.

238
7. CONCLUSIONS
In this dissertation research I show that many causes of rework exist in the design and
permitting phase of a healthcare facility. I show that negative rework is detrimental to
system performance and I identify three throttles that impact production systems, each
one having a varying degree of control. One controllable throttle to a production system
is the amount of rework that is developed during the design and construction phase. I
show that reducing rework increases capacity, reduces variation, and leads to system
stability. I also show, qualitatively, that a better permitting process increases worker
satisfaction.
To improve the design and permitting process, we must break free from
traditional project roles, where information is isolated and protected, and move to an
environment where we understand the workflow of others, which leads to process
improvement. We should make every effort to shift the design curve to the left by
working in an integrated and collaborative environment. We should seek to eliminate
rework and if necessary reduce rework as far upstream as possible.
In section 7.1, I discuss management suggestions for healthcare facility design
resulting from this research. In section 7.2, I consolidate the limitations of my research
and answer the research questions I posed in chapter 1. In section 7.3, I discuss the
academic contributions of my research and in section 7.4, I discuss future research
questions.

239
7.1 Management Suggestions
I present the following management suggestions to reduce or eliminate negative rework
that occurs in healthcare facility design and permitting.
1. Owners could request that the design team implement a built-in quality process to
eliminate errors in design as far upstream as possible. This can enhanced by a phased
plan review process, as has been adopted by OSHPD, which allows early involvement
of its plan reviewers in the design of the healthcare facility. Previously, regulatory
reviewers were allowed to perform only a cursory preliminary review of healthcare
facility designs and had to wait until designs were submitted as 100% designs.
Presumably, this resulted in a high probability of errors being embedded early in
design because OSHPD could comment on them only when they had received the
drawings for review. OSHPD was seen as a quality control agent, when in fact, their
sole responsibility is to ensure healthcare facility designs meet code requirements.
2. Owners could request the design team to use building information modeling (BIM) to
aid in the communication of facility requirements. Ensuring that all project
participants are working off the latest design information by utilizing building
information modeling reduces the delay when changes to the design are made.
Furthermore, by using BIM, these changes to the design are made transparent to all
project participants which reduces confusion and interdisciplinary design conflicts.
3. Owners could perform business case scenarios to ensure the proposed facility can
meet all of their needs. One way of performing a business case scenario is to use a
target costing process. Target costing begins with setting a target price during the
owner’s plan validation phase. A target margin is subtracted from the target price.

240
The target price minus the target margin equals the target cost. One important tenet of
target costing is: if the target cost cannot be met, then the facility should not be
constructed (Clifton et al. 2004). For more information on target costing see Ballard
and Rybkowski (2009), and Nicolini et al. (2000).
4. Design teams could use reverse phase scheduling to appropriately allocate resources
to specific design requirements. Reverse phase scheduling starts with the end date in
mind. In California healthcare facilities, this date is typically the desired date of
occupancy. From there, the schedule is worked backward to include construction,
permitting and review, and design. Reverse phase scheduling requires an integrated
team to provide inputs on the entire series of events.
5. Better definition of handoffs for design information, owner requirements, and design
review requirements should be established. This can be enhanced by using a design
structure matrix (DSM). DSM provides the design team a way of understanding how
inter-related tasks impact each other. It also provides a simple, compact, and visual
representation of a complex system that supports innovative solutions to
decomposition and integration problems (Browning 2001). Further discussion of
DSM is outside the scope of this research. For more information on DSM see e.g.,
Tuholski (2008), Tuholski and Tommelein (2008, 2009), Crawley and Colson (2007),
and Maheswari et al. (2006).
6. Design teams could implement a production control system which reduces process
variability and promotes reliable promising. A system that provides metrics to
measure production performance in the course of process execution is highly
recommended. One such system is the Last PlannerTM (Ballard 2000).

241
7. The owner, design team, and contractors could implement a relational form of
contract which allows monetary funds to cross organizational boundaries in search of
the best possible solution. One such contract is the Integrated Form of Agreement
(IFOA).
8. Design teams could enter into a collaborative review process when submitting large
drawing documents to a state permitting agency. This review should involve all major
stakeholders and a process defined on how interactions will occur between the design
and review teams. This could also include defining what areas of the design will be
reviewed as the design evolves. Clearly stating deliverables on what is and what is
not approved on the drawings, and how each discipline will be reviewed, are vital.
Will the structural portion be a true phased and approved review? Will the other
disciplines (electrical, mechanical, architecture, and fire, life, and safety) be an
evolving review where design alternatives are agreed upon but not formally approved
until the entire system is designed. This research indeed recommends the latter.
9. Design teams could implement a set based design strategy to bring more alternatives
further down the line in the development process. Then, when enough information
presents itself, alternatives are eliminated. The benefit of this strategy is that more
information is developed for the entire design process. Also, selecting a single
alternative early in the process can introduce large amounts of negative rework if the
alternative is deemed infeasible. For further information on set based design see
Parrish (2009), Parrish et al. (2008), Ward (2007), Sobek et al. (1999), and Ward et
al. (1995).

242
These management suggestions outline approaches that are already being taken
separately and in combination by “experimental” projects. It is clear that the industry
is finding ways to improve performance. It is in this context that this dissertation
research makes its contributions to industry.
7.2 Research Findings
Figure 7-1 shows a consolidated picture of the research presented in chapters 3, 4, 5 and
6. The taxonomy of rework in chapter 3 provides a reason to study rework and its impact
on production systems. Chapter 4 describes a real world production system that is
affected by rework and a simulation model is used to demonstrate how a mechanical
contractor can deal with changes timing. The research presented in chapter 4 focuses on
the construction phase of a project and does not attempt to address rework that occurs in
the design phase. Chapter 5 analyzes a simple rework process to build intuition on three
throttles that can affect a production process. The production process is a simplified
version of a review agency and shows how resource capacity is affected by variation. The
research presented in chapter 5 focuses on the design phase of a construction project and
does not extend to the construction phase. Chapter 6 builds on chapter 5 by adding
complexity and field data into a simulation model to determine how an alternative review
process can improve a production process. This alternative review process builds quality
in the production system in an effort to eliminate rework. The research presented in
chapter 6 focuses on the review and permitting process of the design phase and does not
extend to the construction phase.

243
Figure 7-1 Consolidated Research
The rest of section 7.2 will answer the research questions I posed in chapter 1.
Research question 1: What are the root causes of rework in the healthcare facility
construction industry?
I placed the root causes of rework, as discussed in chapter 3, into three categories:
(1) design, planning, and scheduling, (2) design review, and (3) planning, programming,
and budgeting. Items were classified into discrete categories, however, I recognize that
the causes of rework may not be mutually exclusive. The categorization process remains
useful because it creates a reference point from which further discussions on process
improvement can take place. I found that the majority of rework causes are due to the
design, planning, and scheduling of the design effort. The research presented in chapter 3

244
suggests that an alternative review process can eliminate many causes of negative rework
that occur in the design, planning, and scheduling phase. This alternative review process,
which engages all stakeholders early to avoid negative rework, is discussed further in
chapter 6.
Research Question 2: What strategy should a mechanical contractor adopt to avoid
negative rework during the construction phase?
My research suggests that a mechanical contractor in light of late design changes
should adopt a delayed management strategy which is to wait to detail and fabricate items
until the last responsible moment. In case study I, the last responsible moment is to make
the changes in the field. This includes replacing items that had already been installed. A
delayed management strategy fits this scenario because the mechanical contractor
experienced variation when management tried to identify all changes occurring in the
detailing phase. Trying to identify all changes in the detailing phase caused confusion
throughout the organization because interdependence exists between detailing, released
drawings, on-site edits to drawings, and version control of drawings. Management
discovered if changes were allowed to flow to the construction site, the on-site personnel
could best determine the change which reduced workflow variation.
A delayed management strategy benefits the mechanical contractor because
changes become very clear to everyone involved when they occur. Another benefit is the
ease of determining the cost impact of the change, which in turn makes the cost clear to
the general contractor and facility owner. Also, the mechanical contractor does not get
reimbursed for work that is ‘done behind the scenes’, such as correcting deficient

245
drawings and accommodating design changes. Finally, by following this delayed
management strategy, the detailers’ motivation and productivity increased because they
did not have to stop work on current production to re-detail drawings that had incomplete
information.
Research Question 3: What are the throttles on a simple design review process and how
are they controlled?
I identified and modeled three throttles in chapter 5 that impact the design review
process. The three throttles are (1) inflow of projects, (2) review capacity, and
(3) likelihood of rework. The first throttle is difficult to control by the review
organization because it is affected by political and economic forces. Politically, the
inflow of projects is affected, e.g., by mandated facility upgrades to meet seismic
requirements. Economic forces affect the inflow of projects because of service demand.
Service demand is created by population requirements for medical care. The second
throttle can be controlled by the review agency and my computer model shows that an
increase in resource capacity is required to compensate for high rework percentages. The
third throttle is affected by the quality of drawings submitted to the review agency. My
computer simulation shows that the time to permit and the resources required to stabilize
the system decrease if the likelihood of rework remains low. Therefore, it is necessary to
develop alternative review processes that eliminate negative rework.

246
Research Question 4: What is revealed from a sensitivity analysis conducted on a plan
review simulation?
The sensitivity analysis on the review and re-review times on a plan review
simulation in chapter 6 shows that the time to permit can be improved if an alternative
review process is implemented. As modeled, this improvement is directly tied to the
amount of upfront effort invested as long as the return on the investment decreases the
rework rate and the re-review times. The rework rate and re-review times get reduced
because errors are eliminated from the design due to upfront collaboration between
design engineers and the plan review agency. Simulation of a dedicated team to perform
an alternative review process showed a statistical improvement over the current process
for reviewing category IV projects. An alternative review process requires more upfront
involvement of owners, designers, contractors, and regulators to avoid the embedding of
errors into the design drawings. An alternative process can result in fewer errors at the
final review of the drawings, thereby expediting the time to permit.
Research Question 5: How can a plan review system be stabilized for mean time to
permit and improve predictability?
I show in chapter 6 (figures 6-28 and 6-29) from my computer simulation that
implementing a dedicated review team for category IV projects stabilizes the mean time
to permit and improves the predictability of when individual projects will be approved.
Due to reduced rework rates, the instances of rework decreases, which gives healthcare
owners more predictability of when their projects would be approved and permitted.

247
Research Question 6: How can errors in healthcare facility design be detected and
corrected?
This research and literature suggests that if an error is present, the error is more
easily corrected when the design curve is shifted left because the design professionals and
plan reviewers have a greater shared understanding of the project and can quickly resolve
ambiguities and misconceptions. Also, the chance is reduced of discovering a very large
error that may require the entire project to be redesigned. Major errors are identified and
corrected early on in the process where the design team has adequate time to correct them
which eliminates the cascading effect of the error. For example, if the exiting plan for
fire, life, safety is not adequate and this error is allowed to continue down the line, it
would ultimately affect the floor layout, structural, mechanical, and electrical designs.
However, when the error is avoided to begin with, the chance of a cascading error is
eliminated.
This alternative review process allows the plan review agency to be more familiar
with the designer’s intent. Since the plan reviewer is allowed to participate early on in the
design, the design does not have to be explained to the plan reviewer during the final
permit review. For example, the plan reviewer understands the intent of the exiting plan
which details the flow of personnel during an emergency.
Research Question 7: What is the effect on the plan review agency if benefits from an
alternative review process are not realized?
If benefits from an alternative review process should not pan out, i.e, initial plan
review investment, do not reduce the rework rate and re-review times, the time to permit

248
increases dramatically. Figures 6-25 and 6-27 illustrate the increased time to permit. The
increased time to permit occurs because of constrained system resources (i.e., one
discipline reviewer), if the plan reviewer spends more time on the initial review and the
rework rate still remains high, then other projects are not being reviewed and remain in
the system longer, increasing the time to permit for all projects.
If more time is spent upfront on plan review and negative rework is not reduced,
the entire system suffers, the backlog of projects will continue to grow, and projects will
take a longer time to permit as shown in chapters 5 and 6. For example, if the alternative
review process is followed, but the owner makes dramatic changes to the drawings before
the final submittal, the chance that rework will be required is very high and the upfront
time spent on reviews by the regulatory agency will largely be wasted.
If this scenario occurs, the plan reviewers will be de-motivated because trust
within the system will be broken. A major piece that must be present for an alternative
review process to work is trust, i.e., trust that designers will not change items that have
been previously agreed upon. If this trust is broken, cascading effects occur throughout
the system: the plan reviewers will become skeptical of the process and may not continue
to put their best effort forward to follow through with the alternative review process.
Research Question 8: What strategy should a plan review agency adopt to avoid
negative rework during the design and permitting phase?
My research suggests that a plan review agency should adopt an alterative review
process that requires early involvement of plan reviewers, owners, architects, designers
and contractors during the permitting phase of a healthcare facility. Quantitatively in

249
chapter 6, I show that an alternative review process can decrease the mean and standard
deviation of the time to permit healthcare designs. A reduction in the mean time to permit
occurs because the alternative review process improves the design and permitting effort.
This alternative review process allows the shared understanding of the project to be
obtained earlier by all project stakeholders which reduces or eliminates negative rework.
7.3 Contributions to Knowledge
7.3.1 Taxonomy of Rework Contributions
Extending an existing taxonomy of rework where necessary provides a qualitative insight
on where rework occurs in the design and permitting of healthcare facilities in California.
Understanding where the causes of rework occur provides a basis for where management
can improve the process. In this research, a substantial portion of rework occurs in the
interaction between the design team and the regulators. In the current process, design
errors occur early because design teams do not interact with the regulators; this situation
creates a large source of negative rework when the errors are discovered.
This work utilizes root cause analysis by collecting information from a variety of
sources and determining causes of rework. Root cause analysis can provide design teams
with a clearer picture of what causes the permitting process to be inefficient.
This research highlights that all stakeholders within the design and construction of
healthcare facilities in California have a part to play in improving the current permitting
process. In many situations, people understand that the current process is not efficient,
but they do not have or take the time to step back and analyze the causes, instead, they
end up pointing fingers at what is wrong and at others. Consolidating and distributing this

250
research is a valuable academic contribution that enables industry members to tightly
couple learning with action.
7.3.2 Case I Contributions
Developing a discrete event simulation model of workflow of a mechanical contractor
provides both qualitative and quantitative insight on how an organization can change
their process to deal with unmanaged variation. As previously mentioned, unraveling the
interrelatedness between design detailing, fabrication, and installation provides insight
into design and construction management theory. This research provides a systematic
process on how to deal with upstream variation due to designs that continually change.
This case study supports previous research that contends that detailing and
fabrication can be delayed because of their respective speeds of production. Detailing and
fabrication can be accomplished relatively quickly which provides the mechanical
contractor time to keep up with the construction schedule by waiting for more complete
design information. This management strategy supports the idea of the last responsible
moment where one waits to make a decision until the time where an important alternative
is eliminated if a decision is not made. The ability to delay detailing and fabrication for
more complete information can be increased by reducing production lead times for
detailing, fabrication, and installation. This management strategy provides a framework
to reduce process variation.

251
7.3.3 Understanding Demand and Capacity Using Simulation Contributions
The discrete event simulation presented in chapter 5 provides an intuitive and simple way
of understanding the impact rework has on a production system. The concepts of
controlling the three throttles to a production system (inflow, production capacity, and
likelihood of rework) can be widely applied to other production systems. It provides more
evidence that developing a culture where errors are not acceptable can dramatically
improve production system performance.
Understanding the interaction between demand and capacity highlights the need
to develop a management strategy that can balance the two. Management must
understand that upstream work directly affects their resource allocation. Providing a
collaborative environment where errors are eliminated from upstream work can
significantly reduce resource demand. This research demonstrates the need to reduce
process and product variation.
7.3.4 Case II Contributions
Case study II provides a proof of concept for a discrete event simulation model that takes
OSHPD data and constructs a model of how healthcare facility permitting projects flow
through plan review time gates and how much rework is necessary.
The case study further shows the impact of an alternative review process through
a discrete event simulation model. This research adds to the body of research of computer
simulations that model existing organizational processes in an effort to understand
organizational workflow. The simulation makes a change to an organizational process
and illustrates the impact of the change against existing organizational data.

252
Design firms can understand a submission strategy for design drawings that will
improve their approval times. Providing insight to different submission strategies can
improve system performance.
This research provides a deeper understanding of the impact that various types of
work have on a review agency. Due to system behavior, changes to one category of work
impacts other categories of work. This idea can be applied to any organization that
encounters variation in their workflow.
This work provides an understanding of the challenges to implementing
alternative review processes within a plan review agency. Senior leaders of the
organization expressed caution and skepticism to adopt a different process due to the
uncertainty of whether or not the new process will make an improvement. This is a major
hurdle in adopting any new process. However, conducting computer simulation analysis
of the process change, gives confidence to the organization that a change can improve the
process.
Case study II reveals the impact an alternative review process can have on the
regulatory agency and the design community. The simulations of the alternative review
process show a dramatic effect on the time to permit a California healthcare facility. The
original design process is quite isolated for the design engineers; whereas an alternative
review process is much more collaborative. However, new operating procedures have to
be followed and many designers realize that the old paradigms of designing and then
throwing information over the wall will not work in this alternative review process.

253
7.4 Future Research
I raise the following future research questions.
Question 1. How does implementing a chief engineer who would understand owner
needs and then conveys those needs to the design team impact the permitting process?
Womack and Shook (2006) state the chief engineer is the most important person in an
organization because he/she listens to the owner and then determines what the
organization need to do to address owner’s needs. In construction, multiple tiers of needs
exist for a facility. At one level, the design team needs to know the overall function of the
building. At another level, the design team needs to know specific details from groups of
owner representatives. For example, at a high level, a healthcare facility will support 200
beds and 10 surgical rooms. At a lower level, each discipline engineer must meet with
owner representatives to determine the specific needs to support the overall need for the
facility. Traditionally, each discipline engineer is left on their own to determine what are
the owner needs and then the discipline engineers have to come together to address the
conflicts. In contrast, a chief engineer would understand both the high and low level
needs for all disciplines and balance those against what is feasible both technically and
economically. In this scenario, the chief engineer would also understand the concerns of
the regulatory agency and be able to convey their needs to the discipline engineers. This
would alleviate continuity and misinformation issues that arise during traditional project
reviews. However, very few individuals are trained to understand architectural, structural,
mechanical, electrical engineering and all the other disciplines needed to construct a
healthcare facility. AEC practitioners have not traditionally used chief engineers, but
opportunities exist to develop people in this role.

254
Question 2. How does assigning rework to multiple disciplines affect the permitting
process? Currently the simulation model described in chapter 6 assigns one discipline
error during each rework cycle. However, multiple errors can be embedded
simultaneously into each rework cycle. For instance, a required change in fire, life, and
safety requires a change in the structural, mechanical, and electrical layouts. If the exiting
plan has to change the layout of the floor plan, the mechanical and electrical systems may
have to be moved. At the very least, the systems have to be rechecked, which requires the
drawing set to return to those discipline reviewers. This recheck would increase the time
to review drawings through the various disciplines and this, in turn, would increase the
time to permit. While the current model reasonably predicts the time to permit a drawing
set, adding multiple discipline errors may shed further light on the overall process. By
adding this to the model, it may be possible with more data from OSHPD to understand
which discipline affects the time to permit the most. I believe that if rework in structural
and fire, life, and safety disciplines is required early, more rework will be required by all
of the engineering disciplines because those two systems of the facility affect the layout
of mechanical, electrical, and plumbing.
Question 3. How can an adaptive algorithm be implemented into the simulation to allow
continuous updating of model inputs? The current model distinguishes the category of
projects by dollar amounts, mirroring how the FDD categorizes their projects. This
categorization keeps the developed model consistent with the current organizational
record keeping. It is also a way to relate the information when presenting the simulation
model to the organization. However, because the model is set to use dollars, the model
can become outdated in a few years because of inflation. Future work would consist of

255
implementing an algorithm that can adjust for these changes to keep the model up to date
and relevant. This algorithm would use the organization’s existing data to change the
categories in which the review, rework, and re-review characteristics are held.
Question 4. What is the system impact of using a dedicated review team on the time to
permit? My initial assessment of the use of a dedicated review team is positive. However,
further exploration would include dedicated review teams for smaller projects, i.e.,
projects in categories I and II. Category I and II projects represent the largest number of
projects encountered by each OSHPD plan review region. It would be interesting to see
how the system dynamics would be altered if a team were dedicated to solely review
them. The FDD is looking at implementing a hybrid model of this dedicated review team
by setting up times to review these small projects knowing that they require less rework,
and permits can be issued with only slight changes to the drawings.
Question 5. What is the impact on the time to permit if rework is reduced in all drawing
categories? I realize that the permitting of healthcare facilities in California is a system,
therefore, I would expect that the reduction of rework percentages and review times of
the other three project categories would substantially improve the time to permit for the
entire system. The first way to improve the time to permit is to reduce the occurrences of
rework in the system. Implementing a built-in quality process that avoids and removes
errors in documents is the best way to improve the permitting process. The next step is to
categorize and explore the documents required in submitting permitting plans and then
detail the information each plan requires. OSHPD has tried to eliminate some of the
rework by developing code application notices (CANs) and policy information notices
(PINs) to reduce the amount of errors in submittals. For example, CAN 2-3403A

256
provides design teams an acceptable approach to seismically retrofit single story hospital
buildings (OSHPD 2008). However, by reviewing existing data, this procedure has not
helped because the rework rates in structural review are still over 85%.
The FDD may benefit by developing a training program for design practitioners
and investing money into a mobile training or webinar series that explains what
information is required prior to plan submission. While the organization does charge a fee
for reviewing documents, a disincentive program could be established charging extra fees
when rework of permit documents is required. The fee would have to be high enough to
ensure design teams delay the submittal of documents until they are more complete and
accurate. The fee system could work with the first rework cycle being free, but imposing
hefty fines during any subsequent rework cycles. Implementing a simulation model to
test these management strategies would give insight into the overall impact to the system.
Question 6. What are the cost impacts of the causes of rework? This work does not
attempt to track the cost implication of rework. Documenting the cost to rework items
due to agency review will provide insight to the industry that real process improvement is
required. It would be interesting to track the actual cost of reviews to what is charged by
FDD, and relate that to how many rework cycles occur. It would also be interesting to
look at the cost implication of implementing an alternative review process. Realizing the
upfront design review work requires spending money, is the payback really worth the
investment in regards to dollars? What is the impact of fewer rework cycles on the design
and construction of the project? Ultimately, does having better permit drawings improve
the construction of the healthcare facility project? Are there fewer change orders to the
drawings and fewer requests for information from the contractor because the contractors

257
were involved in the design process? What is the impact of an alternative review process
on the field staff that reviews the construction process? Does the field staff provide fewer
notices to the contractor? Does this improve delivery of healthcare facilities? In many of
these questions, in Toyota’s experience, the answer is “yes.”
Question 7. What is the impact of the timing of changes on the flow of work for a
mechanical contractor? Case study I used only generic resources (duct work is
indistinguishable from piping). It would be interesting to explore the different types of
rework that are encountered by the mechanical subcontractor. It would be interesting to
compare the two types of work (dryside vs. wetside) that the company encounters. Is
there more rework in ductwork or piping? This research would be case based because the
setting of the project is important. Knowing what types of contracts and delivery model
are being used affects project behavior.
In conclusion, the research presented in this dissertation answers a few questions
on the effect of rework on the design and permitting of healthcare facilities, yet, raises
many more questions that can be explored in the future. Furthermore, this research shows
that process improvements can not be made individually, but requires a consolidated and
collaborative effort by the entire industry. I know that this type of process improvement
is daunting, but I am confident, through the case studies I present in this research, that
process improvement can improve. This improvement will not only provide better
healthcare for all, but people will want and strive to be a part of the design and
construction industry.

258
REFERENCES
Agbulos, A., Mohamed, Y., Al-Hussein, M., Abourizk, S., and Roesch, J. (2006).
“Application of Lean Concepts and Simulation Analysis to Improve Efficiency of
Drainage Operations Maintenance Crews.” ASCE Journal of Construction
Engineering and Management, 132(3), 291-299.
Alves, T. D. C. L. (2005). “Value Stream Mapping for Make-to-Order Products in a Job
Shop Environment.” Proc. of the 2005 Construction Research Congress: Broadening
Perspective, 5 - 7 April, San Diego, CA, 13-22.
Alves, T. D. C. L., and Tommelein, I. D. (2006). “Simulation as a Tool for Production
System Design in Construction.” Proc. 14th Conference of the International Group
for Lean Construction (IGLC 14), 25 - 27 July, Santiago, Chile, 341-353.
Amabile, T., Hill, K., Hennessey, B., and Tighe, E. (1995). “The Work Preference
Inventory: Assessing Intrinsic and Extrinsic Motivational Orientations.” Journal of
Personality and Social Psychology, 68(4), 580.
Arbulu, R. J., Tommelein, I. D., Walsh, K., and Hershauer, J. (2002). “Contributors to
Lead Time in Construction Supply Chains: Case of Pipe Supports Used in Power
Plants.” Proc. of Winter Simulation Conference 2002, 8 - 11 Dec, San Diego, CA,
1745-1751.
Backhouse, C. J., and Brookes, N. J. (1996). Concurrent Engineering: What’s Working
Where. Gower, Brookfield, VT.
Ballard, G. (2000). “Positive vs Negative Iteration in Design.” Proc. 8th Conference of
the International Group for Lean Construction (IGLC 8), 17-19 July, Brighton,
United Kingdom, 317-328.

259
Ballard, G., and Rybkowski, Z. (2009). “Overcoming the Hurdle of First Cost: Action
Research in Target Costing.” ASCE Proc. of the 2009 Construction Research
Congress, April 5-7, Seattle, WA.
Ballard, G., Tommelein, I., Koskela, L., and Howell, G. (2002). “Lean Construction
Tools and Techniques.” Chapter 15 in Rick Best and Gerard de Valence (editors,
2002). Design and Construction: Building in Value, Butterworth-Heinemann,
Elsevier Science Ltd., 227-255.
Becker, H. S. (1998). Tricks of the Trade: How to Think About Your Research While
You’re Doing It. University of Chicago Press, Chicago, IL.
Bennett, F. L. (2003). The Management of Construction: A Project Life Cycle Approach.
Butterworth-Heinemann, Boston, MA.
Berlyne, D. E. (1971). Aesthetics and Psychobiology. Appleton-Century-Crofts, New
York, NY.
Borgatta, E. F., and Borgatta, M. L. (1992). Encyclopedia of Sociology. Macmillan, New
York, NY.
Browning, T. R. (2001). “Applying the Design Structure Matrix to System
Decomposition and Integration Problems: A Review and New Directions.” IEEE
Transactions of Engineering Management, 48(3), 292-306.
Burati, J., Farrington, J., and Ledbetter, W. (1992). “Causes of Quality Deviations in
Design and Construction.” ASCE Journal of Construction Engineering and
Management, 118(1), 34-49.
Bureau of Labor Statistics. (2007). “Construction Employment.” http://data.bls.gov/
(May 17, 2007).

260
Buscher, U., and Lindner, G. (2007). “Optimizing a Production System with Rework and
Equal Sized Batch Shipments.” Computers Operations Research, 34(2), 515.
Chase, S. (2005). “Narrative Inquiry: Multiple Lenses, Approaches, Voices.” The SAGE
Handbook of Qualitative Research, N. K. Denzin, and Y. S. Lincoln, eds., Sage
Publications, Thousand Oaks, CA, 651-680.
Chung, C. A. (2004). Simulation modeling handbook a practical approach. CRC Press,
Boca Raton, LA.
Collier, K. (2001). Construction Contracts. Merrill Prentice Hall, Upper Saddle River,
NJ.
Construction Industry Development Agency (1995). “Measuring Up or Muddling
Through: Best Practice in the Australian Non-Residential Construction Industry.”
Construction Industry Development Agency and Master Builders Australia, 59-63.
Construction Owners Association of Alberta. (2002). “Project Rework Reduction Tool.”
http://www.coaa.ab.ca/costreduction/prrt/ (May 11, 2007).
Construction Owners Association of Alberta. (2001). “Meeting Minutes.” Edmonton,
Alberta, 1-200.
Cook, R., Lott, F., Milton, B., Eckblad, S., and Ashcraft, H. (2007). “Integrated Project
Delivery: A Guide.” Rep. No. 1, American Institute of Architects, Los Angeles, CA.
Crawley, E., and Colson, J. (2007). “The Projection Relationship between Object Process
Models (OPM) and Design System Matrices (DSM).” Proc. 9th International Design
Structure Matrix Conference, 16-19 Oct., Munich, Germany, 137-150.
Creswell, J. W. (2007). Qualitative Inquiry and Research Design: Choosing Among Five
Approaches. Sage Publications, Thousand Oaks, CA.

261
Creswell, J. W. (2003). Research Design :Qualitative, Quantitative, and Mixed Methods
Approaches. Sage Publications, Thousand Oaks, CA.
Deci, E. L., and Ryan, K. (1985). Intrinsic Motivation and Self-Determination in Human
Behavior. Plenum Publications, New York, NY.
DeMarco, T. (1982). Controlling Software Projects: Management, Measurement and
Estimation. Yourdon Press, New York, NY.
Deming, W. E. (1982). Quality, Productivity, and Competitive Position. Massachusetts
Institute of Technology, Center for Advanced Engineering Study, Cambridge, MA.
Denzin, N. K., and Lincoln, Y. S. (2005). The SAGE Handbook of Qualitative Research.
Sage Publications, Thousand Oaks, CA.
Dillman, D. A., and Tarnai, J. (1992). “Mode Effects of Cognitively Designed Recall
Questions: A Comparison of Answers to Telephone and Mail Surveys.” Measurement
Errors in Surveys, P. Biemer, ed., John Wiley & Sons, New York, NY.
Dillman, D. A. (2007). Mail and Internet Surveys: The Tailored Design Method. Wiley
Publications, Hoboken, NJ.
Dinero, D. A. (2005). Training Within Industry: The Foundation of Lean. Productivity
Press, New York, NY.
Egan, J. (1998). Rethinking Construction: Construction Task Force (CTF) Report.
Department of the Environment, Transport and the Regions, London, UK.
Fairley, R. E. (2005). “Iterative Rework: The Good, the Bad, and the Ugly.” Computer,
38(9), 34.

262
Fayek, A. R., Dissanayake, M., and Campero, O. (2004). “Developing a Standard
Methodology for Measuring and Classifying Construction Field Rework.” Canadian
Journal of Civil Engineering, 31(6), 1077-1089.
Ford, D. N., Hou, A., and Seville, D. (1993). “An Exploration of Systems Product
Development at Gadget Inc., System Dynamics Group.” Rep. No. D-4460,
Massachusetts Institute of Technology, Cambridge, MA.
Ford, D. (2003). “Overcoming the 90% Syndrome: Iteration Management in Concurrent
Development Projects.” Concurrent Engineering, Research and Applications, 11(3),
177-186.
Ford, D. (2003). “The Liar’s Club: Concealing Rework in Concurrent Development.”
Concurrent Engineering, Research and Applications, 11(3), 211-219.
Gaspar, J. E., Leonard, B., Kolari, J. W., Hise, R. T., Smith, L. M., and Arreola-Risa, A.
(2006). Introduction to Business. Wiley, Cambridge, MA.
Ghauri, P. N., and Gronhaug, K. (2002). Research Methods in Business Studies: A
Practical Guide. Financial Times Prentice Hall, Harlow, UK.
Gilbreth, F. B., and Gilbreth, L. M. (1922). “Process Charts and Their Place in
Management.” Mechanical Engineering, January, 38-41.
Gilgun, J. (1994). “A Case for Case Studies in Social Work Research.” Social-Work,
39(4), 371.
Gillengerten, J. (2008). Personal communication with P. Feng, “Validation of Computer
Model”, OSHPD, Sacramento, CA. Oct 14.
Giorgi, A. (1985). Phenomenology and Psychological Research. Duquesne University
Press, Atlantic Highlands, NJ.

263
Grout, J. (2007). “Mistake-Proofing the Design of Healthcare Processes.” Rep. No.
AHRQ Publication No. 07-0020, Agency for Healthcare Research and Quality,
Rockville, MD.
Gryna, F. M., Chua, R., and DeFeo, J. (2007). Juran’s Quality Planning and Analysis:
For Enterprise Quality. McGraw-Hill, Boston, MA.
Halepota, H. (2005). “Motivational Theories and Their Application in Construction.”
Cost Engineering, 47(3), 14.
Halpin, D. W., and Kueckmann, M. (2002). “Lean Construction and Simulation.” Proc.
of Winter Simulation Conference, 8 - 11 Dec., San Diego, CA, 1697-1703.
Halpin, D. W., and Woodhead, R. (1998). Construction Management. Wiley, New York,
NY.
Hanna, A. S., Camlic, R., Peterson, P. A., and Nordheim, E. V. (2002). “Quantitative
Definition of Projects Impacted by Change Orders.” ASCE Journal of Construction
Engineering and Management, 128(1), 57-64.
Hanna, A. S., and Brusoe, J. (1997). “Study of Performance Evaluations in Electrical
Construction Industry.” ASCE Journal of Management in Engineering, 13(6), 66.
Hanna, A. S., Russell, J., Nordheim, E., and Bruggink, M. (1999). “Impact of Change
Orders on Labor Efficiency for Electrical Construction.” ASCE Journal of
Construction Engineering and Management, 125(4), 224.
Harlow, H., Harlow, M., and Meyer, D. (1950). “Learning Motivated by a Manipulation
Drive.” Journal of Experimental Psychology, 40 228-234.
Heier, C. (2008). Personal communication with P. Feng, “Understanding Work Flow
Process”, FM Booth Office, Roseville, CA Mar 6.

264
Hendrickson, C., and Tung, A. (1989). Project Management for Construction:
Fundamental Concepts for Owners, Engineers, Architects, and Builders. Prentice
Hall, Englewood Cliffs, NJ.
Hirano, H., and Shimbun, N (1989). Poka-Yoke: Improving Product Quality by
Preventing Defects. Prodcutivity Press, Cambridge, MA.
Hunt, J. (1965). “Intrinsic Motivation and its Role in Psychological Development.”
Nebraska Symposium on Motivation, University of Nebraska Press, Lincoln, NE, 189-
282.
Ibbs, C. W., and Allen, W. E. (1995). “Quantitative Impacts of Project Change.” Rep. No.
108, CII, Austin, TX.
Ibbs, W. (2005). “Impact of Change’s Timing on Labor Productivity.” ASCE Journal of
Construction Engineering and Management, 131(11), 1219-1223.
Inderfurth, K., Lindner, G., and Rachaniotis, N. P. (2005). “Lot Sizing in a Production
System with Rework and Product Deterioration.” International Journal of Production
Research, 43(7), 1355-1365.
Isaac, S., and Navon, R. (2008). “Feasibility Study of an Automated Tool for Identifying
the Implications of Changes in Construction Projects.” ASCE Journal of Construction
Engineering and Management, 134(2), 139-145.
Ishikawa, K. (1982). Guide to Quality Control. Asian Productivity Organization, New
York, NY.
Josephson, P., and Hammarlund, Y. (1999). “Causes and Costs of Defects in
Construction a Study of Seven Building Projects.” Automation in Construction, 8(6),
681-687.

265
Kiewel, B. (1998). “Measuring Progress in Software Development.” PM Network, 12(1),
29-32.
Koskela, L. (2004). “Making-Do: The Eighth Category of Waste.” Proc. 12th Conference
of the International Group for Lean Construction (IGLC 12), 3-5 Aug, Copenhagen,
Denmark.
Koskela, L. (2000). “An Exploration Towards a Production Theory and its Application to
Construction.” VTT Publications, Espoo, Finland.
Law, A. M. (2007). Simulation Modeling and Analysis. McGraw-Hill, Boston, MA.
Leemis, L. M. (2006). Discrete Event Simulation: A First Course. Pearson Prentice Hall,
Upper Saddle River, NJ.
LeGates, R. T., and Stout, F. (2007). The City Reader. Routledge, New York, NY.
Leonard, C., Moselhi, O., and Fazio, P. (1991). “Impact of Change Orders on
Construction Productivity.” Canadian Journal of Civil Engineering, (18), 484-492.
Leonard, C.A, (1988), The Effects of Change Orders on Productivity, Thesis, M.Eng.
(Building), Centre for Building Studies, Concordia University, Irvine, CA.
Lichtig, W. (2008). “Common Understanding vs. Time.” McDonough Holland & Allen
Attorneys at Law, Presentation, Sacramento, CA
Lichtig, W. (2005). “Integrated Agreement for Lean Project Delivery.” Sacramento, CA,
1-76.
Liker, J. K. (2004). The Toyota Way: 14 Management Principles From the World’s
Greatest Manufacturer. McGraw-Hill, New York, NY.
Liker, J. K., and Hoseus, M. (2008). Toyota Culture: The Heart and Soul of the Toyota
Way. McGraw-Hill, New York, NY.

266
Liker, J. K., and Meier, D. (2007). Toyota Talent: Developing Your People the Toyota
Way. McGraw-Hill, New York, NY.
Liu, L. Y. (1991). “COOPS: Construction Object-Oriented Simulation System.” PhD
Dissertation, University of Michigan, Ann Arbor, MI.
Love, P.E.D. Mandal,Li, (1999). “Determining the Causal Structure of Rework
Influences in Construction.” Construction Management and Economics, 17(4), 505-
515.
Love, P. E. D., and Heng, L. (2000). “Quantifying the Causes and Costs of Rework in
Construction.” Construction Management and Economics, 18(4), 479-490.
Love, P. E. D. (2002). “Influence of Project Type and Procurement Method on Rework
Costs in Building Construction Projects.” ASCE Journal of Construction Engineering
and Management, 128(1), 18-28.
Macneil, I. R. (1974). “The Many Futures of Contract.” Southern California Law Review,
47(3), 691-816.
Maheswari, J. U., Varghese, K., and Sridharan, T. (2006). “Application of Dependency
Structure Matrix for Activity Sequencing in Concurrent Engineering Projects.” ASCE
Journal of Construction Engineering and Management, 132(5), 482-490.
Makela, K. (2002). “Construction of Common Understanding. Interplay of
Organizational Culture, Communication and Knowledge in Inter-company R&D
Projects, Master’s thesis, Department of Communication, University of Helsinki,
Finland.
Mann, D. (2005). Creating a Lean Culture: Tools to Sustain Lean Conversions.
Productivity Press, New York, NY.

267
Mao, X., and Zhang, X. (2008). “Construction Process Reengineering by Integrating
Lean Principles and Computer Simulation Techniques.” ASCE Journal of
Construction Engineering and Management, 134(5), 371-381.
Martinez, J. C. (1996). “STROBOSCOPE State and Resource Based Simulation of
Construction Processes.” PhD thesis, University of Michigan, Ann Arbor, MI.
Meyer, C. (1993). Fast Cycle Time: How to Align Purpose, Strategy, and Structure for
Speed. Free Press, New York, NY.
Mohar, J. (2007). Personal communication with P. Feng, “Understanding Detailing
Process”, FM Booth Office, Roseville, CA. Sep 15.
Montgomery, K. (1954). “The Role of Exploratory Drive in Learning.” Journal of
Comparative and Physiological Psychology, 47-60.
Morris, P. (2007). “Construction Cost Escalation in California Healthcare Projects.” Rep.
No. Jan, Davis Langdon, Sacramento, CA.
Moustakas, C. E. (1994). Phenomenological Research Methods. Sage Publications,
Thousand Oaks, CA.
Nevins, J. L., and Whitney, D. (1989). Concurrent Design of Products and Processes: A
Strategy for the Next Generation in Manufacturing. McGraw-Hill, New York, NY.
Ng, S. T., Skitmore, R., Lam, K., and Poon, A. (2004). “Demotivating Factors
Influencing the Productivity of Civil Engineering Projects.” International Journal of
Project Management, 22 (2), 139-142.
Nicolini, D., Holti, R., Oldman, A., and Smalley, M. (2000). “Can Target Costing and
Whole Life Costing be Applied in the Construction Industry? Evidence from Two
Case Studies.” British Journal of Management, 11, 303-324.

268
Office of Statewide Health Planning and Development. (2007). “About OSHPD - Boards
Committees & Commissions HBSB.”
http://www.oshpd.ca.gov/Boards/HBSB/index.htm (February 25, 2007).
Office of Statewide Planning and Development. (2008). “Facilities Development
Division.” http://www.oshpd.ca.gov/FDD/Plan_Review/Hosp_Insp.html (August 15,
2008).
Oiler, C. J. (1986). Nursing Research: A Qualitative Perspective. Appleton Century
Crofts, Norwalk, CT.
Ohno, T. (1988). Toyota Production System: Beyond Large Scale Production.
Productivity Press, Cambridge, MA.
Parrish, K. (2009). “Application of a Set-Based Design Approach to Reinforced Concrete
Design.” PhD Dissertation, Civil and Environmental Engineering, University of
California, Berkeley, CA.
Parrish, K., Wong, J. M., Tommelein, I. D., and Stojadinovic, B. (2008). “Set-Based
Design: A Case Study on Innovative Hospital Design.” In P. Tzortzopoulos and M.
Kagioglou (eds.) Proc. 16th Annual Conference of the International Group for Lean
Construction (IGLC-16), 16-18 July, Manchester, United Kingdom, 413-423.
Patterson, M. L. (1993). Accelerating Innovation: Improving the Process of Product
Development. Van Nostrand Reinhold, New York, NY.
Perrow, C. (1967). “A Framework for the Comparative Analysis of Organizations.”
American Sociological Review, 32(2), 194-208.

269
Pinnegar, S., and Daynes, J. G. (2007). “Locating Narrative Inquiry Historically:
Thematics in the Turn to Narrative.” Handbook of Narrative Inquiry: Mapping a
Methodology, D. J. Clandinin, ed., Sage Publications, Thousand Oaks, CA.
Poppendieck, M. (2003). “Lean Development and the Predictability Paradox.” 1-39, Eden
Prairie, MN.
Porter, M. E. (1985). Competitive Advantage: Creating and Sustaining Superior
Performance. Free Press, New York, NY.
Rahman, M. M., and Kumaraswamy, M. M. (2004). “Contracting Relationship Trends
and Transitions.” ASCE Journal of Management in Engineering, 20(4), 147-161.
Rahman, M. M. (2007). “Building a Relational Contracting Culture and Integrated
Teams.” Canadian Journal of Civil Engineering, 34(1), 75-88.
Repenning, N. P., and Sterman, J. (2001). “Nobody Ever Gets Credit for Fixing Problems
that Never Happened: Creating and Sustaining Process Improvement.” IEEE
Engineering Management Review, 30(4), 64-78.
Revay, S. (2003). “Coping with Changes.” Transactions of the American Association of
Cost Engineers, R251-R257.
Rogge, D. F., Cogliser, C., Alaman, H., and McCormack, S. (2001). “An Investigation of
Field Rework in Industrial Construction.” Rep. No. RR153-11, CII, Austin, TX.
Rubin, H. J., and Rubin, I. (2005). Qualitative Interviewing: The Art of Hearing Data.
Sage Publications, Thousand Oaks, CA.
Sacks, R., Esquenazi, A., and Goldin, M. (2007). “LEAPCON: Simulation of Lean
Construction of High-Rise Apartment Buildings.” ASCE Journal of Construction
Engineering and Management, 133(7), 529-540.

270
Salant, P., and Dillman, D. (1994). How to Conduct Your Own Survey. John Wiley &
Sons, New York, NY.
Schippers, W. A. J. (1999). “Process Matrix, A Simple Tool to Analyze and Describe
Production Processes.” Quality and Reliability Engineering International, 15(6), 469-
473.
Shewhart, W. A. (1931). Economic Control of Quality of Manufactured Product. D. Van
Nostrand Company, Inc., New York, NY.
Slane, D. (2008). Personal communication with P. Feng, “Understanding On-Site Work
Flow Process”, Kaiser Permanente Hospital, Vacaville, CA, Mar 6.
Sterman, J.D. (2002). “Systems Dynamics Modeling: Tools for Learning in a Complex
World.” IEEE Engineering Management Review, 30 (1), 42-52.
Strauss, A. L., and Corbin, J. (1990). Basics of Qualitative Research: Grounded Theory
Procedures and Techniques. Sage Publications, Newbury Park, CA.
Sweet, J. (2004). Legal Aspects of Architecture, Engineering, and the Construction
Process. Thomson, Toronto, Ontario.
Tesch, R. (1988). “The Contribution of a Qualitative Method: Phenomenological
Research,” Qualitative Research Management, Santa Barbara, CA.
Tocher, K. D., and Owen, D. G. (1960). “The Automatic Programming of Simulations.”
Proc. IFORS Conference, Aix-en-Provence, France, 50-67.
Tommelein, I. D. (1998). “Pull-driven Scheduling for Pipe-Spool Installation: Simulation
of Lean Construction Technique.” ASCE Journal of Construction Engineering and
Management, 124(4), 279-288.

271
Tommelein, I.D., Carr, R.I., and Odeh, A.M. (1994). “Assembly of Simulation Networks
Using Designs, Plans, and Methods.” ASCE Journal of Construction Engineering and
Management, 120(4), 796-815.
Tulholski, S.J. (2008). “Transformation, Flow, and Value Constellations in AEC
Projects.” PhD Dissertation, Civil and Environmental Engineering, University of
California, Berkeley, CA.
Tuholski, S. J., and Tommelein, I. D. (2008). “Design Structure Matrix (DSM)
Implementation on a Seismic Retrofit.” In P. Tzortzopoulos and M. Kagioglou (eds.)
Proc. 16th Annual Conference of the International Group for Lean Construction
(IGLC 16), 16-18 July, Manchester, United Kingdom, 471-483.
Tuholski, S. J., and Tommelein, I. D. (2009). “Design Structure Matrix (DSM)
Implementation on a Seismic Retrofit.” ASCE Journal of Engineering Management,
In Review.
Vroom, V. H. (1964). Work and Motivation. Wiley, New York, NY.
Wheelwright, S. C., and Clark, K. (1992). Revolutionizing Product Development:
Quantum Leaps in Speed, Efficiency, and Quality. Free Press, New York, NY.
White, R. (1959). “Motivation Reconsidered: The Concept of Competence.”
Psychological Review, (66), 297-323.
Winkler, D., and Biffl, S. (2006). “An Empirical Study on Design Quality Improvement
from Best Practice Inspection and Pair Programming.” International Symposium on
Empirical Software Engineering (ISESE), 21-22 September, Rio De Janeiro, Brazil.
Womack, J. (2006). “A Lesson to be Learned.” Manufacturing Engineer, 85(2), 4.

272
Womack, J. P., Jones, D., and Roos, D. (1991). The Machine That Changed the World:
The Story of Lean Production. Harper Perennial, New York, NY.
Womack, J.P., and Shook, J. (2006). “Lean Management and the Role of Leadership.”
http://www.lean.org/jims_replies.html (Apr 16, 2008).
Wortmann, J. C. (1992). “Factory of the Future: Towards an Integrated Theory for One-
of-a-Kind Production.” Working Conference on New Approaches towards “One-of-a-
Kind” Production, Elsevier Science, Bremen, Germany.
Yin, R. K. (2003). Case Study Research: Design and Methods. Sage Publications,
Thousand Oaks, CA.
Zaghloul, R., and Hartman, F. (2003). “Construction Contracts: The Cost of Mistrust.”
International Journal of Project Management, 21(6), 419-424.

273
Appendix A Causes of Rework Data

Description First level Second level Third levelEngineer drawings not used for construction
Construction Planning and Scheduling
Constructability problems
Drawings vs. field construction issues
Changes "ripple" through disciplines
Design Planning and Scheduling Design changes Scope changes
Drawings not correct or complete.
Design Planning and Scheduling
Errors and omissions
Inaccurate/ incorrect drawings
Equipment selection not properly timed
Design Planning and Scheduling
Improper equipment selection
Inappropriate timing for equipment selection
Customization / innovation Design Planning
and SchedulingInappropriate design process
Unable to handle customization/innovation
Target costing batches too large
Design Planning and Scheduling
Inappropriate batch size Large batch
Batch size Design Planning and Scheduling
Inappropriate batch size Large batch
Timing (continuous flow of work)
Design Planning and Scheduling
Inappropriate batch size
No continuous flow of work
Lack of appropriate resources (people, who draws what, design assist)
Design Planning and Scheduling
Inappropriate design process
Constrained resources
Not enough time - unrealistic promises, unexpected issues, failure of one part to deliver, other demands, fear
Design Planning and Scheduling
Inappropriate design process
Constrained resources
Lack of design team resources and everyone else's resources, too; lack of skills
Design Planning and Scheduling
Inappropriate design process
Constrained resources
Lack of work in 3D. Design Planning and Scheduling
Inappropriate design process
Constrained resources
Slowest discipline determing critical path.
Design Planning and Scheduling
Inappropriate design process
Design held up by slowest discipline

Description First level Second level Third levelDesign team reviews and decisions made in silos (no "big room").
Design Planning and Scheduling
Inappropriate design process
Designing in isolation
No dimension lines Design Planning and Scheduling
Inappropriate design process errors & omissions
Incomplete unnecessary set to OSHPD
Design Planning and Scheduling
Inappropriate design process errors & omissions
User group process - programming, schematic design (SD), design development (DD), Contract Documents (CD), Permitting, Construction Administration (CA) - Mistakes or delays in DD cause no delay in DD but delay the project 20 days in CD and 40 days in CA
Design Planning and Scheduling
Inappropriate design process errors & omissions
Overprocessing - focus on wrong elements
Design Planning and Scheduling
Inappropriate design process
Focus on wrong elements
Use wrong person for task Design Planning and Scheduling
Inappropriate design process
Improper skill assignment
Contractor specific plans and specifications
Design Planning and Scheduling
Inappropriate design process
Inadequte information
Incomplete design Design Planning and Scheduling
Inappropriate design process Incomplete design
Information needed by team members is not defined.
Design Planning and Scheduling
Inappropriate design process
Incomplete information
Focus on details too soon. Design Planning and Scheduling
Inappropriate design process
Incomplete information
Using wrong processes for wrong client.
Design Planning and Scheduling
Inappropriate design process
Incorrect alignment of process
Design for multiple vendors/clients
Design Planning and Scheduling
Inappropriate design process
Incorrect information
[3] A/E selection process – lost time/revenue if not selected
Design Planning and Scheduling
Inappropriate design process
Inefficient decision making

Description First level Second level Third level[2] Infrastructure sizing/locations (wastes # 1, 6, 7, 8) too early
Design Planning and Scheduling
Inappropriate design process
Inefficient decision making
[1] Timing of selection of CM/GC
Design Planning and Scheduling
Inappropriate design process
Inefficient decision making
Early or late engagement of key A/E/CMSC/party
Design Planning and Scheduling
Inappropriate design process
Inefficient decision making
User group/input process Design Planning and Scheduling
Inappropriate design process
Inefficient decision making
Lack of alignment between system and affiliate
Design Planning and Scheduling
Inappropriate design process
Inefficient decision making
Information loss at hand off (technology)
Design Planning and Scheduling
Inappropriate design process
Information lost at handoff
Design - constructability disconnect
Design Planning and Scheduling
Inappropriate design process
Information not aligned
[1] Unclear expectations of ‘when’
Design Planning and Scheduling
Inappropriate design process
Lack of complete information
[2] Prelim MEP coordination drawings
Design Planning and Scheduling
Inappropriate design process
Lack of complete information
[1] Clearly define OSHPD submittal package Design Planning
and SchedulingInappropriate design process
Lack of complete information
Design disciplines not hearing user group concerns first hand, or not having early "vision" discussions with client
Design Planning and Scheduling
Inappropriate design process
Lack of complete information
Shift of design intent from SD's
Design Planning and Scheduling
Inappropriate design process
Lack of complete information
Deferred approvals Design Planning and Scheduling
Inappropriate design process
Lack of complete information
Lack of coordination between design team
Design Planning and Scheduling
Inappropriate design process
Lack of coordination
Lack of coordination (technical disciplines)
Design Planning and Scheduling
Inappropriate design process
Lack of coordination
Communication (RFI's) Design Planning and Scheduling
Inappropriate design process
Lack of coordination

Description First level Second level Third levelShop drawing process occurs late and without collaboration and is redrawn
Design Planning and Scheduling
Inappropriate design process
Lack of coordination
RFI process Design Planning and Scheduling
Inappropriate design process
Lack of coordination
Poor information transfer - not understandingwhat others need, not understanding possible prevision, not easy to understand, too late
Design Planning and Scheduling
Inappropriate design process
Lack of coordination
Poor information - accuracy / preliminaries, - incompleteness, - timing, - changes not marked
Design Planning and Scheduling
Inappropriate design process
Lack of coordination
Out of synch. processes. Design Planning and Scheduling
Inappropriate design process
Lack of coordination
Expectation about who provides information
Design Planning and Scheduling
Inappropriate design process
Lack of coordination
[1] user group meetings – unclear process
Design Planning and Scheduling
Inappropriate design process
Lack of coordination
[2] third-party MEP review/coordination
Design Planning and Scheduling
Inappropriate design process
Lack of coordination
Submittals process (including post-approvals) Design Planning
and SchedulingInappropriate design process
Lack of coordination
[1] End of phase submittal package (batch sizes) & transition between phases
Design Planning and Scheduling
Inappropriate design process
Lack of coordination
Lack of standardization (studs, stairs) optimizing the pieces (steel tonnage)
Design Planning and Scheduling
Inappropriate design process
Lack of standardized design elements
BC turnaroundDesign Planning and Scheduling
Inappropriate design process
Length of time for backcheck completion
Out of synch. with owner values
Design Planning and Scheduling
Inappropriate design process
Not understanding owner values

Description First level Second level Third levelDesigner/fabricator not aligned
Design Planning and Scheduling
Inappropriate design process
Outcomes not aligned
studies, number of meetings, unclear process, don’t have right people in the room
Design Planning and Scheduling
Inappropriate design process Overprocessing
[2] Design team detail drawings vs. shop drawings
Design Planning and Scheduling
Inappropriate design process Overprocessing
Developing a design just for critique or contract conformance (especially MEP)
Design Planning and Scheduling
Inappropriate design process Overprocessing
Unnecessary detailing. Design Planning and Scheduling
Inappropriate design process Overproduction
Information put in too many places
Design Planning and Scheduling
Inappropriate design process Overproduction
Exploring design options outside of project scope or budget
Design Planning and Scheduling
Inappropriate design process Overproduction
Moving forward without approvals
Design Planning and Scheduling
Inappropriate design process Review process
Something in the spec you don't understand (see staffing)
Design Planning and Scheduling
Inappropriate design process Unclear codes
[1+] Unclear definition of the deliverables
Design Planning and Scheduling
Inappropriate review process
Lack of complete information
Lack of project introduction to OSHPD.
Design Planning and Scheduling
Inappropriate review process
Lack of project information
Waiting for determination of occupancy judgment (“1”/”B”)
Design Planning and Scheduling
Inappropriate review process
Length of time for review
[3] Code compliance drawings not needed for construction
Design Planning and Scheduling
Inappropriate review process Overprocessing
Questions instead of comments (document / code clarity)
Design Planning and Scheduling
Inappropriate review process
Unclear comments by plan reviewers

Description First level Second level Third level"BIN" time - waiting to review.
Design Planning and Scheduling
Inappropriate review process
Wait time for drawing review
Drawings submitted too soon.
Design Planning and Scheduling
Poor Document Control
Improper drawing delivery
Accuracy and correctness of labels (alignment with customer). Design Planning
and SchedulingPoor Document Control
Inaccurate/ incorrect labels
Document organization and format Design Planning
and Scheduling Poor Document Control
Inadequate document organization
Inconsistent document organization communication
Design Planning and Scheduling
Poor Document Control
Inconsistent document organization
Underproduction - not the right documents or information
Design Planning and Scheduling
Poor Document Control
Incorrect package content
Document organization Design Planning and Scheduling
Poor Document Control
Incorrect package content
Unnecessary drawings packaged in overall set or to each "client"
Design Planning and Scheduling
Poor Document Control
Incorrect package content
Supplemental documents Design Planning and Scheduling
Poor Document Control
Incorrect package content
Overproduction - unnecessary documents (repetition of details)
Design Planning and Scheduling
Poor Document Control Overproduction
Failure to identify AMOC's
Design Planning and Scheduling Scope changes Bad process
assumptions (C3)[1] Changes during CD phase
Design Planning and Scheduling Scope changes Late owner input
(A13)Standards Change (example: DHOT) - Programming Design Review Code Changes
Impact of code changes on design
Standards Change (example: DHOT) - SD Design Review Code Changes
Impact of code changes on design
Standards Change (example: DHOT) - DD Design Review Code Changes
Impact of code changes on design

Description First level Second level Third levelStandards Change (example: DHOT) - CD Design Review Code Changes
Impact of code changes on design
Standards Change (example: DHOT) - Permit Design Review Code Changes
Impact of code changes on design
Standards Change (example: DHOT) - CA Design Review Code Changes
Impact of code changes on design
[1] Timing of input from OSHPD Design Review Inappropriate
review processImproper timing of input
Misalignment of code interpretations between design team and OSHPD - program flex concepts not communicated and vetted)
Design Review Inappropriate review process
Inadequate information
Incomplete OSHPD reviews -> later comments Design Review Inappropriate
review processIncomplete information
Length of approval process Design Review Inappropriate
review processInefficient review process
OSHPD approval loopDesign Review Inappropriate
review processInefficient review process
Inappropriate review (coordinating) Design Review Inappropriate
review processLack of coordination
Lack of documentation and agreements on interpretation
Design Review Inappropriate review process
Lack of coordination
Code interpretation during DD's Design Review Inappropriate
review process
Lack of standardized review
Reviewer preference of solution (multiple reviewers)
Design Review Inappropriate review process
Lack of standardized review
Variations in code interpretations Design Review Inappropriate
review process
Lack of standardized review
Lack of consistency in review staff (technical and experience)
Design Review Inappropriate review process
Lack of standardized review

Description First level Second level Third levelInterpretation of code by field staff Design Review Inappropriate
review process
Lack of standardized review
OSHPD looking at trivialsDesign Review Inappropriate
review process
Lack of standardized review
[3] outside peer reviewDesign Review Inappropriate
review process
Lack of standardized review
OSHPD cycle time / que time, in series Design Review Inappropriate
review process Length of review
[1] OSHPD backcheck process Design Review Inappropriate
review process Length of review
Gaps between reviews (loss of knowledge or familiarity)
Design Review Inappropriate review process
Project review unfamiliarity
Different understandings of what OSHPD must have
Design Review Inappropriate review process
Unclear definition of needs
Plan checker learning curve Design Review Inappropriate
review processUntrained personnel
Inconsistence of reviewersDesign Review Inappropriate
review processUntrained personnel
Lack of project championLeadership and Communication
Ineffective management of project team
Lack of a sense of ownership within the team
Lack of vision/guidingprojects (determining value).
Leadership and Communication
Ineffective management of project team
Lack of a sense of ownership within the team
Failure to communicate project goals or assumptions to team.
Leadership and Communication
Ineffective management of project team
Poor role definition of key players for authority & responsibility
Equipment changes (exmpl.: imaging/big, 64 slice) - programming
Material & Equipment Supply Equipment changes
Change in equipment item/requirements/business case

Description First level Second level Third levelEquipment changes (example: imaging/big, 64 slice) - SD
Material & Equipment Supply Equipment changes
Change in equipment item/requirements/business case
Equipment changes (example: imaging/big, 64 slice) - DD
Material & Equipment Supply Equipment changes
Change in equipment item/requirements/business case
Equipment changes (example: imaging/big, 64 slice) - CD
Material & Equipment Supply Equipment changes
Change in equipment item/requirements/business case
Equipment changes (example: imaging/big, 64 slice) - Permitting - we won't do it
Material & Equipment Supply Equipment changes
Change in equipment item/requirements/business case
Equipment changes (example: imaging/big, 64 slice) - CA (60 person days contractor, 45 person days designer)
Material & Equipment Supply Equipment changes
Change in equipment item/requirements/ business case
Addtnl Bus. Case Change (exmpl: birthing=> cardiac) - Prog
Planning, programming and budgeting
Change in business case
Lack of commitment to business case
Addtnl Bus. Case Change (exmpl: birthing=> cardiac) - SD
Planning, programming and budgeting
Change in business case
Lack of commitment to business case
Addtnl Bus. Case Change (exmpl: birthing=> cardiac) - DD
Planning, programming and budgeting
Change in business case
Lack of commitment to business case
Addtnl Bus. Case Change (exmpl: birthing=> cardiac) - CD
Planning, programming and budgeting
Change in business case
Lack of commitment to business case
Addtnl Bus. Case Change (exmpl: birthing=> cardiac) - Perm.
Planning, programming and budgeting
Change in business case
Lack of commitment to business case
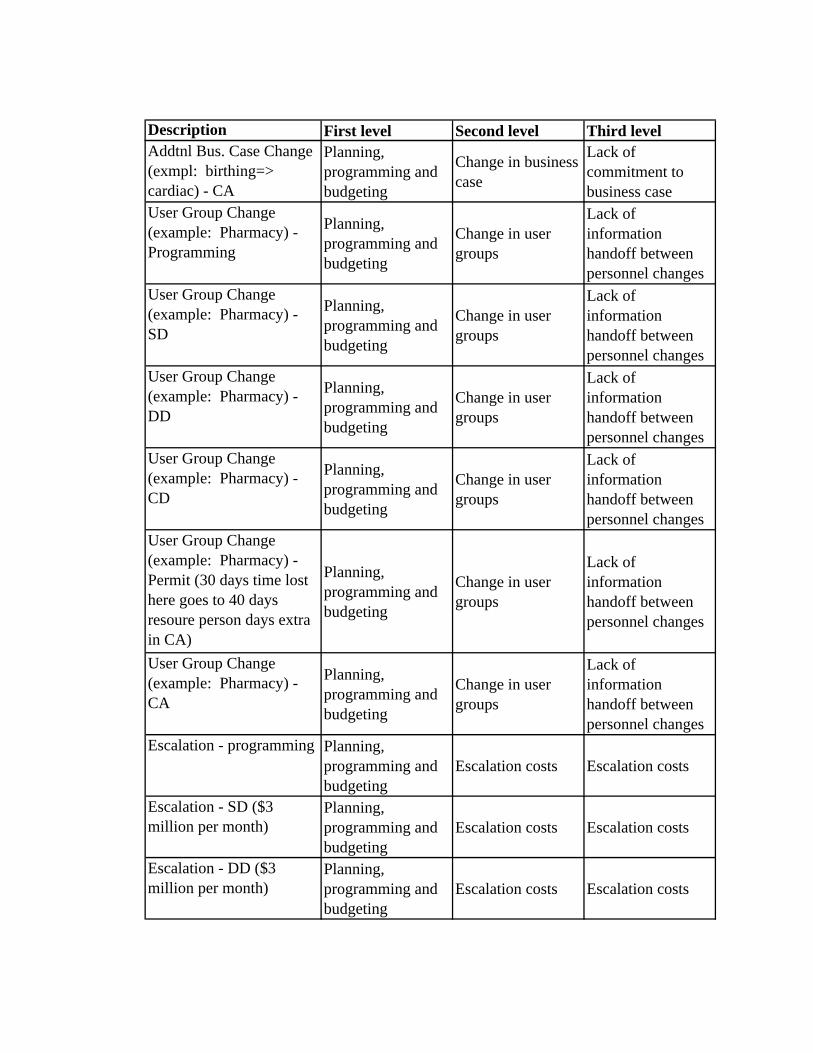
Description First level Second level Third levelAddtnl Bus. Case Change (exmpl: birthing=> cardiac) - CA
Planning, programming and budgeting
Change in business case
Lack of commitment to business case
User Group Change (example: Pharmacy) - Programming
Planning, programming and budgeting
Change in user groups
Lack of information handoff between personnel changes
User Group Change (example: Pharmacy) - SD
Planning, programming and budgeting
Change in user groups
Lack of information handoff between personnel changes
User Group Change (example: Pharmacy) - DD
Planning, programming and budgeting
Change in user groups
Lack of information handoff between personnel changes
User Group Change (example: Pharmacy) - CD
Planning, programming and budgeting
Change in user groups
Lack of information handoff between personnel changes
User Group Change (example: Pharmacy) - Permit (30 days time lost here goes to 40 days resoure person days extra in CA)
Planning, programming and budgeting
Change in user groups
Lack of information handoff between personnel changes
User Group Change (example: Pharmacy) - CA
Planning, programming and budgeting
Change in user groups
Lack of information handoff between personnel changes
Escalation - programming Planning, programming and budgeting
Escalation costs Escalation costs
Escalation - SD ($3 million per month)
Planning, programming and budgeting
Escalation costs Escalation costs
Escalation - DD ($3 million per month)
Planning, programming and budgeting
Escalation costs Escalation costs

Description First level Second level Third levelEscalation - CD ($3 million per month)
Planning, programming and budgeting
Escalation costs Escalation costs
Escalation - Permitting ($3 million per month - $9 million total)
Planning, programming and budgeting
Escalation costs Escalation costs
Escalation - CA Planning, programming and budgeting
Escalation costs Escalation costs
Conflicts between owner Planning, programming and budgeting
Lack of owner commitment
Not understanding owner differences
Starting SD's without business plan approval (problem solutionpriorto problem definition)
Planning, programming and budgeting
Lack of owner commitment
Failure to approve business plan
Incomplete SD's / program still unresolved
Planning, programming and budgeting
Lack of owner commitment
Failure to approve business plan
Lack of project definition Planning, programming and budgeting
Lack of owner commitment
Inadequate project definition
Budget not defined. Planning, programming and budgeting
Lack of owner commitment
Inadequate project planning
Client decisions - right person/stick to it
Planning, programming and budgeting
Lack of owner commitment
Inefficient decision making
[1] leadership/user approval process
Planning, programming and budgeting
Lack of owner commitment
Inefficient decision making
[1] budget validation/VE & constructability
Planning, programming and budgeting
Lack of owner commitment
Inefficient decision making
[2] Business lacking description of what is ‘value’
Planning, programming and budgeting
Lack of owner commitment
Inefficient decision making

Description First level Second level Third levelLack of commitment to scope (living with your decision)
Planning, programming and budgeting
Lack of owner commitment
Inefficient decision making
[1] budget go/no go Planning, programming and budgeting
Lack of owner commitment
Lack of commitment to business case
Timing - over the fence budget and constructability
Planning, programming and budgeting
Lack of owner commitment
Lack of commitment to business case
User group behavior Planning, programming and budgeting
Lack of owner commitment
Lack of coordination
Disconnect money from design too long
Planning, programming and budgeting
Lack of owner commitment
Lack of detailed project budget
Waiting for owner deicsions / approvals
Planning, programming and budgeting
Lack of owner commitment
Lack of owner decision
Changes in "client" or team
Planning, programming and budgeting
Lack of owner commitment
Leadership personnel changes
Lack of flexibililty of program to accommodate outside factors (estimation, demand for service)
Planning, programming and budgeting
Lack of owner flexibility
Inadequte project planning
Lack of understanding of business process by endusers (standardization)
Planning, programming and budgeting
Lack of owner knowledge
Incomplete information
Owner Changes - Programming
Planning, programming and budgeting Owner changes Owner changes
Owner Changes - SD Planning, programming and budgeting Owner changes Owner changes
Owner Changes - DD Planning, programming and budgeting Owner changes Owner changes

Description First level Second level Third levelOwner Changes - CD (per time - 0 time inc. per 30 Days)
Planning, programming and budgeting Owner changes Owner changes
Owner Changes - Permitting
Planning, programming and budgeting Owner changes Owner changes
Owner Changes - CA (50 PD UES, 60 PD contractor)
Planning, programming and budgeting Owner changes Owner changes

285
Appendix B STROBOSCOPE Code for Demand and Capacity
Simulations
/************************************************************************************************** /* Stroboscope source file generated from Visio drawing C:\Documents and Settings\Peter Feng\Desktop\Berkeley Working Folder\PhD Research\4. Case Studies\2. OSHPD\1. OSHPD Simulation (9 Jul 08).vsd /************************************************************************************************** VARIABLE Type1proj 1000; VARIABLE NoArchRev 5; MVAVGCOLLECTOR PermitTime 1; MVAVGCOLLECTOR AvePermitTime 10; /************************************************************************************************** /* Definition of resource types / Define the drawing sets as a resource. This will be the primary resource that flows through the / model. With each drawing set resource a number of characteristics will be assigned. These / characteristics will track how many times a drawing is reviewed and will serve as a counter. / Multiple subtypes of drawing set will be defined. Three different sizes will be established / to represent the actual types of drawings. Small, medium and large projects will be defined / Each of the sizes of drawings can represent either new construction or renovation. CHARTYPE DrawingSet Size ArchMu r; /DR /========================================================================= SUBTYPE DrawingSet Type1 1 1 80; /---------------------------------------------------- SAVEPROPS DrawingSet ArchR RevError; SAVEPROPS DrawingSet RandomNo TotNoRev EntryNumber; SAVEPROPS DrawingSet Reworked; SAVEPROPS DrawingSet ReworkPercent ReworkFactor; SAVEPROPS DrawingSet ArchTime CompleteTime AveTime; SAVEPROPS DrawingSet ProjNo; VARPROP DrawingSet DiscipProp RandomNo; VARPROP DrawingSet DiscipProp1 ProjNo; GENTYPE ArchPerson; /AP GENTYPE FlowPerson; /FP /************************************************************************************************** /* General section for problem parameters /************************************************************************************************** /* Definition of network nodes / Creates a queue that will hold characterized resources QUEUE Projects DrawingSet;

286
/ Combi that initializes each drawings set so the characteristics are set to zero COMBI Initialize; / Creates a queue that represents an area to hold drawings when waiting to be worked on by the / design review specialist QUEUE DrawingTable DrawingSet; / Series of combi that represent the actual review conducted by the design specialist. The process / times associated with each combi was taken from database provided by OSHPD COMBI ArchRev; / Combi that reviews each drawings will only draw from the Drawing Table if each resource has / 1 for each of the review characteristics COMBI Review; NORMAL Review1; NORMAL Review2; /Combi for the rereview process, will be sent drawings from a random calculation of who is assigned error COMBI ReReviewA; / Creates a series of queues that hold the design review specialist resource. This resource is the / one of the limiting factors that can throttle the speed of the review. With more resources, more / drawings can be reviewed. QUEUE ArchPer ArchPerson; / Create Queue for rework decision QUEUE Complete DrawingSet; QUEUE Rework DrawingSet; / Create queue for reporting information QUEUE Complete1 DrawingSet; COMBI Report; / Create queue to control inflow of projects QUEUE Flow FlowPerson; /************************************************************************************************** /* Definition of forks FORK ReworkDecision DrawingSet; /************************************************************************************************** /* Definition of network Links / Created below are the links for the model system. The links with DS in the name represent the flow / of drawing set resources. / The links with AP, SP, MP, EP and FP represent the flow of design review personnel. LINK DS1 Projects Initialize; LINK DS2 Initialize DrawingTable;

287
LINK FL1 Flow Initialize; LINK FL2 Initialize Flow; LINK ArchDS DrawingTable ArchRev; LINK ArchDSRet ArchRev DrawingTable; LINK AP1 ArchPer ArchRev; LINK APRet ArchRev ArchPer; LINK RD1 DrawingTable Review; LINK RD1A Review Review1 DrawingSet; LINK RD2 Review1 ReworkDecision; LINK RD3 ReworkDecision Complete; LINK RD4 ReworkDecision Rework; LINK RD5 Review1 Review2 DrawingSet; LINK RD6 Review2 Complete; / Architect ReReview Links LINK RDA Rework ReReviewA; LINK RDARet ReReviewA Review1 DrawingSet; LINK RRA ArchPer ReReviewA; LINK RRARet ReReviewA ArchPer; / Links for reporting information LINK R1 Complete Report; LINK R2 Report Complete1; /************************************************************************************************** /* Definition of global variables and programing objects FILTER ArchRevF DrawingSet ‘ArchR==0’; FILTER ReworkF DrawingSet ‘ArchR==1’; FILTER DrawingAtFront DrawingSet ‘RandomNo==DrawingTable.RandomNo.MinVal’; FILTER DrawingAtFront1 DrawingSet ‘ProjNo==Complete.ProjNo.MinVal’; FILTER ReworkedEnough DrawingSet ‘Reworked==3’; DISCIPLINE DrawingTable DiscipProp; DISCIPLINE Complete DiscipProp1; /************************************************************************************************** /* Entry of resources into Projects / This step creates the number of drawing sets that will be loaded into the system. Three types of / projects will be loaded into the system to represent small, medium, or large projects either new / construction or renovated. /INIT Projects Type1proj Type1; /INIT ArchPer NoArchRev; /INIT Flow 1; /************************************************************************************************** /* Startup of Initialize

288
ONDRAW DS1 ASSIGN ProjNo ResNum; DURATION Initialize ‘1’; /************************************************************************************************** /* Termination of Initialize / This initializes the properties of each of the drawings that flow through the model. Each ONRELEASE DS2 ASSIGN ArchR 0; ONRELEASE DS2 ASSIGN ArchTime SimTime; / ONRELEASE DS2 PRINT StdOutput “Time\t%5.1f\t” SimTime; / ONRELEASE DS2 PRINT StdOutput “Queue\t%5.0f\t\n” DrawingTable.Type1.Count; /************************************************************************************************** /* Entry of resources into DrawingTable /************************************************************************************************** /* Statements to assist in the definition of attributes of ArchRev and its related links /************************************************************************************************** /* Startup of ArchRev / This criterion will only pull drawings where the ArchR is less than one. This step ensures that / the drawings will only be reviewed once by the architect before a rework decision is made. / This step will only pull a drawing set to review if there is one or more drawings in the queue / ENOUGH ArchDS ‘DrawingTable.ArchRevF.Count>=1’; DRAWWHERE ArchDS ‘ArchR==0&DrawingAtFront’; / ONDRAW ArchDS PRINT StdOutput “Proj No. \t%5.1f” ResNum; / ONDRAW ArchDS PRINT StdOutput “\tin ArchRev at\t%5.1f\n” SimTime; / ONDRAW ArchDS ASSIGN ArchTime SimTime; / This criterion requires one architect to be available to review the drawings set. ENOUGH AP1 ‘ArchPer.CurCount>= 1’; / This step lists the duration of the architectural review which will be a normal distribution. / This step will expand to incorporate three types of review, small, medium and large. The / durations will be taken from the database provided. DURATION ArchRev ‘1’; /************************************************************************************************** /* Termination of ArchRev / This resets the value to one once the drawing has been reviewed by the architect. ONRELEASE ArchDSRet ASSIGN ArchR ArchR+1; /************************************************************************************************** /* Startup of Review

289
ENOUGH RD1 ‘DrawingTable.ReworkF.Count>=1’; DRAWWHERE RD1 ‘ArchR==1’; ONDRAW RD1 ReworkFactor 1; ONDRAW RD1 Reworked 0; DURATION Review ‘0’; /************************************************************************************************** /* Termination of Review /************************************************************************************************** /* Startup of Review1 DURATION Review1 ‘0’; /************************************************************************************************** /* Termination of Review1 /* Rework factor, set to 1 if drawingset has never been repaired and to 2 if it has STRENGTH RD4 Review1.DrawingSet.r; STRENGTH RD3 100-Review1.DrawingSet.r; /************************************************************************************************** /* Startup of Review2 / ONRELEASE RD5 ‘Review1.ReworkedEnough.Count>=1’; / DRAWWHERE RD5 ‘Reworked==3’; DURATION Review1 ‘0’; /************************************************************************************************** /* Termination of Review1 /************************************************************************************************** /* Startup of OwnerRework ONFLOW RD3 ASSIGN CompleteTime SimTime; /Turn on these print statements to show the rework factor. / ONRELEASE RD6 PRINT StdOutput “Proj No. \t%5.1f” ResNum; / ONRELEASE RD6 PRINT StdOutput “\tRework Percent \t%5.1f\n” ‘r/ReworkFactor’; /************************************************************************************************** /* Termination of OwnerRework / ONRELEASE RD6 PRINT StdOutput “Proj No. \t%5.1f” ResNum; / ONRELEASE RD6 PRINT StdOutput “\tOwner Rework Time \t%5.1f\n” OwnerReworkTotal; /************************************************************************************************** /* Startup of ReReviewA PRIORITY ReReviewA ‘Rework.CurCount>0 ? 10 : 0’; DURATION ReReviewA ‘1’;
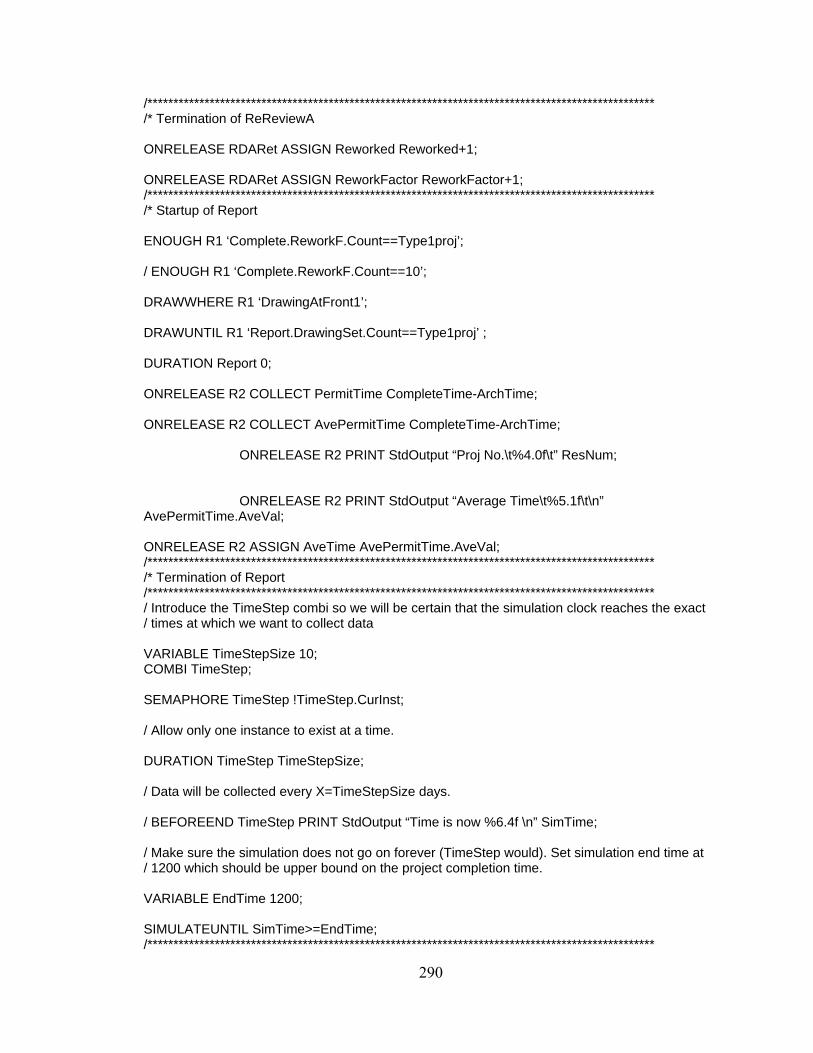
290
/************************************************************************************************** /* Termination of ReReviewA ONRELEASE RDARet ASSIGN Reworked Reworked+1; ONRELEASE RDARet ASSIGN ReworkFactor ReworkFactor+1; /************************************************************************************************** /* Startup of Report ENOUGH R1 ‘Complete.ReworkF.Count==Type1proj’; / ENOUGH R1 ‘Complete.ReworkF.Count==10’; DRAWWHERE R1 ‘DrawingAtFront1’; DRAWUNTIL R1 ‘Report.DrawingSet.Count==Type1proj’ ; DURATION Report 0; ONRELEASE R2 COLLECT PermitTime CompleteTime-ArchTime; ONRELEASE R2 COLLECT AvePermitTime CompleteTime-ArchTime; ONRELEASE R2 PRINT StdOutput “Proj No.\t%4.0f\t” ResNum; ONRELEASE R2 PRINT StdOutput “Average Time\t%5.1f\t\n” AvePermitTime.AveVal; ONRELEASE R2 ASSIGN AveTime AvePermitTime.AveVal; /************************************************************************************************** /* Termination of Report /************************************************************************************************** / Introduce the TimeStep combi so we will be certain that the simulation clock reaches the exact / times at which we want to collect data VARIABLE TimeStepSize 10; COMBI TimeStep; SEMAPHORE TimeStep !TimeStep.CurInst; / Allow only one instance to exist at a time. DURATION TimeStep TimeStepSize; / Data will be collected every X=TimeStepSize days. / BEFOREEND TimeStep PRINT StdOutput “Time is now %6.4f \n” SimTime; / Make sure the simulation does not go on forever (TimeStep would). Set simulation end time at / 1200 which should be upper bound on the project completion time. VARIABLE EndTime 1200; SIMULATEUNTIL SimTime>=EndTime; /**************************************************************************************************

291
/* COLLECTORS /************************************************************************************************** / Define collectors that will gather data over multiple simulation runs. / Collectors need to be persistent (add ‘*’ to their name to make them persistent) or else the data / will get lost when the CLEAR command is invoked upon start of a new iteration. COLLECTOR ProjDuration*; COLLECTOR InstallFirstCollector*; SAVEVALUE CurrentStep 0; WHILE CurrentStep<=EndTime; COLLECTOR QueueSize$<CurrentStep>$*; COLLECTOR LeadTime$<CurrentStep>$*; ASSIGN CurrentStep CurrentStep+TimeStepSize; WEND; /************************************************************************************************** /* ITERATION /************************************************************************************************** VARIABLE NrIterations 30; SAVEVALUE CurrentIteration* 1; SAVEVALUE CurrentStepTwo* 0; WHILE CurrentIteration<=NrIterations; CLEAR; /************************************************************************************************** /* Entry of resources into Projects / This step creates the number of drawing sets that will be loaded into the system. Three types of / projects will be loaded into the system to represent small, medium, or large projects either new / construction or renovated. INIT Projects Type1proj Type1; INIT ArchPer NoArchRev; INIT Flow 1; WHILE CurrentStepTwo<=EndTime; SIMULATEUNTIL SimTime>=CurrentStepTwo; COLLECT QueueSize$<CurrentStepTwo>$ DrawingTable.Type1.Count; ASSIGN CurrentStepTwo CurrentStepTwo+TimeStepSize; WEND; ASSIGN CurrentIteration CurrentIteration+1; ASSIGN CurrentStepTwo 0; PRINT StdOutput “\n\n”; WEND;

292
Appendix C STROBOSCOPE Code for Effect of Alternative
Review on Workflow
Model 1
/************************************************************************************************** /* Stroboscope source file generated from Visio drawing C:\Documents and Settings\Peter Feng\Desktop\Berkeley Working Folder\PhD Research\4. Case Studies\2. OSHPD\1. OSHPD Simulation (9 Jul 08).vsd /************************************************************************************************** VARIABLE Type1proj 50; VARIABLE Type2proj 100; VARIABLE Type3proj 35; VARIABLE Type4proj 20; VARIABLE Type5proj 0; VARIABLE NoArchRev 1; VARIABLE NoStrucRev 1; VARIABLE NoMechRev 1; VARIABLE NoElecRev 1; VARIABLE NoFLSRev 1; VARIABLE RevAssignError ‘Rnd[] <= 1/5 ? 100: LastRnd[] <= 2/5 ? 200: LastRnd[] <= 3/5 ? 300: LastRnd[] <= 4/5 ? 400: 500’; VARIABLE RandomNumber ‘Rnd[]’; MVAVGCOLLECTOR PermitTime 5; /************************************************************************************************** /* Definition of resource types / Define the drawing sets as a resource. This will be the primary resource that flows through the / model. With each drawing set resource a number of characteristics will be assigned. These / characteristics will track how many times a drawing is reviewed and will serve as a counter. / Multiple subtypes of drawing set will be defined. Three different sizes will be established / to represent the actual types of drawings. Small, medium and large projects will be defined / Each of the sizes of drawings can represent either new construction or renovation. CHARTYPE DrawingSet Size ArchMu ArchSD StructMu StructSD MechMu MechSD ElectMu ElectSD FLSMu FLSSD r ORewMu ORewSD RRevAMu RRevASD RRevSMu RRevSSD RRevMMu RRevMSD RRevEMu RRevESD RRevFMu RRevFSD ; /DR /=========================================================================SUBTYPE DrawingSet Type1 1 1.17 0.17 1.85 0.4 1.07 0.05 1.07 0.05 1.36 0.21 82 5 1 1.44
0.42 1.17 0.09 1.39 0.25 1.03 0.03 1.34 0.19 ; /----------------------------------------------------

293
SUBTYPE DrawingSet Type2 10 1.66 0.26 2.59 0.4 3.79 1.17 0.07 1.38 0.22 93 10 2 1.68 0.26 2.3 0.49 1.17 0.2 1.07 0.04 1.96 0.32 ; /---------------------------------------------------- SUBTYPE DrawingSet Type3 100 2.85 0.7 8.32 1.1 4.37 0.8 4.39 1.26 4.0 0.76 99 20 3 1.6 0.29 6.04 0.92 1.82 0.45 1.44 0.2 4.19 1.17 ; /---------------------------------------------------- SUBTYPE DrawingSet Type4 100 8.38 1.82 21.5 6.25 10.9 2.38 8.27 1.94 18.2 3.43 88 70 5 4.05
1.53 10.8 2.9 4.8 1.51 2.7 0.72 7.57 1.8 ; /---------------------------------------------------- SUBTYPE DrawingSet Type5 100 8.38 1.82 21.5 6.25 10.9 2.38 8.27 1.94 18.2 3.43 88 70 5 4.05
1.53 10.8 2.9 4.8 1.51 2.7 0.72 7.57 1.8 ; /---------------------------------------------------- SAVEPROPS DrawingSet ArchR StructR MechR ElectR FLSR RevError; SAVEPROPS DrawingSet RandomNo TotNoRev EntryNumber; SAVEPROPS DrawingSet Reworked; SAVEPROPS DrawingSet ReworkPercent ReworkFactor; SAVEPROPS DrawingSet ArchTime StructTime MechTime ElectTime FLSTime CompleteTime; SAVEPROPS DrawingSet OwnerStart OwnerEnd OwnerReworkTotal; SAVEPROPS DrawingSet ProjNo; VARPROP DrawingSet DiscipProp RandomNo; VARPROP DrawingSet DiscipProp1 ProjNo; CHARTYPE ReviewPer Type; /RP /========================================================================= SUBTYPE ReviewPer Arch 100; SUBTYPE ReviewPer Struct 200; SUBTYPE ReviewPer Mech 300; SUBTYPE ReviewPer Elect 400; SUBTYPE ReviewPer FLS 500; /---------------------------------------------------- / Define five resources that represent the design review personnel. GENTYPE OArchPerson; /AP /************************************************************************************************** /* General section for problem parameters /************************************************************************************************** /* Definition of network nodes / Creates a queue that will hold characterized resources QUEUE Projects DrawingSet;

294
/ Combi that initializes each drawings set so the characteristics are set to zero COMBI Initialize; / Creates a queue that represents an area to hold drawings when waiting to be worked on by the / design review specialist QUEUE DrawingTable DrawingSet; / Series of combi that represent the actual review conducted by the design specialist. The process / times associated with each combi was taken from database provided by OSHPD COMBI ArchRev; COMBI StructRev; COMBI MechRev; COMBI ElectRev; COMBI FLSRev; / Combi that reviews each drawings will only draw from the Drawing Table if each resource has / 1 for each of the review characteristics COMBI Review; NORMAL Review1; COMBI OwnerRework; /Combi for the rereview process, will be sent drawings from a random calculation of who is assigned error COMBI ReReviewA; COMBI ReReviewS; COMBI ReReviewM; COMBI ReReviewE; COMBI ReReviewF; / Creates a series of queues that hold the design review specialist resource. This resource is the / one of the limiting factors that can throttle the speed of the review. With more resources, more / drawings can be reviewed. QUEUE ArchPer ReviewPer; QUEUE StructPer ReviewPer; QUEUE MechPer ReviewPer; QUEUE ElectPer ReviewPer; QUEUE FLSPer ReviewPer; QUEUE OArchPer OArchPerson; / Create Queue for rework decision QUEUE Complete DrawingSet; QUEUE Rework DrawingSet; QUEUE Resubmit DrawingSet; / Create queues for characterized resources, reviewers for each discipline QUEUE ReworkRevA ReviewPer; QUEUE ReworkRevS ReviewPer;

295
QUEUE ReworkRevM ReviewPer; QUEUE ReworkRevE ReviewPer; QUEUE ReworkRevF ReviewPer; / Create queue for reporting information QUEUE Complete1 DrawingSet; COMBI Report; /************************************************************************************************** /* Definition of forks FORK ReworkDecision DrawingSet; /************************************************************************************************** /* Definition of network Links / Created below are the links for the model system. The links with DS in the name represent the flow / of drawing set resources. / The links with AP, SP, MP, EP and FP represent the flow of design review personnel. LINK DS1 Projects Initialize; LINK DS2 Initialize DrawingTable; LINK ArchDS DrawingTable ArchRev; LINK ArchDSRet ArchRev DrawingTable; LINK StructDS DrawingTable StructRev; LINK StructDSRet StructRev DrawingTable; LINK MechDS DrawingTable MechRev; LINK MechDSRet MechRev DrawingTable; LINK ElectDS DrawingTable ElectRev; LINK ElectDSRet ElectRev DrawingTable; LINK FLSDS DrawingTable FLSRev; LINK FLSDSRet FLSRev DrawingTable; LINK AP1 ArchPer ArchRev; LINK APRet ArchRev ArchPer; LINK SP1 StructPer StructRev; LINK SPRet StructRev StructPer; LINK MP1 MechPer MechRev; LINK MPRet MechRev MechPer; LINK EP1 ElectPer ElectRev; LINK EPRet ElectRev ElectPer; LINK FP1 FLSPer FLSRev; LINK FPRet FLSRev FLSPer; LINK RD1 DrawingTable Review; LINK RD1A Review Review1 DrawingSet; LINK RD2 Review1 ReworkDecision; LINK RD3 ReworkDecision Complete;

296
LINK RD4 ReworkDecision Rework; LINK RD5 Rework OwnerRework; LINK RD6 OwnerRework Resubmit; LINK OR1 OArchPer OwnerRework; LINK OR2 OwnerRework OArchPer; / Architect ReReview Links LINK RDA Resubmit ReReviewA; LINK RDARet ReReviewA Review1 DrawingSet; LINK RRA ReworkRevA ReReviewA; LINK RRARet ReReviewA ReworkRevA; / Structural ReReview Links LINK RDS Resubmit ReReviewS; LINK RDSRet ReReviewS Review1 DrawingSet; LINK RRS ReworkRevS ReReviewS; LINK RRSRet ReReviewS ReworkRevS; / Mechanical ReReview Links LINK RDM Resubmit ReReviewM; LINK RDMRet ReReviewM Review1 DrawingSet; LINK RRM ReworkRevM ReReviewM; LINK RRMRet ReReviewM ReworkRevM; / Electrical ReReview Links LINK RDE Resubmit ReReviewE; LINK RDERet ReReviewE Review1 DrawingSet; LINK RRE ReworkRevE ReReviewE; LINK RRERet ReReviewE ReworkRevE; / FLS ReReview Links LINK RDF Resubmit ReReviewF; LINK RDFRet ReReviewF Review1 DrawingSet; LINK RRF ReworkRevF ReReviewF; LINK RRFRet ReReviewF ReworkRevF; / Links for reporting information LINK R1 Complete Report; LINK R2 Report Complete1; /************************************************************************************************** /* Definition of global variables and programing objects FILTER ArchRevF DrawingSet ‘ArchR==0’; FILTER StructRevF DrawingSet ‘StructR==0’; FILTER MechRevF DrawingSet ‘MechR==0’; FILTER ElectRevF DrawingSet ‘ElectR==0’; FILTER FLSRevF DrawingSet ‘FLSR==0’; FILTER ReworkF DrawingSet ‘ArchR==1&StructR==1&MechR==1&ElectR==1&FLSR==1’;

297
FILTER DrawingAtFront DrawingSet ‘RandomNo==DrawingTable.RandomNo.MinVal’; FILTER DrawingAtFront1 DrawingSet ‘ProjNo==Complete.ProjNo.MinVal’; DISCIPLINE DrawingTable DiscipProp; DISCIPLINE Complete DiscipProp1; FILTER ArchPerF ReviewPer ‘Arch==100’; FILTER StructPerF ReviewPer ‘Struct==200’; FILTER MechPerF ReviewPer ‘Mech==300’; FILTER ElectPerF ReviewPer ‘Elect==400’; FILTER FLSPerF ReviewPer ‘FLS==500’; / Create Filters to direct correctly assigned rework to its corresponding review; FILTER ReworkRevFA DrawingSet ‘RevError==100’; FILTER ReworkRevFS DrawingSet ‘RevError==200’; FILTER ReworkRevFM DrawingSet ‘RevError==300’; FILTER ReworkRevFE DrawingSet ‘RevError==400’; FILTER ReworkRevFF DrawingSet ‘RevError==500’; /************************************************************************************************** /* Statements to assist in the definition of attributes of Projects and its related links /************************************************************************************************** /* Entry of resources into Projects / This step creates the number of drawing sets that will be loaded into the system. Three types of / projects will be loaded into the system to represent small, medium, or large projects either new / construction or renovated. INIT Projects Type1proj Type1; INIT Projects Type2proj Type2; INIT Projects Type3proj Type3; INIT Projects Type4proj Type4; INIT Projects Type5proj Type5; INIT ArchPer NoArchRev Arch; INIT StructPer NoStrucRev Struct; INIT MechPer NoMechRev Mech; INIT ElectPer NoElecRev Elect; INIT FLSPer NoFLSRev FLS; INIT ReworkRevA NoArchRev Arch; INIT ReworkRevS NoStrucRev Struct; INIT ReworkRevM NoMechRev Mech; INIT ReworkRevE NoElecRev Elect; INIT ReworkRevF NoFLSRev FLS; /************************************************************************************************** /* Startup of Initialize ONDRAW DS1 ASSIGN RandomNo RandomNumber+Size; ONDRAW DS1 ASSIGN ProjNo ResNum; DURATION Initialize ‘0’; /************************************************************************************************** /* Termination of Initialize

298
/ This initializes the properties of each of the drawings that flow through the model. Each ONRELEASE DS2 ASSIGN ArchR 0; ONRELEASE DS2 ASSIGN StructR 0; ONRELEASE DS2 ASSIGN MechR 0; ONRELEASE DS2 ASSIGN ElectR 0; ONRELEASE DS2 ASSIGN FLSR 0; ONRELEASE DS2 ASSIGN Reworked 0; /Turn on the following two print statements to verify random generation of projects to load into /the system. / ONRELEASE DS2 PRINT StdOutput “Proj No. \t%5.1f” ResNum; / ONRELEASE DS2 PRINT StdOutput “\tRandom No Assign \t%5.4f\n” RandomNo; /************************************************************************************************** /* Entry of resources into DrawingTable /************************************************************************************************** /* Statements to assist in the definition of attributes of ArchRev and its related links /************************************************************************************************** /* Startup of ArchRev / This criterion will only pull drawings where the ArchR is less than one. This step ensures that / the drawings will only be reviewed once by the architect before a rework decision is made. / This step will only pull a drawing set to review if there is one or more drawings in the queue ENOUGH ArchDS ‘DrawingTable.ArchRevF.Count>=1’; DRAWWHERE ArchDS ‘ArchR==0&DrawingAtFront’; / ONDRAW ArchDS PRINT StdOutput “Proj No. \t%5.1f” ResNum; / ONDRAW ArchDS PRINT StdOutput “\tin ArchRev at\t%5.1f\n” SimTime; ONDRAW ArchDS ASSIGN ArchTime SimTime; / ONDRAW ArchDS PRINT StdOutput “\tin ArchRev at\t%5.1f\n” ArchTime; / This criterion requires one architect to be available to review the drawings set. ENOUGH AP1 ‘ArchPer.CurCount>= 1’; / This step lists the duration of the architectural review which will be a normal distribution. / This step will expand to incorporate three types of review, small, medium and large. The / durations will be taken from the database provided. DURATION ArchRev ‘Normal[ArchRev.DrawingSet.ArchMu,ArchRev.DrawingSet.ArchSD]’; /************************************************************************************************** /* Termination of ArchRev / This resets the value to one once the drawing has been reviewed by the architect. ONRELEASE ArchDSRet ASSIGN ArchR ArchR+1;

299
/ ONDRAW ArchDS PRINT StdOutput “======= Arch Filter Count =%5.1f\n” DrawingTable.ArchRevF.Count; / ONDRAW StructDS PRINT StdOutput “======= Struct Filter Count =%5.1f\n” DrawingTable.StructRevF.Count; / ONDRAW MechDS PRINT StdOutput “======= Mech Filter Count =%5.1f\n” DrawingTable.MechRevF.Count; / ONDRAW ElectDS PRINT StdOutput “======= Elect Filter Count =%5.1f\n” DrawingTable.ElectRevF.Count; / ONDRAW FLSDS PRINT StdOutput “======= FLS Filter Count =%5.1f\n” DrawingTable.FLSRevF.Count; / ONDRAW RD1 PRINT StdOutput “======= Rework Filter Count =%5.1f\n” DrawingTable.Rework.Count; /************************************************************************************************** /* Startup of StructRev / The following two criteria require that at least one drawing be available for review and that a / structural design reviewer is available. ENOUGH StructDS ‘DrawingTable.StructRevF.Count>0’; DRAWWHERE StructDS ‘StructR==0&DrawingAtFront’; / ONDRAW StructDS PRINT StdOutput “Proj No. \t%5.1f” ResNum; / ONDRAW StructDS PRINT StdOutput “\tin StructRev at\t%5.1f\n” SimTime; ONDRAW StructDS ASSIGN StructTime SimTime; / ONDRAW StructDS PRINT StdOutput “\tin StructRev at\t%5.1f\n” StructTime; ENOUGH SP1 ‘StructPer.CurCount>=1’; / This criteria will only draw a project if it hasn’t been reviewed by a structural design reviewer / This step lists the duration of the structural review which will be a normal distribution. DURATION StructRev ‘Normal[StructRev.DrawingSet.StructMu,StructRev.DrawingSet.StructSD]’; /************************************************************************************************** /* Termination of StructRev ONRELEASE StructDSRet ASSIGN StructR StructR+1; /************************************************************************************************** /* Startup of MechRev / The following two criteria require that at least one drawing be available for review and that a / mechanical design reviewer is available. / ENOUGH MechDS ‘DrawingTable.Type1.Count>=1’; ENOUGH MechDS ‘DrawingTable.MechRevF.Count>=1’;

300
DRAWWHERE MechDS ‘MechR==0&DrawingAtFront’; / ONDRAW MechDS PRINT StdOutput “Proj No. \t%5.1f” ResNum; / ONDRAW MechDS PRINT StdOutput “\tin MechRev at\t%5.1f\n” SimTime; ONDRAW MechDS ASSIGN MechTime SimTime; / ONDRAW MechDS PRINT StdOutput “\tin MechRev at\t%5.1f\n” MechTime; ENOUGH MP1 ‘MechPer.CurCount>=1’; / This criteria will only draw a project if it hasn’t been reviewed by a mechanical design reviewer / This step lists the duration of the mechanical review which will be a normal distribution. DURATION MechRev ‘Normal[MechRev.DrawingSet.MechMu,MechRev.DrawingSet.MechSD]’; /************************************************************************************************** /* Termination of MechRev ONRELEASE MechDSRet ASSIGN MechR MechR+1; /************************************************************************************************** /* Startup of ElectRev / The following two criteria require that at least one drawing be available for review and that a / electrical design reviewer is available. / ENOUGH ElectDS ‘DrawingTable.Type1.Count>=1’; ENOUGH ElectDS ‘DrawingTable.ElectRevF.Count>=1’; DRAWWHERE ElectDS ‘ElectR==0&DrawingAtFront’; / ONDRAW ElectDS PRINT StdOutput “Proj No. \t%5.1f” ResNum; / ONDRAW ElectDS PRINT StdOutput “\tin ElectRev at\t%5.1f\n” SimTime; ONDRAW ElectDS ASSIGN ElectTime SimTime; / ONDRAW ElectDS PRINT StdOutput “\tin ElectRev at\t%5.1f\n” ElectTime; ENOUGH EP1 ‘ElectPer.CurCount>=1’; / This criteria will only draw a project if it hasn’t been reviewed by a electrical design reviewer / This step lists the duration of the electrical review which will be a normal distribution. DURATION ElectRev ‘Normal[ElectRev.DrawingSet.ElectMu,ElectRev.DrawingSet.ElectSD]’; /************************************************************************************************** /* Termination of ElectRev

301
ONRELEASE ElectDSRet ASSIGN ElectR ElectR+1; /************************************************************************************************** /* Startup of FLSRev / The following two criteria require that at least one drawing be available for review and that a / fire, life, and safety design reviewer is available. / ENOUGH FLSDS ‘DrawingTable.Type1.Count >=1’; ENOUGH FLSDS ‘DrawingTable.FLSRevF.Count>=1’; DRAWWHERE FLSDS ‘FLSR==0&DrawingAtFront’; / ONDRAW FLSDS PRINT StdOutput “Proj No. \t%5.1f” ResNum; / ONDRAW FLSDS PRINT StdOutput “\tin FLSRev at\t%5.1f\n” SimTime; ONDRAW FLSDS ASSIGN FLSTime SimTime; / ONDRAW FLSDS PRINT StdOutput “\tin FLSRev at\t%5.1f\n” FLSTime; ENOUGH FP1 ‘FLSPer.CurCount >= 1’; / This criteria will only draw a project if it hasn’t been reviewed by a fire, life, and safety / design reviewer / This step lists the duration of the fire, life, and safety review which will be a normal / distribution. DURATION FLSRev ‘Normal[FLSRev.DrawingSet.FLSMu,FLSRev.DrawingSet.FLSSD]’; /************************************************************************************************** /* Termination of FLSRev ONRELEASE FLSDSRet ASSIGN FLSR FLSR+1; /************************************************************************************************** /* Startup of Review ENOUGH RD1 ‘DrawingTable.ReworkF.Count>=1’; DRAWWHERE RD1 ‘ArchR==1&StructR==1&MechR==1&ElectR==1&FLSR==1’; ONDRAW RD1 ReworkFactor 1; ONDRAW RD1 Reworked 0; DURATION Review ‘0’; /************************************************************************************************** /* Termination of Review /************************************************************************************************** /* Startup of Review1 DURATION Review1 ‘0’; /************************************************************************************************** /* Termination of Review1

302
/* Rework factor, set to 1 if drawingset has never been repaired and to 2 if it has STRENGTH RD3 100-Review1.DrawingSet.r/Review1.DrawingSet.ReworkFactor; STRENGTH RD4 ‘Review1.DrawingSet.r/Review1.DrawingSet.ReworkFactor’; /************************************************************************************************** /* Startup of OwnerRework ENOUGH RD5 ‘Rework.ReworkF.Count>=1’; / ONFLOW RD3 PRINT StdOutput “Proj No. \t%5.1f” ResNum; / ONFLOW RD3 PRINT StdOutput “\tCOMPLETE at \t%5.1f” SimTime; / ONFLOW RD3 PRINT StdOutput “\tReworked \t%5.0f \tTime(s)\t” Reworked; ONFLOW RD3 ASSIGN CompleteTime SimTime; /ONFLOW RD3 COLLECT PermitTime CompleteTime-ArchTime; /ONFLOW RD3 COLLECT PermitTime CompleteTime-StructTime; /ONFLOW RD3 COLLECT PermitTime CompleteTime-MechTime; /ONFLOW RD3 COLLECT PermitTime CompleteTime-ElectTime; /ONFLOW RD3 COLLECT PermitTime CompleteTime-FLSTime; /ONFLOW RD3 PRINT StdOutput “Approval Time \t%5.1f\t,\t” PermitTime.MaxVal; /ONFLOW RD3 PRINT StdOutput “Owner Rework Time \t%5.1f\n” OwnerReworkTotal; / ONFLOW RD3 PRINT StdOutput “Proj No. \t%5.1f” ResNum; / ONFLOW RD3 PRINT StdOutput “\t(Arch) Comp Time \t%5.1f\n” CompleteTime-ArchTime; / ONFLOW RD3 PRINT StdOutput “Proj No. \t%5.1f” ResNum; / ONFLOW RD3 PRINT StdOutput “\t(Struct) Comp Time \t%5.1f\n” CompleteTime-StructTime; / ONFLOW RD3 PRINT StdOutput “Proj No. \t%5.1f” ResNum; / ONFLOW RD3 PRINT StdOutput “\t(Mech) Comp Time \t%5.1f\n” CompleteTime-MechTime; / ONFLOW RD3 PRINT StdOutput “Proj No. \t%5.1f” ResNum; / ONFLOW RD3 PRINT StdOutput “\t(Elect) Comp Time \t%5.1f\n” CompleteTime-ElectTime; / ONFLOW RD3 PRINT StdOutput “Proj No. \t%5.1f” ResNum; / ONFLOW RD3 PRINT StdOutput “\t(FLS) Comp Time \t%5.1f\n” CompleteTime-FLSTime; ONDRAW RD5 ASSIGN OwnerStart SimTime; ONDRAW RD5 ASSIGN RevError RevAssignError; DURATION OwnerRework ‘Normal[OwnerRework.DrawingSet.ORewMu,OwnerRework.DrawingSet.ORewSD]’;

303
/Turn on these print statements to show the error assigned and the rework factor. / ONRELEASE RD6 PRINT StdOutput “Proj No. \t%5.1f” ResNum; / ONRELEASE RD6 PRINT StdOutput “\tAssign Err No. \t%5.0f” RevError; / ONRELEASE RD6 PRINT StdOutput “\tRework Percent \t%5.1f\n” ‘r/ReworkFactor’; /************************************************************************************************** /* Termination of OwnerRework ONRELEASE RD6 ASSIGN OwnerEnd SimTime; ONRELEASE RD6 ASSIGN OwnerReworkTotal OwnerReworkTotal+(OwnerEnd-OwnerStart); / ONRELEASE RD6 PRINT StdOutput “Proj No. \t%5.1f” ResNum; / ONRELEASE RD6 PRINT StdOutput “\tOwner Rework Time \t%5.1f\n” OwnerReworkTotal; /************************************************************************************************** /* Startup of ReReviewA ENOUGH RDA ‘Resubmit.ReworkRevFA.Count>=1’; DRAWWHERE RDA ‘RevError==100’; /Turn on the print statement to check the reviewer assigned. / ONDRAW RRA PRINT StdOutput “\t\t\t\t\tReview assign \t%5.0f\n” Type; DURATION ReReviewA ‘Normal [ReReviewA.DrawingSet.RRevAMu,ReReviewA.DrawingSet.RRevASD]’; /************************************************************************************************** /* Termination of ReReviewA ONRELEASE RDARet ASSIGN Reworked Reworked+1; ONRELEASE RDARet ASSIGN ReworkFactor ReworkFactor+1; ONRELEASE RDARet ASSIGN RevError 0; / ONRELEASE RDARet PRINT StdOutput “Proj No. \t%5.1f” ResNum; / ONRELEASE RDARet PRINT StdOutput “\tREWORKED \t\t%5.1f \tTime(s)\n” Reworked; /************************************************************************************************** /* Startup of ReReviewS ENOUGH RDS ‘Resubmit.ReworkRevFS.Count>=1’; DRAWWHERE RDS ‘RevError==200’; /Turn on the print statement to check the reviewer assigned. / ONDRAW RRS PRINT StdOutput “\t\t\t\t\tReview assign \t%5.0f\n” Type; DURATION ReReviewS ‘Normal [ReReviewS.DrawingSet.RRevSMu,ReReviewS.DrawingSet.RRevSSD]’;

304
/************************************************************************************************** /* Termination of ReReviewS ONRELEASE RDSRet ASSIGN Reworked Reworked+1; ONRELEASE RDSRet ASSIGN ReworkFactor ReworkFactor+1; ONRELEASE RDSRet ASSIGN RevError 0; / ONRELEASE RDSRet PRINT StdOutput “Proj No. \t%5.1f” ResNum; / ONRELEASE RDSRet PRINT StdOutput “\tREWORKED \t\t%5.1f \tTime(s)\n” Reworked; /************************************************************************************************** /* Startup of ReReviewM ENOUGH RDM ‘Resubmit.ReworkRevFM.Count>=1’; DRAWWHERE RDM ‘RevError==300’; /Turn on the print statement to check the reviewer assigned. / ONDRAW RRM PRINT StdOutput “\t\t\t\t\tReview assign \t%5.0f\n” Type; DURATION ReReviewM ‘Normal [ReReviewM.DrawingSet.RRevMMu,ReReviewM.DrawingSet.RRevMSD]’; /************************************************************************************************** /* Termination of ReReviewM ONRELEASE RDMRet ASSIGN Reworked Reworked+1; ONRELEASE RDMRet ASSIGN ReworkFactor ReworkFactor+1; ONRELEASE RDMRet ASSIGN RevError 0; / ONRELEASE RDMRet PRINT StdOutput “Proj No. \t%5.1f” ResNum; / ONRELEASE RDMRet PRINT StdOutput “\tREWORKED \t\t%5.1f \tTime(s)\n” Reworked; /************************************************************************************************** /* Startup of ReReviewE ENOUGH RDE ‘Resubmit.ReworkRevFE.Count>=1’; DRAWWHERE RDE ‘RevError==400’; /Turn on the print statement to check the reviewer assigned. / ONDRAW RRE PRINT StdOutput “\t\t\t\t\tReview assign \t%5.0f\n” Type; DURATION ReReviewE ‘Normal [ReReviewE.DrawingSet.RRevEMu,ReReviewE.DrawingSet.RRevESD]’; /************************************************************************************************** /* Termination of ReReviewE ONRELEASE RDERet ASSIGN Reworked Reworked+1; ONRELEASE RDERet ASSIGN ReworkFactor ReworkFactor+1;

305
ONRELEASE RDERet ASSIGN RevError 0; / ONRELEASE RDERet PRINT StdOutput “Proj No. \t%5.1f” ResNum; / ONRELEASE RDERet PRINT StdOutput “\tREWORKED \t\t%5.1f \tTime(s)\n” Reworked; /************************************************************************************************** /* Startup of ReReviewF ENOUGH RDF ‘Resubmit.ReworkRevFF.Count>=1’; DRAWWHERE RDF ‘RevError==500’; /Turn on the print statement to check the reviewer assigned. / ONDRAW RRF PRINT StdOutput “\t\t\t\t\tReview assign \t%5.0f\n” Type; DURATION ReReviewF ‘Normal [ReReviewF.DrawingSet.RRevFMu,ReReviewF.DrawingSet.RRevFSD]’; /************************************************************************************************** /* Termination of ReReviewF ONRELEASE RDFRet ASSIGN Reworked Reworked+1; ONRELEASE RDFRet ASSIGN ReworkFactor ReworkFactor+1; ONRELEASE RDFRet ASSIGN RevError 0; / ONRELEASE RDFRet PRINT StdOutput “Proj No. \t%5.1f” ResNum; / ONRELEASE RDFRet PRINT StdOutput “\tREWORKED \t\t%5.1f \tTime(s)\n” Reworked; /************************************************************************************************** /* Startup of Report ENOUGH R1 ‘Complete.ReworkF.Count==Type1proj+Type2proj+Type3proj+Type4proj+Type5proj’; / ENOUGH R1 ‘Complete.ReworkF.Count==10’; DRAWWHERE R1 ‘DrawingAtFront1’; DRAWUNTIL R1 ‘Report.DrawingSet.Count==Type1proj+Type2proj+Type3proj+Type4proj+Type5proj’ ; DURATION Report 0; ONRELEASE R2 COLLECT PermitTime CompleteTime-ArchTime; ONRELEASE R2 COLLECT PermitTime CompleteTime-StructTime; ONRELEASE R2 COLLECT PermitTime CompleteTime-MechTime; ONRELEASE R2 COLLECT PermitTime CompleteTime-ElectTime; ONRELEASE R2 COLLECT PermitTime CompleteTime-FLSTime; ONRELEASE R2 PRINT StdOutput “Proj No.\t%4.0f” ResNum; ONRELEASE R2 PRINT StdOutput “\tReworked\t%2.0f\tTime(s)\t” Reworked;

306
ONRELEASE R2 PRINT StdOutput “Approval Time\t%5.1f\t,\t” PermitTime.MaxVal; ONRELEASE R2 PRINT StdOutput “Owner Rework Time\t%5.1f\t,\n” OwnerReworkTotal; /************************************************************************************************** /* Termination of Report /************************************************************************************************** /* Entry of resources into OArchPer INIT OArchPer 10; /************************************************************************************************** /* Initialization of Queues, Running the Simulation, Presenting Results SIMULATEUNTIL ‘Complete1.Type1.Count==Type1proj&Complete1.Type2.Count==Type2proj& Complete1.Type3.Count==Type3proj&Complete1.Type4.Count==Type4proj& Complete1.Type5.Count==Type5proj’;

307
Model 2
/************************************************************************************************** /* Stroboscope source file generated from Visio drawing C:\Documents and Settings\Peter Feng\Desktop\Berkeley Working Folder\PhD Research\4. Case Studies\2. OSHPD\1. OSHPD Simulation (9 Jul 08).vsd /************************************************************************************************** VARIABLE Type1proj 50; VARIABLE Type2proj 100; VARIABLE Type3proj 35; VARIABLE Type4proj 20; VARIABLE Type5proj 0; VARIABLE NoArchRev 1; VARIABLE NoStrucRev 1; VARIABLE NoMechRev 1; VARIABLE NoElecRev 1; VARIABLE NoFLSRev 1; VARIABLE RevAssignError ‘Rnd[] <= 1/5 ? 100: LastRnd[] <= 2/5 ? 200: LastRnd[] <= 3/5 ? 300: LastRnd[] <= 4/5 ? 400: 500’; VARIABLE RandomNumber ‘Rnd[]’; MVAVGCOLLECTOR PermitTime 5; /************************************************************************************************** /* Definition of resource types / Define the drawing sets as a resource. This will be the primary resource that flows through the / model. With each drawing set resource a number of characteristics will be assigned. These / characteristics will track how many times a drawing is reviewed and will serve as a counter. / Multiple subtypes of drawing set will be defined. Three different sizes will be established / to represent the actual types of drawings. Small, medium and large projects will be defined / Each of the sizes of drawings can represent either new construction or renovation. CHARTYPE DrawingSet Size ArchMu ArchSD StructMu StructSD MechMu MechSD ElectMu ElectSD FLSMu FLSSD r ORewMu ORewSD RRevAMu RRevASD RRevSMu RRevSSD RRevMMu RRevMSD RRevEMu RRevESD RRevFMu RRevFSD ; /DR /=========================================================================SUBTYPE DrawingSet Type1 1 1.17 0.17 1.85 0.4 1.07 0.05 1.07 0.05 1.36 0.21 82 5 1 1.44
0.42 1.17 0.09 1.39 0.25 1.03 0.03 1.34 0.19 ; /---------------------------------------------------- SUBTYPE DrawingSet Type2 10 1.66 0.26 2.59 0.4 3.79 1.17 0.07 1.38 0.22 93 10 2 1.68 0.26 2.3 0.49 1.17 0.2 1.07 0.04 1.96 0.32 ; /----------------------------------------------------

308
SUBTYPE DrawingSet Type3 100 2.85 0.7 8.32 1.1 4.37 0.8 4.39 1.26 4.0 0.76 99 20 3 1.6 0.29 6.04 0.92 1.82 0.45 1.44 0.2 4.19 1.17 ; /---------------------------------------------------- SUBTYPE DrawingSet Type4 100 8.38 1.82 21.5 6.25 10.9 2.38 8.27 1.94 18.2 3.43 88 70 5 4.05
1.53 10.8 2.9 4.8 1.51 2.7 0.72 7.57 1.8 ; /---------------------------------------------------- SUBTYPE DrawingSet Type5 100 8.38 1.82 21.5 6.25 10.9 2.38 8.27 1.94 18.2 3.43 88 70 5 4.05
1.53 10.8 2.9 4.8 1.51 2.7 0.72 7.57 1.8 ; /---------------------------------------------------- SAVEPROPS DrawingSet ArchR StructR MechR ElectR FLSR RevError; SAVEPROPS DrawingSet RandomNo TotNoRev EntryNumber; SAVEPROPS DrawingSet Reworked; SAVEPROPS DrawingSet ReworkPercent ReworkFactor; SAVEPROPS DrawingSet ArchTime StructTime MechTime ElectTime FLSTime CompleteTime; SAVEPROPS DrawingSet OwnerStart OwnerEnd OwnerReworkTotal; SAVEPROPS DrawingSet ProjNo; VARPROP DrawingSet DiscipProp RandomNo; VARPROP DrawingSet DiscipProp1 ProjNo; CHARTYPE ReviewPer Type; /RP /========================================================================= SUBTYPE ReviewPer Arch 100; SUBTYPE ReviewPer Struct 200; SUBTYPE ReviewPer Mech 300; SUBTYPE ReviewPer Elect 400; SUBTYPE ReviewPer FLS 500; /---------------------------------------------------- / Define five resources that represent the design review personnel. GENTYPE OArchPerson; /AP /************************************************************************************************** /* General section for problem parameters /************************************************************************************************** /* Definition of network nodes / Creates a queue that will hold characterized resources QUEUE Projects DrawingSet; / Combi that initializes each drawings set so the characteristics are set to zero COMBI Initialize; / Creates a queue that represents an area to hold drawings when waiting to be worked on by the

309
/ design review specialist QUEUE DrawingTable DrawingSet; / Series of combi that represent the actual review conducted by the design specialist. The process / times associated with each combi was taken from database provided by OSHPD COMBI ArchRev; COMBI StructRev; COMBI MechRev; COMBI ElectRev; COMBI FLSRev; / Combi that reviews each drawings will only draw from the Drawing Table if each resource has / 1 for each of the review characteristics COMBI Review; NORMAL Review1; COMBI OwnerRework; /Combi for the rereview process, will be sent drawings from a random calculation of who is assigned error COMBI ReReviewA; COMBI ReReviewS; COMBI ReReviewM; COMBI ReReviewE; COMBI ReReviewF; / Creates a series of queues that hold the design review specialist resource. This resource is the / one of the limiting factors that can throttle the speed of the review. With more resources, more / drawings can be reviewed. QUEUE ArchPer ReviewPer; QUEUE StructPer ReviewPer; QUEUE MechPer ReviewPer; QUEUE ElectPer ReviewPer; QUEUE FLSPer ReviewPer; QUEUE OArchPer OArchPerson; / Create Queue for rework decision QUEUE Complete DrawingSet; QUEUE Rework DrawingSet; QUEUE Resubmit DrawingSet; / Create queues for characterized resources, reviewers for each discipline / QUEUE ReworkRevA ReviewPer; / QUEUE ReworkRevS ReviewPer; / QUEUE ReworkRevM ReviewPer; / QUEUE ReworkRevE ReviewPer; / QUEUE ReworkRevF ReviewPer; / Create queue for reporting information QUEUE Complete1 DrawingSet;

310
COMBI Report; /************************************************************************************************** /* Definition of forks FORK ReworkDecision DrawingSet; /************************************************************************************************** /* Definition of network Links / Created below are the links for the model system. The links with DS in the name represent the flow / of drawing set resources. / The links with AP, SP, MP, EP and FP represent the flow of design review personnel. LINK DS1 Projects Initialize; LINK DS2 Initialize DrawingTable; LINK ArchDS DrawingTable ArchRev; LINK ArchDSRet ArchRev DrawingTable; LINK StructDS DrawingTable StructRev; LINK StructDSRet StructRev DrawingTable; LINK MechDS DrawingTable MechRev; LINK MechDSRet MechRev DrawingTable; LINK ElectDS DrawingTable ElectRev; LINK ElectDSRet ElectRev DrawingTable; LINK FLSDS DrawingTable FLSRev; LINK FLSDSRet FLSRev DrawingTable; LINK AP1 ArchPer ArchRev; LINK APRet ArchRev ArchPer; LINK SP1 StructPer StructRev; LINK SPRet StructRev StructPer; LINK MP1 MechPer MechRev; LINK MPRet MechRev MechPer; LINK EP1 ElectPer ElectRev; LINK EPRet ElectRev ElectPer; LINK FP1 FLSPer FLSRev; LINK FPRet FLSRev FLSPer; LINK RD1 DrawingTable Review; LINK RD1A Review Review1 DrawingSet; LINK RD2 Review1 ReworkDecision; LINK RD3 ReworkDecision Complete; LINK RD4 ReworkDecision Rework; LINK RD5 Rework OwnerRework; LINK RD6 OwnerRework Resubmit; LINK OR1 OArchPer OwnerRework; LINK OR2 OwnerRework OArchPer; / Architect ReReview Links LINK RDA Resubmit ReReviewA; LINK RDARet ReReviewA Review1 DrawingSet;

311
LINK RRA ArchPer ReReviewA; LINK RRARet ReReviewA ArchPer; / Structural ReReview Links LINK RDS Resubmit ReReviewS; LINK RDSRet ReReviewS Review1 DrawingSet; LINK RRS StructPer ReReviewS; LINK RRSRet ReReviewS StructPer; / Mechanical ReReview Links LINK RDM Resubmit ReReviewM; LINK RDMRet ReReviewM Review1 DrawingSet; LINK RRM MechPer ReReviewM; LINK RRMRet ReReviewM MechPer; / Electrical ReReview Links LINK RDE Resubmit ReReviewE; LINK RDERet ReReviewE Review1 DrawingSet; LINK RRE ElectPer ReReviewE; LINK RRERet ReReviewE ElectPer; / FLS ReReview Links LINK RDF Resubmit ReReviewF; LINK RDFRet ReReviewF Review1 DrawingSet; LINK RRF FLSPer ReReviewF; LINK RRFRet ReReviewF FLSPer; / Links for reporting information LINK R1 Complete Report; LINK R2 Report Complete1; /************************************************************************************************** /* Definition of global variables and programing objects FILTER ArchRevF DrawingSet ‘ArchR==0’; FILTER StructRevF DrawingSet ‘StructR==0’; FILTER MechRevF DrawingSet ‘MechR==0’; FILTER ElectRevF DrawingSet ‘ElectR==0’; FILTER FLSRevF DrawingSet ‘FLSR==0’; FILTER ReworkF DrawingSet ‘ArchR==1&StructR==1&MechR==1&ElectR==1&FLSR==1’; FILTER DrawingAtFront DrawingSet ‘RandomNo==DrawingTable.RandomNo.MinVal’; FILTER DrawingAtFront1 DrawingSet ‘ProjNo==Complete.ProjNo.MinVal’; DISCIPLINE DrawingTable DiscipProp; DISCIPLINE Complete DiscipProp1; FILTER ArchPerF ReviewPer ‘Arch==100’; FILTER StructPerF ReviewPer ‘Struct==200’; FILTER MechPerF ReviewPer ‘Mech==300’; FILTER ElectPerF ReviewPer ‘Elect==400’; FILTER FLSPerF ReviewPer ‘FLS==500’;

312
/ Create Filters to direct correctly assigned rework to its corresponding review; FILTER ReworkRevFA DrawingSet ‘RevError==100’; FILTER ReworkRevFS DrawingSet ‘RevError==200’; FILTER ReworkRevFM DrawingSet ‘RevError==300’; FILTER ReworkRevFE DrawingSet ‘RevError==400’; FILTER ReworkRevFF DrawingSet ‘RevError==500’; /************************************************************************************************** /* Statements to assist in the definition of attributes of Projects and its related links /************************************************************************************************** /* Entry of resources into Projects / This step creates the number of drawing sets that will be loaded into the system. Three types of / projects will be loaded into the system to represent small, medium, or large projects either new / construction or renovated. INIT Projects Type1proj Type1; INIT Projects Type2proj Type2; INIT Projects Type3proj Type3; INIT Projects Type4proj Type4; INIT ArchPer NoArchRev Arch; INIT StructPer NoStrucRev Struct; INIT MechPer NoMechRev Mech; INIT ElectPer NoElecRev Elect; INIT FLSPer NoFLSRev FLS; / INIT ReworkRevA 1 Arch; / INIT ReworkRevS 1 Struct; / INIT ReworkRevM 1 Mech; / INIT ReworkRevE 1 Elect; / INIT ReworkRevF 1 FLS; /************************************************************************************************** /* Startup of Initialize ONDRAW DS1 ASSIGN RandomNo RandomNumber+Size; ONDRAW DS1 ASSIGN ProjNo ResNum; DURATION Initialize ‘0’; /************************************************************************************************** /* Termination of Initialize / This initializes the properties of each of the drawings that flow through the model. Each ONRELEASE DS2 ASSIGN ArchR 0; ONRELEASE DS2 ASSIGN StructR 0; ONRELEASE DS2 ASSIGN MechR 0; ONRELEASE DS2 ASSIGN ElectR 0; ONRELEASE DS2 ASSIGN FLSR 0; ONRELEASE DS2 ASSIGN Reworked 0; /Turn on the following two print statements to verify random generation of projects to load into /the system. / ONRELEASE DS2 PRINT StdOutput “Proj No. \t%5.1f” ResNum;

313
/ ONRELEASE DS2 PRINT StdOutput “\tRandom No Assign \t%5.4f\n” RandomNo; / ONRELEASE DS2 PRINT StdOutput “Proj No. \t%5.1f” ResNum; / ONRELEASE DS2 PRINT StdOutput “\tRandom No Assign \t%5.0f\n” ProjNo; /************************************************************************************************** /* Entry of resources into DrawingTable /************************************************************************************************** /* Statements to assist in the definition of attributes of ArchRev and its related links /************************************************************************************************** /* Startup of ArchRev / This criterion will only pull drawings where the ArchR is less than one. This step ensures that / the drawings will only be reviewed once by the architect before a rework decision is made. / This step will only pull a drawing set to review if there is one or more drawings in the queue ENOUGH ArchDS ‘DrawingTable.ArchRevF.Count>=1’; DRAWWHERE ArchDS ‘ArchR==0&DrawingAtFront’; / ONDRAW ArchDS PRINT StdOutput “Proj No. \t%5.1f” ResNum; / ONDRAW ArchDS PRINT StdOutput “\tin ArchRev at\t%5.1f\n” SimTime; ONDRAW ArchDS ASSIGN ArchTime SimTime; / This criterion requires one architect to be available to review the drawings set. ENOUGH AP1 ‘ArchPer.CurCount>= 1’; / This step lists the duration of the architectural review which will be a normal distribution. / This step will expand to incorporate three types of review, small, medium and large. The / durations will be taken from the database provided. DURATION ArchRev ‘Normal[ArchRev.DrawingSet.ArchMu,ArchRev.DrawingSet.ArchSD]’; /************************************************************************************************** /* Termination of ArchRev / This resets the value to one once the drawing has been reviewed by the architect. ONRELEASE ArchDSRet ASSIGN ArchR ArchR+1; / ONDRAW ArchDS PRINT StdOutput “======= Arch Filter Count =%5.1f\n” DrawingTable.ArchRevF.Count; / ONDRAW StructDS PRINT StdOutput “======= Struct Filter Count =%5.1f\n” DrawingTable.StructRevF.Count; / ONDRAW MechDS PRINT StdOutput “======= Mech Filter Count =%5.1f\n” DrawingTable.MechRevF.Count; / ONDRAW ElectDS PRINT StdOutput “======= Elect Filter Count =%5.1f\n” DrawingTable.ElectRevF.Count;

314
/ ONDRAW FLSDS PRINT StdOutput “======= FLS Filter Count =%5.1f\n” DrawingTable.FLSRevF.Count; / ONDRAW RD1 PRINT StdOutput “======= Rework Filter Count =%5.1f\n” DrawingTable.Rework.Count; /************************************************************************************************** /* Startup of StructRev / The following two criteria require that at least one drawing be available for review and that a / structural design reviewer is available. ENOUGH StructDS ‘DrawingTable.StructRevF.Count>0’; DRAWWHERE StructDS ‘StructR==0&DrawingAtFront’; / ONDRAW StructDS PRINT StdOutput “Proj No. \t%5.1f” ResNum; / ONDRAW StructDS PRINT StdOutput “\tin StructRev at\t%5.1f\n” SimTime; ONDRAW StructDS ASSIGN StructTime SimTime; ENOUGH SP1 ‘StructPer.CurCount>=1’; / This criteria will only draw a project if it hasn’t been reviewed by a structural design reviewer / This step lists the duration of the structural review which will be a normal distribution. DURATION StructRev ‘Normal[StructRev.DrawingSet.StructMu,StructRev.DrawingSet.StructSD]’; /************************************************************************************************** /* Termination of StructRev ONRELEASE StructDSRet ASSIGN StructR StructR+1; /************************************************************************************************** /* Startup of MechRev / The following two criteria require that at least one drawing be available for review and that a / mechanical design reviewer is available. / ENOUGH MechDS ‘DrawingTable.Type1.Count>=1’; ENOUGH MechDS ‘DrawingTable.MechRevF.Count>=1’; DRAWWHERE MechDS ‘MechR==0&DrawingAtFront’; / ONDRAW MechDS PRINT StdOutput “Proj No. \t%5.1f” ResNum; / ONDRAW MechDS PRINT StdOutput “\tin MechRev at\t%5.1f\n” SimTime; ONDRAW MechDS ASSIGN MechTime SimTime; ENOUGH MP1 ‘MechPer.CurCount>=1’; / This criteria will only draw a project if it hasn’t been reviewed by a mechanical design reviewer

315
/ This step lists the duration of the mechanical review which will be a normal distribution. DURATION MechRev ‘Normal[MechRev.DrawingSet.MechMu,MechRev.DrawingSet.MechSD]’; /************************************************************************************************** /* Termination of MechRev ONRELEASE MechDSRet ASSIGN MechR MechR+1; /************************************************************************************************** /* Startup of ElectRev / The following two criteria require that at least one drawing be available for review and that a / electrical design reviewer is available. / ENOUGH ElectDS ‘DrawingTable.Type1.Count>=1’; ENOUGH ElectDS ‘DrawingTable.ElectRevF.Count>=1’; DRAWWHERE ElectDS ‘ElectR==0&DrawingAtFront’; ONDRAW ElectDS ASSIGN ElectTime SimTime; ENOUGH EP1 ‘ElectPer.CurCount>=1’; / This criteria will only draw a project if it hasn’t been reviewed by a electrical design reviewer / This step lists the duration of the electrical review which will be a normal distribution. DURATION ElectRev ‘Normal[ElectRev.DrawingSet.ElectMu,ElectRev.DrawingSet.ElectSD]’; /************************************************************************************************** /* Termination of ElectRev ONRELEASE ElectDSRet ASSIGN ElectR ElectR+1; /************************************************************************************************** /* Startup of FLSRev / The following two criteria require that at least one drawing be available for review and that a / fire, life, and safety design reviewer is available. / ENOUGH FLSDS ‘DrawingTable.Type1.Count >=1’; ENOUGH FLSDS ‘DrawingTable.FLSRevF.Count>=1’; DRAWWHERE FLSDS ‘FLSR==0&DrawingAtFront’; / ONDRAW FLSDS PRINT StdOutput “Proj No. \t%5.1f” ResNum; / ONDRAW FLSDS PRINT StdOutput “\tin FLSRev at\t%5.1f\n” SimTime; ONDRAW FLSDS ASSIGN FLSTime SimTime; ENOUGH FP1 ‘FLSPer.CurCount >= 1’; / This criteria will only draw a project if it hasn’t been reviewed by a fire, life, and safety

316
/ design reviewer / This step lists the duration of the fire, life, and safety review which will be a normal / distribution. DURATION FLSRev ‘Normal[FLSRev.DrawingSet.FLSMu,FLSRev.DrawingSet.FLSSD]’; /************************************************************************************************** /* Termination of FLSRev ONRELEASE FLSDSRet ASSIGN FLSR FLSR+1; /************************************************************************************************** /* Startup of Review ENOUGH RD1 ‘DrawingTable.ReworkF.Count>=1’; DRAWWHERE RD1 ‘ArchR==1&StructR==1&MechR==1&ElectR==1&FLSR==1’; ONDRAW RD1 ReworkFactor 1; ONDRAW RD1 Reworked 0; DURATION Review ‘0’; /************************************************************************************************** /* Termination of Review /************************************************************************************************** /* Startup of Review1 DURATION Review1 ‘0’; /************************************************************************************************** /* Termination of Review1 /* Rework factor, set to 1 if drawingset has never been repaired and to 2 if it has STRENGTH RD4 ‘Review1.DrawingSet.r/Review1.DrawingSet.ReworkFactor’; STRENGTH RD3 100-Review1.DrawingSet.r/Review1.DrawingSet.ReworkFactor; /************************************************************************************************** /* Startup of OwnerRework ENOUGH RD5 ‘Rework.ReworkF.Count>=1’; /ONFLOW RD3 PRINT StdOutput “Proj No. \t%5.1f” ResNum; / ONFLOW RD3 PRINT StdOutput “\tCOMPLETE at \t%5.1f\n” SimTime; /ONFLOW RD3 PRINT StdOutput “\tReworked \t%5.0f \tTime(s)\t” Reworked; ONFLOW RD3 ASSIGN CompleteTime SimTime; /ONFLOW RD3 COLLECT PermitTime CompleteTime-ArchTime; /ONFLOW RD3 COLLECT PermitTime CompleteTime-StructTime; /ONFLOW RD3 COLLECT PermitTime CompleteTime-MechTime; /ONFLOW RD3 COLLECT PermitTime CompleteTime-ElectTime; /ONFLOW RD3 COLLECT PermitTime CompleteTime-FLSTime;

317
/ONFLOW RD3 PRINT StdOutput “Approval Time \t%5.1f\t,\t” PermitTime.MaxVal; /ONFLOW RD3 PRINT StdOutput “Owner Rework Time \t%5.1f\n” OwnerReworkTotal; / ONFLOW RD3 PRINT StdOutput “Proj No. \t%5.1f” ResNum; / ONFLOW RD3 PRINT StdOutput “\t(Arch) Comp Time \t%5.1f\n” CompleteTime-ArchTime; / ONFLOW RD3 PRINT StdOutput “Proj No. \t%5.1f” ResNum; / ONFLOW RD3 PRINT StdOutput “\t(Struct) Comp Time \t%5.1f\n” CompleteTime-StructTime; / ONFLOW RD3 PRINT StdOutput “Proj No. \t%5.1f” ResNum; / ONFLOW RD3 PRINT StdOutput “\t(Mech) Comp Time \t%5.1f\n” CompleteTime-MechTime; / ONFLOW RD3 PRINT StdOutput “Proj No. \t%5.1f” ResNum; / ONFLOW RD3 PRINT StdOutput “\t(Elect) Comp Time \t%5.1f\n” CompleteTime-ElectTime; / ONFLOW RD3 PRINT StdOutput “Proj No. \t%5.1f” ResNum; / ONFLOW RD3 PRINT StdOutput “\t(FLS) Comp Time \t%5.1f\n” CompleteTime-FLSTime; ONDRAW RD5 ASSIGN OwnerStart SimTime; ONDRAW RD5 ASSIGN RevError RevAssignError; DURATION OwnerRework ‘Normal[OwnerRework.DrawingSet.ORewMu,OwnerRework.DrawingSet.ORewSD]’; /Turn on these print statements to show the error assigned and the rework factor. / ONRELEASE RD6 PRINT StdOutput “Proj No. \t%5.1f” ResNum; / ONRELEASE RD6 PRINT StdOutput “\tAssign Err No. \t%5.0f” RevError; / ONRELEASE RD6 PRINT StdOutput “\tRework Percent \t%5.1f\n” ‘r/ReworkFactor’; /************************************************************************************************** /* Termination of OwnerRework ONRELEASE RD6 ASSIGN OwnerEnd SimTime; ONRELEASE RD6 ASSIGN OwnerReworkTotal OwnerReworkTotal+(OwnerEnd-OwnerStart); / ONRELEASE RD6 PRINT StdOutput “Proj No. \t%5.1f” ResNum; / ONRELEASE RD6 PRINT StdOutput “\tOwner Rework Time \t%5.1f\n” OwnerReworkTotal; /************************************************************************************************** /* Startup of ReReviewA PRIORITY ReReviewA ‘Resubmit.CurCount>0 ? 10 : 0’; ENOUGH RDA ‘Resubmit.ReworkRevFA.Count>=1’; DRAWWHERE RDA ‘RevError==100’;

318
/Turn on the print statement to check the reviewer assigned / ONDRAW RRA PRINT StdOutput “\t\t\t\t\tReview assign \t%5.0f\n” Type; DURATION ReReviewA ‘Normal [ReReviewA.DrawingSet.RRevAMu,ReReviewA.DrawingSet.RRevASD]’; /************************************************************************************************** /* Termination of ReReviewA ONRELEASE RDARet ASSIGN Reworked Reworked+1; ONRELEASE RDARet ASSIGN ReworkFactor ReworkFactor+1; ONRELEASE RDARet ASSIGN RevError 0; / ONRELEASE RDARet PRINT StdOutput “Proj No. \t%5.1f” ResNum; / ONRELEASE RDARet PRINT StdOutput “\tREWORKED \t\t%5.1f \tTime(s)\n” Reworked; /************************************************************************************************** /* Startup of ReReviewS PRIORITY ReReviewS ‘Resubmit.CurCount>0 ? 10 : 0’; ENOUGH RDS ‘Resubmit.ReworkRevFS.Count>=1’; DRAWWHERE RDS ‘RevError==200’; /Turn on the print statement to check the reviewer assigned / ONDRAW RRS PRINT StdOutput “\t\t\t\t\tReview assign \t%5.0f\n” Type; DURATION ReReviewS ‘Normal [ReReviewS.DrawingSet.RRevSMu,ReReviewS.DrawingSet.RRevSSD]’; /************************************************************************************************** /* Termination of ReReviewS ONRELEASE RDSRet ASSIGN Reworked Reworked+1; ONRELEASE RDSRet ASSIGN ReworkFactor ReworkFactor+1; ONRELEASE RDSRet ASSIGN RevError 0; / ONRELEASE RDSRet PRINT StdOutput “Proj No. \t%5.1f” ResNum; / ONRELEASE RDSRet PRINT StdOutput “\tREWORKED \t\t%5.1f \tTime(s)\n” Reworked; /************************************************************************************************** /* Startup of ReReviewM PRIORITY ReReviewM ‘Resubmit.CurCount>0 ? 10 : 0’; ENOUGH RDM ‘Resubmit.ReworkRevFM.Count>=1’; DRAWWHERE RDM ‘RevError==300’; /Turn on the print statement to check the reviewer assigned

319
/ ONDRAW RRM PRINT StdOutput “\t\t\t\t\tReview assign \t%5.0f\n” Type; DURATION ReReviewM ‘Normal [ReReviewM.DrawingSet.RRevMMu,ReReviewM.DrawingSet.RRevMSD]’; /************************************************************************************************** /* Termination of ReReviewM ONRELEASE RDMRet ASSIGN Reworked Reworked+1; ONRELEASE RDMRet ASSIGN ReworkFactor ReworkFactor+1; ONRELEASE RDMRet ASSIGN RevError 0; / ONRELEASE RDMRet PRINT StdOutput “Proj No. \t%5.1f” ResNum; / ONRELEASE RDMRet PRINT StdOutput “\tREWORKED \t\t%5.1f \tTime(s)\n” Reworked; /************************************************************************************************** /* Startup of ReReviewE PRIORITY ReReviewE ‘Resubmit.CurCount>0 ? 10 : 0’; ENOUGH RDE ‘Resubmit.ReworkRevFE.Count>=1’; DRAWWHERE RDE ‘RevError==400’; /Turn on the print statement to check the reviewer assigned / ONDRAW RRE PRINT StdOutput “\t\t\t\t\tReview assign \t%5.0f\n” Type; DURATION ReReviewE ‘Normal [ReReviewE.DrawingSet.RRevEMu,ReReviewE.DrawingSet.RRevESD]’; /************************************************************************************************** /* Termination of ReReviewE ONRELEASE RDERet ASSIGN Reworked Reworked+1; ONRELEASE RDERet ASSIGN ReworkFactor ReworkFactor+1; ONRELEASE RDERet ASSIGN RevError 0; / ONRELEASE RDERet PRINT StdOutput “Proj No. \t%5.1f” ResNum; / ONRELEASE RDERet PRINT StdOutput “\tREWORKED \t\t%5.1f \tTime(s)\n” Reworked; /************************************************************************************************** /* Startup of ReReviewF PRIORITY ReReviewF ‘Resubmit.CurCount>0 ? 10 : 0’; ENOUGH RDF ‘Resubmit.ReworkRevFF.Count>=1’; DRAWWHERE RDF ‘RevError==500’; /Turn on the print statement to check the reviewer assigned / ONDRAW RRF PRINT StdOutput “\t\t\t\t\tReview assign \t%5.0f\n” Type;

320
DURATION ReReviewF ‘Normal [ReReviewF.DrawingSet.RRevFMu,ReReviewF.DrawingSet.RRevFSD]’; /************************************************************************************************** /* Termination of ReReviewF ONRELEASE RDFRet ASSIGN Reworked Reworked+1; ONRELEASE RDFRet ASSIGN RevError 0; / ONRELEASE RDFRet PRINT StdOutput “Proj No. \t%5.1f” ResNum; / ONRELEASE RDFRet PRINT StdOutput “\tREWORKED \t\t%5.1f \tTime(s)\n” Reworked; /************************************************************************************************** /* Startup of Report ENOUGH R1 ‘Complete.ReworkF.Count==Type1proj+Type2proj+Type3proj+Type4proj+Type5proj’; / ENOUGH R1 ‘Complete.ReworkF.Count==10’; DRAWWHERE R1 ‘DrawingAtFront1’; DRAWUNTIL R1 ‘Report.DrawingSet.Count==Type1proj+Type2proj+Type3proj+Type4proj+Type5proj’ ; DURATION Report 0; ONRELEASE R2 COLLECT PermitTime CompleteTime-ArchTime; ONRELEASE R2 COLLECT PermitTime CompleteTime-StructTime; ONRELEASE R2 COLLECT PermitTime CompleteTime-MechTime; ONRELEASE R2 COLLECT PermitTime CompleteTime-ElectTime; ONRELEASE R2 COLLECT PermitTime CompleteTime-FLSTime; ONRELEASE R2 PRINT StdOutput “Proj No.\t%4.0f” ResNum; ONRELEASE R2 PRINT StdOutput “\tReworked\t%2.0f\tTime(s)\t” Reworked; ONRELEASE R2 PRINT StdOutput “Approval Time\t%5.1f\t,\t” PermitTime.MaxVal; ONRELEASE R2 PRINT StdOutput “Owner Rework Time\t%5.1f\t,\n” OwnerReworkTotal; /************************************************************************************************** /* Termination of Report /************************************************************************************************** /* Entry of resources into OArchPer INIT OArchPer 10; /************************************************************************************************** /* Initialization of Queues, Running the Simulation, Presenting Results SIMULATEUNTIL ‘Complete1.Type1.Count==Type1proj&Complete1.Type2.Count==Type2proj& Complete1.Type3.Count==Type3proj&Complete1.Type4.Count==Type4proj& Complete1.Type5.Count==Type5proj’;

321
Appendix D Validation Output Information
I present the following output as a way to validate the computer model presented in
chapter 6. Figure D-1 shows projects entering the system according to when they were
defined in the computer code.
Figure D-1 Loading System, No Sorting Key
Figure D-1 shows the project number and when it was taken into the respective reviewer.
For example project 1 is taken in to the architect for review first, project 2 is taken into
the structural engineer for review second, and so on in descending order.

322
This is not a realistic way of how the organization receives and reviews drawings.
For example a category III project will come in before a category II or category I project
and will be worked on in that order. The organization typically structures their work in a
first in first out order.
To simulate a first in first out review situation, the discrete event simulation
model generates a random number and assigns it to each of the projects when they
initially enter the system. The projects are ordered according to their random number.
The following code generates this randomization which reorders how the projects are
reviewed.
VARIABLE RandomNumber ‘Rnd[]’;
SAVEPROPS DrawingSet RandomNo;
VARPROP DrawingSet DiscipProp RandomNo;
Filters ensure that the drawing at front is reviewed first by the available reviewer.
FILTER DrawingAtFront DrawingSet
‘RandomNo==DrawingTable.RandomNo.MinVal’;
DISCIPLINE DrawingTable DiscipProp; The discipline of the queue DrawingTable is
set to follow the order in which the drawings were ranked in accordance with the random
number.
ONDRAW DS1 ASSIGN RandomNo RandomNumber; This “ondraw” code
generates a random number for each of the projects and assigns it to a saved property.
DRAWWHERE ArchDS ‘ArchR==0&DrawingAtFront’; This “drawwhere”
code draws a project into the architect for review which has not been reviewed yet and
meets the criteria of the random number order.

323
Figure D-2 shows the projects with a random number assigned and how they are taken in
by the simulation model.
Figure D-2 Loading System With a Sorting Key Random
Figure D-2 shows the project number and the resultant random number generated.
Project number 1 is assigned 0.2136, project number 2 is assigned 0.5618.
FILTER DrawingAtFront DrawingSet
‘RandomNo==DrawingTable.RandomNo.MinVal’;
The “filter” code then reorders the projects to have the minimum value to enter the
review first, which in this situation is project number 8 which is assigned a number

324
0.0063, then project number 9 with a random number of 0.0459, then project number 4
with a random number of 0.0818 and so on until all the projects are reviewed.
The rework percentage is dependent on the rework cycle. Figure D-3 illustrates a
changing rework percentage. It shows that if a rework percentage is assigned to 100%,
then on the second rework cycle, the rework percentage will be 50% as shown by arrows
6 and 7.
Figure D-3 Dynamic Rework
Figure D-4 illustrates how a project can be reworked multiple times with different types
of errors assigned. In this example project 20 is highlighted with arrow 1. It entered the
rework process and was assigned the error 500 which means it was a fire, life, and safety
error. It was then assigned the fire, life, and safety reviewer as highlighted by arrow 2. It
was then determined to require another rework cycle as shown by arrows 3 and 4 with an
6
5
4
3
1
2
7

325
assigned error of 300 which represents a mechanical issue. Finally it was then required to
be reworked again by being assigned an error of 500 or the fire, life, and safety
discipline. The project was finally completed after being reworked three times as noted
by arrow 7 and completed at time 283.1 days as marked by arrow 8.
Figure D-4 Example of Multiple Rework Cycles
Figure D-5 shows output from the model that highlights the matching issue. Arrows 1, 3
and 5 show the error that is assigned. Arrows 2, 4, and 6 show that the reviewer assigned
to correct the error matches the assigned error number.
1 2
3 4
5 6
7
1 2
3 4
5 6
8 7

326
Figure D-5 Error Assignment
Assigning Rework is accomplished through a random number generator.
VARIABLE RevAssignError ‘Rnd[] <= 1/5 ? 100:
LastRnd[] <= 2/5 ? 200:
LastRnd[] <= 3/5 ? 300:
LastRnd[] <= 4/5 ? 400: 500’;
This code assigns RevAssignError by generating a random number and then
assigning it to either 100, 200, 300, 400, or 500. Those respective numbers represent
1 2
3 4
5 6
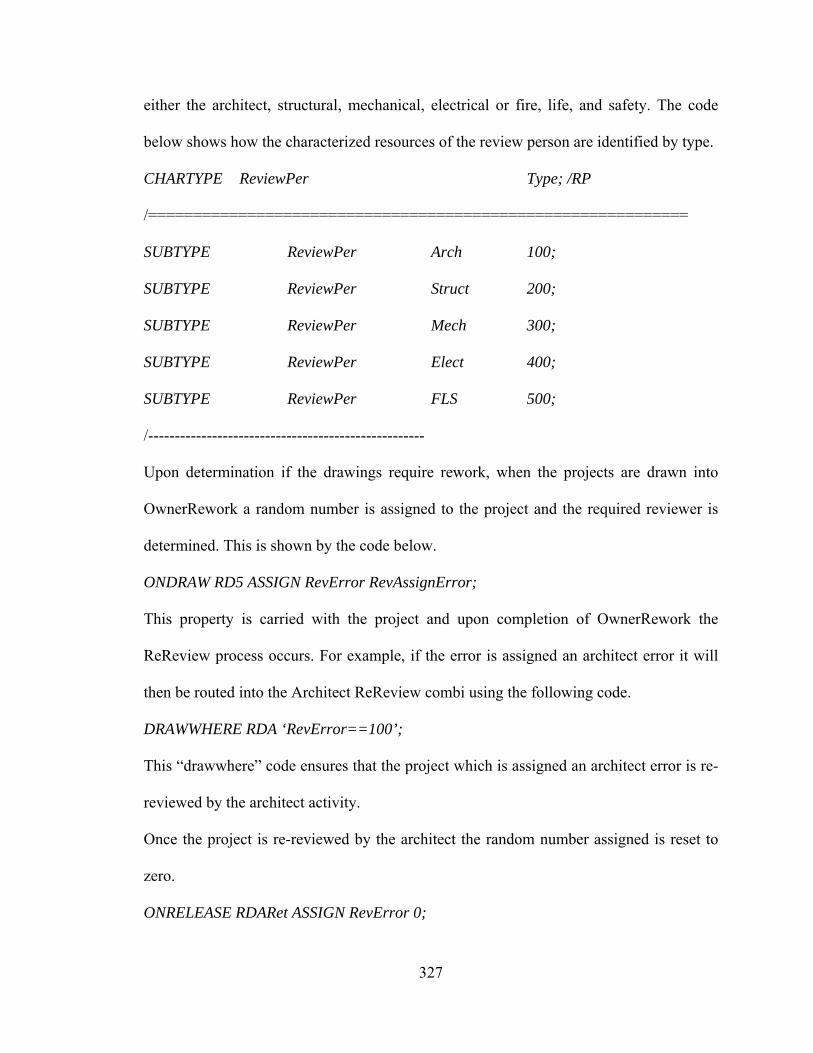
327
either the architect, structural, mechanical, electrical or fire, life, and safety. The code
below shows how the characterized resources of the review person are identified by type.
CHARTYPE ReviewPer Type; /RP
/============================================================
SUBTYPE ReviewPer Arch 100;
SUBTYPE ReviewPer Struct 200;
SUBTYPE ReviewPer Mech 300;
SUBTYPE ReviewPer Elect 400;
SUBTYPE ReviewPer FLS 500;
/----------------------------------------------------
Upon determination if the drawings require rework, when the projects are drawn into
OwnerRework a random number is assigned to the project and the required reviewer is
determined. This is shown by the code below.
ONDRAW RD5 ASSIGN RevError RevAssignError;
This property is carried with the project and upon completion of OwnerRework the
ReReview process occurs. For example, if the error is assigned an architect error it will
then be routed into the Architect ReReview combi using the following code.
DRAWWHERE RDA ‘RevError==100’;
This “drawwhere” code ensures that the project which is assigned an architect error is re-
reviewed by the architect activity.
Once the project is re-reviewed by the architect the random number assigned is reset to
zero.
ONRELEASE RDARet ASSIGN RevError 0;

328
This reset occurs because the project then goes back to rework decision to determine if
the project requires another round of rework. If rework is not needed, the project flows
into the complete queue. If it requires rework then the project is reassigned a random
number and a discipline error is assigned. The process continues until that project
requires no more rework and enters the complete queue. The model output tracks the
number of times the project is reworked and becomes vital information in determining
the overall time to permit the drawings.
Similar statements mirror this error assignment for structural, mechanical, electrical and
fire, life, and safety. The code fragments are shown below.
Structural - DRAWWHERE RDS ‘RevError==200’;
ONRELEASE RDSRet ASSIGN RevError 0;
Mechanical -DRAWWHERE RDM ‘RevError==300’;
ONRELEASE RDMRet ASSIGN RevError 0;
Electrical - DRAWWHERE RDE ‘RevError==400’;
ONRELEASE RDERet ASSIGN RevError 0;
Fire, life, and safety - DRAWWHERE RDF ‘RevError==500’;
ONRELEASE RDFRet ASSIGN RevError 0;

329
Appendix E Resampling Code for Case II
Following is code generated to run the resampling analysis program. The lines of code
that begins with the # symbol are comments in the program and do not impact the
computer program.
# Code to plot histograms from data collected Line 1: sample = c(45,8,2,51,3,16,8,25,29,15,4,20,1,54,1,42,29,2,29,67, 52,1,36,1,1,1,1,2,1,1) # Create a vector in which to store type3 values Line 2: Value=numeric(1000) Line 3: n=length(sample) # Setup a loop to generate the 1000 values Line 4: Value = sapply(1:1000, function(x) {mean(sample (type3, n, replace=T))}) Line 5: hist(Value) Line 6: print (hist (Value)) Line 7: print (mean (Value)) Line 8: print (sd (Value))
Line 1 creates a vector of numbers that were calculated from a spreadsheet.
Line 2 creates another vector that will hold 1000 vectors of the same length as the
original vector. In this case, the original vector contains 30 values.
Line 3 requires each generated vector to have the same amount of data points as the
original vector which for all resampling code is 30.
Line 4 generates a loop that takes the mean of each of the generated vectors and then
stores them in the Value vector.
Line 5 creates a histogram of the Value vector.
Lines 6 through 8 print the histogram, mean of the 1000 values and standard deviation of
the 1000 values.

330
Figure E-1 shows a sample output from this resampling code.
Figure E-1 Sample Output from Resampling Code

331
Figure E-2 Sample Histogram
As shown in figure E-1 the mean was calculated to be 8.26 and the standard deviation
1.89 for the 1000 values stored in the Value vector. The histogram (figure E-2) shows the
review times resemble a normal curve.

332
Following is code used to calculate the review times for each review discipline and for
each project category.
Category I (Less than $50K)
Architectural Review (Less than $50K)
# Code to plot histograms from data collected type3 = c(1,1,1,1,1,1,1,1,1,1,1,1,1,1,1,1,1,1,1,1,1,1,1,1,1,1,1,1,1,6) #Create a vector in which to store type3 values Value=numeric(1000) # Setup a loop to generate the 1000 values n=length(type3) Value = sapply(1:1000, function(x) { mean(sample (type3, n, replace=T)) }) hist(Value) print (hist (Value)) print (mean (Value)) print (sd (Value)) Electrical Review (Less than $50K)
# Code to plot histograms from data collected type3 = c(1,1,1,1,1,1,1,1,1,1,1,1,1,1,1,1,1,1,1,1,1,1,1,1,1,1,1,1,2,2) #Create a vector in which to store type3 values Value=numeric(1000) # Setup a loop to generate the 1000 values n=length(type3) Value = sapply(1:1000, function(x) { mean(sample (type3, n, replace=T)) }) hist(Value) print (hist (Value)) print (mean (Value)) print (sd (Value))

333
Fire, Life, and Safety Review (Less than $50K)
# Code to plot histograms from data collected type3 = c(1,1,1,1,1,1,1,1,1,1,1,1,1,1,1,1,1,1,1,1,1,1,1,1,1,2,2,3,2,7) #Create a vector in which to store type3 values Value=numeric(1000) # Setup a loop to generate the 1000 values n=length(type3) Value = sapply(1:1000, function(x) { mean(sample (type3, n, replace=T)) }) hist(Value) print (hist (Value)) print (mean (Value)) print (sd (Value)) Mechanical Review (Less than $50K)
# Code to plot histograms from data collected type3 = c(1,1,1,1,1,1,1,1,1,1,1,1,1,1,1,1,1,1,1,1,1,1,1,1,1,1,1,1,2,2) #Create a vector in which to store type3 values Value=numeric(1000) # Setup a loop to generate the 1000 values n=length(type3) Value = sapply(1:1000, function(x) { mean(sample (type3, n, replace=T)) }) hist(Value) print (hist (Value)) print (mean (Value)) print (sd (Value)) Structural Review (Less than $50K)
# Code to plot histograms from data collected type3 = c(1,1,1,1,1,1,1,1,1,1,1,1,1,1,1,1,1,1,1,1,1,1,1,1,1,2,5,7,8,8) #Create a vector in which to store type3 values Value=numeric(1000)

334
# Setup a loop to generate the 1000 values n=length(type3) Value = sapply(1:1000, function(x) { mean(sample (type3, n, replace=T)) }) hist(Value) print (hist (Value)) print (mean (Value)) print (sd (Value))
Category II (Greater than $50K and less than or equal to $1M)
Architectural Review (Greater than $50K and less than or equal to $1M)
# Code to plot histograms from data collected # Code to plot histograms from data collected type3 = c(1,7,2,2,1,5,1,3,1,1,1,1,1,1,1,1,7,1,1,1,3,1,1,1,1,1,2,1,1,1,1,1,1,1,1) #Create a vector in which to store type3 values Value=numeric(1000) # Setup a loop to generate the 1000 values n=length(type3) Value = sapply(1:1000, function(x) { mean(sample (type3, n, replace=T)) }) hist(Value) print (hist (Value)) print (mean (Value)) print (sd (Value)) Electrical Review (Greater than $50K and less than or equal to $1M)
# Code to plot histograms from data collected type3 = c(1,1,1,1,1,1,1,1,1,1,1,1,1,1,1,1,1,1,1,1,1,1,1,1,1,2,2,2,2,2) #Create a vector in which to store type3 values Value=numeric(1000) # Setup a loop to generate the 1000 values n=length(type3)

335
Value = sapply(1:1000, function(x) { mean(sample (type3, n, replace=T)) }) hist(Value) print (hist (Value)) print (mean (Value)) print (sd (Value)) Fire, Life, and Safety Review (Greater than $50K and less than or equal to $1M)
# Code to plot histograms from data collected type3 = c(1,1,1,1,1,1,1,1,1,1,1,1,1,1,1,1,1,1,1,1,1,1,1,1,2,2,2,3,7) #Create a vector in which to store type3 values Value=numeric(1000) # Setup a loop to generate the 1000 values n=length(type3) Value = sapply(1:1000, function(x) { mean(sample (type3, n, replace=T)) }) hist(Value) print (hist (Value)) print (mean (Value)) print (sd (Value)) Mechanical Review (Greater than $50K and less than or equal to $1M)
# Code to plot histograms from data collected type3 = c(1,1,1,1,1,1,1,1,1,1,1,1,1,1,1,1,1,1,1,1,2,2,2,2,2,2,4,14,60) #Create a vector in which to store type3 values Value=numeric(1000) # Setup a loop to generate the 1000 values n=length(type3) Value = sapply(1:1000, function(x) { mean(sample (type3, n, replace=T)) }) hist(Value) print (hist (Value)) print (mean (Value)) print (sd (Value))

336
Structural Review (Greater than $50K and less than or equal to $1M)
# Code to plot histograms from data collected type3 = c(1,1,2,2,2,1,1,1,3,4,4,6,3,1,2,2,3,1,3,3,1,1,2,1,4,1,3,12,4,2) #Create a vector in which to store type3 values Value=numeric(1000) # Setup a loop to generate the 1000 values n=length(type3) Value = sapply(1:1000, function(x) { mean(sample (type3, n, replace=T)) }) hist(Value) print (hist (Value)) print (mean (Value)) print (sd (Value))
Category III (Greater than $1M and less than or equal to $10M)
Architectural Review (Greater than $1M and less than or equal to $10M)
# Code to plot histograms from data collected type3 = c(2,1,1,1,1,1,1,1,1,9,1,4,3,1,3,4,11,1,1,1,1,1,1,1,3,1,6,4,1,18) #Create a vector in which to store type3 values Value=numeric(1000) # Setup a loop to generate the 1000 values n=length(type3) Value = sapply(1:1000, function(x) { mean(sample (type3, n, replace=T)) }) hist(Value) print (hist (Value)) print (mean (Value)) print (sd (Value)) Electrical Review (Greater than $1M and less than or equal to $10M)
# Code to plot histograms from data collected

337
type3 = c(1,1,1,1,5,28,1,6,1,27,3,1,3,1,1,13,1,1,1,4,2,2,3,8,1,1,3,1,7,2) #Create a vector in which to store type3 values Value=numeric(1000) # Setup a loop to generate the 1000 values n=length(type3) Value = sapply(1:1000, function(x) { mean(sample (type3, n, replace=T)) }) hist(Value) print (hist (Value)) print (mean (Value)) print (sd (Value)) Fire, Life, and Safety Review (Greater than $1M and less than or equal to $10M)
# Code to plot histograms from data collected type3 = c(1,18,1,1,6,8,1,6,6,1,1,1,2,9,9,1,8,1,1,1,3,2,2,1,13,1,2,1,5,8) #Create a vector in which to store type3 values Value=numeric(1000) # Setup a loop to generate the 1000 values n=length(type3) Value = sapply(1:1000, function(x) { mean(sample (type3, n, replace=T)) }) hist(Value) print (hist (Value)) print (mean (Value)) print (sd (Value)) Mechanical Review (Greater than $1M and less than or equal to $10M)
# Code to plot histograms from data collected type3 = c(2,11,1,2,5,8,1,6,2,20,2,1,6,2,3,1,6,1,6,2,15,2,3,2,1,8,2,6,2,2) #Create a vector in which to store type3 values Value=numeric(1000) # Setup a loop to generate the 1000 values n=length(type3)

338
Value = sapply(1:1000, function(x) { mean(sample (type3, n, replace=T)) }) hist(Value) print (hist (Value)) print (mean (Value)) print (sd (Value)) Structural Review (Greater than $1M and less than or equal to $10M)
# Code to plot histograms from data collected type3 = c(11,15,1,3,10,8,2,2,2,16,24,20,8,19,7,16,10,5,2,3,4,8,3,12,8,6,1,9,7,8) #Create a vector in which to store type3 values Value=numeric(1000) # Setup a loop to generate the 1000 values n=length(type3) Value = sapply(1:1000, function(x) { mean(sample (type3, n, replace=T)) }) hist(Value) print (hist (Value)) print (mean (Value)) print (sd (Value))
Category IV (Greater than $10M)
Architectural Review (Greater than $10M)
# Code to plot histograms from data collected type3 = c(17,3,3,1,1,2,1,24,3,1,16,2,5,1,4,1,11,1,11,8,38,15,16,9,18,1,36,1,1,1) #Create a vector in which to store type3 values Value=numeric(1000) # Setup a loop to generate the 1000 values n=length(type3) Value = sapply(1:1000, function(x) { mean(sample (type3, n, replace=T))

339
}) hist(Value) print (hist (Value)) print (mean (Value)) print (sd (Value)) Electrical Review (Greater than $10M)
# Code to plot histograms from data collected type3 = c(7,8,4,1,4,3,24,10,1,7,7,10,4,43,1,44,9,8,1,15,2,14,9,1,1,1,1,2,1,5) #Create a vector in which to store type3 values Value=numeric(1000) # Setup a loop to generate the 1000 values n=length(type3) Value = sapply(1:1000, function(x) { mean(sample (type3, n, replace=T)) }) hist(Value) print (hist (Value)) print (mean (Value)) print (sd (Value)) Fire, Life, and Safety Review (Greater than $10M)
# Code to plot histograms from data collected type3 = c(45,8,2,51,3,16,8,25,29,15,4,20,1,54,1,42,29,2,29,67,52,1,36,1,1,1,1,2,1,1) #Create a vector in which to store type3 values Value=numeric(1000) # Setup a loop to generate the 1000 values n=length(type3) Value = sapply(1:1000, function(x) { mean(sample (type3, n, replace=T)) }) hist(Value) print (hist (Value)) print (mean (Value))

340
print (sd (Value)) Mechanical Review (Greater than $10M)
# Code to plot histograms from data collected type3 = c(16,1,1,43,2,15,9,2,15,1,5,12,7,9,16,2,3,55,2,15,1,17,22,1,42,1,6,4,1,1) #Create a vector in which to store type3 values Value=numeric(1000) # Setup a loop to generate the 1000 values n=length(type3) Value = sapply(1:1000, function(x) { mean(sample (type3, n, replace=T)) }) hist(Value) print (hist (Value)) print (mean (Value)) print (sd (Value)) Structural Review (Greater than $10M)
# Code to plot histograms from data collected type3 = c(67,166,28,8,21,6,55,5,4,63,1,15,2,4,1,1,2,59,1,6,29,9,16,28,7,15,4,11,3,4) #Create a vector in which to store type3 values Value=numeric(1000) # Setup a loop to generate the 1000 values n=length(type3) Value = sapply(1:1000, function(x) { mean(sample (type3, n, replace=T)) }) hist(Value) print (hist (Value)) print (mean (Value)) print (sd (Value))