
Innovator Case Studies: Innovator Case Studies: Physician ...

CASE STUDIES MANUAL FOR
CHALLENGE AER-200 Aerobic/Anaerobic Respirometer Systems
Patented Page • Oxygen Uptake Rate (OUR) Fingerprints 1
• OUR Set-Point Control of Activated Sludge Processes 5 • Measuring Short-Term BOD 6
• Toxicity Assessment Using a Dilution Series 7 • Assessment of Acute Toxicity to Treatment Plants 8
• Biodegradation Tests for Wastewater Samples 9 • Assessing Nutrient Deficiencies 11
• Extant Biodegradation Kinetics of mixed wastewaters 12 • Intrinsic Biodegradation Kinetics of Chemicals 13
• Biodegradation of oily soil 14 • Oxygen Uptake of Soil and Compost Samples 15
• Anaerobic Biomass Activity Tests 16 • Anaerobic BMP and ATA Tests 17
• Methane potential of sludge samples 18
Challenge Environmental Laboratories, llc. Research Center Blvd., Suite 2221
Fayetteville, Arkansas 72701 www.challenge-laboaratory.com

The Challenge AER-200 aerobic/anaerobic respirometer system The Challenge AER-200 aerobic/anaerobic respirometer system is probably the most versatile respirometer system available today. It has a number of unique features that make it ideally suited for use in wastewater treatment plants, industrial environmental laboratories, and research laboratories. Specific features include: 1. Expandable in groups of 8 reactors. The AER-200 system allows connection of up to 24 flow-
measuring cells to a common computer for efficiency of data collection and storage. The oxygen uptake modules may be arranged in groups of two, four or eight cells.
2. Aerobic/anaerobic operation. All systems are capable of operating in an anaerobic mode without the
purchase of additional components, and one or more individual cells or cell groups can be operated simultaneously in aerobic or anaerobic modes.
3. Easy cleanup. Grease is not required to seal the reaction vessels, therefore less time is required for set
up and organic solvents are not required for cleanup. 4. Variable Reactor Volume. All systems allow simultaneous use of reaction vessels ranging in volume
from 50 mL to 1,000 mL. 5. Windows Based Graphics Software. The Windows-95/98/2000/NT computer software is capable of
simultaneous display of cumulative oxygen uptake curves and oxygen uptake rates for one to 24 reactors. Data is stored in an ASCII format for ease of import to a variety of data processing programs. Data may be stored at user-set increments ranging from 1 to 720 min.
6. No-heat Stirring Base. The stirring base does not contain electrical motors or current-induced
magnet drives directly beneath the reaction vessels that can transfer heat to the reaction vessels. The stirring base can be operated at rotational speeds ranging from 20 to 1,300 rpm.
7. Modular Configuration. The mixing/reaction base can be separated from the interface module and
computer, thereby requiring less bench space and improving operator convenience. 8. Start and Stop Flexibility. The systems allow addition or removal of individual reactors from the
system without interrupting data collection from the remaining reactors. Samples can be removed from individual reaction vessels, or chemicals or nutrients can be added, without interrupting data collection from the remaining reactors.
9. Standard Glassware and Supplies. The glassware and supplies are standard and can be purchased
from a number of suppliers, thereby allowing the user to optimize costs. 10. High Sensitivity. The oxygen uptake increment, and therefore sensitivity, is less than 0.06 mg when
operating at 25oC. Flow measuring cells are factory calibrated and contain no metal, electrical, or mechanical parts.
11. Can Be Operated Without Water Bath. All systems are capable of being operated in a constant
temperature incubator without the use of a water bath or circulatory water system for temperature control.
12. No Special Computer Boards are Required. The computer does not require special data acquisition
boards, thereby reducing maintenance costs and allowing a number of types of computers to be used for data acquisition.
13. Flexible Location of Flow-Measuring Cells. The AER-200 system allows connection of extension or
satellite oxygen uptake cells within 50 ft (20 m) of the interface module by using conventional telephone cable.
14. High Oxygen Uptake Rates. Oxygen transfer rates in excess of 500 mg/L-hr can be achieved without
using special vessels or apparatus

Oxygen Uptake Rate (OUR) Fingerprints
Pharmaceutical Wastewater
OXYGEN UPTAKE RATE
0
100
200
300
400
500
600
0 5 10 15 20TIME, hours
OU
R, m
g/L-
hr
RAS+ww+0 MCB RAS+ww+10 MCB RAS+ww+15 MCB RAS+ww+20 MCB
RAS+ww+25 MCB RAS+ww+50 MCB RAS alone
A pharmaceutical company was interested in knowing whether a specific component, MCB, inhibited the biodegradation of other wastewater constituents. A series of respirometer tests was conducted using a Challenge AER-200 respirometer system. Identical mixtures of wastewater and return activated sludge (RAS) plus varying amounts of MCB were placed in each reaction vessel. The OUR fingerprint of this wastewater includes a first peak of about 500 mg/L-hr within the first hour of contact that represents the oxidation of highly-biodegradable organic constituents. A second group of readily biodegradable constituents caused a second high OUR peak between one and two hours. The relative position of OUR curves suggests that this peak represented the biodegradation of the MCB test chemical. This second OUR peak was followed by oxidation of a slowly degrading group of organic constituents that were completely oxidized between five and seven hours of contact. Oxygen uptake between seven and thirteen hours represents the biodegradation of a final group of constituents – possibly nitrification – before the OUR returns to endogenous rates. The fact that the OUR returned to endogenous rates indicates that essentially all the organic constituents of the wastewater were degraded.
1

Pulp Mill Wastewater
SOUR
0
25
50
75
100
125
150
0 2.5 5 7.5 10 12.5 15 17.5 20 22.5
Time (hr)
SOU
R (m
g O
x/hr
/g V
SS)
F/M=0.5 (1) F/M=0.5 (2) F/M=1.0 (1) F/M=1.0 (2)
F/M=1.5 (1) F/M=1.5 (2) CONTROL (1) CONTROL (2)
F/M=0.5
F/M=1.0
Seed
F/M=1.5
A pulp mill was interested in evaluating the impact of increasing organic loading rates on the performance of their activated sludge systems. In this case, the wastewater and biomass concentrations were varied to give food-to-microorganism (F/M) ratios of 0.5:1, 1:1, and 1.5:1. Test temperature was 35oC. Specific oxygen uptake rate (SOUR = OUR/M) curves – measured using a Challenge AER-200 respirometer system – show a high rate of oxidation of readily biodegradable organic constituents. One peak occurs within one hour of test initiation. A second peak occurs between one and four hours of contact for the 1:1 and 1.5:1 F/M ratios. This reaction occurs at the low F/M test conditions but is superimposed on the first high-rate peak of oxygen uptake. At the higher F/M ratios, insufficient organisms are present initially to oxidize the wastewater at maximum rates but grow rapidly to complete the OUR reactions within four hours. The oxidation of readily biodegradable organic constituents is followed by a long tail of slowly degrading constituents. In this case, the SOUR curve for the 0.5:1 F/M ratio represents the basic fingerprint for this plant. The SOUR curves for the 1:1 and 1.5:1 F/M ratio indicate that the activated sludge process would require several hours more contact time to allow complete oxidation of the organic constituents of the wastewater. The fact that the OUR does not reach endogenous rates after 20 hours of contact indicates that the oxidation of organic wastewater constituents had not been completed.
2
Chemical Production Wastewater
OXYGEN UPTAKE RATE
0
5
10
15
20
25
30
35
40
0 1 2 3 4 5 6 7
TIME, hours
OU
R, m
g/hr
WASTE 1
WASTE 2
SEED
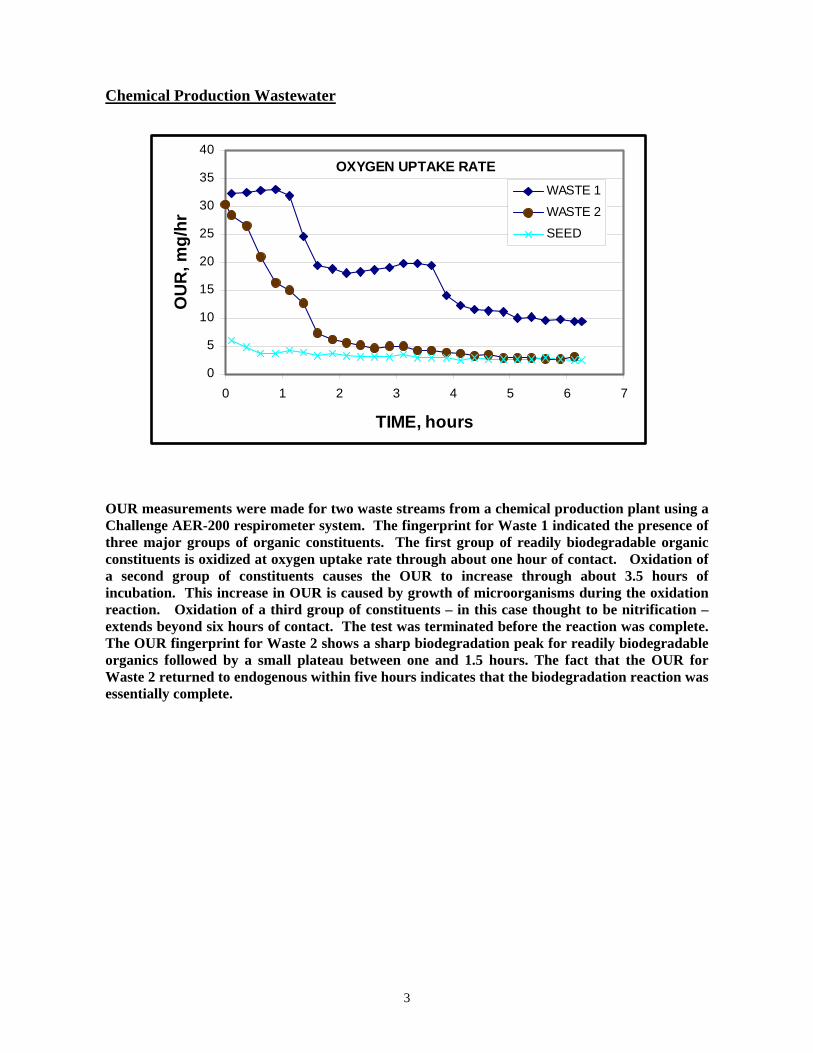
OUR measurements were made for two waste streams from a chemical production plant using a Challenge AER-200 respirometer system. The fingerprint for Waste 1 indicated the presence of three major groups of organic constituents. The first group of readily biodegradable organic constituents is oxidized at oxygen uptake rate through about one hour of contact. Oxidation of a second group of constituents causes the OUR to increase through about 3.5 hours of incubation. This increase in OUR is caused by growth of microorganisms during the oxidation reaction. Oxidation of a third group of constituents – in this case thought to be nitrification – extends beyond six hours of contact. The test was terminated before the reaction was complete. The OUR fingerprint for Waste 2 shows a sharp biodegradation peak for readily biodegradable organics followed by a small plateau between one and 1.5 hours. The fact that the OUR for Waste 2 returned to endogenous within five hours indicates that the biodegradation reaction was essentially complete.
3

With experience, plant operators can learn to “read” the changes in OUR fingerprints to identify the factors affecting plant operation and treatment performance as illustrated in the Figures below. For example, as F/M ratio increases above a normal level (0.5 in this case), the initial OUR remains relatively constant but the time required to complete the biodegradation reaction increases (Figure A). This effect was shown above with the pulp mill wastewater. When moderate levels of toxic substances enter a plant, the initial OUR decreases and longer times are required to completely degrade the waste constituents ( Figure B). In this case, toxicity was simulated by a reduction in the specific substrate uptake rate, q. On the other hand, a low influent BOD load produces a different OUR curve than does the influx of a toxic substance as shown in Figure C. Figures B and C also show how toxic substances can reduce the rate of biodegradation until un-degraded wastewater constituents reach the discharge point of the aeration basin. In effect, toxic substances “push” wastewater constituents through the plant until effluent quality suffers.
120
0
20
40
60
80
100
OU
R, m
g/L-
hr
0 1 2 3 4 5 6 7 TIME, hours
F/M = 0.5:1 F/M = 1:1 F/M = 2:1
EFFECT OF F/M RATIOA
60
0
10
20
30
40
50
60
OU
R, m
g/L-
hr
0 1 2 3 4 5 6 7 TIME, hours
qm = 8/day qm = 6/day qm = 4/day
EFFECT OF TOXINSB
4
0
10
20
30
40
50
OU
R, m
g/L-
hr
0 1 2 3 4 5 6 7 TIME, hours
Normal Low BOD Toxin
LOW BOD vs TOXINC

OUR Set-Point Control of Activated Sludge Processes
The OUR Set-Point method is useful for controlling the activity and loading-rate capacity of an activated sludge mixed liquor. In this case, sufficient amounts of a stock substrate are added to a mixed liquor suspension to provide kinetic saturation with subsequent measure of OUR. Once an acceptable substrate is found for a specific wastewater treatment plant, an OUR can be identified that provides acceptable performance. This OUR is identified as the “Set-Point OUR. The operator then maintains a constant OUR by adjusting mixed liquor volatile suspended solids concentrations to maintain the desired OURmax.
MLVSSoperation = MLVSSmeasured * (OURset-point/OURmeasured)
Figure A below shows oxygen uptake rates for three mixed liquor concentrations in which acetate was used as a standard substrate – as measured using a Challenge AER-200 respirometer system. The three tests show a consistent OUR fingerprint but with changes in OURmax that reflect changes in active biomass. Figure B shows a repeat test after adjusting the biomass concentration to give the desired Set-Point OUR. The relationship allows plant operators to maintain a constant loading rate capacity under all operating conditions. In this case, adjustment of the OUR for the 830 mg/L MLVSS sample and the 2,290 mg/L MLVSS sample to 1,685 mg/L brought all mixed liquors to the same OUR. Once a Set-Point OUR has been identified, the changes in MLVSS concentrations are relative so that the substrate type should not be a major concern as long as it is constant.
VARIABLE MLVSS - BEFORE ADJUSTMENT
CONSTANT MLVSS - AFTER ADJUSTMENT
020406080
100120140160180200220
0.0 0.5 1.0 1.5 2.0 2.5 3.0TIME, hours
OU
R, m
g/L-
hr
MLVSS = 830 mg/LMLVSS = 1685 mg/LMLVSS = 2290 mg/L
A
020406080
100120140160180200220
0.0 0.5 1.0 1.5 2.0 2.5 3.0TIME, hours
OU
R, m
g/L-
hr
MLVSS = 1685 mg/LMLVSS = 1685 mg/L
MLVSS = 1685 mg/L
B
5

Measuring Short-Term BOD Using the challenge OUR-BODst respirometer
Measurement of oxygen uptake rates in activated sludge processes is essential to their satisfactory operation. Traditionally, oxygen uptake rates (OUR) have been determined by using a dissolved oxygen probe to measure the change in dissolved oxygen in a BOD bottle. While this method is rapid, it provides only a snapshot, at a single point in time, of the oxygen uptake rate reaction in a treatment plant. Much more can be learned about the operation of a treatment plant by measuring the oxygen uptake rate over a period ranging from one to four hours after adding wastewater to the mixed liquor. The resulting pattern of oxygen uptake rate can be used to assess biodegradation patterns, to determine the impact of various wastes on treatment plant performance, and to provide a short-term measure of BOD. An example of a typical OUR test is shown below using data collected with a Challenge AER-200 respirometer system. The data show the background OUR for the MLSS and a 60/40 mixture of wastewater and mixed liquor(A). As indicated, the maximum OUR was around 30 mg/L-hr. This value corresponds to the value that would be obtained by a single measure using a DO probe. The difference between the oxygen uptake of sample plus seed and seed alone produces a short-term BOD curve (B) or the data can be used to produce an estimate of the standard 5-
day dilution BOD.
OXYGEN UPTAKE RATE
0
5
10
15
20
25
30
35
40
0 1 2 3 4 5 6 7TIME, hours
OU
R, m
g/hr
WASTE 1WASTE 2SEED
A
SHORT-TERM BOD
050
100
150200250300
350400
450
0 1 2 3 4 5 6 7TIME, hours
BO
Dst
, mg/
L
WASTE 1WASTE 2
B
6

Toxicity Assessment Using a Dilution Series
Toxicity, or more appropriately, inhibition, is a measure of the interference of a compound
or compounds with biodegradation. Since inhibition usually is expressed as the interference with bioconversion of an oxygen-consuming reaction – or gas producing reaction in the case of anoxic or anaerobic reactions – it is essential that a biodegradable substrate be present when assessing toxicity of specific compounds. A dilution series is one of the most common respirometric approaches used to assess toxicity. The test procedure usually consists of 1) adding a seed culture to a number of respirometer vessels, 2) adding biodegradable substrate, 3) adding adequate amounts of nutrients and minerals to support biological growth and a buffer to maintain pH within a suitable range, and 4) adding the suspected inhibitory chemical or wastewater to produce a range of test concentrations. The number of dilutions should be based on the anticipated range of exposure of the subject chemical or wastewater to a receiving treatment process. A dilution series also requires use of a respirometer that can be operated over the range of substrate concentrations and test conditions needed to assess inhibition effects. An example of a dilution series using four concentrations of phenol – and a measured using a Challenge AER-200 respirometer system – is shown in Figure A. The increasing lag time with oxygen uptake rates increasing to a maximum is a fingerprint for substrate inhibition reactions. An example using wastewater from a petrochemical industry is shown in Figure B. The test program involved analysis of four dilutions of wastewater plus a control. The control in this case was wastewater from the process that would receive the test industrial wastewater. The relative relationship between dilutions showed increased lag and declining oxygen uptake rates as wastewater concentration increased toward full-strength. The first plateau around 20% of COD represents the completion of the biodegradation reaction for the first of at least three groups of organic constituents. The fact that the oxygen uptake rate increased gradually to essentially the same maximum for each dilution is characteristic of substrate inhibition. The oxidation of the second group of organic constituents was complete at around 60% of the COD. Subsequent tests indicated that this wastewater could be added to a regional wastewater treatment process at volume ratios up to 25% of the total flow without contributing significantly to risk of failure.
PHENOL BIODEGRADATION
0
200
400
600
800
1000
1200
0 24 48 72 9TIME, hours
OXY
GEN
UP
TAK
E, m
g/L
60
10 20 30 40 50 60 70 80 90
100 110 120
OXYG
EN UP
TAKE
, % of
COD
0 50 100 150 200 250 300 TIME, hours
CONTROL 33% IND. WW 50% IND WW67 % IND WW 100% IND WW SEED
MIXED INDUSTRIAL WASTEWATER
B
300 mg/L600 mg/L900 mg/L1200 mg/L
A
7
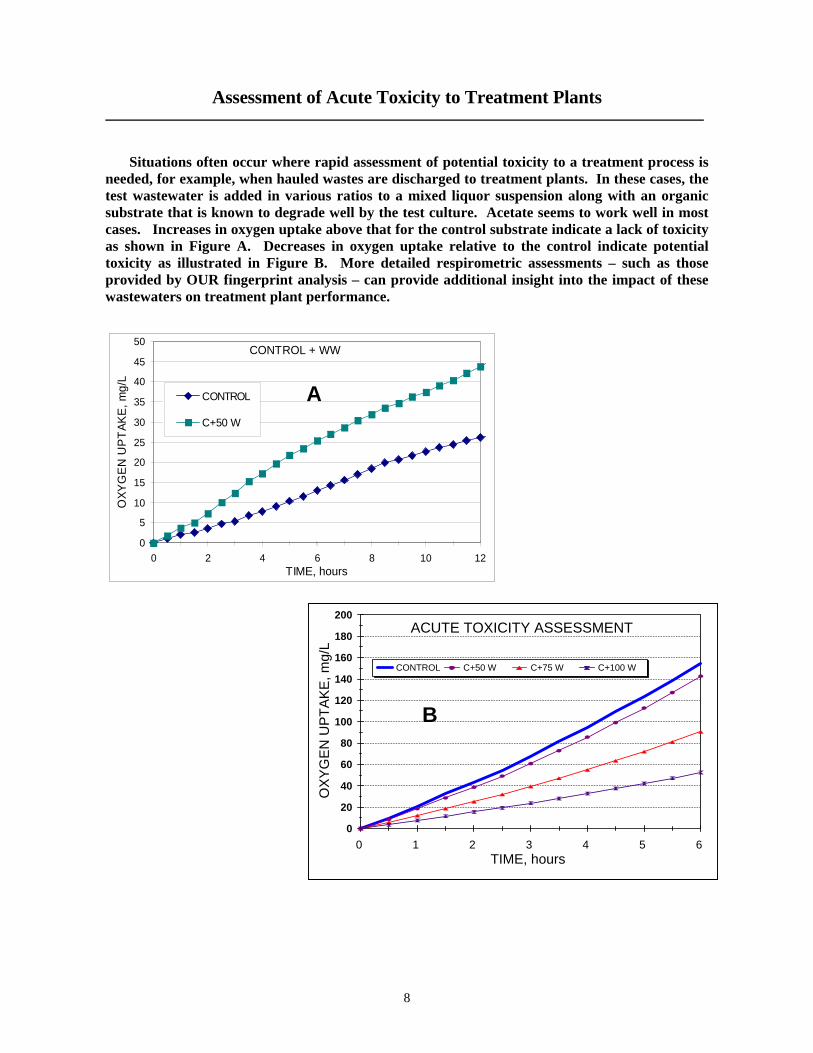
Assessment of Acute Toxicity to Treatment Plants
Situations often occur where rapid assessment of potential toxicity to a treatment process is
needed, for example, when hauled wastes are discharged to treatment plants. In these cases, the test wastewater is added in various ratios to a mixed liquor suspension along with an organic substrate that is known to degrade well by the test culture. Acetate seems to work well in most cases. Increases in oxygen uptake above that for the control substrate indicate a lack of toxicity as shown in Figure A. Decreases in oxygen uptake relative to the control indicate potential toxicity as illustrated in Figure B. More detailed respirometric assessments – such as those provided by OUR fingerprint analysis – can provide additional insight into the impact of these wastewaters on treatment plant performance.
8
CONTROL + WW
0
5
10
50
45
40
35
30
25
20
15
0 2 4 6 8 10 12TIME, hours
OXY
GEN
UP
TAK
E, m
g/L
CONTROL
C+50 W
A
0
20
40
60
80
100
120
140
160
180
200
OX
YG
EN
UP
TAK
E, m
g/L
0 1 2 3 4 5 6 TIME, hours
CONTROL C+50 W C+75 W C+100 W
ACUTE TOXICITY ASSESSMENT
B
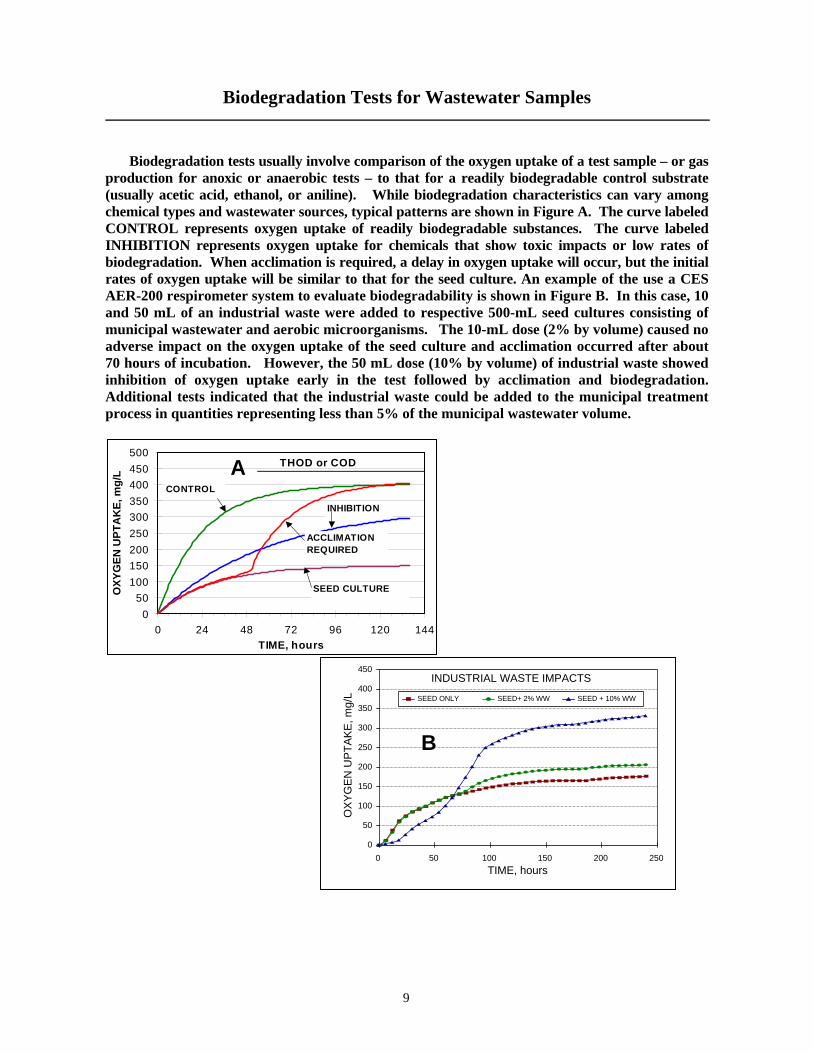
Biodegradation Tests for Wastewater Samples
Biodegradation tests usually involve comparison of the oxygen uptake of a test sample – or gas production for anoxic or anaerobic tests – to that for a readily biodegradable control substrate (usually acetic acid, ethanol, or aniline). While biodegradation characteristics can vary among chemical types and wastewater sources, typical patterns are shown in Figure A. The curve labeled CONTROL represents oxygen uptake of readily biodegradable substances. The curve labeled INHIBITION represents oxygen uptake for chemicals that show toxic impacts or low rates of biodegradation. When acclimation is required, a delay in oxygen uptake will occur, but the initial rates of oxygen uptake will be similar to that for the seed culture. An example of the use a CES AER-200 respirometer system to evaluate biodegradability is shown in Figure B. In this case, 10 and 50 mL of an industrial waste were added to respective 500-mL seed cultures consisting of municipal wastewater and aerobic microorganisms. The 10-mL dose (2% by volume) caused no adverse impact on the oxygen uptake of the seed culture and acclimation occurred after about 70 hours of incubation. However, the 50 mL dose (10% by volume) of industrial waste showed inhibition of oxygen uptake early in the test followed by acclimation and biodegradation. Additional tests indicated that the industrial waste could be added to the municipal treatment process in quantities representing less than 5% of the municipal wastewater volume.
050
100150200250300350400450500
0 24 48 72 96 120 144TIME, hours
OXY
GEN
UPT
AK
E, m
g/L
CONTROL
ACCLIMATION REQUIRED
INHIBITION
SEED CULTURE
THOD or CODA
0
50
100
150
200
250
300
350
400
450
OXY
GEN
UPT
AKE,
mg/
L
0 50 100 150 200 250 TIME, hours
SEED ONLY SEED+ 2% WW SEED + 10% WW
INDUSTRIAL WASTE IMPACTS
B
9

Standardized Biodegradation Protocols
A number of protocols have been developed to standardize evaluations of the biodegradability of specific compounds or formulations (ISO 9408, 1999; OECD 301, 1992; USEPA 835, 1998). These protocols usually involve long-term (14 to 28+ day) respirometer testing to evaluate the extent to which a compound is oxidized relative to its theoretical oxygen demand (THOD) or measured COD. These test protocols usually involve the following steps: 1. Add 100 mg/L of test organic, or no less than 100 mg/L THOD (or COD), to a test
respirometer vessel. 2. Add no more than 30 mg VSS/L as a seed culture. 3. Run simultaneous tests with a reference compound (usually aniline, benzoate or acetate). 4. Measure oxygen uptake for 28 or more days and compare to THOD or TCOD. 5. Oxygen uptake of 60% or more of THOD or COD in 28 days shows acceptable
biodegradability.
An example of tests for an organic-based cleaning agent using aniline as a reference compound is shown in the Figure below. The test revealed the following: 1. Biodegradation of the test product began earlier than the control (aniline), thereby
indicating that no acclimation was required. 2. The fact that the oxygen uptake curves for the two test doses were the same indicated that
the test compound was not toxic. 3. The fact that the oxygen uptake for the test compound exceeded 60% of the THOD in 28
days indicates that the formulation was readily biodegradable. 4. The fact that the oxygen uptake for the test compound was only 65% of theoretical after 28
days of incubation implies that one or more constituents were not biodegradable.
ISO 9408 TEST RESULTS
0
20
40
60
80
100
120
0 2 4 6 8 10 12 14 16 18 20 22 24 26 28TIME, days
OXY
GEN
UPT
AK
E,pe
rcen
t of T
HO
D
50 mg/L product150 mg/L product100 mg/L Aniline
Results of ultimate biodegradability test for an organic cleaning agent.
10
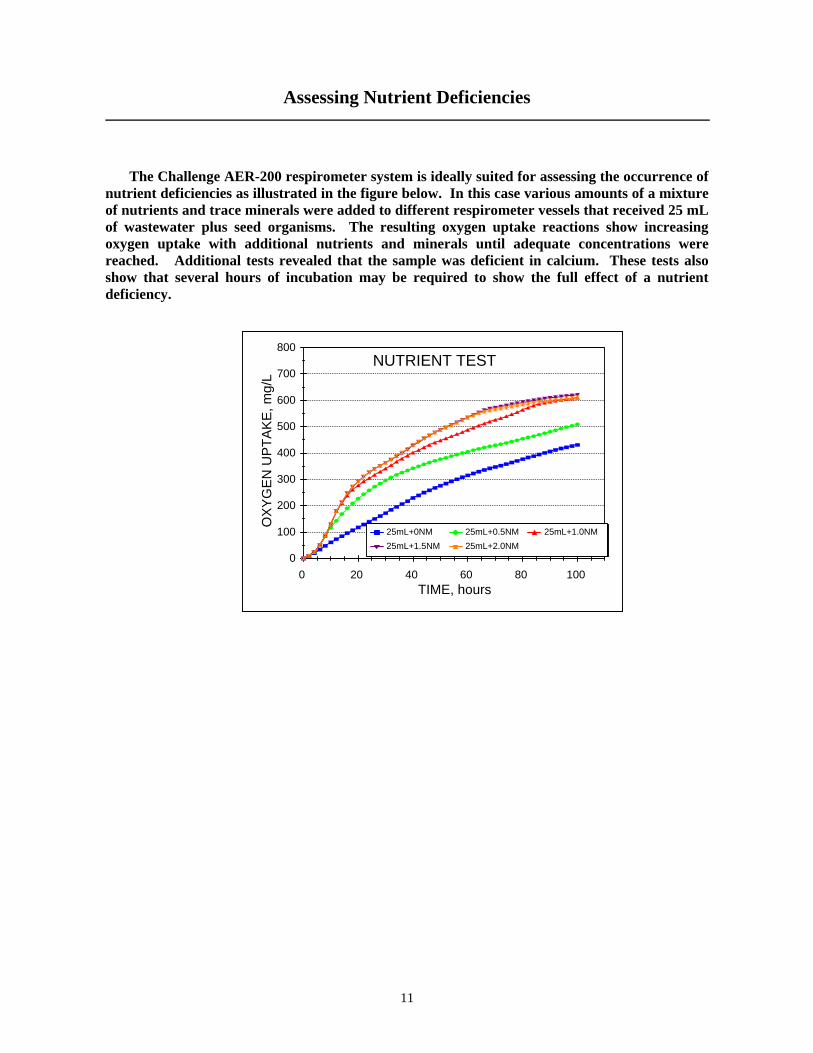
Assessing Nutrient Deficiencies
The Challenge AER-200 respirometer system is ideally suited for assessing the occurrence of nutrient deficiencies as illustrated in the figure below. In this case various amounts of a mixture of nutrients and trace minerals were added to different respirometer vessels that received 25 mL of wastewater plus seed organisms. The resulting oxygen uptake reactions show increasing oxygen uptake with additional nutrients and minerals until adequate concentrations were reached. Additional tests revealed that the sample was deficient in calcium. These tests also show that several hours of incubation may be required to show the full effect of a nutrient deficiency.
800
0
100
200
300
400
500
600
700
OX
YG
EN
UP
TAK
E, m
g/L
0 20 40 60 80 100 TIME, hours
25mL+0NM 25mL+0.5NM 25mL+1.0NM25mL+1.5NM 25mL+2.0NM
NUTRIENT TEST
11

Extant Kinetics Of Mixed Wastewaters
OUR fingerprints can be used to estimate kinetic parameters for the wastewater constituents
as shown in Figurea A and B below. Wastewater A contained one group of readily degraded compounds and one group that was degraded at lower rates. A third region of oxygen uptake was caused by nitrification. Kinetic modeling suggested that biodegradation of each constituent followed classical Monod kinetics. Wastewater B contained a group of readily biodegradable constituents and two more-slowly degrading constituents. The primary constituent followed classical Monod kinetics, but second group of compounds was controlled by hydrolysis as indicated by the first-order decrease in OUR. Nitrification was a small part of the remaining OUR. Biomass growth and biodegradation coefficients for these two wastewaters are listed in Table 1. As indicated, the active biomass concentration involved in specific reactions was quite low.
40 40
0
5
10
15
20
25
30
35
OU
R, m
g/L-
hr
0 1 2 3 4 5 6 7 TIME, hours
MIXED INDUSTRIAL WASTE KINETICS
Primary Substrate
OUR Total
Nitrification
A
Table 1. Biomass growth and kinetic coefficients asonstituents of the industrial wastes described in Fic
Parameter Wastewater # 1 S1 S2 NCOD, mg/L 55 85Xa, mg/L 235 110Xa, % MLVSS 9.04 4.23Yg, mg/mg 0.50 0.50qm, /day 6 6Ks, mg/L 4 1b, /day 0.30 0.30
12
0
5
10
15
20
25
30
35
OU
R, m
g/L-
hr
0 1 2 3 4 5 6 7 TIME, hours
MIXED INDUSTRIAL WASTE KINETICS
Primary
Hydrolysis
Nitrification
OUR Total
B
sociated with biodegradation of the gures A and B.
Wastewater # 2 H3-N S1 Hydr. NH3-N
8 20 30 3.57 150 40 40
0.27 5.77 1.54 1.540.50 0.50 0.50 0.50
5 9 0.015 3.70.3 5 -- 0.3
0.20 0.30 0.30 0.08
Intrinsic Biodegradation Kinetics Of Chemicals
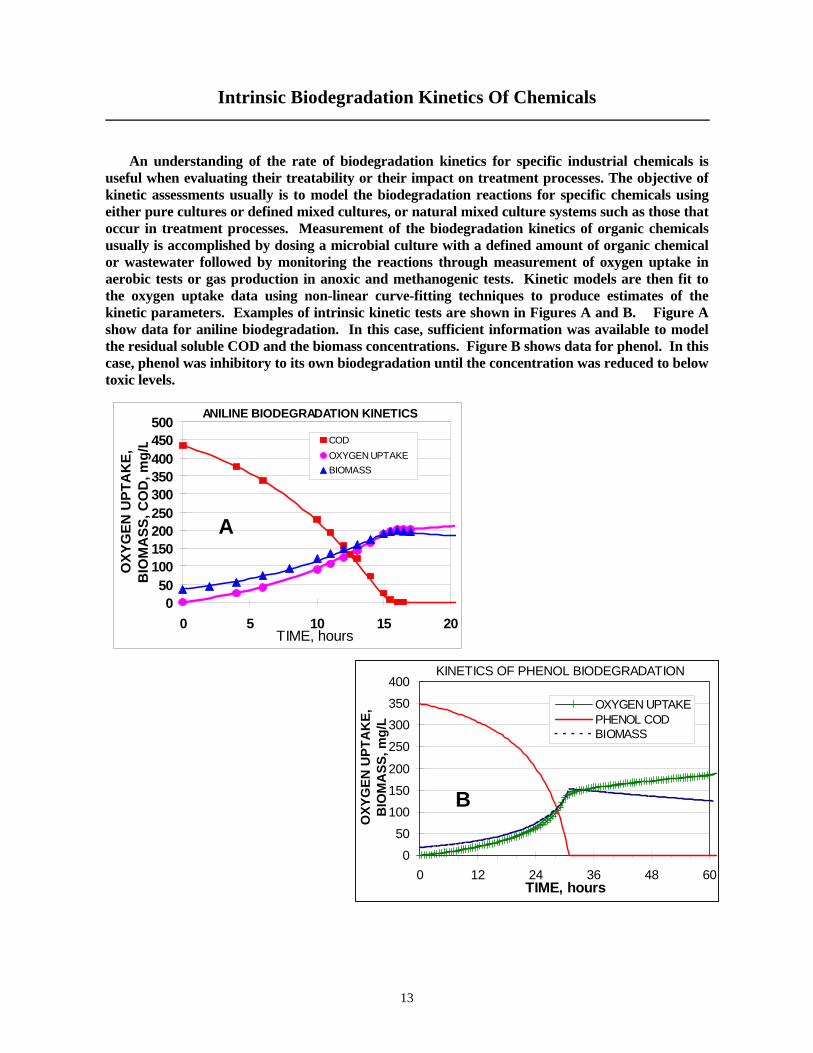
An understanding of the rate of biodegradation kinetics for specific industrial chemicals is useful when evaluating their treatability or their impact on treatment processes. The objective of kinetic assessments usually is to model the biodegradation reactions for specific chemicals using either pure cultures or defined mixed cultures, or natural mixed culture systems such as those that occur in treatment processes. Measurement of the biodegradation kinetics of organic chemicals usually is accomplished by dosing a microbial culture with a defined amount of organic chemical or wastewater followed by monitoring the reactions through measurement of oxygen uptake in aerobic tests or gas production in anoxic and methanogenic tests. Kinetic models are then fit to the oxygen uptake data using non-linear curve-fitting techniques to produce estimates of the kinetic parameters. Examples of intrinsic kinetic tests are shown in Figures A and B. Figure A show data for aniline biodegradation. In this case, sufficient information was available to model the residual soluble COD and the biomass concentrations. Figure B shows data for phenol. In this case, phenol was inhibitory to its own biodegradation until the concentration was reduced to below toxic levels.
13
ANILINE BIODEGRADATION KINETICS
050
100150200250300350400450500
0 5 10 15 20TIME, hours
OXY
GEN
UPT
AK
E,
BIO
MA
SS, C
OD
, mg/
L CODOXYGEN UPTAKEBIOMASS
A
KINETICS OF PHENOL BIODEGRADATION
0
50
100150
200
250
300350
400
0 12 24 36 48 60TIME, hours
OXY
GEN
UPT
AK
E,
BIO
MA
SS, m
g/L
OXYGEN UPTAKEPHENOL CODBIOMASS
B

Aerobic Treatment of Oily Soil
An oily soil from a refinery site contained 4.7% hydrocarbons by weight. The total COD of the soil was 55,000 mg/L. Tests were conducted to determine if Tween-80, a surfactant, enhanced the biodegradation of the oily contaminants in the soil. Samples of the oily soil were added to individual reactors of a Challenge AER-200 respirometer system. Tween-80 was added on one set of samples at a T-80:soil ratio (w/w) of 1:10. The tests were conducted for 52 days without interruption.
The respirometer tests showed that Tween-80 enhanced the biodegradation of the organic
materials in the soil sample. Without T-80, the 52-day oxygen uptake represented 30% of the COD while with T-80, the 52-day oxygen uptake represented 67% of the COD as shown in the accompanying figure. (All data have been corrected for dilution and for the contribution of seed organisms to the oxygen uptake).
-5000
5000
15000
25000
35000
45000
OX
YG
EN
UP
TAK
E, m
g/L
0 10 20 30 40 50 60 TIME, days
Soil Alone (Soil+T80)-T80
OILY SOIL: SOIL vs SOIL+T80
14
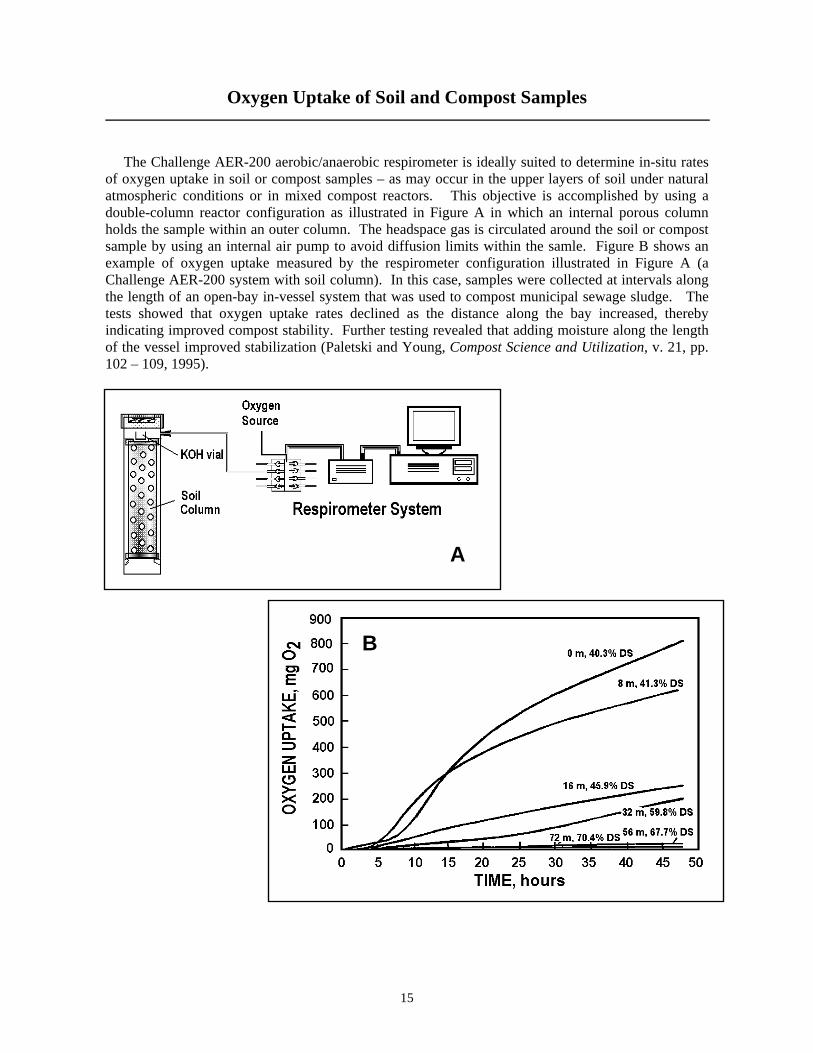
Oxygen Uptake of Soil and Compost Samples The Challenge AER-200 aerobic/anaerobic respirometer is ideally suited to determine in-situ rates of oxygen uptake in soil or compost samples – as may occur in the upper layers of soil under natural atmospheric conditions or in mixed compost reactors. This objective is accomplished by using a double-column reactor configuration as illustrated in Figure A in which an internal porous column holds the sample within an outer column. The headspace gas is circulated around the soil or compost sample by using an internal air pump to avoid diffusion limits within the samle. Figure B shows an example of oxygen uptake measured by the respirometer configuration illustrated in Figure A (a Challenge AER-200 system with soil column). In this case, samples were collected at intervals along the length of an open-bay in-vessel system that was used to compost municipal sewage sludge. The tests showed that oxygen uptake rates declined as the distance along the bay increased, thereby indicating improved compost stability. Further testing revealed that adding moisture along the length of the vessel improved stabilization (Paletski and Young, Compost Science and Utilization, v. 21, pp. 102 – 109, 1995).
A
B
15

Anaerobic Biomass Activity Tests The methane production activity of anaerobic sludges is related to the history of the sludge, the biomass yield from the wastewater the sludge has been treating, the fraction of methanogens, and the presence of toxic substances. Best performance can be achieved from an anaerobic treatment plant if the operator measures the Specific Methanogenic Production (SMP) of the biomass contained within the sludge. The SMP is measured by placing a known amount of biomass in a respirometer vessel, adding a known amount of substrate – usually acetic acid – to the bottle at concentrations sufficient to cause maximum biomass activity, and measuring the resulting methane. The SMP is expressed as the COD equivalent of the methane production rate per gram of volatile solids, or gm COD/gm VSS/d. An example of an SMP measurement is shown in the figure below. Figure A shows methane production measured over a three-day period using a Challenge AER-200 aerobic/anaerobic respirometer. Figure B shows the calculated specific methane production rate. The maximum specific methane production rate represents the SMA – or the activity – of this sludge sample. SMAs between 1.0 and 2.0 indicate a highly active biomass. An SMA of 1.5 g COD/g VSS-d indicates that the biomass is 25% methanogens by weight.
April 6, 2000 BIOMASS
0
100
200
300
400
500
600
700
800
0 10 20 30 40 50 60 70 80
TIME, hours
MET
HA
NE
PRO
D.,
ml/g
CO
D a
dded
/da y
12.5 % 25 % 50 % 75 %
A April 6, 2000 BIOMASS
0
0.2
0.4
0.6
0.8
1
1.2
1.4
1.6
1.8
0 10 20 30 40 50 60 70 80
TIME, hours
SMP,
g C
OD
/g V
SS/d
12.5 % 25 %
SMA = 1.5 g COD/g VSS-d
B
16

Anaerobic BMP and ATA Tests
Biochemical Methane Potential (BMP) tests involve addition of test chemicals or wastewater samples of concern to an anaerobic culture that is contained within a sealed vessel. Methane or total gas production are measured over periods ranging from 1 to 60 days without addition of new chemical or wastewater sample. Modern BMP tests usually involve multiple additions of substrate or wastewater to anaerobic reactors over 3 to 60 days to assess the ability for sustained biodegradation. Example BMP test data are shown in Figure A for three wastewater streams as compared to an ethanol control when using a Challenge AER-200 aerobic/anaerobic respirometer system. In this case, substrate injections were made on three consecutive days and the methane production was expressed as mL/g COD added. These data show that only about 75% of the COD in Stream 1 and 50% of the COD in Stream 2 was converted to methane. The mixture showed COD conversion between 50 and 75%. The fact that the initial rate of methane production was the same as that for the control indicates that the wastewater streams contained no toxic substances. ATA tests involve addition of test chemical or wastewater plus a biodegradable organic substrate – ethanol, acetate, benzoate, etc. – to anaerobic cultures contained within sealed vessels. Concentrations of test materials range from 0 (Control) to 2 to 4 times anticipated field concentrations, in effect, a dilution series. Example ATA test results are shown in Figure B when testing the effect of a sanitizing agent on anaerobic the activity of an anaerobic culture. These tests indicated that mild inhibition occurred at a chemical dose as low as 12 mg/L. Inhibition increased with increasing dose of test chemical. A concentration of 120 mg/L produced a 50% decrease in methane production rate. The benefit of using respirometers to measure methane production at short time intervals is illustrated well in this case. Measuring cumulative methane production after 24 hours would have shown no toxic impacts.
0
100
200
300
400
500
600
ME
THA
NE
PR
OD
., m
L/g
CO
D
0 24 48 72TIME, hrs
CONTROL STREAMS 1+2 STREAM 1 STREAM 2
BIOCHEMICAL METHANE POTENTIALBATCH ANAEROBIC TESTS
A
SANITIZING AGENT TOXICITY
0
100
200
300
400
500
0 4 8 12 16 20 2TIME, hours
MET
HA
NE
PR
OD
UC
TIO
N,
ml/g
CO
D
4
CONTROL12 mg/L48 mg/L84 mg/L120 mg/L192mg/L264mg/L
B
17

Anaerobic Methane Potential from Sludges
Questions often arise as to how much residual biodegradable matter remains in sludges from biological processes after previous treatment has been completed. In one case, sludge samples were removed from two facultative lagoons. Tests were conducted to determine the methane potential remaining in the sludges and to determine if the sludges were suitable for land spreading. Samples of the sludge were transferred to respective reactions vessels of a Challenge AER-200 aerobic/anaerobic respirometer system. The respective reactors contained 20.5 and 22.7 g VSS. Gas production was measured over a period of 18 days. Methane production ranged from 120 mL in one sample to 160 in the second sample as shown in the Figure below. The gas production rate was high for only about 2 days and then leveled off to a rate of about 4 mL/day. The COD conversion equivalent of the produced gas was only about 0.3 to 0.4 g per sample, thereby representing VSS conversions of 1.47 and 1.76 %. The sludge was then deemed to be suitable for land application without further treatment. The benefit of using respirometers to measure methane production over long periods of time is illustrated well in this case.
LAGOON SLUDGE SAMPLES
0
20
40
60
80
100
120
140
160
180
0 5 10 15 20 25TIME, days
MET
HAN
E P
ROD
UCTI
ON,
mL
SLUDGE 1 SLUDGE 2
18

Monitoring Denitrification Reactions
Nitrogen gas produced during denitrification reactions can be measured using the Challenge AER-200 respirometer system. In this case, the test culture is placed in a respirometer vessel with nitrate and organic electron donor. Carbon dioxide is scrubbed from the headspace using a caustic scrubber in the same manner used with aerobic oxygen uptake tests. Example test data are shown in the figure below when using COD/N ratio as a test variable (Cheng, 2000). The total nitrogen production increased with COD/N ratio up to around 4:1, which is approximately the theoretically required ratio. However, the reaction was completed sooner at higher COD/N ratios. The rate of nitrogen production an be determined as follows: c
RN2 = 0.86 (1 - YN ) RN , L N2 /L-hr (1) where 0.86 = liters of nitrogen gas per gram of nitrate nitrogen reduced at 20oC, YN = fraction of the nitrate nitrogen used for synthesis (YN ≈ 0.05 g N synthesized/g N oxidized), and RN = nitrate loading rate, g NO3-N/L-hr. When the system is operated under kinetically saturated nitrate conditions, RN2 is
aximum and the active denitrifying biomass concentration, XaDn, can be estimated as follows: m RN2max XaDn = –––––––––––––––– , g/L (2)
0.86 (1-Yn) qmax-Dn where qmax-Dn is the maximum specific substrate conversion rate for denitrification reactions and averages 0.153 L N2/g XaDn/hr (0.5 g COD/g XaDn/hr) when using readily biodegradable substrates such as methanol, acetate, or glucose. The active denitrifying biomass for the example case was then 28 mg/L.
19