Canaccord Technical Session
95
TSX–NYSE MKT: RIC POSITIONING FOR SUSTAINABLE GROWTH Canaccord – Technical Session April 25, 2016
-
Upload
adnet-communications -
Category
Business
-
view
3.828 -
download
0
Transcript of Canaccord Technical Session

TSX–NYSE MKT: RIC
POSITIONING FOR SUSTAINABLE GROWTH
Canaccord – Technical SessionApril 25, 2016

www.richmont-mines.com 2RIC: TSX NYSE-MKT
• Richmont Overview Renaud Adams• Vision & Strategy
• Corporate Overview
• Assets, Reserves & Resources Overview
AGENDA
• Island Gold Geology Doug MacMillan• Regional & Local Geology
• Resource Model
• QAQC & Reconciliation
• Island Gold Operations Renaud Adams• Operating Strategy
• Progress to Date
• 2016 Plans
• Growth
Island Gold – Exploration Upside Daniel Adam

www.richmont-mines.com 3RIC: TSX NYSE-MKT
FORWARD LOOKING STATEMENTS
Safe Harbor Statement & Cautionary Note to U.S. Investors Concerning Resource Estimates
This presentation contains forward-looking statements that include risks and uncertainties. The factors that couldcause actual results to differ materially from those indicated in such forward-looking statements include changes in theprevailing price of gold, the Canadian-U.S. exchange rate, grade of ore mined and unforeseen difficulties in miningoperations that could affect revenue and production costs. Other factors such as uncertainties regarding governmentregulations could also affect the results. Other risks may be detailed from time to time in Richmont Mines Inc.’speriodic reports and annual notice.
The resource estimates in this presentation were prepared in accordance with NI 43-101 adopted by the CanadianSecurities Administrators. The requirements of NI 43-101 differ significantly from the requirements of the United StatesSecurities and Exchange Commission (the “SEC”). In this presentation, we use the terms “Measured”, “Indicated” and“Inferred” Resources. Although these terms are recognized and required to be used in Canada, the SEC does notrecognize them. The SEC permits U.S. mining corporations, in their filings with the SEC, to disclose only those mineraldeposits that constitute “Reserves”. Under United States standards, mineralization may not be classified as a Reserveunless the determination has been made that the mineralization could be economically and legally extracted at the timethe determination is made. United States investors should not assume that all or any portion of a Measured orIndicated Resource will ever be converted into “Reserves”. Furthermore, “Inferred Resources” have a great amount ofuncertainty as to their existence and whether they can be mined economically or legally, and United States investorsshould not assume that “Inferred Resources” exist or can be legally or economically mined, or that they will ever beupgraded to a more certain category.
U.S. Investors are urged to consider the disclosure in our annual report on Form 20-F, File No. 001-14598, which maybe obtained from us or from the SEC’s web site: http://sec.gov/edgar.shtml.
(All amounts are in Canadian dollars, unless otherwise indicated.)

www.richmont-mines.com 4RIC: TSX NYSE-MKT
OUR VISION and STRATEGY
Our vision is to become a leading intermediate gold producer focused on the Americas generating superior per share valuation. We are committed to a “Sustainable Business Model” and a strategy of long-term growth, and will fully utilize the Corporation’s strong balance sheet, assets, cash flow, capital structure and the extensive experience of the Corporations’ Board of Directors and Management Team to build the next leading Canadian based intermediate gold company.
Our strategy, in the short term, will focus on becoming a leading junior gold producer by maintaining at all times a superior per share position on operational & financial metrics while maintaining a sustainable and risk adverse approach under a “Sustainable Business Model”.
We are guided by our core corporate values to achieve long term value for all of our stakeholders. By cultivating a culture of responsible performance, we are focused on operating in a sustainable manner while holding ourselves accountable to all of our stakeholders.
www.richmont-mines.com 5RIC: TSX NYSE-MKT
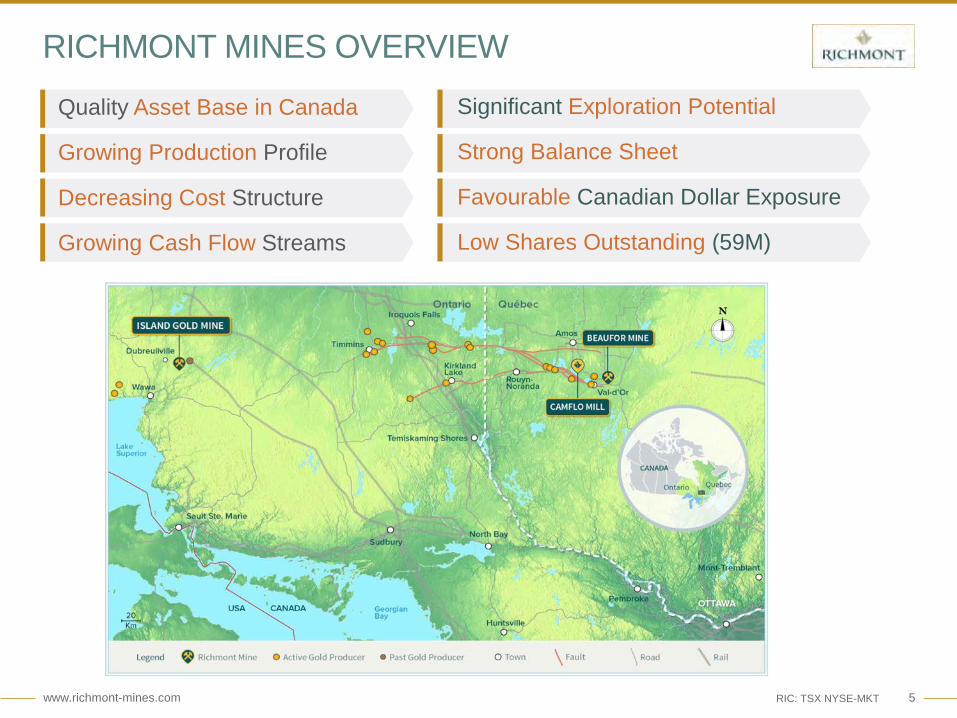
RICHMONT MINES OVERVIEW
Quality Asset Base in Canada
Growing Production Profile
Decreasing Cost Structure
Growing Cash Flow Streams
Significant Exploration Potential
Strong Balance Sheet
Favourable Canadian Dollar Exposure
Low Shares Outstanding (59M)
www.richmont-mines.com 6RIC: TSX NYSE-MKT
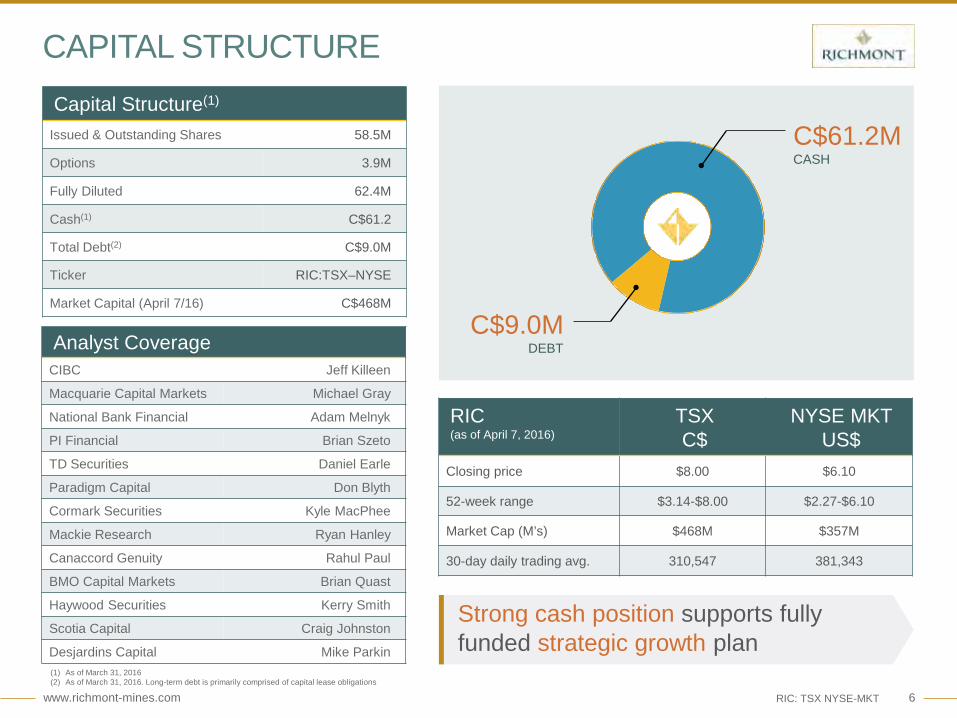
CAPITAL STRUCTURECapital Structure(1)
Issued & Outstanding Shares 58.5M
Options 3.9M
Fully Diluted 62.4M
Cash(1) C$61.2
Total Debt(2) C$9.0M
Ticker RIC:TSX–NYSE
Market Capital (April 7/16) C$468M
(1) As of March 31, 2016 (2) As of March 31, 2016. Long-term debt is primarily comprised of capital lease obligations
C$61.2MCASH
C$9.0MDEBTAnalyst Coverage
CIBC Jeff Killeen
Macquarie Capital Markets Michael Gray
National Bank Financial Adam Melnyk
PI Financial Brian Szeto
TD Securities Daniel Earle
Paradigm Capital Don Blyth
Cormark Securities Kyle MacPhee
Mackie Research Ryan Hanley
Canaccord Genuity Rahul Paul
BMO Capital Markets Brian Quast
Haywood Securities Kerry Smith
Scotia Capital Craig Johnston
Desjardins Capital Mike Parkin
RIC (as of April 7, 2016)
TSX C$
NYSE MKT US$
Closing price $8.00 $6.10
52-week range $3.14-$8.00 $2.27-$6.10
Market Cap (M’s) $468M $357M
30-day daily trading avg. 310,547 381,343
Strong cash position supports fully funded strategic growth plan

www.richmont-mines.com 7RIC: TSX NYSE-MKT
Q1 production: 32,369 oz.; Cash costs of $806 per oz (US$587)
Reserves increased by 187%; 206% at Island Gold; 95% at Beaufor
Island Gold mine life increased to 7 years(1) with 3 years mine life pre-developed
Beaufor mine life increased to more than 2 years(1)
Released Preliminary Economic Assessment for Island Gold (Oct 28/15)
OPERATIONAL HIGHLIGHTS
2015 Q1 2016 2016 Guidance
Gold produced (oz) 98,031 32,369 87,000-97000
Cash cost per oz. (CAN$)(1) $977 $806 $930-$1,000
AISC (CAN$)(1) $1,373 - $1,275-$1,390
Cash cost per oz. (US$)(1) $764 $587 $680-$730(2)
AISC (US$)(1) $1,074 - $935-$1,015(2)
(1) Refer to the Non-GAAP performance measures contained in the Annual MD&A.
(2) 2016 Guidance assumes a foreign exchange rate of 1.364 Canadian dollars to the US dollar.
Proven and Probable Mineral Reserves(1)(2)
Island Gold Mine and Beaufor Mine
December 31, 2015 Gold ounces Gold g/t
Island Gold Proven & Probable
above ~400m 76,700 6.91
below ~400m 485,000 8.52
Island Gold Proven & Probable 561,700 8.26
Beaufor Proven & Probable 63,850 6.57
Total Proven & Probable 625,550 8.05
(1) Refer to the detailed mineral reserve and mineral resource tables that follow at the end of this presentation
(2) No changes to Mineral Reserves were made at the Corporation’s other properties.
(1) Mine life based on 2015 Mineral Reserves and Resources
Operational Highlights

www.richmont-mines.com 8RIC: TSX NYSE-MKT
CANADIAN HIGH-GRADE UNDERGROUND MINE
Record Production Q1; Declining cash costs
YTD positive grade reconciliation: 44%
Production expansion opportunity
Reserves increase by 206%; 7-year mine life(1)
Exploration potential laterally and at depth(1) Refer to full 2015 Reserve and Resource information at the end of this presentation
2015 Q1 2016
2016Guidance
PEA2017-2022
Avg.
Gold Production (oz) 55,040 26,589 62,000-67,000 78,000
Gold Sold (oz) 52,363 26,031 - -
Cash costs/oz (C$)(1) $1,034 $674 $900-$960 $552
AISC (C$)(1) $1,460 - $1,160-$1,250 $639
Cash costs/oz (US$)(1) $808 $491 $660-$705(2) $414
AISC (US$)(1) $1,141 - $850-$920(2) $479
(1) Refer to the Non-GAAP performance measures contained in the Annual MD&A.(2) 2016 Guidance a foreign exchange rate of 1.364 Canadian dollars to the US dollar.
63% INCREASE IN PRODUCTION SINCE 2013
Capital and Exploration 2015 2016Guidance
2016PEA
Sustaining Capital ($M) 22.3 17.3 ~$20.0(2)
Project Capital ($M) PEA 28.9 37.4 36.8Project Capital ($M) non-PEA 2.0 6.0(1) -
Exploration ($M) 4.6 7.3 -(1) Includes 1,000m of development and related infrastructure outside of the PEA area(2) Estimated sustaining capital for the entire period 2017-2022 as per the PEA is $40.5M
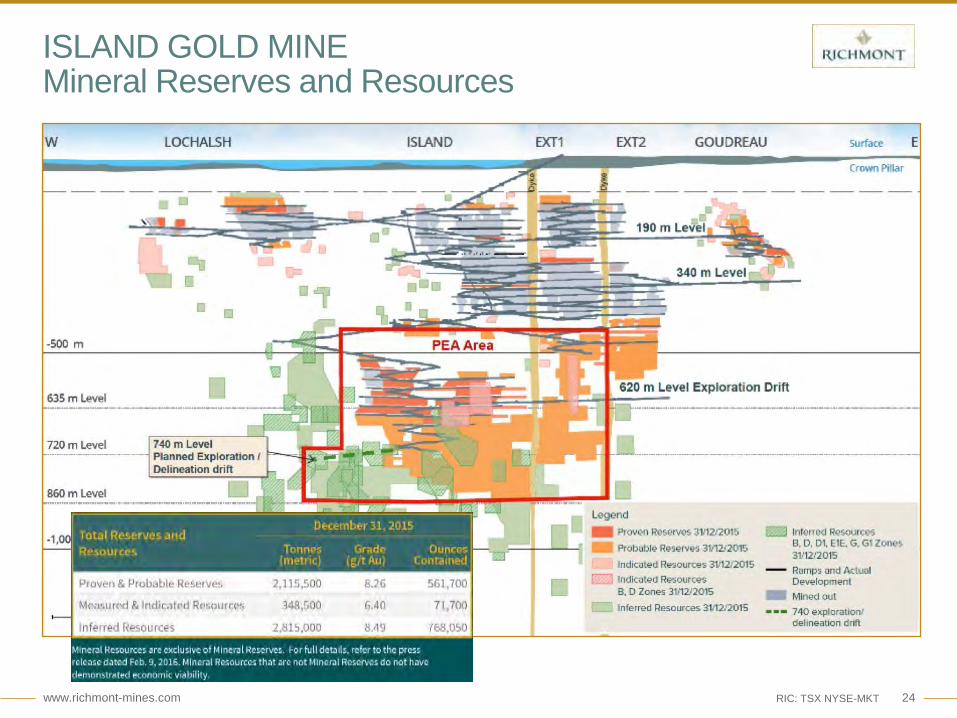
2015 Reserves and Resources Tonnes Gold
Ounces Grade g/t
Reserves (oz)(1)/Grade (g/t) 2,115,500 561,700 8.26
M&I (oz)(1) /Grade (g/t) 348,500 71,700 6.40
Inferred (oz)(1)/Grade (g/t) 2,815,000 768,050 8.49
(1) Mine life based on 2015 Mineral Reserves and Resources

www.richmont-mines.com 9RIC: TSX NYSE-MKT
BEAUFOR MINE: OVERVIEW
(1) Refer to the Non-GAAP performance measures contained in the Annual MD&A(2) 2016 Guidance assumes a foreign exchange rate of 1.364 Canadian dollars to the US dollar(3) Refer to full 2015 Reserve and Resource information at the end of this presentation
2015 Q1 2016 2016 Guidance
Gold Production (oz) 26,411 4,615 25,000-30,000
Gold Sold (oz) 26,875 5,037 -
Cash costs/oz (C$)(1) $995 1,398 $1,000-$1,060
AISC (C$)(1) $1,216 - $1,230-$1,330
Cash costs/oz (US$)(1) $778 1,018 $735-$780(2)
AISC (US$)(1) $951 - $905-$975(2)
Capital and Exploration 2015 2016 Guidance
Sustaining Capital ($M) $5.9 $6.8
2015 Reserves and Resources Gold Ounces Grade g/t
Reserves (oz)(3)/Grade (g/t) 63,850 6.57
M&I (oz)(3) /Grade (g/t) 171,900 6.34
Inferred (oz)(3)/Grade (g/t) 28,000 6.44
Reserves increased by 95%; mine life increased by 2 years (based on reserves)
Development of the Q Zone; Reached the mineralized structure in late March
Generating free cash flow (2016-2017)
Camflo Mill: capacity of 1,200 tpd provides toll milling opportunities

www.richmont-mines.com 10RIC: TSX NYSE-MKT
MINERAL RESERVES INCREASE BY 187%
Gold oz.63,850
Gold oz.561,700
0
100
200
300
400
500
600
700
2012 2013 2014 2015
Min
eral
Res
erve
s (0
00’s
oun
ces)
Monique Beaufor Island Gold
Proven and Probable Mineral Reserves(1)(2)
Island Gold Mine and Beaufor MineGold ounces Grams per tonne
December 31 2015 2014Change
(%) 2015 2014Change
(%)Island Gold Proven & Probable
above ~400m 76,700 90,000 (15%) 6.91 6.04 14%
below ~400m 485,000 93,750 417% 8.52 6.76 26%
Island Gold Proven & Probable 561,700 183,750 206% 8.26 6.39 29%
Beaufor Proven & Probable 63,850 32,750 95% 6.57 7.06 (7%)
Total Proven & Probable 625,550 216,500 187% 8.05 6.43 25%(1) Refer to the detailed mineral reserve and mineral resource tables that follow at the end of this presentation.(2) No changes to Mineral Reserves were made at the Corporation’s other properties.
Island Gold Reserves increase by 206%
• 29% increase in grade to 8.26 g/t
• 80% of PEA resources converted
• Mine life of 7 years (based on reserves)
Beaufor Reserves increase by 95%
• Mine life > 2 years (based on reserves)
• Conversion primarily from the Q Zone

Island Gold Mine - Geology

www.richmont-mines.com 12RIC: TSX NYSE-MKT
REGIONAL LOCATION MAP
Island Gold Mine

www.richmont-mines.com 13RIC: TSX NYSE-MKT
ISLAND GOLD MINELocation Map
Lake Superior
Marathon
White River17
25 km
Wawa
HEMLO
RENABIE
MISHI EDWARDS
ISLAND GOLD MINE
Proterozoic Plutonic and Volcanic RocksArchean Granitoid PlutonsArchean Metasedimentary TerranesArchean Greenstone TerranesFaultGold Past Producer
Gold Producer
SUGAR ZONESCHREIBER
EAGLE RIVER

www.richmont-mines.com 14RIC: TSX NYSE-MKT
Present and Past Producers
Mine Tonnage Grade AU Ounce
Island Gold 1,654,000 5.6 358,000
Magino 770,000 4.6 114,000
Kremzar 306,000 4.8 47,000
Edwards 391,000 9.9 140,000
Cline 330,000 6.5 69,000
Renabie 5,584,000 7.2 1,100,000
Wawa Area 478,000 7.8 119,000
Eagle River 3,473,000 9.3 1,003,000
DubreuilvilleISLAND GOLD MINE
10 km
N
Wawa48°
84°
85°
Lake Superior
EAGLE RIVER
RENABIE MINE
17
519
ISLAND GOLD MINEWawa Gold Camp District (2.9 M oz.)

www.richmont-mines.com 15RIC: TSX NYSE-MKT
GOUDREAU LAKE DEFORMATION ZONE

www.richmont-mines.com 16RIC: TSX NYSE-MKT
ISLAND GOLD MINEGLDZ Trends

www.richmont-mines.com 17RIC: TSX NYSE-MKT
Mill
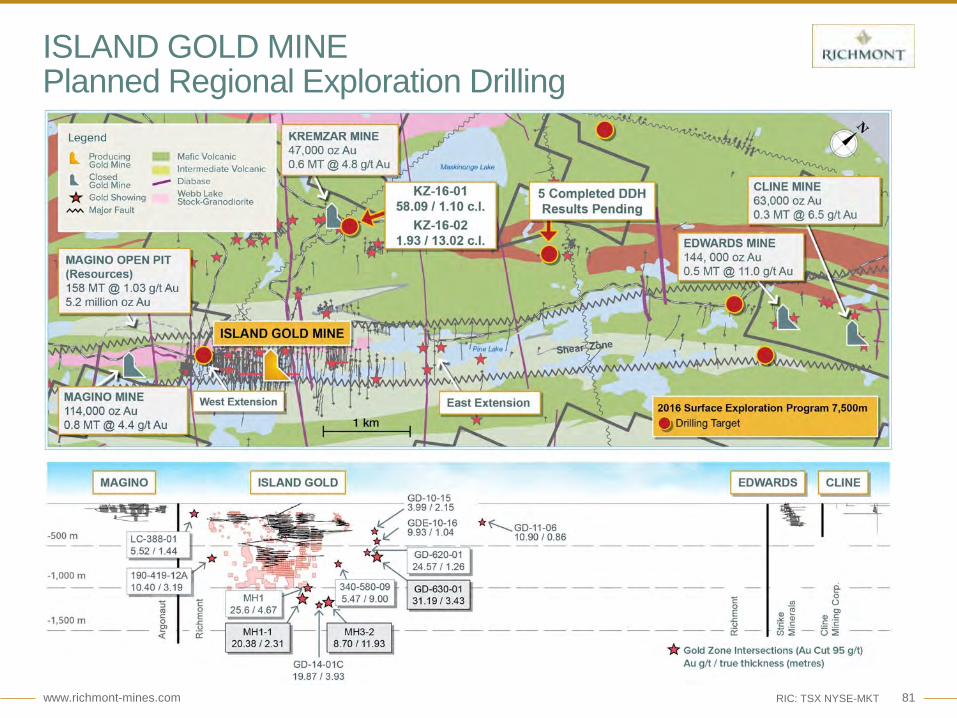
CLINE, 63,000 oz Au0,3 MT @ 6.5 g/t AuCline Lake Porphyry
1 km
EDWARDS, 144,000 oz Au0,5 MT @ 11.0 g/t AuPorphyry Dykes, Splays MV
KREMZAR, 47,000 oz Au0.6 MT @ 4.8 g/t AuGabbro Sill north contact
MAGINO, 114,000 oz Au0.8 MT @ 4.4 g/t AuWebb Lake Stock
ISLAND GOLD MINEFelsic Volcanic complex
Richmont property outline
Maskinongelake
Ramp
MAGINO OPEN PIT (Resources)158 MT @ 1.03 g/t Au 5.2 million oz Au Goudreau Zone
Lochalsh Zone
ISLAND GOLD MINEAdjacent Past Producers

www.richmont-mines.com 18RIC: TSX NYSE-MKT
ISLAND GOLD MINE
• Gold not restricted to any rock type except diabase, Maskinonge Granite
• High spatial correlation of 8 Goudreau camp Au deposits with a variety intrusive rocks
• Shafts• Gutcher Lake Stock, Trondhjemite, Murphy Mine;• Webb Lake Stock, Trondhjemite, Magino Mine;• Webb Lake Sill, Trondhjemite, Shore and North Shear Zone;• Cline Lake Porphyry, Felsic intrusive, Cline Mine;• Felsic Porphyry Dykes, Edwards Deposit;• Gabbroic Sill, Kremzar Deposit;• Felsic Dyke/Sill, Markes A zone; • Felsic porphyry dykes, Ego deposit.
• Island Gold Mine, mafic dykes, massive volcanic units, felsic dykes

www.richmont-mines.com 19RIC: TSX NYSE-MKT
RICHMONT MINES INC.Land Tenure
Ego Deposit
Emily Bay Showing
Dubreuilville
2 km
RICHMONT MINES PROPERTIES
OTHER OWNERS
Portal MainRamp
Edwards
Magino
GOUDREAU LAKE
Cline RICHMONT MINES219 Mining Titles 7,772 hectares
ISLAND GOLD MINE

www.richmont-mines.com 20RIC: TSX NYSE-MKT
ISLAND GOLD MINE2010 Planned Exploration Drilling
Planned Drilling Campaign: 5000 m

www.richmont-mines.com 21RIC: TSX NYSE-MKT
RICHMONT MINES2010 Drill Results

www.richmont-mines.com 22RIC: TSX NYSE-MKT
RICHMONT MINESDrilling Summary
A limited drill program for 5000 meters continued for 2.5 years to end of 2013
123,000 meters total
187 drill holes were drilled

www.richmont-mines.com 23RIC: TSX NYSE-MKT
ISLAND GOLD MINE2014 Long-section, Deep C Zone
SSM2666
SSM2491SSM2490SSM2490
Island Gold Deep C Zone
www.richmont-mines.com 24RIC: TSX NYSE-MKT
ISLAND GOLD MINEMineral Reserves and Resources

www.richmont-mines.com 25RIC: TSX NYSE-MKT
ISLAND GOLD MINEIsometric View, December 31, 2015

www.richmont-mines.com 26RIC: TSX NYSE-MKTTSX - NYSE MKT: RIC
S N
-500m
-900m
100 m
510 Level
535 Level
Zone
Island Gold Lower Resources
Section 14940E
560 Level
585 Level
Composite Longitudinal Section
620 Explo. Level635 Level
ISLAND GOLD MINESection 14940E

www.richmont-mines.com 27RIC: TSX NYSE-MKT
ISLAND GOLD MINEPlan View – 675 Level
Island Gold Lower Resources
ISLAND EXT 1 EXT 2 EW
675 Level Plan

www.richmont-mines.com 28RIC: TSX NYSE-MKT
ISLAND GOLD MINESchematic Cross Section
Overburden
535 Level
620 Level
Island Mainmineralized zones
Island Lowermineralized zones
ramp and drifts
Crown pillar
-500m
-750m
-250m
Inflection Zone
50m
• Deposit discovered between 1985-87 by Canamax Resources
• 1989-90: ramp access with 2 levels developed
• 2003: option agreement between Richmont and Patricia Mining
• 2007 beginning of commercial production
• 2008: Richmont acquired Patricia Mining
• 2010: beginning of deep exploration drilling(-400 to – 1,000 m)
• 2014: 320 000 oz of gold extracted from above the 400 level and more than a million ounce resource found below
• 2015: more than 560,000 oz in Proven and Probable Reserves, beginning of a deep directional exploration program (-1,000 to -1,500 m)
100m

www.richmont-mines.com 29RIC: TSX NYSE-MKT
ISLAND GOLD MINETypical Sections Looking West
14740ESection
Island Lowermineralized zones

www.richmont-mines.com 30RIC: TSX NYSE-MKT
ISLAND GOLD MINE535 Level Drift – C Zone

www.richmont-mines.com 31RIC: TSX NYSE-MKT
Island Gold MineTypical Section 14960 E – Looking West
-500m
-750m
-250m
Crown pillar
-1000m
Island Lowermineralized zones
Mafic dykes
14960ESection
Felsicvolcanics

www.richmont-mines.com 32
Island Gold MineMineralization Model
• Rock Competency contrast Exhibited on Regional and Mine scale
• GLDZ developing at/near interface of Cycle 2 and Cycle 3 volcanic rocks, so the major structure forming along contrasted lithologic and age domains.
• Likewise on a smaller deposit scale at the Island Gold mine the favorable structural setting along which the Island Gold deposit has formed is linked to rheological differences of the host sequence which in this case is the competency contrasts between the mafic dyke – volcanic domain and the larger more competent and massive footwall felsic unit. Not a ground breaking new concept but very workable in the Goudreau area.
• Accordingly the development of shears propagate along these planes of weakness with the subsequent formation of structural traps, vein formation and gold deposition.

www.richmont-mines.com 33RIC: TSX NYSE-MKT
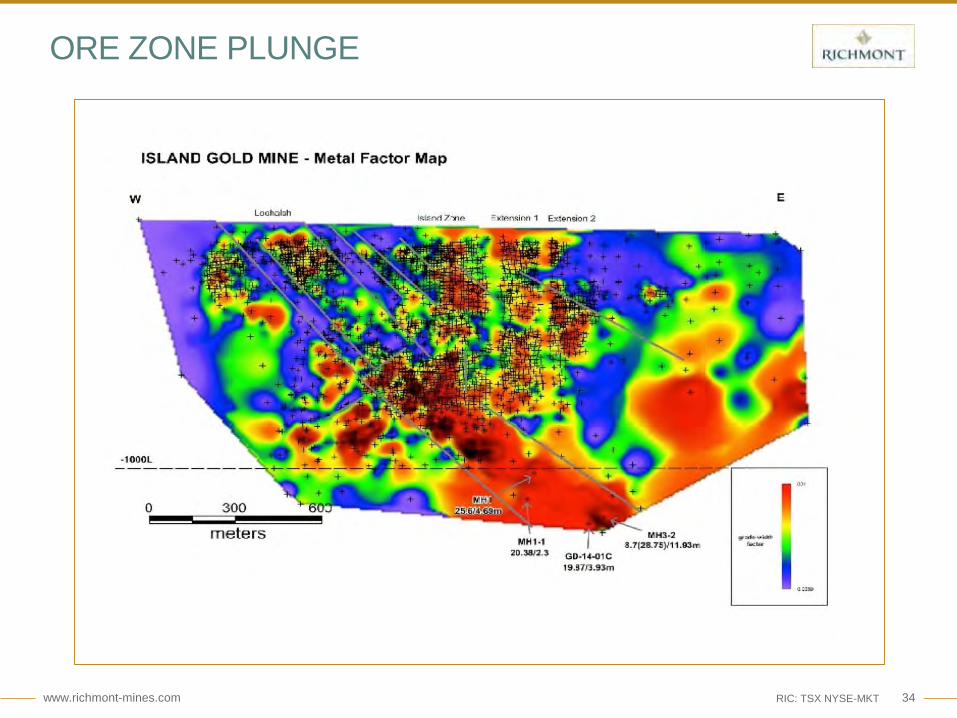
ISLAND GOLD MINEC Zone – Metal Factor, (grade*width)
W E
GOUDREAULOCHALSH ISLAND EXT1 EXT2
- 1,000 m
- 500 m
Crown pillar
- 1,500 m 15,0
00 m
E
16,0
00 m
E
620 m Level Exploration drift
14,0
00 m
E
Surface
200 m
Cut off (4.0g/t Au / 2.0m)
32730
20
10
5
0
Metal FactorGrade (g Au/t) x true width (metres)
(Cut 95g)
PEA
GD-620-0124.57/1.26
GD-14-01C19.87/3.93
MH1-120.38/2.31
MH3-28.70/11.93
GD-630-0131.19/3.43
GD-630-0211.90/0.60
www.richmont-mines.com 34RIC: TSX NYSE-MKT
ORE ZONE PLUNGE

www.richmont-mines.com 35RIC: TSX NYSE-MKT
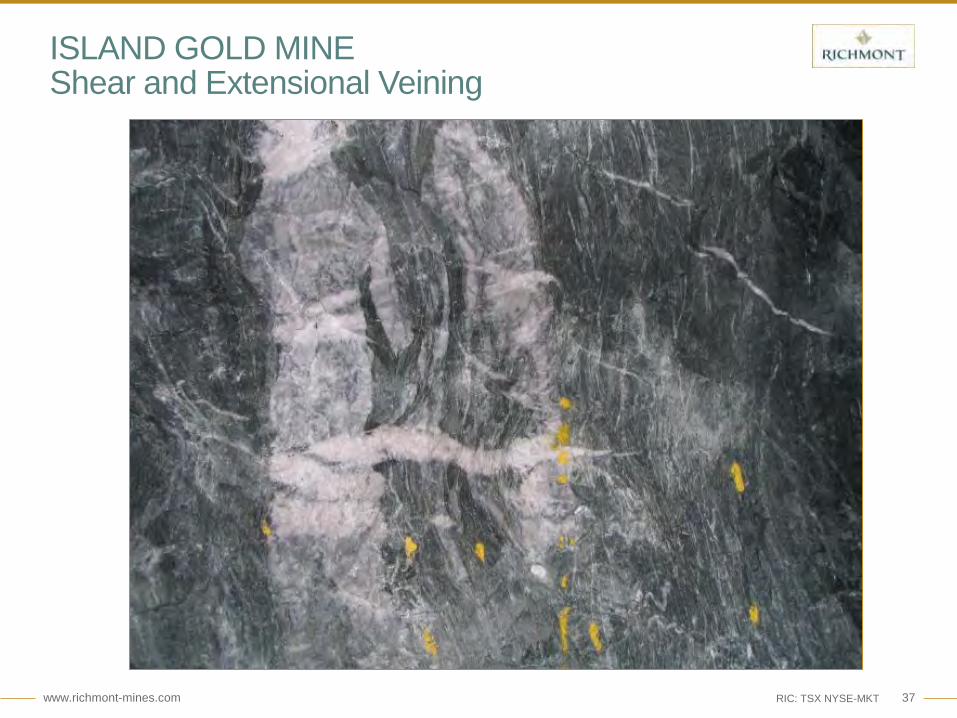
ORE ZONE 140L Ore Face
C zone, stringers style ore and boudignaged decimeter scale
Alteration envelope = quartz-sericite-pyrite-carbonate +/- tourmaline +/- albite

www.richmont-mines.com 36RIC: TSX NYSE-MKT
ISLAND GOLD MINEIsland 560 Sill
Approx. 10 cm
ISLAND 560C
www.richmont-mines.com 37RIC: TSX NYSE-MKT
ISLAND GOLD MINEShear and Extensional Veining
Approx. 10 cm

www.richmont-mines.com 38RIC: TSX NYSE-MKT
ISLAND GOLD MINEGoudreau Zone
Approx. 10 cm

www.richmont-mines.com 39RIC: TSX NYSE-MKT
ISLAND GOLD MINEComposite Longitudinal Section, Lower Zones
Approx. 10 cm400-514-1830.0 g/t Au / 9.55 m
400-528-104.79 / 2.87
400-528-097.44 / 8.49
400-528-104.44 / 6.07
GD-14-022.43/1.5
GD-14-01C19.87 g/t Au / 3.93 m

www.richmont-mines.com 40RIC: TSX NYSE-MKT
ISLAND GOLD MINE1200 meters depth
Still open at depth... GD14-01C : 19.9 g/t over a true width of 3.9 m

www.richmont-mines.com 41RIC: TSX NYSE-MKT
ISLAND GOLD MINEDeep C Vein
DH 425-487-12: Deep C vein - smokey color + VG, NQ size.

www.richmont-mines.com 42RIC: TSX NYSE-MKT
ISLAND GOLD MINE C Zone
C zone DH 425-487-10: 1 cm Au stringer @ 9,240 g/t

www.richmont-mines.com 43RIC: TSX NYSE-MKT
ISLAND GOLD MINEC Zone

www.richmont-mines.com 44RIC: TSX NYSE-MKT
ISLAND GOLD MINEC Zone
Metallurgical Tests on Island Gold Samples PU-2012-11-754
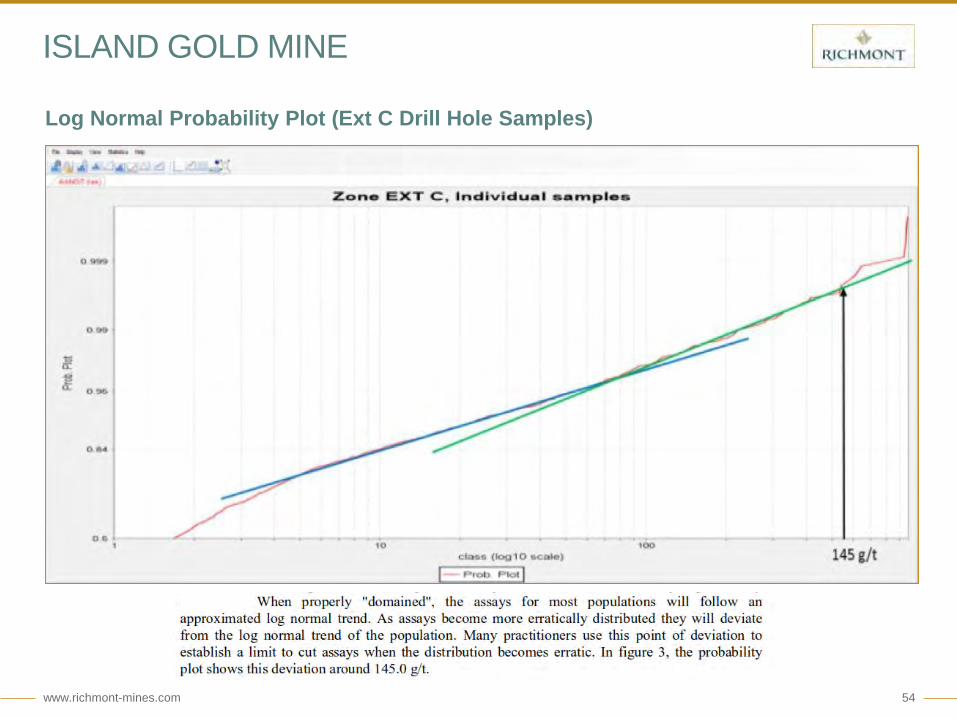
The figure above shows some measures of the largest free gold particles detected. The coarsest
gold particle was measured at 693 µm. But in general, the major part of the free gold is
in the finer size (<25 µm)
Diameter of some large free gold particles

www.richmont-mines.com 45RIC: TSX NYSE-MKT
ISLAND GOLD MINEFacts
Higher grades have been realized in the Deep Island averaging over 8.26 g/t average in the current inferred reserve vs. the 5.6 g average mined between 2007-2013.
Average zone width of deep resource 4.5 meters average width vs. upper zones averaging 2.7 meters (Press release 02/05/13)
Vg hit ratio is 60% at depth as opposed to 30% in the upper levels as calculated in the first Deep C resource estimate.
Veining more robust with increasing depth - a change from cm scale stringers and decimeter veins evolving into decimeter and meter scale veins with increasing depth
Structural-alteration corridor enveloping all zones appears to be widening at depth almost from about 50 metres to 100 metres.

www.richmont-mines.com 46RIC: TSX NYSE-MKT
ISLAND GOLD MINEPrevious QA/QC Method Review
2004 RPA Technical Report on the Island Gold Deposit concludes that gold in the Island Deposit is fine grained enough to respond well to normal fire assay procedures.
2015 – ALS conducted a review of Island Gold Mine QA/QC and concluded procedures were conformable or exceeded industry standards.
2016 – RPA completed a full review of estimated Mineral Resources as at December 31, 2015.

www.richmont-mines.com 47RIC: TSX NYSE-MKT
ISLAND GOLD MINEPrevious QA/QC Method Review
Standard Reference Material inserted at rate of 1:20 in core sample stream for exploration and 1:50 for production
Standard Reference Material inserted into every outgoing chip sample batch (10-20 samples/batch)
Blanks inserted following visible gold core samples
Pulp and Reject laboratory cross checking routine
Duplicate chip sampling on faces
Core shack on gated mine site with limited access

www.richmont-mines.com 48RIC: TSX NYSE-MKT
Lab Expert versus Actlabs Pulp Cross Check
R² = 0.8504
0.01
0.1
1
10
100
1000
0.001 0.01 0.1 1 10 100 1000
Lab
Expe
rt O
rigin
al C
ore
Assa
y Au
ppm
Actlabs Recheck Au ppm
Lab Expert Core vs Actlabs Recheck

www.richmont-mines.com 49RIC: TSX NYSE-MKT
Island Gold daily Lab vs. Lab Expert Pulp Cross Checks

www.richmont-mines.com 50RIC: TSX NYSE-MKT
ISLAND GOLD MINEMineral Reserves and Resources

www.richmont-mines.com 51RIC: TSX NYSE-MKT
ISLAND GOLD MINELongitudinal Section, Lower C ZoneDevelopment as of December 31st, 2015

www.richmont-mines.com 52RIC: TSX NYSE-MKT
ISLAND GOLD MINEReconciliation of the Lower Zones
Diluted

www.richmont-mines.com 53
ISLAND GOLD MINE
Histogram of the Ext C Samples
www.richmont-mines.com 54
ISLAND GOLD MINE
Log Normal Probability Plot (Ext C Drill Hole Samples)

Island Gold Mine – Ops & Growth

www.richmont-mines.com 56RIC: TSX NYSE-MKT
ISLAND GOLD: 2016 Development and Mine Plan

www.richmont-mines.com 57RIC: TSX NYSE-MKT
ISLAND GOLD MINE: Mining Methods
• Pull void is used to create void for the next blast• Cables are used in the walls between rings for ground support

www.richmont-mines.com 58RIC: TSX NYSE-MKT
ISLAND GOLD MINE: Mill Flowsheet -1 of 2

www.richmont-mines.com 59RIC: TSX NYSE-MKT
ISLAND GOLD MINE: Mill Flowsheet -2 of 2

www.richmont-mines.com 60RIC: TSX NYSE-MKT
Underground Mine Productivity
ISLAND GOLD MINE: Positioning for Growth
0.0
2.0
4.0
6.0
8.0
10.0
12.0
0100200300400500600700800900
1000Q
4 14
Q1 15
Q2 15
Q3 15
Q4 15
2016E
PEA
(800tpd)
Q1 16
Upside
(900tpd)
Gra
ms
per t
onne
Tonn
es p
er d
ay
Underground tpd Head grade (g/t)
Island Gold 2014 2015 Q1 2016 2016E
Underground (tpd) 601 659 853 800
Mill (tpd) 632 663 834 800
Head grade (g/t) 5.91 7.31 11.31 7.0-7.5
Recoveries (%) 96.3 96.8 96.3 96.5
(1) Fourth quarter production and mine and mill productivity: Includes a 3-week scheduled underground mine shutdown and a 2-week scheduled mill shutdown
Tonnes mined from development ore: • 2015: 50% / 2016E: 40% / PEA: 5%
First 2 mining horizons developed, third horizon development in progress
3 years of mine life pre-developed
Tailings expansion complete (2.3MT)
- 10,000 20,000 30,000 40,000 50,000 60,000 70,000 80,000 90,000
100,000
2014 2015 2016E(1) PEA BaseCase
(800tpd)(2)
UpsidePotential
(900tpd)(3)
(1) Mid-range of 2016 guidance
Island Gold Production Upside
(2) Avg. annual production 2017-2022 (3) Permitted potential
Oz
Au
2016E (1) PEA Base Case
(800tpd) (2)
Upside Potential
(900tpd) (3)

www.richmont-mines.com 61RIC: TSX NYSE-MKT
Q1 RECORD PRODUCTION:Positive Reconciliation to Reserve
(1) Reconciliation Mined to Reserves as of March 31st, 2016
Record production in Q1; Higher than planned grades mined
Development ore ratio strategically increased to 55% (vs. 40% planned) in Q1
Development primarily in the higher-grade second mining horizon
YTD positive grade reconciliation of 44%: (47% development / 39% stope)
30% dilution assumption for development reserves; lower dilution from deeper, wider zones
Reserves (as of Dec 31st, 2015) Mined (reconciled) Variations (Mined vs Reserves)
Diluted Tonnes
Diluted Grade
Diluted Ounces
Reconciled Tonnes
Reconciled Grade
Reconciled Ounces Tonnes Grade Ounces
Total Development Q1 44,323 8.28 11,795 42,601 12.19 16,701 96% 147% 142%
Total Stope Q1 34,877 7.13 7,991 34,995 9.92 11,166 100% 139% 140%
Total U/G Q1 79,199 7.77 19,785 77,596 11.17 27,867 98% 144% 141%
Year-to-Date Reserve Reconciliation (1)

www.richmont-mines.com 62RIC: TSX NYSE-MKT
• All of Island Gold Mine operating costs are in Canadian dollars
• 2015 average exchange rate CAN $0.782 = US $1.00
2015 Cash Cost/Tonne (C$)Total 2015 cost/tonne = C$232
0%
5%
10%
15%
20%
25%
30%
35%
$49SG&A
$140MINING
$35MILLING
$8ROYALTIES
2015 Cash Cost/Tonne (C$ %)
ISLAND GOLD MINEMine Cost/Tonne Breakdown

www.richmont-mines.com 63RIC: TSX NYSE-MKT
MINING UNIT COST OPPORTUNITY
Uni
t Min
ing
Cost
20.0% 30.0% 40.0% 50.0%
% of Development Ore of Total Ore Mined
0
50
150
Q2 2015
100
250Long-term planned ratio
Q1 2015200
0.0% 10.0% 60.0% 70.0% 80.0%
Historical DataPEA – 2017/20222015
150
Q4 2015
100150
Q3 2015
100
2016
150
Q1 2016
100
Near-term opportunity: lower the mining cost by returning to historical development ratio

www.richmont-mines.com 64RIC: TSX NYSE-MKT
ISLAND GOLD MINETruck Test Summary
• Cat Trucks with tail gates
• Average load from U/G 20.92 metric tons
• Average loaded on surface 26.1
• Difference is 5.2 metric tons
• Cat Truck with no tail gate
• Average load from U/G 19.5 metric tons
• Average loaded on surface 24.9
• Difference is 5.4 metric tons

www.richmont-mines.com 65RIC: TSX NYSE-MKT
ISLAND GOLD MINETruck Test Summary: Original load – 20 Tons

www.richmont-mines.com 66RIC: TSX NYSE-MKT
ISLAND GOLD MINETruck Test Summary: Reloaded – 26 Tons

www.richmont-mines.com 67RIC: TSX NYSE-MKT
OTHER IMPROVEMENT INITIATIVES:
Implementation of Performance Management System – Dash Board
Workshops – Mixed Team Sessions (Operations & Supervision)
Operating Costs – Operational Strategy on Main Cost Drivers
Capital Expenditures Control – Allocation & Follow-up
Procurement Strategy on Main Cost Drivers
Dilution Control – Long-hole Stoping
Life of Mine – Optimization of Mine Plans (Expansion Scenario)
Site Admin Costs – Optimization

www.richmont-mines.com 68RIC: TSX NYSE-MKT
East
ISLAND GOLD MINEPreliminary Economic Assessment
Resources located between 450L and 860L

www.richmont-mines.com 69RIC: TSX NYSE-MKT
• Conceptual expansion case released in H2 2016; Potential Expansion Case to 1,150 tpd decision in H1 2017
ISLAND GOLDPEA Overview• Potential for increased production and lower AISC
0
200
400
600
800
1000
1200
2015 Q1 2016 PEA BaseCase
PermittedCapacity
PEAExpanded
Case
Tonn
espe
r day
• Phased approach: Phase 1 (800 tpd)
• Mining from a depth of 450 to 860 metres over three long-hole mining horizons• Excludes resources above the 450 metre level, isolated resource blocks and parallel zones• Avg. production of approx. 78,000 gold ounces per year from 2017 to 2022 at
$552/oz cash costs
PEA Summary 2017-2022
Tonnes Milled (Mt) 1.7
Head Grade (g/t) 8.67
Mine life excl. transition period (years) 6
Daily mine production (tpd) 801
Gold recovery (%) 96.5
Production (Koz) 464.6
Average annual gold production (Koz) 78
Total operating cost ($M) 256
Average cash operating cost ($/t) 148
Average cash operating cost ($/oz) 552
Transition Period Project Capital 2015-2016 ($M) 62
Sustaining Capital ($M) (2017-2022) 40.5
Mill Expansion Opportunity

www.richmont-mines.com 70RIC: TSX NYSE-MKT
ISLAND GOLD MINE PEA 2015Maximum Capacity
Simulation at 1,150 tpd mining rate

www.richmont-mines.com 71RIC: TSX NYSE-MKT
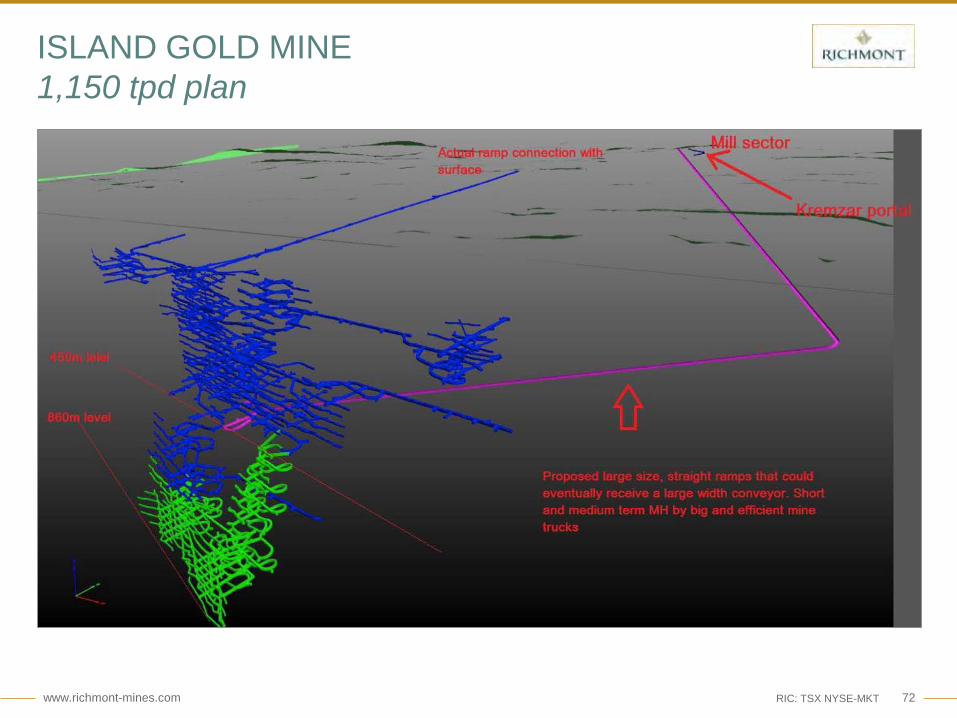
ISLAND GOLD MINEMaterials Handling Options1,150 tpd plan
Option 8b- New Ramp with 1.5m wide suspended conveyor
www.richmont-mines.com 72RIC: TSX NYSE-MKT
ISLAND GOLD MINE1,150 tpd plan
www.richmont-mines.com 73RIC: TSX NYSE-MKT
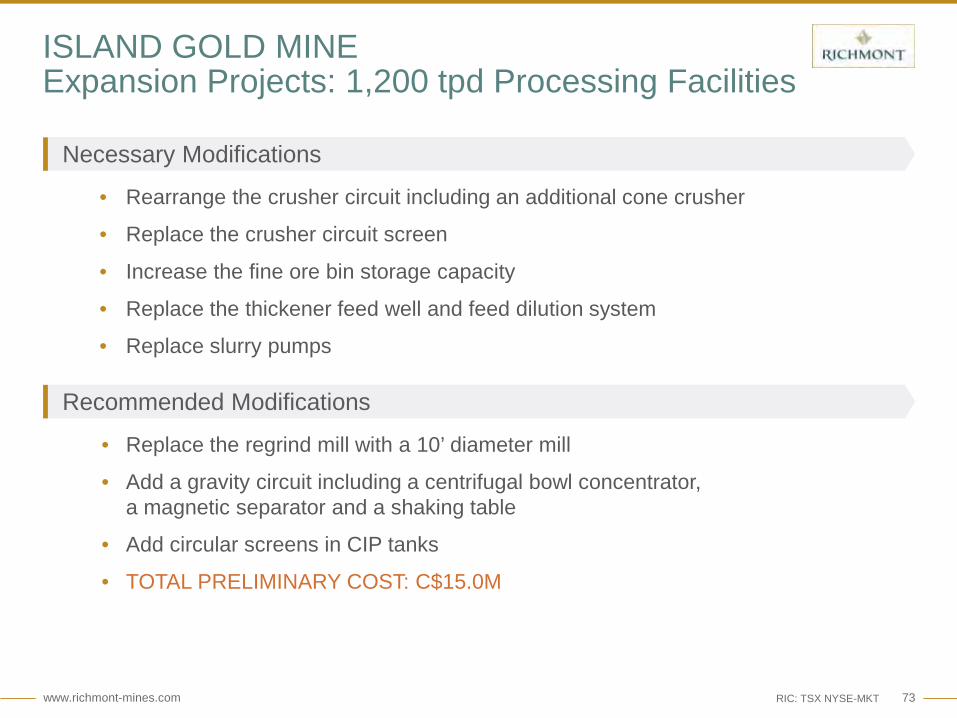
• Necessary Modifications
• Rearrange the crusher circuit including an additional cone crusher
• Replace the crusher circuit screen
• Increase the fine ore bin storage capacity
• Replace the thickener feed well and feed dilution system
• Replace slurry pumps
• Recommended Modifications
• Replace the regrind mill with a 10’ diameter mill
• Add a gravity circuit including a centrifugal bowl concentrator, a magnetic separator and a shaking table
• Add circular screens in CIP tanks
• TOTAL PRELIMINARY COST: C$15.0M
ISLAND GOLD MINEExpansion Projects: 1,200 tpd Processing Facilities

Island Gold Mine – Exploration

www.richmont-mines.com 75RIC: TSX NYSE-MKT
49,196 oz
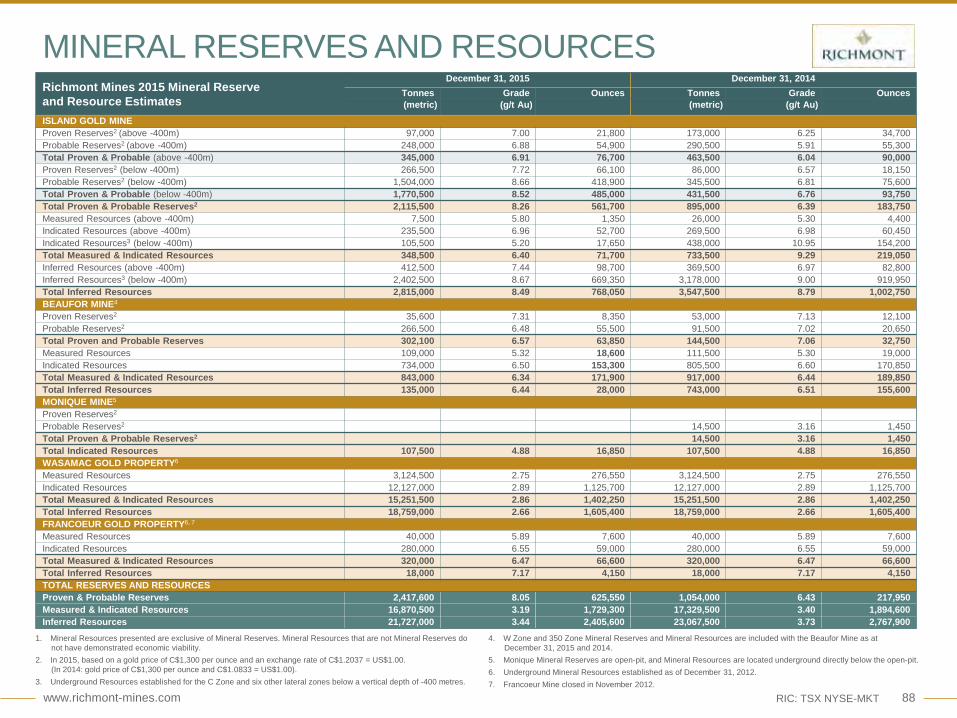
MINERAL RESERVES AND RESOURCESRichmont Mines 2015 Mineral Reserve and Resource Estimates
December 31, 2015 December 31, 2014Tonnes Grade Ounces Tonnes Grade Ounces(metric) (g/t Au) (metric) (g/t Au)
ISLAND GOLD MINEProven Reserves2 (above -400m) 97,000 7.00 21,800 173,000 6.25 34,700Probable Reserves2 (above -400m) 248,000 6.88 54,900 290,500 5.91 55,300Total Proven & Probable (above -400m) 345,000 6.91 76,700 463,500 6.04 90,000Proven Reserves2 (below -400m) 266,500 7.72 66,100 86,000 6.57 18,150Probable Reserves2 (below -400m) 1,504,000 8.66 418,900 345,500 6.81 75,600Total Proven & Probable (below -400m) 1,770,500 8.52 485,000 431,500 6.76 93,750Total Proven & Probable Reserves2 2,115,500 8.26 561,700 895,000 6.39 183,750Measured Resources (above -400m) 7,500 5.80 1,350 26,000 5.30 4,400Indicated Resources (above -400m) 235,500 6.96 52,700 269,500 6.98 60,450Indicated Resources3 (below -400m) 105,500 5.20 17,650 438,000 10.95 154,200Total Measured & Indicated Resources 348,500 6.40 71,700 733,500 9.29 219,050Inferred Resources (above -400m) 412,500 7.44 98,700 369,500 6.97 82,800Inferred Resources3 (below -400m) 2,402,500 8.67 669,350 3,178,000 9.00 919,950Total Inferred Resources 2,815,000 8.49 768,050 3,547,500 8.79 1,002,750BEAUFOR MINE4
Proven Reserves2 35,600 7.31 8,350 53,000 7.13 12,100Probable Reserves2 266,500 6.48 55,500 91,500 7.02 20,650Total Proven and Probable Reserves 302,100 6.57 63,850 144,500 7.06 32,750Measured Resources 109,000 5.32 18,600 111,500 5.30 19,000Indicated Resources 734,000 6.50 153,300 805,500 6.60 170,850Total Measured & Indicated Resources 843,000 6.34 171,900 917,000 6.44 189,850Total Inferred Resources 135,000 6.44 28,000 743,000 6.51 155,600MONIQUE MINE5
Proven Reserves2
Probable Reserves2 14,500 3.16 1,450Total Proven & Probable Reserves2 14,500 3.16 1,450Total Indicated Resources 107,500 4.88 16,850 107,500 4.88 16,850WASAMAC GOLD PROPERTY6
Measured Resources 3,124,500 2.75 276,550 3,124,500 2.75 276,550Indicated Resources 12,127,000 2.89 1,125,700 12,127,000 2.89 1,125,700Total Measured & Indicated Resources 15,251,500 2.86 1,402,250 15,251,500 2.86 1,402,250Total Inferred Resources 18,759,000 2.66 1,605,400 18,759,000 2.66 1,605,400FRANCOEUR GOLD PROPERTY6, 7
Measured Resources 40,000 5.89 7,600 40,000 5.89 7,600Indicated Resources 280,000 6.55 59,000 280,000 6.55 59,000Total Measured & Indicated Resources 320,000 6.47 66,600 320,000 6.47 66,600Total Inferred Resources 18,000 7.17 4,150 18,000 7.17 4,150TOTAL RESERVES AND RESOURCESProven & Probable Reserves 2,417,600 8.05 625,550 1,054,000 6.43 217,950Measured & Indicated Resources 16,870,500 3.19 1,729,300 17,329,500 3.40 1,894,600Inferred Resources 21,727,000 3.44 2,405,600 23,067,500 3.73 2,767,900
1. Mineral Resources presented are exclusive of Mineral Reserves. Mineral Resources that are not Mineral Reserves do not have demonstrated economic viability.
2. In 2015, based on a gold price of C$1,300 per ounce and an exchange rate of C$1.2037 = US$1.00. (In 2014: gold price of C$1,300 per ounce and C$1.0833 = US$1.00).
3. Underground Resources established for the C Zone and six other lateral zones below a vertical depth of -400 metres.
4. W Zone and 350 Zone Mineral Reserves and Mineral Resources are included with the Beaufor Mine as at December 31, 2015 and 2014.
5. Monique Mineral Reserves are open-pit, and Mineral Resources are located underground directly below the open-pit.6. Underground Mineral Resources established as of December 31, 2012.7. Francoeur Mine closed in November 2012.

www.richmont-mines.com 76RIC: TSX NYSE-MKT
49,196 oz
ISLAND GOLD MINEC Zone, Metal factor (grade*width) as of Dec. 2015

www.richmont-mines.com 77RIC: TSX NYSE-MKT
ISLAND GOLD MINE: Exploration Program86,500m Drilling program launched in Q4 2015; 50,050m completed to date

www.richmont-mines.com 78RIC: TSX NYSE-MKT
ISLAND GOLD MINEDeep Directional Drilling (Phase 1)

www.richmont-mines.com 79RIC: TSX NYSE-MKT
ISLAND GOLD MINENear Mine Lateral Exploration

www.richmont-mines.com 80RIC: TSX NYSE-MKT
ISLAND GOLD MINE2016 Eastern Lateral Exploration
www.richmont-mines.com 81RIC: TSX NYSE-MKT
ISLAND GOLD MINEPlanned Regional Exploration Drilling

www.richmont-mines.com 82RIC: TSX NYSE-MKT
ISLAND GOLD AREA2016 Exploration: Kremzar Mine
Q V
- 750 m
KZ-16-021.93 g/t Au /13.02 m
(core length)
Surface
KZ-16-0158.09 g/t Au /1.10 m
(core length)
KZ-16-010.49 g/t Au / 6.40 m
(core length)
KREMZAR MINE (Production)0.6 MT @ 4.8 g/t Au, 47,000 oz Au
- 250 m
- 500 m
100 m
Mined Stopes
SW NE

Q&A

APPENDIX

www.richmont-mines.com 85RIC: TSX NYSE-MKT
CHRISTIAN BOURCIER
Vice-President, Operations
P. ENGPresident and Chief Executive Officer
P. ENG
RICHMONT MINES: MANAGEMENT TEAM
RENAUD ADAMS DANIEL ADAM
Vice-President Exploration
GEO PHD
NICOLE VEILLEUX
Vice-President Finance
CPA, CA
JEAN BASTIEN
Island Gold Mine General Manager
P. ENG, MBA
MARC-ANDRÉ LAVERGNE
Beaufor Mine and Camflo Mill General Manager
P. ENG
MAXIME GRONDIN
Director, Human Resources
CIRC
MÉLISSA TARDIF
ANNE DAY
Vice-President, Investor Relations
MBA
STEVE BURLETON
Vice-President, Business Development
CFA, MBA
Director, Business Performance Management and Infrastructure
BSC ISE
MIGUEL MENDOZA
Lawyer and Corporate Secretary
LLB

www.richmont-mines.com 86RIC: TSX NYSE-MKT
RICHMONT MINES: BOARD OF DIRECTORS
GREG CHAMANDY
Director
RENÉ MARION
Chairman of the Board
P. ENG
MICHAEL PESNER
Director and Chairman ofthe Audit Committee
CA
RENAUD ADAMS
Director, President and Chief Executive Officer
P. ENG
PETER BARNES
Director
CA
ELAINE ELLINGHAM
Director
P. Geo., MBA

www.richmont-mines.com 87
2016 OPERATIONAL ESTIMATES2016 Production and Cost Guidance
2016 Capital Investment Guidance
Operational Estimates Island Gold Beaufor2016 Consolidated
EstimatesGold Ounces Produced 62,000-67,000 25,000-30,000 87,000-97,000Cash Costs per Ounce (C$)(1) $900-$960 $1,000-$1,060 $930-$1,000Sustaining Capital per Ounce (C$) $260-$290 $230-$270 $250-$280
Corporate G&A per Ounce (C$) $95-$110
All-in Sustaining Costs per Ounce (C$)(1) $1,160-$1,250 $1,230-$1,330 $1,275-$1,390Cash Costs per Ounce (US$)(1) $660-$705 $735-$780 $680-$730Sustaining Capital per Ounce (US$) $190-$215 $170-$195 $185-$205
Corporate G&A per Ounce (US$) $70-$80
All-in Sustaining Costs per Ounce (US$)(1) $850-$920 $905-$975 $935-$1,015(1) Cash costs and AISC are non-GAAP measures. Refer to the Non-GAAP performance measures section in the 2015 Annual MD&A.
Material assumptions include: an average gold price of C$1,500 per ounce (US$1,100 per ounce); and a foreign exchange rate of 1.364 Canadian dollars to the US dollar.
Capital and Exploration Investment ($M) Island Gold Quebec Division2016 Consolidated
EstimatesSustaining Capital (C$) $17.3 $6.8 $24.1Project Capital (C$)(3) $43.4 $ - $43.4Company-wide Exploration (C$) $7.3(1) $1.1(2) $8.4Sustaining Capital (US$) $12.7 $5.0 $17.7Project Capital (US$)(3) $31.8 $ - $31.8Company-wide Exploration (US$) $5.4 $0.8 $6.2(1) Exploration costs required to complete the drilling programs announced in September 2015.(2) All delineation and exploration drilling for the Beaufor Mine is included in sustaining capital and $1.1 million is related to the Quebec division outside the Beaufor property.(3) Project Capital for Island Gold includes accelerated underground development of $25.0 million (US$18.3 million) related to the PEA and $6.0 million (US$4.4 million) related to discretionary development outside the scope of the PEA.
www.richmont-mines.com 88RIC: TSX NYSE-MKT
49,196 oz
MINERAL RESERVES AND RESOURCESRichmont Mines 2015 Mineral Reserve and Resource Estimates
December 31, 2015 December 31, 2014Tonnes Grade Ounces Tonnes Grade Ounces(metric) (g/t Au) (metric) (g/t Au)
ISLAND GOLD MINEProven Reserves2 (above -400m) 97,000 7.00 21,800 173,000 6.25 34,700Probable Reserves2 (above -400m) 248,000 6.88 54,900 290,500 5.91 55,300Total Proven & Probable (above -400m) 345,000 6.91 76,700 463,500 6.04 90,000Proven Reserves2 (below -400m) 266,500 7.72 66,100 86,000 6.57 18,150Probable Reserves2 (below -400m) 1,504,000 8.66 418,900 345,500 6.81 75,600Total Proven & Probable (below -400m) 1,770,500 8.52 485,000 431,500 6.76 93,750Total Proven & Probable Reserves2 2,115,500 8.26 561,700 895,000 6.39 183,750Measured Resources (above -400m) 7,500 5.80 1,350 26,000 5.30 4,400Indicated Resources (above -400m) 235,500 6.96 52,700 269,500 6.98 60,450Indicated Resources3 (below -400m) 105,500 5.20 17,650 438,000 10.95 154,200Total Measured & Indicated Resources 348,500 6.40 71,700 733,500 9.29 219,050Inferred Resources (above -400m) 412,500 7.44 98,700 369,500 6.97 82,800Inferred Resources3 (below -400m) 2,402,500 8.67 669,350 3,178,000 9.00 919,950Total Inferred Resources 2,815,000 8.49 768,050 3,547,500 8.79 1,002,750BEAUFOR MINE4
Proven Reserves2 35,600 7.31 8,350 53,000 7.13 12,100Probable Reserves2 266,500 6.48 55,500 91,500 7.02 20,650Total Proven and Probable Reserves 302,100 6.57 63,850 144,500 7.06 32,750Measured Resources 109,000 5.32 18,600 111,500 5.30 19,000Indicated Resources 734,000 6.50 153,300 805,500 6.60 170,850Total Measured & Indicated Resources 843,000 6.34 171,900 917,000 6.44 189,850Total Inferred Resources 135,000 6.44 28,000 743,000 6.51 155,600MONIQUE MINE5
Proven Reserves2
Probable Reserves2 14,500 3.16 1,450Total Proven & Probable Reserves2 14,500 3.16 1,450Total Indicated Resources 107,500 4.88 16,850 107,500 4.88 16,850WASAMAC GOLD PROPERTY6
Measured Resources 3,124,500 2.75 276,550 3,124,500 2.75 276,550Indicated Resources 12,127,000 2.89 1,125,700 12,127,000 2.89 1,125,700Total Measured & Indicated Resources 15,251,500 2.86 1,402,250 15,251,500 2.86 1,402,250Total Inferred Resources 18,759,000 2.66 1,605,400 18,759,000 2.66 1,605,400FRANCOEUR GOLD PROPERTY6, 7
Measured Resources 40,000 5.89 7,600 40,000 5.89 7,600Indicated Resources 280,000 6.55 59,000 280,000 6.55 59,000Total Measured & Indicated Resources 320,000 6.47 66,600 320,000 6.47 66,600Total Inferred Resources 18,000 7.17 4,150 18,000 7.17 4,150TOTAL RESERVES AND RESOURCESProven & Probable Reserves 2,417,600 8.05 625,550 1,054,000 6.43 217,950Measured & Indicated Resources 16,870,500 3.19 1,729,300 17,329,500 3.40 1,894,600Inferred Resources 21,727,000 3.44 2,405,600 23,067,500 3.73 2,767,900
1. Mineral Resources presented are exclusive of Mineral Reserves. Mineral Resources that are not Mineral Reserves do not have demonstrated economic viability.
2. In 2015, based on a gold price of C$1,300 per ounce and an exchange rate of C$1.2037 = US$1.00. (In 2014: gold price of C$1,300 per ounce and C$1.0833 = US$1.00).
3. Underground Resources established for the C Zone and six other lateral zones below a vertical depth of -400 metres.
4. W Zone and 350 Zone Mineral Reserves and Mineral Resources are included with the Beaufor Mine as at December 31, 2015 and 2014.
5. Monique Mineral Reserves are open-pit, and Mineral Resources are located underground directly below the open-pit.6. Underground Mineral Resources established as of December 31, 2012.7. Francoeur Mine closed in November 2012.

www.richmont-mines.com 89
TOP SHAREHOLDERSFirm Name % O/S Shares Held City
Oxbridge Group, Inc.(1) 6.93 4,020,854 MontrealRenaissance Technologies LLC 5.95 3,484,500 New YorkZPR Investment Management Inc. 4.70 2,752,610 Orange CityCaisse de Depot et Placement du Quebec 4.66 2,730,000 MontrealOppenheimerFunds, Inc. 3.93 2,300,000 New York1832 Asset Management L.P. 3.72 2,175,000 TorontoConnor, Clark & Lunn Investment Management Ltd. 3.10 1,812,714 VancouverRBC Global Asset Management Inc. 2.92 1,711,273 TorontoSentry Investments Inc. 2.76 1,615,900 TorontoMackenzie Financial Corporation 2.73 1,600,800 TorontoRuffer LLP 2.22 1,300,000 LondonU.S. Global Investors, Inc. 1.88 1,100,000 San AntonioFiera Capital Corporation 1.70 995,789 MontrealFonds de Solidarité FTQ 1.68 985,600 MontrealEterna Investment Management Inc. 1.52 888,600 Quebec CityPicton Mahoney Asset Management 1.45 850,000 TorontoDimensional Fund Advisors, L.P. 1.41 825,000 AustinNorrep Capital Management Ltd. 1.12 655,400 CalgaryManulife Asset Management Limited 1.11 650,000 TorontoAcadian Asset Management LLC 1.00 584,648 BostonFormula Growth Ltd. 0.94 550,000 MontrealAGF Investments Inc. 0.93 546,600 TorontoBlackRock Asset Management Canada Limited 0.93 545,000 TorontoJames Investment Research Inc. 0.86 505,415 XeniaGabelli Funds, LLC 0.77 450,000 Rye(1) Shares held by H. Greg Chamandy, Director– Richmont Mines

www.richmont-mines.com 90RIC: TSX NYSE-MKT
WASAMAC: ADVANCED DEVELOPMENT PROJECT
Resources Tonnes Grade (g/t Au)
Gold Ounces
Measured Resources 3,124,500 2.75 276,550
Indicated Resources 12,127,000 2.89 1,125,700
Inferred Resources 18,759,000 2.66 1,605,400
(1) Refer to full 2014 Reserve and Resource information at the end of this presentation
15km west of Rouyn-Noranda, Quebec
100% owned, no royalties
Close proximity to existing infrastructure
Located in the Abitibi gold mining district
Significant exploration potential
NI 43-101 PEA released in March 2012

www.richmont-mines.com 91RIC: TSX NYSE-MKT
RICHMONT MINES ASSETSVald’or Area – Exploration Properties

www.richmont-mines.com 92RIC: TSX NYSE-MKT
RICHMONT MINES ASSETSRouyn-Noranda Area / Exploration Properties

www.richmont-mines.com 93RIC: TSX NYSE-MKT
RICHMONT MINES ASSETSTimmins Area / Exploration Properties

www.richmont-mines.com 94RIC: TSX NYSE-MKT
OUR VALUES
At the heart of this is a commitment to responsibility, integrity and accountability and the Corporation’s four corporate values of Family, Health & Safety, Growth and Team Work.
Health and Safety“Zero tolerance…”
Family“At the heart of
what unites us…”Richmont Mines is a family. Our
management team is easily accessible and actively listens to our employees and their
families. Richmont has put a number of plans and activities in place, including programs that
support work-family balance, scholarships, and student hiring.
Health and safety is a cardinal value of the corporation. Richmont Mines makes every effort to safeguard the health and safety of all of its employees. We implement efficient health and wellness programs and support our objectives with recognition programs.The only truly acceptable result is zero accidents.
Team Work “Working together...”
Richmont Mines strives to create a unified team by encouraging the involvement and
the participation of our employees and stakeholders. We want our employees to enjoy working together. Every position is important. Working together and promoting
cooperation promotes continued success and the achievement of greater objectives.
With an objective of becoming a leading junior gold producer in the short-term and an important intermediate gold producer, Richmont’s growth is supported by the development of our workforce, the health and safety of our employees, and cultivating good relations with the community, while having a transparent approach, driven by integrity and ethics.
Growth “We are building the future…”

www.richmont-mines.com 95RIC: TSX NYSE-MKT
SUSTAINABLE BUSINESS MODEL
We believe in developing Richmont based on the principles of sustainability, in order to deliver sustainable and superior value for all stakeholders with low risk exposure to precious metals.
SustainableHuman Resources
SustainableCommunity Development
SustainableProcess Improvement
SustainableGrowth Principles
Making work life sustainable through employee health & safety and wellness
programs, improved supervisory & operational planning/implementation practices and skills through training programs. Develop potential
leadership abilities through leadership program. Promote Life in Balance; family, work and
personal development.
Reducing inefficiency and waste through quality & performance management by implementation of “Lean” methods and balanced score card approach. Advanced knowledge and experience with energy efficiency, sustainable waste systems & construction/building practices.
Leadership and consulting skills for promoting comprehensive change
toward sustainability in communities and developing world-class relationships
with Aboriginal communities.
Developing sustainable exploration, development, operational and financial practices in order to deliver superior per share value, mitigation/management of risk exposure and discipline approach toward preserving best-in-class balance sheet and capital structure.