Business Case Walking - Auckland Council
26
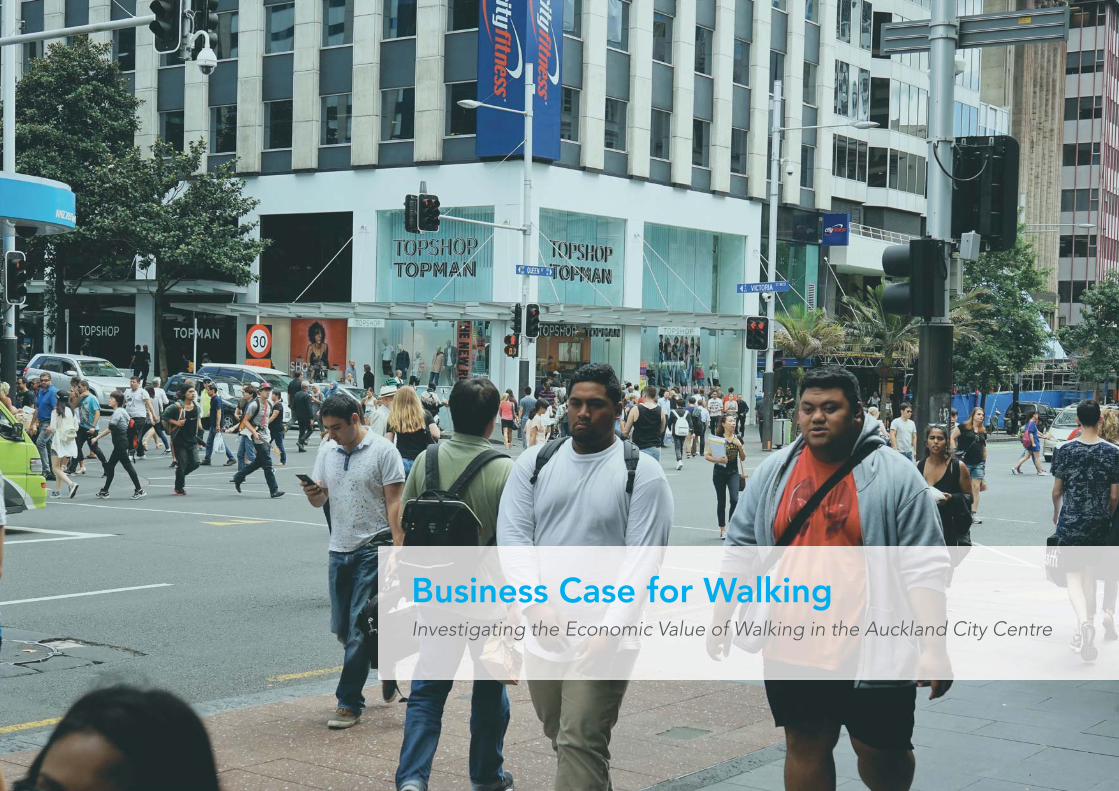
Business Case for Walking Investigating the Economic Value of Walking in the Auckland City Centre
Transcript of Business Case Walking - Auckland Council
Business Case for WalkingInvestigating the Economic Value of Walking in the Auckland City Centre
Business Case for Walking | City Centre Transport Trends
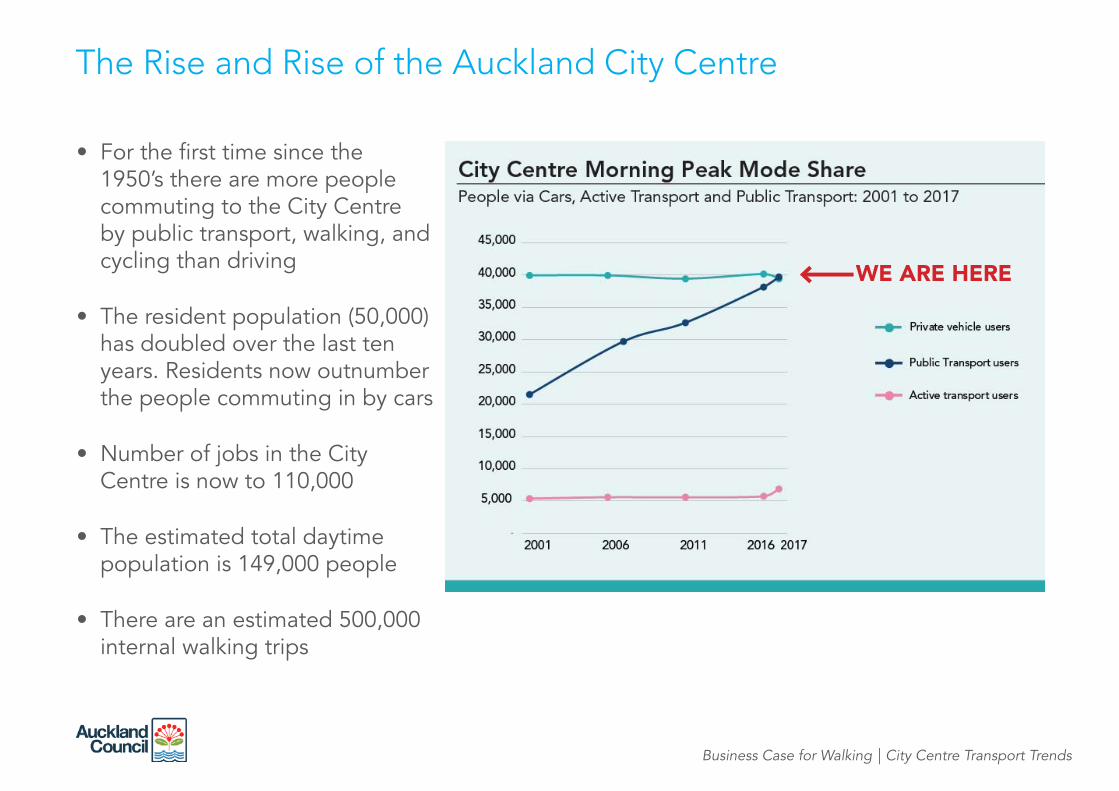
• For the fi rst time since the 1950’s there are more people commuting to the City Centre by public transport, walking, and cycling than driving
• The resident population (50,000) has doubled over the last ten years. Residents now outnumber the people commuting in by cars
• Number of jobs in the City Centre is now to 110,000
• The estimated total daytime population is 149,000 people
• There are an estimated 500,000 internal walking trips
The Rise and Rise of the Auckland City Centre
WE ARE HERE
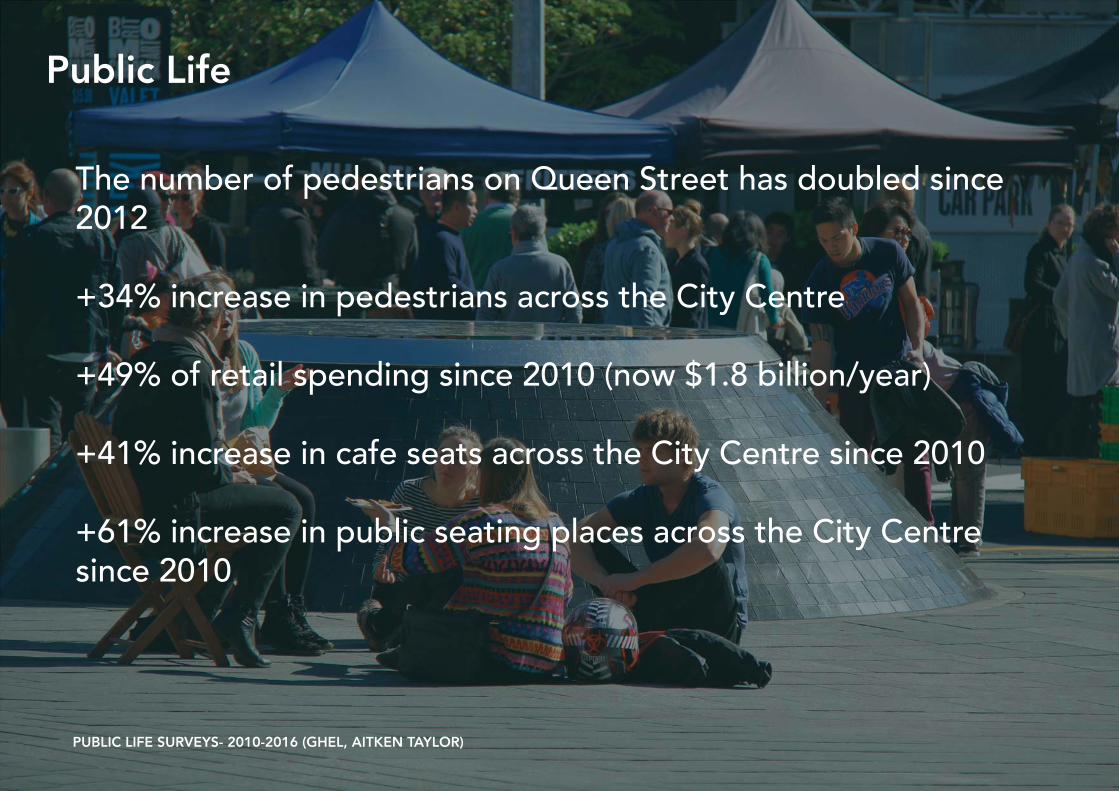
The number of pedestrians on Queen Street has doubled since 2012
+34% increase in pedestrians across the City Centre
+49% of retail spending since 2010 (now $1.8 billion/year)
+41% increase in cafe seats across the City Centre since 2010
+61% increase in public seating places across the City Centresince 2010
PUBLIC LIFE SURVEYS- 2010-2016 (GHEL, AITKEN TAYLOR)
Public Life
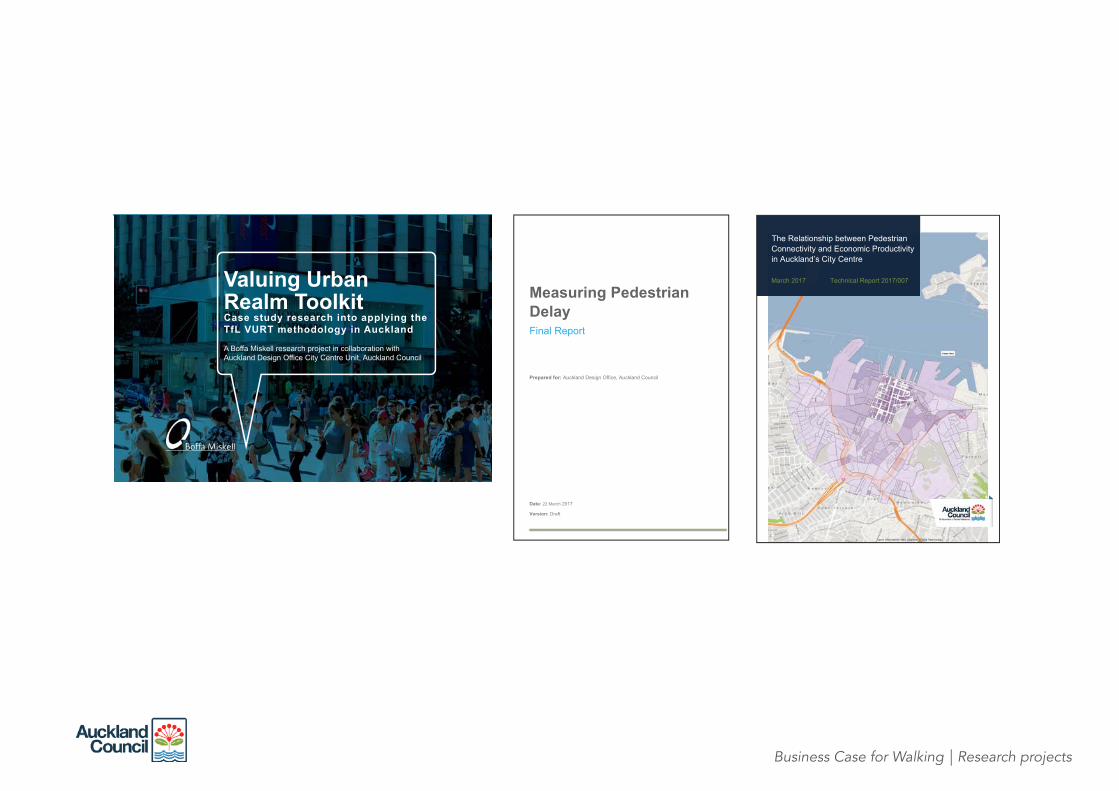
Business Case for Walking | Research projects
The Relationship between Pedestrian Connectivity and Economic Productivityin Auckland’s City Centre
March 2017 Technical Report 2017/007Valuing Urban Realm ToolkitCase study research into applying the TfL VURT methodology in Auckland
Date: 22 March 2017
Version: Draft
Measuring Pedestrian Delay Final Report
Prepared for: Auckland Design Office, Auckland Council
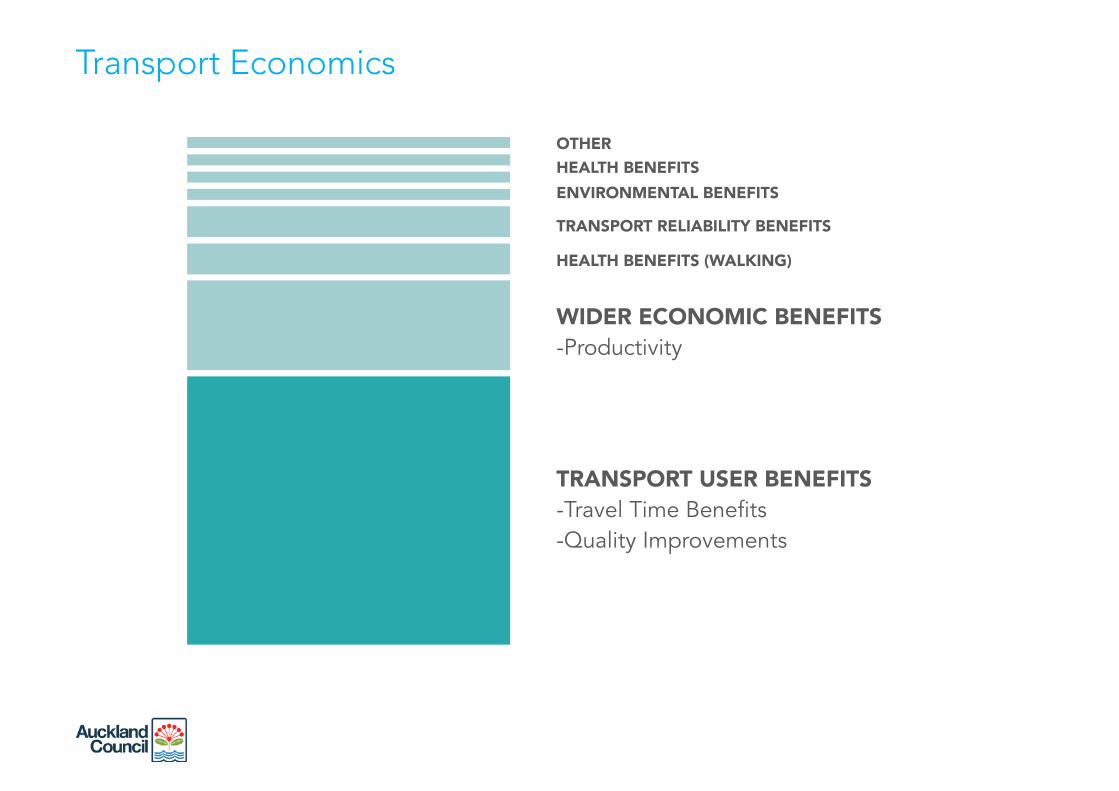
TRANSPORT USER BENEFITS-Travel Time Benefi ts-Quality Improvements
WIDER ECONOMIC BENEFITS-Productivity
HEALTH BENEFITS (WALKING)
TRANSPORT RELIABILITY BENEFITS
ENVIRONMENTAL BENEFITS
HEALTH BENEFITSOTHER
Transport Economics

Business Case for Walking | VURT
• Methodology created and used by Transport for London
• Objective, evidence-based justifi cations for investment in public realm
• Quantifi es user benefi ts
• Comparative before & after evaluation
• Measures & compares changes in public realm quality
• Link and space values: moving through, lingering, and sitting
Valuing the Urban Realm (VURT)Estimating the user benefi ts from public realm investment
Valuing Urban Realm ToolkitCase study research into applying the TfL VURT methodology in Auckland
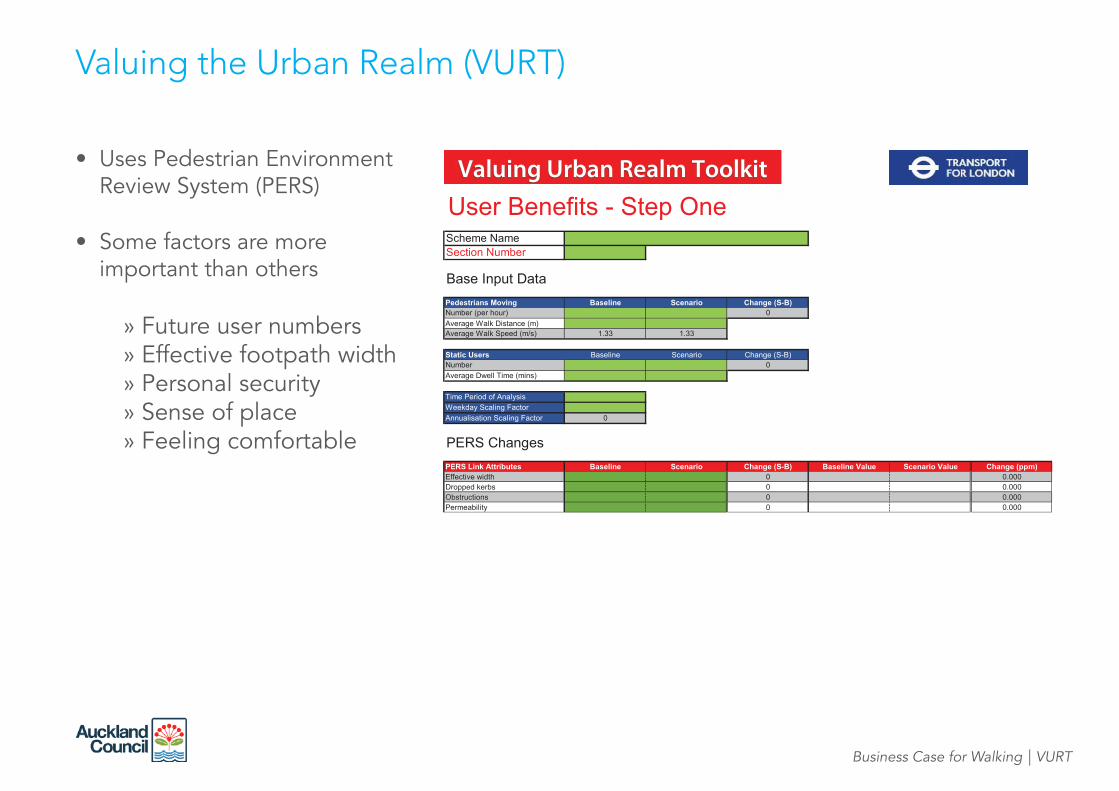
Valuing the Urban Realm (VURT)
User Benefits - Step OneScheme NameSection Number
Base Input DataPedestrians Moving Baseline Scenario Change (S-B)Number (per hour) 0Average Walk Distance (m)Average Walk Speed (m/s) 1.33 1.33
Static Users Baseline Scenario Change (S-B)Number 0Average Dwell Time (mins)
Time Period of AnalysisWeekday Scaling FactorAnnualisation Scaling Factor 0
PERS ChangesPERS Link Attributes Baseline Scenario Change (S-B) Baseline Value Scenario Value Change (ppm)Effective width 0 0.000Dropped kerbs 0 0.000Obstructions 0 0.000Permeability 0 0.000
U B fit St OValuing Urban Realm Toolkit• Uses Pedestrian Environment
Review System (PERS)
• Some factors are more important than others
» Future user numbers » Effective footpath width » Personal security » Sense of place » Feeling comfortable
Business Case for Walking | VURT

Karangahape Road Scenario 1A••••
A Valuing of the Urban Realm Toolkit for Auckland |
Karangahape Road Scenario 2A••••
A Valuing of the Urban Realm Toolkit for Auckland |
Business Case for Walking | VURT
Valuing the Urban Realm (VURT)
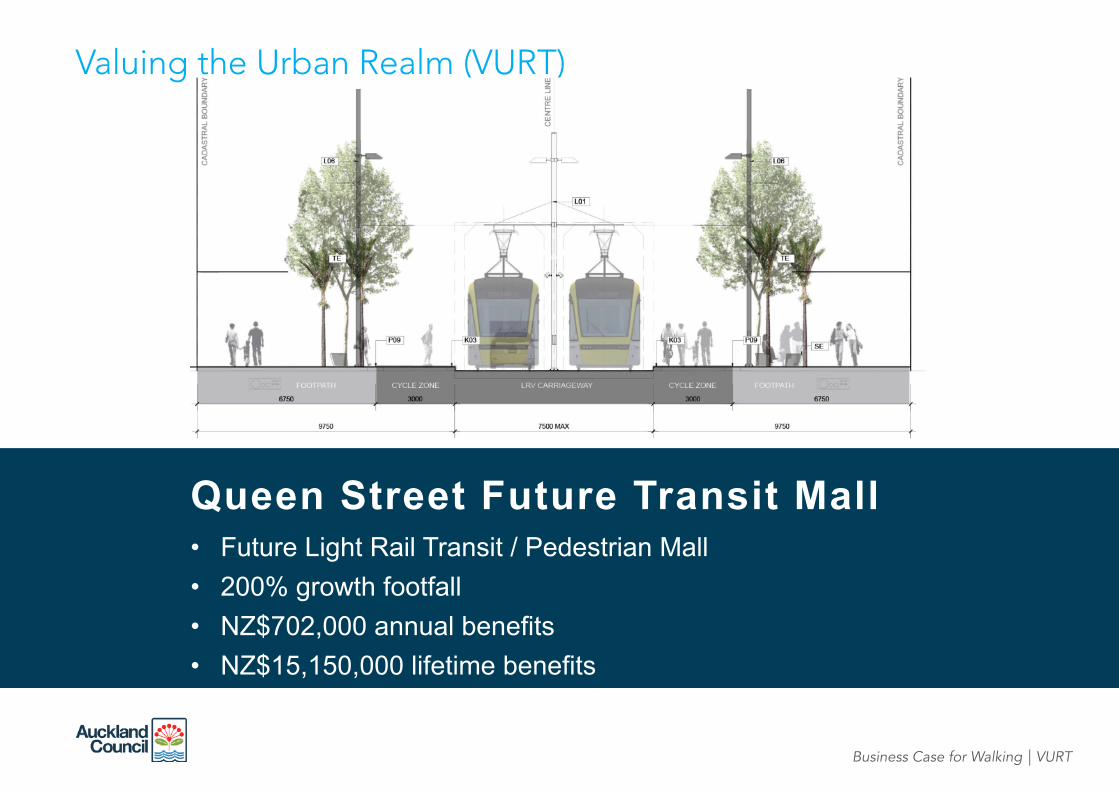
Valuing the Urban Realm (VURT)
Business Case for Walking | VURT
Queen Street Future Transit Mall••••
* MARKETVIEW
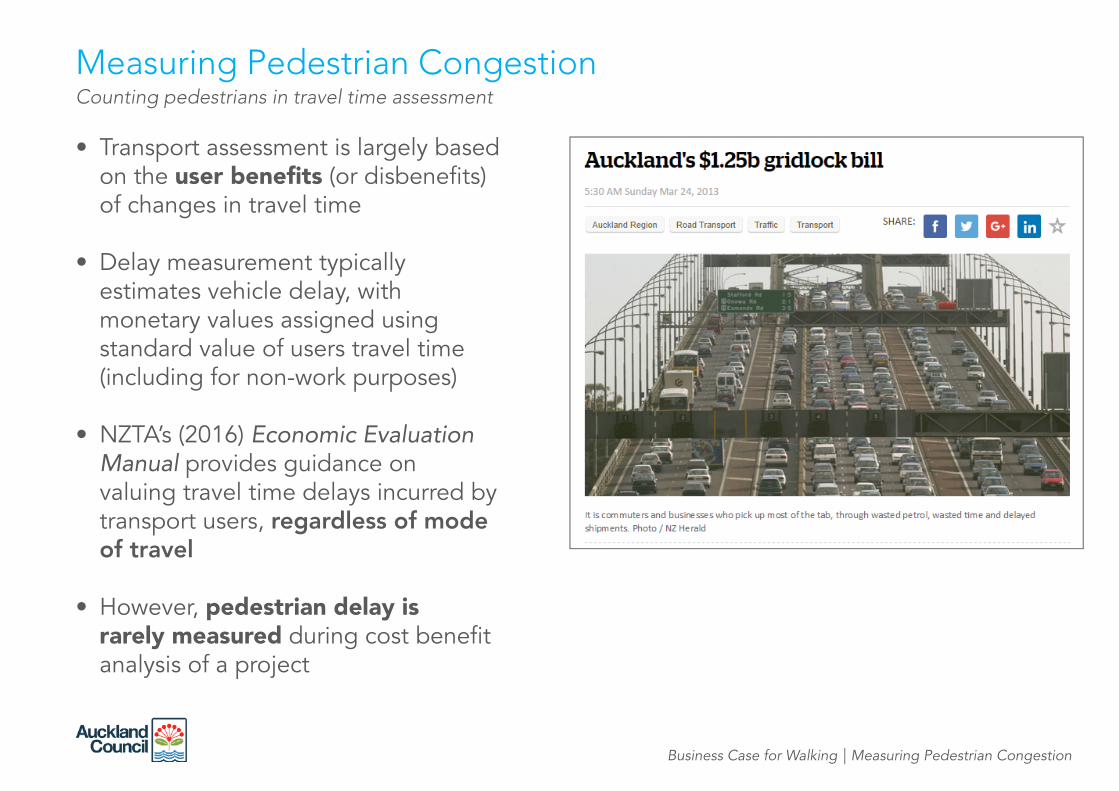
Measuring Pedestrian CongestionCounting pedestrians in travel time assessment
• Transport assessment is largely based on the user benefi ts (or disbenefi ts) of changes in travel time
• Delay measurement typically estimates vehicle delay, with monetary values assigned using standard value of users travel time (including for non-work purposes)
• NZTA’s (2016) Economic Evaluation Manual provides guidance on valuing travel time delays incurred by transport users, regardless of mode of travel
• However, pedestrian delay is rarely measured during cost benefi t analysis of a project
Business Case for Walking | Measuring Pedestrian Congestion
Business Case for Walking | Measuring Pedestrian Congestion
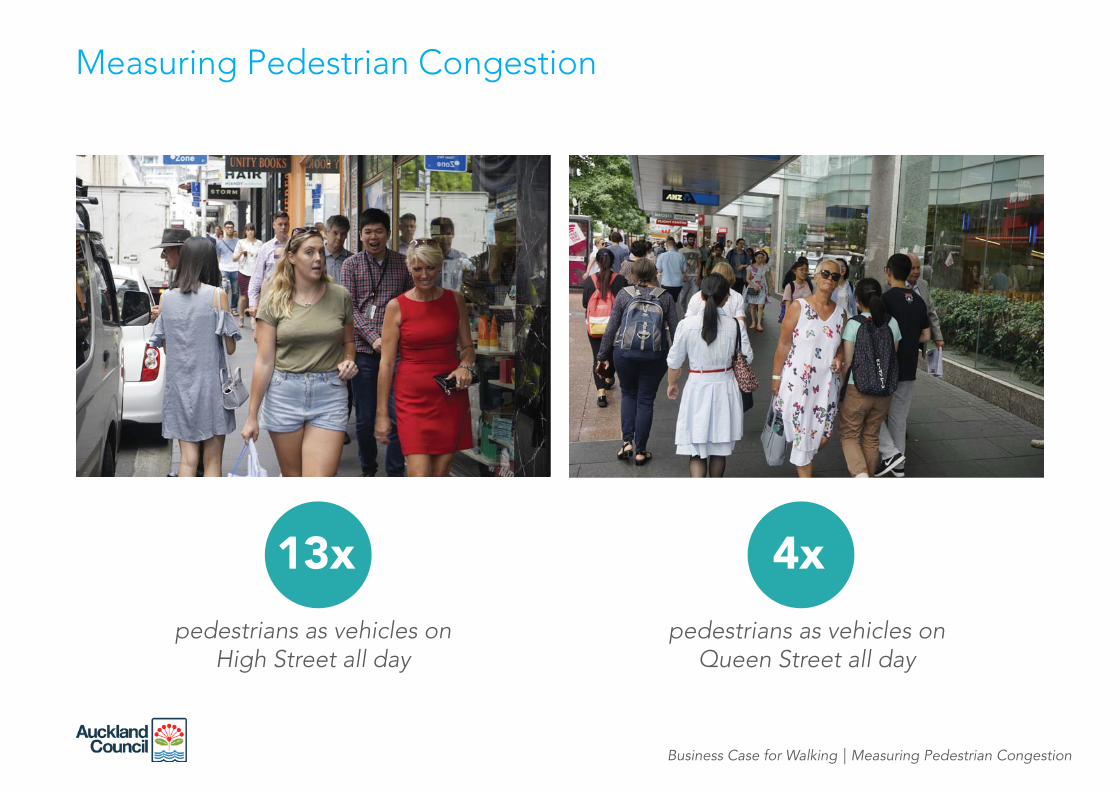
pedestrians as vehicles on High Street all day
pedestrians as vehicles on Queen Street all day
Measuring Pedestrian Congestion
13x 4x
Business Case for Walking | Measuring Pedestrian Congestion
Business Case for Walking | Measuring Pedestrian Congestion
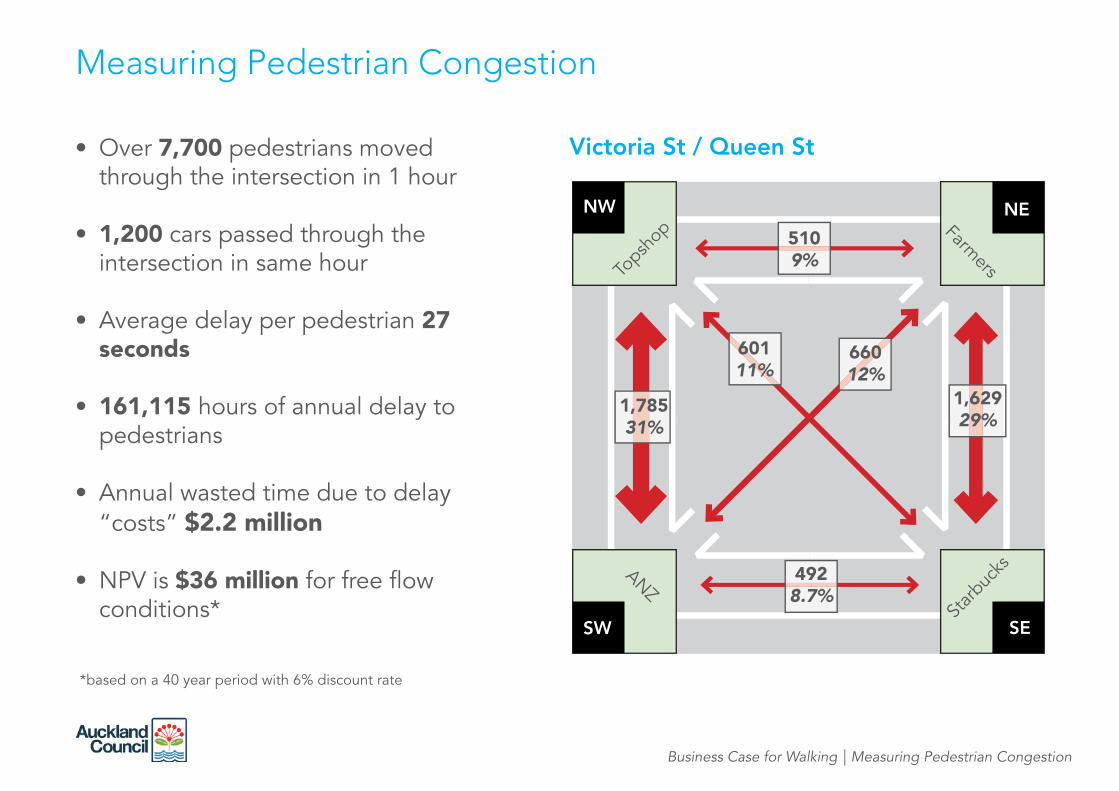
Victoria St / Queen St• Over 7,700 pedestrians moved through the intersection in 1 hour
• 1,200 cars passed through the intersection in same hour
• Average delay per pedestrian 27 seconds
• 161,115 hours of annual delay to pedestrians
• Annual wasted time due to delay “costs” $2.2 million
• NPV is $36 million for free fl ow conditions*
*based on a 40 year period with 6% discount rate
NW NE
SW SE
Topsh
op
ANZ
Farmers
Starb
ucks
1,78531%
4928.7%
1,62929%
5109%
66012%
60111%
Measuring Pedestrian Congestion
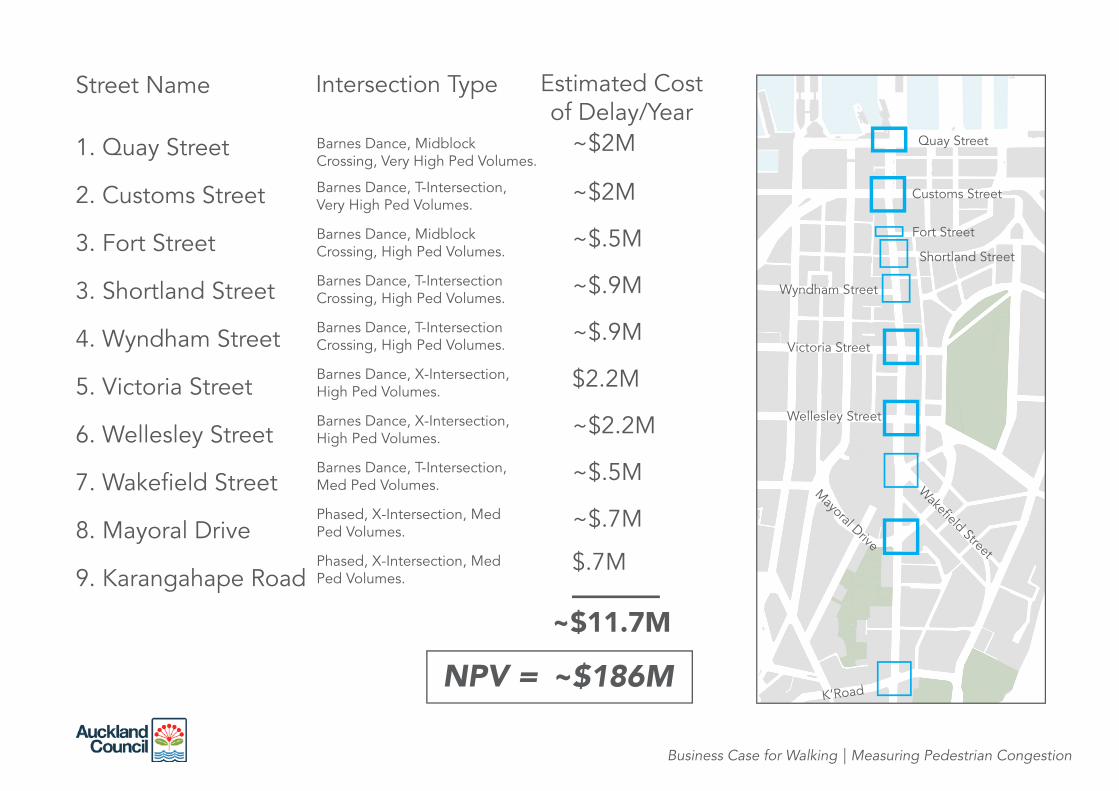
1. Quay Street
2. Customs Street
3. Fort Street
3. Shortland Street
4. Wyndham Street
5. Victoria Street
6. Wellesley Street
7. Wakefi eld Street
8. Mayoral Drive
9. Karangahape Road
Street Name Intersection Type Estimated Cost of Delay/Year
Barnes Dance, Midblock Crossing, Very High Ped Volumes.
Barnes Dance, T-Intersection, Very High Ped Volumes.
Barnes Dance, Midblock Crossing, High Ped Volumes.
Barnes Dance, T-Intersection Crossing, High Ped Volumes.
Barnes Dance, T-Intersection Crossing, High Ped Volumes.
Barnes Dance, X-Intersection, High Ped Volumes.
Barnes Dance, X-Intersection, High Ped Volumes.
Barnes Dance, T-Intersection, Med Ped Volumes.
Phased, X-Intersection, Med Ped Volumes.
Phased, X-Intersection, Med Ped Volumes.
~$2M
~$2M
~$.5M
~$.9M
~$.9M
$2.2M
~$2.2M
~$.5M
$.7M
~$.7M
~$11.7M
Business Case for Walking | Measuring Pedestrian Congestion
Quay Street
Customs Street
Fort Street
Shortland Street
Wyndham Street
Victoria Street
Wellesley Street
Wakefi eld Street
K’Road
Mayoral Drive
~$186MNPV =
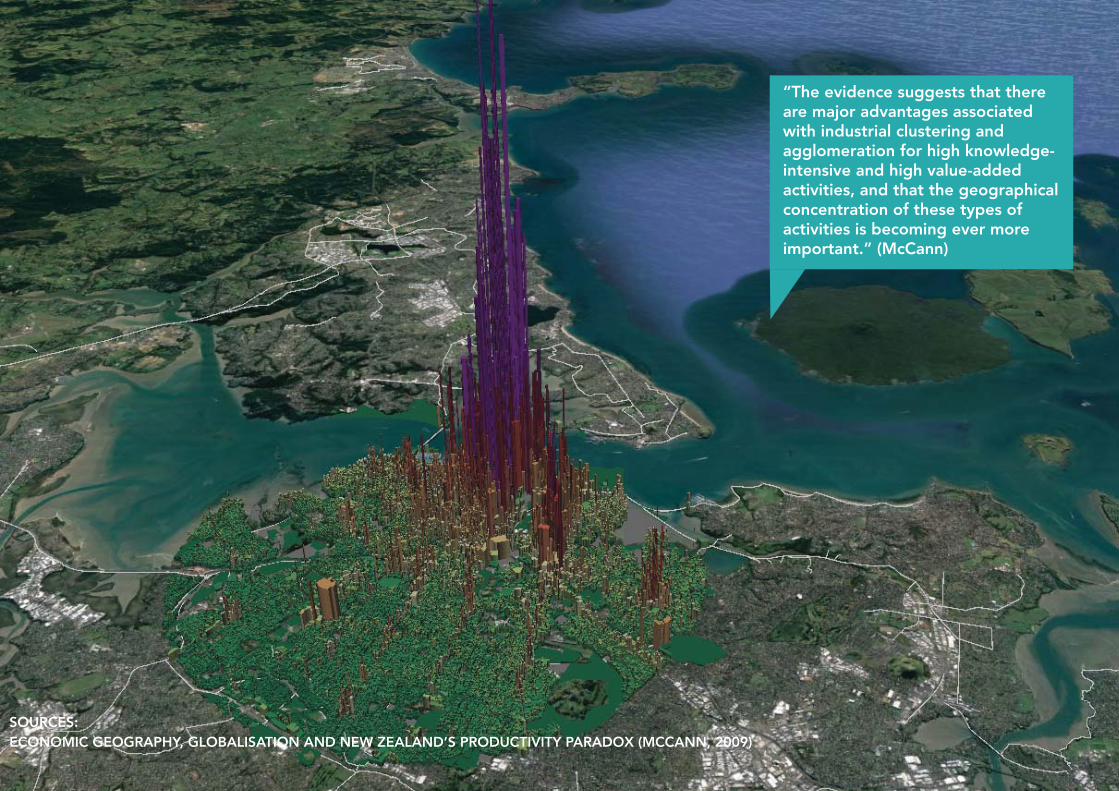
“The evidence suggests that there are major advantages associated with industrial clustering and agglomeration for high knowledge-intensive and high value-added activities, and that the geographical concentration of these types of activities is becoming ever more important.” (McCann)
SOURCES: ECONOMIC GEOGRAPHY, GLOBALISATION AND NEW ZEALAND’S PRODUCTIVITY PARADOX (MCCANN, 2009)
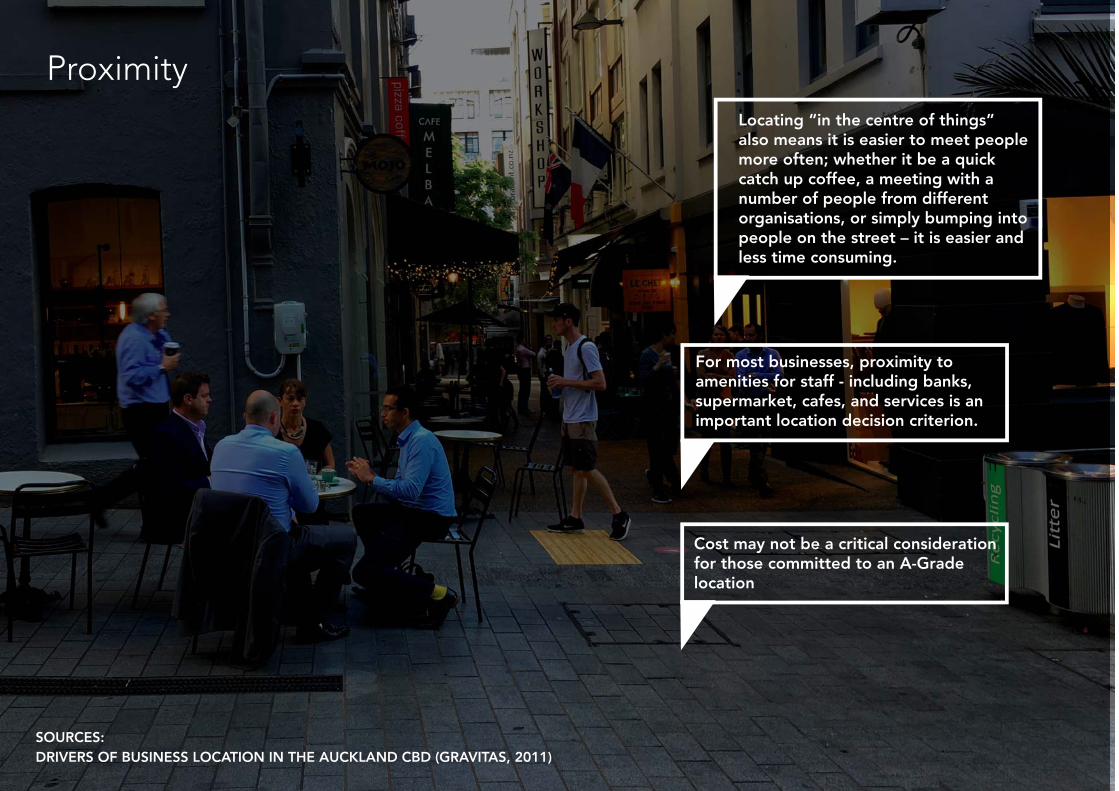
Locating “in the centre of things” also means it is easier to meet people more often; whether it be a quick catch up coffee, a meeting with a number of people from different organisations, or simply bumping into people on the street – it is easier and less time consuming.
Proximity
SOURCES: DRIVERS OF BUSINESS LOCATION IN THE AUCKLAND CBD (GRAVITAS, 2011)
Cost may not be a critical consideration for those committed to an A-Grade location
For most businesses, proximity to amenities for staff - including banks, supermarket, cafes, and services is an important location decision criterion.
Business Case for Walking | Pedestrian Connectivity and Economic Productivity
Pedestrian Connectivity and Economic Productivity
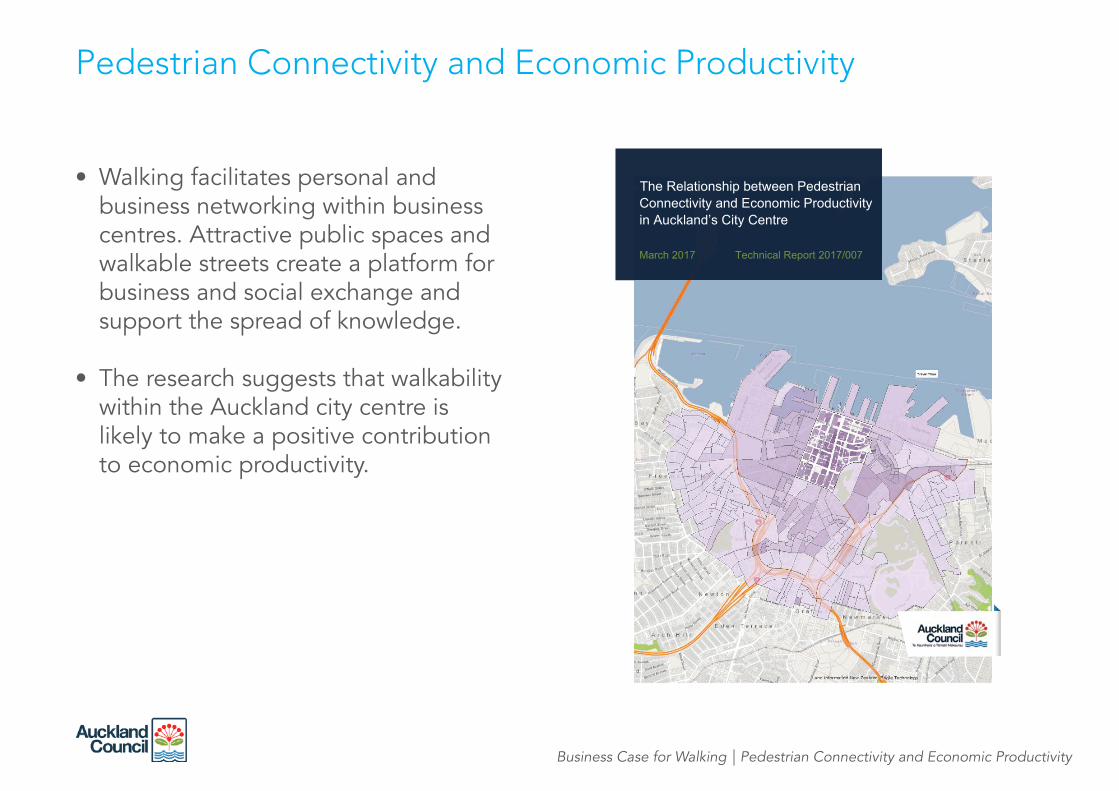
The Relationship between Pedestrian Connectivity and Economic Productivityin Auckland’s City Centre
March 2017 Technical Report 2017/007
• Walking facilitates personal and business networking within business centres. Attractive public spaces and walkable streets create a platform for business and social exchange and support the spread of knowledge.
• The research suggests that walkability within the Auckland city centre is likely to make a positive contribution to economic productivity.
Business Case for Walking | Pedestrian Connectivity and Economic Productivity
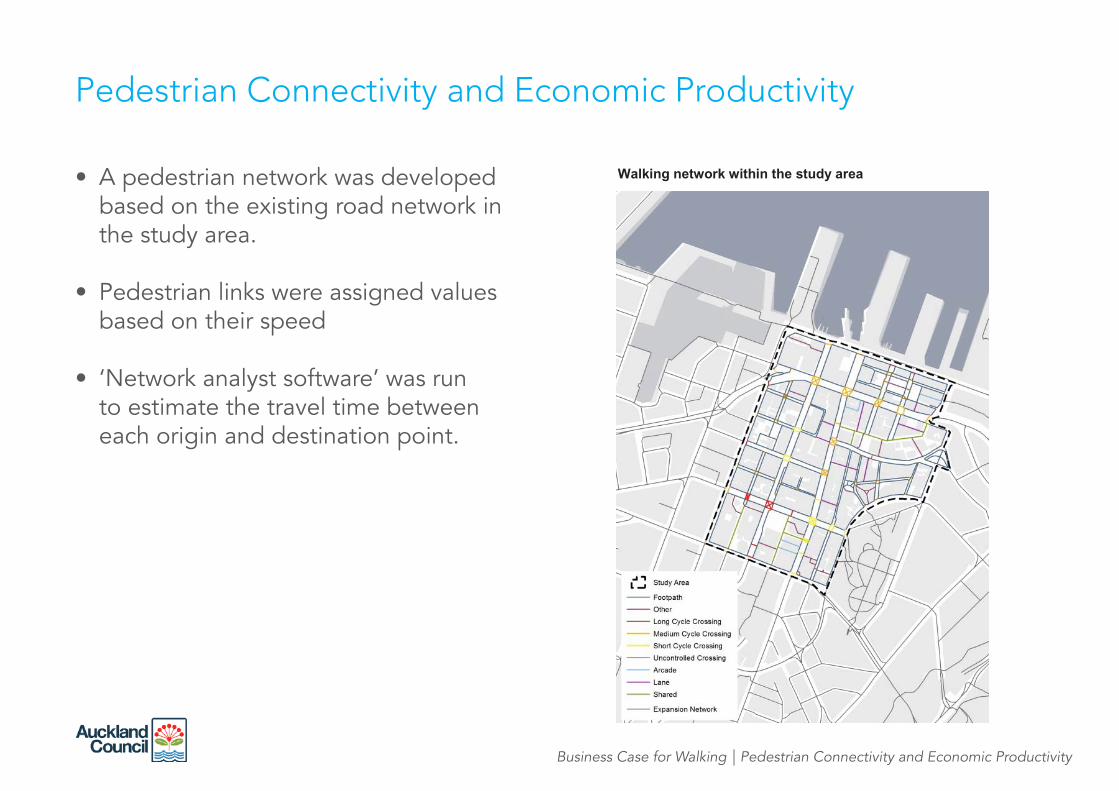
• A pedestrian network was developed based on the existing road network in the study area.
• Pedestrian links were assigned values based on their speed
• ‘Network analyst software’ was run to estimate the travel time between each origin and destination point.
Pedestrian Connectivity and Economic Productivity
Walking network within the study area
Business Case for Walking | Pedestrian Connectivity and Economic Productivity
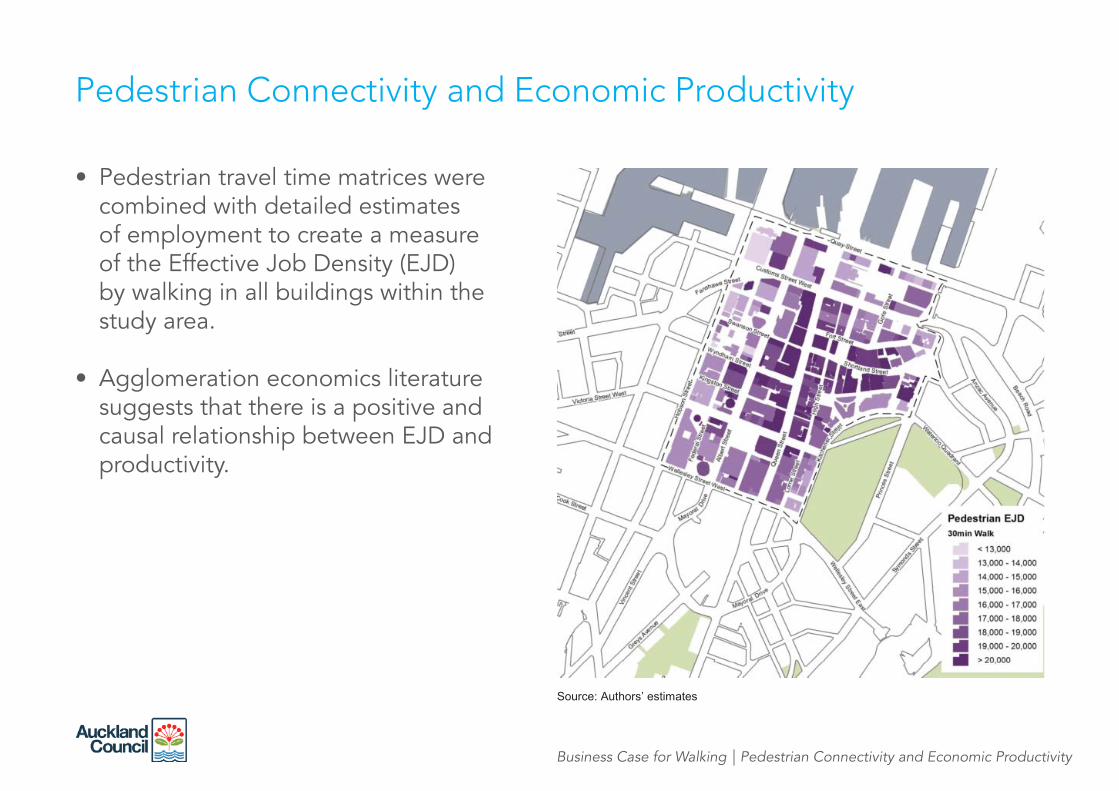
• Pedestrian travel time matrices were combined with detailed estimates of employment to create a measure of the Effective Job Density (EJD) by walking in all buildings within the study area.
• Agglomeration economics literature suggests that there is a positive and causal relationship between EJD and productivity.
Source: Authors’ estimates
Pedestrian Connectivity and Economic Productivity

Business Case for Walking | Pedestrian Connectivity and Economic Productivity\
• A proxy measure for labour productivity was estimated based on detailed data on average annual wages from Statistics NZ’s Data (2015).
• The point estimate suggests that a 10 per cent increase in walking EJD is associated with a 5.3 per cent increase in productivity.
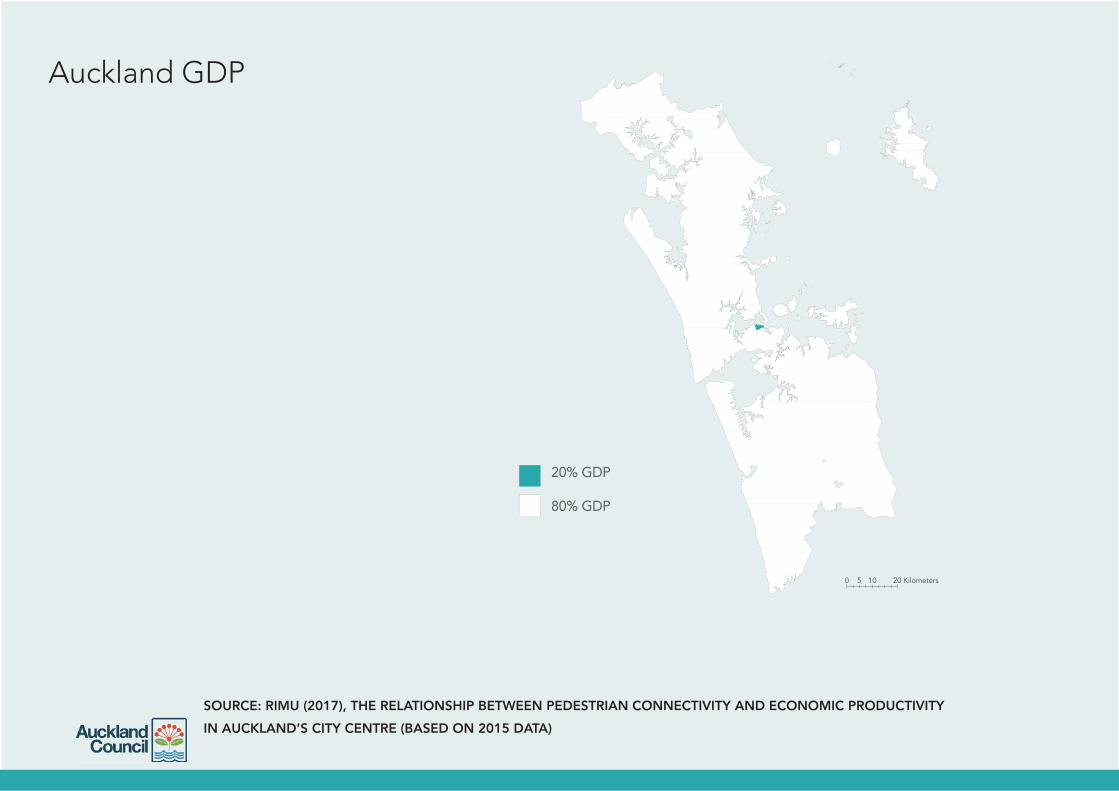
• This means that a 1% increase in walking EJD will increase the value of economy of the study area by 0.53% or approximately $42 million based on the authors’ estimate of $8.01 billion GDP for the study area.
Figure 19: The association between walking EJD and labour productivity
Source: Authors’ estimates
Pedestrian Connectivity and Economic Productivity
Business Case for WalkingInvestigating the Economic Value of Walking in the Auckland City Centre
Pedestrian Connectivity and Economic Productivity
• Scenario Testing placeholder
0 5 10 20 Kilometers
20% GDP
80% GDP
SOURCE: RIMU (2017), THE RELATIONSHIP BETWEEN PEDESTRIAN CONNECTIVITY AND ECONOMIC PRODUCTIVITY
IN AUCKLAND’S CITY CENTRE (BASED ON 2015 DATA)
Auckland GDP
Total IndustriesAgriculture, Forestry and Fishing
ConstructionManufacturing
Electricity, Gas, Water and Waste ...Health Care and Social Assistance
Retail TradeWholesale Trade
Other ServicesTransport, Postal and Warehouse
MiningEducation and Training
Administrative and Support ServicesRental, Hiring and Real Estate ...
Accommodation and Food ServicesArts and Recreation Services
Public Administration and SafetyProfessional, Scientific and ...
Information, Media and ...Financial and Insurance Services ...
0% 10% 20% 30% 40% 50% 60% 70%
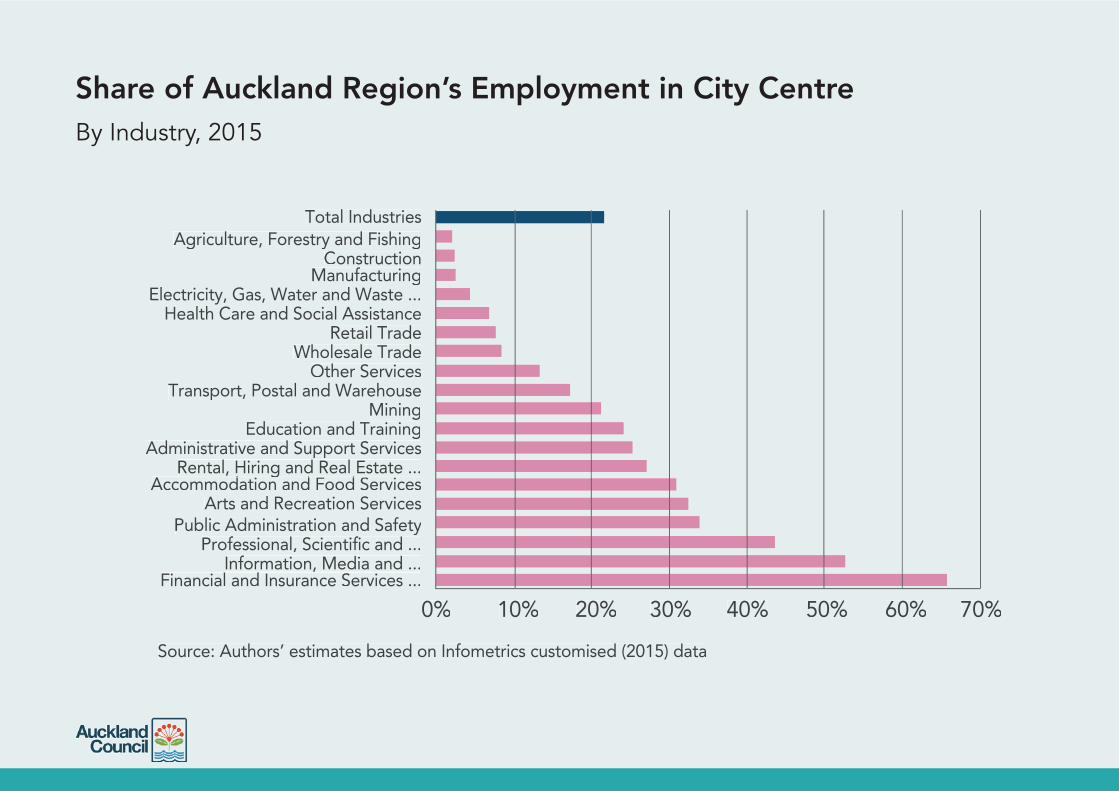
Source: Authors’ estimates based on Infometrics customised (2015) data
Total IndustriesAgriculture, Forestry and Fishing
ConstructionManufacturing
Electricity, Gas, Water and Waste ...Health Care and Social Assistance
Retail TradeWholesale Trade
Other ServicesTransport, Postal and Warehouse
MiningEducation and Training
Administrative and Support ServicesRental, Hiring and Real Estate ...
Accommodation and Food Servicesgg
Arts and Recreation ServicesPublic Administration and Safety
Professional, Scientific and ...Information, Media and ...
Financial and Insurance Services ...
0% 10% 20% 30% 40% 50% 60% 70%
Source: Authors’ estimates based on Infometrics customised (2015) data
Share of Auckland Region’s Employment in City CentreBy Industry, 2015
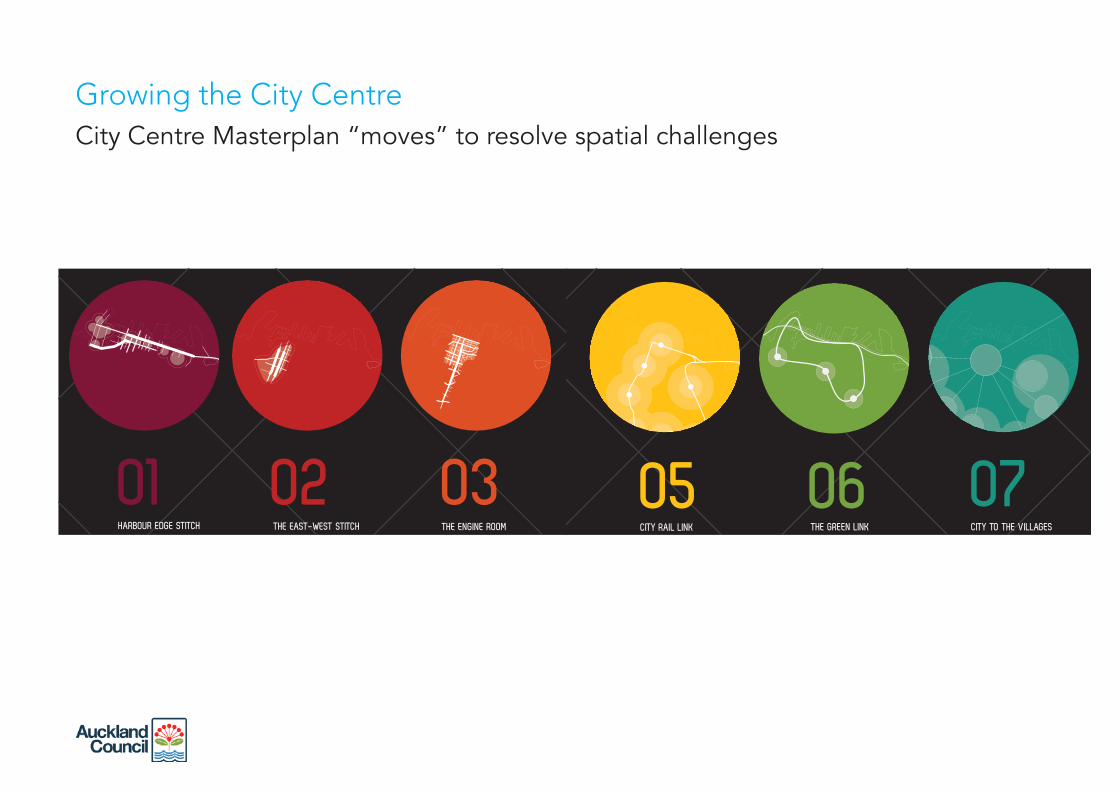
Growing the City CentreCity Centre Masterplan “moves” to resolve spatial challenges
01 02 03 HARBOUR EDGE STITCH THE EAST-WEST STITCH THE ENGINE ROOM
05 06 07CITY RAIL LINK THE GREEN LINK CITY TO THE VILLAGES
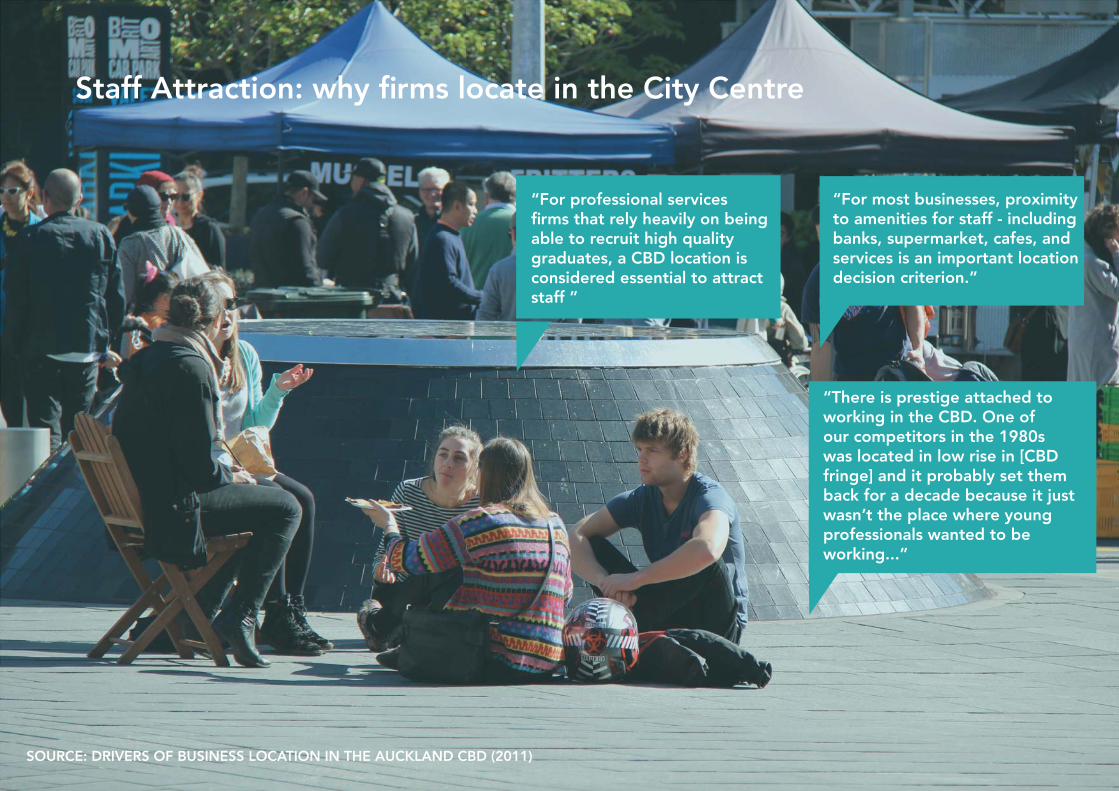
“For professional services fi rms that rely heavily on being able to recruit high quality graduates, a CBD location is considered essential to attract staff ”
“For most businesses, proximity to amenities for staff - including banks, supermarket, cafes, and services is an important location decision criterion.”
“There is prestige attached to working in the CBD. One of our competitors in the 1980s was located in low rise in [CBD fringe] and it probably set them back for a decade because it just wasn’t the place where young professionals wanted to be working...”
SOURCE: DRIVERS OF BUSINESS LOCATION IN THE AUCKLAND CBD (2011)
Staff Attraction: why fi rms locate in the City Centre