
Big Code - Profs Area Scienze ed...
33
Big Code and Security Roberto Giacobazzi
Transcript of Big Code - Profs Area Scienze ed...

Big Codeand Security
Roberto Giacobazzi
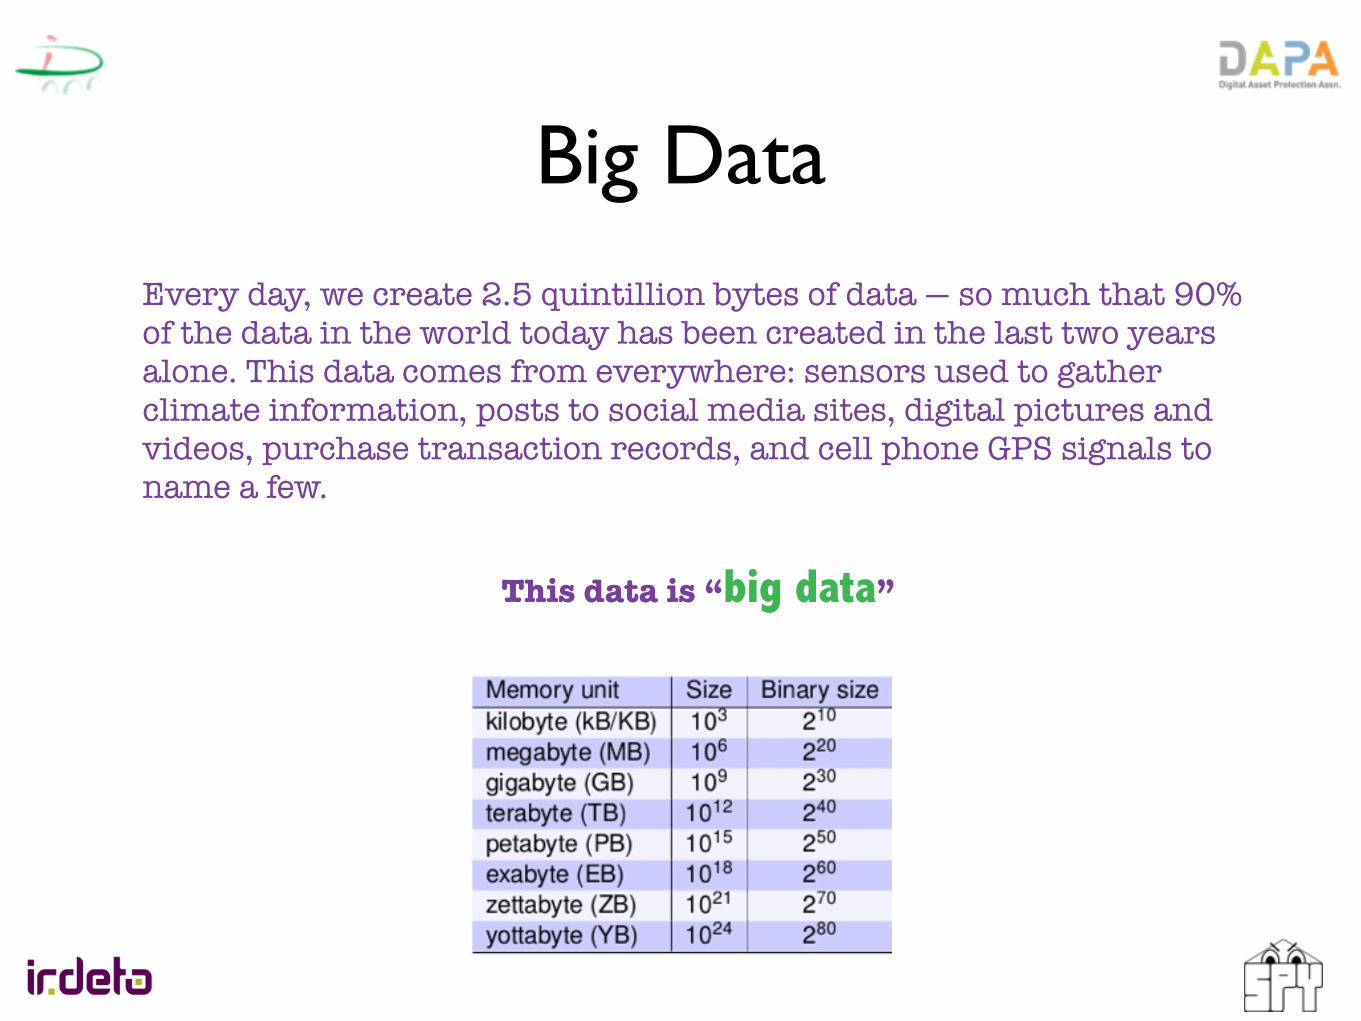
Big DataEvery day, we create 2.5 quintillion bytes of data — so much that 90% of the data in the world today has been created in the last two years alone. This data comes from everywhere: sensors used to gather climate information, posts to social media sites, digital pictures and videos, purchase transaction records, and cell phone GPS signals to name a few.
This data is “big data”
22
connected nodes in the Internet of Things—sometimes also referred to as machine-to-machine (M2M) devices—deployed in the world will grow at a rate exceeding 30 percent annually over the next five years (Exhibit 10). Some of the growth sectors are expected to be utilities as these operators install more smart meters and smart appliances; health care, as the sector deploys remote health monitoring; retail, which will eventually increase its use of radio frequency identification (RFID) tags; and the automotive industry, which will increasingly install sensors in vehicles.
Exhibit 9
The penetration of social networks is increasing online and on smartphones; frequent users are increasing as a share of total users1
SOURCE: McKinsey iConsumer Survey
1 Based on penetration of users who browse social network sites. For consistency, we exclude Twitter-specific questions (added to survey in 2009) and location-based mobile social networks (e.g., Foursquare, added to survey in 2010).
2 Frequent users defined as those that use social networking at least once a week.
Social networking penetration on the PC is slowing, but frequent users are still increasing% of respondents
Social networking penetration of smartphoneshas nearly doubled since 2008% of smartphone users
1314
12
67+11% p.a.
2010
55
2009
63
49
2008
55
41
12
14
13
57+28% p.a.
2010
44
2009
47
33
2008
35
23
65 70 7776 78 82
Frequent user2
% Frequent users
% Frequent users
Exhibit 10
Data generated from the Internet of Things will grow exponentially as the number of connected nodes increases
SOURCE: Analyst interviews; McKinsey Global Institute analysis
Estimated number of connected nodesMillion
Compound annual growth rate 2010–15, %
Utilities
Travel and logistics
Retail
Industrials
Energy
Health care
Security
2015
72–215
15–45
28–83
4–12
8–23
2–6
1–3
Automotive
5–14
2010
17–50
6–18
10–30
2–6 2–6
2–5
1–2
5–14
50+
50+15530
15
45
20
35
NOTE: Numbers may not sum due to rounding.
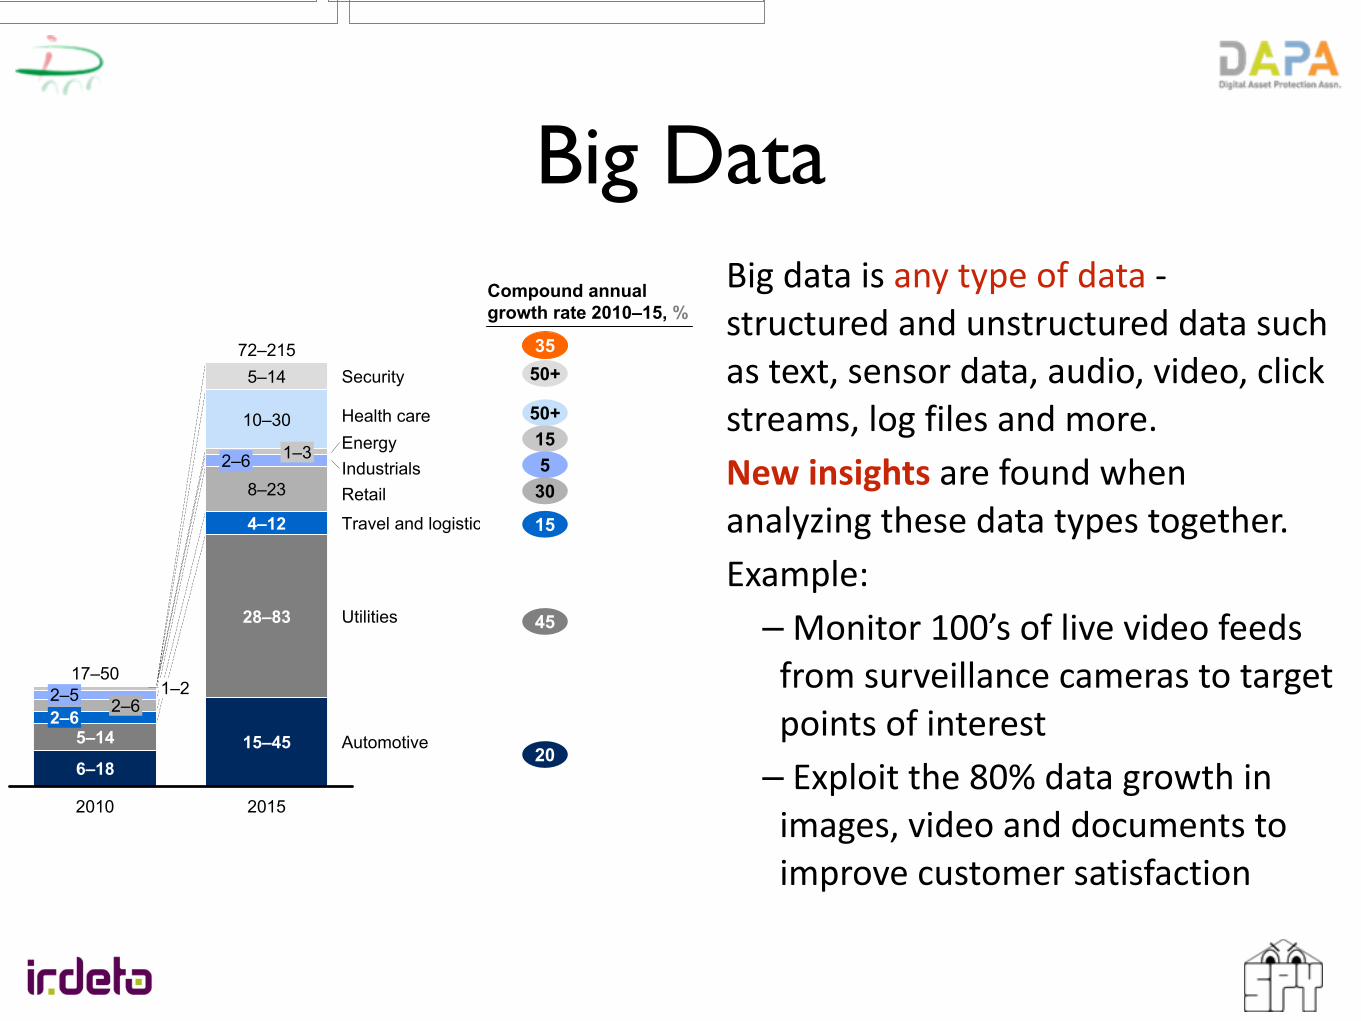
Big DataBig data is any type of data -‐ structured and unstructured data such as text, sensor data, audio, video, click streams, log files and more. New insights are found when analyzing these data types together. Example: – Monitor 100’s of live video feeds from surveillance cameras to target points of interest – Exploit the 80% data growth in images, video and documents to improve customer satisfaction
22
connected nodes in the Internet of Things—sometimes also referred to as machine-to-machine (M2M) devices—deployed in the world will grow at a rate exceeding 30 percent annually over the next five years (Exhibit 10). Some of the growth sectors are expected to be utilities as these operators install more smart meters and smart appliances; health care, as the sector deploys remote health monitoring; retail, which will eventually increase its use of radio frequency identification (RFID) tags; and the automotive industry, which will increasingly install sensors in vehicles.
Exhibit 9
The penetration of social networks is increasing online and on smartphones; frequent users are increasing as a share of total users1
SOURCE: McKinsey iConsumer Survey
1 Based on penetration of users who browse social network sites. For consistency, we exclude Twitter-specific questions (added to survey in 2009) and location-based mobile social networks (e.g., Foursquare, added to survey in 2010).
2 Frequent users defined as those that use social networking at least once a week.
Social networking penetration on the PC is slowing, but frequent users are still increasing% of respondents
Social networking penetration of smartphoneshas nearly doubled since 2008% of smartphone users
1314
12
67+11% p.a.
2010
55
2009
63
49
2008
55
41
12
14
13
57+28% p.a.
2010
44
2009
47
33
2008
35
23
65 70 7776 78 82
Frequent user2
% Frequent users
% Frequent users
Exhibit 10
Data generated from the Internet of Things will grow exponentially as the number of connected nodes increases
SOURCE: Analyst interviews; McKinsey Global Institute analysis
Estimated number of connected nodesMillion
Compound annual growth rate 2010–15, %
Utilities
Travel and logistics
Retail
Industrials
Energy
Health care
Security
2015
72–215
15–45
28–83
4–12
8–23
2–6
1–3
Automotive
5–14
2010
17–50
6–18
10–30
2–6 2–6
2–5
1–2
5–14
50+
50+15530
15
45
20
35
NOTE: Numbers may not sum due to rounding.
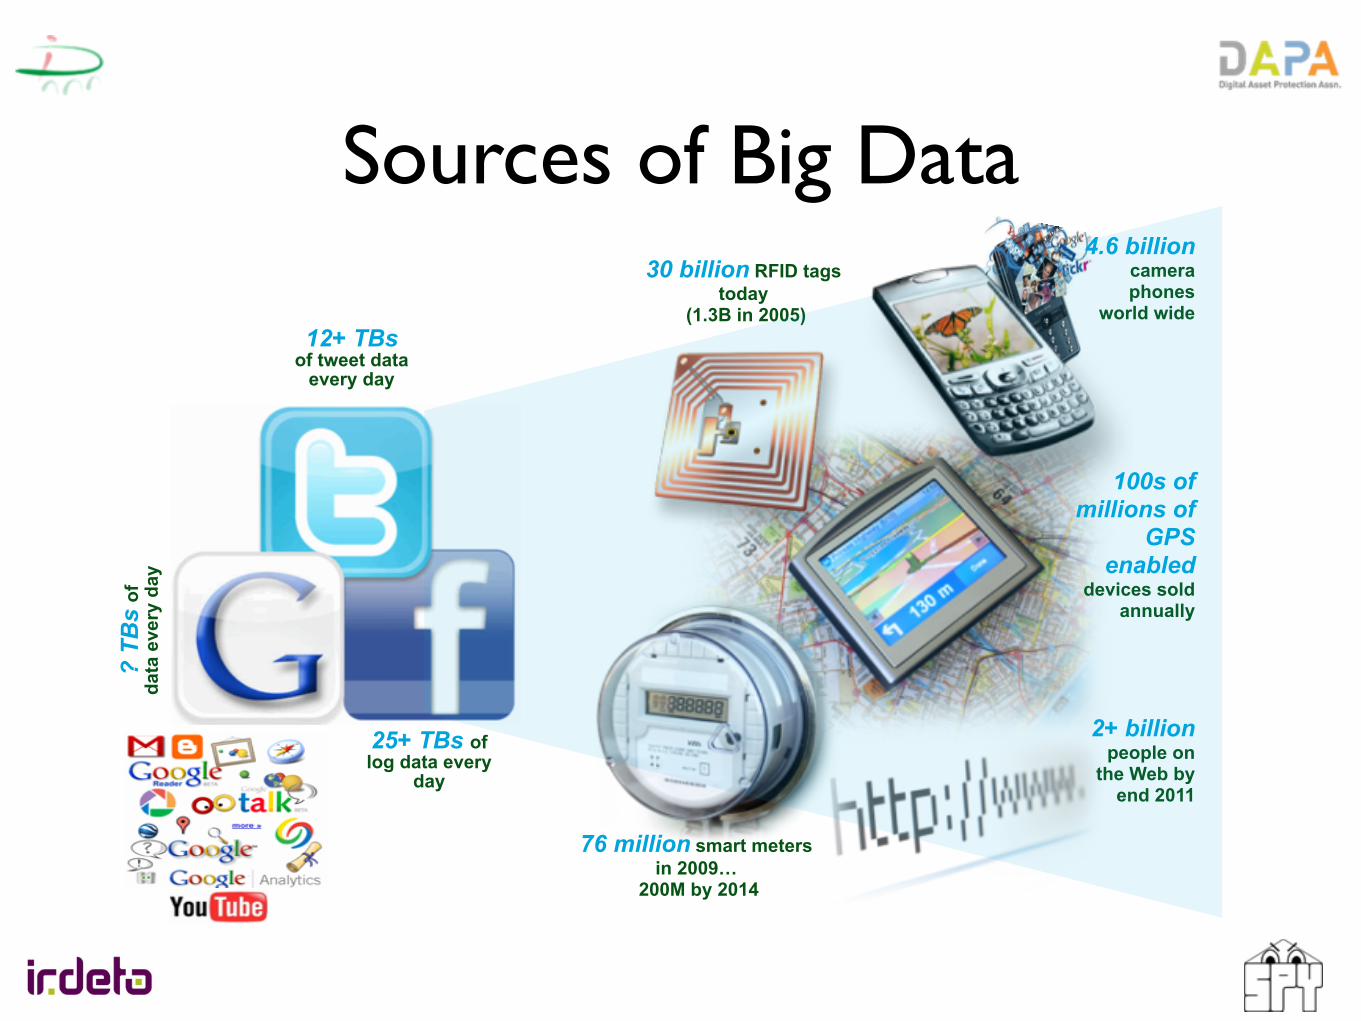
Sources of Big Data
2+ billion people on
the Web by end 2011
30 billion RFID tags today
(1.3B in 2005)
4.6 billion camera phones
world wide
100s of millions of
GPS enabled
devices sold annually
76 million smart meters in 2009…
200M by 2014
12+ TBs of tweet data
every day
25+ TBs of log data every
day
? TB
s of
data
eve
ry d
ay
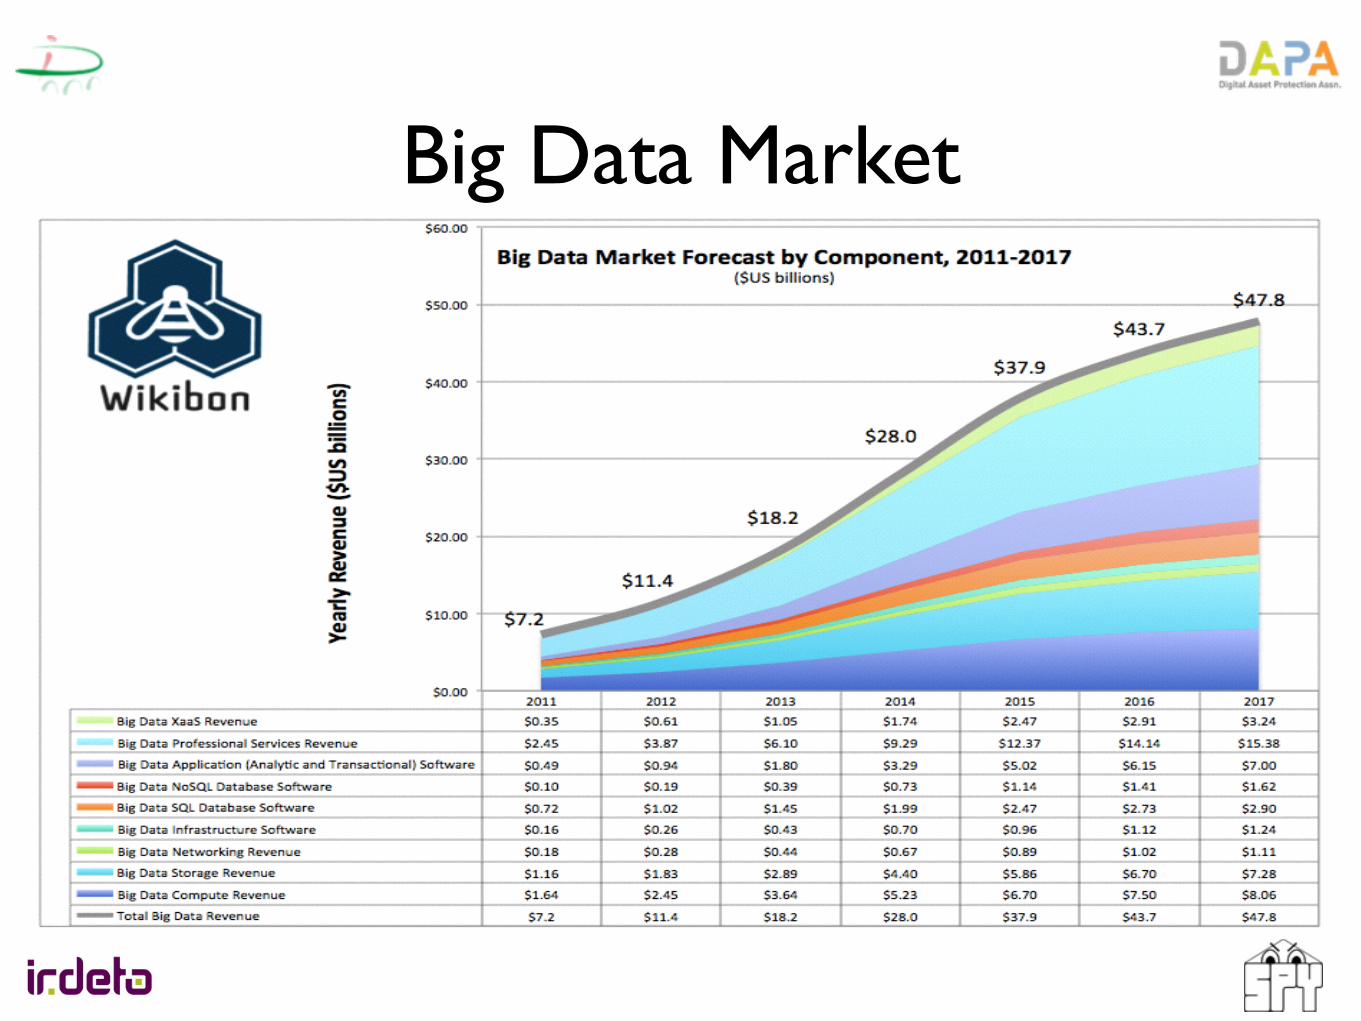
Big Data Market
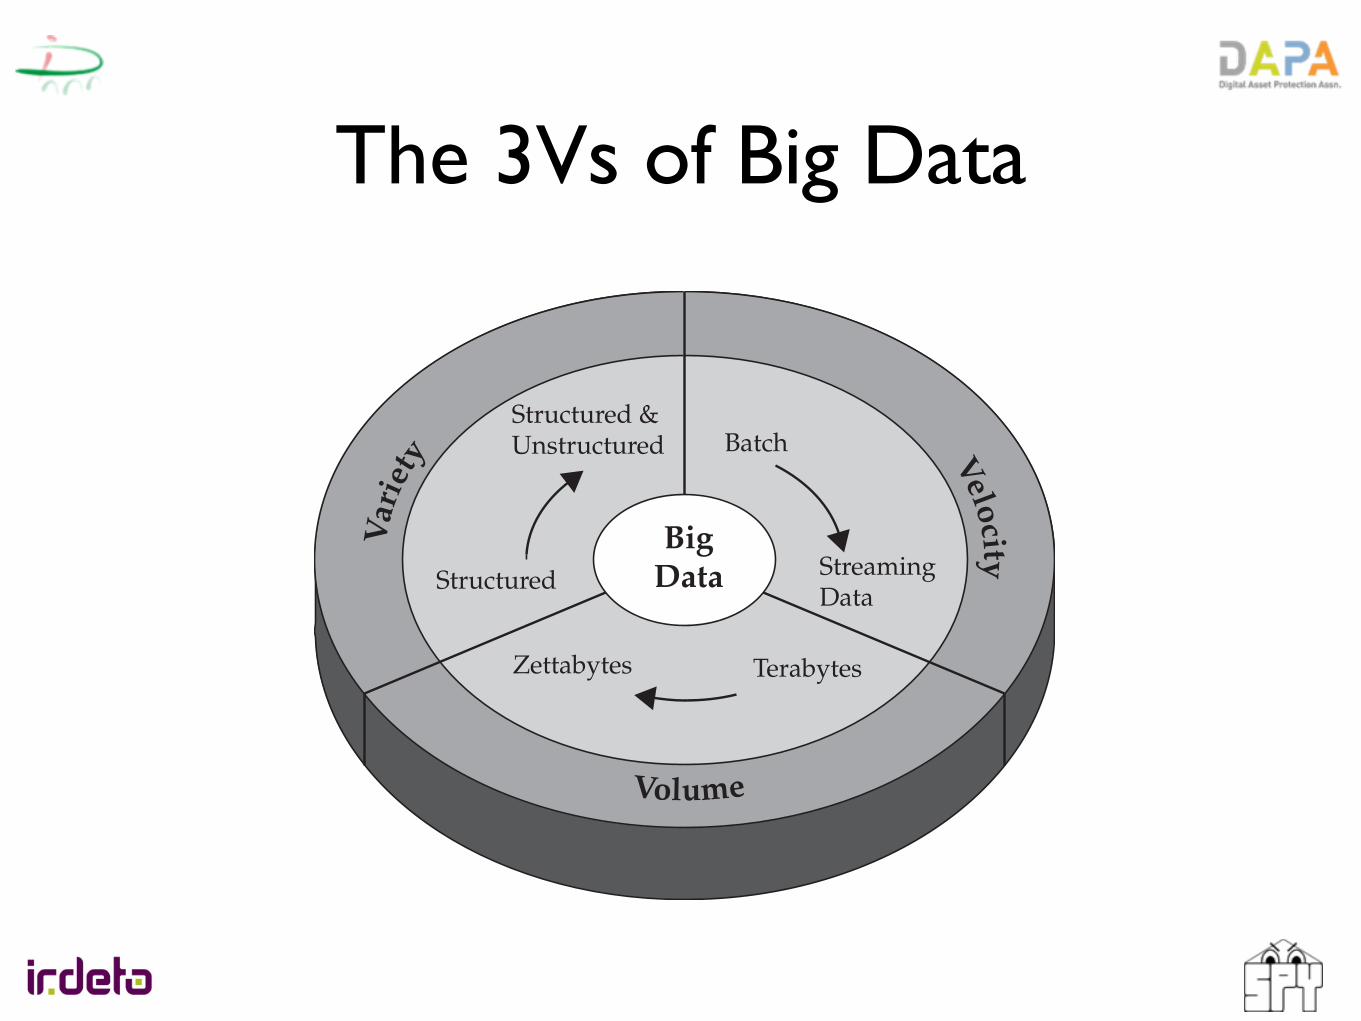
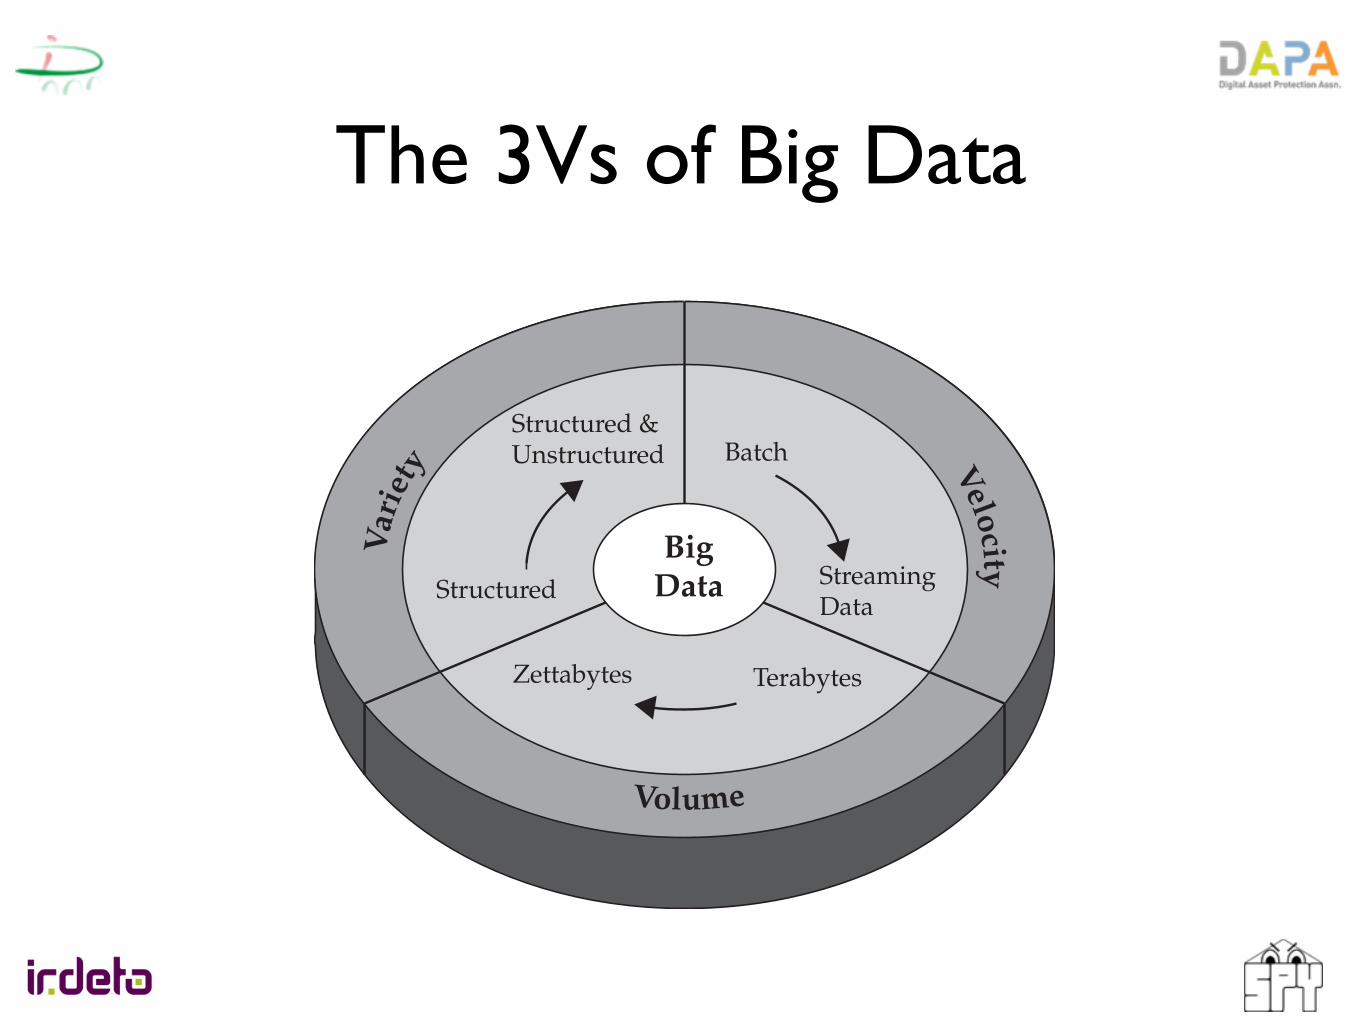
The 3Vs of Big Data
What Is Big Data? Hint: You’re a Part of It Every Day 5
Characteristics of Big DataThree characteristics define Big Data: volume, variety, and velocity (as shown in Figure 1-1). Together, these characteristics define what we at IBM refer to as “Big Data.” They have created the need for a new class of capabilities to augment the way things are done today to provide better line of site and controls over our existing knowledge domains and the ability to act on them.
The IBM Big Data platform gives you the unique opportunity to extract insight from an immense volume, variety, and velocity of data, in context, beyond what was previously possible. Let’s spend some time explicitly defining these terms.
Can There Be Enough? The Volume of DataThe sheer volume of data being stored today is exploding. In the year 2000, 800,000 petabytes (PB) of data were stored in the world. Of course, a lot of the data that’s being created today isn’t analyzed at all and that’s another prob-lem we’re trying to address with BigInsights. We expect this number to reach 35 zettabytes (ZB) by 2020. Twitter alone generates more than 7 terabytes (TB) of data every day, Facebook 10 TB, and some enterprises generate
Volume
Velocity
Var
iety
BatchStructured &Unstructured
Structured StreamingData
TerabytesZettabytes
BigData
Figure 1-1 IBM characterizes Big Data by its volume, velocity, and variety—or simply, V3.
ch01.indd 5 07/10/11 12:38 PM

Code is not Data! Structured Diversified Intensional
Big Code?
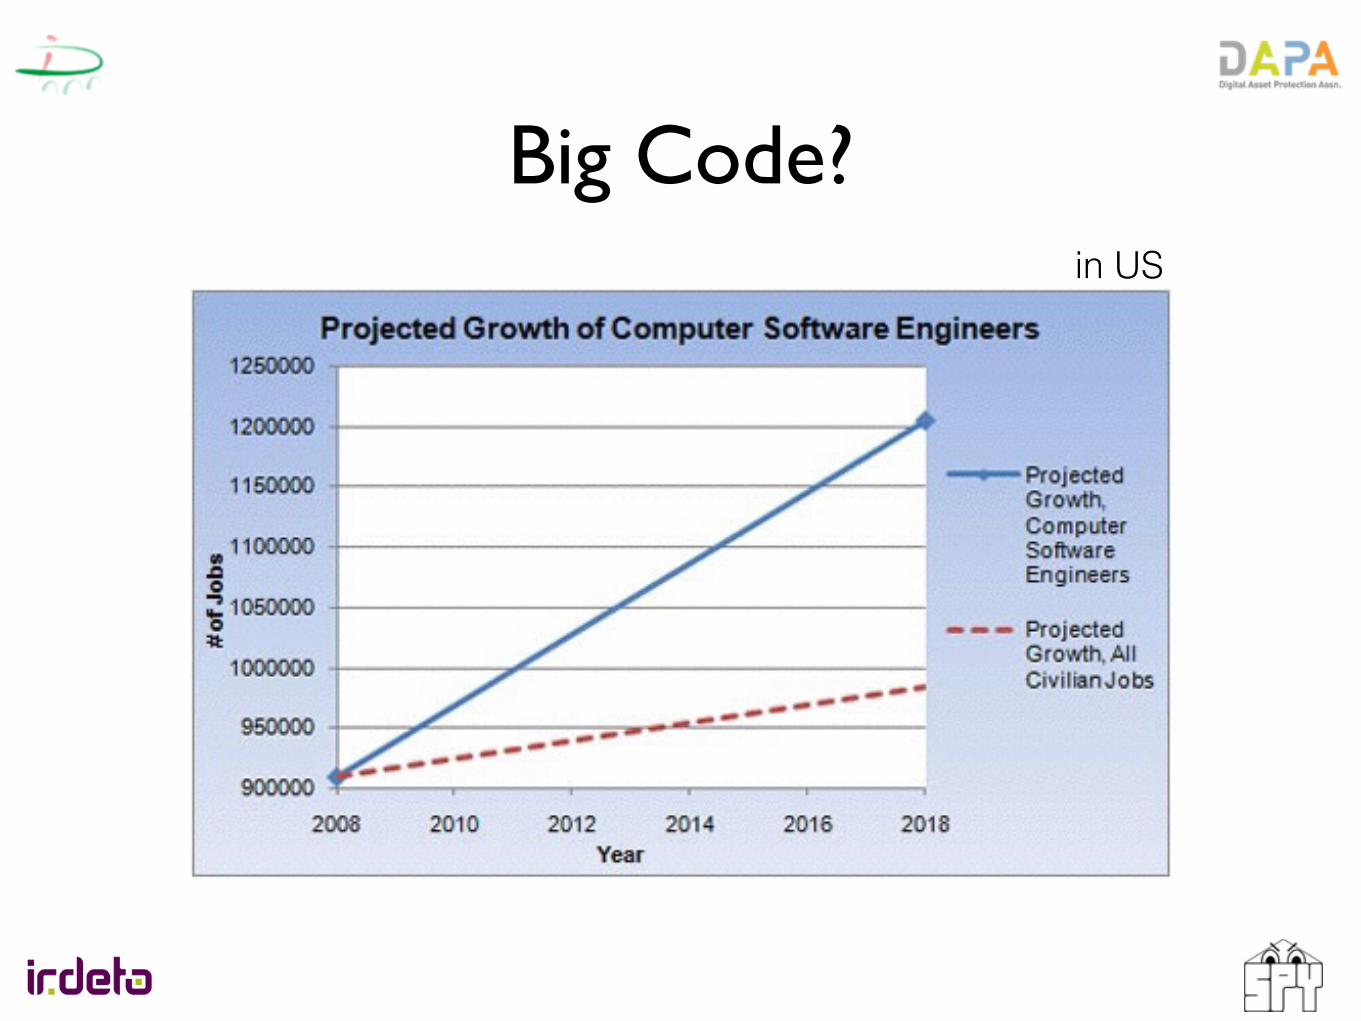
Big Code?in US

Big Code?

Big Code?
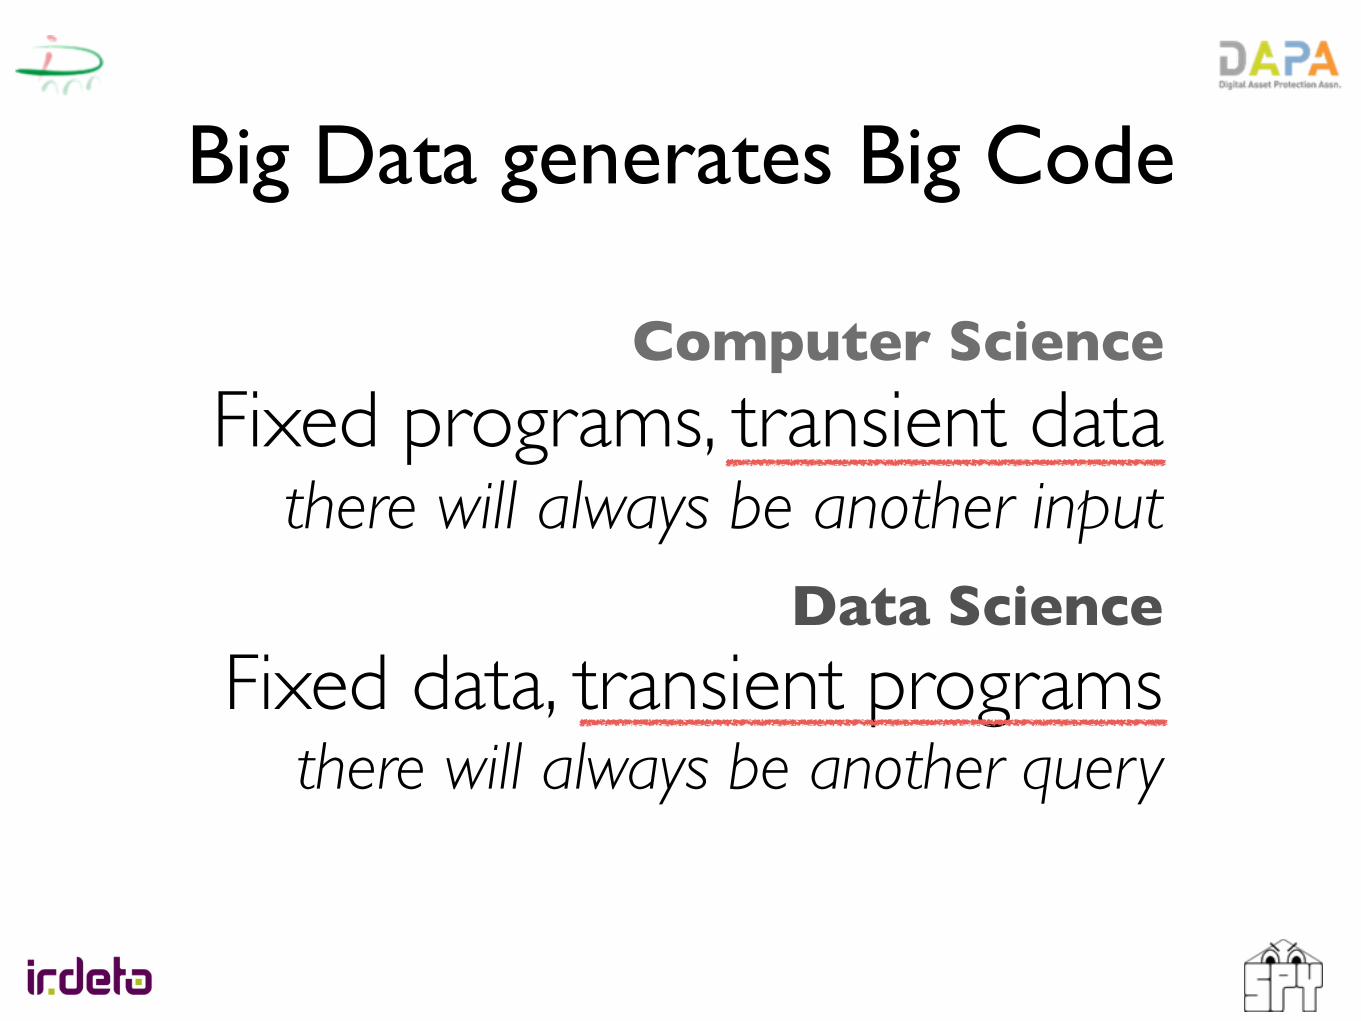
Big Data generates Big CodeA Clash of World Views
Computer Science
Fixed programs, transient datathere will always be another input
Data Science
Fixed data, transient programsthere will always be another query

Big Code: getting dynamicJavaScript
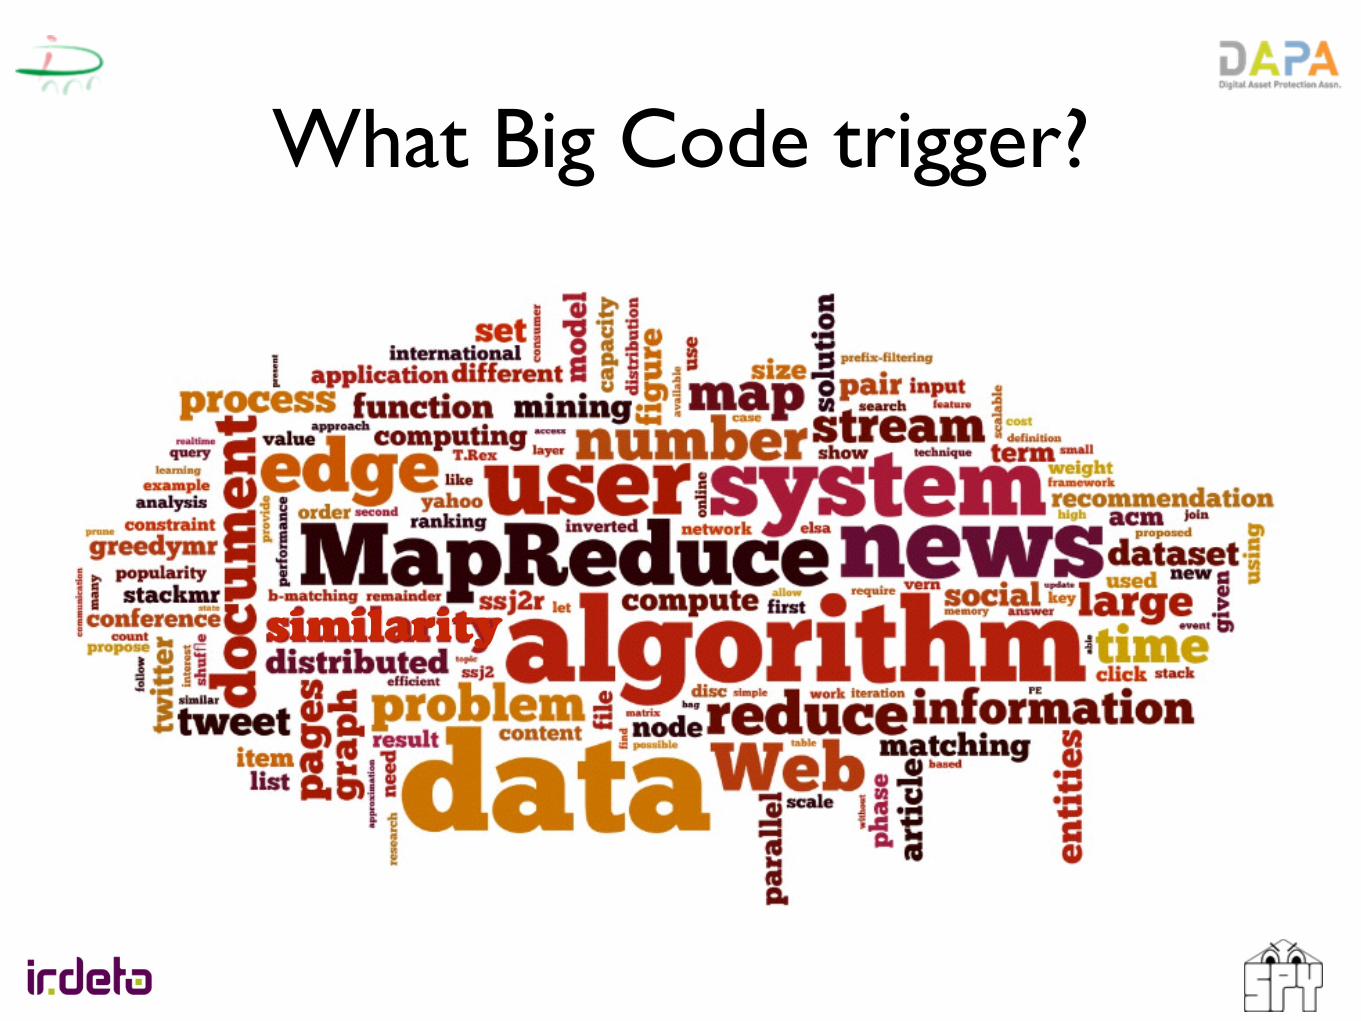
What Big Code trigger?
similarity
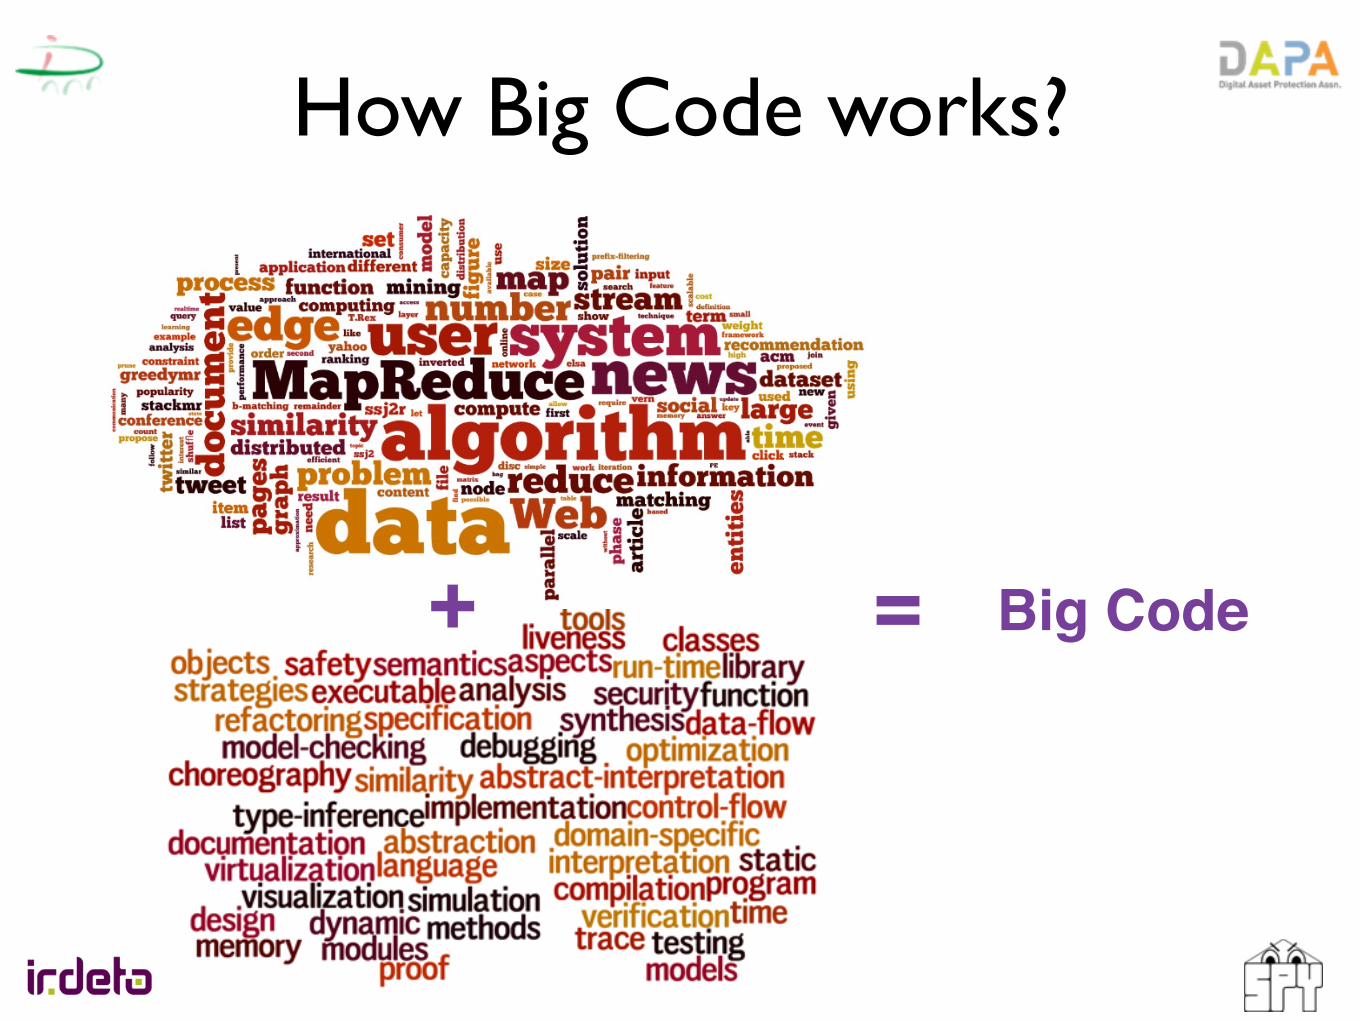
How Big Code works?
+ = Big Code
The 3Vs of Big Data
What Is Big Data? Hint: You’re a Part of It Every Day 5
Characteristics of Big DataThree characteristics define Big Data: volume, variety, and velocity (as shown in Figure 1-1). Together, these characteristics define what we at IBM refer to as “Big Data.” They have created the need for a new class of capabilities to augment the way things are done today to provide better line of site and controls over our existing knowledge domains and the ability to act on them.
The IBM Big Data platform gives you the unique opportunity to extract insight from an immense volume, variety, and velocity of data, in context, beyond what was previously possible. Let’s spend some time explicitly defining these terms.
Can There Be Enough? The Volume of DataThe sheer volume of data being stored today is exploding. In the year 2000, 800,000 petabytes (PB) of data were stored in the world. Of course, a lot of the data that’s being created today isn’t analyzed at all and that’s another prob-lem we’re trying to address with BigInsights. We expect this number to reach 35 zettabytes (ZB) by 2020. Twitter alone generates more than 7 terabytes (TB) of data every day, Facebook 10 TB, and some enterprises generate
Volume
Velocity
Var
iety
BatchStructured &Unstructured
Structured StreamingData
TerabytesZettabytes
BigData
Figure 1-1 IBM characterizes Big Data by its volume, velocity, and variety—or simply, V3.
ch01.indd 5 07/10/11 12:38 PM
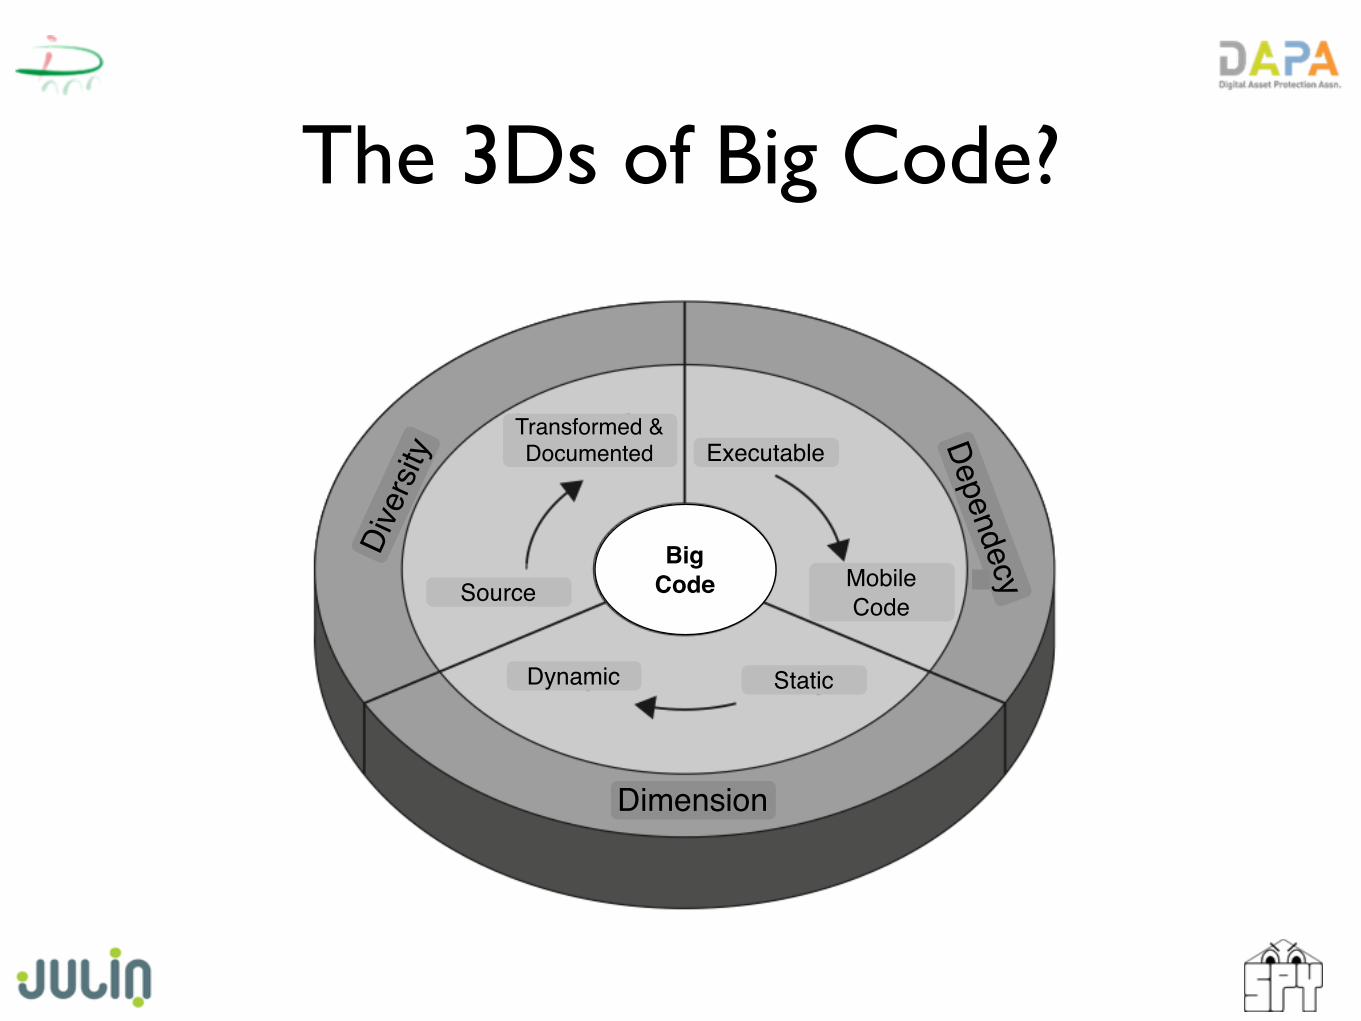
The 3Ds of Big Code?
BigCode
Dive
rsity
Dependecy
Dimension
StaticDynamic
Source
Transformed & Documented
Mobile Code
Executable

Big Data pipeline in Big Code
3
many levels of engagement with the data, not all requiring deep database expertise. Solutions to problems such as this will not come from incremental improvements to business as usual such as industry may make on its own. Rather, they require us to fundamentally rethink how we manage data analysis.
Fortunately, existing computational techniques can be applied, either as is or with some extensions, to at least some aspects of the Big Data problem. For example, relational databases rely on the notion of logical data independence: users can think about what they want to compute, while the system (with skilled engineers designing those systems) determines how to compute it efficiently. Similarly, the SQL standard and the relational data model provide a uniform, powerful language to express many query needs and, in principle, allows customers to choose between vendors, increasing competition. The challenge ahead of us is to combine these healthy features of prior systems as we devise novel solutions to the many new challenges of Big Data.
In this paper, we consider each of the boxes in the figure above, and discuss both what has already been done and what challenges remain as we seek to exploit Big Data. We begin by considering
To be doneStandard
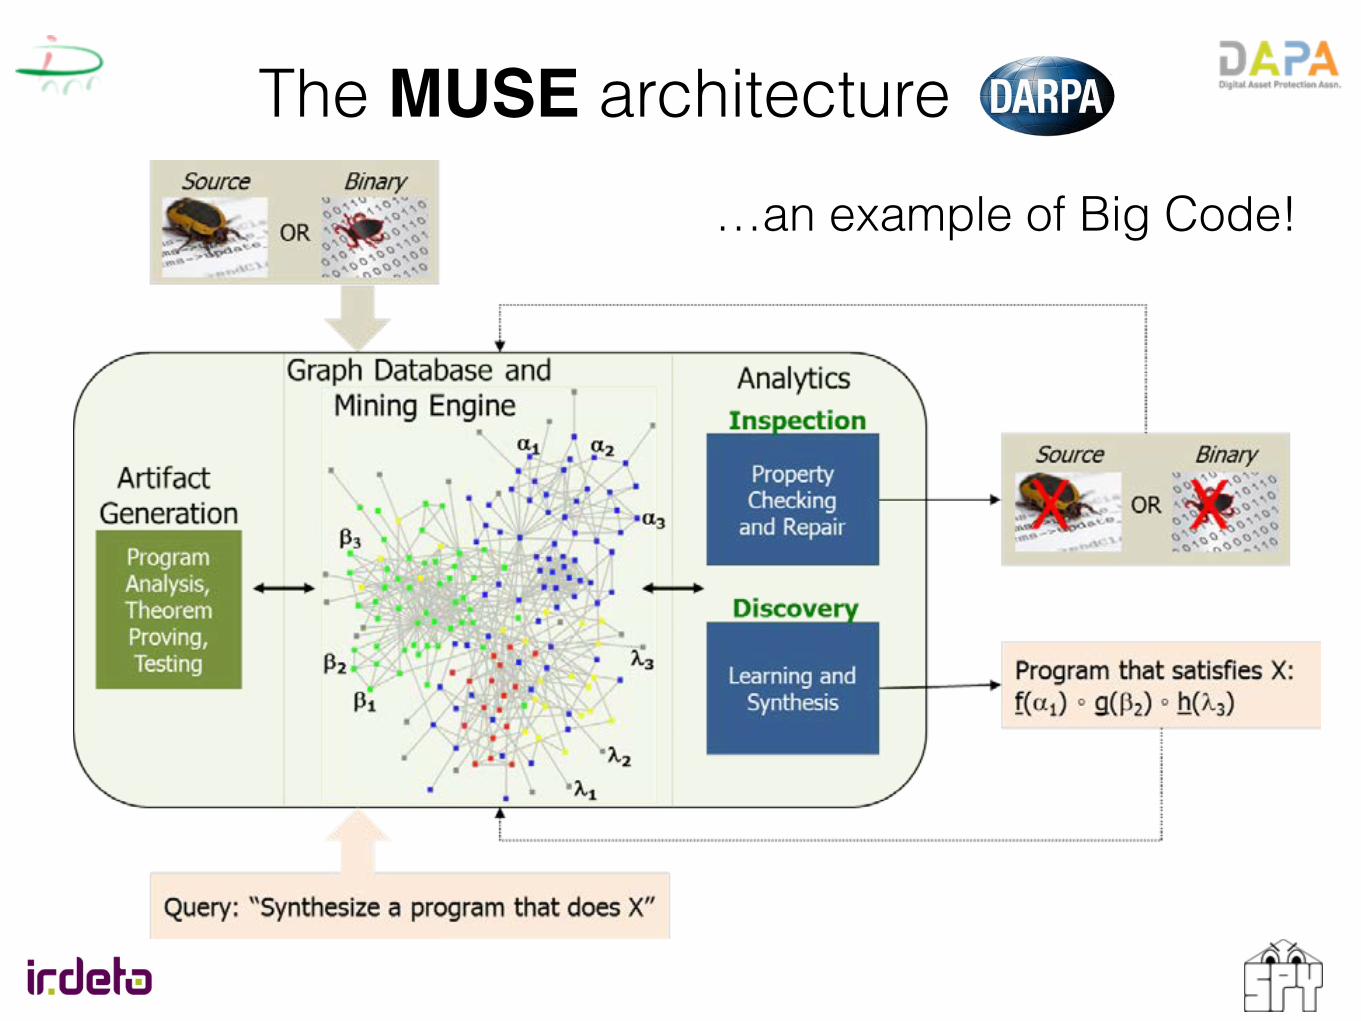
The MUSE architecture
DARPA-BAA-14-22 MUSE 8
expressive Application Programming Interface (API) and query language to generate and apply inferences in the database, and developing analytic tools that can exploit the information stored therein; as described below in points (4) and (5), we consider two specific instances, although others are certainly conceivable. Thus, efforts in this space will entail:
(1) Defining and implementing a persistent graph database engine geared towards
manipulating the output of the analyses developed in the front-end, that furthermore enables effective querying and generation of semantically-relevant relations among them;
(2) Designing domain-specific languages and rule-based systems for efficient search and
traversal over the graph tailored for identification and discovery of properties of interest; (3) Creating statistical and probabilistic inferences based on confidence measures on the
validity of presumed facts and derived inferences; (4) Using the database to enable automated program repair by examining the structure and
characteristics of programs in terms of their properties stored within the database, discovering salient variations between semantically-similar programs, for example, with and without defects; and
(5) Providing an expressive specification language that can be used to search the database for
a set of components from which suitable interfaces, refactorings, and transformations can be synthesized to yield an implementation that satisfies the input specification.
The high-level architecture of the MUSE infrastructure is given below.
Broad Agency Announcement Mining and Understanding Software Enclaves (MUSE)
DARPA-BAA-14-22
February 25, 2014
Defense Advanced Research Projects Agency Information Innovation Office 675 North Randolph Street Arlington, VA 22203-2114
…an example of Big Code!
✤ A/B Testing & group comparison
✤ Data mining and rule learning
✤ Classification
✤ Unsupervised analysis & Cluster analysis
✤ Data fusion and Integration
✤ Machine learning & pattern recognition
✤ Sentiment analysis
✤ Regression analysis and predictive modeling
✤ Simulation
✤ Time series analysis
✤ Network analysis
✤ Visualization
TechniquesTypical Big Data Tools
McKinsey Global Institute
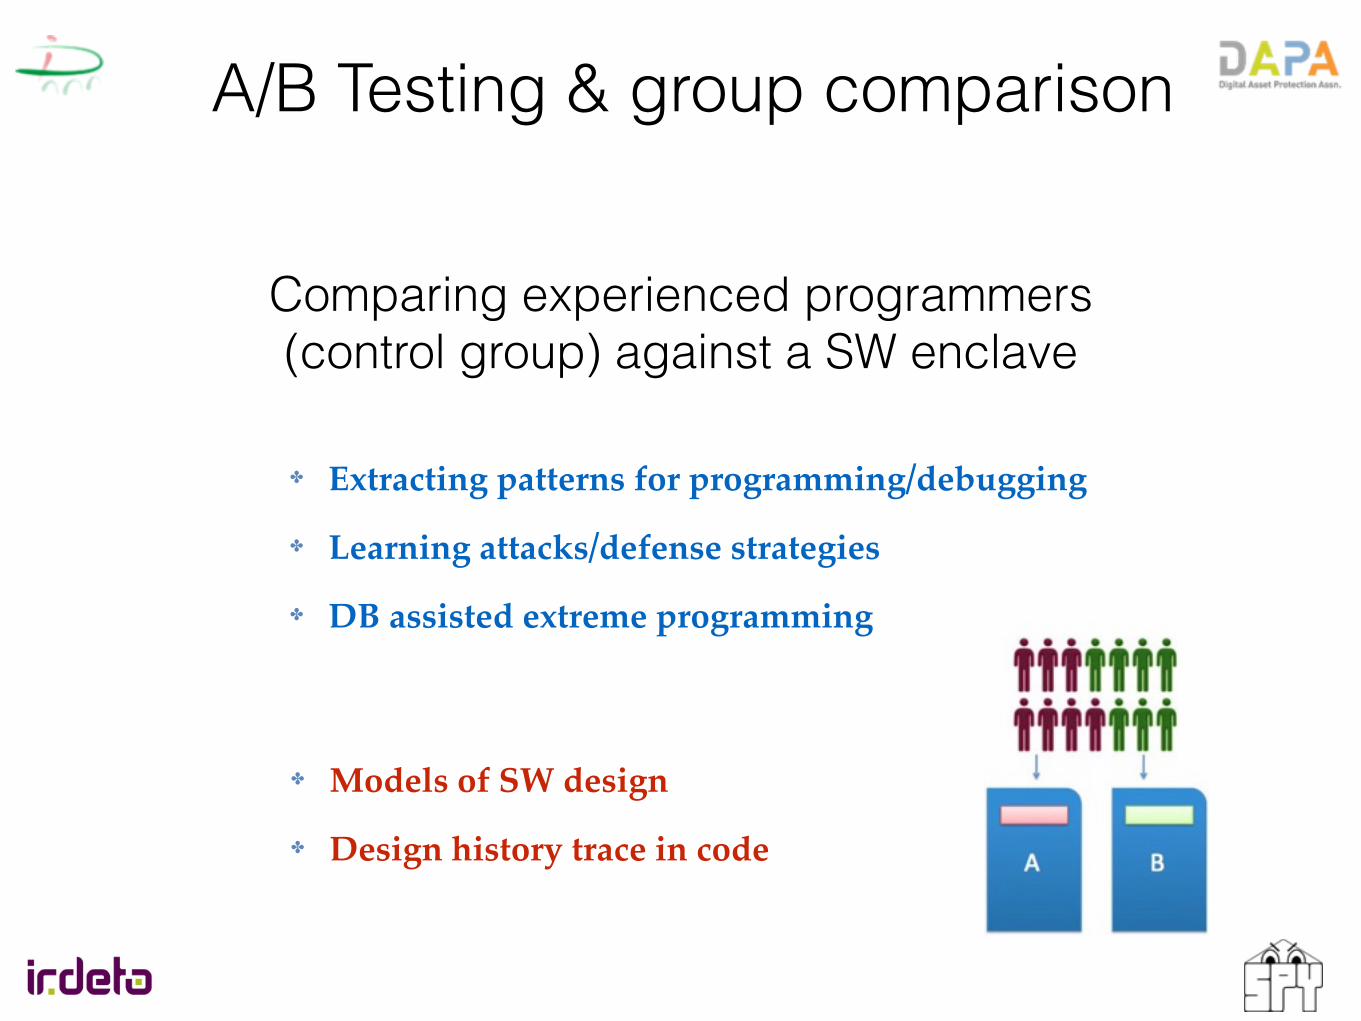
A/B Testing & group comparison
Comparing experienced programmers (control group) against a SW enclave
✤ Extracting patterns for programming/debugging
✤ Learning attacks/defense strategies
✤ DB assisted extreme programming
✤ Models of SW design
✤ Design history trace in code

Data mining and rule learning
Mining over code mutations for extracting rules for code fixing and debugging
✤ Extracting metamorphic and polymorphic behaviors in malware
✤ Mining-based program analysis
✤ Advanced regression testing
✤ Reverse engineering
✤ Advanced similarity analysis
✤ Temporal model of code evolution

Classification (supervised)
Classification of similar SW with respect to key properties: safety, security, efficiency,
etc.
✤ Provide a query-answer design of optimal code
✤ New metrics for SW quality by similarity analysis
✤ DB-assisted testing
✤ Advanced similarity analysis
✤ Advanced analysis of Code
✤ Analysis of analyses

Unsupervised cluster analysis
Classification of SW with respect to its use & design style
(no training set)
✤ Malware detection by similarity
✤ Correlation with Big Data of use
✤ SW community building
✤ Advanced similarity analysis
✤ Graph-based DB of Code & User Data
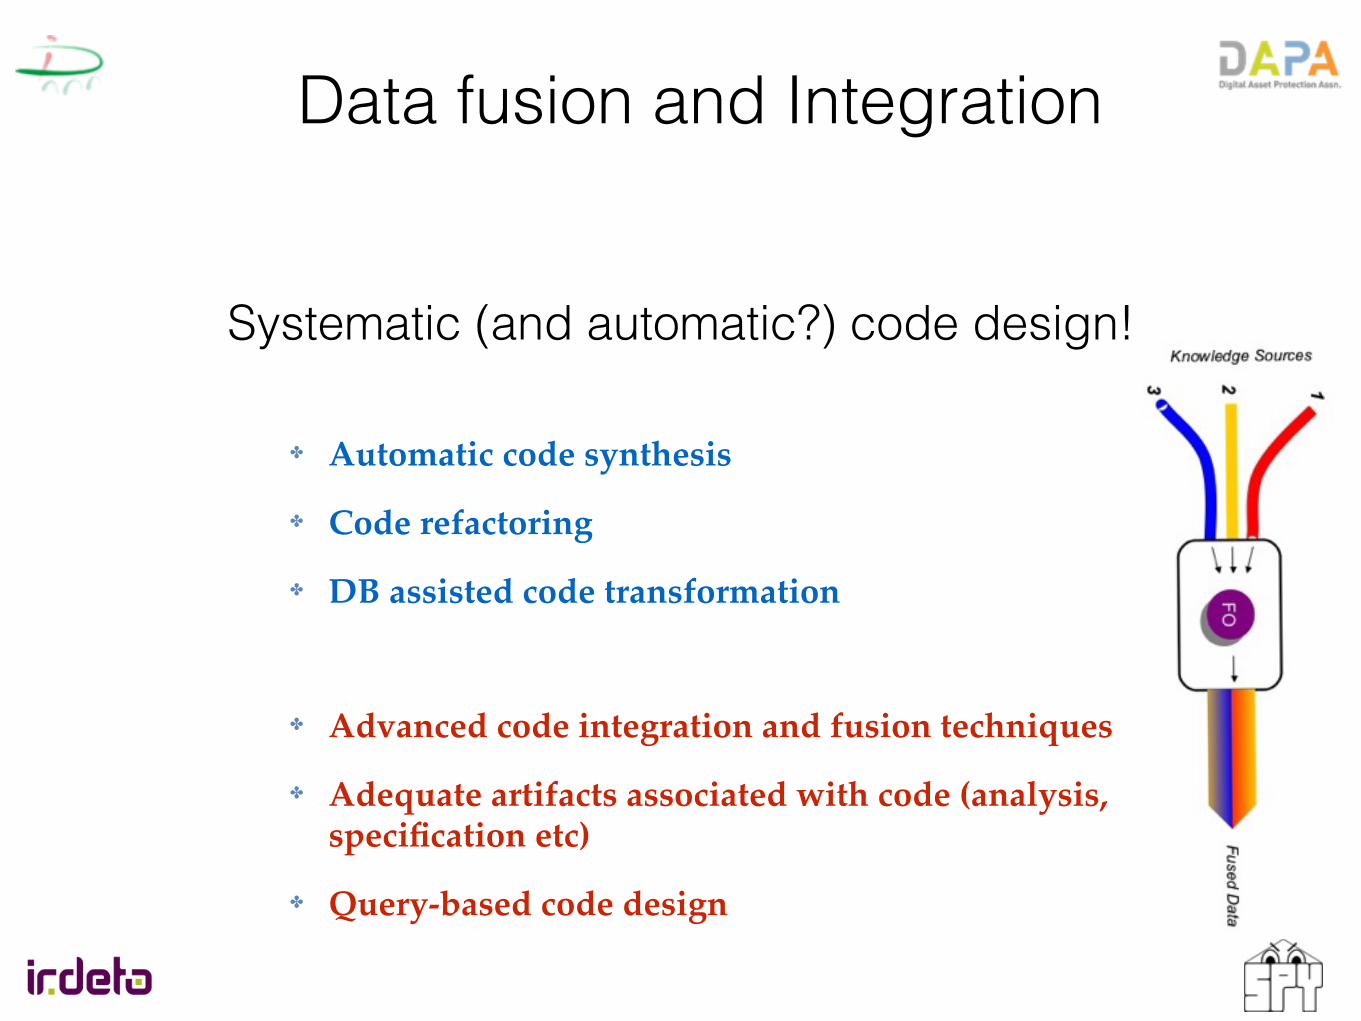
Data fusion and Integration
Systematic (and automatic?) code design!
✤ Automatic code synthesis
✤ Code refactoring
✤ DB assisted code transformation
✤ Advanced code integration and fusion techniques
✤ Adequate artifacts associated with code (analysis, specification etc)
✤ Query-based code design

Machine learning & pattern recognition
Find useful code patterns
✤ Reusable legacy code
✤ Find bug patterns
✤ Find attack patterns in security
✤ Machine Learning as Program Analysis?
✤ Adequate semantic abstractions for making learning possible!
Sentiment analysis
?
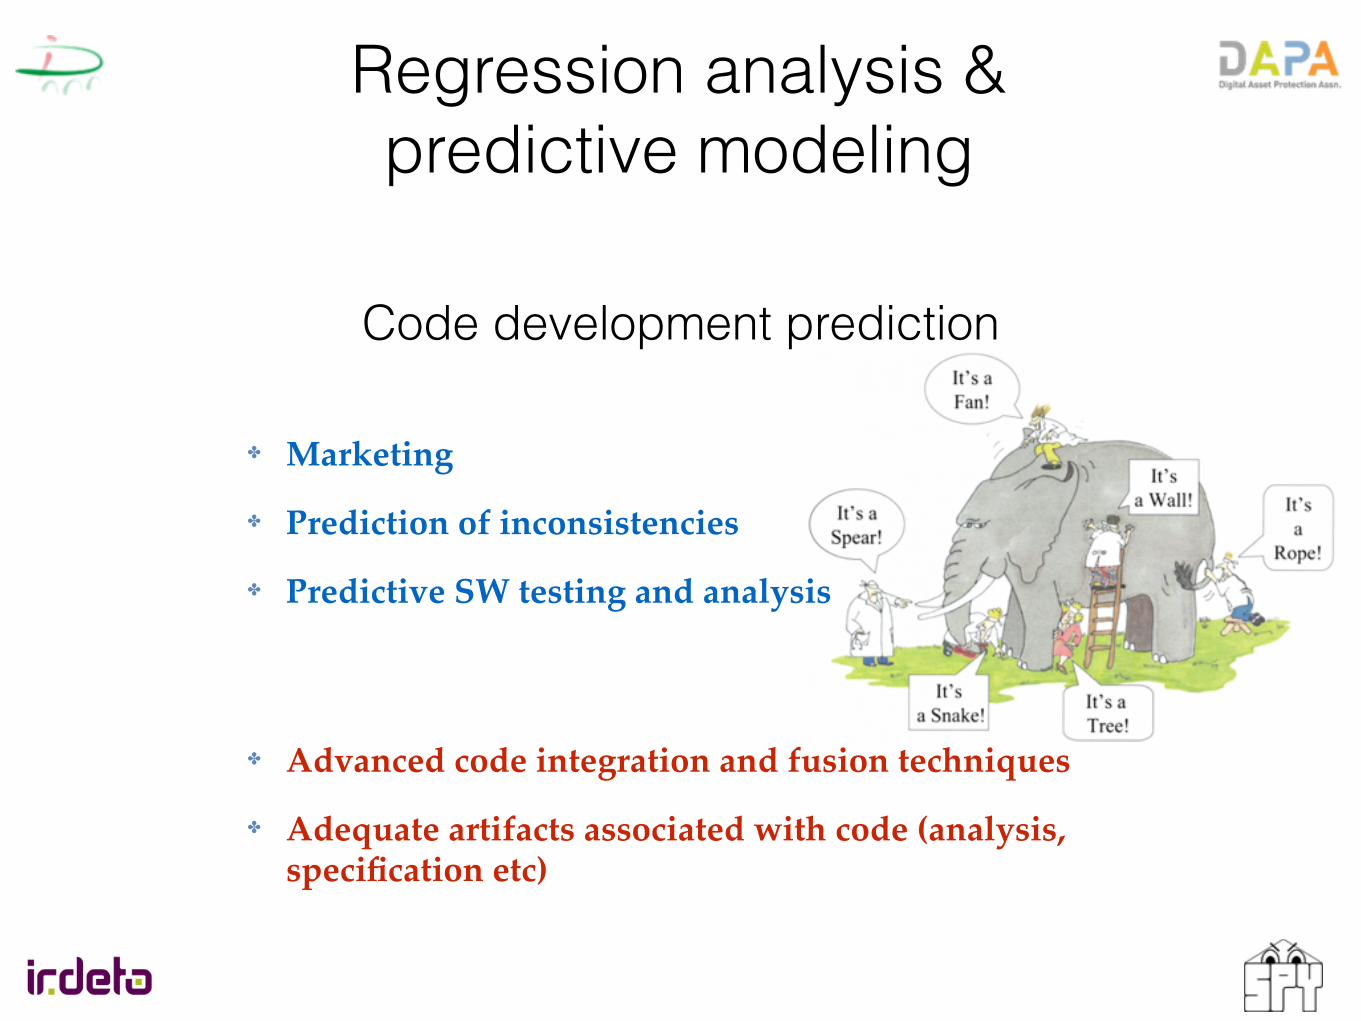
Regression analysis & predictive modeling
Code development prediction
✤ Advanced code integration and fusion techniques
✤ Adequate artifacts associated with code (analysis, specification etc)
✤ Marketing
✤ Prediction of inconsistencies
✤ Predictive SW testing and analysis
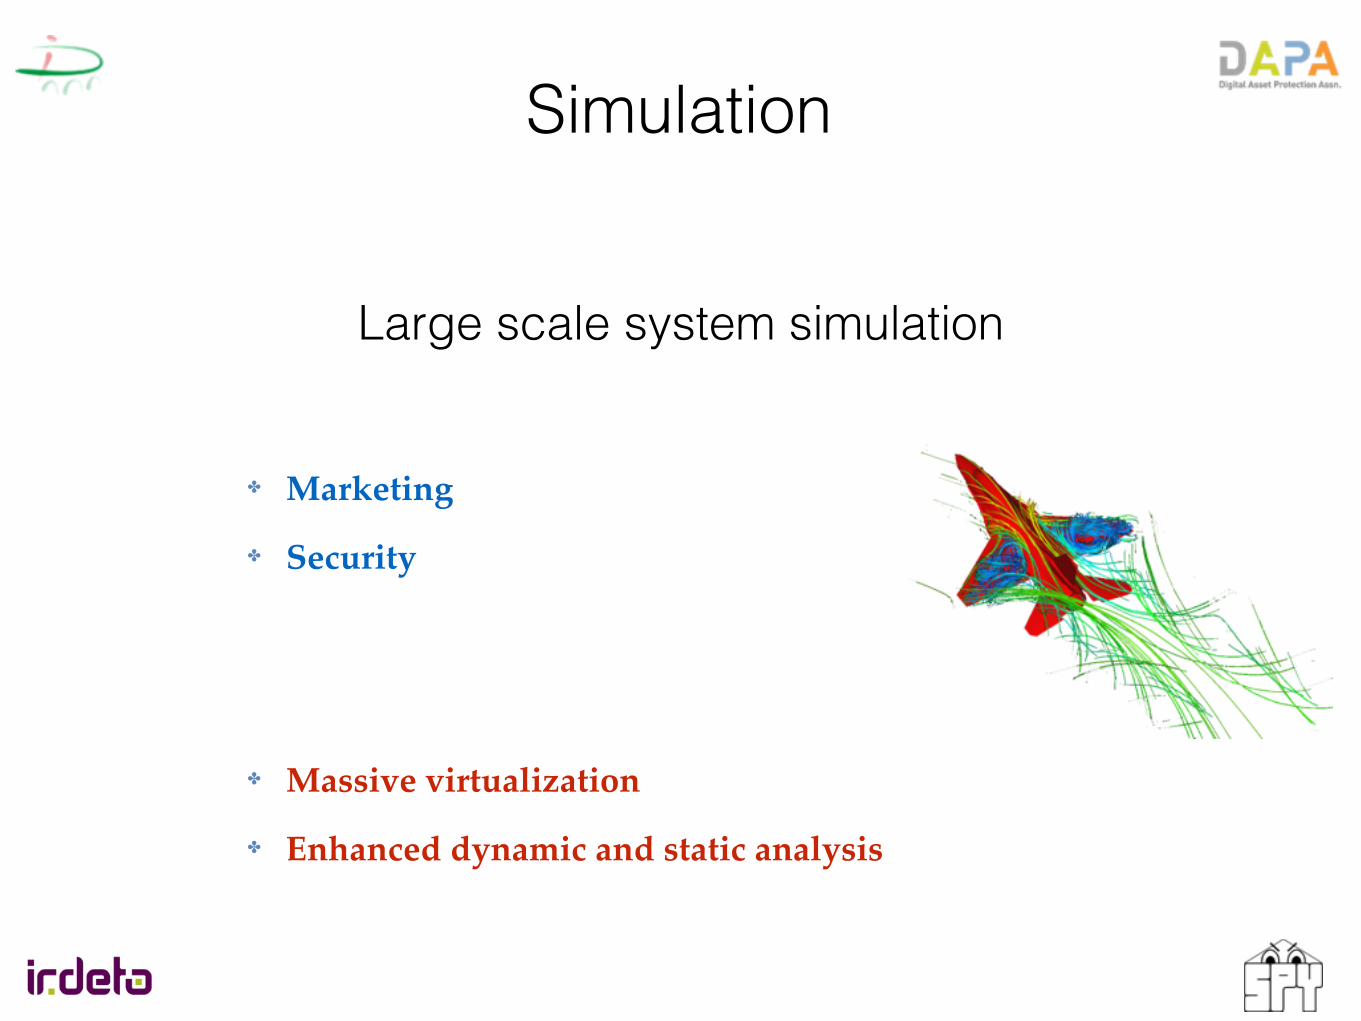
Simulation
Large scale system simulation
✤ Massive virtualization
✤ Enhanced dynamic and static analysis
✤ Marketing
✤ Security
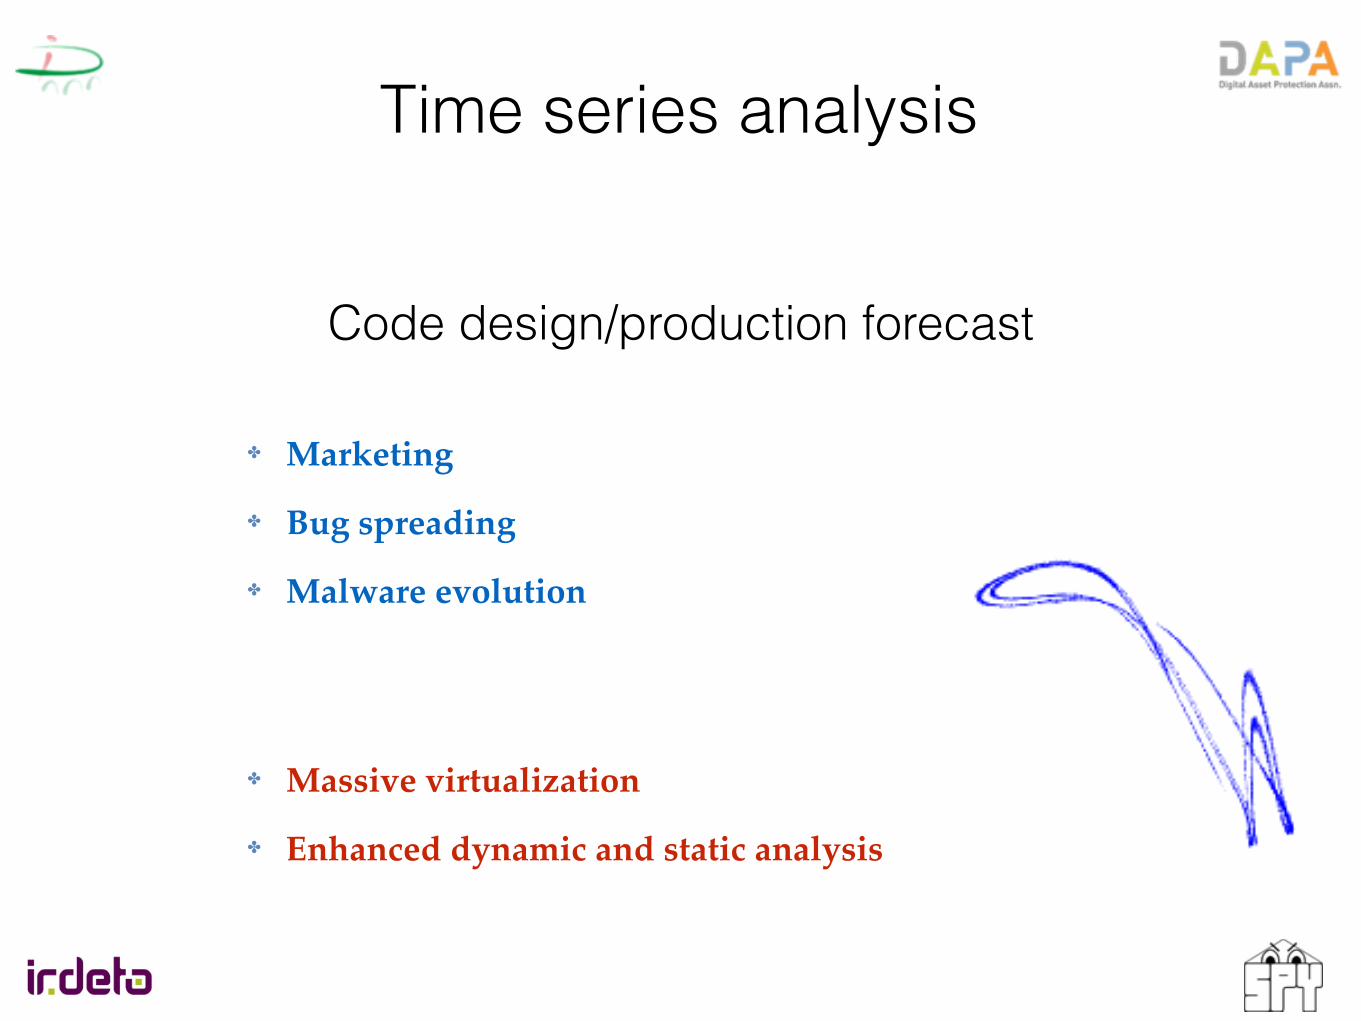
Time series analysis
✤ Massive virtualization
✤ Enhanced dynamic and static analysis
✤ Marketing
✤ Bug spreading
✤ Malware evolution
Code design/production forecast
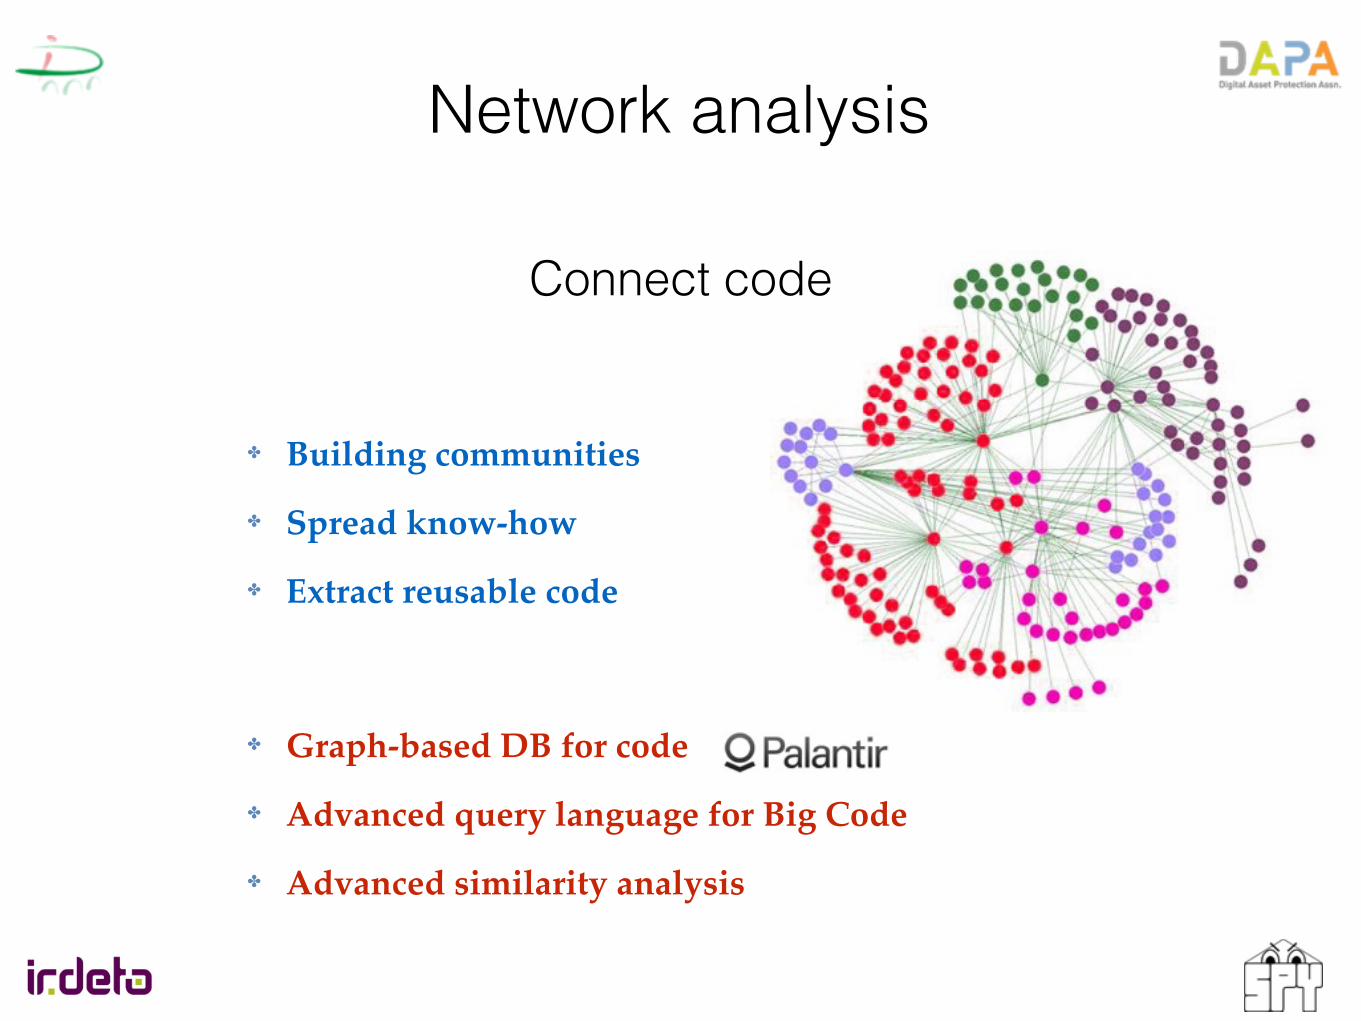
Network analysis
✤ Graph-based DB for code
✤ Advanced query language for Big Code
✤ Advanced similarity analysis
✤ Building communities
✤ Spread know-how
✤ Extract reusable code
Connect code
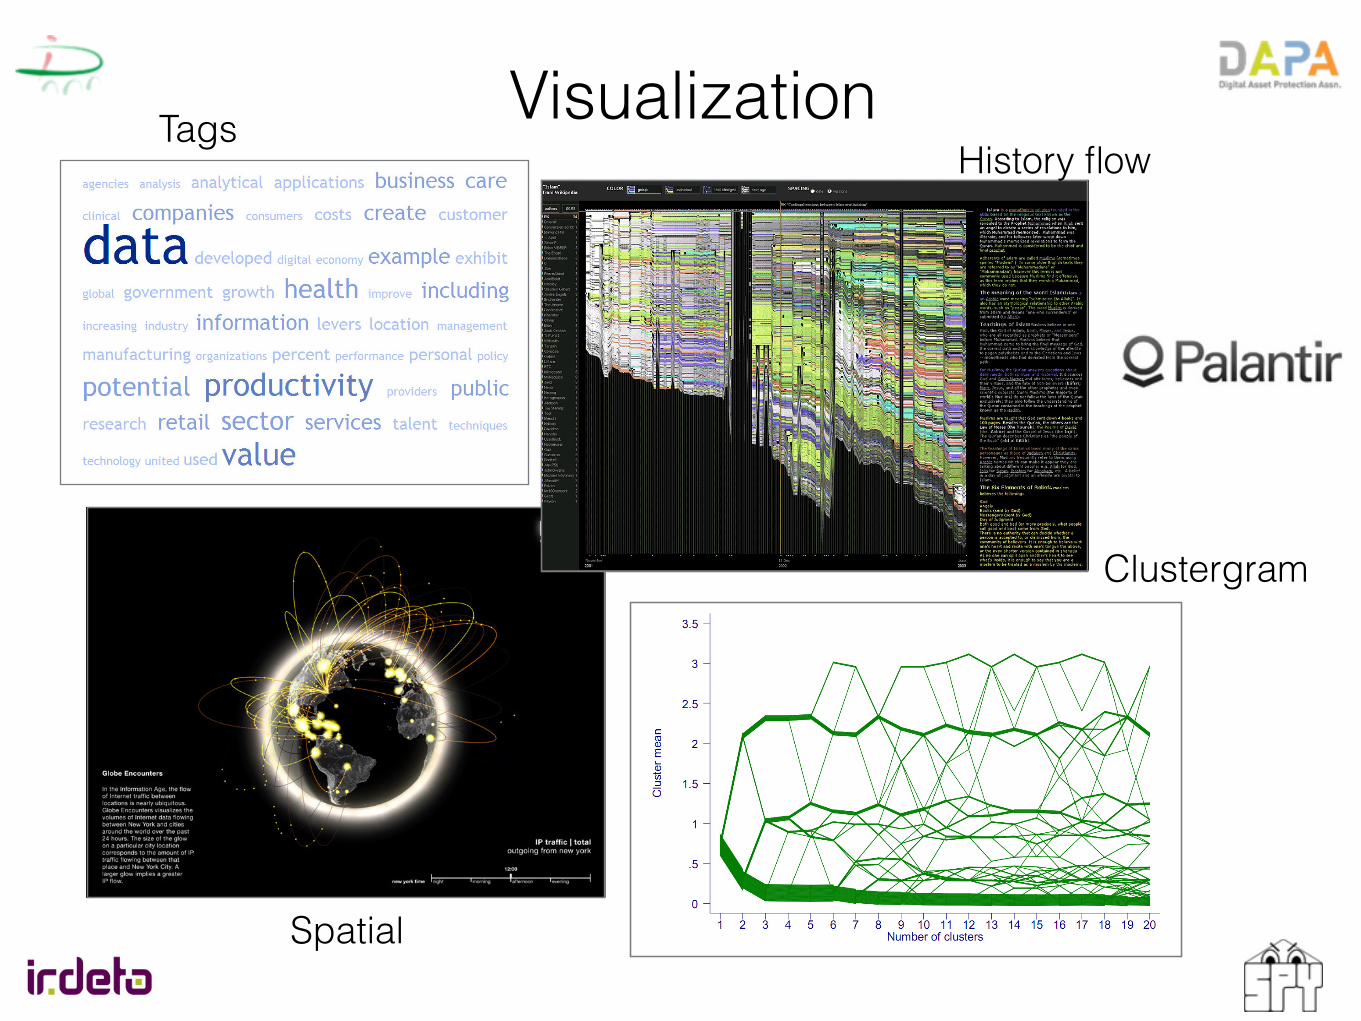
Visualization
36
Spatial information flow
Another visualization technique is one that depicts spatial information flows. The example we show here is entitled the New York Talk Exchange.36 It shows the amount of Internet Protocol (IP) data flowing between New York and cities around the world. The size of the glow on a particular city location corresponds to the amount of IP traffic flowing between that place and New York City; the greater the glow, the larger the flow. This visualization allows us to determine quickly which cities are most closely connected to New York in terms of their communications volume.
36 The New York Talk Exchange was displayed at New York’s Museum of Modern Art in 2008 (senseable.mit.edu/nyte/).
35Big data: The next frontier for innovation, competition, and productivityMcKinsey Global Institute
History flow
History flow is a visualization technique that charts the evolution of a document as it is edited by multiple contributing authors.34 Time appears on the horizontal axis, while contributions to to the text are on the vertical axis; each author has a different color code and the vertical length of a bar indicates the amount of text written by each author. By visualizing the history of a document in this manner, various insights easily emerge. For instance, the history flow we show here that depicts the Wikipedia entry for the word “Islam” shows that an increasing number of authors have made contributions over the history of this entry.35 One can also see easily that the length of the document has grown over time as more authors have elaborated on the topic, but that, at certain points, there have been significant deletions, too, i.e., when the vertical length has decreased. One can even see instances of “vandalism” in which the document has been removed completely although, interestingly, the document has tended to be repaired and returned to its previous state very quickly.
34 Fernanda B. Viegas, Martin Wattenberg, and Kushal Dave, Studying cooperation and conflict between authors with history flow visualizations, CHI2004 proceedings of the SIGCHI conference on human factors in computing systems, 2004.
35 For more examples of history flows, see the gallery provided by the Collaborative User Experience Research group of IBM (www.research.ibm.com/visual/projects/history_flow/gallery.htm).
34
Tag cloud
This graphic is a visualization of the text of this report in the form of a tag cloud, i.e., a weighted visual list, in which words that appear most frequently are larger and words that appear less frequently smaller. This type of visualization helps the reader to quickly perceive the most salient concepts in a large body of text.
Clustergram
A clustergram is a visualization technique used for cluster analysis displaying how individual members of a dataset are assigned to clusters as the number of clusters increases.33 The choice of the number of clusters is an important parameter in cluster analysis. This technique enables the analyst to reach a better understanding of how the results of clustering vary with different numbers of clusters.
33 Matthias Schonlau, “The clustergram: a graph for visualizing hierarchical and non-hierarchical cluster analyses,” The Stata Journal, 2002; 2 (4): 391-402.
Clustergram
History flowTags
Spatial

THINK

THANK


![aEYl]eYla[Y - Profs Area Scienze ed Ingegneriaprofs.sci.univr.it/~gregorio/fondamenti-primaria.pdf · 3.4 Lʼalgoritmo della sottrazione• 33 Capitolo 4 La divisione nei numeri naturali•](https://static.fdocuments.net/doc/165x107/5c65eba309d3f2e4308b7246/aeyleylay-profs-area-scienze-ed-gregoriofondamenti-primariapdf-34-lalgoritmo.jpg)