Basic concepts and rationale - IFAD
47
Basic concepts and rationale 1 IFAD’S INTERNAL GUIDELINES Economic and Financial Analysis of rural investment projects
Transcript of Basic concepts and rationale - IFAD
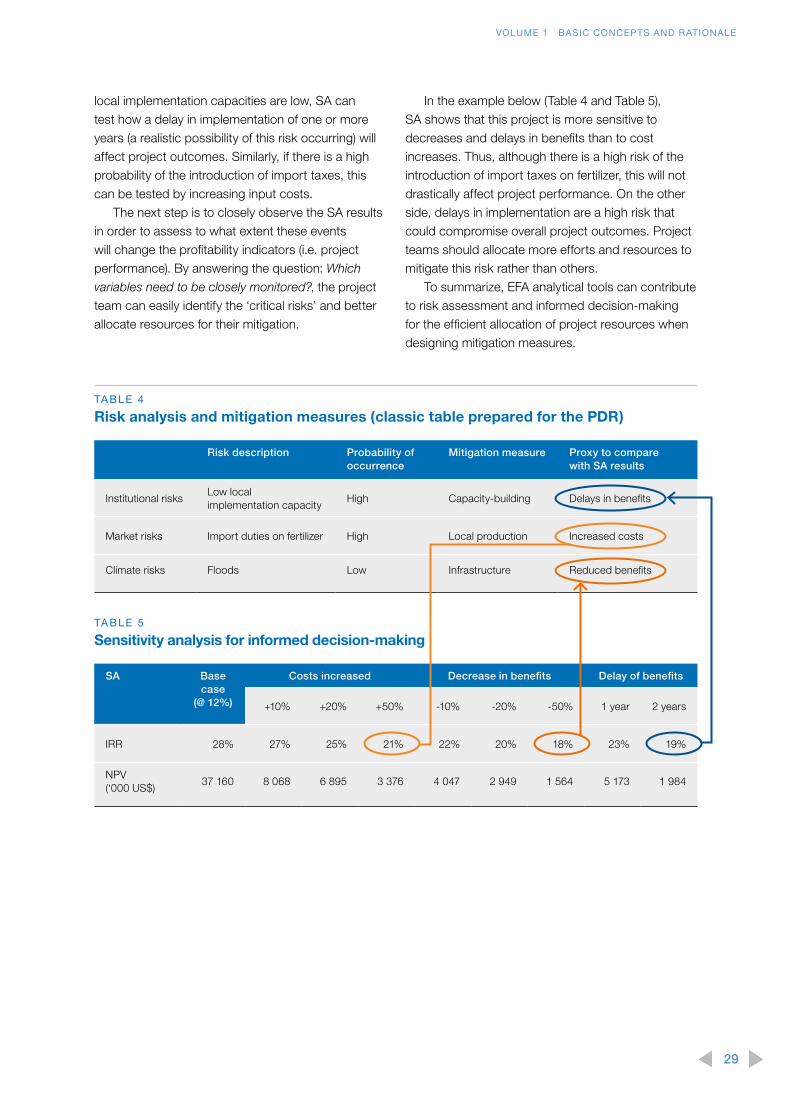
Basic concepts and rationale
1
IFADrsquoS INTERNAL GUIDELINES
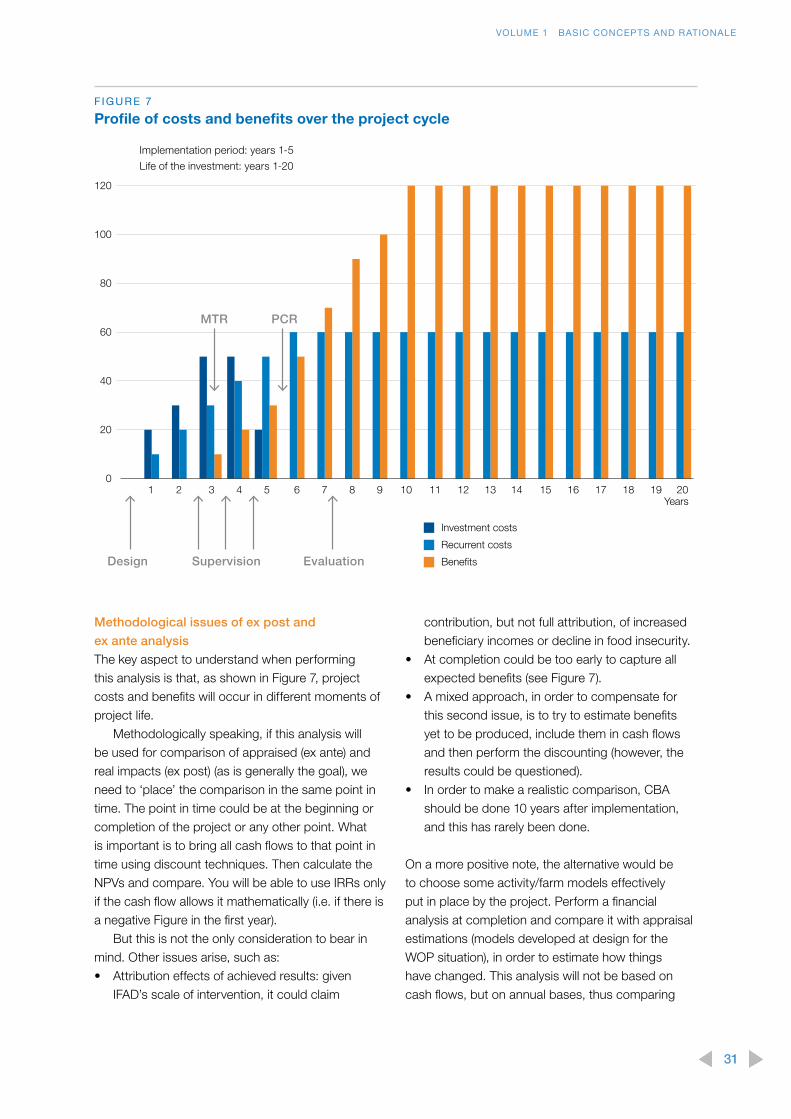
Economic and Financial Analysis of rural investment projects
IFADrsquoS INTERNAL GUIDELINES
Economic and Financial Analysis of rural investment projects
Basic concepts and rationale
1
copy 2015 by the International Fund for Agricultural Development (IFAD)
Printed August 2015
AcknowledgementsThese guidelines have been developed by the
economic and financial analyses (EFA) technical
team in the Policy and Technical Advisory Division
(PTA) as a resource book to address the recurrent
problems faced by the Fund in the elaboration of
this analysis during project design and supervision
Building on existing and renown manuals as well as
practical cases these guidelines are the product of
an intensive consultation process with colleagues
both inside and outside IFAD
These guidelines are the result of a team effort
the first draft being developed by the author (Eloisa
de Villalobos EFA technical adviser) with substantial
contributions from Chiara Calvosa and Graciela
Gutman The final version has been improved with
sections developed by David Young and Enrico
Mazzoli as well as the constant support critiques
and contributions from Ruy de Villalobos
The EFA team would like to particularly thank the
following people for their contributions Internally
they have been discussed and reviewed with the
IFAD Thematic Group on EFA as well as the Quality
Assurance team and peer reviewed by Brian Baldwin
(IFAD) Michael Hamp (IFAD) James Garret (IFAD)
Ed Heinemann (IFAD) Shantanu Mathur (IFAD) Kris Hamel (IFAD) Maria Elena Mangiafico (IFAD)
Philipp Baumgartner (IFAD) Francesca Carpano
(IFAD) and Bertrand Reysset (IFAD)
The external reviewers included Gordon Temple
(WB) Jock Anderson (WB) Pedro Belli (WB)
Amnon Golan (WB) Osvaldo Feinstein (WB) and our
colleagues from FAOTCI
Finally beyond all these contributions PTA
takes full responsibility for any inaccuracies that
may persist These guidelines are conceived as a
dynamic tool precisely to incorporate corrections
and timely contributions
Section IIntroduction 5
Background5
Scope 5
Outline 6
How to read the guidelines6
Section II Relevance of EFA 7
Relevance of economic and financial analysis 7
EFA as a decision-making tool
in project planning 7
Section III Basic concepts in undertaking EFA 11
Investment criteria profitability indicators 12
Economic and financial analysis
the differences 13
Section IVEFA of IFAD rural investment projects 18
Focusing on lsquotypicalrsquo IFAD rural
investment projects and their
main benefits 18
Unquantified benefits alternative
methodologies to CBA 20
EFA data sources collection
and coherence 23
CONTENTS
Section VEFA role throughout IFADrsquos project cycle 24
EFA in project design Links with
the logframe and MampE 26
EFA in project design
Risk analysis 27
EFA in project supervision implementation
and ex post evaluation 30
Ex post EFA and scaling up 32
Technical annex 33
Formulas for profitability indicators 33
Cost-effectiveness 33
Multicriteria analysis 34
Types of projects and EFA activities 35
References 37
Glossary 39
3
BC benefitcost ratio
BAU business as usual
CBA cost-benefit analysis
CDD community-demand-driven
CF conversion factor(s)
COSOP country strategic opportunities programme
CPM country programme manager
EFA economic and financial analysis
ENPV economic net present value
ERR economic internal rate of return
FNPV financial net present value
FRR financial internal rate of return
HH household
IFI international financial institution
IGs internal guidelines
IOE Independent Office of Evaluation of IFAD
IRR internal rate of return
MampE monitoring and evaluation
MCA multicriteria analysis
NPV net present value
NRM natural resource management
PMU project management unit
PTA Policy and Technical Advisory Division
QA quality assurance
QE quality enhancement
RMF Results Measurement Framework
SA sensitivity analysis
SP shadow prices
SV switching value (analysis)
TA technical assistance
VC value chain
WOP without project
WP with project
ABBREVIATIONS AND ACRONYMS
4
Introduction
illustrated by good examples (c) provide standards
for presenting assumptions and findings and for
the information to be included in project design
documents their annexes and working papers and
(d) guide selection of for example the discount
rate inclusion of externalities and application of
shadow prices andor conversion factors (CFs) and
their justification
ScopeThe main scope of these guidelines is to help country
programme managers (CPMs) in their project design
dialogue with governments as well as to help
mission leaders and EFA analysts in the performance
of their tasks related to project EFA The IGs should
be considered an open and dynamic document
which will be regularly updated to introduce changes
andor complement information following the needs
of its main users
These guidelines are by definition an auxiliary
methodological tool in meeting EFA requirements at
IFAD They do not pretend to substitute for the large
bibliography on EFA and cost-benefit analysis (CBA)
developed by academics and other international
financial institutions (IFIs) that analysts may consult1
Finally any project analyst should rely on hisher
best judgment refined through experience when
deciding on the methodology and assumptions to
be used These IGs as with any guidelines are not
a substitute for these essential qualities It is hoped
however that they will help reduce the scope of
subjective judgment in project EFA as well as bring
some standardization to the presentation of results
1 See list of references
SECTION I
BackgroundSince the quality enhancement (QE) process was
established in 2008 project reviewers at both the
quality enhancement and quality assurance (QA)
stages have identified areas of weakness in IFADrsquos
use of economic and financial analysis (EFA) in
project design For example of the 38 projects
the QE process reviewed during 2011 8 per cent
had not submitted an EFA and in 24 projects
EFA issues were identified At the QA stage EFA
recommendations have surfaced for 20 per cent
of the projects
Specific areas of concern range from technical
considerations regarding the quality of the analyses
and data (poor assumptions poor presentation of
the analysis and technical issues such as the use
of shadow pricing conversion factors and discount
rates) to broader issues regarding the use of EFA
as a tool in project design (activity selection logical
framework [logframe] design and risk analysis)
As a first step the Policy and Technical
Advisory Division (PTA) in collaboration with the QA
secretariat organized a workshop in October 2011
with international experts and practitioners involved
in project EFA to establish a consensus regarding
internationally accepted standards and best practice
The need for internal guidelines (IGs) for EFA of IFAD
projects emerged as one of the workshoprsquos main
recommendations It was suggested that the IGs
should (a) be directed to staff and practitioners in
charge of carrying out EFA (including government
officers) as well as to reviewers and advisers to
familiarize them with these analyses (b) be simple
and hands on including minimum criteria for EFA
5
VOLUME 1 BASIC CONCEPTS AND RATIONALE
F IGUR E 1
EFA guidelines outline
OutlineThe guidelines are divided into three volumes as
shown in Figure 1 Volume 1 highlights the relevance
of EFA to investment projects in general presenting
some basic technical concepts and briefly describing
the process of classic EFA It also explains the
use of different EFA elements throughout design
implementation and supervision of development
projects A short presentation of alternatives
methods to EFA such as cost-effectiveness and
multicriteria analysis (MCA) are also included in
this volume Volume 2 is the core of these IGs and
defines minimum requirements for the elaboration
of comprehensive EFA of IFAD rural investment
projects All detailed steps of analysis are presented
and illustrated through a hypothetical example the
Guideland Rural Development Project An annex to
volume 2 offers technical notes practical tips quality
checklists and suggested tables for the presentation
of results Volume 3 presents a set of practical
examples on the assessment of quantitative benefits
in cases in which project activities are not directly
related to production or productivity objectives
(eg rural finance projects climate adaptation
initiatives community-demand-driven [CDD] or
capacity-building projects)
How to read the guidelinesThese IGs are directed to two different audiences
The first includes CPMs country programme
officers government officers and anyone designing
andor implementing IFAD projects who are
making informed decisions and need to know the
basic concepts of EFA For this group volume 1
will provide all the information needed to use EFA
results for example linking EFA outcomes and
assumptions to define benchmark indicators for the
logframe or using sensitivity analysis to inform the
risk assessment exercise The second audience is
the EFA analyst In volumes 2 and 3 she will find
IFADrsquos minimum requirements for quality standards
a practical example illustrating all the steps required
to perform analysis and suggestions on the
presentation of results Answers to the most frequent
questions and identification of the most common
mistakes are provided in text boxes
Basic concepts and rationale
Minimum requirements
Case studies
IFADrsquoS INTERNAL GUIDELINES
Economic and Financial Analysis of rural investment projects
32
1
6
Relevance of economic and financial analysisEFA originated as a central tool in ensuring efficient
allocation of government spending It was meant
to ensure that public funds were efficiently used in
all major public reconstruction and infrastructure
investments mostly following World War II Since the
1960s CBA has been recognized as the major lsquopre-
investment toolrsquo in facilitating investment decisions
on public investments and policy
EFA of investment projects is a basic requirement
for investor and recipient decision-making in
project investment and financing Currently most
IFIs (eg the African Development Bank (AfDB)
Asian Development Bank (AsDB) Inter-American
Development Bank (IDB) and World Bank (WB))
require an EFA when deciding project financing and
they guide recipient governments accordingly
IFAD has recognized the need to ensure the
viability of its operations so that member states can
borrow funds in the knowledge that repayments
can be generated from project benefits and not
place themselves in unsustainable debt situations
Consequently IFAD acknowledged the relevance of
economic and financial analysis as a requirement for
project approval in its founding documents (see the
Agreement Establishing IFAD article 7 section I[d] 2
and the IFAD Lending Policies and Criteria [III (26)])3
Initially undertaking of EFA was very common
in IFAD project designs but a shift away from
production-oriented programmes towards
community-based and capacity-based projects in
the 1990s changed the degree to which designs
were able to produce robust EFA With value chains
2 ldquohellip eligibility for assistance shall be on the basis of objective economic and social criteriahelliprdquo
3 ldquoThe Fund taking due account of hellip the principle of economic viability of projectshelliprdquo
now emerging as a focus ndash and more generally
with greater attention given to the issue of project
efficiency ndash the need is shifting back towards
a more-classical approach to EFA Today it is
considered a priority for IFAD and under IFAD10 4 one of the indicators of the corporate Results
Measurement Framework (RMF) is that loan-financed
projects receive a published and verifiable
economic analysis5
These guidelines seek to demonstrate the
utility of EFA analysis throughout the participatory
planning design implementation and evaluation
of projects This is indispensable to good project
appraisal and lets decision makers assess the overall
value of a project including the likelihood that target
beneficiaries will adopt the interventions proposed
The following sections demonstrate that
EFA provides information both to understand the
convenience of private investments for target
beneficiaries and to prove to governments that
public resources will be efficiently allocated
EFA as a decision-making tool in project planningAll the development programmes and initiatives
are made of projects Projects are the main
tool governments use to encourage and shape
development They allow us to transform into
practice ideas highlighted in the poverty reduction
strategy papers
A clear distinction can be made between
projects and programmes although the two
concepts are tightly related
4 The Tenth Replenishment of IFADrsquos Resources
5 Indicator 427 ldquoshare of projects with a published and verifiable economic analysis (yearly)rdquo Revised IFAD10 RMF (2016-2018)
SECTION II Relevance of EFA
7
VOLUME 1 BASIC CONCEPTS AND RATIONALE
Programme is a portfolio comprised of multiple
projects that are managed and coordinated as one
unit with the objective of achieving common (often
intangible) outcomes and benefits at sector country
or even multi-country level
Project is a temporary entity established to
deliver specific (often tangible) outputs in line with
predefined time cost and quality constraints A
project should always be defined and executed and
evaluated relative to an approved business plan
which balances its costs benefits and risks
Whenever a project involves the decision to
use available economic resources (eg productive
capital infrastructure human capital knowledge) in
the anticipation of future benefits it is an lsquoinvestment
projectrsquo In brief an investment project is the decision
to make current expenditures in the anticipation of
future benefits
IFADacutes main activity is the financing of rural
investment projects through loans and grants EFA
provides clear and simple indicators to ensure that
a projectrsquos investments generate the anticipated
benefits at household and project levels Thus
IFAD requires this analysis in its project formulation
documents Apart from country-level decisions EFA
results are also used to inform approval decisions in
QEQA processes and by the Executive Board
In summary the main purpose of EFA is to
ensure an efficient allocation of resources proving
to governments the benefit of implementing one
particular investment rather than another option
which could be the lsquodo nothingrsquo alternative (Figure 2)
EFA is the most appropriate tool in appraising the
convenience of carrying out a project for both
the direct beneficiaries and the national economy
as a whole
Thus when appraising the economic and
financial viability of any project one must first
examine the lsquobusiness as usualrsquo (BAU) or lsquowithout
projectrsquo alternative and then compare it with proposed
options What the analyst needs to assess is the
value added (incremental approach) of the project
As a major methodological tool EFA makes use
of CBA but it also allows for other approaches
and studies such as cost-effectiveness and
multicriteria analyses Because costs and benefits
do not occur at the same time ndash with costs generally
preceding and exceeding benefits during the first
years of the project and benefits especially in
the agriculture sector being realized gradually
over a longer time period ndash the comparison is not
straightforward Hence lsquodiscounting techniquesrsquo
are applied This issue will be further developed in
the following sections
CBA was created as a lsquopre-investment toolrsquo
to facilitate investment decisions In these types
of ex ante decision-making tools there is a
trade-off between the amount invested in the
ex ante studies and the probability of making a
wrong investment decision
F IGUR E 2
Decision-making in project formulation
Decisionalternatives
Decision
criteria If XgtY recommend the project
Do not undertake the project
Resources for alternative
uses
Value of alternative
usesBenefit = Y
Undertake the project
Resources allocated to the project
Value of project
outcome Benefits = X
8
VOLUME 1 BASIC CONCEPTS AND RATIONALE
F IGUR E 3
Guiding questions during project assessment
Should resources be invested in this project
Could people afford to adopt the proposed intervention
Would they take the risk to change current practices
Viability
Feasibility
Uptake
BOX 1
Guiding questions
Should the government invest its scarce resources in this particular intervention Should the
producer adopt the proposed intervention
Replying to these questions will ensure that the proposal is solid from a technical financial and
economic point of view Analysis should assess the viability of the investment and compare it
with alternatives (at least with the presentBAU situation) to ensure that the project is generating
additional value This information is also used to ensure the economic profitability of the project
as a whole
Could the producer afford the proposed technology
From a purely financial point of view are available resources adequate for the producer to invest
in the proposed intervention If these resources are not sufficient alternative financing schemes
should be assessed by the project (eg loans savings schemes insurance grants) In addition
other context-specific restrictions should be considered at this stage ndash such as input availability
labour requirements and legal restrictions ndash that could be a barrier to modifying current practice
Would the producer take the risk Would the government take a loan to finance
this project
This is one of the most relevant questions for all project implementers Are incentives high enough
to convince producers to change their current situation Here not only monetary incentives
should be considered but also social cultural and environmental ones
A proper risk analysis would identify the critical economic parameters the government should
consider when making its investment decisions
The ability to support decision-making is a
key element of EFA It provides solid indicators for
answering questions regarding lsquothe best alternativersquo
from the points of view of different actors
Figure 3 shows guiding questions for the
assessment of any investment project and
box 1 provides more information on how these
can be used
9
VOLUME 1 BASIC CONCEPTS AND RATIONALE
The various steps in EFA provide information
to respond to these questions taking into account
that the decision is not simple projects require time
to develop and one wants to make certain that the
improvements in peoplersquos lives are permanent
EFA requirements technical and
institutional viability
EFA is only one part of the overall analysis of a
project it assumes that the project is technically
sound and that its institutional arrangements will
be effective during implementation In other words
EFA of investment projects requires at the least
that the project under analysis be feasible from the
technical and institutional points of view Projects
can be implemented through different institutional
arrangements and using different technical solutions
For a project to be viable at least one of these
institutional arrangements needs to be valid and at
least one technical solution needs to be viable As
will be seen the application of EFA during project
formulation will also help identify and select the lsquobestrsquo
project technical and institutional alternatives This
is a strong assumption as the review of numerous
cases has shown many inconsistencies in project
technical formulation
Commonly identified inconsistencies include
(a) incomplete or inadequate description of the
institutional arrangements for carrying out the
proposed project components (b) incomplete or
inadequate identification of constraints on productive
development For example the project (i) proposes
a new technology but there is no assessment
of the on-farm working capital requirements for
adopting it and consequently the project lacks the
required financing component (eg grants credit)
(ii) plans huge investments in irrigation facilities
but no provision has been made for the required
technological transfer services and working capital
needs (iii) proposes improvement of rural financial
services but there is no description of the expected
productive activities and technologies to be adopted
through the support of these facilities
Thus reviews of the technical proposals and
institutional arrangements for project implementation
are steps prior to EFA They involve preparation of an
adequate project logframe (reviewed at each stage
of the project cycle) which is essential in confirming
institutional viability
10
This section illustrates basic concepts so that the
non-specialist can become more familiar with the
terminology and purpose of EFA However detailed
information on carrying out EFA of projects is
provided in volume 2 of these guidelines
EFA is based on comparison of the net6 cash
flows of investment alternatives The present or
BAU cash flow is compared with at least one
other investment alternative which according
to the projectrsquos technical specialists will result in
amelioration of the producerrsquos situation
6 Net cash flows defined as Benefits discounted cash flow net from costs discounted cash flows
However in order to assess if the project is
making good use of public funds the costs of
implementing it (including the institutional setting
and capacity-building of both implementers and
producers) must be compared with the benefits
produced In other words the value added by the
project is compared with the incremental costs of
implementing it
In practical terms the analyst models diverse
beneficiary livelihood strategies to compare BAU
situations with the project proposal Description
of the BAU or without project (WOP) situation
although simple at first sight can confuse the analyst
regarding many aspects (box 2)
BOX 2
With project (WP) and without project (WOP) scenarios common issues
Accurate description of both WP and WOP scenarios is essential to a realistic assessment of
incremental benefits
1 WOP equal to zero When the project proposes development of a new activity many analysts
represent the WOP as a null scenario because the activity wasnrsquot present in the past
However the correct approach is to realistically represent the alternative activities
(eg off-farm employment)
2 Static or unrealistic WOP Generally WOP scenarios are presented as a static situation that
repeats itself through the years This is often underestimating the capacity of people to adapt
and progress Projects generally assist these processes and accelerate their returns
3 An inaccurate WP fails to assess the incremental net value of the project In a woodlot project
in Malawi that aimed to produce firewood analysts spent a great deal of time studying how
to value the incremental wood production since there was no market for the wood Finally
they decided on an international valuation of the energy created They missed the point In
the without situation women spent a great deal of time travelling to procure firewood with
the project they could spend their time producing more maize If the analysts had developed
realistic WOP and WP situations they would have realized that the benefits of the project
came from incremental maize not wood production
Basic concepts in undertaking EFA
SECTION III
11
VOLUME 1 BASIC CONCEPTS AND RATIONALE
Next one needs to formulate the WP situation
defining expected outcomes in the future by
identifying the requested investment and operating
costs as well as projecting estimated benefits7 In
order to convert future costs and benefits which do
not occur at the same time into todayrsquos values for
comparison discounting techniques are applied
Discounting permits comparison of the value of
money in different time periods considering that
a dollar today is worth more than a dollar received
tomorrow (ie the fact that we have to postpone
consumption makes tomorrowrsquos dollar less valuable
than todayrsquos) How much is $1 received in lsquonrsquo years
worth today The answer depends on the adopted
discount rate (r) and the discount period (n)8
Thus the aggregation of project flows occurring
in different years requires adoption of an appropriate
discount rate to calculate the present value of future
flows As a guiding principle discount rates should
represent the opportunity cost of capital for the
agent (producer or government)9 The other essential
element in discounting is definition of the discount
period (also called lsquoproject economic lifersquo or lsquotime
horizon analysisrsquo)
Usually the discount period is equivalent to the
lifespan of the largest investment components of
the project10
Finally the project net cash flows (ie financial
andor economic)11 are based on the incremental
approach which results from comparing the
WP and WOP situations With these elements it
is possible to calculate the corresponding project
lsquoprofitability indicatorsrsquo
7 The analysis is looking at future investments and outcomes thus sunk costs are irrelevant
8 The present value (PV) = future value(1+r)n If r = 10 and n = 8 years the present value of $1 would be $051
9 For the producer a realistic alternative is an average of the passive deposit rate of local commercial banks The government should instead consider the interest rate at which the country can actually borrow capital from a relevant international capital market alternatively the return on long-term public treasury bonds is also a suitable option More information on determining a relevant discount rate is provided in volume 2
10 This rule might change when (i) technological progress would make the investment obsolete before the end of its useful life (ii) the investment period is lsquotoo longrsquo (ie very common in environmental projects ship construction etc) or (iii) other factors exist (ie legal institutional etc) that justify another specific choice for the discount period
11 See the following subsection for differences between the two
Investment criteria profitability indicatorsGenerally speaking a project is considered lsquoviablersquo
if the sum of expected incremental benefits is
larger than the sum of all costs accrued in project
implementation This can be assessed through
profitability indicators12 The most relevant indicators
for these IGs are the net present value internal rate
of return and benefitcost (BC) ratio
bull The net present value (NPV) indicator is defined
as the sum that results when the expected
costs of the investment are deducted from
the discounted value of the expected benefits
(revenues) Whenever NPV gt 0 the project is
considered worthwhile or profitable Among
mutually exclusive projects the one with the
highest NPV should be chosen
bull The internal rate of return (IRR) indicator is
defined as the discount rate (r) that produces
a zero NPV This represents the maximum
interest rate that a project could face and still
not waste resources
For the project to be profitable the IRR has
to be greater than the interest rate that could be
earned in alternative investments thus when
IRR gt r the project is considered viable If the
(alternative) interest rate (imkt) also called opportunity
costs of capital is lower than the IRR the NPV is
positive and vice versa
IRR NPV 0gt gti mkt
IRR NPV 0lt lti mkt
12 Formulas can be found in the technical annex
12
VOLUME 1 BASIC CONCEPTS AND RATIONALE
Both NPV and IRR are calculated on the same
project cash flows of incremental net benefits
However in certain cases the calculation of
IRR is not possible and thus it cannot be used as a
profitability indicator
This is the case when (a) the flow of net
incremental benefits does not have a negative
element or (b) it presents more than one IRR
complicating the decision as to which one to
consider as the profitability indicator
Moreover IRR is an indicator that should not be
used to rank or select mutually exclusive project
options as it cannot provide a measure of the size or
magnitude of project value13 (box 3)
The NPV on the other hand is an indicator that
can always be calculated as is the case with the
benefitcost ratio
bull The (BC) ratio indicator is the ratio of the
present value of benefits to the present value
of costs over the time horizon The BC ratio
provides some advantages when a ranking of
alternative investment projects is needed under
budget constraints
If BC ge 1 the project is accepted
If BC lt 1 the project is rejected
13 Where a project is the only alternative proposal to the status quo the issue is whether the IRR provides worthwhile additional information Views differ in this respect Some argue that there is little merit in calculating a statistic that is either misleading or subservient to the NPV Others see a role for the IRR in providing a clear signal as regards the sensitivity of a projectrsquos net benefits to the discount rate Yet whichever perspective is taken this does not alter the broad conclusion on the general primacy of the NPV rule
These IGs consider that the most appropriate
indicator for appraising an investment project is
the NPV as the investment decision criterion is
straightforward if NPV is gt 0 the project is viable
It means that the proposed investment is a profitable
alternative in terms of resource allocations It is better
than the present and WOP situations and also better
than allocating the same resources to other economic
activities that will yield the average profit rate
Economic and financial analysis the differencesAll investment projects include a number of
stakeholders and this has implications for the
valuation of the benefits and costs accrued by
project interventions Whose costs and benefits
count14 Governments and society as a whole will
consider and value costs and benefits differently
from producers or any other private actor individually
From the perspective of a development agency such
as IFAD both points of view are relevant to a reply
to the guiding questions stated before Should the
government invest in this project Will the producer
take the risk
14 In the CBAEFA literature the question of lsquowhose costs and benefits countrsquo is known as the lsquostandingrsquo issue (ie whose welfare counts in the aggregation of net benefits)
BOX 3
IRR or NPV
Although the most appropriate indicator for appraising an investment project is the NPV ndash as it
can always be calculated and will provide information on the magnitude of the return ndash the IRR is
the most commonly used This is probably due to the fact that IRR is expressed as a percentage
which is often wrongly associated with other rates of return such as interest rates (r) or profit rates in
alternative allocations In fact the IRR has no meaning in terms of project value or size
To prove this letrsquos suppose a project is one thousandth the size of another project Simply multiply
each side of the equation by 1000 The calculated IRR will not change but the small project entails
less value The project to be chosen from a social point of view would be the one producing the
bigger returns to the economy and the NPV will clearly show this while the IRR will not
13
VOLUME 1 BASIC CONCEPTS AND RATIONALE
In order to consider these points of view analysis
will be conducted on two levels (a) financial analysis
will consider private stakeholdersrsquo interests15 and
(b) economic analysis will consider government
and society perspectives These two viewpoints will
require the analyst to consider different items
when looking at the benefits and costs of a project
valuate them differently and in some cases even
use different rates to discount the streams of costs
and benefits
The private investor exclusively considers the
costs and benefits related to the productivemarket
aspects of the project while analysis from an
economic point of view considers that benefits are
defined as an increase in social well-being16 The
costs are defined as reductions in social well-being
For a project to be economically viable its social
benefits must exceed its social costs
15 This point of view is also applied to the executing agency of a public project
16 The term lsquosocial welfarersquo or lsquowell-beingrsquo is used in these IGs as a simple monetary measure The definition is taken from neoclassical economics and prevailing economic theories of well-being No attempts are made to include any type of measurement of subjective happiness or to develop any well-being indexes or social indicators
Thus from the perspective of a private
stakeholder (financial analysis) participating in the
investment with risk capital the wealth created by
a project in lsquonrsquo periods of time is defined as the
financial NPV (FNPV) The economic or cost-benefit
analysis looks at the overall impact of the project
and takes the point of view of the collective agent
(eg society) and the wealth created by a project in
lsquonrsquo periods of time is defined as the economic NPV
(ENPV) of the investment produced by the project17
In financial analysis all costs and benefits
should be valued at market prices Only cash inflows
and outflows are considered (depreciation reserves
and other accounting items not corresponding to
actual flows are excluded)
17 In rural development projects where the agent is a subsistence farmer accumulated generated cash per year must be at least equal to or higher than the BAU situation that was ensuring hisher familyrsquos survival
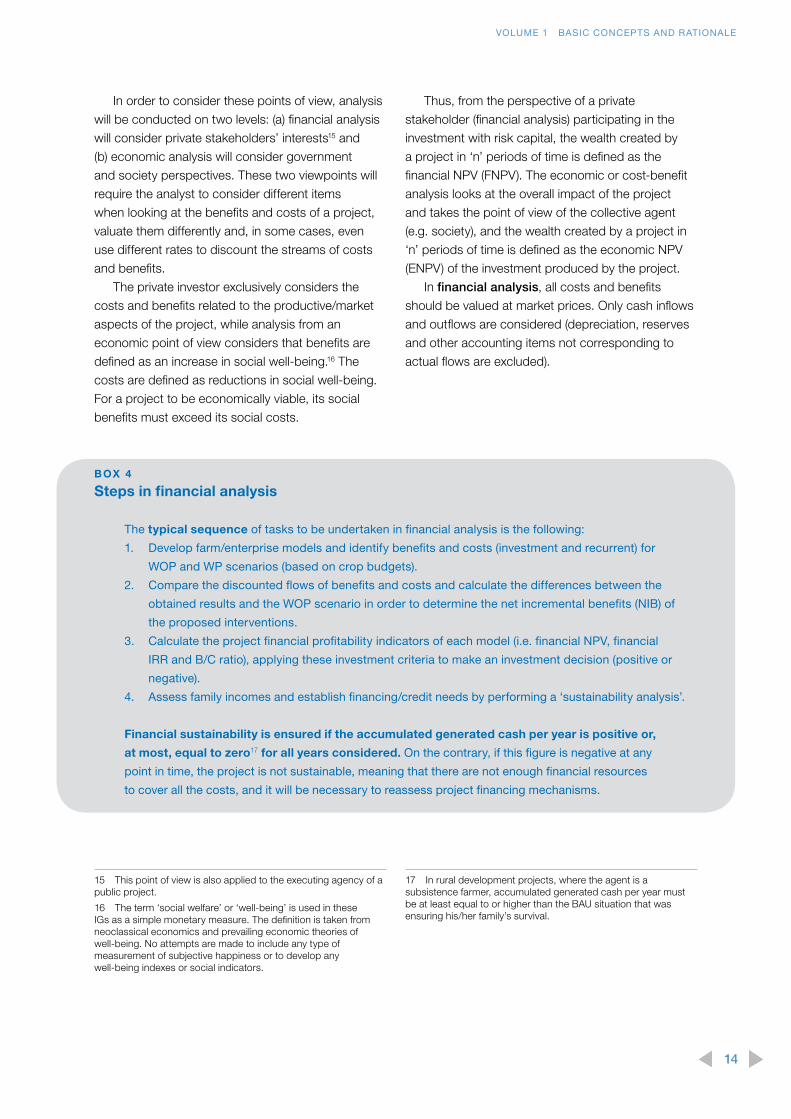
BOX 4
Steps in financial analysis
The typical sequence of tasks to be undertaken in financial analysis is the following
1 Develop farmenterprise models and identify benefits and costs (investment and recurrent) for
WOP and WP scenarios (based on crop budgets)
2 Compare the discounted flows of benefits and costs and calculate the differences between the
obtained results and the WOP scenario in order to determine the net incremental benefits (NIB) of
the proposed interventions
3 Calculate the project financial profitability indicators of each model (ie financial NPV financial
IRR and BC ratio) applying these investment criteria to make an investment decision (positive or
negative)
4 Assess family incomes and establish financingcredit needs by performing a lsquosustainability analysisrsquo
Financial sustainability is ensured if the accumulated generated cash per year is positive or
at most equal to zero17 for all years considered On the contrary if this figure is negative at any
point in time the project is not sustainable meaning that there are not enough financial resources
to cover all the costs and it will be necessary to reassess project financing mechanisms
14
VOLUME 1 BASIC CONCEPTS AND RATIONALE
Economic analysis or cost-benefit analysis
builds on the results of financial analysis with the
additional consideration of impacts and benefits not
directly captured by the latter These analyses are
strictly related as shown in Figure 4
The main steps in financial analysis are
summarized in box 4 A detailed description of
building economic analysis from financial models is
provided in volume 2 which illustrates each step in
EFA of a typical IFAD production-oriented project
In economic analysis the analyst needs to
complement financial analysis by considering all
project impacts on the society The private actor is
generally not interested in considering all negative
or positive impacts that his actions may have on the
rest of society In terms of environmental impact
for example polluting rivers through production
discharges or emitting CO2 are social costs generally
not considered by the private agent These are called
lsquoexternalitiesrsquo as in practical terms the private agent
is lsquoexternalizingrsquo a production cost making the whole
society pay for it On the other hand there also exist
positive effects not counted by the private agent
such as the introduction of new pastures by a single
producer which can increase honey production in
the area and benefit neighbouring beekeepers
These aspects are known as positive and
negative externalities In addition economic analysis
must eliminate all transfer costs between national
and private actors (ie subsidies and taxes) Lastly all
costs and benefits need to be valued at their social
opportunity cost rather than at their market price
F IGUR E 4
Economic and financial analysis links
Aggregation
Project net incremental
benefits(NIB)
Farm budgets properly phased
Activity budgets (eg processing enterprises)
phased
Government implementing
agencies
Financial analysis(market prices)
123n
123n
Farm budgets properly phased
Activity budgets (eg processing enterprises)
phased
Government implementing
agencies
sum
sum
sum
Economic analysis(economic values)
123n
123n
Adjust market values to economic
values
Eliminate transfer
payments (taxes and subsidies)
Quantify externalities
15
VOLUME 1 BASIC CONCEPTS AND RATIONALE
Many times for example when trade barriers
are in place or when currencies are controlled
market prices do not reflect the social value of
goods In order to account for these distortions
one of the most critical tasks is the calculation of
economic or shadow prices Another critical aspect
is the establishment of a social rate of discount
that realistically reflects an investment alternative
(opportunity cost) for the government18 Detailed
explanations and guidelines for these calculations
are also included in volume 2
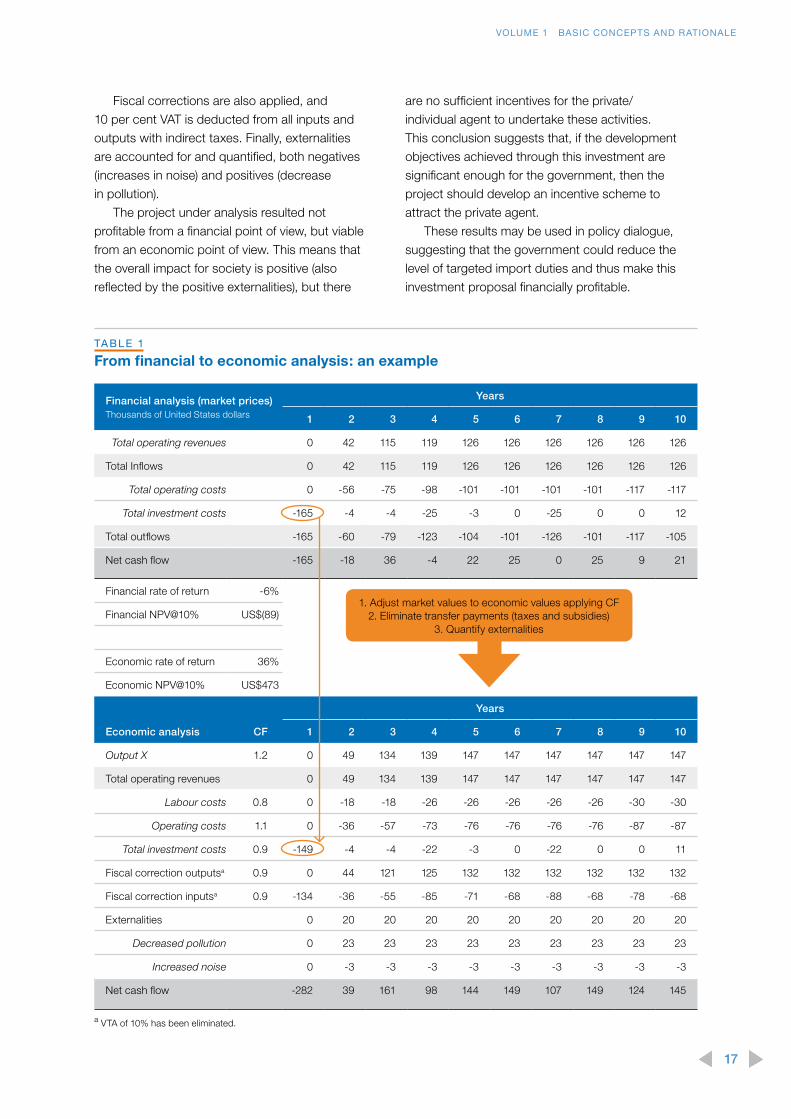
Table 1 illustrates the process of going from
financial to economic analysis19 The financial
analysis section at the top shows revenues and 20
production costs (operating and investment) of a
hypothetical enterprise The enterprise is experiencing
18 As a general rule when a country is a capital borrower the social rate of discount should be no less than the actual rate of interest on the capital market from which the capital is borrowed
19 Clicking on the table reveals the formulas
20 See section on ldquoUse of SA to assess project risks an examplerdquo
several years of negative net cash flows resulting
in a negative NPV and IRR This is caused by high
operating costs as well as recurrent needs for
investment Economic analysis converts market
prices into economic prices As reflected by the
application of conversion factors (CF) market prices
of outputs and inputs are different from their social
value For example the CF applied to wages reflects
the presence of high unemployment (20 per cent)
in the area which would push people to work for
lower than market wages (thus CF = 08)21 In the
same way the CF applied to investments reflects
the presence of high transport costs or duties that
make the productrsquos market price overestimate its
social value In fact the market price is 83 while the
economic price is 75 and thus the CF is 09
21 Market wage (mW) = US$100 unemployment = 20 economic wage(eW) = US$80 (observed given the high unemployment) CF = eWmW = 80100 = 08
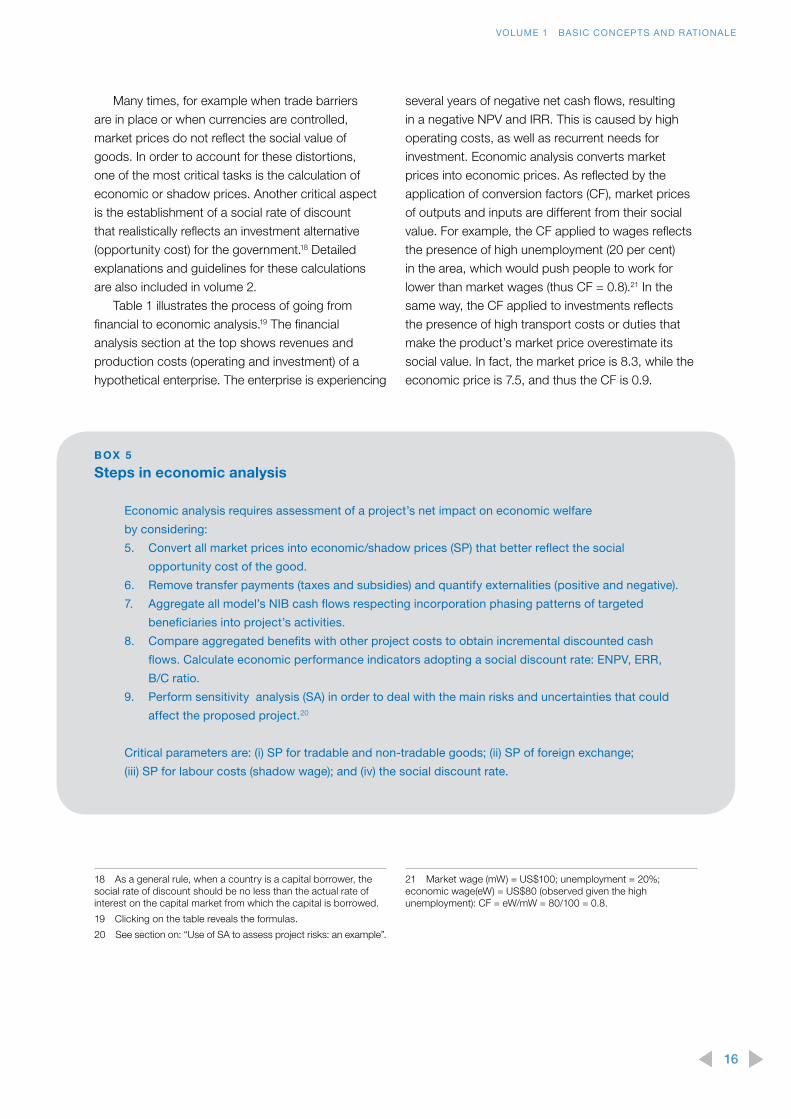
BOX 5
Steps in economic analysis
Economic analysis requires assessment of a projectrsquos net impact on economic welfare
by considering
5 Convert all market prices into economicshadow prices (SP) that better reflect the social
opportunity cost of the good
6 Remove transfer payments (taxes and subsidies) and quantify externalities (positive and negative)
7 Aggregate all modelrsquos NIB cash flows respecting incorporation phasing patterns of targeted
beneficiaries into projectrsquos activities
8 Compare aggregated benefits with other project costs to obtain incremental discounted cash
flows Calculate economic performance indicators adopting a social discount rate ENPV ERR
BC ratio
9 Perform sensitivity analysis (SA) in order to deal with the main risks and uncertainties that could
affect the proposed project20
Critical parameters are (i) SP for tradable and non-tradable goods (ii) SP of foreign exchange
(iii) SP for labour costs (shadow wage) and (iv) the social discount rate
16
VOLUME 1 BASIC CONCEPTS AND RATIONALE
Fiscal corrections are also applied and
10 per cent VAT is deducted from all inputs and
outputs with indirect taxes Finally externalities
are accounted for and quantified both negatives
(increases in noise) and positives (decrease
in pollution)
The project under analysis resulted not profitable from a financial point of view but viable
from an economic point of view This means that
the overall impact for society is positive (also
reflected by the positive externalities) but there
are no sufficient incentives for the private
individual agent to undertake these activities
This conclusion suggests that if the development
objectives achieved through this investment are
significant enough for the government then the
project should develop an incentive scheme to
attract the private agent
These results may be used in policy dialogue
suggesting that the government could reduce the
level of targeted import duties and thus make this
investment proposal financially profitable
TA BLE 1
From financial to economic analysis an example
Financial analysis (market prices)Thousands of United States dollars
Years
1 2 3 4 5 6 7 8 9 10
Total operating revenues 0 42 115 119 126 126 126 126 126 126
Total Inflows 0 42 115 119 126 126 126 126 126 126
Total operating costs 0 -56 -75 -98 -101 -101 -101 -101 -117 -117
Total investment costs -165 -4 -4 -25 -3 0 -25 0 0 12
Total outflows -165 -60 -79 -123 -104 -101 -126 -101 -117 -105
Net cash flow -165 -18 36 -4 22 25 0 25 9 21
Financial rate of return -6
Financial NPV10 US$(89)
Economic rate of return 36
Economic NPV10 US$473
Years
Economic analysis CF 1 2 3 4 5 6 7 8 9 10
Output X 12 0 49 134 139 147 147 147 147 147 147
Total operating revenues 0 49 134 139 147 147 147 147 147 147
Labour costs 08 0 -18 -18 -26 -26 -26 -26 -26 -30 -30
Operating costs 11 0 -36 -57 -73 -76 -76 -76 -76 -87 -87
Total investment costs 09 -149 -4 -4 -22 -3 0 -22 0 0 11
Fiscal correction outputsa 09 0 44 121 125 132 132 132 132 132 132
Fiscal correction inputsa 09 -134 -36 -55 -85 -71 -68 -88 -68 -78 -68
Externalities 0 20 20 20 20 20 20 20 20 20
Decreased pollution 0 23 23 23 23 23 23 23 23 23
Increased noise 0 -3 -3 -3 -3 -3 -3 -3 -3 -3
Net cash flow -282 39 161 98 144 149 107 149 124 145
a VTA of 10 has been eliminated
1 Adjust market values to economic values applying CF2 Eliminate transfer payments (taxes and subsidies)
3 Quantify externalities
17
SECTION IV
IFAD rural investment projects include projects
in integrated rural development irrigation rural
finance value chain development natural resource
management (NRM) climate-change adaptation
and mitigation community development and
institutional strengthening
As IFAD follows its main mandate of focusing its
projects on benefiting poor rural people22 projects
are characterized and designed through identification
of a target group composed mostly of rural people
Poor rural people represent different productive
and economic categories the main one being
smallholders Others include the landless population
engaged in rural non-agricultural microenterprises
rural workers fishers and finally special vulnerable
groups such as women indigenous minorities and
youth All IFAD projects must be formulated on
the basis of benefiting one or more of the above-
mentioned poor rural groups
The increased number of value chain projects
in IFADrsquos portfolio23 ndash aiming to integrate IFADrsquos
traditional target groups into these chains to improve
their access to secure markets and sustainably raise
their incomes ndash has expanded the definition of IFADrsquos
target group to all rural people including small- and
medium-scale entrepreneurs in rural areas However
for the purposes of EFA the impact on poor rural
people is the one that matters the most to IFAD24 and
22 See IFAD Lending Policies and Criteria I (5) ldquoIFAD will concentrate its resources upon activities that promise to achieve in a cost-effective way a reduction of poverty in rural areas where most poor people live and work The Fundrsquos major target groups irrespective of the stage of economic development of the country will be the small and landless farmersrdquo
23 From only 3 per cent in 1999 to 46 per cent in 2009 (Raswant and Heinemann 2012)
24 However when possible and relevant distribution of benefits among value chain actors is a complement to CBA
to the poverty-reduction development objectives of
each government
This IFAD specificity has direct consequences for
CBA discussion of the lsquostandingrsquo issue As previously
stated investment projects include a number
of social stakeholders However for IFAD rural
investment projects this is not a major issue as the
formulation of IFAD projects is focused on benefiting
a specific target group poor rural people25
Focusing on lsquotypicalrsquo IFAD rural investment projects and their main benefitsThe typical IFAD project is usually production
oriented26 and its main outcomes (ie financial and
economic benefits) are frequently net production
increases In other words most IFAD projects will
have a direct impact on the production levels
of target groups which in turn will lead to net
income increases
IFAD projects have an impact on the incomes
of poor rural people by increasing their access to
inputs and services that will subsequently increase
their production volumes andor productivity
The most common areas of intervention include
technical assistance (TA) for crops and livestock
through extension services rural finance services
25 There might be exceptional situations in which other social groups could benefit from an IFAD project These cases might require additional analyses (eg distributional effects analysis) when undertaking EFA
26 Of 114 projects reviewed by QE from 2009 to 2011 73 per cent were agriculture- or rural development-related while in 16 per cent the core objective was to strengthen financial services The rest focused on capacity-building or NRM These data show that most IFAD projects can be characterized as production-oriented that is designed to have direct impact on production and productivity increase
EFA of IFAD rural investment projects
18
VOLUME 1 BASIC CONCEPTS AND RATIONALE
to support on-farm investments and increased
access to working capital through creditloan27 or
grant facilities improved water management through
the construction of irrigation structures provision
of storage drying and cooling facilities to enhance
post-harvest preservation and technical advisory
and financial resources to support entrepreneurs
in starting small and microenterprises ndash as well as
combinations of the above
This IFAD specificity leads to some
straightforward requirements when analysing its
financial and economic results First the project
should be assessed in terms of the financial feasibility
and sustainability of targeted beneficiaries second
the project should be assessed in terms of economic
profitability for the whole national economy
Thus in IFAD production-oriented projects the
main household-level goal in financial analysis is to
determine whether the producer28 will have enough
incentives to participate in the project
In simple terms analysis needs to establish
whether the farmer should undertake the proposed
intervention under the criterion that it is financially
viable (ie the benefits over time are higher than the
investment and recurrent costs) and that these net
benefits exceed present returns (ie incremental
benefits are positive)
However even if the new situation (WP) is more
appealing than the present one (WOP) could the
farmer afford to adopt improved practices Although
viable the investment may still not be profitable if it
does not generate enough returns (mostly during the
first years) to cover the farmerrsquos needs Where the
producer is living under the poverty line the project
should at least generate the same net income each
year as in the BAU situation (subsistence system)
to ensure hisher participation Where poverty levels
are lower incomes should be adequate to cover
investment and working capital needs in addition to
27 Comprising inclusive innovativeadapted rural finance products and services including risk management strategies savings financial literacyeducation programmes etc
28 The terms lsquofarmerrsquo lsquoproducerrsquo or lsquoprivate stakeholderrsquo will be used throughout the IGs as synonyms for the term lsquoprivate agentrsquo in financial analysis
the farmerrsquos living expenses The lack of initial capital
to invest is generally a huge barrier to engaging in
a new activity A financial analysis will determine if
farmersrsquo cash flows are adequate to undertake the
activities (ie it will clearly identify a farmerrsquos financial
needs and hisher repayment capacity)
Even when a financing scheme will prove the
feasibility of the investment there are many risks
involved in changing a farmerrsquos practices (business
as usual) above all if it involves taking out a loan
in an uncertain agricultural environment Thus the
last question to be answered is would the farmer
take the risk are there enough incentives Risks
faced by farmers are many and extremely difficult
to manage29 The only measure of their willingness
to change habitstechnologies will be by comparing
their returns to the opportunity costs of remaining
in the actual situation If for example the returns to
labour of the new activity prove to be much higher
than the average rural wage it is probable that a
farmer would be willing to invest his time in his own
farm and take the risk
In other words financial analysis will establish
whether farmers will obtain a net incremental benefit
(financial viability and profitability analysis) if theyrsquoll
have enough working capital to buy the additional
farm inputs or to bear the costs of stocking
processed goods (financial sustainability) and finally
if financial incentives are enough to convince them to
change existing practices
The practical way to undertake this analysis is by
developing different beneficiary productive profiles
ndash considering several types of productive activities
lsquofarm-systemsrsquo and lsquoactivity-modelsrsquo ndash as well as how
many and which types of people generally engage in
these activities in this particular area
On the basis of the individual models of financial
analysis ndash and once the three steps in converting
market prices into their economic value have been
29 For example risks in the areas of production prices casualties technology climate ndash to name just a few
19
VOLUME 1 BASIC CONCEPTS AND RATIONALE
completed ndash economic analysis of the project as a
whole can be undertaken30 This is done by means
of the aggregation that in project analysis is the
process of adding together the costs and benefits
of all the entities participating to reach a summary
account from which a measure of project worth can
be derived The result of the aggregation is the net
incremental benefit or cash flow of the project31
Lastly the goal of economic analysis is to answer
the question of whether it is worthwhile to invest
public resources in the overall project proposal
(should the government invest) It will focus on the
perspective of the entire country and it measures the
effects of the project on the economy as a whole
Unquantified benefits alternative methodologies to CBAThe majority of IFADrsquos projects are production-
oriented interventions in which expected outcomes
are tangible and easily quantifiable however due to
IFADrsquos typical target group many of these projects
are complemented by activities seeking an impact
on less-tangible aspects of rural poverty alleviation
Womenrsquos empowerment increased access to assets
and services enhanced capacities ownership and
land titling are examples of this important part of
IFADrsquos overall project impact However these types
of benefits which are more difficult to measure or not
measurable in monetary terms (intangible benefits)
are often excluded from CBA
In addition environmental and social benefits
resulting from the promotion of resilient agricultural
practices or social infrastructure such as rural roads
irrigation schemes or market infrastructure are also
seldom included in CBA In order to change this
trend these IGs will provide some ideas on how to
allocate value through the use of valid proxies to
measure the impact of these intangible social andor
environmental benefits
30 Some analysts proceed by aggregating the financial analysis and then converting the aggregated results into their economic value It can be argued that this stage of analysis is useless as the financial profitability indicators for the project as a whole have no use in terms of investment decisions
31 See volume 2 and its annex for more details on the lsquoaggregation issuersquo and common mistakes
In the particular case of CDD projects where
communities collectively decide on the allocation
of project resources it is very difficult to foresee
which productive activities will be targeted However
markets and agronomic conditions in the project
area will limit the scope of activities that can be
successfully undertaken In these cases the fact
that communities are making participatory decisions
will grant the additional benefits that ownership
provides ensuring higher adoption rates than
average and increasing the sustainability of the
chosen interventions
In cases where the identification and valuation
of benefits is difficult simple and sensible ways
of estimating tangible benefits should be applied
Table 2 presents an overview of suggested
approaches to transforming such benefits into
tangible values so as to include them in overall
project cash-flow analysis from the most common
complementary activities in IFADrsquos projects
Additionally the IGs will introduce two methods
alternative to CBA for those cases where not even
proxies could be measured cost-effectiveness
and MCA32 The latter has not yet been tested
as a suitable tool in IFAD project designs but is
suggested as an alternative in cases of complex
decision-making
Cost-effectiveness
When tangible benefits from a given investment
are difficult to quantify but the costs are easily
identifiable the most commonly used valuation
method is cost-effectiveness which is used to select
the least-costly alternative among a set of options
that will achieve the same result (a given set of
predetermined objectives) Once the purpose of the
project has been decided for example construction
of a market storage facility cost-effectiveness would
be used to compare scale location technology
etc in order to choose between investment
32 See the technical annex for more details
20
VOLUME 1 BASIC CONCEPTS AND RATIONALE
Project componentsactivity Quantifiable benefits
Productivity enhancement (including irrigation post-harvest and processing) Storage drying cooling facilities irrigation
bull Reduced post-harvest losses
bull Increased value and volumes of production due to investments in storage cooling or small processing facilities (drying or milling)
bull Increased production and productivity due to water provision
Value chain (VC) Collective marketing warehouse receipt systems increased market information
bull Increased value of final product owing to increased quality and access to markets improved handling packaging and commercialization
bull Financial benefits to all actors along the VC
bull Microenterprise and employment creation
bull Creation of internal and external markets that did not exist before investments
Rural roads bull Reduced transport and vehicle maintenance costs (incl vehicle operating costs [VOC] and travel-time costs [TTC])
bull Access to areas not accessible before hence increased total production
bull Increased volume of transported agricultural products for sale (reduced losses)
bull Reduced transport costs due to better access to sales points
Domestic water supply bull Time saved in procuring water
bull Reduced sickness through better water quality
bull Reduced water losses due to leakage
bull Increased productivity through small-plot crop irrigation and through provision of water for livestock
bull Introduction of backyard gardening
Climate adaptation and resilience practices Changes in tillage practices crop rotations landsoil conversion afforestation energy-efficient systems flood prevention
bull Reduced land erosion an estimate of saved nutrient content can be valued at price of fertilizer needed to replace that nutrient content
bull Increased crop timber and livestock yields through soil preservation conservation tillage and agriculture
bull Increased final product value due to labelling as organic agricultural practices
bull Avoided rehabilitation costs for public infrastructure destroyed by natural disasters
bull Energy savings owing to replacement of old practices by eco-friendly artefacts (eco-stoves solar panels etc)
Land registration Land tenure security may translate into increased land value explained by
bull Long-term Investments in land fertility
bull Improved access to credit as land can be used as collateral
bull Greater dynamism of land markets
bull Environmental benefits as a result of better NRM (people improve or maintain forest andor tree cover)
TA BLE 2
Simple sensible ways of valuing different types of benefits
21
VOLUME 1 BASIC CONCEPTS AND RATIONALE
options (eg open storage location of a facility
construction materials) Unfortunately the results of
this method which can justify project investment
decisions cannot be integrated into the streams of
incremental net benefits resulting from classic CBA
thus underestimating the overall benefits of
the investment
Multicriteria analysis
MCA is a decision-making tool for evaluating
complex decision problems where the options
entail many different objectives Unlike CBA MCA
allows consideration of aspects other than economic
and financial ones for example both quantitative
and qualitative data It builds trade-offs between
criteria that in complex decision-making are usually
in conflict (efficiency and equity for example) 33
and is an important instrument in ranking different
options and discriminating between acceptable and
unacceptable possibilities
The main advantages of MCA are its openness
explicitness and power to simplify complex
situations This process eases the discussion and
promotes communication first within the decision-
33 Another example would be when production objectives are in contraposition to environmental ones For example to increase livestock production for food security and at the same time reduce CO2 emissions
Project componentsactivity Quantifiable benefits
Rural finance bull Efficiency gains in financial system can lower operational costs and ensure self-sufficiency and sustainability of financial services supply
bull Shifts in portfolio composition of financial service providers (productive loans versus consumption)
bull Incremental taxation revenues to government
bull Potential productivity increases through financing of working capital (incremental benefits to clientsborrowers)
bull Economic benefits of transfer effects
Community development (CD) bull Improvements in lives of beneficiary households (value these in money equivalents if possible)
bull CD activities result in high empowerment and ownership of project activities which could translate into greater sustainability
Indigenous peoplesrsquo (IPs) knowledge
bull When IPs are supported in applying their knowledge ownership of project activities is ensured as well as sustainability of activities This can translate into low implementation risk and high uptake (adoption rates)
bull Generally IP practice are environmentally friendly thus reducing stress on natural resources
bull Nutritional aspects are also part of the positive impacts
Institutional strengthening bull Improved institutional capacity has generated or will generate benefits for target groups
bull Losses avoided by strengthening the institution looking at the sensitivity analysis assess how delays in implementation (due to institutional weak capacities) affect project outcomes and use that data to calculate losses avoided
Source PTA ndash EFA desk elaboration
22
VOLUME 1 BASIC CONCEPTS AND RATIONALE
making body and later between that body and
stakeholders MCA can be an ex ante (lsquobefore the
factrsquo) and an ex post (lsquoafter the factrsquo) evaluation tool
This type of analysis also presents some difficulties
One concerns definition of the comparative criteria
Use of MCA requires knowledge of mathematical
notions data aggregation methodologies and
computer applications to perform analysis following
a structured process and to avoid weak conclusions
It is often costly and time-consuming
EFA data sources collection and coherenceThe value of EFA as a decision tool hinges on the
quality of the data and assumptions that underpin
it Data availability is a widespread problem for
EFA analysts who should always work in close
collaboration with expert colleagues (agronomy
livestock and rural infrastructure experts) who will
provide or validate the key technical parameters of
the analysis34
Data regarding project costs should be collected
during design missions in consultation with the rest
of the team Once the first results from EFA are
reached they should also be shared with the team
to discuss how they affect expected outcomes and
assumptions For example planned investment costs
may not be sufficient to reach the number of target
beneficiaries outcomes of specific components may
not be appealing from a financial point of view etc
Although it is the responsibility of the EFA analyst
to gather and ensure data consistency among
sources the mission leader should promote and
facilitate dialogue among mission members and
provide sufficient time for the analyst to collect and
process data to ensure EFA quality and coherence35
34 Alternatively FAOSTAT is the most reliable and recommended source of data (httpfaostatfaoorg)
35 It is estimated that at least five weeks are needed for elaboration of a complete EFA one week for data gathering two weeks of mission and two weeks for data processing
For the other parameters of EFA analysis such
as conversion factors and discount rates one
of the most important sources of data is always
the national planning offices If these data are not
available evaluations of completed operations by
the Independent Office of Evaluation of IFAD (IOE)
can be used as a reference36 These can provide
reference values for similar projects or projects
in the same country (and region) for example on
uptake (adoption rates) of a specific technology or
constraints on input availability
Moreover economic and financial analysis in
appraisal reports for the same country (andor region
andor sector) ndash from IFAD and other IFIs such as
the World Bank or regional development banks ndash are
potential sources of information on key parameters
such as discount rates37
However any project analyst should rely on his
her best judgment accumulated through experience
when deciding on the assumptions to be used
36 Evaluations by country and region are available at wwwifadorgevaluationpublic_htmleksystdocprjindexhtm
37 FAOrsquos Monitoring and Analysing Food and Agricultural Policies (MAFAP) programme develops estimates for standard conversion factors the social exchange rate (SER) for different countries and currencies and other important parameters for estimating shadow prices such as the transport costs duties and taxes instrumental in calculating parityborder prices for tradable goods (wwwfaoorgmafaphomeen Country reports can be found at wwwfaoorgmafapproductscountry-reports-technical-notesen)
23
SECTION V
To increase the efficient use of EFA it is important to
view this analysis as an integral part of project design
information and not only as a mandatory study done
for compliance with IFAD quality requirements
To do so there should be continuous review and
refinement of EFA at all stages of the project cycle
It is part of the monitoring and evaluation (MampE) and
knowledge management functions to inform decisions
on adjustments to design and implementation
modalities in pursuit of project objectives
As a first step the data used for EFA in
project design should be periodically updated
by the projectrsquos MampE system and supervision
implementation support missions should verify that
this has taken place If significant changes occur in
the data ndash particularly those for which the sensitivity
analysis showed higher sensitivity ndash the IRR NPV
and cost-benefit ratio should be recalculated
In the light of new data (eg prices for inputs
and outputs demand forecast for project outputs
andor adoption rates) ndash and taking into account
the results of updated EFA including identified
risks and suggested mitigation measures ndash it may
become appropriate during project supervision
andor implementation support missions to decide
to reallocate resources among activities andor
components shifting from those that contribute less
according to the new constellation of data to those
that would contribute more to the projectrsquos objectives
Moreover the EFA spreadsheet prepared during
project appraisal should remain available for review
during project implementation and evaluation This
serves as an indicator of compliance with the EFA
requirement for design documents and the new RMF
indicator as stated in the relevance section It would
also facilitate the updating process indicated in the
preceding paragraph
The purpose of EFA in each phase of the project
cycle including evaluation is indicated in the
following table
TA BLE 3
EFA at different stages of project cycle
Project cycle stage Role of EFA Form of analysis
Concept Definition of investment criteria
bull Purely ex ante ndash all benefits and costs are based on estimates of future values
Project design Resource allocation decisions
bull Purely ex ante ndash all benefits and costs are based on estimates of future values
Supervision ndash early stage
Resource reallocation decisions
Newly Identified risks
bull Mainly ex ante ndash some costs may be ex post but most benefits will still be based on future estimates
Midterm review (MTR) bull Mainly ex ante ndash some costs will be ex post but estimation of future benefits will be based on evidence accrued during first half of project
Supervision ndash later stages
bull About 50 ex post50 ex ante ndash costs will be increasingly based on actual results but benefits are generally lagged by several years at least and will continue to accrue over life of investment
Project completion report (PCR)
Assessment of results bull Mainly ex post ndash all costs and some benefits will be based on actual results but benefit stream for residual life of investment will remain an estimate of future values
EFA role throughout IFADrsquos project cycle
24
VOLUME 1 BASIC CONCEPTS AND RATIONALE
Table 3 also describes the form of analysis
undertaken at each stage of the project cycle which
ranges from purely ex ante during project design to
partly ex post initially with regard to costs and later
to benefits and finally purely ex post for investment
costs but only partly ex post for recurrent costs
and benefits In this example a fully ex post analysis
would only be possible after 20 years which lies
more in the realm of policy analysis than project EFA
Given its purpose EFA is currently used mostly
as an ex ante tool to guide project formulation and
justify investment decisions Nevertheless it could
make a bigger contribution to IFADrsquos mandate for
rural poverty reduction if it were used in some of
the following ways
At concept
bull At COSOP38 andor project conception previous
evaluation ex post reports elements from
previous EFAs or speedy financial assessments
of intended investments could serve as
screening criteria for the validation of proposed
investment ideas For example a previous study
on the investment requirements for a specific
irrigation technology may help establish a
minimum area to be covered by projects in order
to produce sufficient benefits to overcome
project investments
At design
bull For component selection ex ante assessment of
component viability during design
bull For cost validation EFA will confirm whether
estimated project investment costs are sufficient
to cover proposed interventions as well as define
beneficiariesrsquo contributions and their financial needs
bull In the logframe EFA can provide realistic and
consistent outcome indicators
bull For risk management EFA will provide grounded
information for the effective design of mitigation
measures applied to changing circumstances in
order to understand and manage risk
38 Country strategic opportunities programme
At implementation
bull To terminate or modify activities that are not
generating satisfactory financial results for the
intended beneficiaries and economic impact for
the country as a whole
bull For MampE Updating EFA to changing
circumstances will provide up-to-date evidence
of realistic outputs outcomes and impacts As
an MampE and knowledge management tool it can
facilitate learning within and between countries
about what works and what doesnrsquot in terms of
financial and economic impact This knowledge
can also be used to guide the design of country
programmes through the COSOP
bull EFA can also be used as a risk management
tool during implementation Where new risks
are identified or design assumptions are found
to be incorrect remedial action may be needed
including reallocation of resources among
components andor expenditure categories
Early in implementation EFA could contribute
to adaptation to changing circumstances such
as commodity prices production technologies
and institutional and policy changes which
may suggest that different or better approaches
be adopted modifying the design andor
implementation arrangements
At evaluation
bull As an ex post impact assessment tool by
incorporating EFA in IOErsquos PCR and country or
project evaluations in order to compare expected
and actual project results
bull To inform decisions on scaling up or replication
of successful initiatives including the scaling
up of grant-funded activities into full-scale
loan-funded projects
bull Ex post EFA assessment may suggest
discontinuation of approaches that are not
working and scaling up of those that are
25
VOLUME 1 BASIC CONCEPTS AND RATIONALE
Goal bull 20 increased average
income in 29000 HH
C1 bull 29000 farmers linked
with VCbull US$64 m in loans
distributed
C2 bull 29500 HH new crops
amp improved yields 15bull 2000 ha irrigatedbull 83 km rural roads
C3 Overall implementation
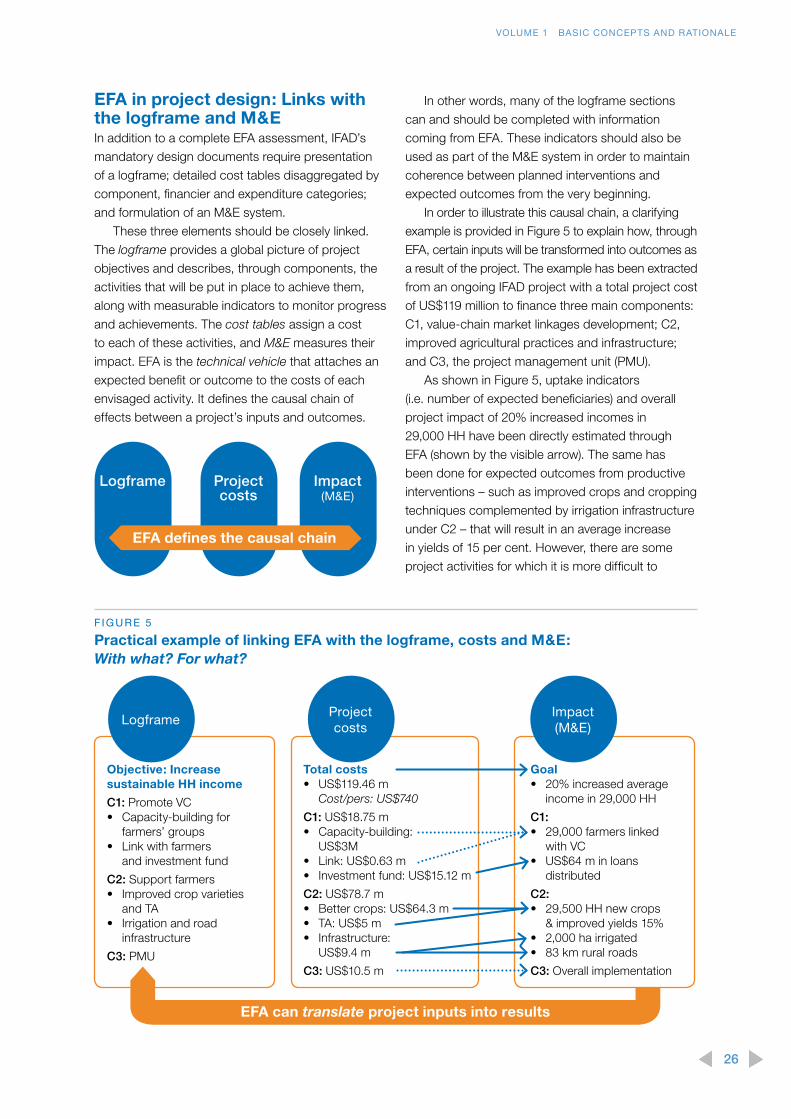
EFA in project design Links with the logframe and MampEIn addition to a complete EFA assessment IFADrsquos
mandatory design documents require presentation
of a logframe detailed cost tables disaggregated by
component financier and expenditure categories
and formulation of an MampE system
These three elements should be closely linked
The logframe provides a global picture of project
objectives and describes through components the
activities that will be put in place to achieve them
along with measurable indicators to monitor progress
and achievements The cost tables assign a cost
to each of these activities and MampE measures their
impact EFA is the technical vehicle that attaches an
expected benefit or outcome to the costs of each
envisaged activity It defines the causal chain of
effects between a projectrsquos inputs and outcomes
In other words many of the logframe sections
can and should be completed with information
coming from EFA These indicators should also be
used as part of the MampE system in order to maintain
coherence between planned interventions and
expected outcomes from the very beginning
In order to illustrate this causal chain a clarifying
example is provided in Figure 5 to explain how through
EFA certain inputs will be transformed into outcomes as
a result of the project The example has been extracted
from an ongoing IFAD project with a total project cost
of US$119 million to finance three main components
C1 value-chain market linkages development C2
improved agricultural practices and infrastructure
and C3 the project management unit (PMU)
As shown in Figure 5 uptake indicators
(ie number of expected beneficiaries) and overall
project impact of 20 increased incomes in
29000 HH have been directly estimated through
EFA (shown by the visible arrow) The same has
been done for expected outcomes from productive
interventions ndash such as improved crops and cropping
techniques complemented by irrigation infrastructure
under C2 ndash that will result in an average increase
in yields of 15 per cent However there are some
project activities for which it is more difficult to
F IGUR E 5
Practical example of linking EFA with the logframe costs and MampE With what For what
Objective Increase sustainable HH income
C1 Promote VCbull Capacity-building for
farmersrsquo groupsbull Link with farmers
and investment fund
C2 Support farmersbull Improved crop varieties
and TAbull Irrigation and road
infrastructure
C3 PMU
Total costs bull US$11946 m
Costpers US$740
C1 US$1875 mbull Capacity-building
US$3Mbull Link US$063 mbull Investment fund US$1512 m
C2 US$787 mbull Better crops US$643 mbull TA US$5 mbull Infrastructure
US$94 m
C3 US$105 m
LogframeImpact (MampE)
Projectcosts
Logframe Projectcosts
Impact (MampE)
EFA defines the causal chain
EFA can translate project inputs into results
26
VOLUME 1 BASIC CONCEPTS AND RATIONALE
measure impact (represented by the fading arrow)
In the example the development of stronger links
between farmers and agribusiness and improved
market access through construction of rural roads
will certainly have an impact on beneficiary access
to markets but this is not easily quantified by
measuring the number of meetings held by these
groups It would be better reflected in increases in
volumes sold and the prices received by farmers
Moreover indirect benefits from project activities
should also account for other rural people that will
benefit from the roads and are also not included in
the analysis Finally several project costs will not
produce any direct benefits but the activities they
fund are fundamental in the delivery of the overall
project For example all costs regarding the PMU
as well as awareness-raising campaigns and other
types of lsquosoftrsquo interventions
In summary the logframe provides a structure
that can help organize the data and assumptions
used in EFA elaboration Key data for estimating
costs and benefits and assumptions made
concerning incremental yields adoption rates etc
should be incorporated into the logframe and used
as indicators in the MampE system
While useful EFA cannot provide all relevant
indicators required in the logframe For example
third-level indicators (eg on reduced stunting or
increased HH assets) in IFADrsquos Results and Impact
Management System (RIMS) will still need to be
collected through baseline surveys in the early phase
of implementation
Finally it is important to distinguish output from
outcome indicators in the logframe39 During the
initial years of a project supervision should focus
on the output indicators As project implementation
proceeds the focus should shift to (or at least
include) outcome indicators which provide key data
to compare with the initial EFA assessment
39 A good practice example of a logframe distinguishing between output and outcome indicators is the Project for Agricultural Development and Economic Empowerment in Cambodia (EB 2012105R15Rev1 wwwifadorggbdocseb105eindexhtm) It should be noted that Annual Reports on Quality Assurance in IFADrsquos Projects and Programmes (eg document EB 200998R57) have called attention to imprecise development objectives and lack of quantified final and intermediate outcome indicators to track progress towards achieving objectives This deficiency also affects the quality of EFA and the possibility of using it during project supervision and implementation support Thus improved quality of the logframe can contribute to improving the quality of EFA and to enhancing its use during this phase
EFA in project design Risk analysisEconomic analysis of projects is by definition
built on uncertain future events Estimation of the
basic elements of this analysis (costs and profits)
inevitably involves explicit or implicit probability
judgments In order to contain and measure
the impact of these uncertainties on project
results there are some techniques that help
detect the lsquocritical variablesrsquo or sources of major
risks and set the basis for introducing effective
mitigating measures
The most common tools used in EFA are the
sensitivity analysis (SA) and the switching value (SV)
analysis40 Both enable testing and measurement
of the effect of changes in key project variables on
the final outcomes of our project and hence its
economic indicators (NPV and IRR) Although SA is
frequently used to assess the robustness of projects
and their resilience to shocks its outcomes are
seldom linked to risk analysis
In other words the most relevant question at
this stage is to know how fluctuation in critical
parameters (eg increases in costs delays in
implementation) will affect project performance and
which of the identified risks are the ones that need
close monitoring
Considering the effects of risks and mitigation
measures identified at the project design stage on
EFA results would not only represent a more realistic
approach to assessing the projectrsquos profitability but
would also help identify the nature of those risks
ndash acknowledged but not mitigated by the project ndash
whose existence is regarded as acceptable
In practical terms the SA tests percentage
increases and decreases in estimated benefits and
costs to assess their impact on NPV and IRR while
the SV provides the percentage change in cost
or benefits that will cause project outcomes to fall
below the minimum level of acceptability (NPV lt 0)
40 In volume 2 the IGs also provide information on more sophisticated tools using probabilistic approaches such as Crystal Ball and Risk
27
VOLUME 1 BASIC CONCEPTS AND RATIONALE
Both analyses are extremely useful if linked to
identified project risks For example SV can identify
benchmarks (maximum percentage increases in costs
or decreases in benefits) for lsquotrigger valuesrsquo to activate
specific mitigation measures (eg if the internal price
of a specific input increases to 30 per cent activities
should shift to an alternative crop)
Another way of looking at this analysis is
through the graphic in Figure 6 Here variations
in expected benefits and costs are represented
in the vertical and horizontal axes respectively
Calculation of the switching values of our project
identifies the maximum reduction in benefits (Bmin)
and the maximum increase in costs (Cmax) that
would result in an NPV of zero Thus the switching
value frontier (SVF) represented by the black line
between Bmin and Cmax encloses all possible
combinations of reduction in benefits and increase
in costs that would bring the NPV to zero Implicitly
the area (O Bmin Cmax) represents the set of all the
different combinations of decrease in benefits and
simultaneously increase in costs that would not
endanger project viability
Once the SVF has been identified and after a
proper evaluation of the country context and project
risks and mitigation measures we could eventually
assume that benefits and costs are very unlikely to
attain the levels represented by the two dotted lines
(B0 C0) As a result we narrow down our uncertainty
area defining a lsquosafe zonersquo identified by the blue area
(A) and a lsquorisky zonersquo identified by the orange area
(R) Area A represents the set of combinations that
falls into the viable cases where increases in costs
or decreases in benefits are not jeopardizing the
overall outcome of the project Area R represents all
the diverse combinations of costs and benefits that
will render the project unprofitable (NPV lt 0)
An analysis including probabilistic approaches
could provide a better understanding of the likelihood
that the project would fall into one of the two areas
and thus assess how much at risk it would be if
certain events occurred Details of these types of
analysis can be found in volume 2
Use of SA to assess project risks an example
SA provides grounded information to the design
team to develop effective mitigation measures for
each identified potential risk The first step then
is to add a proxy to the classic table or section on
project risk of the project design report (PDR) ndash a
proxy that responds to the question How will this
risk affect project performance For example if
F IGUR E 6
Identification of the risk zone
0
A
R
Switching value frontier(NPV=0)
Cmax + Costs
- Benefits
B0
Bmin
Cmax
28
VOLUME 1 BASIC CONCEPTS AND RATIONALE
local implementation capacities are low SA can
test how a delay in implementation of one or more
years (a realistic possibility of this risk occurring) will
affect project outcomes Similarly if there is a high
probability of the introduction of import taxes this
can be tested by increasing input costs
The next step is to closely observe the SA results
in order to assess to what extent these events
will change the profitability indicators (ie project
performance) By answering the question Which
variables need to be closely monitored the project
team can easily identify the lsquocritical risksrsquo and better
allocate resources for their mitigation
In the example below (Table 4 and Table 5)
SA shows that this project is more sensitive to
decreases and delays in benefits than to cost
increases Thus although there is a high risk of the
introduction of import taxes on fertilizer this will not
drastically affect project performance On the other
side delays in implementation are a high risk that
could compromise overall project outcomes Project
teams should allocate more efforts and resources to
mitigate this risk rather than others
To summarize EFA analytical tools can contribute
to risk assessment and informed decision-making
for the efficient allocation of project resources when
designing mitigation measures
TA BLE 4
Risk analysis and mitigation measures (classic table prepared for the PDR)
Risk description Probability of occurrence
Mitigation measure Proxy to compare with SA results
Institutional risksLow local implementation capacity
High Capacity-building Delays in benefits
Market risks Import duties on fertilizer High Local production Increased costs
Climate risks Floods Low Infrastructure Reduced benefits
TA BLE 5
Sensitivity analysis for informed decision-making
SA Base case
( 12)
Costs increased Decrease in benefits Delay of benefits
+10 +20 +50 -10 -20 -50 1 year 2 years
IRR 28 27 25 21 22 20 18 23 19
NPV (lsquo000 US$)
37 160 8 068 6 895 3 376 4 047 2 949 1 564 5 173 1 984
29
VOLUME 1 BASIC CONCEPTS AND RATIONALE
EFA in project supervision implementation and ex post evaluationThe underlying principles for the use of EFA in project
implementation are no different from those for project
design and are detailed in a number of old and
well-known sources Squire and van der Tak (1975)
Gittinger (1985) Belli et al (1998) and IFADrsquos draft EFA
guidelines of September 2012 However although the
principles are the same the methods of application
differ to some extent as shown in Table 6
The approach to EFA both before and during
project implementation should be tailored to
the nature of the project What to look for in the
field and the type of analysis undertaken vary
considerably among different project categories
More detailed information is provided in Table 7 in
the technical annex
Ex ante and ex post EFA
It is important to distinguish between ex ante and ex
post EFA and to appreciate their roles in the various
stages of the project cycle Ex ante is the more
familiar form of EFA Undertaken as a key part of the
project design process it is used to inform decision-
making on the nature of the project and its expected
financial and economic impacts Ex post EFA is
undertaken after an investment project has been
completed There are also intermediate forms of
analysis undertaken during project implementation
which are partly ex post and partly ex ante
It is important to distinguish between the
implementation period and the life of the investment
The implementation period typically five to seven
years is the period in which project activities are
undertaken and IFAD funds disbursed The life of
the investment is much longer typically 20 years
or more during which economic and financial
benefits are expected to accrue Figure 7 shows
a typical IFAD project profile with the investment
costs incurred during years 1-5 recurrent costs
over the 20-year project life and benefits beginning
to flow in year 3 and reaching a plateau from
year 10 onwards
TA BLE 6
Application of general principles of EFA
Key principle Methods of application
Ex ante EFA Implementation
With and without project comparison
Prepare lsquobusiness as usualrsquo scenario on the basis of lsquodo nothingrsquo option
bull Conduct baseline survey to define pre-project status
bull Estimate what would have happened without the project
bull Paired comparisons can help (eg inoutside project area)
Financial analysis Construct farm models showing expected revenue and expenditure for beneficiaries
bull Survey beneficiaries to estimate actual revenue and expenditure
bull Validate andor adjust farm models accordingly
Discounting future benefits and costs
Discount future costs and benefits back to year zero
bull Discount future and previous benefits and costs back to year zero
Accounting for externalities
Identify and quantify all externalities where possible
bull Check for signs of positive and negative externalities emerging during implementation
Adjusting for distortions Deduct taxes add subsidies use shadow prices estimate conversion factors
bull Check for changes in tax and subsidy rates and adjust prices accordingly
bull Update conversion factors on the basis of trade andor tariff data
30
VOLUME 1 BASIC CONCEPTS AND RATIONALE
Methodological issues of ex post and
ex ante analysis
The key aspect to understand when performing
this analysis is that as shown in Figure 7 project
costs and benefits will occur in different moments of
project life
Methodologically speaking if this analysis will
be used for comparison of appraised (ex ante) and
real impacts (ex post) (as is generally the goal) we
need to lsquoplacersquo the comparison in the same point in
time The point in time could be at the beginning or
completion of the project or any other point What
is important is to bring all cash flows to that point in
time using discount techniques Then calculate the
NPVs and compare You will be able to use IRRs only
if the cash flow allows it mathematically (ie if there is
a negative Figure in the first year)
But this is not the only consideration to bear in
mind Other issues arise such as
bull Attribution effects of achieved results given
IFADrsquos scale of intervention it could claim
contribution but not full attribution of increased
beneficiary incomes or decline in food insecurity
bull At completion could be too early to capture all
expected benefits (see Figure 7)
bull A mixed approach in order to compensate for
this second issue is to try to estimate benefits
yet to be produced include them in cash flows
and then perform the discounting (however the
results could be questioned)
bull In order to make a realistic comparison CBA
should be done 10 years after implementation
and this has rarely been done
On a more positive note the alternative would be
to choose some activityfarm models effectively
put in place by the project Perform a financial
analysis at completion and compare it with appraisal
estimations (models developed at design for the
WOP situation) in order to estimate how things
have changed This analysis will not be based on
cash flows but on annual bases thus comparing
F IGUR E 7
Profile of costs and benefits over the project cycle
0
20
40
60
80
100
120
Investment costs
Recurrent costs
Benefits
MTR
Supervision EvaluationDesign
PCR
1Years
2 3 4 5 6 7 8 9 10 11 12 13 14 15 16 17 18 19 20
Implementation period years 1-5
Life of the investment years 1-20
31
VOLUME 1 BASIC CONCEPTS AND RATIONALE
annual financial indicators such as total sales total
production costs employment created Hopefully
full development of the model would have been
achieved by completion so as to provide information
on how adequate project interventions had been
This could also potentially provide information on the
reasons underpinning adoption rates
Ex post EFA and scaling upConfronted with the large-scale problem of reducing
rural poverty which it is mandated to address
and the limited resources available from official
development assistance (ODA) IFAD is compelled
to increase the impact of every dollar it invests in
agriculture and rural development For this reason
scaling up the results of successful development
initiatives is an overarching priority that directly
supports the achievement of IFADrsquos mandate To
deliver on this priority IFADrsquos operational practices
must be geared towards supporting all concerned
actors and institutions ndash including poor rural women
and men and their organizations ndash in achieving
impact at scale
The formal IFAD definition of lsquoscaling uprsquo is
expanding adapting and supporting successful
policies programmes and knowledge in order to
leverage resources and partners to deliver larger
more sustainable results for a greater number of
poor rural people Scaling up results means that
IFAD interventions will not be viewed as a way of
expanding small projects into larger ones Instead
they will focus on how successful local initiatives
will sustainably leverage policy changes additional
resources and learning to bring the results to scale
EFA has an important role to play in informing
scaling-up decisions since evidence of favourable
financial and economic impacts should be a key
criterion for deciding whether or not to scale up
Thus the framing questions must incorporate an
economic and financial dimension as follows
bull Idea If a project is referred to as one that is
being scaled up or otherwise further developed
from previous interventions in the host country
or region what were the economic and financial
outcomes of the activity to be scaled up Have
economic and financial impacts been estimated
or measured
bull Vision How many poor rural men and women
will benefit financially and to what extent What
will be the overall economic impact
bull Drivers Are the economic and financial benefits
sufficiently attractive to drive the expansion and
sustain the initiative over the long term
bull Spaces Is there sufficient capacity to finance
the proposed expansion Is the local regional or
national economy large enough to accommodate
it Can markets absorb the level of production
envisaged
bull Pathways What are the financial and economic
implications of alternative scaling-up pathways Is
a gradual or a fast-track approach preferred
bull IFADrsquos role How will IFAD ensure that economic
and financial impacts of the expansion are
properly monitored and evaluated
Scaling-up issues often need to be addressed during
COSOP formulation or country portfolio reviews
especially where grant-funded pilot programmes
have been implemented and are being considered
for scaling up into full-scale investment projects In
these cases EFA of pilot programmes during and
after implementation becomes an important part of
the strategic process
32
Formulas for profitability indicatorsThe net present value (NPV) indicator defined as
the sum that results when the expected costs of the
investment are deducted from the discounted value
of the expected benefits (revenues) is calculated
through the following formula
Where
Bt = benefits at time t Ct = costs at time tIt = investment costs n = project economic life
r = interest rate used as indicator of opportunity
cost discount rate
The internal rate of return (IRR) indicator is defined
as the discount rate (r) that produces a zero NPV
This represents the maximum interest rate that a
project could face and still not waste resources
This is called the internal rate of return (IRR) It is
calculated through
IRR = (r NPV = 0)
For the project to be profitable the IRR has to be
greater than the interest rate that could be earned in
alternative investments thus whenever IRR gt r the
project is considered viable If the (alternative) interest
rate (imkt) is lower than the IRR the NPV is positive
and vice versa
The benefitcost ratio (BC) indicator is the ratio of
the present value of benefits to the present value of
costs over the time horizon The BC ratio provides
some advantages when it is necessary to formulate
a lsquorankingrsquo of alternative investment projects under
budget constraints
If BC ge1 the project is accepted
If BC lt1 the project is rejected
Cost-effectivenessWhen tangible benefits from a given investment
are difficult to quantify but the costs are easily
identifiable the most common valuation method
is cost-effectiveness It is used to select the least
costly alternative among a set of options that will
achieve the same result (a given set of predetermined
objectives) Once the purpose of the project has
been decided for example construction of a market
storage facility cost-effectiveness would be used to
compare scale location technology etc to choose
among investment options (eg open storage
location of the facility construction materials)
The methodology consists in first listing and
measuring in monetary terms the costs of the
options available and then comparing them with
the costs occurring in the base scenario (without
the project) Total costs are then discounted at
year 1 and the results compared to identify the
cheapest intervention In other words valuation by
cost-effectiveness consists in comparing on a
present-worth basis all alternatives that can achieve
the same benefit (Gittinger 1985) and selecting the
least costly
IRR NPV 0gt gti mkt
IRR NPV 0lt lti mkt
IRR NPV 0gt gti mkt
IRR NPV 0lt lti mkt
IRR NPV 0gt gti mkt
IRR NPV 0lt lti mkt
IRR NPV 0gt gti mkt
IRR NPV 0lt lti mkt
Technical annex
33
VOLUME 1 BASIC CONCEPTS AND RATIONALE
Unfortunately the results of this method which
can justify project investment decisions cannot be
integrated into the streams of incremental net benefits
resulting from classic CBA ndash thus underestimating
the overall benefits of the investment
Multicriteria analysis41
MCA is a decision-making tool used to evaluate
complex decision problems With this tool it is
possible to identify overall preferences among
alternative options where the options entail many
diverse objectives Unlike CBA MCA allows
consideration of aspects other than economic and
financial ones for example social technological and
environmental issues Its use is particularly relevant
when other single-criterion approaches cannot
provide monetary valuations42
In the same model thanks to these techniques
it is possible to consider quantitative and qualitative
data It builds on trade-offs between criteria that
in complex decision-making are usually in conflict
(efficiency and equity for example) Choices are
classified aggregating various items of information
in a common index of utility value Since policy
decisions may be influenced by both monetary
and non-monetary objectives it offers a technique
capable of ranking diverse outcomes
MCA establishes preferences among options
referring to a set of objectives identified by decision
makers It is an important instrument for ranking
options and discriminating between acceptable and
unacceptable possibilities Decision makers must
define quantifiable criteria to judge how an objective
has been achieved and MCA allows them to
41 MCA has not yet been tested as a suitable tool for IFAD project design but is suggested as an alternative in the extreme cases mentioned above of complex decision-making
42 One example would be when production objectives are in contraposition to environmental ones For example to increase livestock production for food security and at the same time reduce CO2 emissions
aggregate the data on individual criteria in order to
provide indicators of the overall performance of the
options It brings out the points of view of the actors
involved in the judgment and is characterized by the
subjectivity related to the opinions of the decision-
making group43
The main advantages of MCA are its openness
explicitness and its power to simplify complex
situations In fact it splits the components of
intricate situations and organizes them so as to find
a solution step by step and clearly Objectives and
criteria chosen by the decision group can in fact be
analysed and changed if they are not considered
suitable This process eases the discussion and
promotes communication within the decision-making
body first and later between that body and the
stakeholders MCA can be both an ex ante and an ex
post evaluation tool
This type of analysis also presents some
difficulties One concerns the choice of the activities
or variables to be studied and definition of the
comparative criteria These operations are often
very complicated and require much time spent
in discussions and negotiations Use of MCA
requires knowledge of mathematical notions
data aggregation methodologies and computer
applications in order to perform analysis following a
structured process and to avoid weak conclusions
It is often costly and time-consuming
43 Indeed the opinion team establishes objectives and criteria assesses relative importance weights and judges the contribution of every option to each performance criterion MCA can be preceded by strengths weaknesses opportunities and threats (SWOT) analysis for the choice of criteria it can be supported by an expert panel to help the negotiating group develop an assessment of a specific topic or it can be assisted by focus groups questionnaires and case studies to choose criteria and rate them In addition criteria can be evaluated using cost-effectiveness analysis
34
VOLUME 1 BASIC CONCEPTS AND RATIONALE
Types of projects and EFA activitiesAspects to look for in the field and the type of
analysis undertaken vary considerably among project
categories as shown in Table 7
TA BLE 7
Main EFA tasks by type of project
Project category Main EFA tasks during implementation
Productivity enhancement (including irrigation)
bull Estimate number of beneficiaries and technology adoption rates by target group households
bull Monitor productivity changes product quality and prices
bull Estimate gross margins (per unit of land and labour) for project and non-project households
bull Update farm models based on observedactual results revise economic analysis as necessary and consider adjustments to project design to improve results
Rural infrastructure bull Review construction schedule and costs relative to design estimates
bull Estimate utilization rates for new or upgraded infrastructure
bull Assess arrangements for operation and maintenance
bull Estimate benefits derived by target group households (eg reduced costs increased prices improved market access)
bull Update farm models based on observedactual results revise economic analysis as necessary and consider adjustments to project design to improve results
Natural resource management
bull Undertake a comparison of NRM activities with and without project
bull Review with and without project scenarios of agricultural productivity
bull Seek evidence of more sustainable and responsible NRM practices
bull Identify and if possible quantify value of environmental benefits
bull Update farm models based on observedactual results revise economic analysis as necessary and consider adjustments to project design to improve results
Community development bull Determine number of target group beneficiaries participating in community development activities
bull Identify what has changed in the community and individual households as a result of these activities
bull Describe improvements in the lives of beneficiary households and value these in monetary equivalents if possible
bull Revise economic analysis as necessary and consider adjustments to project design to improve results
35
VOLUME 1 BASIC CONCEPTS AND RATIONALE
Project category Main EFA tasks during implementation
Institutional strengthening bull Prepare inventory of actual institutional-strengthening activities undertaken
bull Complete assessment of institutional capacity and projectrsquos impact on it
bull Identify how improved institutional capacity has or will generate benefits for target groups
bull Revise economic analysis as necessary and consider adjustments to project design to improve results
Marketing and value chain development
bull Review value chain analysis undertaken during project preparation to update data on volumes costs prices and value addition
bull Identify ways in which improvements in value chain efficiency have improved or are likely to improve market access and farmgate prices for beneficiaries
bull Estimate financial benefits accruing to target group farmers and other value chain actors
bull Update farm models based on observedactual results revise economic analysis as necessary and consider adjustments to project design to improve results
Rural financial services bull Estimate number of beneficiaries with improved access to financial services types of services offered and acceptance rates
bull Monitor cost of financial services at different levels (cost of loanable funds retail service costs at client level) and compare with project design estimates
bull Assess actual or likely changes in farm and non-farm economic activities arising from improved access to rural financial services
bull Estimate the net financial benefits accruing to target group beneficiaries from these changes
bull Update farm models based on observedactual results revise economic analysis as necessary and consider adjustments to project design to improve results
36
Anandajayasekeram P CJ Van Rooyen F Liebenberg 2004 Agricultural project planning and analysis A sourcebook Second Edition Network Activity Program ndash Institutional University Cooperation (IUC) between the Flemish Universities of Belgium and University of Pretoria
Asian Development Bank 2013 Cost-benefit analysis for development A practical guide Manila httpwwwadborgdocumentscost-benefit-analysis-development-practical-guide
Australian Department of Infrastructure and Planning Queensland Government 2012 Project assurance framework ndash Cost benefit analysis guidelines Brisbane Queensland Australia
Belli P J Anderson H Barnum J Dixon and J-P Tan 1998 Handbook on economic analysis of investment operations Washington DC Operational Core Services Network Learning and Leadership Center World Bank httpsiteresourcesworldbankorgINTCDDResourcesHandbookEApdf
Belli P 2001 Economic analysis of investment operations Analytical tools and practical operations Washington DC World Bank
Campell H R Brown 2003 Benefit cost analysis financial and economic appraisal using spreadsheet Cambridge University Press
CIFOR 1999 Guidelines for applying multi-criteria analysis to the assessment of criteria and indicators Bogor Indonesia Center for International Forestry Research wwwcifororgacmmethodstoolbox9html
Department for Communities and Local Government 2009 Multi-criteria analysis A manual London httpeprintslseacuk127611Multi-criteria_Analysispdf
DFID 2011 Guidance for country offices on measuring and maximising value for money in cash transfer programmes London Department for International Development (UK)
European Commission 2008 Guide to cost-benefit analysis of investment projects Brussels httpeceuropaeuregional_policysourcesdocgenerguidescostguide2008_enpdf
FAO 1979 Economic analysis of forestry projects Case studies FAO Forestry Paper No 17 Supp 1 Rome Food and Agriculture Organization of the United Nations
FAO 1995 Guidelines for the design of agricultural investment projects Investment Centre Technical Paper No 7 Rome Food and Agriculture Organization of the United Nations
FAO 2010 Estimating mitigation potential of agricultural projects An application of the EX-ante carbon balance tool (EX-ACT) in Brazil Rome Food and Agriculture Organization of the United Nations
Gittinger J Price 1985 Economic analysis of agricultural projects Washington DC Economic Development Institute World Bank httpdocumentsworldbankorgcurateden198501437966economic-analysis-agricultural-projects
Government of South Africa 2004 Cost-benefit analysis Pretoria Department of Environmental Affairs and Tourism
IFAD 2012 Review of post-harvest systems in IFAD programmes Rome
Jenkins G C Kuo A Harberger 2011 Cost-benefit analysis for investment decisions httpwwwqueensjdiexecorgpublicationsqed_dp_206pdf
Lewis DL 1999 Road user and mitigation costs in highway pavement projects Washington DC Transportation Research Board National Research Council
Mishan EJ 1971 Cost-benefit analysis London George Allen and Unwin
Potts D 2002 Project planning and analysis for development httpswwwriennercomtitleProject_Planning_and_Analysis_for_Development
Raswant V and E Heinemann 2012 Access to markets Making value chains work for poor rural people Rome IFAD
Squire L and HG van der Tak 1975 Economic analysis of projects Baltimore MD USA Johns Hopkins University Press
References
37
VOLUME 1 BASIC CONCEPTS AND RATIONALE
Treasury Board of Canada 2007 Canadian cost-benefit analysis guide Ottawa Secretariat Treasury Board of Canada analys-engpdf
UNIDO 1972 reprinted 1993 Guidelines for project evaluation Order No IDSERH2 Vienna United Nations Industrial Development Organization
UNIDO 1986 Manual for evaluation of industrial projects Vienna United Nations Industrial Development Organization wwwunidoorgfileadminuser_mediaPublicationsdownloadManual_for_Evaluation_of_Industrial_Projectspdf
USAIDINDIA 2000 REFORM Project compendium with practitionersrsquo guide State fiscal management reform Vol V Project appraisal practitionersrsquo guide New Delhi US Agency for International DevelopmentIndia httppdfusaidgovpdf_docsPNADM777pdf
World Bank 2013 Investment Project Financing Economic Analysis Guidance Note httpsiteresourcesworldbankorgPROJECTSResources40940-1365611011935Guidance_Note_Economic_Analysispdf
World Bank 2012 A guide to assessing needs Essential tools for collecting information making decisions and achieving development results by Watkins R Meiers M amp Visser Y httpsopenknowledgeworldbankorgbitstreamhandle109862231663920PUB0EPI00essing09780821388686pdfsequence=1
38
Glossary
Aggregation 15 16 20 in project analysis the process of adding together the costs and benefits of all the entities participating in a project to reach a summary account from which a measure of project worth can be derived Often the result of the aggregation is the Incremental Net Benefit or Cash Flow of a project
Appraisal 7 24 31 A before the fact (ex- ante) evaluation of a proposed investment project to determine its merit and acceptability in accordance with established decision-making criteria
Benefitcost ratio (BC ratio) 13 33 a discounted measure of project worth The ratio of benefits to costs It should be calculated using the present values of each discounted at an appropriate discount rate Most often the opportunity cost of capital The ratio should be at least 1 for the project to be acceptable It may give incorrect ranking among independent projects and cannot be used for choosing among mutually exclusive alternatives
Border price 23 The border price is the unit price of a traded good at the countryrsquos border For exports it is the FOB (free on board) price and for imports it is the CIF (cost insurance and freight) price
Business as Usual (BAU) 8 9 11 14 19 a reference scenario which assumes that future evolution is an extension of the current trends See also lsquodo nothing scenariorsquo
Cash flow 11 12 16 19 20 31 The funds generated or used by the project Reflects the costs and benefits over time from a stated point of view Incomebenefit is a positive cash flow and expensescosts are negative flows
Constant price A price that has been deflated to real terms by an appropriate price index They should be distinguished from current or nominal prices Often used as synonym of real prices
Contingent valuation A method of inferring the value of benefits and costs in the absence of a market What people would be willing to pay to gain a benefit (or willing to accept in recompense for a loss) if a market existed for the good
Conversion factor 5 16 23 30 the factor that converts the domestic market price to an economic price Conversion factors are the ratios of economic to financial prices Thus a conversion factor is a number that is used to convert the domestic market price of an item into its economic opportunity cost to the
economy by multiplying the market price of the item by the conversion factor
Cost An expense related to purchase of inputs including capital equipment buildings materials labour and public utilities Costs such as environmental damage or injuries to health are sometimes referred to as negative externalities
Cost Benefit Analysis (CBA) 7 8 18 31 conceptual framework applied to any systematic quantitative appraisal of a public or private project to determine whether or to what extent that project is worthwhile from a social perspective Cost-benefit analysis differs from a straightforward financial appraisal in that it considers all gains (benefits) and losses (costs) to social agents CBA usually implies the use of economicsocial prices
Cost effectiveness analysis (CEA) 20 33 an appraisal technique used in projects and programs in which benefits cannot be reasonably measured in money terms Cost-effectiveness analysis is used in one of two forms to select least-cost alternatives either holding constant the level of benefits and varying the level of costs or holding constant the level of cost and varying the level of benefits In either form the ratio of cost to benefits is known as the cost-effectiveness ratio
Current prices (Nominal prices) prices as actually observed at a given time They refer to prices that include the effects of general inflation and should be contrasted with constant prices
Cut-off rate the rate below which a project is considered unacceptable It is often taken to be the opportunity cost of capital The cut-off rate would be the minimum acceptable internal rate of return for a project or the discount rate used to calculate the net present value the net-benefit investment ratio or the benefit-cost ratio
Depreciation 14 Not a term used in cost-benefit analysis In other financial frameworks depreciation is the allocation of the cost of an asset over time Depreciation is a method of allocating the cost of a tangible asset over its useful life For accounting purposes depreciation indicates how much of an assetrsquos value has been used up For intangible assets amortization is the correct term However these are accounting concepts that makes no sense in financial analysis Here the full investment costs will be computed every time the asset needs replacement
39
VOLUME 1 BASIC CONCEPTS AND RATIONALE
Direct transfer payment 15-17 Transfer payments are transfers of money among residents of a country without a corresponding exchange of goods and services Taxes are transfer payments from individuals to the government Subsidies are transfer payments from the government to individuals Gifts are transfers ldquoin kindrdquo from one individual to another Because transfer payments are not made in return for goods and services they do not add to total output When transfer payments occur in the context of projects they redistribute project costs or benefits from the project entity to some other group or individual in the country
Discount rate 12 14 16 23 the interest rate at which future values are discounted to the present It usually represents the cost of capital for the person or entity calculating the net present value of the stream The financial discount rate and economic or social discount rate may differ in the same way that market prices may differ from economic prices The selection of the discount rate in financial analysis is a relative straightforward process and that is calculated as the potential gains of alternative safe investments on the market In economic analysis where project viewpoint is overturned toward the socio-economic context this parameter needs to be estimated properly so as to i) reflect the public nature of the investment ii) account for scarcity of resources and iii) ensure good use of public funds (See also social discount rate)
Discounted cash flow 14 The costs and benefits (cash flows) discounted to present values to give a common basis for comparison
Discounting 12 31 The process of adjusting future values to an equivalent present value at a stated point in time by a discount rate
Distortion 16 30 A difference between market prices and true values (economic prices) A distortion is any interference with market forces that renders the resulting quantity produced and price different from the price and quantity that would result under conditions of perfect competition
Distributional effect A change in the income or wealth of the people from whose point of view the benefit-cost analysis is done
Do nothing scenario the baseline scenario lsquobusiness as usualrsquo against which the additional benefits and costs of the lsquowith project scenariorsquo can be measured (often a synonym for the lsquowithout projectrsquo scenario)
Economic analysis 7 14-17 20 30 analysis that is undertaken using economic values reflecting the values that society would be willing to pay for a good or service In general economic analysis values all items at their value in use or their opportunity cost to
society (often a border price for tradable items) It has the same meaning as social cost-benefit analysis
Economic cost The economic cost of an activity or resource is the cost to society of that activity or resource Economic costs include the private costs borne directly by economic agents undertaking the activity and all other costs borne by other economic agents For example the economic costs of driving automobiles include the private costs of petrol plus the additional costs of congestion borne by other users of the roads plus the costs of pollution borne by society in general
Economic impact analysis the analysis of the total effects on the level of economic activity (output income employment) associated with the intervention This kind of analysis focuses on macroeconomic indicators and forecasts the influence of the project on these indicators It goes beyond CBA when very large projects are considered in relatively small economies
Economic net present value (ENPV) 16 The net present value of a project calculated using true or economic values Synonymous with social net present value
Economic price 16 Price that reflects the relative value that should be assigned to inputs and outputs if the economy is to produce the maximum value of physical output efficiently There is no consideration of income distribution or other non-efficiency goals in such a price Synonymous with efficiency price and true price
Economic rate of return (ERR) 16 An internal rate of return based on economic prices and social opportunity costs of capital expressing the socio-economic profitability of a project (See internal rate of return)
Environmental impact analysis the statement of the environmental impact of a project that identifies its physical or biological effects on the environment in a broad sense This would include the forecasting of potential pollution emissions loss of visual amenity and so on
Export parity price 23 footnote The export parity price is the FOB price of a good or service valued at point of export net of taxes and subsidies and suitably adjusted for internal transport costs to a location in a country The export parity price is the net-of-taxes-and-subsidies price that exporters would need to receive for a good or service sold in the domestic market in order to make them indifferent between selling in the domestic market or exporting
Externalities 5 15-17 30 A benefit or cost falling on third parties who normally cannot pay or be compensated for it through a market mechanism An external benefit is a positive externality an external
40
VOLUME 1 BASIC CONCEPTS AND RATIONALE
cost is a negative externality A positive externality may reduce the costs of a production process of an unrelated economic agent as when the bees of a bee grower pollinate a neighbourrsquos apple orchard They may also increase the enjoyment of another economic agent as when musicians playing for their own pleasure delight those around them A negative externality increases the production costs or reduces enjoyment for another economic agent Traffic congestion and the numerous forms of environmental pollution such as the pollution created by a manufacturing plant are examples of negative externalities Externalities are not reflected in the financial analysis For economic analysis however it is necessary to take such externalities into account and place a value on them
Ex-ante evaluation 24-25 30 the evaluation carried out in order to take the investment decision It serves to select the best option from the socio economic and financial point of view It provides the necessary base for the monitoring and subsequent evaluations ensuring that wherever possible the objectives are quantified
Ex-post evaluation 24-25 30-32 an evaluation carried out a certain length of time after the conclusion of the initiative It consists of describing the impact achieved by the initiative compared to the overall objectives and project purpose (ex-ante)
Farm gate price The price received by farmers for their products net of transport costs to the market where the products are sold
Feasibility study 9 19 a study of a proposed project to indicate whether the proposal is attractive enough to justify more detailed preparation It contains the detailed technical information necessary for the financial and economic evaluation
Financial analysis 7 14-17 19 30 31 the analysis carried out using market prices and taking a commercial point of view It allows one to 1) verify and guarantee cash balance (verify the financial sustainability) 2) calculate the indices of financial return on the investment project based on the net discounted cash flows
Financial sustainability analysis 14 19 20 analysis carried out in order to verify that financial resources are sufficient to cover all financial outflows year after year for the whole time horizon of the project Financial sustainability is verified if the cumulated net cash flow is never negative during all the years considered
Financial rate of return An internal rate of return based on market prices and opportunity costs of capital(See internal rate of return)
Human capital Human capital is the stock of skills and productive knowledge embodied in people The
purpose of investing in human capital is to improve the productivity of human beings
Impact 25-27 a generic term for describing the changes or the long term effects on society that can be attributed to the project Impacts should be expressed in the units of measurement adopted to deal with the objectives to be addressed by the project
Import parity price 23 footnote The import parity price is the CIF price of a good or service valued in a specific geographical location It includes the CIF price of the good suitably adjusted for transport costs net of taxes and subsidies The import parity price aims to measure the price that producers in the country would receive for a good or service produced in the country for sale in the domestic market under conditions of free trade
Incremental 11-14 19-20 Additional or marginal
Inflation A general increase in market price levels (a fall in the general purchasing power of the currency unit)
Input 26 28 That which is consumed by the project (as opposed to the projectrsquos output) Usually refers to the physical inputs used by the project including materials capital labour and public utilities Inputs like environmental quality foreign exchange and workersrsquo health are usually termed externalities
Internal rate of return (IRR) 12 33 The yield or profitability of a project based on discounted cash-flow analysis The IRR is the discount rate at which a stream of costs and benefits has a net present value of zero It is equivalent to the discount rate r that satisfies the following relationship
IRR NPV 0gt gti mkt
IRR NPV 0lt lti mkt
where Bt is the benefit stream and Ct is the cost stream The internal rate of return is compared with a benchmark in order to evaluate the performance of the proposed project The internal rate of return is then compared with the market rate of interest to determine whether or not a proposed project should be undertaken (See cut-off rate)
Financial Rate of Return is the internal rate of return calculated when all the inputs and outputs are calculated using financial values Economic rate of Return is based on economic opportunity costs
Logframe 10 25-27 is a management tool mainly used for designingand MampE of development projects It consists of four steps (1) establishing objectives (2) establishing cause-and-effect relationships (causal linkages) among activities inputs outputs and objectives (3) identifying assumptions underlying the causal linkages and (4) identifying objectively-verifiable measures for evaluating progress and success
41
VOLUME 1 BASIC CONCEPTS AND RATIONALE
Market price 14-17 (a) The price of a good in the domestic market (see financial prices) as opposed to the economic price shadow price or social price (b) the cost of a good including indirect taxes and subsidies It is the price relevant for financial analysis
Model A representation or simulation of a system or process showing how parameters benefits and costs interact to produce a bottom-line result by which the project can be judged
Monitoring 25-27 the systematic examination of the state of advancement of an activity according to a pre-determined calendar and on the basis of significant and representative indicators
Multi-criteria analysis 22 34 MCA is an evaluation methodology that considers many objectives by the attribution of a weight to each measurable objective In contrast to CBA that focuses on a unique criterion (the maximisation of social welfare) Multi Criteria Analysis is a tool for dealing with a set of different objectives that cannot be aggregated through shadow prices and welfare weights as in standard CBA
Mutually exclusive 8 12 13 Alternatives that cannot be undertaken simultaneously if one alternative is carried out the other cannot be The alternatives may be mutually exclusive because they represent alternative times of beginning the same project because funds are limited or because if one is carried out the other will not be required (for example a choice between a thermal and a hydro power station)
Net present value (NPV) 12 13 27-29 33 The net value of an investment when all costs and benefits expressed in standard units of value (numeraires) are summed up The sum that results when the discounted value of the expected costs of an investment are deducted from the discounted value of the expected revenues The net present value of a stream of costs and benefits is a number that results from discounting the values of the stream at a given discount rate It is equivalent to the number that results from the following expression
IRR NPV 0gt gti mkt
IRR NPV 0lt lti mkt
whereBt = benefits at time t Ct = costs at time tIt = investment costs n = project economic lifer = discount rate
Net revenues the amount remaining after all outflows have been subtracted from all inflows Discounting the incremental net revenues before financing gives a measure of the project worth of all resources engaged discounting the incremental net revenues after financing gives a measure of the project worth of the entityrsquos own resources or equity
Nominal prices Prices prevailing in a particular year Synonymous with budget-year dollars
Non-tradable good 16 23 footnote good or service that by its very nature cannot be exported or imported Land and buildings are examples of a non-tradable good
Non-traded good 16 23 footnote A non-traded good or service is one that is neither exported nor imported in a particular country for a variety of reasons including quotas and prohibitions Common examples of non-traded items are certain drugs haircuts etc In project analysis non-traded refers to goods and services not traded by the country in which the project is located
Numeraire a standard unit of value Money is a numeraire by which the values of different commodities can be compared In cost-benefit analysis the numeraire is the common denominator for measuring benefits and costs Widely used numeraires are the willingness to pay or aggregate consumption numeraire and the foreign exchange numeraire
Operational and maintenance costs 21 35 The recurring costs for operating and maintaining the value of physical assets
Opportunity cost 12 16 19 The best alternative return foregone elsewhere by committing assets to the project The value of something foregone For example the direct opportunity cost of a person-day of labour is what the person would otherwise have produced or being paid for that day of work The value of a resource in its best alternative use For the financial analysis the opportunity cost of a purchased input is always its market price In economic analysis the opportunity cost of a purchased input is its marginal social value in its best non-project alternative use
Output 27 That which is produced Usually refers to the physical product of the project Other effects of the project such as housing for workers employment training of labour and foreign-exchange savings are usually called externalities
Payback period The time required for the cumulative present value of benefits to become equal to the cumulative present value of costs
Programme 8 is a portfolio of multiple projects that are managed and coordinated as one unit with the objective of achieving common (often intangible) outcomes and benefits at sector country or even multi-country level
Project 8 is a temporary entity established to deliver specific (often tangible) outputs in line with predefined time cost and quality constraints A project should always be defined executed and evaluated relative to an approved business plan which balances its costs benefits and risks
42
VOLUME 1 BASIC CONCEPTS AND RATIONALE
Project analysis 8 20 the analytical framework for the evaluation of a projectrsquos feasibility and performance It includes the analysis of the context the objectives technical aspects demand forecasts and financial and economic costs and benefits Project analysis is needed to determine if given the alternatives a proposed project will sufficiently advance the objectives of the entity from whose standpoint the analysis is being undertaken to justify the project
Project cycle 24-25 30-31 a sequence of the series of necessary and pre-defined activities carried out for each project Typically it is separated into the following phases conceptualization inception formulation appraisal ex-ante evaluation financing implementation and ex-post evaluation
Real prices calculated by adjusting market prices by an appropriate price index to eliminate the effects of inflation Prices of goods and services change over time either because the general price level rises that is because of inflation or because the underlying conditions of supply and demand change Real prices refer to prices of goods and services that reflect changes in the underlying conditions of supply and demand but that do not reflect the effects of inflation The terms real prices and constant prices are used interchangeably but referring to real prices as constant prices is misleading Real prices do not necessarily remain constant over time as they change in response to changes in supply and demand Real prices should be distinguished from current prices which reflect inflation as well as changes in supply and demand
Relative prices the exchange value of two goods given by the ratio between the quantity exchanged and their nominal prices
Risk 10 25-27 The degree to which outcomes are uncertain The extent of possible variation in the outcome
Risk analysis 10 25-27 Risk analysis is a technique for assessing the expected net present value of a project in relation with project risks By taking into account the probability distribution of critical variables and the correlations among them it enables analysts not only to assess the expected net present value of a project but also its associated probability distribution In cost-benefit analysis it recognizes the simultaneous variation of the values of several inputs according to specified ranges and probabilities and analyses the resulting variability in the bottom line
Scale 31-33 The size of a project
Scenario 11 14 30 An outline or portrait of a possible future usually portrays unfolding events rather than being static in time
Sensitivity analysis 16 27-29 Sensitivity analysis is an analytical technique to test systematically the
effects on a projectrsquos outcome of changes in its basic assumptions Sensitivity analysis is carried out by varying one element or a combination of elements and determining the effect of that change on projectrsquos profitability indicators (NPV and IRR)
Shadow price 16 23 footnote 30 A shadow price of a good or service is the economic opportunity cost to society of that good or service The true or economic value of a good (as opposed to the market price which might be distorted) Synonymous with economic or social price
Social price 16 A price that reflects the true value to the country of inputs and outputs of the project Synonymous with economic price and shadow price
Social discount rate 12 footnote 16 It attempts to reflect the social view on how the future should be valued against the present (See Discount rate)
Socio-economic costs and benefits 13 opportunity costs or benefits for the economy as a whole They may differ from private costs and benefits to the extent that actual prices differ from economic prices
Switching value 27-28 The switching value of a variable is that value that it would have to attain in order for the outcome of the project to fall below the minimum level of acceptability (net present value of the project equal to nil)
Time value of money Time value of money refers to the concept that money received in the present is more valuable than money received in the future It is the concept underlying discounting
Tradable 16 23 footnote Referring to a good that could be traded internationally in the absence of restrictive trade policies
Traded good 16 23 footnote A traded good is a good that is either exported or imported by some country
Transfer payments 15-17 22 Payments that redistribute wealth but do not use up resources or create them
Willingness to pay What consumers are willing to pay for a good or service Consumers willing to pay substantially more than the actual market price enjoy a consumer surplus (the amount they would pay minus the amount they actually have to pay)
With project scenario (WP) 11 Box 2 estimation simulation modelling of project envisaged costs and benefits
Without project scenario (WOP) 11 Box 2 the baseline scenario against which the additional benefits and costs of the with project scenario can be measured (eg business as usual)
43
VOLUME 1 BASIC CONCEPTS AND RATIONALE
Steps in economic analysis
Economic analysis requires assessment of a projectrsquos net impact on economic welfare
by considering
5 Convert all market prices into economicshadow prices (SP) that better reflect the social
opportunity cost of the good
6 Remove transfer payments (taxes and subsidies) and quantify externalities (positive
and negative)
7 Aggregate all modelsrsquo NIB cash flows respecting incorporation phasing patterns of targeted
beneficiaries into projectrsquos activities
8 Compare aggregated benefits with other project costs to obtain incremental discounted
cash flows Calculate economic performance indicators adopting a social discount rate
ENPV ERR BC ratio
9 Perform sensitivity analysis (SA) in order to deal with the main risks and uncertainties that
could affect the proposed project
Steps in financial analysis
The typical sequence of tasks to be undertaken in financial analysis is the following
1 Develop farmenterprise models and identify benefits and costs (investment and recurrent) for
WOP and WP scenarios (based on crop budgets)
2 Compare the discounted flows of benefits and costs and calculate the differences between the
obtained results and the WOP scenario in order to determine the net incremental benefits (NIB)
of the proposed interventions
3 Calculate the project financial profitability indicators of each model (ie financial NPV financial
IRR and BC ratio) applying these investment criteria to make an investment decision
(positive or negative)
4 Assess family incomes and establish financingcredit needs by performing a lsquosustainability analysisrsquo
Summary steps in financial and economic analysis
44
WP-WOP develop and identify
Develop farmenterprise models and identify benefits and costs (investment and recurrent) for WOP and WP scenarios (based on crop budgets)
Calculate indicators
Calculate the project financial profitability indicators of each model (ie financial NPV financial IRR and BC ratio) applying these criteria to make an investment decision
Financial sustainability
Assess family incomes and establish credit needs by performing a lsquosustainability analysisrsquo
Discount flows ndash costs and benefits
Compare the discounted flows of benefits and costs and calculate the differences between the obtained results and the WOP scenario in order to determine the net incremental benefits (NIB) of the proposed interventions
Shadow prices
Convert all market prices into economicshadow prices (SP) that better reflect the social opportunity cost of the good
Aggregation
Aggregate all modelrsquos NIB cash flows respecting incorporation phasing patterns of targeted beneficiaries
Cash flows
Compare aggregated benefits with other project costs to obtain incremental discounted cash flows Calculate economic performance indicators adopting a social discount rate ENPV ERR BC ratio
Transfers and externalities
Deduct taxes and subsidies ndash Consider positive and negative externalities
Perform sensitivity analysis
in order to deal with the main risks and uncertainties that could affect the proposed project
1
5
6
7
8
9
2
3
4
Economic analysisFinancial analysis
EFA step by step
International Fund for Agricultural Development
Via Paolo di Dono 44 - 00142 Rome ItalyTel +39 06 54591 - Fax +39 06 5043463E-mail ifadifadorgwwwifadorgwwwruralpovertyportalorg
ifad-unblogspotcom
wwwfacebookcomifad
instagramcomifadnews
wwwtwittercomifadnews
wwwyoutubecomuserifadTV
Contacts EFA desk
Eloisa de Villalobos Thomann
EFA Technical Adviser Tel +39 06 5459 2827Email edevillalobosifadorg
Enrico Mazzoli
Technical Adviser Tel +39 06 5459 2462Email emazzoliifadorg
- Acknowledgements
- Contents
- Abbreviations and acronyms
- Section I - Introduction
-
- Background
- Scope
- Outline
- How to read the guidelines
-
- Section II - Relevance of EFA
-
- Relevance of economic and financial analysis
- EFA as a decision-making tool in project planning
-
- Section III - Basic concepts in undertaking EFA
-
- Investment criteria profitability indicators
- Economic and financial analysis the differences
-
- Section IV - EFA of IFAD rural
-
- Focusing on lsquotypicalrsquo IFAD rural investment projects and their main benefits
- Unquantified benefits alternative methodologies to CBA
- EFA data sources collection and coherence
-
- Section V - EFA role throughout
-
- EFA in project design Links with the logframe and MampE
- EFA in project design Risk analysis
- EFA in project supervision implementation and ex post evaluation
- Ex post EFA and scaling up
-
- Technical annex
-
- Formulas for profitability indicators
- Cost-effectiveness
- Multicriteria analysis
- Types of projects and EFA activities
-
- References
- Glossary
- Summary steps in financial and economic analysis
-

IFADrsquoS INTERNAL GUIDELINES
Economic and Financial Analysis of rural investment projects
Basic concepts and rationale
1
copy 2015 by the International Fund for Agricultural Development (IFAD)
Printed August 2015
AcknowledgementsThese guidelines have been developed by the
economic and financial analyses (EFA) technical
team in the Policy and Technical Advisory Division
(PTA) as a resource book to address the recurrent
problems faced by the Fund in the elaboration of
this analysis during project design and supervision
Building on existing and renown manuals as well as
practical cases these guidelines are the product of
an intensive consultation process with colleagues
both inside and outside IFAD
These guidelines are the result of a team effort
the first draft being developed by the author (Eloisa
de Villalobos EFA technical adviser) with substantial
contributions from Chiara Calvosa and Graciela
Gutman The final version has been improved with
sections developed by David Young and Enrico
Mazzoli as well as the constant support critiques
and contributions from Ruy de Villalobos
The EFA team would like to particularly thank the
following people for their contributions Internally
they have been discussed and reviewed with the
IFAD Thematic Group on EFA as well as the Quality
Assurance team and peer reviewed by Brian Baldwin
(IFAD) Michael Hamp (IFAD) James Garret (IFAD)
Ed Heinemann (IFAD) Shantanu Mathur (IFAD) Kris Hamel (IFAD) Maria Elena Mangiafico (IFAD)
Philipp Baumgartner (IFAD) Francesca Carpano
(IFAD) and Bertrand Reysset (IFAD)
The external reviewers included Gordon Temple
(WB) Jock Anderson (WB) Pedro Belli (WB)
Amnon Golan (WB) Osvaldo Feinstein (WB) and our
colleagues from FAOTCI
Finally beyond all these contributions PTA
takes full responsibility for any inaccuracies that
may persist These guidelines are conceived as a
dynamic tool precisely to incorporate corrections
and timely contributions
Section IIntroduction 5
Background5
Scope 5
Outline 6
How to read the guidelines6
Section II Relevance of EFA 7
Relevance of economic and financial analysis 7
EFA as a decision-making tool
in project planning 7
Section III Basic concepts in undertaking EFA 11
Investment criteria profitability indicators 12
Economic and financial analysis
the differences 13
Section IVEFA of IFAD rural investment projects 18
Focusing on lsquotypicalrsquo IFAD rural
investment projects and their
main benefits 18
Unquantified benefits alternative
methodologies to CBA 20
EFA data sources collection
and coherence 23
CONTENTS
Section VEFA role throughout IFADrsquos project cycle 24
EFA in project design Links with
the logframe and MampE 26
EFA in project design
Risk analysis 27
EFA in project supervision implementation
and ex post evaluation 30
Ex post EFA and scaling up 32
Technical annex 33
Formulas for profitability indicators 33
Cost-effectiveness 33
Multicriteria analysis 34
Types of projects and EFA activities 35
References 37
Glossary 39
3
BC benefitcost ratio
BAU business as usual
CBA cost-benefit analysis
CDD community-demand-driven
CF conversion factor(s)
COSOP country strategic opportunities programme
CPM country programme manager
EFA economic and financial analysis
ENPV economic net present value
ERR economic internal rate of return
FNPV financial net present value
FRR financial internal rate of return
HH household
IFI international financial institution
IGs internal guidelines
IOE Independent Office of Evaluation of IFAD
IRR internal rate of return
MampE monitoring and evaluation
MCA multicriteria analysis
NPV net present value
NRM natural resource management
PMU project management unit
PTA Policy and Technical Advisory Division
QA quality assurance
QE quality enhancement
RMF Results Measurement Framework
SA sensitivity analysis
SP shadow prices
SV switching value (analysis)
TA technical assistance
VC value chain
WOP without project
WP with project
ABBREVIATIONS AND ACRONYMS
4
Introduction
illustrated by good examples (c) provide standards
for presenting assumptions and findings and for
the information to be included in project design
documents their annexes and working papers and
(d) guide selection of for example the discount
rate inclusion of externalities and application of
shadow prices andor conversion factors (CFs) and
their justification
ScopeThe main scope of these guidelines is to help country
programme managers (CPMs) in their project design
dialogue with governments as well as to help
mission leaders and EFA analysts in the performance
of their tasks related to project EFA The IGs should
be considered an open and dynamic document
which will be regularly updated to introduce changes
andor complement information following the needs
of its main users
These guidelines are by definition an auxiliary
methodological tool in meeting EFA requirements at
IFAD They do not pretend to substitute for the large
bibliography on EFA and cost-benefit analysis (CBA)
developed by academics and other international
financial institutions (IFIs) that analysts may consult1
Finally any project analyst should rely on hisher
best judgment refined through experience when
deciding on the methodology and assumptions to
be used These IGs as with any guidelines are not
a substitute for these essential qualities It is hoped
however that they will help reduce the scope of
subjective judgment in project EFA as well as bring
some standardization to the presentation of results
1 See list of references
SECTION I
BackgroundSince the quality enhancement (QE) process was
established in 2008 project reviewers at both the
quality enhancement and quality assurance (QA)
stages have identified areas of weakness in IFADrsquos
use of economic and financial analysis (EFA) in
project design For example of the 38 projects
the QE process reviewed during 2011 8 per cent
had not submitted an EFA and in 24 projects
EFA issues were identified At the QA stage EFA
recommendations have surfaced for 20 per cent
of the projects
Specific areas of concern range from technical
considerations regarding the quality of the analyses
and data (poor assumptions poor presentation of
the analysis and technical issues such as the use
of shadow pricing conversion factors and discount
rates) to broader issues regarding the use of EFA
as a tool in project design (activity selection logical
framework [logframe] design and risk analysis)
As a first step the Policy and Technical
Advisory Division (PTA) in collaboration with the QA
secretariat organized a workshop in October 2011
with international experts and practitioners involved
in project EFA to establish a consensus regarding
internationally accepted standards and best practice
The need for internal guidelines (IGs) for EFA of IFAD
projects emerged as one of the workshoprsquos main
recommendations It was suggested that the IGs
should (a) be directed to staff and practitioners in
charge of carrying out EFA (including government
officers) as well as to reviewers and advisers to
familiarize them with these analyses (b) be simple
and hands on including minimum criteria for EFA
5
VOLUME 1 BASIC CONCEPTS AND RATIONALE
F IGUR E 1
EFA guidelines outline
OutlineThe guidelines are divided into three volumes as
shown in Figure 1 Volume 1 highlights the relevance
of EFA to investment projects in general presenting
some basic technical concepts and briefly describing
the process of classic EFA It also explains the
use of different EFA elements throughout design
implementation and supervision of development
projects A short presentation of alternatives
methods to EFA such as cost-effectiveness and
multicriteria analysis (MCA) are also included in
this volume Volume 2 is the core of these IGs and
defines minimum requirements for the elaboration
of comprehensive EFA of IFAD rural investment
projects All detailed steps of analysis are presented
and illustrated through a hypothetical example the
Guideland Rural Development Project An annex to
volume 2 offers technical notes practical tips quality
checklists and suggested tables for the presentation
of results Volume 3 presents a set of practical
examples on the assessment of quantitative benefits
in cases in which project activities are not directly
related to production or productivity objectives
(eg rural finance projects climate adaptation
initiatives community-demand-driven [CDD] or
capacity-building projects)
How to read the guidelinesThese IGs are directed to two different audiences
The first includes CPMs country programme
officers government officers and anyone designing
andor implementing IFAD projects who are
making informed decisions and need to know the
basic concepts of EFA For this group volume 1
will provide all the information needed to use EFA
results for example linking EFA outcomes and
assumptions to define benchmark indicators for the
logframe or using sensitivity analysis to inform the
risk assessment exercise The second audience is
the EFA analyst In volumes 2 and 3 she will find
IFADrsquos minimum requirements for quality standards
a practical example illustrating all the steps required
to perform analysis and suggestions on the
presentation of results Answers to the most frequent
questions and identification of the most common
mistakes are provided in text boxes
Basic concepts and rationale
Minimum requirements
Case studies
IFADrsquoS INTERNAL GUIDELINES
Economic and Financial Analysis of rural investment projects
32
1
6
Relevance of economic and financial analysisEFA originated as a central tool in ensuring efficient
allocation of government spending It was meant
to ensure that public funds were efficiently used in
all major public reconstruction and infrastructure
investments mostly following World War II Since the
1960s CBA has been recognized as the major lsquopre-
investment toolrsquo in facilitating investment decisions
on public investments and policy
EFA of investment projects is a basic requirement
for investor and recipient decision-making in
project investment and financing Currently most
IFIs (eg the African Development Bank (AfDB)
Asian Development Bank (AsDB) Inter-American
Development Bank (IDB) and World Bank (WB))
require an EFA when deciding project financing and
they guide recipient governments accordingly
IFAD has recognized the need to ensure the
viability of its operations so that member states can
borrow funds in the knowledge that repayments
can be generated from project benefits and not
place themselves in unsustainable debt situations
Consequently IFAD acknowledged the relevance of
economic and financial analysis as a requirement for
project approval in its founding documents (see the
Agreement Establishing IFAD article 7 section I[d] 2
and the IFAD Lending Policies and Criteria [III (26)])3
Initially undertaking of EFA was very common
in IFAD project designs but a shift away from
production-oriented programmes towards
community-based and capacity-based projects in
the 1990s changed the degree to which designs
were able to produce robust EFA With value chains
2 ldquohellip eligibility for assistance shall be on the basis of objective economic and social criteriahelliprdquo
3 ldquoThe Fund taking due account of hellip the principle of economic viability of projectshelliprdquo
now emerging as a focus ndash and more generally
with greater attention given to the issue of project
efficiency ndash the need is shifting back towards
a more-classical approach to EFA Today it is
considered a priority for IFAD and under IFAD10 4 one of the indicators of the corporate Results
Measurement Framework (RMF) is that loan-financed
projects receive a published and verifiable
economic analysis5
These guidelines seek to demonstrate the
utility of EFA analysis throughout the participatory
planning design implementation and evaluation
of projects This is indispensable to good project
appraisal and lets decision makers assess the overall
value of a project including the likelihood that target
beneficiaries will adopt the interventions proposed
The following sections demonstrate that
EFA provides information both to understand the
convenience of private investments for target
beneficiaries and to prove to governments that
public resources will be efficiently allocated
EFA as a decision-making tool in project planningAll the development programmes and initiatives
are made of projects Projects are the main
tool governments use to encourage and shape
development They allow us to transform into
practice ideas highlighted in the poverty reduction
strategy papers
A clear distinction can be made between
projects and programmes although the two
concepts are tightly related
4 The Tenth Replenishment of IFADrsquos Resources
5 Indicator 427 ldquoshare of projects with a published and verifiable economic analysis (yearly)rdquo Revised IFAD10 RMF (2016-2018)
SECTION II Relevance of EFA
7
VOLUME 1 BASIC CONCEPTS AND RATIONALE
Programme is a portfolio comprised of multiple
projects that are managed and coordinated as one
unit with the objective of achieving common (often
intangible) outcomes and benefits at sector country
or even multi-country level
Project is a temporary entity established to
deliver specific (often tangible) outputs in line with
predefined time cost and quality constraints A
project should always be defined and executed and
evaluated relative to an approved business plan
which balances its costs benefits and risks
Whenever a project involves the decision to
use available economic resources (eg productive
capital infrastructure human capital knowledge) in
the anticipation of future benefits it is an lsquoinvestment
projectrsquo In brief an investment project is the decision
to make current expenditures in the anticipation of
future benefits
IFADacutes main activity is the financing of rural
investment projects through loans and grants EFA
provides clear and simple indicators to ensure that
a projectrsquos investments generate the anticipated
benefits at household and project levels Thus
IFAD requires this analysis in its project formulation
documents Apart from country-level decisions EFA
results are also used to inform approval decisions in
QEQA processes and by the Executive Board
In summary the main purpose of EFA is to
ensure an efficient allocation of resources proving
to governments the benefit of implementing one
particular investment rather than another option
which could be the lsquodo nothingrsquo alternative (Figure 2)
EFA is the most appropriate tool in appraising the
convenience of carrying out a project for both
the direct beneficiaries and the national economy
as a whole
Thus when appraising the economic and
financial viability of any project one must first
examine the lsquobusiness as usualrsquo (BAU) or lsquowithout
projectrsquo alternative and then compare it with proposed
options What the analyst needs to assess is the
value added (incremental approach) of the project
As a major methodological tool EFA makes use
of CBA but it also allows for other approaches
and studies such as cost-effectiveness and
multicriteria analyses Because costs and benefits
do not occur at the same time ndash with costs generally
preceding and exceeding benefits during the first
years of the project and benefits especially in
the agriculture sector being realized gradually
over a longer time period ndash the comparison is not
straightforward Hence lsquodiscounting techniquesrsquo
are applied This issue will be further developed in
the following sections
CBA was created as a lsquopre-investment toolrsquo
to facilitate investment decisions In these types
of ex ante decision-making tools there is a
trade-off between the amount invested in the
ex ante studies and the probability of making a
wrong investment decision
F IGUR E 2
Decision-making in project formulation
Decisionalternatives
Decision
criteria If XgtY recommend the project
Do not undertake the project
Resources for alternative
uses
Value of alternative
usesBenefit = Y
Undertake the project
Resources allocated to the project
Value of project
outcome Benefits = X
8
VOLUME 1 BASIC CONCEPTS AND RATIONALE
F IGUR E 3
Guiding questions during project assessment
Should resources be invested in this project
Could people afford to adopt the proposed intervention
Would they take the risk to change current practices
Viability
Feasibility
Uptake
BOX 1
Guiding questions
Should the government invest its scarce resources in this particular intervention Should the
producer adopt the proposed intervention
Replying to these questions will ensure that the proposal is solid from a technical financial and
economic point of view Analysis should assess the viability of the investment and compare it
with alternatives (at least with the presentBAU situation) to ensure that the project is generating
additional value This information is also used to ensure the economic profitability of the project
as a whole
Could the producer afford the proposed technology
From a purely financial point of view are available resources adequate for the producer to invest
in the proposed intervention If these resources are not sufficient alternative financing schemes
should be assessed by the project (eg loans savings schemes insurance grants) In addition
other context-specific restrictions should be considered at this stage ndash such as input availability
labour requirements and legal restrictions ndash that could be a barrier to modifying current practice
Would the producer take the risk Would the government take a loan to finance
this project
This is one of the most relevant questions for all project implementers Are incentives high enough
to convince producers to change their current situation Here not only monetary incentives
should be considered but also social cultural and environmental ones
A proper risk analysis would identify the critical economic parameters the government should
consider when making its investment decisions
The ability to support decision-making is a
key element of EFA It provides solid indicators for
answering questions regarding lsquothe best alternativersquo
from the points of view of different actors
Figure 3 shows guiding questions for the
assessment of any investment project and
box 1 provides more information on how these
can be used
9
VOLUME 1 BASIC CONCEPTS AND RATIONALE
The various steps in EFA provide information
to respond to these questions taking into account
that the decision is not simple projects require time
to develop and one wants to make certain that the
improvements in peoplersquos lives are permanent
EFA requirements technical and
institutional viability
EFA is only one part of the overall analysis of a
project it assumes that the project is technically
sound and that its institutional arrangements will
be effective during implementation In other words
EFA of investment projects requires at the least
that the project under analysis be feasible from the
technical and institutional points of view Projects
can be implemented through different institutional
arrangements and using different technical solutions
For a project to be viable at least one of these
institutional arrangements needs to be valid and at
least one technical solution needs to be viable As
will be seen the application of EFA during project
formulation will also help identify and select the lsquobestrsquo
project technical and institutional alternatives This
is a strong assumption as the review of numerous
cases has shown many inconsistencies in project
technical formulation
Commonly identified inconsistencies include
(a) incomplete or inadequate description of the
institutional arrangements for carrying out the
proposed project components (b) incomplete or
inadequate identification of constraints on productive
development For example the project (i) proposes
a new technology but there is no assessment
of the on-farm working capital requirements for
adopting it and consequently the project lacks the
required financing component (eg grants credit)
(ii) plans huge investments in irrigation facilities
but no provision has been made for the required
technological transfer services and working capital
needs (iii) proposes improvement of rural financial
services but there is no description of the expected
productive activities and technologies to be adopted
through the support of these facilities
Thus reviews of the technical proposals and
institutional arrangements for project implementation
are steps prior to EFA They involve preparation of an
adequate project logframe (reviewed at each stage
of the project cycle) which is essential in confirming
institutional viability
10
This section illustrates basic concepts so that the
non-specialist can become more familiar with the
terminology and purpose of EFA However detailed
information on carrying out EFA of projects is
provided in volume 2 of these guidelines
EFA is based on comparison of the net6 cash
flows of investment alternatives The present or
BAU cash flow is compared with at least one
other investment alternative which according
to the projectrsquos technical specialists will result in
amelioration of the producerrsquos situation
6 Net cash flows defined as Benefits discounted cash flow net from costs discounted cash flows
However in order to assess if the project is
making good use of public funds the costs of
implementing it (including the institutional setting
and capacity-building of both implementers and
producers) must be compared with the benefits
produced In other words the value added by the
project is compared with the incremental costs of
implementing it
In practical terms the analyst models diverse
beneficiary livelihood strategies to compare BAU
situations with the project proposal Description
of the BAU or without project (WOP) situation
although simple at first sight can confuse the analyst
regarding many aspects (box 2)
BOX 2
With project (WP) and without project (WOP) scenarios common issues
Accurate description of both WP and WOP scenarios is essential to a realistic assessment of
incremental benefits
1 WOP equal to zero When the project proposes development of a new activity many analysts
represent the WOP as a null scenario because the activity wasnrsquot present in the past
However the correct approach is to realistically represent the alternative activities
(eg off-farm employment)
2 Static or unrealistic WOP Generally WOP scenarios are presented as a static situation that
repeats itself through the years This is often underestimating the capacity of people to adapt
and progress Projects generally assist these processes and accelerate their returns
3 An inaccurate WP fails to assess the incremental net value of the project In a woodlot project
in Malawi that aimed to produce firewood analysts spent a great deal of time studying how
to value the incremental wood production since there was no market for the wood Finally
they decided on an international valuation of the energy created They missed the point In
the without situation women spent a great deal of time travelling to procure firewood with
the project they could spend their time producing more maize If the analysts had developed
realistic WOP and WP situations they would have realized that the benefits of the project
came from incremental maize not wood production
Basic concepts in undertaking EFA
SECTION III
11
VOLUME 1 BASIC CONCEPTS AND RATIONALE
Next one needs to formulate the WP situation
defining expected outcomes in the future by
identifying the requested investment and operating
costs as well as projecting estimated benefits7 In
order to convert future costs and benefits which do
not occur at the same time into todayrsquos values for
comparison discounting techniques are applied
Discounting permits comparison of the value of
money in different time periods considering that
a dollar today is worth more than a dollar received
tomorrow (ie the fact that we have to postpone
consumption makes tomorrowrsquos dollar less valuable
than todayrsquos) How much is $1 received in lsquonrsquo years
worth today The answer depends on the adopted
discount rate (r) and the discount period (n)8
Thus the aggregation of project flows occurring
in different years requires adoption of an appropriate
discount rate to calculate the present value of future
flows As a guiding principle discount rates should
represent the opportunity cost of capital for the
agent (producer or government)9 The other essential
element in discounting is definition of the discount
period (also called lsquoproject economic lifersquo or lsquotime
horizon analysisrsquo)
Usually the discount period is equivalent to the
lifespan of the largest investment components of
the project10
Finally the project net cash flows (ie financial
andor economic)11 are based on the incremental
approach which results from comparing the
WP and WOP situations With these elements it
is possible to calculate the corresponding project
lsquoprofitability indicatorsrsquo
7 The analysis is looking at future investments and outcomes thus sunk costs are irrelevant
8 The present value (PV) = future value(1+r)n If r = 10 and n = 8 years the present value of $1 would be $051
9 For the producer a realistic alternative is an average of the passive deposit rate of local commercial banks The government should instead consider the interest rate at which the country can actually borrow capital from a relevant international capital market alternatively the return on long-term public treasury bonds is also a suitable option More information on determining a relevant discount rate is provided in volume 2
10 This rule might change when (i) technological progress would make the investment obsolete before the end of its useful life (ii) the investment period is lsquotoo longrsquo (ie very common in environmental projects ship construction etc) or (iii) other factors exist (ie legal institutional etc) that justify another specific choice for the discount period
11 See the following subsection for differences between the two
Investment criteria profitability indicatorsGenerally speaking a project is considered lsquoviablersquo
if the sum of expected incremental benefits is
larger than the sum of all costs accrued in project
implementation This can be assessed through
profitability indicators12 The most relevant indicators
for these IGs are the net present value internal rate
of return and benefitcost (BC) ratio
bull The net present value (NPV) indicator is defined
as the sum that results when the expected
costs of the investment are deducted from
the discounted value of the expected benefits
(revenues) Whenever NPV gt 0 the project is
considered worthwhile or profitable Among
mutually exclusive projects the one with the
highest NPV should be chosen
bull The internal rate of return (IRR) indicator is
defined as the discount rate (r) that produces
a zero NPV This represents the maximum
interest rate that a project could face and still
not waste resources
For the project to be profitable the IRR has
to be greater than the interest rate that could be
earned in alternative investments thus when
IRR gt r the project is considered viable If the
(alternative) interest rate (imkt) also called opportunity
costs of capital is lower than the IRR the NPV is
positive and vice versa
IRR NPV 0gt gti mkt
IRR NPV 0lt lti mkt
12 Formulas can be found in the technical annex
12
VOLUME 1 BASIC CONCEPTS AND RATIONALE
Both NPV and IRR are calculated on the same
project cash flows of incremental net benefits
However in certain cases the calculation of
IRR is not possible and thus it cannot be used as a
profitability indicator
This is the case when (a) the flow of net
incremental benefits does not have a negative
element or (b) it presents more than one IRR
complicating the decision as to which one to
consider as the profitability indicator
Moreover IRR is an indicator that should not be
used to rank or select mutually exclusive project
options as it cannot provide a measure of the size or
magnitude of project value13 (box 3)
The NPV on the other hand is an indicator that
can always be calculated as is the case with the
benefitcost ratio
bull The (BC) ratio indicator is the ratio of the
present value of benefits to the present value
of costs over the time horizon The BC ratio
provides some advantages when a ranking of
alternative investment projects is needed under
budget constraints
If BC ge 1 the project is accepted
If BC lt 1 the project is rejected
13 Where a project is the only alternative proposal to the status quo the issue is whether the IRR provides worthwhile additional information Views differ in this respect Some argue that there is little merit in calculating a statistic that is either misleading or subservient to the NPV Others see a role for the IRR in providing a clear signal as regards the sensitivity of a projectrsquos net benefits to the discount rate Yet whichever perspective is taken this does not alter the broad conclusion on the general primacy of the NPV rule
These IGs consider that the most appropriate
indicator for appraising an investment project is
the NPV as the investment decision criterion is
straightforward if NPV is gt 0 the project is viable
It means that the proposed investment is a profitable
alternative in terms of resource allocations It is better
than the present and WOP situations and also better
than allocating the same resources to other economic
activities that will yield the average profit rate
Economic and financial analysis the differencesAll investment projects include a number of
stakeholders and this has implications for the
valuation of the benefits and costs accrued by
project interventions Whose costs and benefits
count14 Governments and society as a whole will
consider and value costs and benefits differently
from producers or any other private actor individually
From the perspective of a development agency such
as IFAD both points of view are relevant to a reply
to the guiding questions stated before Should the
government invest in this project Will the producer
take the risk
14 In the CBAEFA literature the question of lsquowhose costs and benefits countrsquo is known as the lsquostandingrsquo issue (ie whose welfare counts in the aggregation of net benefits)
BOX 3
IRR or NPV
Although the most appropriate indicator for appraising an investment project is the NPV ndash as it
can always be calculated and will provide information on the magnitude of the return ndash the IRR is
the most commonly used This is probably due to the fact that IRR is expressed as a percentage
which is often wrongly associated with other rates of return such as interest rates (r) or profit rates in
alternative allocations In fact the IRR has no meaning in terms of project value or size
To prove this letrsquos suppose a project is one thousandth the size of another project Simply multiply
each side of the equation by 1000 The calculated IRR will not change but the small project entails
less value The project to be chosen from a social point of view would be the one producing the
bigger returns to the economy and the NPV will clearly show this while the IRR will not
13
VOLUME 1 BASIC CONCEPTS AND RATIONALE
In order to consider these points of view analysis
will be conducted on two levels (a) financial analysis
will consider private stakeholdersrsquo interests15 and
(b) economic analysis will consider government
and society perspectives These two viewpoints will
require the analyst to consider different items
when looking at the benefits and costs of a project
valuate them differently and in some cases even
use different rates to discount the streams of costs
and benefits
The private investor exclusively considers the
costs and benefits related to the productivemarket
aspects of the project while analysis from an
economic point of view considers that benefits are
defined as an increase in social well-being16 The
costs are defined as reductions in social well-being
For a project to be economically viable its social
benefits must exceed its social costs
15 This point of view is also applied to the executing agency of a public project
16 The term lsquosocial welfarersquo or lsquowell-beingrsquo is used in these IGs as a simple monetary measure The definition is taken from neoclassical economics and prevailing economic theories of well-being No attempts are made to include any type of measurement of subjective happiness or to develop any well-being indexes or social indicators
Thus from the perspective of a private
stakeholder (financial analysis) participating in the
investment with risk capital the wealth created by
a project in lsquonrsquo periods of time is defined as the
financial NPV (FNPV) The economic or cost-benefit
analysis looks at the overall impact of the project
and takes the point of view of the collective agent
(eg society) and the wealth created by a project in
lsquonrsquo periods of time is defined as the economic NPV
(ENPV) of the investment produced by the project17
In financial analysis all costs and benefits
should be valued at market prices Only cash inflows
and outflows are considered (depreciation reserves
and other accounting items not corresponding to
actual flows are excluded)
17 In rural development projects where the agent is a subsistence farmer accumulated generated cash per year must be at least equal to or higher than the BAU situation that was ensuring hisher familyrsquos survival
BOX 4
Steps in financial analysis
The typical sequence of tasks to be undertaken in financial analysis is the following
1 Develop farmenterprise models and identify benefits and costs (investment and recurrent) for
WOP and WP scenarios (based on crop budgets)
2 Compare the discounted flows of benefits and costs and calculate the differences between the
obtained results and the WOP scenario in order to determine the net incremental benefits (NIB) of
the proposed interventions
3 Calculate the project financial profitability indicators of each model (ie financial NPV financial
IRR and BC ratio) applying these investment criteria to make an investment decision (positive or
negative)
4 Assess family incomes and establish financingcredit needs by performing a lsquosustainability analysisrsquo
Financial sustainability is ensured if the accumulated generated cash per year is positive or
at most equal to zero17 for all years considered On the contrary if this figure is negative at any
point in time the project is not sustainable meaning that there are not enough financial resources
to cover all the costs and it will be necessary to reassess project financing mechanisms
14
VOLUME 1 BASIC CONCEPTS AND RATIONALE
Economic analysis or cost-benefit analysis
builds on the results of financial analysis with the
additional consideration of impacts and benefits not
directly captured by the latter These analyses are
strictly related as shown in Figure 4
The main steps in financial analysis are
summarized in box 4 A detailed description of
building economic analysis from financial models is
provided in volume 2 which illustrates each step in
EFA of a typical IFAD production-oriented project
In economic analysis the analyst needs to
complement financial analysis by considering all
project impacts on the society The private actor is
generally not interested in considering all negative
or positive impacts that his actions may have on the
rest of society In terms of environmental impact
for example polluting rivers through production
discharges or emitting CO2 are social costs generally
not considered by the private agent These are called
lsquoexternalitiesrsquo as in practical terms the private agent
is lsquoexternalizingrsquo a production cost making the whole
society pay for it On the other hand there also exist
positive effects not counted by the private agent
such as the introduction of new pastures by a single
producer which can increase honey production in
the area and benefit neighbouring beekeepers
These aspects are known as positive and
negative externalities In addition economic analysis
must eliminate all transfer costs between national
and private actors (ie subsidies and taxes) Lastly all
costs and benefits need to be valued at their social
opportunity cost rather than at their market price
F IGUR E 4
Economic and financial analysis links
Aggregation
Project net incremental
benefits(NIB)
Farm budgets properly phased
Activity budgets (eg processing enterprises)
phased
Government implementing
agencies
Financial analysis(market prices)
123n
123n
Farm budgets properly phased
Activity budgets (eg processing enterprises)
phased
Government implementing
agencies
sum
sum
sum
Economic analysis(economic values)
123n
123n
Adjust market values to economic
values
Eliminate transfer
payments (taxes and subsidies)
Quantify externalities
15
VOLUME 1 BASIC CONCEPTS AND RATIONALE
Many times for example when trade barriers
are in place or when currencies are controlled
market prices do not reflect the social value of
goods In order to account for these distortions
one of the most critical tasks is the calculation of
economic or shadow prices Another critical aspect
is the establishment of a social rate of discount
that realistically reflects an investment alternative
(opportunity cost) for the government18 Detailed
explanations and guidelines for these calculations
are also included in volume 2
Table 1 illustrates the process of going from
financial to economic analysis19 The financial
analysis section at the top shows revenues and 20
production costs (operating and investment) of a
hypothetical enterprise The enterprise is experiencing
18 As a general rule when a country is a capital borrower the social rate of discount should be no less than the actual rate of interest on the capital market from which the capital is borrowed
19 Clicking on the table reveals the formulas
20 See section on ldquoUse of SA to assess project risks an examplerdquo
several years of negative net cash flows resulting
in a negative NPV and IRR This is caused by high
operating costs as well as recurrent needs for
investment Economic analysis converts market
prices into economic prices As reflected by the
application of conversion factors (CF) market prices
of outputs and inputs are different from their social
value For example the CF applied to wages reflects
the presence of high unemployment (20 per cent)
in the area which would push people to work for
lower than market wages (thus CF = 08)21 In the
same way the CF applied to investments reflects
the presence of high transport costs or duties that
make the productrsquos market price overestimate its
social value In fact the market price is 83 while the
economic price is 75 and thus the CF is 09
21 Market wage (mW) = US$100 unemployment = 20 economic wage(eW) = US$80 (observed given the high unemployment) CF = eWmW = 80100 = 08
BOX 5
Steps in economic analysis
Economic analysis requires assessment of a projectrsquos net impact on economic welfare
by considering
5 Convert all market prices into economicshadow prices (SP) that better reflect the social
opportunity cost of the good
6 Remove transfer payments (taxes and subsidies) and quantify externalities (positive and negative)
7 Aggregate all modelrsquos NIB cash flows respecting incorporation phasing patterns of targeted
beneficiaries into projectrsquos activities
8 Compare aggregated benefits with other project costs to obtain incremental discounted cash
flows Calculate economic performance indicators adopting a social discount rate ENPV ERR
BC ratio
9 Perform sensitivity analysis (SA) in order to deal with the main risks and uncertainties that could
affect the proposed project20
Critical parameters are (i) SP for tradable and non-tradable goods (ii) SP of foreign exchange
(iii) SP for labour costs (shadow wage) and (iv) the social discount rate
16
VOLUME 1 BASIC CONCEPTS AND RATIONALE
Fiscal corrections are also applied and
10 per cent VAT is deducted from all inputs and
outputs with indirect taxes Finally externalities
are accounted for and quantified both negatives
(increases in noise) and positives (decrease
in pollution)
The project under analysis resulted not profitable from a financial point of view but viable
from an economic point of view This means that
the overall impact for society is positive (also
reflected by the positive externalities) but there
are no sufficient incentives for the private
individual agent to undertake these activities
This conclusion suggests that if the development
objectives achieved through this investment are
significant enough for the government then the
project should develop an incentive scheme to
attract the private agent
These results may be used in policy dialogue
suggesting that the government could reduce the
level of targeted import duties and thus make this
investment proposal financially profitable
TA BLE 1
From financial to economic analysis an example
Financial analysis (market prices)Thousands of United States dollars
Years
1 2 3 4 5 6 7 8 9 10
Total operating revenues 0 42 115 119 126 126 126 126 126 126
Total Inflows 0 42 115 119 126 126 126 126 126 126
Total operating costs 0 -56 -75 -98 -101 -101 -101 -101 -117 -117
Total investment costs -165 -4 -4 -25 -3 0 -25 0 0 12
Total outflows -165 -60 -79 -123 -104 -101 -126 -101 -117 -105
Net cash flow -165 -18 36 -4 22 25 0 25 9 21
Financial rate of return -6
Financial NPV10 US$(89)
Economic rate of return 36
Economic NPV10 US$473
Years
Economic analysis CF 1 2 3 4 5 6 7 8 9 10
Output X 12 0 49 134 139 147 147 147 147 147 147
Total operating revenues 0 49 134 139 147 147 147 147 147 147
Labour costs 08 0 -18 -18 -26 -26 -26 -26 -26 -30 -30
Operating costs 11 0 -36 -57 -73 -76 -76 -76 -76 -87 -87
Total investment costs 09 -149 -4 -4 -22 -3 0 -22 0 0 11
Fiscal correction outputsa 09 0 44 121 125 132 132 132 132 132 132
Fiscal correction inputsa 09 -134 -36 -55 -85 -71 -68 -88 -68 -78 -68
Externalities 0 20 20 20 20 20 20 20 20 20
Decreased pollution 0 23 23 23 23 23 23 23 23 23
Increased noise 0 -3 -3 -3 -3 -3 -3 -3 -3 -3
Net cash flow -282 39 161 98 144 149 107 149 124 145
a VTA of 10 has been eliminated
1 Adjust market values to economic values applying CF2 Eliminate transfer payments (taxes and subsidies)
3 Quantify externalities
17
SECTION IV
IFAD rural investment projects include projects
in integrated rural development irrigation rural
finance value chain development natural resource
management (NRM) climate-change adaptation
and mitigation community development and
institutional strengthening
As IFAD follows its main mandate of focusing its
projects on benefiting poor rural people22 projects
are characterized and designed through identification
of a target group composed mostly of rural people
Poor rural people represent different productive
and economic categories the main one being
smallholders Others include the landless population
engaged in rural non-agricultural microenterprises
rural workers fishers and finally special vulnerable
groups such as women indigenous minorities and
youth All IFAD projects must be formulated on
the basis of benefiting one or more of the above-
mentioned poor rural groups
The increased number of value chain projects
in IFADrsquos portfolio23 ndash aiming to integrate IFADrsquos
traditional target groups into these chains to improve
their access to secure markets and sustainably raise
their incomes ndash has expanded the definition of IFADrsquos
target group to all rural people including small- and
medium-scale entrepreneurs in rural areas However
for the purposes of EFA the impact on poor rural
people is the one that matters the most to IFAD24 and
22 See IFAD Lending Policies and Criteria I (5) ldquoIFAD will concentrate its resources upon activities that promise to achieve in a cost-effective way a reduction of poverty in rural areas where most poor people live and work The Fundrsquos major target groups irrespective of the stage of economic development of the country will be the small and landless farmersrdquo
23 From only 3 per cent in 1999 to 46 per cent in 2009 (Raswant and Heinemann 2012)
24 However when possible and relevant distribution of benefits among value chain actors is a complement to CBA
to the poverty-reduction development objectives of
each government
This IFAD specificity has direct consequences for
CBA discussion of the lsquostandingrsquo issue As previously
stated investment projects include a number
of social stakeholders However for IFAD rural
investment projects this is not a major issue as the
formulation of IFAD projects is focused on benefiting
a specific target group poor rural people25
Focusing on lsquotypicalrsquo IFAD rural investment projects and their main benefitsThe typical IFAD project is usually production
oriented26 and its main outcomes (ie financial and
economic benefits) are frequently net production
increases In other words most IFAD projects will
have a direct impact on the production levels
of target groups which in turn will lead to net
income increases
IFAD projects have an impact on the incomes
of poor rural people by increasing their access to
inputs and services that will subsequently increase
their production volumes andor productivity
The most common areas of intervention include
technical assistance (TA) for crops and livestock
through extension services rural finance services
25 There might be exceptional situations in which other social groups could benefit from an IFAD project These cases might require additional analyses (eg distributional effects analysis) when undertaking EFA
26 Of 114 projects reviewed by QE from 2009 to 2011 73 per cent were agriculture- or rural development-related while in 16 per cent the core objective was to strengthen financial services The rest focused on capacity-building or NRM These data show that most IFAD projects can be characterized as production-oriented that is designed to have direct impact on production and productivity increase
EFA of IFAD rural investment projects
18
VOLUME 1 BASIC CONCEPTS AND RATIONALE
to support on-farm investments and increased
access to working capital through creditloan27 or
grant facilities improved water management through
the construction of irrigation structures provision
of storage drying and cooling facilities to enhance
post-harvest preservation and technical advisory
and financial resources to support entrepreneurs
in starting small and microenterprises ndash as well as
combinations of the above
This IFAD specificity leads to some
straightforward requirements when analysing its
financial and economic results First the project
should be assessed in terms of the financial feasibility
and sustainability of targeted beneficiaries second
the project should be assessed in terms of economic
profitability for the whole national economy
Thus in IFAD production-oriented projects the
main household-level goal in financial analysis is to
determine whether the producer28 will have enough
incentives to participate in the project
In simple terms analysis needs to establish
whether the farmer should undertake the proposed
intervention under the criterion that it is financially
viable (ie the benefits over time are higher than the
investment and recurrent costs) and that these net
benefits exceed present returns (ie incremental
benefits are positive)
However even if the new situation (WP) is more
appealing than the present one (WOP) could the
farmer afford to adopt improved practices Although
viable the investment may still not be profitable if it
does not generate enough returns (mostly during the
first years) to cover the farmerrsquos needs Where the
producer is living under the poverty line the project
should at least generate the same net income each
year as in the BAU situation (subsistence system)
to ensure hisher participation Where poverty levels
are lower incomes should be adequate to cover
investment and working capital needs in addition to
27 Comprising inclusive innovativeadapted rural finance products and services including risk management strategies savings financial literacyeducation programmes etc
28 The terms lsquofarmerrsquo lsquoproducerrsquo or lsquoprivate stakeholderrsquo will be used throughout the IGs as synonyms for the term lsquoprivate agentrsquo in financial analysis
the farmerrsquos living expenses The lack of initial capital
to invest is generally a huge barrier to engaging in
a new activity A financial analysis will determine if
farmersrsquo cash flows are adequate to undertake the
activities (ie it will clearly identify a farmerrsquos financial
needs and hisher repayment capacity)
Even when a financing scheme will prove the
feasibility of the investment there are many risks
involved in changing a farmerrsquos practices (business
as usual) above all if it involves taking out a loan
in an uncertain agricultural environment Thus the
last question to be answered is would the farmer
take the risk are there enough incentives Risks
faced by farmers are many and extremely difficult
to manage29 The only measure of their willingness
to change habitstechnologies will be by comparing
their returns to the opportunity costs of remaining
in the actual situation If for example the returns to
labour of the new activity prove to be much higher
than the average rural wage it is probable that a
farmer would be willing to invest his time in his own
farm and take the risk
In other words financial analysis will establish
whether farmers will obtain a net incremental benefit
(financial viability and profitability analysis) if theyrsquoll
have enough working capital to buy the additional
farm inputs or to bear the costs of stocking
processed goods (financial sustainability) and finally
if financial incentives are enough to convince them to
change existing practices
The practical way to undertake this analysis is by
developing different beneficiary productive profiles
ndash considering several types of productive activities
lsquofarm-systemsrsquo and lsquoactivity-modelsrsquo ndash as well as how
many and which types of people generally engage in
these activities in this particular area
On the basis of the individual models of financial
analysis ndash and once the three steps in converting
market prices into their economic value have been
29 For example risks in the areas of production prices casualties technology climate ndash to name just a few
19
VOLUME 1 BASIC CONCEPTS AND RATIONALE
completed ndash economic analysis of the project as a
whole can be undertaken30 This is done by means
of the aggregation that in project analysis is the
process of adding together the costs and benefits
of all the entities participating to reach a summary
account from which a measure of project worth can
be derived The result of the aggregation is the net
incremental benefit or cash flow of the project31
Lastly the goal of economic analysis is to answer
the question of whether it is worthwhile to invest
public resources in the overall project proposal
(should the government invest) It will focus on the
perspective of the entire country and it measures the
effects of the project on the economy as a whole
Unquantified benefits alternative methodologies to CBAThe majority of IFADrsquos projects are production-
oriented interventions in which expected outcomes
are tangible and easily quantifiable however due to
IFADrsquos typical target group many of these projects
are complemented by activities seeking an impact
on less-tangible aspects of rural poverty alleviation
Womenrsquos empowerment increased access to assets
and services enhanced capacities ownership and
land titling are examples of this important part of
IFADrsquos overall project impact However these types
of benefits which are more difficult to measure or not
measurable in monetary terms (intangible benefits)
are often excluded from CBA
In addition environmental and social benefits
resulting from the promotion of resilient agricultural
practices or social infrastructure such as rural roads
irrigation schemes or market infrastructure are also
seldom included in CBA In order to change this
trend these IGs will provide some ideas on how to
allocate value through the use of valid proxies to
measure the impact of these intangible social andor
environmental benefits
30 Some analysts proceed by aggregating the financial analysis and then converting the aggregated results into their economic value It can be argued that this stage of analysis is useless as the financial profitability indicators for the project as a whole have no use in terms of investment decisions
31 See volume 2 and its annex for more details on the lsquoaggregation issuersquo and common mistakes
In the particular case of CDD projects where
communities collectively decide on the allocation
of project resources it is very difficult to foresee
which productive activities will be targeted However
markets and agronomic conditions in the project
area will limit the scope of activities that can be
successfully undertaken In these cases the fact
that communities are making participatory decisions
will grant the additional benefits that ownership
provides ensuring higher adoption rates than
average and increasing the sustainability of the
chosen interventions
In cases where the identification and valuation
of benefits is difficult simple and sensible ways
of estimating tangible benefits should be applied
Table 2 presents an overview of suggested
approaches to transforming such benefits into
tangible values so as to include them in overall
project cash-flow analysis from the most common
complementary activities in IFADrsquos projects
Additionally the IGs will introduce two methods
alternative to CBA for those cases where not even
proxies could be measured cost-effectiveness
and MCA32 The latter has not yet been tested
as a suitable tool in IFAD project designs but is
suggested as an alternative in cases of complex
decision-making
Cost-effectiveness
When tangible benefits from a given investment
are difficult to quantify but the costs are easily
identifiable the most commonly used valuation
method is cost-effectiveness which is used to select
the least-costly alternative among a set of options
that will achieve the same result (a given set of
predetermined objectives) Once the purpose of the
project has been decided for example construction
of a market storage facility cost-effectiveness would
be used to compare scale location technology
etc in order to choose between investment
32 See the technical annex for more details
20
VOLUME 1 BASIC CONCEPTS AND RATIONALE
Project componentsactivity Quantifiable benefits
Productivity enhancement (including irrigation post-harvest and processing) Storage drying cooling facilities irrigation
bull Reduced post-harvest losses
bull Increased value and volumes of production due to investments in storage cooling or small processing facilities (drying or milling)
bull Increased production and productivity due to water provision
Value chain (VC) Collective marketing warehouse receipt systems increased market information
bull Increased value of final product owing to increased quality and access to markets improved handling packaging and commercialization
bull Financial benefits to all actors along the VC
bull Microenterprise and employment creation
bull Creation of internal and external markets that did not exist before investments
Rural roads bull Reduced transport and vehicle maintenance costs (incl vehicle operating costs [VOC] and travel-time costs [TTC])
bull Access to areas not accessible before hence increased total production
bull Increased volume of transported agricultural products for sale (reduced losses)
bull Reduced transport costs due to better access to sales points
Domestic water supply bull Time saved in procuring water
bull Reduced sickness through better water quality
bull Reduced water losses due to leakage
bull Increased productivity through small-plot crop irrigation and through provision of water for livestock
bull Introduction of backyard gardening
Climate adaptation and resilience practices Changes in tillage practices crop rotations landsoil conversion afforestation energy-efficient systems flood prevention
bull Reduced land erosion an estimate of saved nutrient content can be valued at price of fertilizer needed to replace that nutrient content
bull Increased crop timber and livestock yields through soil preservation conservation tillage and agriculture
bull Increased final product value due to labelling as organic agricultural practices
bull Avoided rehabilitation costs for public infrastructure destroyed by natural disasters
bull Energy savings owing to replacement of old practices by eco-friendly artefacts (eco-stoves solar panels etc)
Land registration Land tenure security may translate into increased land value explained by
bull Long-term Investments in land fertility
bull Improved access to credit as land can be used as collateral
bull Greater dynamism of land markets
bull Environmental benefits as a result of better NRM (people improve or maintain forest andor tree cover)
TA BLE 2
Simple sensible ways of valuing different types of benefits
21
VOLUME 1 BASIC CONCEPTS AND RATIONALE
options (eg open storage location of a facility
construction materials) Unfortunately the results of
this method which can justify project investment
decisions cannot be integrated into the streams of
incremental net benefits resulting from classic CBA
thus underestimating the overall benefits of
the investment
Multicriteria analysis
MCA is a decision-making tool for evaluating
complex decision problems where the options
entail many different objectives Unlike CBA MCA
allows consideration of aspects other than economic
and financial ones for example both quantitative
and qualitative data It builds trade-offs between
criteria that in complex decision-making are usually
in conflict (efficiency and equity for example) 33
and is an important instrument in ranking different
options and discriminating between acceptable and
unacceptable possibilities
The main advantages of MCA are its openness
explicitness and power to simplify complex
situations This process eases the discussion and
promotes communication first within the decision-
33 Another example would be when production objectives are in contraposition to environmental ones For example to increase livestock production for food security and at the same time reduce CO2 emissions
Project componentsactivity Quantifiable benefits
Rural finance bull Efficiency gains in financial system can lower operational costs and ensure self-sufficiency and sustainability of financial services supply
bull Shifts in portfolio composition of financial service providers (productive loans versus consumption)
bull Incremental taxation revenues to government
bull Potential productivity increases through financing of working capital (incremental benefits to clientsborrowers)
bull Economic benefits of transfer effects
Community development (CD) bull Improvements in lives of beneficiary households (value these in money equivalents if possible)
bull CD activities result in high empowerment and ownership of project activities which could translate into greater sustainability
Indigenous peoplesrsquo (IPs) knowledge
bull When IPs are supported in applying their knowledge ownership of project activities is ensured as well as sustainability of activities This can translate into low implementation risk and high uptake (adoption rates)
bull Generally IP practice are environmentally friendly thus reducing stress on natural resources
bull Nutritional aspects are also part of the positive impacts
Institutional strengthening bull Improved institutional capacity has generated or will generate benefits for target groups
bull Losses avoided by strengthening the institution looking at the sensitivity analysis assess how delays in implementation (due to institutional weak capacities) affect project outcomes and use that data to calculate losses avoided
Source PTA ndash EFA desk elaboration
22
VOLUME 1 BASIC CONCEPTS AND RATIONALE
making body and later between that body and
stakeholders MCA can be an ex ante (lsquobefore the
factrsquo) and an ex post (lsquoafter the factrsquo) evaluation tool
This type of analysis also presents some difficulties
One concerns definition of the comparative criteria
Use of MCA requires knowledge of mathematical
notions data aggregation methodologies and
computer applications to perform analysis following
a structured process and to avoid weak conclusions
It is often costly and time-consuming
EFA data sources collection and coherenceThe value of EFA as a decision tool hinges on the
quality of the data and assumptions that underpin
it Data availability is a widespread problem for
EFA analysts who should always work in close
collaboration with expert colleagues (agronomy
livestock and rural infrastructure experts) who will
provide or validate the key technical parameters of
the analysis34
Data regarding project costs should be collected
during design missions in consultation with the rest
of the team Once the first results from EFA are
reached they should also be shared with the team
to discuss how they affect expected outcomes and
assumptions For example planned investment costs
may not be sufficient to reach the number of target
beneficiaries outcomes of specific components may
not be appealing from a financial point of view etc
Although it is the responsibility of the EFA analyst
to gather and ensure data consistency among
sources the mission leader should promote and
facilitate dialogue among mission members and
provide sufficient time for the analyst to collect and
process data to ensure EFA quality and coherence35
34 Alternatively FAOSTAT is the most reliable and recommended source of data (httpfaostatfaoorg)
35 It is estimated that at least five weeks are needed for elaboration of a complete EFA one week for data gathering two weeks of mission and two weeks for data processing
For the other parameters of EFA analysis such
as conversion factors and discount rates one
of the most important sources of data is always
the national planning offices If these data are not
available evaluations of completed operations by
the Independent Office of Evaluation of IFAD (IOE)
can be used as a reference36 These can provide
reference values for similar projects or projects
in the same country (and region) for example on
uptake (adoption rates) of a specific technology or
constraints on input availability
Moreover economic and financial analysis in
appraisal reports for the same country (andor region
andor sector) ndash from IFAD and other IFIs such as
the World Bank or regional development banks ndash are
potential sources of information on key parameters
such as discount rates37
However any project analyst should rely on his
her best judgment accumulated through experience
when deciding on the assumptions to be used
36 Evaluations by country and region are available at wwwifadorgevaluationpublic_htmleksystdocprjindexhtm
37 FAOrsquos Monitoring and Analysing Food and Agricultural Policies (MAFAP) programme develops estimates for standard conversion factors the social exchange rate (SER) for different countries and currencies and other important parameters for estimating shadow prices such as the transport costs duties and taxes instrumental in calculating parityborder prices for tradable goods (wwwfaoorgmafaphomeen Country reports can be found at wwwfaoorgmafapproductscountry-reports-technical-notesen)
23
SECTION V
To increase the efficient use of EFA it is important to
view this analysis as an integral part of project design
information and not only as a mandatory study done
for compliance with IFAD quality requirements
To do so there should be continuous review and
refinement of EFA at all stages of the project cycle
It is part of the monitoring and evaluation (MampE) and
knowledge management functions to inform decisions
on adjustments to design and implementation
modalities in pursuit of project objectives
As a first step the data used for EFA in
project design should be periodically updated
by the projectrsquos MampE system and supervision
implementation support missions should verify that
this has taken place If significant changes occur in
the data ndash particularly those for which the sensitivity
analysis showed higher sensitivity ndash the IRR NPV
and cost-benefit ratio should be recalculated
In the light of new data (eg prices for inputs
and outputs demand forecast for project outputs
andor adoption rates) ndash and taking into account
the results of updated EFA including identified
risks and suggested mitigation measures ndash it may
become appropriate during project supervision
andor implementation support missions to decide
to reallocate resources among activities andor
components shifting from those that contribute less
according to the new constellation of data to those
that would contribute more to the projectrsquos objectives
Moreover the EFA spreadsheet prepared during
project appraisal should remain available for review
during project implementation and evaluation This
serves as an indicator of compliance with the EFA
requirement for design documents and the new RMF
indicator as stated in the relevance section It would
also facilitate the updating process indicated in the
preceding paragraph
The purpose of EFA in each phase of the project
cycle including evaluation is indicated in the
following table
TA BLE 3
EFA at different stages of project cycle
Project cycle stage Role of EFA Form of analysis
Concept Definition of investment criteria
bull Purely ex ante ndash all benefits and costs are based on estimates of future values
Project design Resource allocation decisions
bull Purely ex ante ndash all benefits and costs are based on estimates of future values
Supervision ndash early stage
Resource reallocation decisions
Newly Identified risks
bull Mainly ex ante ndash some costs may be ex post but most benefits will still be based on future estimates
Midterm review (MTR) bull Mainly ex ante ndash some costs will be ex post but estimation of future benefits will be based on evidence accrued during first half of project
Supervision ndash later stages
bull About 50 ex post50 ex ante ndash costs will be increasingly based on actual results but benefits are generally lagged by several years at least and will continue to accrue over life of investment
Project completion report (PCR)
Assessment of results bull Mainly ex post ndash all costs and some benefits will be based on actual results but benefit stream for residual life of investment will remain an estimate of future values
EFA role throughout IFADrsquos project cycle
24
VOLUME 1 BASIC CONCEPTS AND RATIONALE
Table 3 also describes the form of analysis
undertaken at each stage of the project cycle which
ranges from purely ex ante during project design to
partly ex post initially with regard to costs and later
to benefits and finally purely ex post for investment
costs but only partly ex post for recurrent costs
and benefits In this example a fully ex post analysis
would only be possible after 20 years which lies
more in the realm of policy analysis than project EFA
Given its purpose EFA is currently used mostly
as an ex ante tool to guide project formulation and
justify investment decisions Nevertheless it could
make a bigger contribution to IFADrsquos mandate for
rural poverty reduction if it were used in some of
the following ways
At concept
bull At COSOP38 andor project conception previous
evaluation ex post reports elements from
previous EFAs or speedy financial assessments
of intended investments could serve as
screening criteria for the validation of proposed
investment ideas For example a previous study
on the investment requirements for a specific
irrigation technology may help establish a
minimum area to be covered by projects in order
to produce sufficient benefits to overcome
project investments
At design
bull For component selection ex ante assessment of
component viability during design
bull For cost validation EFA will confirm whether
estimated project investment costs are sufficient
to cover proposed interventions as well as define
beneficiariesrsquo contributions and their financial needs
bull In the logframe EFA can provide realistic and
consistent outcome indicators
bull For risk management EFA will provide grounded
information for the effective design of mitigation
measures applied to changing circumstances in
order to understand and manage risk
38 Country strategic opportunities programme
At implementation
bull To terminate or modify activities that are not
generating satisfactory financial results for the
intended beneficiaries and economic impact for
the country as a whole
bull For MampE Updating EFA to changing
circumstances will provide up-to-date evidence
of realistic outputs outcomes and impacts As
an MampE and knowledge management tool it can
facilitate learning within and between countries
about what works and what doesnrsquot in terms of
financial and economic impact This knowledge
can also be used to guide the design of country
programmes through the COSOP
bull EFA can also be used as a risk management
tool during implementation Where new risks
are identified or design assumptions are found
to be incorrect remedial action may be needed
including reallocation of resources among
components andor expenditure categories
Early in implementation EFA could contribute
to adaptation to changing circumstances such
as commodity prices production technologies
and institutional and policy changes which
may suggest that different or better approaches
be adopted modifying the design andor
implementation arrangements
At evaluation
bull As an ex post impact assessment tool by
incorporating EFA in IOErsquos PCR and country or
project evaluations in order to compare expected
and actual project results
bull To inform decisions on scaling up or replication
of successful initiatives including the scaling
up of grant-funded activities into full-scale
loan-funded projects
bull Ex post EFA assessment may suggest
discontinuation of approaches that are not
working and scaling up of those that are
25
VOLUME 1 BASIC CONCEPTS AND RATIONALE
Goal bull 20 increased average
income in 29000 HH
C1 bull 29000 farmers linked
with VCbull US$64 m in loans
distributed
C2 bull 29500 HH new crops
amp improved yields 15bull 2000 ha irrigatedbull 83 km rural roads
C3 Overall implementation
EFA in project design Links with the logframe and MampEIn addition to a complete EFA assessment IFADrsquos
mandatory design documents require presentation
of a logframe detailed cost tables disaggregated by
component financier and expenditure categories
and formulation of an MampE system
These three elements should be closely linked
The logframe provides a global picture of project
objectives and describes through components the
activities that will be put in place to achieve them
along with measurable indicators to monitor progress
and achievements The cost tables assign a cost
to each of these activities and MampE measures their
impact EFA is the technical vehicle that attaches an
expected benefit or outcome to the costs of each
envisaged activity It defines the causal chain of
effects between a projectrsquos inputs and outcomes
In other words many of the logframe sections
can and should be completed with information
coming from EFA These indicators should also be
used as part of the MampE system in order to maintain
coherence between planned interventions and
expected outcomes from the very beginning
In order to illustrate this causal chain a clarifying
example is provided in Figure 5 to explain how through
EFA certain inputs will be transformed into outcomes as
a result of the project The example has been extracted
from an ongoing IFAD project with a total project cost
of US$119 million to finance three main components
C1 value-chain market linkages development C2
improved agricultural practices and infrastructure
and C3 the project management unit (PMU)
As shown in Figure 5 uptake indicators
(ie number of expected beneficiaries) and overall
project impact of 20 increased incomes in
29000 HH have been directly estimated through
EFA (shown by the visible arrow) The same has
been done for expected outcomes from productive
interventions ndash such as improved crops and cropping
techniques complemented by irrigation infrastructure
under C2 ndash that will result in an average increase
in yields of 15 per cent However there are some
project activities for which it is more difficult to
F IGUR E 5
Practical example of linking EFA with the logframe costs and MampE With what For what
Objective Increase sustainable HH income
C1 Promote VCbull Capacity-building for
farmersrsquo groupsbull Link with farmers
and investment fund
C2 Support farmersbull Improved crop varieties
and TAbull Irrigation and road
infrastructure
C3 PMU
Total costs bull US$11946 m
Costpers US$740
C1 US$1875 mbull Capacity-building
US$3Mbull Link US$063 mbull Investment fund US$1512 m
C2 US$787 mbull Better crops US$643 mbull TA US$5 mbull Infrastructure
US$94 m
C3 US$105 m
LogframeImpact (MampE)
Projectcosts
Logframe Projectcosts
Impact (MampE)
EFA defines the causal chain
EFA can translate project inputs into results
26
VOLUME 1 BASIC CONCEPTS AND RATIONALE
measure impact (represented by the fading arrow)
In the example the development of stronger links
between farmers and agribusiness and improved
market access through construction of rural roads
will certainly have an impact on beneficiary access
to markets but this is not easily quantified by
measuring the number of meetings held by these
groups It would be better reflected in increases in
volumes sold and the prices received by farmers
Moreover indirect benefits from project activities
should also account for other rural people that will
benefit from the roads and are also not included in
the analysis Finally several project costs will not
produce any direct benefits but the activities they
fund are fundamental in the delivery of the overall
project For example all costs regarding the PMU
as well as awareness-raising campaigns and other
types of lsquosoftrsquo interventions
In summary the logframe provides a structure
that can help organize the data and assumptions
used in EFA elaboration Key data for estimating
costs and benefits and assumptions made
concerning incremental yields adoption rates etc
should be incorporated into the logframe and used
as indicators in the MampE system
While useful EFA cannot provide all relevant
indicators required in the logframe For example
third-level indicators (eg on reduced stunting or
increased HH assets) in IFADrsquos Results and Impact
Management System (RIMS) will still need to be
collected through baseline surveys in the early phase
of implementation
Finally it is important to distinguish output from
outcome indicators in the logframe39 During the
initial years of a project supervision should focus
on the output indicators As project implementation
proceeds the focus should shift to (or at least
include) outcome indicators which provide key data
to compare with the initial EFA assessment
39 A good practice example of a logframe distinguishing between output and outcome indicators is the Project for Agricultural Development and Economic Empowerment in Cambodia (EB 2012105R15Rev1 wwwifadorggbdocseb105eindexhtm) It should be noted that Annual Reports on Quality Assurance in IFADrsquos Projects and Programmes (eg document EB 200998R57) have called attention to imprecise development objectives and lack of quantified final and intermediate outcome indicators to track progress towards achieving objectives This deficiency also affects the quality of EFA and the possibility of using it during project supervision and implementation support Thus improved quality of the logframe can contribute to improving the quality of EFA and to enhancing its use during this phase
EFA in project design Risk analysisEconomic analysis of projects is by definition
built on uncertain future events Estimation of the
basic elements of this analysis (costs and profits)
inevitably involves explicit or implicit probability
judgments In order to contain and measure
the impact of these uncertainties on project
results there are some techniques that help
detect the lsquocritical variablesrsquo or sources of major
risks and set the basis for introducing effective
mitigating measures
The most common tools used in EFA are the
sensitivity analysis (SA) and the switching value (SV)
analysis40 Both enable testing and measurement
of the effect of changes in key project variables on
the final outcomes of our project and hence its
economic indicators (NPV and IRR) Although SA is
frequently used to assess the robustness of projects
and their resilience to shocks its outcomes are
seldom linked to risk analysis
In other words the most relevant question at
this stage is to know how fluctuation in critical
parameters (eg increases in costs delays in
implementation) will affect project performance and
which of the identified risks are the ones that need
close monitoring
Considering the effects of risks and mitigation
measures identified at the project design stage on
EFA results would not only represent a more realistic
approach to assessing the projectrsquos profitability but
would also help identify the nature of those risks
ndash acknowledged but not mitigated by the project ndash
whose existence is regarded as acceptable
In practical terms the SA tests percentage
increases and decreases in estimated benefits and
costs to assess their impact on NPV and IRR while
the SV provides the percentage change in cost
or benefits that will cause project outcomes to fall
below the minimum level of acceptability (NPV lt 0)
40 In volume 2 the IGs also provide information on more sophisticated tools using probabilistic approaches such as Crystal Ball and Risk
27
VOLUME 1 BASIC CONCEPTS AND RATIONALE
Both analyses are extremely useful if linked to
identified project risks For example SV can identify
benchmarks (maximum percentage increases in costs
or decreases in benefits) for lsquotrigger valuesrsquo to activate
specific mitigation measures (eg if the internal price
of a specific input increases to 30 per cent activities
should shift to an alternative crop)
Another way of looking at this analysis is
through the graphic in Figure 6 Here variations
in expected benefits and costs are represented
in the vertical and horizontal axes respectively
Calculation of the switching values of our project
identifies the maximum reduction in benefits (Bmin)
and the maximum increase in costs (Cmax) that
would result in an NPV of zero Thus the switching
value frontier (SVF) represented by the black line
between Bmin and Cmax encloses all possible
combinations of reduction in benefits and increase
in costs that would bring the NPV to zero Implicitly
the area (O Bmin Cmax) represents the set of all the
different combinations of decrease in benefits and
simultaneously increase in costs that would not
endanger project viability
Once the SVF has been identified and after a
proper evaluation of the country context and project
risks and mitigation measures we could eventually
assume that benefits and costs are very unlikely to
attain the levels represented by the two dotted lines
(B0 C0) As a result we narrow down our uncertainty
area defining a lsquosafe zonersquo identified by the blue area
(A) and a lsquorisky zonersquo identified by the orange area
(R) Area A represents the set of combinations that
falls into the viable cases where increases in costs
or decreases in benefits are not jeopardizing the
overall outcome of the project Area R represents all
the diverse combinations of costs and benefits that
will render the project unprofitable (NPV lt 0)
An analysis including probabilistic approaches
could provide a better understanding of the likelihood
that the project would fall into one of the two areas
and thus assess how much at risk it would be if
certain events occurred Details of these types of
analysis can be found in volume 2
Use of SA to assess project risks an example
SA provides grounded information to the design
team to develop effective mitigation measures for
each identified potential risk The first step then
is to add a proxy to the classic table or section on
project risk of the project design report (PDR) ndash a
proxy that responds to the question How will this
risk affect project performance For example if
F IGUR E 6
Identification of the risk zone
0
A
R
Switching value frontier(NPV=0)
Cmax + Costs
- Benefits
B0
Bmin
Cmax
28
VOLUME 1 BASIC CONCEPTS AND RATIONALE
local implementation capacities are low SA can
test how a delay in implementation of one or more
years (a realistic possibility of this risk occurring) will
affect project outcomes Similarly if there is a high
probability of the introduction of import taxes this
can be tested by increasing input costs
The next step is to closely observe the SA results
in order to assess to what extent these events
will change the profitability indicators (ie project
performance) By answering the question Which
variables need to be closely monitored the project
team can easily identify the lsquocritical risksrsquo and better
allocate resources for their mitigation
In the example below (Table 4 and Table 5)
SA shows that this project is more sensitive to
decreases and delays in benefits than to cost
increases Thus although there is a high risk of the
introduction of import taxes on fertilizer this will not
drastically affect project performance On the other
side delays in implementation are a high risk that
could compromise overall project outcomes Project
teams should allocate more efforts and resources to
mitigate this risk rather than others
To summarize EFA analytical tools can contribute
to risk assessment and informed decision-making
for the efficient allocation of project resources when
designing mitigation measures
TA BLE 4
Risk analysis and mitigation measures (classic table prepared for the PDR)
Risk description Probability of occurrence
Mitigation measure Proxy to compare with SA results
Institutional risksLow local implementation capacity
High Capacity-building Delays in benefits
Market risks Import duties on fertilizer High Local production Increased costs
Climate risks Floods Low Infrastructure Reduced benefits
TA BLE 5
Sensitivity analysis for informed decision-making
SA Base case
( 12)
Costs increased Decrease in benefits Delay of benefits
+10 +20 +50 -10 -20 -50 1 year 2 years
IRR 28 27 25 21 22 20 18 23 19
NPV (lsquo000 US$)
37 160 8 068 6 895 3 376 4 047 2 949 1 564 5 173 1 984
29
VOLUME 1 BASIC CONCEPTS AND RATIONALE
EFA in project supervision implementation and ex post evaluationThe underlying principles for the use of EFA in project
implementation are no different from those for project
design and are detailed in a number of old and
well-known sources Squire and van der Tak (1975)
Gittinger (1985) Belli et al (1998) and IFADrsquos draft EFA
guidelines of September 2012 However although the
principles are the same the methods of application
differ to some extent as shown in Table 6
The approach to EFA both before and during
project implementation should be tailored to
the nature of the project What to look for in the
field and the type of analysis undertaken vary
considerably among different project categories
More detailed information is provided in Table 7 in
the technical annex
Ex ante and ex post EFA
It is important to distinguish between ex ante and ex
post EFA and to appreciate their roles in the various
stages of the project cycle Ex ante is the more
familiar form of EFA Undertaken as a key part of the
project design process it is used to inform decision-
making on the nature of the project and its expected
financial and economic impacts Ex post EFA is
undertaken after an investment project has been
completed There are also intermediate forms of
analysis undertaken during project implementation
which are partly ex post and partly ex ante
It is important to distinguish between the
implementation period and the life of the investment
The implementation period typically five to seven
years is the period in which project activities are
undertaken and IFAD funds disbursed The life of
the investment is much longer typically 20 years
or more during which economic and financial
benefits are expected to accrue Figure 7 shows
a typical IFAD project profile with the investment
costs incurred during years 1-5 recurrent costs
over the 20-year project life and benefits beginning
to flow in year 3 and reaching a plateau from
year 10 onwards
TA BLE 6
Application of general principles of EFA
Key principle Methods of application
Ex ante EFA Implementation
With and without project comparison
Prepare lsquobusiness as usualrsquo scenario on the basis of lsquodo nothingrsquo option
bull Conduct baseline survey to define pre-project status
bull Estimate what would have happened without the project
bull Paired comparisons can help (eg inoutside project area)
Financial analysis Construct farm models showing expected revenue and expenditure for beneficiaries
bull Survey beneficiaries to estimate actual revenue and expenditure
bull Validate andor adjust farm models accordingly
Discounting future benefits and costs
Discount future costs and benefits back to year zero
bull Discount future and previous benefits and costs back to year zero
Accounting for externalities
Identify and quantify all externalities where possible
bull Check for signs of positive and negative externalities emerging during implementation
Adjusting for distortions Deduct taxes add subsidies use shadow prices estimate conversion factors
bull Check for changes in tax and subsidy rates and adjust prices accordingly
bull Update conversion factors on the basis of trade andor tariff data
30
VOLUME 1 BASIC CONCEPTS AND RATIONALE
Methodological issues of ex post and
ex ante analysis
The key aspect to understand when performing
this analysis is that as shown in Figure 7 project
costs and benefits will occur in different moments of
project life
Methodologically speaking if this analysis will
be used for comparison of appraised (ex ante) and
real impacts (ex post) (as is generally the goal) we
need to lsquoplacersquo the comparison in the same point in
time The point in time could be at the beginning or
completion of the project or any other point What
is important is to bring all cash flows to that point in
time using discount techniques Then calculate the
NPVs and compare You will be able to use IRRs only
if the cash flow allows it mathematically (ie if there is
a negative Figure in the first year)
But this is not the only consideration to bear in
mind Other issues arise such as
bull Attribution effects of achieved results given
IFADrsquos scale of intervention it could claim
contribution but not full attribution of increased
beneficiary incomes or decline in food insecurity
bull At completion could be too early to capture all
expected benefits (see Figure 7)
bull A mixed approach in order to compensate for
this second issue is to try to estimate benefits
yet to be produced include them in cash flows
and then perform the discounting (however the
results could be questioned)
bull In order to make a realistic comparison CBA
should be done 10 years after implementation
and this has rarely been done
On a more positive note the alternative would be
to choose some activityfarm models effectively
put in place by the project Perform a financial
analysis at completion and compare it with appraisal
estimations (models developed at design for the
WOP situation) in order to estimate how things
have changed This analysis will not be based on
cash flows but on annual bases thus comparing
F IGUR E 7
Profile of costs and benefits over the project cycle
0
20
40
60
80
100
120
Investment costs
Recurrent costs
Benefits
MTR
Supervision EvaluationDesign
PCR
1Years
2 3 4 5 6 7 8 9 10 11 12 13 14 15 16 17 18 19 20
Implementation period years 1-5
Life of the investment years 1-20
31
VOLUME 1 BASIC CONCEPTS AND RATIONALE
annual financial indicators such as total sales total
production costs employment created Hopefully
full development of the model would have been
achieved by completion so as to provide information
on how adequate project interventions had been
This could also potentially provide information on the
reasons underpinning adoption rates
Ex post EFA and scaling upConfronted with the large-scale problem of reducing
rural poverty which it is mandated to address
and the limited resources available from official
development assistance (ODA) IFAD is compelled
to increase the impact of every dollar it invests in
agriculture and rural development For this reason
scaling up the results of successful development
initiatives is an overarching priority that directly
supports the achievement of IFADrsquos mandate To
deliver on this priority IFADrsquos operational practices
must be geared towards supporting all concerned
actors and institutions ndash including poor rural women
and men and their organizations ndash in achieving
impact at scale
The formal IFAD definition of lsquoscaling uprsquo is
expanding adapting and supporting successful
policies programmes and knowledge in order to
leverage resources and partners to deliver larger
more sustainable results for a greater number of
poor rural people Scaling up results means that
IFAD interventions will not be viewed as a way of
expanding small projects into larger ones Instead
they will focus on how successful local initiatives
will sustainably leverage policy changes additional
resources and learning to bring the results to scale
EFA has an important role to play in informing
scaling-up decisions since evidence of favourable
financial and economic impacts should be a key
criterion for deciding whether or not to scale up
Thus the framing questions must incorporate an
economic and financial dimension as follows
bull Idea If a project is referred to as one that is
being scaled up or otherwise further developed
from previous interventions in the host country
or region what were the economic and financial
outcomes of the activity to be scaled up Have
economic and financial impacts been estimated
or measured
bull Vision How many poor rural men and women
will benefit financially and to what extent What
will be the overall economic impact
bull Drivers Are the economic and financial benefits
sufficiently attractive to drive the expansion and
sustain the initiative over the long term
bull Spaces Is there sufficient capacity to finance
the proposed expansion Is the local regional or
national economy large enough to accommodate
it Can markets absorb the level of production
envisaged
bull Pathways What are the financial and economic
implications of alternative scaling-up pathways Is
a gradual or a fast-track approach preferred
bull IFADrsquos role How will IFAD ensure that economic
and financial impacts of the expansion are
properly monitored and evaluated
Scaling-up issues often need to be addressed during
COSOP formulation or country portfolio reviews
especially where grant-funded pilot programmes
have been implemented and are being considered
for scaling up into full-scale investment projects In
these cases EFA of pilot programmes during and
after implementation becomes an important part of
the strategic process
32
Formulas for profitability indicatorsThe net present value (NPV) indicator defined as
the sum that results when the expected costs of the
investment are deducted from the discounted value
of the expected benefits (revenues) is calculated
through the following formula
Where
Bt = benefits at time t Ct = costs at time tIt = investment costs n = project economic life
r = interest rate used as indicator of opportunity
cost discount rate
The internal rate of return (IRR) indicator is defined
as the discount rate (r) that produces a zero NPV
This represents the maximum interest rate that a
project could face and still not waste resources
This is called the internal rate of return (IRR) It is
calculated through
IRR = (r NPV = 0)
For the project to be profitable the IRR has to be
greater than the interest rate that could be earned in
alternative investments thus whenever IRR gt r the
project is considered viable If the (alternative) interest
rate (imkt) is lower than the IRR the NPV is positive
and vice versa
The benefitcost ratio (BC) indicator is the ratio of
the present value of benefits to the present value of
costs over the time horizon The BC ratio provides
some advantages when it is necessary to formulate
a lsquorankingrsquo of alternative investment projects under
budget constraints
If BC ge1 the project is accepted
If BC lt1 the project is rejected
Cost-effectivenessWhen tangible benefits from a given investment
are difficult to quantify but the costs are easily
identifiable the most common valuation method
is cost-effectiveness It is used to select the least
costly alternative among a set of options that will
achieve the same result (a given set of predetermined
objectives) Once the purpose of the project has
been decided for example construction of a market
storage facility cost-effectiveness would be used to
compare scale location technology etc to choose
among investment options (eg open storage
location of the facility construction materials)
The methodology consists in first listing and
measuring in monetary terms the costs of the
options available and then comparing them with
the costs occurring in the base scenario (without
the project) Total costs are then discounted at
year 1 and the results compared to identify the
cheapest intervention In other words valuation by
cost-effectiveness consists in comparing on a
present-worth basis all alternatives that can achieve
the same benefit (Gittinger 1985) and selecting the
least costly
IRR NPV 0gt gti mkt
IRR NPV 0lt lti mkt
IRR NPV 0gt gti mkt
IRR NPV 0lt lti mkt
IRR NPV 0gt gti mkt
IRR NPV 0lt lti mkt
IRR NPV 0gt gti mkt
IRR NPV 0lt lti mkt
Technical annex
33
VOLUME 1 BASIC CONCEPTS AND RATIONALE
Unfortunately the results of this method which
can justify project investment decisions cannot be
integrated into the streams of incremental net benefits
resulting from classic CBA ndash thus underestimating
the overall benefits of the investment
Multicriteria analysis41
MCA is a decision-making tool used to evaluate
complex decision problems With this tool it is
possible to identify overall preferences among
alternative options where the options entail many
diverse objectives Unlike CBA MCA allows
consideration of aspects other than economic and
financial ones for example social technological and
environmental issues Its use is particularly relevant
when other single-criterion approaches cannot
provide monetary valuations42
In the same model thanks to these techniques
it is possible to consider quantitative and qualitative
data It builds on trade-offs between criteria that
in complex decision-making are usually in conflict
(efficiency and equity for example) Choices are
classified aggregating various items of information
in a common index of utility value Since policy
decisions may be influenced by both monetary
and non-monetary objectives it offers a technique
capable of ranking diverse outcomes
MCA establishes preferences among options
referring to a set of objectives identified by decision
makers It is an important instrument for ranking
options and discriminating between acceptable and
unacceptable possibilities Decision makers must
define quantifiable criteria to judge how an objective
has been achieved and MCA allows them to
41 MCA has not yet been tested as a suitable tool for IFAD project design but is suggested as an alternative in the extreme cases mentioned above of complex decision-making
42 One example would be when production objectives are in contraposition to environmental ones For example to increase livestock production for food security and at the same time reduce CO2 emissions
aggregate the data on individual criteria in order to
provide indicators of the overall performance of the
options It brings out the points of view of the actors
involved in the judgment and is characterized by the
subjectivity related to the opinions of the decision-
making group43
The main advantages of MCA are its openness
explicitness and its power to simplify complex
situations In fact it splits the components of
intricate situations and organizes them so as to find
a solution step by step and clearly Objectives and
criteria chosen by the decision group can in fact be
analysed and changed if they are not considered
suitable This process eases the discussion and
promotes communication within the decision-making
body first and later between that body and the
stakeholders MCA can be both an ex ante and an ex
post evaluation tool
This type of analysis also presents some
difficulties One concerns the choice of the activities
or variables to be studied and definition of the
comparative criteria These operations are often
very complicated and require much time spent
in discussions and negotiations Use of MCA
requires knowledge of mathematical notions
data aggregation methodologies and computer
applications in order to perform analysis following a
structured process and to avoid weak conclusions
It is often costly and time-consuming
43 Indeed the opinion team establishes objectives and criteria assesses relative importance weights and judges the contribution of every option to each performance criterion MCA can be preceded by strengths weaknesses opportunities and threats (SWOT) analysis for the choice of criteria it can be supported by an expert panel to help the negotiating group develop an assessment of a specific topic or it can be assisted by focus groups questionnaires and case studies to choose criteria and rate them In addition criteria can be evaluated using cost-effectiveness analysis
34
VOLUME 1 BASIC CONCEPTS AND RATIONALE
Types of projects and EFA activitiesAspects to look for in the field and the type of
analysis undertaken vary considerably among project
categories as shown in Table 7
TA BLE 7
Main EFA tasks by type of project
Project category Main EFA tasks during implementation
Productivity enhancement (including irrigation)
bull Estimate number of beneficiaries and technology adoption rates by target group households
bull Monitor productivity changes product quality and prices
bull Estimate gross margins (per unit of land and labour) for project and non-project households
bull Update farm models based on observedactual results revise economic analysis as necessary and consider adjustments to project design to improve results
Rural infrastructure bull Review construction schedule and costs relative to design estimates
bull Estimate utilization rates for new or upgraded infrastructure
bull Assess arrangements for operation and maintenance
bull Estimate benefits derived by target group households (eg reduced costs increased prices improved market access)
bull Update farm models based on observedactual results revise economic analysis as necessary and consider adjustments to project design to improve results
Natural resource management
bull Undertake a comparison of NRM activities with and without project
bull Review with and without project scenarios of agricultural productivity
bull Seek evidence of more sustainable and responsible NRM practices
bull Identify and if possible quantify value of environmental benefits
bull Update farm models based on observedactual results revise economic analysis as necessary and consider adjustments to project design to improve results
Community development bull Determine number of target group beneficiaries participating in community development activities
bull Identify what has changed in the community and individual households as a result of these activities
bull Describe improvements in the lives of beneficiary households and value these in monetary equivalents if possible
bull Revise economic analysis as necessary and consider adjustments to project design to improve results
35
VOLUME 1 BASIC CONCEPTS AND RATIONALE
Project category Main EFA tasks during implementation
Institutional strengthening bull Prepare inventory of actual institutional-strengthening activities undertaken
bull Complete assessment of institutional capacity and projectrsquos impact on it
bull Identify how improved institutional capacity has or will generate benefits for target groups
bull Revise economic analysis as necessary and consider adjustments to project design to improve results
Marketing and value chain development
bull Review value chain analysis undertaken during project preparation to update data on volumes costs prices and value addition
bull Identify ways in which improvements in value chain efficiency have improved or are likely to improve market access and farmgate prices for beneficiaries
bull Estimate financial benefits accruing to target group farmers and other value chain actors
bull Update farm models based on observedactual results revise economic analysis as necessary and consider adjustments to project design to improve results
Rural financial services bull Estimate number of beneficiaries with improved access to financial services types of services offered and acceptance rates
bull Monitor cost of financial services at different levels (cost of loanable funds retail service costs at client level) and compare with project design estimates
bull Assess actual or likely changes in farm and non-farm economic activities arising from improved access to rural financial services
bull Estimate the net financial benefits accruing to target group beneficiaries from these changes
bull Update farm models based on observedactual results revise economic analysis as necessary and consider adjustments to project design to improve results
36
Anandajayasekeram P CJ Van Rooyen F Liebenberg 2004 Agricultural project planning and analysis A sourcebook Second Edition Network Activity Program ndash Institutional University Cooperation (IUC) between the Flemish Universities of Belgium and University of Pretoria
Asian Development Bank 2013 Cost-benefit analysis for development A practical guide Manila httpwwwadborgdocumentscost-benefit-analysis-development-practical-guide
Australian Department of Infrastructure and Planning Queensland Government 2012 Project assurance framework ndash Cost benefit analysis guidelines Brisbane Queensland Australia
Belli P J Anderson H Barnum J Dixon and J-P Tan 1998 Handbook on economic analysis of investment operations Washington DC Operational Core Services Network Learning and Leadership Center World Bank httpsiteresourcesworldbankorgINTCDDResourcesHandbookEApdf
Belli P 2001 Economic analysis of investment operations Analytical tools and practical operations Washington DC World Bank
Campell H R Brown 2003 Benefit cost analysis financial and economic appraisal using spreadsheet Cambridge University Press
CIFOR 1999 Guidelines for applying multi-criteria analysis to the assessment of criteria and indicators Bogor Indonesia Center for International Forestry Research wwwcifororgacmmethodstoolbox9html
Department for Communities and Local Government 2009 Multi-criteria analysis A manual London httpeprintslseacuk127611Multi-criteria_Analysispdf
DFID 2011 Guidance for country offices on measuring and maximising value for money in cash transfer programmes London Department for International Development (UK)
European Commission 2008 Guide to cost-benefit analysis of investment projects Brussels httpeceuropaeuregional_policysourcesdocgenerguidescostguide2008_enpdf
FAO 1979 Economic analysis of forestry projects Case studies FAO Forestry Paper No 17 Supp 1 Rome Food and Agriculture Organization of the United Nations
FAO 1995 Guidelines for the design of agricultural investment projects Investment Centre Technical Paper No 7 Rome Food and Agriculture Organization of the United Nations
FAO 2010 Estimating mitigation potential of agricultural projects An application of the EX-ante carbon balance tool (EX-ACT) in Brazil Rome Food and Agriculture Organization of the United Nations
Gittinger J Price 1985 Economic analysis of agricultural projects Washington DC Economic Development Institute World Bank httpdocumentsworldbankorgcurateden198501437966economic-analysis-agricultural-projects
Government of South Africa 2004 Cost-benefit analysis Pretoria Department of Environmental Affairs and Tourism
IFAD 2012 Review of post-harvest systems in IFAD programmes Rome
Jenkins G C Kuo A Harberger 2011 Cost-benefit analysis for investment decisions httpwwwqueensjdiexecorgpublicationsqed_dp_206pdf
Lewis DL 1999 Road user and mitigation costs in highway pavement projects Washington DC Transportation Research Board National Research Council
Mishan EJ 1971 Cost-benefit analysis London George Allen and Unwin
Potts D 2002 Project planning and analysis for development httpswwwriennercomtitleProject_Planning_and_Analysis_for_Development
Raswant V and E Heinemann 2012 Access to markets Making value chains work for poor rural people Rome IFAD
Squire L and HG van der Tak 1975 Economic analysis of projects Baltimore MD USA Johns Hopkins University Press
References
37
VOLUME 1 BASIC CONCEPTS AND RATIONALE
Treasury Board of Canada 2007 Canadian cost-benefit analysis guide Ottawa Secretariat Treasury Board of Canada analys-engpdf
UNIDO 1972 reprinted 1993 Guidelines for project evaluation Order No IDSERH2 Vienna United Nations Industrial Development Organization
UNIDO 1986 Manual for evaluation of industrial projects Vienna United Nations Industrial Development Organization wwwunidoorgfileadminuser_mediaPublicationsdownloadManual_for_Evaluation_of_Industrial_Projectspdf
USAIDINDIA 2000 REFORM Project compendium with practitionersrsquo guide State fiscal management reform Vol V Project appraisal practitionersrsquo guide New Delhi US Agency for International DevelopmentIndia httppdfusaidgovpdf_docsPNADM777pdf
World Bank 2013 Investment Project Financing Economic Analysis Guidance Note httpsiteresourcesworldbankorgPROJECTSResources40940-1365611011935Guidance_Note_Economic_Analysispdf
World Bank 2012 A guide to assessing needs Essential tools for collecting information making decisions and achieving development results by Watkins R Meiers M amp Visser Y httpsopenknowledgeworldbankorgbitstreamhandle109862231663920PUB0EPI00essing09780821388686pdfsequence=1
38
Glossary
Aggregation 15 16 20 in project analysis the process of adding together the costs and benefits of all the entities participating in a project to reach a summary account from which a measure of project worth can be derived Often the result of the aggregation is the Incremental Net Benefit or Cash Flow of a project
Appraisal 7 24 31 A before the fact (ex- ante) evaluation of a proposed investment project to determine its merit and acceptability in accordance with established decision-making criteria
Benefitcost ratio (BC ratio) 13 33 a discounted measure of project worth The ratio of benefits to costs It should be calculated using the present values of each discounted at an appropriate discount rate Most often the opportunity cost of capital The ratio should be at least 1 for the project to be acceptable It may give incorrect ranking among independent projects and cannot be used for choosing among mutually exclusive alternatives
Border price 23 The border price is the unit price of a traded good at the countryrsquos border For exports it is the FOB (free on board) price and for imports it is the CIF (cost insurance and freight) price
Business as Usual (BAU) 8 9 11 14 19 a reference scenario which assumes that future evolution is an extension of the current trends See also lsquodo nothing scenariorsquo
Cash flow 11 12 16 19 20 31 The funds generated or used by the project Reflects the costs and benefits over time from a stated point of view Incomebenefit is a positive cash flow and expensescosts are negative flows
Constant price A price that has been deflated to real terms by an appropriate price index They should be distinguished from current or nominal prices Often used as synonym of real prices
Contingent valuation A method of inferring the value of benefits and costs in the absence of a market What people would be willing to pay to gain a benefit (or willing to accept in recompense for a loss) if a market existed for the good
Conversion factor 5 16 23 30 the factor that converts the domestic market price to an economic price Conversion factors are the ratios of economic to financial prices Thus a conversion factor is a number that is used to convert the domestic market price of an item into its economic opportunity cost to the
economy by multiplying the market price of the item by the conversion factor
Cost An expense related to purchase of inputs including capital equipment buildings materials labour and public utilities Costs such as environmental damage or injuries to health are sometimes referred to as negative externalities
Cost Benefit Analysis (CBA) 7 8 18 31 conceptual framework applied to any systematic quantitative appraisal of a public or private project to determine whether or to what extent that project is worthwhile from a social perspective Cost-benefit analysis differs from a straightforward financial appraisal in that it considers all gains (benefits) and losses (costs) to social agents CBA usually implies the use of economicsocial prices
Cost effectiveness analysis (CEA) 20 33 an appraisal technique used in projects and programs in which benefits cannot be reasonably measured in money terms Cost-effectiveness analysis is used in one of two forms to select least-cost alternatives either holding constant the level of benefits and varying the level of costs or holding constant the level of cost and varying the level of benefits In either form the ratio of cost to benefits is known as the cost-effectiveness ratio
Current prices (Nominal prices) prices as actually observed at a given time They refer to prices that include the effects of general inflation and should be contrasted with constant prices
Cut-off rate the rate below which a project is considered unacceptable It is often taken to be the opportunity cost of capital The cut-off rate would be the minimum acceptable internal rate of return for a project or the discount rate used to calculate the net present value the net-benefit investment ratio or the benefit-cost ratio
Depreciation 14 Not a term used in cost-benefit analysis In other financial frameworks depreciation is the allocation of the cost of an asset over time Depreciation is a method of allocating the cost of a tangible asset over its useful life For accounting purposes depreciation indicates how much of an assetrsquos value has been used up For intangible assets amortization is the correct term However these are accounting concepts that makes no sense in financial analysis Here the full investment costs will be computed every time the asset needs replacement
39
VOLUME 1 BASIC CONCEPTS AND RATIONALE
Direct transfer payment 15-17 Transfer payments are transfers of money among residents of a country without a corresponding exchange of goods and services Taxes are transfer payments from individuals to the government Subsidies are transfer payments from the government to individuals Gifts are transfers ldquoin kindrdquo from one individual to another Because transfer payments are not made in return for goods and services they do not add to total output When transfer payments occur in the context of projects they redistribute project costs or benefits from the project entity to some other group or individual in the country
Discount rate 12 14 16 23 the interest rate at which future values are discounted to the present It usually represents the cost of capital for the person or entity calculating the net present value of the stream The financial discount rate and economic or social discount rate may differ in the same way that market prices may differ from economic prices The selection of the discount rate in financial analysis is a relative straightforward process and that is calculated as the potential gains of alternative safe investments on the market In economic analysis where project viewpoint is overturned toward the socio-economic context this parameter needs to be estimated properly so as to i) reflect the public nature of the investment ii) account for scarcity of resources and iii) ensure good use of public funds (See also social discount rate)
Discounted cash flow 14 The costs and benefits (cash flows) discounted to present values to give a common basis for comparison
Discounting 12 31 The process of adjusting future values to an equivalent present value at a stated point in time by a discount rate
Distortion 16 30 A difference between market prices and true values (economic prices) A distortion is any interference with market forces that renders the resulting quantity produced and price different from the price and quantity that would result under conditions of perfect competition
Distributional effect A change in the income or wealth of the people from whose point of view the benefit-cost analysis is done
Do nothing scenario the baseline scenario lsquobusiness as usualrsquo against which the additional benefits and costs of the lsquowith project scenariorsquo can be measured (often a synonym for the lsquowithout projectrsquo scenario)
Economic analysis 7 14-17 20 30 analysis that is undertaken using economic values reflecting the values that society would be willing to pay for a good or service In general economic analysis values all items at their value in use or their opportunity cost to
society (often a border price for tradable items) It has the same meaning as social cost-benefit analysis
Economic cost The economic cost of an activity or resource is the cost to society of that activity or resource Economic costs include the private costs borne directly by economic agents undertaking the activity and all other costs borne by other economic agents For example the economic costs of driving automobiles include the private costs of petrol plus the additional costs of congestion borne by other users of the roads plus the costs of pollution borne by society in general
Economic impact analysis the analysis of the total effects on the level of economic activity (output income employment) associated with the intervention This kind of analysis focuses on macroeconomic indicators and forecasts the influence of the project on these indicators It goes beyond CBA when very large projects are considered in relatively small economies
Economic net present value (ENPV) 16 The net present value of a project calculated using true or economic values Synonymous with social net present value
Economic price 16 Price that reflects the relative value that should be assigned to inputs and outputs if the economy is to produce the maximum value of physical output efficiently There is no consideration of income distribution or other non-efficiency goals in such a price Synonymous with efficiency price and true price
Economic rate of return (ERR) 16 An internal rate of return based on economic prices and social opportunity costs of capital expressing the socio-economic profitability of a project (See internal rate of return)
Environmental impact analysis the statement of the environmental impact of a project that identifies its physical or biological effects on the environment in a broad sense This would include the forecasting of potential pollution emissions loss of visual amenity and so on
Export parity price 23 footnote The export parity price is the FOB price of a good or service valued at point of export net of taxes and subsidies and suitably adjusted for internal transport costs to a location in a country The export parity price is the net-of-taxes-and-subsidies price that exporters would need to receive for a good or service sold in the domestic market in order to make them indifferent between selling in the domestic market or exporting
Externalities 5 15-17 30 A benefit or cost falling on third parties who normally cannot pay or be compensated for it through a market mechanism An external benefit is a positive externality an external
40
VOLUME 1 BASIC CONCEPTS AND RATIONALE
cost is a negative externality A positive externality may reduce the costs of a production process of an unrelated economic agent as when the bees of a bee grower pollinate a neighbourrsquos apple orchard They may also increase the enjoyment of another economic agent as when musicians playing for their own pleasure delight those around them A negative externality increases the production costs or reduces enjoyment for another economic agent Traffic congestion and the numerous forms of environmental pollution such as the pollution created by a manufacturing plant are examples of negative externalities Externalities are not reflected in the financial analysis For economic analysis however it is necessary to take such externalities into account and place a value on them
Ex-ante evaluation 24-25 30 the evaluation carried out in order to take the investment decision It serves to select the best option from the socio economic and financial point of view It provides the necessary base for the monitoring and subsequent evaluations ensuring that wherever possible the objectives are quantified
Ex-post evaluation 24-25 30-32 an evaluation carried out a certain length of time after the conclusion of the initiative It consists of describing the impact achieved by the initiative compared to the overall objectives and project purpose (ex-ante)
Farm gate price The price received by farmers for their products net of transport costs to the market where the products are sold
Feasibility study 9 19 a study of a proposed project to indicate whether the proposal is attractive enough to justify more detailed preparation It contains the detailed technical information necessary for the financial and economic evaluation
Financial analysis 7 14-17 19 30 31 the analysis carried out using market prices and taking a commercial point of view It allows one to 1) verify and guarantee cash balance (verify the financial sustainability) 2) calculate the indices of financial return on the investment project based on the net discounted cash flows
Financial sustainability analysis 14 19 20 analysis carried out in order to verify that financial resources are sufficient to cover all financial outflows year after year for the whole time horizon of the project Financial sustainability is verified if the cumulated net cash flow is never negative during all the years considered
Financial rate of return An internal rate of return based on market prices and opportunity costs of capital(See internal rate of return)
Human capital Human capital is the stock of skills and productive knowledge embodied in people The
purpose of investing in human capital is to improve the productivity of human beings
Impact 25-27 a generic term for describing the changes or the long term effects on society that can be attributed to the project Impacts should be expressed in the units of measurement adopted to deal with the objectives to be addressed by the project
Import parity price 23 footnote The import parity price is the CIF price of a good or service valued in a specific geographical location It includes the CIF price of the good suitably adjusted for transport costs net of taxes and subsidies The import parity price aims to measure the price that producers in the country would receive for a good or service produced in the country for sale in the domestic market under conditions of free trade
Incremental 11-14 19-20 Additional or marginal
Inflation A general increase in market price levels (a fall in the general purchasing power of the currency unit)
Input 26 28 That which is consumed by the project (as opposed to the projectrsquos output) Usually refers to the physical inputs used by the project including materials capital labour and public utilities Inputs like environmental quality foreign exchange and workersrsquo health are usually termed externalities
Internal rate of return (IRR) 12 33 The yield or profitability of a project based on discounted cash-flow analysis The IRR is the discount rate at which a stream of costs and benefits has a net present value of zero It is equivalent to the discount rate r that satisfies the following relationship
IRR NPV 0gt gti mkt
IRR NPV 0lt lti mkt
where Bt is the benefit stream and Ct is the cost stream The internal rate of return is compared with a benchmark in order to evaluate the performance of the proposed project The internal rate of return is then compared with the market rate of interest to determine whether or not a proposed project should be undertaken (See cut-off rate)
Financial Rate of Return is the internal rate of return calculated when all the inputs and outputs are calculated using financial values Economic rate of Return is based on economic opportunity costs
Logframe 10 25-27 is a management tool mainly used for designingand MampE of development projects It consists of four steps (1) establishing objectives (2) establishing cause-and-effect relationships (causal linkages) among activities inputs outputs and objectives (3) identifying assumptions underlying the causal linkages and (4) identifying objectively-verifiable measures for evaluating progress and success
41
VOLUME 1 BASIC CONCEPTS AND RATIONALE
Market price 14-17 (a) The price of a good in the domestic market (see financial prices) as opposed to the economic price shadow price or social price (b) the cost of a good including indirect taxes and subsidies It is the price relevant for financial analysis
Model A representation or simulation of a system or process showing how parameters benefits and costs interact to produce a bottom-line result by which the project can be judged
Monitoring 25-27 the systematic examination of the state of advancement of an activity according to a pre-determined calendar and on the basis of significant and representative indicators
Multi-criteria analysis 22 34 MCA is an evaluation methodology that considers many objectives by the attribution of a weight to each measurable objective In contrast to CBA that focuses on a unique criterion (the maximisation of social welfare) Multi Criteria Analysis is a tool for dealing with a set of different objectives that cannot be aggregated through shadow prices and welfare weights as in standard CBA
Mutually exclusive 8 12 13 Alternatives that cannot be undertaken simultaneously if one alternative is carried out the other cannot be The alternatives may be mutually exclusive because they represent alternative times of beginning the same project because funds are limited or because if one is carried out the other will not be required (for example a choice between a thermal and a hydro power station)
Net present value (NPV) 12 13 27-29 33 The net value of an investment when all costs and benefits expressed in standard units of value (numeraires) are summed up The sum that results when the discounted value of the expected costs of an investment are deducted from the discounted value of the expected revenues The net present value of a stream of costs and benefits is a number that results from discounting the values of the stream at a given discount rate It is equivalent to the number that results from the following expression
IRR NPV 0gt gti mkt
IRR NPV 0lt lti mkt
whereBt = benefits at time t Ct = costs at time tIt = investment costs n = project economic lifer = discount rate
Net revenues the amount remaining after all outflows have been subtracted from all inflows Discounting the incremental net revenues before financing gives a measure of the project worth of all resources engaged discounting the incremental net revenues after financing gives a measure of the project worth of the entityrsquos own resources or equity
Nominal prices Prices prevailing in a particular year Synonymous with budget-year dollars
Non-tradable good 16 23 footnote good or service that by its very nature cannot be exported or imported Land and buildings are examples of a non-tradable good
Non-traded good 16 23 footnote A non-traded good or service is one that is neither exported nor imported in a particular country for a variety of reasons including quotas and prohibitions Common examples of non-traded items are certain drugs haircuts etc In project analysis non-traded refers to goods and services not traded by the country in which the project is located
Numeraire a standard unit of value Money is a numeraire by which the values of different commodities can be compared In cost-benefit analysis the numeraire is the common denominator for measuring benefits and costs Widely used numeraires are the willingness to pay or aggregate consumption numeraire and the foreign exchange numeraire
Operational and maintenance costs 21 35 The recurring costs for operating and maintaining the value of physical assets
Opportunity cost 12 16 19 The best alternative return foregone elsewhere by committing assets to the project The value of something foregone For example the direct opportunity cost of a person-day of labour is what the person would otherwise have produced or being paid for that day of work The value of a resource in its best alternative use For the financial analysis the opportunity cost of a purchased input is always its market price In economic analysis the opportunity cost of a purchased input is its marginal social value in its best non-project alternative use
Output 27 That which is produced Usually refers to the physical product of the project Other effects of the project such as housing for workers employment training of labour and foreign-exchange savings are usually called externalities
Payback period The time required for the cumulative present value of benefits to become equal to the cumulative present value of costs
Programme 8 is a portfolio of multiple projects that are managed and coordinated as one unit with the objective of achieving common (often intangible) outcomes and benefits at sector country or even multi-country level
Project 8 is a temporary entity established to deliver specific (often tangible) outputs in line with predefined time cost and quality constraints A project should always be defined executed and evaluated relative to an approved business plan which balances its costs benefits and risks
42
VOLUME 1 BASIC CONCEPTS AND RATIONALE
Project analysis 8 20 the analytical framework for the evaluation of a projectrsquos feasibility and performance It includes the analysis of the context the objectives technical aspects demand forecasts and financial and economic costs and benefits Project analysis is needed to determine if given the alternatives a proposed project will sufficiently advance the objectives of the entity from whose standpoint the analysis is being undertaken to justify the project
Project cycle 24-25 30-31 a sequence of the series of necessary and pre-defined activities carried out for each project Typically it is separated into the following phases conceptualization inception formulation appraisal ex-ante evaluation financing implementation and ex-post evaluation
Real prices calculated by adjusting market prices by an appropriate price index to eliminate the effects of inflation Prices of goods and services change over time either because the general price level rises that is because of inflation or because the underlying conditions of supply and demand change Real prices refer to prices of goods and services that reflect changes in the underlying conditions of supply and demand but that do not reflect the effects of inflation The terms real prices and constant prices are used interchangeably but referring to real prices as constant prices is misleading Real prices do not necessarily remain constant over time as they change in response to changes in supply and demand Real prices should be distinguished from current prices which reflect inflation as well as changes in supply and demand
Relative prices the exchange value of two goods given by the ratio between the quantity exchanged and their nominal prices
Risk 10 25-27 The degree to which outcomes are uncertain The extent of possible variation in the outcome
Risk analysis 10 25-27 Risk analysis is a technique for assessing the expected net present value of a project in relation with project risks By taking into account the probability distribution of critical variables and the correlations among them it enables analysts not only to assess the expected net present value of a project but also its associated probability distribution In cost-benefit analysis it recognizes the simultaneous variation of the values of several inputs according to specified ranges and probabilities and analyses the resulting variability in the bottom line
Scale 31-33 The size of a project
Scenario 11 14 30 An outline or portrait of a possible future usually portrays unfolding events rather than being static in time
Sensitivity analysis 16 27-29 Sensitivity analysis is an analytical technique to test systematically the
effects on a projectrsquos outcome of changes in its basic assumptions Sensitivity analysis is carried out by varying one element or a combination of elements and determining the effect of that change on projectrsquos profitability indicators (NPV and IRR)
Shadow price 16 23 footnote 30 A shadow price of a good or service is the economic opportunity cost to society of that good or service The true or economic value of a good (as opposed to the market price which might be distorted) Synonymous with economic or social price
Social price 16 A price that reflects the true value to the country of inputs and outputs of the project Synonymous with economic price and shadow price
Social discount rate 12 footnote 16 It attempts to reflect the social view on how the future should be valued against the present (See Discount rate)
Socio-economic costs and benefits 13 opportunity costs or benefits for the economy as a whole They may differ from private costs and benefits to the extent that actual prices differ from economic prices
Switching value 27-28 The switching value of a variable is that value that it would have to attain in order for the outcome of the project to fall below the minimum level of acceptability (net present value of the project equal to nil)
Time value of money Time value of money refers to the concept that money received in the present is more valuable than money received in the future It is the concept underlying discounting
Tradable 16 23 footnote Referring to a good that could be traded internationally in the absence of restrictive trade policies
Traded good 16 23 footnote A traded good is a good that is either exported or imported by some country
Transfer payments 15-17 22 Payments that redistribute wealth but do not use up resources or create them
Willingness to pay What consumers are willing to pay for a good or service Consumers willing to pay substantially more than the actual market price enjoy a consumer surplus (the amount they would pay minus the amount they actually have to pay)
With project scenario (WP) 11 Box 2 estimation simulation modelling of project envisaged costs and benefits
Without project scenario (WOP) 11 Box 2 the baseline scenario against which the additional benefits and costs of the with project scenario can be measured (eg business as usual)
43
VOLUME 1 BASIC CONCEPTS AND RATIONALE
Steps in economic analysis
Economic analysis requires assessment of a projectrsquos net impact on economic welfare
by considering
5 Convert all market prices into economicshadow prices (SP) that better reflect the social
opportunity cost of the good
6 Remove transfer payments (taxes and subsidies) and quantify externalities (positive
and negative)
7 Aggregate all modelsrsquo NIB cash flows respecting incorporation phasing patterns of targeted
beneficiaries into projectrsquos activities
8 Compare aggregated benefits with other project costs to obtain incremental discounted
cash flows Calculate economic performance indicators adopting a social discount rate
ENPV ERR BC ratio
9 Perform sensitivity analysis (SA) in order to deal with the main risks and uncertainties that
could affect the proposed project
Steps in financial analysis
The typical sequence of tasks to be undertaken in financial analysis is the following
1 Develop farmenterprise models and identify benefits and costs (investment and recurrent) for
WOP and WP scenarios (based on crop budgets)
2 Compare the discounted flows of benefits and costs and calculate the differences between the
obtained results and the WOP scenario in order to determine the net incremental benefits (NIB)
of the proposed interventions
3 Calculate the project financial profitability indicators of each model (ie financial NPV financial
IRR and BC ratio) applying these investment criteria to make an investment decision
(positive or negative)
4 Assess family incomes and establish financingcredit needs by performing a lsquosustainability analysisrsquo
Summary steps in financial and economic analysis
44
WP-WOP develop and identify
Develop farmenterprise models and identify benefits and costs (investment and recurrent) for WOP and WP scenarios (based on crop budgets)
Calculate indicators
Calculate the project financial profitability indicators of each model (ie financial NPV financial IRR and BC ratio) applying these criteria to make an investment decision
Financial sustainability
Assess family incomes and establish credit needs by performing a lsquosustainability analysisrsquo
Discount flows ndash costs and benefits
Compare the discounted flows of benefits and costs and calculate the differences between the obtained results and the WOP scenario in order to determine the net incremental benefits (NIB) of the proposed interventions
Shadow prices
Convert all market prices into economicshadow prices (SP) that better reflect the social opportunity cost of the good
Aggregation
Aggregate all modelrsquos NIB cash flows respecting incorporation phasing patterns of targeted beneficiaries
Cash flows
Compare aggregated benefits with other project costs to obtain incremental discounted cash flows Calculate economic performance indicators adopting a social discount rate ENPV ERR BC ratio
Transfers and externalities
Deduct taxes and subsidies ndash Consider positive and negative externalities
Perform sensitivity analysis
in order to deal with the main risks and uncertainties that could affect the proposed project
1
5
6
7
8
9
2
3
4
Economic analysisFinancial analysis
EFA step by step
International Fund for Agricultural Development
Via Paolo di Dono 44 - 00142 Rome ItalyTel +39 06 54591 - Fax +39 06 5043463E-mail ifadifadorgwwwifadorgwwwruralpovertyportalorg
ifad-unblogspotcom
wwwfacebookcomifad
instagramcomifadnews
wwwtwittercomifadnews
wwwyoutubecomuserifadTV
Contacts EFA desk
Eloisa de Villalobos Thomann
EFA Technical Adviser Tel +39 06 5459 2827Email edevillalobosifadorg
Enrico Mazzoli
Technical Adviser Tel +39 06 5459 2462Email emazzoliifadorg
- Acknowledgements
- Contents
- Abbreviations and acronyms
- Section I - Introduction
-
- Background
- Scope
- Outline
- How to read the guidelines
-
- Section II - Relevance of EFA
-
- Relevance of economic and financial analysis
- EFA as a decision-making tool in project planning
-
- Section III - Basic concepts in undertaking EFA
-
- Investment criteria profitability indicators
- Economic and financial analysis the differences
-
- Section IV - EFA of IFAD rural
-
- Focusing on lsquotypicalrsquo IFAD rural investment projects and their main benefits
- Unquantified benefits alternative methodologies to CBA
- EFA data sources collection and coherence
-
- Section V - EFA role throughout
-
- EFA in project design Links with the logframe and MampE
- EFA in project design Risk analysis
- EFA in project supervision implementation and ex post evaluation
- Ex post EFA and scaling up
-
- Technical annex
-
- Formulas for profitability indicators
- Cost-effectiveness
- Multicriteria analysis
- Types of projects and EFA activities
-
- References
- Glossary
- Summary steps in financial and economic analysis
-

VOLUME 1 BASIC CONCEPTS AND RATIONALE
F IGUR E 1
EFA guidelines outline
OutlineThe guidelines are divided into three volumes as
shown in Figure 1 Volume 1 highlights the relevance
of EFA to investment projects in general presenting
some basic technical concepts and briefly describing
the process of classic EFA It also explains the
use of different EFA elements throughout design
implementation and supervision of development
projects A short presentation of alternatives
methods to EFA such as cost-effectiveness and
multicriteria analysis (MCA) are also included in
this volume Volume 2 is the core of these IGs and
defines minimum requirements for the elaboration
of comprehensive EFA of IFAD rural investment
projects All detailed steps of analysis are presented
and illustrated through a hypothetical example the
Guideland Rural Development Project An annex to
volume 2 offers technical notes practical tips quality
checklists and suggested tables for the presentation
of results Volume 3 presents a set of practical
examples on the assessment of quantitative benefits
in cases in which project activities are not directly
related to production or productivity objectives
(eg rural finance projects climate adaptation
initiatives community-demand-driven [CDD] or
capacity-building projects)
How to read the guidelinesThese IGs are directed to two different audiences
The first includes CPMs country programme
officers government officers and anyone designing
andor implementing IFAD projects who are
making informed decisions and need to know the
basic concepts of EFA For this group volume 1
will provide all the information needed to use EFA
results for example linking EFA outcomes and
assumptions to define benchmark indicators for the
logframe or using sensitivity analysis to inform the
risk assessment exercise The second audience is
the EFA analyst In volumes 2 and 3 she will find
IFADrsquos minimum requirements for quality standards
a practical example illustrating all the steps required
to perform analysis and suggestions on the
presentation of results Answers to the most frequent
questions and identification of the most common
mistakes are provided in text boxes
Basic concepts and rationale
Minimum requirements
Case studies
IFADrsquoS INTERNAL GUIDELINES
Economic and Financial Analysis of rural investment projects
32
1
6
Relevance of economic and financial analysisEFA originated as a central tool in ensuring efficient
allocation of government spending It was meant
to ensure that public funds were efficiently used in
all major public reconstruction and infrastructure
investments mostly following World War II Since the
1960s CBA has been recognized as the major lsquopre-
investment toolrsquo in facilitating investment decisions
on public investments and policy
EFA of investment projects is a basic requirement
for investor and recipient decision-making in
project investment and financing Currently most
IFIs (eg the African Development Bank (AfDB)
Asian Development Bank (AsDB) Inter-American
Development Bank (IDB) and World Bank (WB))
require an EFA when deciding project financing and
they guide recipient governments accordingly
IFAD has recognized the need to ensure the
viability of its operations so that member states can
borrow funds in the knowledge that repayments
can be generated from project benefits and not
place themselves in unsustainable debt situations
Consequently IFAD acknowledged the relevance of
economic and financial analysis as a requirement for
project approval in its founding documents (see the
Agreement Establishing IFAD article 7 section I[d] 2
and the IFAD Lending Policies and Criteria [III (26)])3
Initially undertaking of EFA was very common
in IFAD project designs but a shift away from
production-oriented programmes towards
community-based and capacity-based projects in
the 1990s changed the degree to which designs
were able to produce robust EFA With value chains
2 ldquohellip eligibility for assistance shall be on the basis of objective economic and social criteriahelliprdquo
3 ldquoThe Fund taking due account of hellip the principle of economic viability of projectshelliprdquo
now emerging as a focus ndash and more generally
with greater attention given to the issue of project
efficiency ndash the need is shifting back towards
a more-classical approach to EFA Today it is
considered a priority for IFAD and under IFAD10 4 one of the indicators of the corporate Results
Measurement Framework (RMF) is that loan-financed
projects receive a published and verifiable
economic analysis5
These guidelines seek to demonstrate the
utility of EFA analysis throughout the participatory
planning design implementation and evaluation
of projects This is indispensable to good project
appraisal and lets decision makers assess the overall
value of a project including the likelihood that target
beneficiaries will adopt the interventions proposed
The following sections demonstrate that
EFA provides information both to understand the
convenience of private investments for target
beneficiaries and to prove to governments that
public resources will be efficiently allocated
EFA as a decision-making tool in project planningAll the development programmes and initiatives
are made of projects Projects are the main
tool governments use to encourage and shape
development They allow us to transform into
practice ideas highlighted in the poverty reduction
strategy papers
A clear distinction can be made between
projects and programmes although the two
concepts are tightly related
4 The Tenth Replenishment of IFADrsquos Resources
5 Indicator 427 ldquoshare of projects with a published and verifiable economic analysis (yearly)rdquo Revised IFAD10 RMF (2016-2018)
SECTION II Relevance of EFA
7
VOLUME 1 BASIC CONCEPTS AND RATIONALE
Programme is a portfolio comprised of multiple
projects that are managed and coordinated as one
unit with the objective of achieving common (often
intangible) outcomes and benefits at sector country
or even multi-country level
Project is a temporary entity established to
deliver specific (often tangible) outputs in line with
predefined time cost and quality constraints A
project should always be defined and executed and
evaluated relative to an approved business plan
which balances its costs benefits and risks
Whenever a project involves the decision to
use available economic resources (eg productive
capital infrastructure human capital knowledge) in
the anticipation of future benefits it is an lsquoinvestment
projectrsquo In brief an investment project is the decision
to make current expenditures in the anticipation of
future benefits
IFADacutes main activity is the financing of rural
investment projects through loans and grants EFA
provides clear and simple indicators to ensure that
a projectrsquos investments generate the anticipated
benefits at household and project levels Thus
IFAD requires this analysis in its project formulation
documents Apart from country-level decisions EFA
results are also used to inform approval decisions in
QEQA processes and by the Executive Board
In summary the main purpose of EFA is to
ensure an efficient allocation of resources proving
to governments the benefit of implementing one
particular investment rather than another option
which could be the lsquodo nothingrsquo alternative (Figure 2)
EFA is the most appropriate tool in appraising the
convenience of carrying out a project for both
the direct beneficiaries and the national economy
as a whole
Thus when appraising the economic and
financial viability of any project one must first
examine the lsquobusiness as usualrsquo (BAU) or lsquowithout
projectrsquo alternative and then compare it with proposed
options What the analyst needs to assess is the
value added (incremental approach) of the project
As a major methodological tool EFA makes use
of CBA but it also allows for other approaches
and studies such as cost-effectiveness and
multicriteria analyses Because costs and benefits
do not occur at the same time ndash with costs generally
preceding and exceeding benefits during the first
years of the project and benefits especially in
the agriculture sector being realized gradually
over a longer time period ndash the comparison is not
straightforward Hence lsquodiscounting techniquesrsquo
are applied This issue will be further developed in
the following sections
CBA was created as a lsquopre-investment toolrsquo
to facilitate investment decisions In these types
of ex ante decision-making tools there is a
trade-off between the amount invested in the
ex ante studies and the probability of making a
wrong investment decision
F IGUR E 2
Decision-making in project formulation
Decisionalternatives
Decision
criteria If XgtY recommend the project
Do not undertake the project
Resources for alternative
uses
Value of alternative
usesBenefit = Y
Undertake the project
Resources allocated to the project
Value of project
outcome Benefits = X
8
VOLUME 1 BASIC CONCEPTS AND RATIONALE
F IGUR E 3
Guiding questions during project assessment
Should resources be invested in this project
Could people afford to adopt the proposed intervention
Would they take the risk to change current practices
Viability
Feasibility
Uptake
BOX 1
Guiding questions
Should the government invest its scarce resources in this particular intervention Should the
producer adopt the proposed intervention
Replying to these questions will ensure that the proposal is solid from a technical financial and
economic point of view Analysis should assess the viability of the investment and compare it
with alternatives (at least with the presentBAU situation) to ensure that the project is generating
additional value This information is also used to ensure the economic profitability of the project
as a whole
Could the producer afford the proposed technology
From a purely financial point of view are available resources adequate for the producer to invest
in the proposed intervention If these resources are not sufficient alternative financing schemes
should be assessed by the project (eg loans savings schemes insurance grants) In addition
other context-specific restrictions should be considered at this stage ndash such as input availability
labour requirements and legal restrictions ndash that could be a barrier to modifying current practice
Would the producer take the risk Would the government take a loan to finance
this project
This is one of the most relevant questions for all project implementers Are incentives high enough
to convince producers to change their current situation Here not only monetary incentives
should be considered but also social cultural and environmental ones
A proper risk analysis would identify the critical economic parameters the government should
consider when making its investment decisions
The ability to support decision-making is a
key element of EFA It provides solid indicators for
answering questions regarding lsquothe best alternativersquo
from the points of view of different actors
Figure 3 shows guiding questions for the
assessment of any investment project and
box 1 provides more information on how these
can be used
9
VOLUME 1 BASIC CONCEPTS AND RATIONALE
The various steps in EFA provide information
to respond to these questions taking into account
that the decision is not simple projects require time
to develop and one wants to make certain that the
improvements in peoplersquos lives are permanent
EFA requirements technical and
institutional viability
EFA is only one part of the overall analysis of a
project it assumes that the project is technically
sound and that its institutional arrangements will
be effective during implementation In other words
EFA of investment projects requires at the least
that the project under analysis be feasible from the
technical and institutional points of view Projects
can be implemented through different institutional
arrangements and using different technical solutions
For a project to be viable at least one of these
institutional arrangements needs to be valid and at
least one technical solution needs to be viable As
will be seen the application of EFA during project
formulation will also help identify and select the lsquobestrsquo
project technical and institutional alternatives This
is a strong assumption as the review of numerous
cases has shown many inconsistencies in project
technical formulation
Commonly identified inconsistencies include
(a) incomplete or inadequate description of the
institutional arrangements for carrying out the
proposed project components (b) incomplete or
inadequate identification of constraints on productive
development For example the project (i) proposes
a new technology but there is no assessment
of the on-farm working capital requirements for
adopting it and consequently the project lacks the
required financing component (eg grants credit)
(ii) plans huge investments in irrigation facilities
but no provision has been made for the required
technological transfer services and working capital
needs (iii) proposes improvement of rural financial
services but there is no description of the expected
productive activities and technologies to be adopted
through the support of these facilities
Thus reviews of the technical proposals and
institutional arrangements for project implementation
are steps prior to EFA They involve preparation of an
adequate project logframe (reviewed at each stage
of the project cycle) which is essential in confirming
institutional viability
10
This section illustrates basic concepts so that the
non-specialist can become more familiar with the
terminology and purpose of EFA However detailed
information on carrying out EFA of projects is
provided in volume 2 of these guidelines
EFA is based on comparison of the net6 cash
flows of investment alternatives The present or
BAU cash flow is compared with at least one
other investment alternative which according
to the projectrsquos technical specialists will result in
amelioration of the producerrsquos situation
6 Net cash flows defined as Benefits discounted cash flow net from costs discounted cash flows
However in order to assess if the project is
making good use of public funds the costs of
implementing it (including the institutional setting
and capacity-building of both implementers and
producers) must be compared with the benefits
produced In other words the value added by the
project is compared with the incremental costs of
implementing it
In practical terms the analyst models diverse
beneficiary livelihood strategies to compare BAU
situations with the project proposal Description
of the BAU or without project (WOP) situation
although simple at first sight can confuse the analyst
regarding many aspects (box 2)
BOX 2
With project (WP) and without project (WOP) scenarios common issues
Accurate description of both WP and WOP scenarios is essential to a realistic assessment of
incremental benefits
1 WOP equal to zero When the project proposes development of a new activity many analysts
represent the WOP as a null scenario because the activity wasnrsquot present in the past
However the correct approach is to realistically represent the alternative activities
(eg off-farm employment)
2 Static or unrealistic WOP Generally WOP scenarios are presented as a static situation that
repeats itself through the years This is often underestimating the capacity of people to adapt
and progress Projects generally assist these processes and accelerate their returns
3 An inaccurate WP fails to assess the incremental net value of the project In a woodlot project
in Malawi that aimed to produce firewood analysts spent a great deal of time studying how
to value the incremental wood production since there was no market for the wood Finally
they decided on an international valuation of the energy created They missed the point In
the without situation women spent a great deal of time travelling to procure firewood with
the project they could spend their time producing more maize If the analysts had developed
realistic WOP and WP situations they would have realized that the benefits of the project
came from incremental maize not wood production
Basic concepts in undertaking EFA
SECTION III
11
VOLUME 1 BASIC CONCEPTS AND RATIONALE
Next one needs to formulate the WP situation
defining expected outcomes in the future by
identifying the requested investment and operating
costs as well as projecting estimated benefits7 In
order to convert future costs and benefits which do
not occur at the same time into todayrsquos values for
comparison discounting techniques are applied
Discounting permits comparison of the value of
money in different time periods considering that
a dollar today is worth more than a dollar received
tomorrow (ie the fact that we have to postpone
consumption makes tomorrowrsquos dollar less valuable
than todayrsquos) How much is $1 received in lsquonrsquo years
worth today The answer depends on the adopted
discount rate (r) and the discount period (n)8
Thus the aggregation of project flows occurring
in different years requires adoption of an appropriate
discount rate to calculate the present value of future
flows As a guiding principle discount rates should
represent the opportunity cost of capital for the
agent (producer or government)9 The other essential
element in discounting is definition of the discount
period (also called lsquoproject economic lifersquo or lsquotime
horizon analysisrsquo)
Usually the discount period is equivalent to the
lifespan of the largest investment components of
the project10
Finally the project net cash flows (ie financial
andor economic)11 are based on the incremental
approach which results from comparing the
WP and WOP situations With these elements it
is possible to calculate the corresponding project
lsquoprofitability indicatorsrsquo
7 The analysis is looking at future investments and outcomes thus sunk costs are irrelevant
8 The present value (PV) = future value(1+r)n If r = 10 and n = 8 years the present value of $1 would be $051
9 For the producer a realistic alternative is an average of the passive deposit rate of local commercial banks The government should instead consider the interest rate at which the country can actually borrow capital from a relevant international capital market alternatively the return on long-term public treasury bonds is also a suitable option More information on determining a relevant discount rate is provided in volume 2
10 This rule might change when (i) technological progress would make the investment obsolete before the end of its useful life (ii) the investment period is lsquotoo longrsquo (ie very common in environmental projects ship construction etc) or (iii) other factors exist (ie legal institutional etc) that justify another specific choice for the discount period
11 See the following subsection for differences between the two
Investment criteria profitability indicatorsGenerally speaking a project is considered lsquoviablersquo
if the sum of expected incremental benefits is
larger than the sum of all costs accrued in project
implementation This can be assessed through
profitability indicators12 The most relevant indicators
for these IGs are the net present value internal rate
of return and benefitcost (BC) ratio
bull The net present value (NPV) indicator is defined
as the sum that results when the expected
costs of the investment are deducted from
the discounted value of the expected benefits
(revenues) Whenever NPV gt 0 the project is
considered worthwhile or profitable Among
mutually exclusive projects the one with the
highest NPV should be chosen
bull The internal rate of return (IRR) indicator is
defined as the discount rate (r) that produces
a zero NPV This represents the maximum
interest rate that a project could face and still
not waste resources
For the project to be profitable the IRR has
to be greater than the interest rate that could be
earned in alternative investments thus when
IRR gt r the project is considered viable If the
(alternative) interest rate (imkt) also called opportunity
costs of capital is lower than the IRR the NPV is
positive and vice versa
IRR NPV 0gt gti mkt
IRR NPV 0lt lti mkt
12 Formulas can be found in the technical annex
12
VOLUME 1 BASIC CONCEPTS AND RATIONALE
Both NPV and IRR are calculated on the same
project cash flows of incremental net benefits
However in certain cases the calculation of
IRR is not possible and thus it cannot be used as a
profitability indicator
This is the case when (a) the flow of net
incremental benefits does not have a negative
element or (b) it presents more than one IRR
complicating the decision as to which one to
consider as the profitability indicator
Moreover IRR is an indicator that should not be
used to rank or select mutually exclusive project
options as it cannot provide a measure of the size or
magnitude of project value13 (box 3)
The NPV on the other hand is an indicator that
can always be calculated as is the case with the
benefitcost ratio
bull The (BC) ratio indicator is the ratio of the
present value of benefits to the present value
of costs over the time horizon The BC ratio
provides some advantages when a ranking of
alternative investment projects is needed under
budget constraints
If BC ge 1 the project is accepted
If BC lt 1 the project is rejected
13 Where a project is the only alternative proposal to the status quo the issue is whether the IRR provides worthwhile additional information Views differ in this respect Some argue that there is little merit in calculating a statistic that is either misleading or subservient to the NPV Others see a role for the IRR in providing a clear signal as regards the sensitivity of a projectrsquos net benefits to the discount rate Yet whichever perspective is taken this does not alter the broad conclusion on the general primacy of the NPV rule
These IGs consider that the most appropriate
indicator for appraising an investment project is
the NPV as the investment decision criterion is
straightforward if NPV is gt 0 the project is viable
It means that the proposed investment is a profitable
alternative in terms of resource allocations It is better
than the present and WOP situations and also better
than allocating the same resources to other economic
activities that will yield the average profit rate
Economic and financial analysis the differencesAll investment projects include a number of
stakeholders and this has implications for the
valuation of the benefits and costs accrued by
project interventions Whose costs and benefits
count14 Governments and society as a whole will
consider and value costs and benefits differently
from producers or any other private actor individually
From the perspective of a development agency such
as IFAD both points of view are relevant to a reply
to the guiding questions stated before Should the
government invest in this project Will the producer
take the risk
14 In the CBAEFA literature the question of lsquowhose costs and benefits countrsquo is known as the lsquostandingrsquo issue (ie whose welfare counts in the aggregation of net benefits)
BOX 3
IRR or NPV
Although the most appropriate indicator for appraising an investment project is the NPV ndash as it
can always be calculated and will provide information on the magnitude of the return ndash the IRR is
the most commonly used This is probably due to the fact that IRR is expressed as a percentage
which is often wrongly associated with other rates of return such as interest rates (r) or profit rates in
alternative allocations In fact the IRR has no meaning in terms of project value or size
To prove this letrsquos suppose a project is one thousandth the size of another project Simply multiply
each side of the equation by 1000 The calculated IRR will not change but the small project entails
less value The project to be chosen from a social point of view would be the one producing the
bigger returns to the economy and the NPV will clearly show this while the IRR will not
13
VOLUME 1 BASIC CONCEPTS AND RATIONALE
In order to consider these points of view analysis
will be conducted on two levels (a) financial analysis
will consider private stakeholdersrsquo interests15 and
(b) economic analysis will consider government
and society perspectives These two viewpoints will
require the analyst to consider different items
when looking at the benefits and costs of a project
valuate them differently and in some cases even
use different rates to discount the streams of costs
and benefits
The private investor exclusively considers the
costs and benefits related to the productivemarket
aspects of the project while analysis from an
economic point of view considers that benefits are
defined as an increase in social well-being16 The
costs are defined as reductions in social well-being
For a project to be economically viable its social
benefits must exceed its social costs
15 This point of view is also applied to the executing agency of a public project
16 The term lsquosocial welfarersquo or lsquowell-beingrsquo is used in these IGs as a simple monetary measure The definition is taken from neoclassical economics and prevailing economic theories of well-being No attempts are made to include any type of measurement of subjective happiness or to develop any well-being indexes or social indicators
Thus from the perspective of a private
stakeholder (financial analysis) participating in the
investment with risk capital the wealth created by
a project in lsquonrsquo periods of time is defined as the
financial NPV (FNPV) The economic or cost-benefit
analysis looks at the overall impact of the project
and takes the point of view of the collective agent
(eg society) and the wealth created by a project in
lsquonrsquo periods of time is defined as the economic NPV
(ENPV) of the investment produced by the project17
In financial analysis all costs and benefits
should be valued at market prices Only cash inflows
and outflows are considered (depreciation reserves
and other accounting items not corresponding to
actual flows are excluded)
17 In rural development projects where the agent is a subsistence farmer accumulated generated cash per year must be at least equal to or higher than the BAU situation that was ensuring hisher familyrsquos survival
BOX 4
Steps in financial analysis
The typical sequence of tasks to be undertaken in financial analysis is the following
1 Develop farmenterprise models and identify benefits and costs (investment and recurrent) for
WOP and WP scenarios (based on crop budgets)
2 Compare the discounted flows of benefits and costs and calculate the differences between the
obtained results and the WOP scenario in order to determine the net incremental benefits (NIB) of
the proposed interventions
3 Calculate the project financial profitability indicators of each model (ie financial NPV financial
IRR and BC ratio) applying these investment criteria to make an investment decision (positive or
negative)
4 Assess family incomes and establish financingcredit needs by performing a lsquosustainability analysisrsquo
Financial sustainability is ensured if the accumulated generated cash per year is positive or
at most equal to zero17 for all years considered On the contrary if this figure is negative at any
point in time the project is not sustainable meaning that there are not enough financial resources
to cover all the costs and it will be necessary to reassess project financing mechanisms
14
VOLUME 1 BASIC CONCEPTS AND RATIONALE
Economic analysis or cost-benefit analysis
builds on the results of financial analysis with the
additional consideration of impacts and benefits not
directly captured by the latter These analyses are
strictly related as shown in Figure 4
The main steps in financial analysis are
summarized in box 4 A detailed description of
building economic analysis from financial models is
provided in volume 2 which illustrates each step in
EFA of a typical IFAD production-oriented project
In economic analysis the analyst needs to
complement financial analysis by considering all
project impacts on the society The private actor is
generally not interested in considering all negative
or positive impacts that his actions may have on the
rest of society In terms of environmental impact
for example polluting rivers through production
discharges or emitting CO2 are social costs generally
not considered by the private agent These are called
lsquoexternalitiesrsquo as in practical terms the private agent
is lsquoexternalizingrsquo a production cost making the whole
society pay for it On the other hand there also exist
positive effects not counted by the private agent
such as the introduction of new pastures by a single
producer which can increase honey production in
the area and benefit neighbouring beekeepers
These aspects are known as positive and
negative externalities In addition economic analysis
must eliminate all transfer costs between national
and private actors (ie subsidies and taxes) Lastly all
costs and benefits need to be valued at their social
opportunity cost rather than at their market price
F IGUR E 4
Economic and financial analysis links
Aggregation
Project net incremental
benefits(NIB)
Farm budgets properly phased
Activity budgets (eg processing enterprises)
phased
Government implementing
agencies
Financial analysis(market prices)
123n
123n
Farm budgets properly phased
Activity budgets (eg processing enterprises)
phased
Government implementing
agencies
sum
sum
sum
Economic analysis(economic values)
123n
123n
Adjust market values to economic
values
Eliminate transfer
payments (taxes and subsidies)
Quantify externalities
15
VOLUME 1 BASIC CONCEPTS AND RATIONALE
Many times for example when trade barriers
are in place or when currencies are controlled
market prices do not reflect the social value of
goods In order to account for these distortions
one of the most critical tasks is the calculation of
economic or shadow prices Another critical aspect
is the establishment of a social rate of discount
that realistically reflects an investment alternative
(opportunity cost) for the government18 Detailed
explanations and guidelines for these calculations
are also included in volume 2
Table 1 illustrates the process of going from
financial to economic analysis19 The financial
analysis section at the top shows revenues and 20
production costs (operating and investment) of a
hypothetical enterprise The enterprise is experiencing
18 As a general rule when a country is a capital borrower the social rate of discount should be no less than the actual rate of interest on the capital market from which the capital is borrowed
19 Clicking on the table reveals the formulas
20 See section on ldquoUse of SA to assess project risks an examplerdquo
several years of negative net cash flows resulting
in a negative NPV and IRR This is caused by high
operating costs as well as recurrent needs for
investment Economic analysis converts market
prices into economic prices As reflected by the
application of conversion factors (CF) market prices
of outputs and inputs are different from their social
value For example the CF applied to wages reflects
the presence of high unemployment (20 per cent)
in the area which would push people to work for
lower than market wages (thus CF = 08)21 In the
same way the CF applied to investments reflects
the presence of high transport costs or duties that
make the productrsquos market price overestimate its
social value In fact the market price is 83 while the
economic price is 75 and thus the CF is 09
21 Market wage (mW) = US$100 unemployment = 20 economic wage(eW) = US$80 (observed given the high unemployment) CF = eWmW = 80100 = 08
BOX 5
Steps in economic analysis
Economic analysis requires assessment of a projectrsquos net impact on economic welfare
by considering
5 Convert all market prices into economicshadow prices (SP) that better reflect the social
opportunity cost of the good
6 Remove transfer payments (taxes and subsidies) and quantify externalities (positive and negative)
7 Aggregate all modelrsquos NIB cash flows respecting incorporation phasing patterns of targeted
beneficiaries into projectrsquos activities
8 Compare aggregated benefits with other project costs to obtain incremental discounted cash
flows Calculate economic performance indicators adopting a social discount rate ENPV ERR
BC ratio
9 Perform sensitivity analysis (SA) in order to deal with the main risks and uncertainties that could
affect the proposed project20
Critical parameters are (i) SP for tradable and non-tradable goods (ii) SP of foreign exchange
(iii) SP for labour costs (shadow wage) and (iv) the social discount rate
16
VOLUME 1 BASIC CONCEPTS AND RATIONALE
Fiscal corrections are also applied and
10 per cent VAT is deducted from all inputs and
outputs with indirect taxes Finally externalities
are accounted for and quantified both negatives
(increases in noise) and positives (decrease
in pollution)
The project under analysis resulted not profitable from a financial point of view but viable
from an economic point of view This means that
the overall impact for society is positive (also
reflected by the positive externalities) but there
are no sufficient incentives for the private
individual agent to undertake these activities
This conclusion suggests that if the development
objectives achieved through this investment are
significant enough for the government then the
project should develop an incentive scheme to
attract the private agent
These results may be used in policy dialogue
suggesting that the government could reduce the
level of targeted import duties and thus make this
investment proposal financially profitable
TA BLE 1
From financial to economic analysis an example
Financial analysis (market prices)Thousands of United States dollars
Years
1 2 3 4 5 6 7 8 9 10
Total operating revenues 0 42 115 119 126 126 126 126 126 126
Total Inflows 0 42 115 119 126 126 126 126 126 126
Total operating costs 0 -56 -75 -98 -101 -101 -101 -101 -117 -117
Total investment costs -165 -4 -4 -25 -3 0 -25 0 0 12
Total outflows -165 -60 -79 -123 -104 -101 -126 -101 -117 -105
Net cash flow -165 -18 36 -4 22 25 0 25 9 21
Financial rate of return -6
Financial NPV10 US$(89)
Economic rate of return 36
Economic NPV10 US$473
Years
Economic analysis CF 1 2 3 4 5 6 7 8 9 10
Output X 12 0 49 134 139 147 147 147 147 147 147
Total operating revenues 0 49 134 139 147 147 147 147 147 147
Labour costs 08 0 -18 -18 -26 -26 -26 -26 -26 -30 -30
Operating costs 11 0 -36 -57 -73 -76 -76 -76 -76 -87 -87
Total investment costs 09 -149 -4 -4 -22 -3 0 -22 0 0 11
Fiscal correction outputsa 09 0 44 121 125 132 132 132 132 132 132
Fiscal correction inputsa 09 -134 -36 -55 -85 -71 -68 -88 -68 -78 -68
Externalities 0 20 20 20 20 20 20 20 20 20
Decreased pollution 0 23 23 23 23 23 23 23 23 23
Increased noise 0 -3 -3 -3 -3 -3 -3 -3 -3 -3
Net cash flow -282 39 161 98 144 149 107 149 124 145
a VTA of 10 has been eliminated
1 Adjust market values to economic values applying CF2 Eliminate transfer payments (taxes and subsidies)
3 Quantify externalities
17
SECTION IV
IFAD rural investment projects include projects
in integrated rural development irrigation rural
finance value chain development natural resource
management (NRM) climate-change adaptation
and mitigation community development and
institutional strengthening
As IFAD follows its main mandate of focusing its
projects on benefiting poor rural people22 projects
are characterized and designed through identification
of a target group composed mostly of rural people
Poor rural people represent different productive
and economic categories the main one being
smallholders Others include the landless population
engaged in rural non-agricultural microenterprises
rural workers fishers and finally special vulnerable
groups such as women indigenous minorities and
youth All IFAD projects must be formulated on
the basis of benefiting one or more of the above-
mentioned poor rural groups
The increased number of value chain projects
in IFADrsquos portfolio23 ndash aiming to integrate IFADrsquos
traditional target groups into these chains to improve
their access to secure markets and sustainably raise
their incomes ndash has expanded the definition of IFADrsquos
target group to all rural people including small- and
medium-scale entrepreneurs in rural areas However
for the purposes of EFA the impact on poor rural
people is the one that matters the most to IFAD24 and
22 See IFAD Lending Policies and Criteria I (5) ldquoIFAD will concentrate its resources upon activities that promise to achieve in a cost-effective way a reduction of poverty in rural areas where most poor people live and work The Fundrsquos major target groups irrespective of the stage of economic development of the country will be the small and landless farmersrdquo
23 From only 3 per cent in 1999 to 46 per cent in 2009 (Raswant and Heinemann 2012)
24 However when possible and relevant distribution of benefits among value chain actors is a complement to CBA
to the poverty-reduction development objectives of
each government
This IFAD specificity has direct consequences for
CBA discussion of the lsquostandingrsquo issue As previously
stated investment projects include a number
of social stakeholders However for IFAD rural
investment projects this is not a major issue as the
formulation of IFAD projects is focused on benefiting
a specific target group poor rural people25
Focusing on lsquotypicalrsquo IFAD rural investment projects and their main benefitsThe typical IFAD project is usually production
oriented26 and its main outcomes (ie financial and
economic benefits) are frequently net production
increases In other words most IFAD projects will
have a direct impact on the production levels
of target groups which in turn will lead to net
income increases
IFAD projects have an impact on the incomes
of poor rural people by increasing their access to
inputs and services that will subsequently increase
their production volumes andor productivity
The most common areas of intervention include
technical assistance (TA) for crops and livestock
through extension services rural finance services
25 There might be exceptional situations in which other social groups could benefit from an IFAD project These cases might require additional analyses (eg distributional effects analysis) when undertaking EFA
26 Of 114 projects reviewed by QE from 2009 to 2011 73 per cent were agriculture- or rural development-related while in 16 per cent the core objective was to strengthen financial services The rest focused on capacity-building or NRM These data show that most IFAD projects can be characterized as production-oriented that is designed to have direct impact on production and productivity increase
EFA of IFAD rural investment projects
18
VOLUME 1 BASIC CONCEPTS AND RATIONALE
to support on-farm investments and increased
access to working capital through creditloan27 or
grant facilities improved water management through
the construction of irrigation structures provision
of storage drying and cooling facilities to enhance
post-harvest preservation and technical advisory
and financial resources to support entrepreneurs
in starting small and microenterprises ndash as well as
combinations of the above
This IFAD specificity leads to some
straightforward requirements when analysing its
financial and economic results First the project
should be assessed in terms of the financial feasibility
and sustainability of targeted beneficiaries second
the project should be assessed in terms of economic
profitability for the whole national economy
Thus in IFAD production-oriented projects the
main household-level goal in financial analysis is to
determine whether the producer28 will have enough
incentives to participate in the project
In simple terms analysis needs to establish
whether the farmer should undertake the proposed
intervention under the criterion that it is financially
viable (ie the benefits over time are higher than the
investment and recurrent costs) and that these net
benefits exceed present returns (ie incremental
benefits are positive)
However even if the new situation (WP) is more
appealing than the present one (WOP) could the
farmer afford to adopt improved practices Although
viable the investment may still not be profitable if it
does not generate enough returns (mostly during the
first years) to cover the farmerrsquos needs Where the
producer is living under the poverty line the project
should at least generate the same net income each
year as in the BAU situation (subsistence system)
to ensure hisher participation Where poverty levels
are lower incomes should be adequate to cover
investment and working capital needs in addition to
27 Comprising inclusive innovativeadapted rural finance products and services including risk management strategies savings financial literacyeducation programmes etc
28 The terms lsquofarmerrsquo lsquoproducerrsquo or lsquoprivate stakeholderrsquo will be used throughout the IGs as synonyms for the term lsquoprivate agentrsquo in financial analysis
the farmerrsquos living expenses The lack of initial capital
to invest is generally a huge barrier to engaging in
a new activity A financial analysis will determine if
farmersrsquo cash flows are adequate to undertake the
activities (ie it will clearly identify a farmerrsquos financial
needs and hisher repayment capacity)
Even when a financing scheme will prove the
feasibility of the investment there are many risks
involved in changing a farmerrsquos practices (business
as usual) above all if it involves taking out a loan
in an uncertain agricultural environment Thus the
last question to be answered is would the farmer
take the risk are there enough incentives Risks
faced by farmers are many and extremely difficult
to manage29 The only measure of their willingness
to change habitstechnologies will be by comparing
their returns to the opportunity costs of remaining
in the actual situation If for example the returns to
labour of the new activity prove to be much higher
than the average rural wage it is probable that a
farmer would be willing to invest his time in his own
farm and take the risk
In other words financial analysis will establish
whether farmers will obtain a net incremental benefit
(financial viability and profitability analysis) if theyrsquoll
have enough working capital to buy the additional
farm inputs or to bear the costs of stocking
processed goods (financial sustainability) and finally
if financial incentives are enough to convince them to
change existing practices
The practical way to undertake this analysis is by
developing different beneficiary productive profiles
ndash considering several types of productive activities
lsquofarm-systemsrsquo and lsquoactivity-modelsrsquo ndash as well as how
many and which types of people generally engage in
these activities in this particular area
On the basis of the individual models of financial
analysis ndash and once the three steps in converting
market prices into their economic value have been
29 For example risks in the areas of production prices casualties technology climate ndash to name just a few
19
VOLUME 1 BASIC CONCEPTS AND RATIONALE
completed ndash economic analysis of the project as a
whole can be undertaken30 This is done by means
of the aggregation that in project analysis is the
process of adding together the costs and benefits
of all the entities participating to reach a summary
account from which a measure of project worth can
be derived The result of the aggregation is the net
incremental benefit or cash flow of the project31
Lastly the goal of economic analysis is to answer
the question of whether it is worthwhile to invest
public resources in the overall project proposal
(should the government invest) It will focus on the
perspective of the entire country and it measures the
effects of the project on the economy as a whole
Unquantified benefits alternative methodologies to CBAThe majority of IFADrsquos projects are production-
oriented interventions in which expected outcomes
are tangible and easily quantifiable however due to
IFADrsquos typical target group many of these projects
are complemented by activities seeking an impact
on less-tangible aspects of rural poverty alleviation
Womenrsquos empowerment increased access to assets
and services enhanced capacities ownership and
land titling are examples of this important part of
IFADrsquos overall project impact However these types
of benefits which are more difficult to measure or not
measurable in monetary terms (intangible benefits)
are often excluded from CBA
In addition environmental and social benefits
resulting from the promotion of resilient agricultural
practices or social infrastructure such as rural roads
irrigation schemes or market infrastructure are also
seldom included in CBA In order to change this
trend these IGs will provide some ideas on how to
allocate value through the use of valid proxies to
measure the impact of these intangible social andor
environmental benefits
30 Some analysts proceed by aggregating the financial analysis and then converting the aggregated results into their economic value It can be argued that this stage of analysis is useless as the financial profitability indicators for the project as a whole have no use in terms of investment decisions
31 See volume 2 and its annex for more details on the lsquoaggregation issuersquo and common mistakes
In the particular case of CDD projects where
communities collectively decide on the allocation
of project resources it is very difficult to foresee
which productive activities will be targeted However
markets and agronomic conditions in the project
area will limit the scope of activities that can be
successfully undertaken In these cases the fact
that communities are making participatory decisions
will grant the additional benefits that ownership
provides ensuring higher adoption rates than
average and increasing the sustainability of the
chosen interventions
In cases where the identification and valuation
of benefits is difficult simple and sensible ways
of estimating tangible benefits should be applied
Table 2 presents an overview of suggested
approaches to transforming such benefits into
tangible values so as to include them in overall
project cash-flow analysis from the most common
complementary activities in IFADrsquos projects
Additionally the IGs will introduce two methods
alternative to CBA for those cases where not even
proxies could be measured cost-effectiveness
and MCA32 The latter has not yet been tested
as a suitable tool in IFAD project designs but is
suggested as an alternative in cases of complex
decision-making
Cost-effectiveness
When tangible benefits from a given investment
are difficult to quantify but the costs are easily
identifiable the most commonly used valuation
method is cost-effectiveness which is used to select
the least-costly alternative among a set of options
that will achieve the same result (a given set of
predetermined objectives) Once the purpose of the
project has been decided for example construction
of a market storage facility cost-effectiveness would
be used to compare scale location technology
etc in order to choose between investment
32 See the technical annex for more details
20
VOLUME 1 BASIC CONCEPTS AND RATIONALE
Project componentsactivity Quantifiable benefits
Productivity enhancement (including irrigation post-harvest and processing) Storage drying cooling facilities irrigation
bull Reduced post-harvest losses
bull Increased value and volumes of production due to investments in storage cooling or small processing facilities (drying or milling)
bull Increased production and productivity due to water provision
Value chain (VC) Collective marketing warehouse receipt systems increased market information
bull Increased value of final product owing to increased quality and access to markets improved handling packaging and commercialization
bull Financial benefits to all actors along the VC
bull Microenterprise and employment creation
bull Creation of internal and external markets that did not exist before investments
Rural roads bull Reduced transport and vehicle maintenance costs (incl vehicle operating costs [VOC] and travel-time costs [TTC])
bull Access to areas not accessible before hence increased total production
bull Increased volume of transported agricultural products for sale (reduced losses)
bull Reduced transport costs due to better access to sales points
Domestic water supply bull Time saved in procuring water
bull Reduced sickness through better water quality
bull Reduced water losses due to leakage
bull Increased productivity through small-plot crop irrigation and through provision of water for livestock
bull Introduction of backyard gardening
Climate adaptation and resilience practices Changes in tillage practices crop rotations landsoil conversion afforestation energy-efficient systems flood prevention
bull Reduced land erosion an estimate of saved nutrient content can be valued at price of fertilizer needed to replace that nutrient content
bull Increased crop timber and livestock yields through soil preservation conservation tillage and agriculture
bull Increased final product value due to labelling as organic agricultural practices
bull Avoided rehabilitation costs for public infrastructure destroyed by natural disasters
bull Energy savings owing to replacement of old practices by eco-friendly artefacts (eco-stoves solar panels etc)
Land registration Land tenure security may translate into increased land value explained by
bull Long-term Investments in land fertility
bull Improved access to credit as land can be used as collateral
bull Greater dynamism of land markets
bull Environmental benefits as a result of better NRM (people improve or maintain forest andor tree cover)
TA BLE 2
Simple sensible ways of valuing different types of benefits
21
VOLUME 1 BASIC CONCEPTS AND RATIONALE
options (eg open storage location of a facility
construction materials) Unfortunately the results of
this method which can justify project investment
decisions cannot be integrated into the streams of
incremental net benefits resulting from classic CBA
thus underestimating the overall benefits of
the investment
Multicriteria analysis
MCA is a decision-making tool for evaluating
complex decision problems where the options
entail many different objectives Unlike CBA MCA
allows consideration of aspects other than economic
and financial ones for example both quantitative
and qualitative data It builds trade-offs between
criteria that in complex decision-making are usually
in conflict (efficiency and equity for example) 33
and is an important instrument in ranking different
options and discriminating between acceptable and
unacceptable possibilities
The main advantages of MCA are its openness
explicitness and power to simplify complex
situations This process eases the discussion and
promotes communication first within the decision-
33 Another example would be when production objectives are in contraposition to environmental ones For example to increase livestock production for food security and at the same time reduce CO2 emissions
Project componentsactivity Quantifiable benefits
Rural finance bull Efficiency gains in financial system can lower operational costs and ensure self-sufficiency and sustainability of financial services supply
bull Shifts in portfolio composition of financial service providers (productive loans versus consumption)
bull Incremental taxation revenues to government
bull Potential productivity increases through financing of working capital (incremental benefits to clientsborrowers)
bull Economic benefits of transfer effects
Community development (CD) bull Improvements in lives of beneficiary households (value these in money equivalents if possible)
bull CD activities result in high empowerment and ownership of project activities which could translate into greater sustainability
Indigenous peoplesrsquo (IPs) knowledge
bull When IPs are supported in applying their knowledge ownership of project activities is ensured as well as sustainability of activities This can translate into low implementation risk and high uptake (adoption rates)
bull Generally IP practice are environmentally friendly thus reducing stress on natural resources
bull Nutritional aspects are also part of the positive impacts
Institutional strengthening bull Improved institutional capacity has generated or will generate benefits for target groups
bull Losses avoided by strengthening the institution looking at the sensitivity analysis assess how delays in implementation (due to institutional weak capacities) affect project outcomes and use that data to calculate losses avoided
Source PTA ndash EFA desk elaboration
22
VOLUME 1 BASIC CONCEPTS AND RATIONALE
making body and later between that body and
stakeholders MCA can be an ex ante (lsquobefore the
factrsquo) and an ex post (lsquoafter the factrsquo) evaluation tool
This type of analysis also presents some difficulties
One concerns definition of the comparative criteria
Use of MCA requires knowledge of mathematical
notions data aggregation methodologies and
computer applications to perform analysis following
a structured process and to avoid weak conclusions
It is often costly and time-consuming
EFA data sources collection and coherenceThe value of EFA as a decision tool hinges on the
quality of the data and assumptions that underpin
it Data availability is a widespread problem for
EFA analysts who should always work in close
collaboration with expert colleagues (agronomy
livestock and rural infrastructure experts) who will
provide or validate the key technical parameters of
the analysis34
Data regarding project costs should be collected
during design missions in consultation with the rest
of the team Once the first results from EFA are
reached they should also be shared with the team
to discuss how they affect expected outcomes and
assumptions For example planned investment costs
may not be sufficient to reach the number of target
beneficiaries outcomes of specific components may
not be appealing from a financial point of view etc
Although it is the responsibility of the EFA analyst
to gather and ensure data consistency among
sources the mission leader should promote and
facilitate dialogue among mission members and
provide sufficient time for the analyst to collect and
process data to ensure EFA quality and coherence35
34 Alternatively FAOSTAT is the most reliable and recommended source of data (httpfaostatfaoorg)
35 It is estimated that at least five weeks are needed for elaboration of a complete EFA one week for data gathering two weeks of mission and two weeks for data processing
For the other parameters of EFA analysis such
as conversion factors and discount rates one
of the most important sources of data is always
the national planning offices If these data are not
available evaluations of completed operations by
the Independent Office of Evaluation of IFAD (IOE)
can be used as a reference36 These can provide
reference values for similar projects or projects
in the same country (and region) for example on
uptake (adoption rates) of a specific technology or
constraints on input availability
Moreover economic and financial analysis in
appraisal reports for the same country (andor region
andor sector) ndash from IFAD and other IFIs such as
the World Bank or regional development banks ndash are
potential sources of information on key parameters
such as discount rates37
However any project analyst should rely on his
her best judgment accumulated through experience
when deciding on the assumptions to be used
36 Evaluations by country and region are available at wwwifadorgevaluationpublic_htmleksystdocprjindexhtm
37 FAOrsquos Monitoring and Analysing Food and Agricultural Policies (MAFAP) programme develops estimates for standard conversion factors the social exchange rate (SER) for different countries and currencies and other important parameters for estimating shadow prices such as the transport costs duties and taxes instrumental in calculating parityborder prices for tradable goods (wwwfaoorgmafaphomeen Country reports can be found at wwwfaoorgmafapproductscountry-reports-technical-notesen)
23
SECTION V
To increase the efficient use of EFA it is important to
view this analysis as an integral part of project design
information and not only as a mandatory study done
for compliance with IFAD quality requirements
To do so there should be continuous review and
refinement of EFA at all stages of the project cycle
It is part of the monitoring and evaluation (MampE) and
knowledge management functions to inform decisions
on adjustments to design and implementation
modalities in pursuit of project objectives
As a first step the data used for EFA in
project design should be periodically updated
by the projectrsquos MampE system and supervision
implementation support missions should verify that
this has taken place If significant changes occur in
the data ndash particularly those for which the sensitivity
analysis showed higher sensitivity ndash the IRR NPV
and cost-benefit ratio should be recalculated
In the light of new data (eg prices for inputs
and outputs demand forecast for project outputs
andor adoption rates) ndash and taking into account
the results of updated EFA including identified
risks and suggested mitigation measures ndash it may
become appropriate during project supervision
andor implementation support missions to decide
to reallocate resources among activities andor
components shifting from those that contribute less
according to the new constellation of data to those
that would contribute more to the projectrsquos objectives
Moreover the EFA spreadsheet prepared during
project appraisal should remain available for review
during project implementation and evaluation This
serves as an indicator of compliance with the EFA
requirement for design documents and the new RMF
indicator as stated in the relevance section It would
also facilitate the updating process indicated in the
preceding paragraph
The purpose of EFA in each phase of the project
cycle including evaluation is indicated in the
following table
TA BLE 3
EFA at different stages of project cycle
Project cycle stage Role of EFA Form of analysis
Concept Definition of investment criteria
bull Purely ex ante ndash all benefits and costs are based on estimates of future values
Project design Resource allocation decisions
bull Purely ex ante ndash all benefits and costs are based on estimates of future values
Supervision ndash early stage
Resource reallocation decisions
Newly Identified risks
bull Mainly ex ante ndash some costs may be ex post but most benefits will still be based on future estimates
Midterm review (MTR) bull Mainly ex ante ndash some costs will be ex post but estimation of future benefits will be based on evidence accrued during first half of project
Supervision ndash later stages
bull About 50 ex post50 ex ante ndash costs will be increasingly based on actual results but benefits are generally lagged by several years at least and will continue to accrue over life of investment
Project completion report (PCR)
Assessment of results bull Mainly ex post ndash all costs and some benefits will be based on actual results but benefit stream for residual life of investment will remain an estimate of future values
EFA role throughout IFADrsquos project cycle
24
VOLUME 1 BASIC CONCEPTS AND RATIONALE
Table 3 also describes the form of analysis
undertaken at each stage of the project cycle which
ranges from purely ex ante during project design to
partly ex post initially with regard to costs and later
to benefits and finally purely ex post for investment
costs but only partly ex post for recurrent costs
and benefits In this example a fully ex post analysis
would only be possible after 20 years which lies
more in the realm of policy analysis than project EFA
Given its purpose EFA is currently used mostly
as an ex ante tool to guide project formulation and
justify investment decisions Nevertheless it could
make a bigger contribution to IFADrsquos mandate for
rural poverty reduction if it were used in some of
the following ways
At concept
bull At COSOP38 andor project conception previous
evaluation ex post reports elements from
previous EFAs or speedy financial assessments
of intended investments could serve as
screening criteria for the validation of proposed
investment ideas For example a previous study
on the investment requirements for a specific
irrigation technology may help establish a
minimum area to be covered by projects in order
to produce sufficient benefits to overcome
project investments
At design
bull For component selection ex ante assessment of
component viability during design
bull For cost validation EFA will confirm whether
estimated project investment costs are sufficient
to cover proposed interventions as well as define
beneficiariesrsquo contributions and their financial needs
bull In the logframe EFA can provide realistic and
consistent outcome indicators
bull For risk management EFA will provide grounded
information for the effective design of mitigation
measures applied to changing circumstances in
order to understand and manage risk
38 Country strategic opportunities programme
At implementation
bull To terminate or modify activities that are not
generating satisfactory financial results for the
intended beneficiaries and economic impact for
the country as a whole
bull For MampE Updating EFA to changing
circumstances will provide up-to-date evidence
of realistic outputs outcomes and impacts As
an MampE and knowledge management tool it can
facilitate learning within and between countries
about what works and what doesnrsquot in terms of
financial and economic impact This knowledge
can also be used to guide the design of country
programmes through the COSOP
bull EFA can also be used as a risk management
tool during implementation Where new risks
are identified or design assumptions are found
to be incorrect remedial action may be needed
including reallocation of resources among
components andor expenditure categories
Early in implementation EFA could contribute
to adaptation to changing circumstances such
as commodity prices production technologies
and institutional and policy changes which
may suggest that different or better approaches
be adopted modifying the design andor
implementation arrangements
At evaluation
bull As an ex post impact assessment tool by
incorporating EFA in IOErsquos PCR and country or
project evaluations in order to compare expected
and actual project results
bull To inform decisions on scaling up or replication
of successful initiatives including the scaling
up of grant-funded activities into full-scale
loan-funded projects
bull Ex post EFA assessment may suggest
discontinuation of approaches that are not
working and scaling up of those that are
25
VOLUME 1 BASIC CONCEPTS AND RATIONALE
Goal bull 20 increased average
income in 29000 HH
C1 bull 29000 farmers linked
with VCbull US$64 m in loans
distributed
C2 bull 29500 HH new crops
amp improved yields 15bull 2000 ha irrigatedbull 83 km rural roads
C3 Overall implementation
EFA in project design Links with the logframe and MampEIn addition to a complete EFA assessment IFADrsquos
mandatory design documents require presentation
of a logframe detailed cost tables disaggregated by
component financier and expenditure categories
and formulation of an MampE system
These three elements should be closely linked
The logframe provides a global picture of project
objectives and describes through components the
activities that will be put in place to achieve them
along with measurable indicators to monitor progress
and achievements The cost tables assign a cost
to each of these activities and MampE measures their
impact EFA is the technical vehicle that attaches an
expected benefit or outcome to the costs of each
envisaged activity It defines the causal chain of
effects between a projectrsquos inputs and outcomes
In other words many of the logframe sections
can and should be completed with information
coming from EFA These indicators should also be
used as part of the MampE system in order to maintain
coherence between planned interventions and
expected outcomes from the very beginning
In order to illustrate this causal chain a clarifying
example is provided in Figure 5 to explain how through
EFA certain inputs will be transformed into outcomes as
a result of the project The example has been extracted
from an ongoing IFAD project with a total project cost
of US$119 million to finance three main components
C1 value-chain market linkages development C2
improved agricultural practices and infrastructure
and C3 the project management unit (PMU)
As shown in Figure 5 uptake indicators
(ie number of expected beneficiaries) and overall
project impact of 20 increased incomes in
29000 HH have been directly estimated through
EFA (shown by the visible arrow) The same has
been done for expected outcomes from productive
interventions ndash such as improved crops and cropping
techniques complemented by irrigation infrastructure
under C2 ndash that will result in an average increase
in yields of 15 per cent However there are some
project activities for which it is more difficult to
F IGUR E 5
Practical example of linking EFA with the logframe costs and MampE With what For what
Objective Increase sustainable HH income
C1 Promote VCbull Capacity-building for
farmersrsquo groupsbull Link with farmers
and investment fund
C2 Support farmersbull Improved crop varieties
and TAbull Irrigation and road
infrastructure
C3 PMU
Total costs bull US$11946 m
Costpers US$740
C1 US$1875 mbull Capacity-building
US$3Mbull Link US$063 mbull Investment fund US$1512 m
C2 US$787 mbull Better crops US$643 mbull TA US$5 mbull Infrastructure
US$94 m
C3 US$105 m
LogframeImpact (MampE)
Projectcosts
Logframe Projectcosts
Impact (MampE)
EFA defines the causal chain
EFA can translate project inputs into results
26
VOLUME 1 BASIC CONCEPTS AND RATIONALE
measure impact (represented by the fading arrow)
In the example the development of stronger links
between farmers and agribusiness and improved
market access through construction of rural roads
will certainly have an impact on beneficiary access
to markets but this is not easily quantified by
measuring the number of meetings held by these
groups It would be better reflected in increases in
volumes sold and the prices received by farmers
Moreover indirect benefits from project activities
should also account for other rural people that will
benefit from the roads and are also not included in
the analysis Finally several project costs will not
produce any direct benefits but the activities they
fund are fundamental in the delivery of the overall
project For example all costs regarding the PMU
as well as awareness-raising campaigns and other
types of lsquosoftrsquo interventions
In summary the logframe provides a structure
that can help organize the data and assumptions
used in EFA elaboration Key data for estimating
costs and benefits and assumptions made
concerning incremental yields adoption rates etc
should be incorporated into the logframe and used
as indicators in the MampE system
While useful EFA cannot provide all relevant
indicators required in the logframe For example
third-level indicators (eg on reduced stunting or
increased HH assets) in IFADrsquos Results and Impact
Management System (RIMS) will still need to be
collected through baseline surveys in the early phase
of implementation
Finally it is important to distinguish output from
outcome indicators in the logframe39 During the
initial years of a project supervision should focus
on the output indicators As project implementation
proceeds the focus should shift to (or at least
include) outcome indicators which provide key data
to compare with the initial EFA assessment
39 A good practice example of a logframe distinguishing between output and outcome indicators is the Project for Agricultural Development and Economic Empowerment in Cambodia (EB 2012105R15Rev1 wwwifadorggbdocseb105eindexhtm) It should be noted that Annual Reports on Quality Assurance in IFADrsquos Projects and Programmes (eg document EB 200998R57) have called attention to imprecise development objectives and lack of quantified final and intermediate outcome indicators to track progress towards achieving objectives This deficiency also affects the quality of EFA and the possibility of using it during project supervision and implementation support Thus improved quality of the logframe can contribute to improving the quality of EFA and to enhancing its use during this phase
EFA in project design Risk analysisEconomic analysis of projects is by definition
built on uncertain future events Estimation of the
basic elements of this analysis (costs and profits)
inevitably involves explicit or implicit probability
judgments In order to contain and measure
the impact of these uncertainties on project
results there are some techniques that help
detect the lsquocritical variablesrsquo or sources of major
risks and set the basis for introducing effective
mitigating measures
The most common tools used in EFA are the
sensitivity analysis (SA) and the switching value (SV)
analysis40 Both enable testing and measurement
of the effect of changes in key project variables on
the final outcomes of our project and hence its
economic indicators (NPV and IRR) Although SA is
frequently used to assess the robustness of projects
and their resilience to shocks its outcomes are
seldom linked to risk analysis
In other words the most relevant question at
this stage is to know how fluctuation in critical
parameters (eg increases in costs delays in
implementation) will affect project performance and
which of the identified risks are the ones that need
close monitoring
Considering the effects of risks and mitigation
measures identified at the project design stage on
EFA results would not only represent a more realistic
approach to assessing the projectrsquos profitability but
would also help identify the nature of those risks
ndash acknowledged but not mitigated by the project ndash
whose existence is regarded as acceptable
In practical terms the SA tests percentage
increases and decreases in estimated benefits and
costs to assess their impact on NPV and IRR while
the SV provides the percentage change in cost
or benefits that will cause project outcomes to fall
below the minimum level of acceptability (NPV lt 0)
40 In volume 2 the IGs also provide information on more sophisticated tools using probabilistic approaches such as Crystal Ball and Risk
27
VOLUME 1 BASIC CONCEPTS AND RATIONALE
Both analyses are extremely useful if linked to
identified project risks For example SV can identify
benchmarks (maximum percentage increases in costs
or decreases in benefits) for lsquotrigger valuesrsquo to activate
specific mitigation measures (eg if the internal price
of a specific input increases to 30 per cent activities
should shift to an alternative crop)
Another way of looking at this analysis is
through the graphic in Figure 6 Here variations
in expected benefits and costs are represented
in the vertical and horizontal axes respectively
Calculation of the switching values of our project
identifies the maximum reduction in benefits (Bmin)
and the maximum increase in costs (Cmax) that
would result in an NPV of zero Thus the switching
value frontier (SVF) represented by the black line
between Bmin and Cmax encloses all possible
combinations of reduction in benefits and increase
in costs that would bring the NPV to zero Implicitly
the area (O Bmin Cmax) represents the set of all the
different combinations of decrease in benefits and
simultaneously increase in costs that would not
endanger project viability
Once the SVF has been identified and after a
proper evaluation of the country context and project
risks and mitigation measures we could eventually
assume that benefits and costs are very unlikely to
attain the levels represented by the two dotted lines
(B0 C0) As a result we narrow down our uncertainty
area defining a lsquosafe zonersquo identified by the blue area
(A) and a lsquorisky zonersquo identified by the orange area
(R) Area A represents the set of combinations that
falls into the viable cases where increases in costs
or decreases in benefits are not jeopardizing the
overall outcome of the project Area R represents all
the diverse combinations of costs and benefits that
will render the project unprofitable (NPV lt 0)
An analysis including probabilistic approaches
could provide a better understanding of the likelihood
that the project would fall into one of the two areas
and thus assess how much at risk it would be if
certain events occurred Details of these types of
analysis can be found in volume 2
Use of SA to assess project risks an example
SA provides grounded information to the design
team to develop effective mitigation measures for
each identified potential risk The first step then
is to add a proxy to the classic table or section on
project risk of the project design report (PDR) ndash a
proxy that responds to the question How will this
risk affect project performance For example if
F IGUR E 6
Identification of the risk zone
0
A
R
Switching value frontier(NPV=0)
Cmax + Costs
- Benefits
B0
Bmin
Cmax
28
VOLUME 1 BASIC CONCEPTS AND RATIONALE
local implementation capacities are low SA can
test how a delay in implementation of one or more
years (a realistic possibility of this risk occurring) will
affect project outcomes Similarly if there is a high
probability of the introduction of import taxes this
can be tested by increasing input costs
The next step is to closely observe the SA results
in order to assess to what extent these events
will change the profitability indicators (ie project
performance) By answering the question Which
variables need to be closely monitored the project
team can easily identify the lsquocritical risksrsquo and better
allocate resources for their mitigation
In the example below (Table 4 and Table 5)
SA shows that this project is more sensitive to
decreases and delays in benefits than to cost
increases Thus although there is a high risk of the
introduction of import taxes on fertilizer this will not
drastically affect project performance On the other
side delays in implementation are a high risk that
could compromise overall project outcomes Project
teams should allocate more efforts and resources to
mitigate this risk rather than others
To summarize EFA analytical tools can contribute
to risk assessment and informed decision-making
for the efficient allocation of project resources when
designing mitigation measures
TA BLE 4
Risk analysis and mitigation measures (classic table prepared for the PDR)
Risk description Probability of occurrence
Mitigation measure Proxy to compare with SA results
Institutional risksLow local implementation capacity
High Capacity-building Delays in benefits
Market risks Import duties on fertilizer High Local production Increased costs
Climate risks Floods Low Infrastructure Reduced benefits
TA BLE 5
Sensitivity analysis for informed decision-making
SA Base case
( 12)
Costs increased Decrease in benefits Delay of benefits
+10 +20 +50 -10 -20 -50 1 year 2 years
IRR 28 27 25 21 22 20 18 23 19
NPV (lsquo000 US$)
37 160 8 068 6 895 3 376 4 047 2 949 1 564 5 173 1 984
29
VOLUME 1 BASIC CONCEPTS AND RATIONALE
EFA in project supervision implementation and ex post evaluationThe underlying principles for the use of EFA in project
implementation are no different from those for project
design and are detailed in a number of old and
well-known sources Squire and van der Tak (1975)
Gittinger (1985) Belli et al (1998) and IFADrsquos draft EFA
guidelines of September 2012 However although the
principles are the same the methods of application
differ to some extent as shown in Table 6
The approach to EFA both before and during
project implementation should be tailored to
the nature of the project What to look for in the
field and the type of analysis undertaken vary
considerably among different project categories
More detailed information is provided in Table 7 in
the technical annex
Ex ante and ex post EFA
It is important to distinguish between ex ante and ex
post EFA and to appreciate their roles in the various
stages of the project cycle Ex ante is the more
familiar form of EFA Undertaken as a key part of the
project design process it is used to inform decision-
making on the nature of the project and its expected
financial and economic impacts Ex post EFA is
undertaken after an investment project has been
completed There are also intermediate forms of
analysis undertaken during project implementation
which are partly ex post and partly ex ante
It is important to distinguish between the
implementation period and the life of the investment
The implementation period typically five to seven
years is the period in which project activities are
undertaken and IFAD funds disbursed The life of
the investment is much longer typically 20 years
or more during which economic and financial
benefits are expected to accrue Figure 7 shows
a typical IFAD project profile with the investment
costs incurred during years 1-5 recurrent costs
over the 20-year project life and benefits beginning
to flow in year 3 and reaching a plateau from
year 10 onwards
TA BLE 6
Application of general principles of EFA
Key principle Methods of application
Ex ante EFA Implementation
With and without project comparison
Prepare lsquobusiness as usualrsquo scenario on the basis of lsquodo nothingrsquo option
bull Conduct baseline survey to define pre-project status
bull Estimate what would have happened without the project
bull Paired comparisons can help (eg inoutside project area)
Financial analysis Construct farm models showing expected revenue and expenditure for beneficiaries
bull Survey beneficiaries to estimate actual revenue and expenditure
bull Validate andor adjust farm models accordingly
Discounting future benefits and costs
Discount future costs and benefits back to year zero
bull Discount future and previous benefits and costs back to year zero
Accounting for externalities
Identify and quantify all externalities where possible
bull Check for signs of positive and negative externalities emerging during implementation
Adjusting for distortions Deduct taxes add subsidies use shadow prices estimate conversion factors
bull Check for changes in tax and subsidy rates and adjust prices accordingly
bull Update conversion factors on the basis of trade andor tariff data
30
VOLUME 1 BASIC CONCEPTS AND RATIONALE
Methodological issues of ex post and
ex ante analysis
The key aspect to understand when performing
this analysis is that as shown in Figure 7 project
costs and benefits will occur in different moments of
project life
Methodologically speaking if this analysis will
be used for comparison of appraised (ex ante) and
real impacts (ex post) (as is generally the goal) we
need to lsquoplacersquo the comparison in the same point in
time The point in time could be at the beginning or
completion of the project or any other point What
is important is to bring all cash flows to that point in
time using discount techniques Then calculate the
NPVs and compare You will be able to use IRRs only
if the cash flow allows it mathematically (ie if there is
a negative Figure in the first year)
But this is not the only consideration to bear in
mind Other issues arise such as
bull Attribution effects of achieved results given
IFADrsquos scale of intervention it could claim
contribution but not full attribution of increased
beneficiary incomes or decline in food insecurity
bull At completion could be too early to capture all
expected benefits (see Figure 7)
bull A mixed approach in order to compensate for
this second issue is to try to estimate benefits
yet to be produced include them in cash flows
and then perform the discounting (however the
results could be questioned)
bull In order to make a realistic comparison CBA
should be done 10 years after implementation
and this has rarely been done
On a more positive note the alternative would be
to choose some activityfarm models effectively
put in place by the project Perform a financial
analysis at completion and compare it with appraisal
estimations (models developed at design for the
WOP situation) in order to estimate how things
have changed This analysis will not be based on
cash flows but on annual bases thus comparing
F IGUR E 7
Profile of costs and benefits over the project cycle
0
20
40
60
80
100
120
Investment costs
Recurrent costs
Benefits
MTR
Supervision EvaluationDesign
PCR
1Years
2 3 4 5 6 7 8 9 10 11 12 13 14 15 16 17 18 19 20
Implementation period years 1-5
Life of the investment years 1-20
31
VOLUME 1 BASIC CONCEPTS AND RATIONALE
annual financial indicators such as total sales total
production costs employment created Hopefully
full development of the model would have been
achieved by completion so as to provide information
on how adequate project interventions had been
This could also potentially provide information on the
reasons underpinning adoption rates
Ex post EFA and scaling upConfronted with the large-scale problem of reducing
rural poverty which it is mandated to address
and the limited resources available from official
development assistance (ODA) IFAD is compelled
to increase the impact of every dollar it invests in
agriculture and rural development For this reason
scaling up the results of successful development
initiatives is an overarching priority that directly
supports the achievement of IFADrsquos mandate To
deliver on this priority IFADrsquos operational practices
must be geared towards supporting all concerned
actors and institutions ndash including poor rural women
and men and their organizations ndash in achieving
impact at scale
The formal IFAD definition of lsquoscaling uprsquo is
expanding adapting and supporting successful
policies programmes and knowledge in order to
leverage resources and partners to deliver larger
more sustainable results for a greater number of
poor rural people Scaling up results means that
IFAD interventions will not be viewed as a way of
expanding small projects into larger ones Instead
they will focus on how successful local initiatives
will sustainably leverage policy changes additional
resources and learning to bring the results to scale
EFA has an important role to play in informing
scaling-up decisions since evidence of favourable
financial and economic impacts should be a key
criterion for deciding whether or not to scale up
Thus the framing questions must incorporate an
economic and financial dimension as follows
bull Idea If a project is referred to as one that is
being scaled up or otherwise further developed
from previous interventions in the host country
or region what were the economic and financial
outcomes of the activity to be scaled up Have
economic and financial impacts been estimated
or measured
bull Vision How many poor rural men and women
will benefit financially and to what extent What
will be the overall economic impact
bull Drivers Are the economic and financial benefits
sufficiently attractive to drive the expansion and
sustain the initiative over the long term
bull Spaces Is there sufficient capacity to finance
the proposed expansion Is the local regional or
national economy large enough to accommodate
it Can markets absorb the level of production
envisaged
bull Pathways What are the financial and economic
implications of alternative scaling-up pathways Is
a gradual or a fast-track approach preferred
bull IFADrsquos role How will IFAD ensure that economic
and financial impacts of the expansion are
properly monitored and evaluated
Scaling-up issues often need to be addressed during
COSOP formulation or country portfolio reviews
especially where grant-funded pilot programmes
have been implemented and are being considered
for scaling up into full-scale investment projects In
these cases EFA of pilot programmes during and
after implementation becomes an important part of
the strategic process
32
Formulas for profitability indicatorsThe net present value (NPV) indicator defined as
the sum that results when the expected costs of the
investment are deducted from the discounted value
of the expected benefits (revenues) is calculated
through the following formula
Where
Bt = benefits at time t Ct = costs at time tIt = investment costs n = project economic life
r = interest rate used as indicator of opportunity
cost discount rate
The internal rate of return (IRR) indicator is defined
as the discount rate (r) that produces a zero NPV
This represents the maximum interest rate that a
project could face and still not waste resources
This is called the internal rate of return (IRR) It is
calculated through
IRR = (r NPV = 0)
For the project to be profitable the IRR has to be
greater than the interest rate that could be earned in
alternative investments thus whenever IRR gt r the
project is considered viable If the (alternative) interest
rate (imkt) is lower than the IRR the NPV is positive
and vice versa
The benefitcost ratio (BC) indicator is the ratio of
the present value of benefits to the present value of
costs over the time horizon The BC ratio provides
some advantages when it is necessary to formulate
a lsquorankingrsquo of alternative investment projects under
budget constraints
If BC ge1 the project is accepted
If BC lt1 the project is rejected
Cost-effectivenessWhen tangible benefits from a given investment
are difficult to quantify but the costs are easily
identifiable the most common valuation method
is cost-effectiveness It is used to select the least
costly alternative among a set of options that will
achieve the same result (a given set of predetermined
objectives) Once the purpose of the project has
been decided for example construction of a market
storage facility cost-effectiveness would be used to
compare scale location technology etc to choose
among investment options (eg open storage
location of the facility construction materials)
The methodology consists in first listing and
measuring in monetary terms the costs of the
options available and then comparing them with
the costs occurring in the base scenario (without
the project) Total costs are then discounted at
year 1 and the results compared to identify the
cheapest intervention In other words valuation by
cost-effectiveness consists in comparing on a
present-worth basis all alternatives that can achieve
the same benefit (Gittinger 1985) and selecting the
least costly
IRR NPV 0gt gti mkt
IRR NPV 0lt lti mkt
IRR NPV 0gt gti mkt
IRR NPV 0lt lti mkt
IRR NPV 0gt gti mkt
IRR NPV 0lt lti mkt
IRR NPV 0gt gti mkt
IRR NPV 0lt lti mkt
Technical annex
33
VOLUME 1 BASIC CONCEPTS AND RATIONALE
Unfortunately the results of this method which
can justify project investment decisions cannot be
integrated into the streams of incremental net benefits
resulting from classic CBA ndash thus underestimating
the overall benefits of the investment
Multicriteria analysis41
MCA is a decision-making tool used to evaluate
complex decision problems With this tool it is
possible to identify overall preferences among
alternative options where the options entail many
diverse objectives Unlike CBA MCA allows
consideration of aspects other than economic and
financial ones for example social technological and
environmental issues Its use is particularly relevant
when other single-criterion approaches cannot
provide monetary valuations42
In the same model thanks to these techniques
it is possible to consider quantitative and qualitative
data It builds on trade-offs between criteria that
in complex decision-making are usually in conflict
(efficiency and equity for example) Choices are
classified aggregating various items of information
in a common index of utility value Since policy
decisions may be influenced by both monetary
and non-monetary objectives it offers a technique
capable of ranking diverse outcomes
MCA establishes preferences among options
referring to a set of objectives identified by decision
makers It is an important instrument for ranking
options and discriminating between acceptable and
unacceptable possibilities Decision makers must
define quantifiable criteria to judge how an objective
has been achieved and MCA allows them to
41 MCA has not yet been tested as a suitable tool for IFAD project design but is suggested as an alternative in the extreme cases mentioned above of complex decision-making
42 One example would be when production objectives are in contraposition to environmental ones For example to increase livestock production for food security and at the same time reduce CO2 emissions
aggregate the data on individual criteria in order to
provide indicators of the overall performance of the
options It brings out the points of view of the actors
involved in the judgment and is characterized by the
subjectivity related to the opinions of the decision-
making group43
The main advantages of MCA are its openness
explicitness and its power to simplify complex
situations In fact it splits the components of
intricate situations and organizes them so as to find
a solution step by step and clearly Objectives and
criteria chosen by the decision group can in fact be
analysed and changed if they are not considered
suitable This process eases the discussion and
promotes communication within the decision-making
body first and later between that body and the
stakeholders MCA can be both an ex ante and an ex
post evaluation tool
This type of analysis also presents some
difficulties One concerns the choice of the activities
or variables to be studied and definition of the
comparative criteria These operations are often
very complicated and require much time spent
in discussions and negotiations Use of MCA
requires knowledge of mathematical notions
data aggregation methodologies and computer
applications in order to perform analysis following a
structured process and to avoid weak conclusions
It is often costly and time-consuming
43 Indeed the opinion team establishes objectives and criteria assesses relative importance weights and judges the contribution of every option to each performance criterion MCA can be preceded by strengths weaknesses opportunities and threats (SWOT) analysis for the choice of criteria it can be supported by an expert panel to help the negotiating group develop an assessment of a specific topic or it can be assisted by focus groups questionnaires and case studies to choose criteria and rate them In addition criteria can be evaluated using cost-effectiveness analysis
34
VOLUME 1 BASIC CONCEPTS AND RATIONALE
Types of projects and EFA activitiesAspects to look for in the field and the type of
analysis undertaken vary considerably among project
categories as shown in Table 7
TA BLE 7
Main EFA tasks by type of project
Project category Main EFA tasks during implementation
Productivity enhancement (including irrigation)
bull Estimate number of beneficiaries and technology adoption rates by target group households
bull Monitor productivity changes product quality and prices
bull Estimate gross margins (per unit of land and labour) for project and non-project households
bull Update farm models based on observedactual results revise economic analysis as necessary and consider adjustments to project design to improve results
Rural infrastructure bull Review construction schedule and costs relative to design estimates
bull Estimate utilization rates for new or upgraded infrastructure
bull Assess arrangements for operation and maintenance
bull Estimate benefits derived by target group households (eg reduced costs increased prices improved market access)
bull Update farm models based on observedactual results revise economic analysis as necessary and consider adjustments to project design to improve results
Natural resource management
bull Undertake a comparison of NRM activities with and without project
bull Review with and without project scenarios of agricultural productivity
bull Seek evidence of more sustainable and responsible NRM practices
bull Identify and if possible quantify value of environmental benefits
bull Update farm models based on observedactual results revise economic analysis as necessary and consider adjustments to project design to improve results
Community development bull Determine number of target group beneficiaries participating in community development activities
bull Identify what has changed in the community and individual households as a result of these activities
bull Describe improvements in the lives of beneficiary households and value these in monetary equivalents if possible
bull Revise economic analysis as necessary and consider adjustments to project design to improve results
35
VOLUME 1 BASIC CONCEPTS AND RATIONALE
Project category Main EFA tasks during implementation
Institutional strengthening bull Prepare inventory of actual institutional-strengthening activities undertaken
bull Complete assessment of institutional capacity and projectrsquos impact on it
bull Identify how improved institutional capacity has or will generate benefits for target groups
bull Revise economic analysis as necessary and consider adjustments to project design to improve results
Marketing and value chain development
bull Review value chain analysis undertaken during project preparation to update data on volumes costs prices and value addition
bull Identify ways in which improvements in value chain efficiency have improved or are likely to improve market access and farmgate prices for beneficiaries
bull Estimate financial benefits accruing to target group farmers and other value chain actors
bull Update farm models based on observedactual results revise economic analysis as necessary and consider adjustments to project design to improve results
Rural financial services bull Estimate number of beneficiaries with improved access to financial services types of services offered and acceptance rates
bull Monitor cost of financial services at different levels (cost of loanable funds retail service costs at client level) and compare with project design estimates
bull Assess actual or likely changes in farm and non-farm economic activities arising from improved access to rural financial services
bull Estimate the net financial benefits accruing to target group beneficiaries from these changes
bull Update farm models based on observedactual results revise economic analysis as necessary and consider adjustments to project design to improve results
36
Anandajayasekeram P CJ Van Rooyen F Liebenberg 2004 Agricultural project planning and analysis A sourcebook Second Edition Network Activity Program ndash Institutional University Cooperation (IUC) between the Flemish Universities of Belgium and University of Pretoria
Asian Development Bank 2013 Cost-benefit analysis for development A practical guide Manila httpwwwadborgdocumentscost-benefit-analysis-development-practical-guide
Australian Department of Infrastructure and Planning Queensland Government 2012 Project assurance framework ndash Cost benefit analysis guidelines Brisbane Queensland Australia
Belli P J Anderson H Barnum J Dixon and J-P Tan 1998 Handbook on economic analysis of investment operations Washington DC Operational Core Services Network Learning and Leadership Center World Bank httpsiteresourcesworldbankorgINTCDDResourcesHandbookEApdf
Belli P 2001 Economic analysis of investment operations Analytical tools and practical operations Washington DC World Bank
Campell H R Brown 2003 Benefit cost analysis financial and economic appraisal using spreadsheet Cambridge University Press
CIFOR 1999 Guidelines for applying multi-criteria analysis to the assessment of criteria and indicators Bogor Indonesia Center for International Forestry Research wwwcifororgacmmethodstoolbox9html
Department for Communities and Local Government 2009 Multi-criteria analysis A manual London httpeprintslseacuk127611Multi-criteria_Analysispdf
DFID 2011 Guidance for country offices on measuring and maximising value for money in cash transfer programmes London Department for International Development (UK)
European Commission 2008 Guide to cost-benefit analysis of investment projects Brussels httpeceuropaeuregional_policysourcesdocgenerguidescostguide2008_enpdf
FAO 1979 Economic analysis of forestry projects Case studies FAO Forestry Paper No 17 Supp 1 Rome Food and Agriculture Organization of the United Nations
FAO 1995 Guidelines for the design of agricultural investment projects Investment Centre Technical Paper No 7 Rome Food and Agriculture Organization of the United Nations
FAO 2010 Estimating mitigation potential of agricultural projects An application of the EX-ante carbon balance tool (EX-ACT) in Brazil Rome Food and Agriculture Organization of the United Nations
Gittinger J Price 1985 Economic analysis of agricultural projects Washington DC Economic Development Institute World Bank httpdocumentsworldbankorgcurateden198501437966economic-analysis-agricultural-projects
Government of South Africa 2004 Cost-benefit analysis Pretoria Department of Environmental Affairs and Tourism
IFAD 2012 Review of post-harvest systems in IFAD programmes Rome
Jenkins G C Kuo A Harberger 2011 Cost-benefit analysis for investment decisions httpwwwqueensjdiexecorgpublicationsqed_dp_206pdf
Lewis DL 1999 Road user and mitigation costs in highway pavement projects Washington DC Transportation Research Board National Research Council
Mishan EJ 1971 Cost-benefit analysis London George Allen and Unwin
Potts D 2002 Project planning and analysis for development httpswwwriennercomtitleProject_Planning_and_Analysis_for_Development
Raswant V and E Heinemann 2012 Access to markets Making value chains work for poor rural people Rome IFAD
Squire L and HG van der Tak 1975 Economic analysis of projects Baltimore MD USA Johns Hopkins University Press
References
37
VOLUME 1 BASIC CONCEPTS AND RATIONALE
Treasury Board of Canada 2007 Canadian cost-benefit analysis guide Ottawa Secretariat Treasury Board of Canada analys-engpdf
UNIDO 1972 reprinted 1993 Guidelines for project evaluation Order No IDSERH2 Vienna United Nations Industrial Development Organization
UNIDO 1986 Manual for evaluation of industrial projects Vienna United Nations Industrial Development Organization wwwunidoorgfileadminuser_mediaPublicationsdownloadManual_for_Evaluation_of_Industrial_Projectspdf
USAIDINDIA 2000 REFORM Project compendium with practitionersrsquo guide State fiscal management reform Vol V Project appraisal practitionersrsquo guide New Delhi US Agency for International DevelopmentIndia httppdfusaidgovpdf_docsPNADM777pdf
World Bank 2013 Investment Project Financing Economic Analysis Guidance Note httpsiteresourcesworldbankorgPROJECTSResources40940-1365611011935Guidance_Note_Economic_Analysispdf
World Bank 2012 A guide to assessing needs Essential tools for collecting information making decisions and achieving development results by Watkins R Meiers M amp Visser Y httpsopenknowledgeworldbankorgbitstreamhandle109862231663920PUB0EPI00essing09780821388686pdfsequence=1
38
Glossary
Aggregation 15 16 20 in project analysis the process of adding together the costs and benefits of all the entities participating in a project to reach a summary account from which a measure of project worth can be derived Often the result of the aggregation is the Incremental Net Benefit or Cash Flow of a project
Appraisal 7 24 31 A before the fact (ex- ante) evaluation of a proposed investment project to determine its merit and acceptability in accordance with established decision-making criteria
Benefitcost ratio (BC ratio) 13 33 a discounted measure of project worth The ratio of benefits to costs It should be calculated using the present values of each discounted at an appropriate discount rate Most often the opportunity cost of capital The ratio should be at least 1 for the project to be acceptable It may give incorrect ranking among independent projects and cannot be used for choosing among mutually exclusive alternatives
Border price 23 The border price is the unit price of a traded good at the countryrsquos border For exports it is the FOB (free on board) price and for imports it is the CIF (cost insurance and freight) price
Business as Usual (BAU) 8 9 11 14 19 a reference scenario which assumes that future evolution is an extension of the current trends See also lsquodo nothing scenariorsquo
Cash flow 11 12 16 19 20 31 The funds generated or used by the project Reflects the costs and benefits over time from a stated point of view Incomebenefit is a positive cash flow and expensescosts are negative flows
Constant price A price that has been deflated to real terms by an appropriate price index They should be distinguished from current or nominal prices Often used as synonym of real prices
Contingent valuation A method of inferring the value of benefits and costs in the absence of a market What people would be willing to pay to gain a benefit (or willing to accept in recompense for a loss) if a market existed for the good
Conversion factor 5 16 23 30 the factor that converts the domestic market price to an economic price Conversion factors are the ratios of economic to financial prices Thus a conversion factor is a number that is used to convert the domestic market price of an item into its economic opportunity cost to the
economy by multiplying the market price of the item by the conversion factor
Cost An expense related to purchase of inputs including capital equipment buildings materials labour and public utilities Costs such as environmental damage or injuries to health are sometimes referred to as negative externalities
Cost Benefit Analysis (CBA) 7 8 18 31 conceptual framework applied to any systematic quantitative appraisal of a public or private project to determine whether or to what extent that project is worthwhile from a social perspective Cost-benefit analysis differs from a straightforward financial appraisal in that it considers all gains (benefits) and losses (costs) to social agents CBA usually implies the use of economicsocial prices
Cost effectiveness analysis (CEA) 20 33 an appraisal technique used in projects and programs in which benefits cannot be reasonably measured in money terms Cost-effectiveness analysis is used in one of two forms to select least-cost alternatives either holding constant the level of benefits and varying the level of costs or holding constant the level of cost and varying the level of benefits In either form the ratio of cost to benefits is known as the cost-effectiveness ratio
Current prices (Nominal prices) prices as actually observed at a given time They refer to prices that include the effects of general inflation and should be contrasted with constant prices
Cut-off rate the rate below which a project is considered unacceptable It is often taken to be the opportunity cost of capital The cut-off rate would be the minimum acceptable internal rate of return for a project or the discount rate used to calculate the net present value the net-benefit investment ratio or the benefit-cost ratio
Depreciation 14 Not a term used in cost-benefit analysis In other financial frameworks depreciation is the allocation of the cost of an asset over time Depreciation is a method of allocating the cost of a tangible asset over its useful life For accounting purposes depreciation indicates how much of an assetrsquos value has been used up For intangible assets amortization is the correct term However these are accounting concepts that makes no sense in financial analysis Here the full investment costs will be computed every time the asset needs replacement
39
VOLUME 1 BASIC CONCEPTS AND RATIONALE
Direct transfer payment 15-17 Transfer payments are transfers of money among residents of a country without a corresponding exchange of goods and services Taxes are transfer payments from individuals to the government Subsidies are transfer payments from the government to individuals Gifts are transfers ldquoin kindrdquo from one individual to another Because transfer payments are not made in return for goods and services they do not add to total output When transfer payments occur in the context of projects they redistribute project costs or benefits from the project entity to some other group or individual in the country
Discount rate 12 14 16 23 the interest rate at which future values are discounted to the present It usually represents the cost of capital for the person or entity calculating the net present value of the stream The financial discount rate and economic or social discount rate may differ in the same way that market prices may differ from economic prices The selection of the discount rate in financial analysis is a relative straightforward process and that is calculated as the potential gains of alternative safe investments on the market In economic analysis where project viewpoint is overturned toward the socio-economic context this parameter needs to be estimated properly so as to i) reflect the public nature of the investment ii) account for scarcity of resources and iii) ensure good use of public funds (See also social discount rate)
Discounted cash flow 14 The costs and benefits (cash flows) discounted to present values to give a common basis for comparison
Discounting 12 31 The process of adjusting future values to an equivalent present value at a stated point in time by a discount rate
Distortion 16 30 A difference between market prices and true values (economic prices) A distortion is any interference with market forces that renders the resulting quantity produced and price different from the price and quantity that would result under conditions of perfect competition
Distributional effect A change in the income or wealth of the people from whose point of view the benefit-cost analysis is done
Do nothing scenario the baseline scenario lsquobusiness as usualrsquo against which the additional benefits and costs of the lsquowith project scenariorsquo can be measured (often a synonym for the lsquowithout projectrsquo scenario)
Economic analysis 7 14-17 20 30 analysis that is undertaken using economic values reflecting the values that society would be willing to pay for a good or service In general economic analysis values all items at their value in use or their opportunity cost to
society (often a border price for tradable items) It has the same meaning as social cost-benefit analysis
Economic cost The economic cost of an activity or resource is the cost to society of that activity or resource Economic costs include the private costs borne directly by economic agents undertaking the activity and all other costs borne by other economic agents For example the economic costs of driving automobiles include the private costs of petrol plus the additional costs of congestion borne by other users of the roads plus the costs of pollution borne by society in general
Economic impact analysis the analysis of the total effects on the level of economic activity (output income employment) associated with the intervention This kind of analysis focuses on macroeconomic indicators and forecasts the influence of the project on these indicators It goes beyond CBA when very large projects are considered in relatively small economies
Economic net present value (ENPV) 16 The net present value of a project calculated using true or economic values Synonymous with social net present value
Economic price 16 Price that reflects the relative value that should be assigned to inputs and outputs if the economy is to produce the maximum value of physical output efficiently There is no consideration of income distribution or other non-efficiency goals in such a price Synonymous with efficiency price and true price
Economic rate of return (ERR) 16 An internal rate of return based on economic prices and social opportunity costs of capital expressing the socio-economic profitability of a project (See internal rate of return)
Environmental impact analysis the statement of the environmental impact of a project that identifies its physical or biological effects on the environment in a broad sense This would include the forecasting of potential pollution emissions loss of visual amenity and so on
Export parity price 23 footnote The export parity price is the FOB price of a good or service valued at point of export net of taxes and subsidies and suitably adjusted for internal transport costs to a location in a country The export parity price is the net-of-taxes-and-subsidies price that exporters would need to receive for a good or service sold in the domestic market in order to make them indifferent between selling in the domestic market or exporting
Externalities 5 15-17 30 A benefit or cost falling on third parties who normally cannot pay or be compensated for it through a market mechanism An external benefit is a positive externality an external
40
VOLUME 1 BASIC CONCEPTS AND RATIONALE
cost is a negative externality A positive externality may reduce the costs of a production process of an unrelated economic agent as when the bees of a bee grower pollinate a neighbourrsquos apple orchard They may also increase the enjoyment of another economic agent as when musicians playing for their own pleasure delight those around them A negative externality increases the production costs or reduces enjoyment for another economic agent Traffic congestion and the numerous forms of environmental pollution such as the pollution created by a manufacturing plant are examples of negative externalities Externalities are not reflected in the financial analysis For economic analysis however it is necessary to take such externalities into account and place a value on them
Ex-ante evaluation 24-25 30 the evaluation carried out in order to take the investment decision It serves to select the best option from the socio economic and financial point of view It provides the necessary base for the monitoring and subsequent evaluations ensuring that wherever possible the objectives are quantified
Ex-post evaluation 24-25 30-32 an evaluation carried out a certain length of time after the conclusion of the initiative It consists of describing the impact achieved by the initiative compared to the overall objectives and project purpose (ex-ante)
Farm gate price The price received by farmers for their products net of transport costs to the market where the products are sold
Feasibility study 9 19 a study of a proposed project to indicate whether the proposal is attractive enough to justify more detailed preparation It contains the detailed technical information necessary for the financial and economic evaluation
Financial analysis 7 14-17 19 30 31 the analysis carried out using market prices and taking a commercial point of view It allows one to 1) verify and guarantee cash balance (verify the financial sustainability) 2) calculate the indices of financial return on the investment project based on the net discounted cash flows
Financial sustainability analysis 14 19 20 analysis carried out in order to verify that financial resources are sufficient to cover all financial outflows year after year for the whole time horizon of the project Financial sustainability is verified if the cumulated net cash flow is never negative during all the years considered
Financial rate of return An internal rate of return based on market prices and opportunity costs of capital(See internal rate of return)
Human capital Human capital is the stock of skills and productive knowledge embodied in people The
purpose of investing in human capital is to improve the productivity of human beings
Impact 25-27 a generic term for describing the changes or the long term effects on society that can be attributed to the project Impacts should be expressed in the units of measurement adopted to deal with the objectives to be addressed by the project
Import parity price 23 footnote The import parity price is the CIF price of a good or service valued in a specific geographical location It includes the CIF price of the good suitably adjusted for transport costs net of taxes and subsidies The import parity price aims to measure the price that producers in the country would receive for a good or service produced in the country for sale in the domestic market under conditions of free trade
Incremental 11-14 19-20 Additional or marginal
Inflation A general increase in market price levels (a fall in the general purchasing power of the currency unit)
Input 26 28 That which is consumed by the project (as opposed to the projectrsquos output) Usually refers to the physical inputs used by the project including materials capital labour and public utilities Inputs like environmental quality foreign exchange and workersrsquo health are usually termed externalities
Internal rate of return (IRR) 12 33 The yield or profitability of a project based on discounted cash-flow analysis The IRR is the discount rate at which a stream of costs and benefits has a net present value of zero It is equivalent to the discount rate r that satisfies the following relationship
IRR NPV 0gt gti mkt
IRR NPV 0lt lti mkt
where Bt is the benefit stream and Ct is the cost stream The internal rate of return is compared with a benchmark in order to evaluate the performance of the proposed project The internal rate of return is then compared with the market rate of interest to determine whether or not a proposed project should be undertaken (See cut-off rate)
Financial Rate of Return is the internal rate of return calculated when all the inputs and outputs are calculated using financial values Economic rate of Return is based on economic opportunity costs
Logframe 10 25-27 is a management tool mainly used for designingand MampE of development projects It consists of four steps (1) establishing objectives (2) establishing cause-and-effect relationships (causal linkages) among activities inputs outputs and objectives (3) identifying assumptions underlying the causal linkages and (4) identifying objectively-verifiable measures for evaluating progress and success
41
VOLUME 1 BASIC CONCEPTS AND RATIONALE
Market price 14-17 (a) The price of a good in the domestic market (see financial prices) as opposed to the economic price shadow price or social price (b) the cost of a good including indirect taxes and subsidies It is the price relevant for financial analysis
Model A representation or simulation of a system or process showing how parameters benefits and costs interact to produce a bottom-line result by which the project can be judged
Monitoring 25-27 the systematic examination of the state of advancement of an activity according to a pre-determined calendar and on the basis of significant and representative indicators
Multi-criteria analysis 22 34 MCA is an evaluation methodology that considers many objectives by the attribution of a weight to each measurable objective In contrast to CBA that focuses on a unique criterion (the maximisation of social welfare) Multi Criteria Analysis is a tool for dealing with a set of different objectives that cannot be aggregated through shadow prices and welfare weights as in standard CBA
Mutually exclusive 8 12 13 Alternatives that cannot be undertaken simultaneously if one alternative is carried out the other cannot be The alternatives may be mutually exclusive because they represent alternative times of beginning the same project because funds are limited or because if one is carried out the other will not be required (for example a choice between a thermal and a hydro power station)
Net present value (NPV) 12 13 27-29 33 The net value of an investment when all costs and benefits expressed in standard units of value (numeraires) are summed up The sum that results when the discounted value of the expected costs of an investment are deducted from the discounted value of the expected revenues The net present value of a stream of costs and benefits is a number that results from discounting the values of the stream at a given discount rate It is equivalent to the number that results from the following expression
IRR NPV 0gt gti mkt
IRR NPV 0lt lti mkt
whereBt = benefits at time t Ct = costs at time tIt = investment costs n = project economic lifer = discount rate
Net revenues the amount remaining after all outflows have been subtracted from all inflows Discounting the incremental net revenues before financing gives a measure of the project worth of all resources engaged discounting the incremental net revenues after financing gives a measure of the project worth of the entityrsquos own resources or equity
Nominal prices Prices prevailing in a particular year Synonymous with budget-year dollars
Non-tradable good 16 23 footnote good or service that by its very nature cannot be exported or imported Land and buildings are examples of a non-tradable good
Non-traded good 16 23 footnote A non-traded good or service is one that is neither exported nor imported in a particular country for a variety of reasons including quotas and prohibitions Common examples of non-traded items are certain drugs haircuts etc In project analysis non-traded refers to goods and services not traded by the country in which the project is located
Numeraire a standard unit of value Money is a numeraire by which the values of different commodities can be compared In cost-benefit analysis the numeraire is the common denominator for measuring benefits and costs Widely used numeraires are the willingness to pay or aggregate consumption numeraire and the foreign exchange numeraire
Operational and maintenance costs 21 35 The recurring costs for operating and maintaining the value of physical assets
Opportunity cost 12 16 19 The best alternative return foregone elsewhere by committing assets to the project The value of something foregone For example the direct opportunity cost of a person-day of labour is what the person would otherwise have produced or being paid for that day of work The value of a resource in its best alternative use For the financial analysis the opportunity cost of a purchased input is always its market price In economic analysis the opportunity cost of a purchased input is its marginal social value in its best non-project alternative use
Output 27 That which is produced Usually refers to the physical product of the project Other effects of the project such as housing for workers employment training of labour and foreign-exchange savings are usually called externalities
Payback period The time required for the cumulative present value of benefits to become equal to the cumulative present value of costs
Programme 8 is a portfolio of multiple projects that are managed and coordinated as one unit with the objective of achieving common (often intangible) outcomes and benefits at sector country or even multi-country level
Project 8 is a temporary entity established to deliver specific (often tangible) outputs in line with predefined time cost and quality constraints A project should always be defined executed and evaluated relative to an approved business plan which balances its costs benefits and risks
42
VOLUME 1 BASIC CONCEPTS AND RATIONALE
Project analysis 8 20 the analytical framework for the evaluation of a projectrsquos feasibility and performance It includes the analysis of the context the objectives technical aspects demand forecasts and financial and economic costs and benefits Project analysis is needed to determine if given the alternatives a proposed project will sufficiently advance the objectives of the entity from whose standpoint the analysis is being undertaken to justify the project
Project cycle 24-25 30-31 a sequence of the series of necessary and pre-defined activities carried out for each project Typically it is separated into the following phases conceptualization inception formulation appraisal ex-ante evaluation financing implementation and ex-post evaluation
Real prices calculated by adjusting market prices by an appropriate price index to eliminate the effects of inflation Prices of goods and services change over time either because the general price level rises that is because of inflation or because the underlying conditions of supply and demand change Real prices refer to prices of goods and services that reflect changes in the underlying conditions of supply and demand but that do not reflect the effects of inflation The terms real prices and constant prices are used interchangeably but referring to real prices as constant prices is misleading Real prices do not necessarily remain constant over time as they change in response to changes in supply and demand Real prices should be distinguished from current prices which reflect inflation as well as changes in supply and demand
Relative prices the exchange value of two goods given by the ratio between the quantity exchanged and their nominal prices
Risk 10 25-27 The degree to which outcomes are uncertain The extent of possible variation in the outcome
Risk analysis 10 25-27 Risk analysis is a technique for assessing the expected net present value of a project in relation with project risks By taking into account the probability distribution of critical variables and the correlations among them it enables analysts not only to assess the expected net present value of a project but also its associated probability distribution In cost-benefit analysis it recognizes the simultaneous variation of the values of several inputs according to specified ranges and probabilities and analyses the resulting variability in the bottom line
Scale 31-33 The size of a project
Scenario 11 14 30 An outline or portrait of a possible future usually portrays unfolding events rather than being static in time
Sensitivity analysis 16 27-29 Sensitivity analysis is an analytical technique to test systematically the
effects on a projectrsquos outcome of changes in its basic assumptions Sensitivity analysis is carried out by varying one element or a combination of elements and determining the effect of that change on projectrsquos profitability indicators (NPV and IRR)
Shadow price 16 23 footnote 30 A shadow price of a good or service is the economic opportunity cost to society of that good or service The true or economic value of a good (as opposed to the market price which might be distorted) Synonymous with economic or social price
Social price 16 A price that reflects the true value to the country of inputs and outputs of the project Synonymous with economic price and shadow price
Social discount rate 12 footnote 16 It attempts to reflect the social view on how the future should be valued against the present (See Discount rate)
Socio-economic costs and benefits 13 opportunity costs or benefits for the economy as a whole They may differ from private costs and benefits to the extent that actual prices differ from economic prices
Switching value 27-28 The switching value of a variable is that value that it would have to attain in order for the outcome of the project to fall below the minimum level of acceptability (net present value of the project equal to nil)
Time value of money Time value of money refers to the concept that money received in the present is more valuable than money received in the future It is the concept underlying discounting
Tradable 16 23 footnote Referring to a good that could be traded internationally in the absence of restrictive trade policies
Traded good 16 23 footnote A traded good is a good that is either exported or imported by some country
Transfer payments 15-17 22 Payments that redistribute wealth but do not use up resources or create them
Willingness to pay What consumers are willing to pay for a good or service Consumers willing to pay substantially more than the actual market price enjoy a consumer surplus (the amount they would pay minus the amount they actually have to pay)
With project scenario (WP) 11 Box 2 estimation simulation modelling of project envisaged costs and benefits
Without project scenario (WOP) 11 Box 2 the baseline scenario against which the additional benefits and costs of the with project scenario can be measured (eg business as usual)
43
VOLUME 1 BASIC CONCEPTS AND RATIONALE
Steps in economic analysis
Economic analysis requires assessment of a projectrsquos net impact on economic welfare
by considering
5 Convert all market prices into economicshadow prices (SP) that better reflect the social
opportunity cost of the good
6 Remove transfer payments (taxes and subsidies) and quantify externalities (positive
and negative)
7 Aggregate all modelsrsquo NIB cash flows respecting incorporation phasing patterns of targeted
beneficiaries into projectrsquos activities
8 Compare aggregated benefits with other project costs to obtain incremental discounted
cash flows Calculate economic performance indicators adopting a social discount rate
ENPV ERR BC ratio
9 Perform sensitivity analysis (SA) in order to deal with the main risks and uncertainties that
could affect the proposed project
Steps in financial analysis
The typical sequence of tasks to be undertaken in financial analysis is the following
1 Develop farmenterprise models and identify benefits and costs (investment and recurrent) for
WOP and WP scenarios (based on crop budgets)
2 Compare the discounted flows of benefits and costs and calculate the differences between the
obtained results and the WOP scenario in order to determine the net incremental benefits (NIB)
of the proposed interventions
3 Calculate the project financial profitability indicators of each model (ie financial NPV financial
IRR and BC ratio) applying these investment criteria to make an investment decision
(positive or negative)
4 Assess family incomes and establish financingcredit needs by performing a lsquosustainability analysisrsquo
Summary steps in financial and economic analysis
44
WP-WOP develop and identify
Develop farmenterprise models and identify benefits and costs (investment and recurrent) for WOP and WP scenarios (based on crop budgets)
Calculate indicators
Calculate the project financial profitability indicators of each model (ie financial NPV financial IRR and BC ratio) applying these criteria to make an investment decision
Financial sustainability
Assess family incomes and establish credit needs by performing a lsquosustainability analysisrsquo
Discount flows ndash costs and benefits
Compare the discounted flows of benefits and costs and calculate the differences between the obtained results and the WOP scenario in order to determine the net incremental benefits (NIB) of the proposed interventions
Shadow prices
Convert all market prices into economicshadow prices (SP) that better reflect the social opportunity cost of the good
Aggregation
Aggregate all modelrsquos NIB cash flows respecting incorporation phasing patterns of targeted beneficiaries
Cash flows
Compare aggregated benefits with other project costs to obtain incremental discounted cash flows Calculate economic performance indicators adopting a social discount rate ENPV ERR BC ratio
Transfers and externalities
Deduct taxes and subsidies ndash Consider positive and negative externalities
Perform sensitivity analysis
in order to deal with the main risks and uncertainties that could affect the proposed project
1
5
6
7
8
9
2
3
4
Economic analysisFinancial analysis
EFA step by step
International Fund for Agricultural Development
Via Paolo di Dono 44 - 00142 Rome ItalyTel +39 06 54591 - Fax +39 06 5043463E-mail ifadifadorgwwwifadorgwwwruralpovertyportalorg
ifad-unblogspotcom
wwwfacebookcomifad
instagramcomifadnews
wwwtwittercomifadnews
wwwyoutubecomuserifadTV
Contacts EFA desk
Eloisa de Villalobos Thomann
EFA Technical Adviser Tel +39 06 5459 2827Email edevillalobosifadorg
Enrico Mazzoli
Technical Adviser Tel +39 06 5459 2462Email emazzoliifadorg
- Acknowledgements
- Contents
- Abbreviations and acronyms
- Section I - Introduction
-
- Background
- Scope
- Outline
- How to read the guidelines
-
- Section II - Relevance of EFA
-
- Relevance of economic and financial analysis
- EFA as a decision-making tool in project planning
-
- Section III - Basic concepts in undertaking EFA
-
- Investment criteria profitability indicators
- Economic and financial analysis the differences
-
- Section IV - EFA of IFAD rural
-
- Focusing on lsquotypicalrsquo IFAD rural investment projects and their main benefits
- Unquantified benefits alternative methodologies to CBA
- EFA data sources collection and coherence
-
- Section V - EFA role throughout
-
- EFA in project design Links with the logframe and MampE
- EFA in project design Risk analysis
- EFA in project supervision implementation and ex post evaluation
- Ex post EFA and scaling up
-
- Technical annex
-
- Formulas for profitability indicators
- Cost-effectiveness
- Multicriteria analysis
- Types of projects and EFA activities
-
- References
- Glossary
- Summary steps in financial and economic analysis
-

VOLUME 1 BASIC CONCEPTS AND RATIONALE
Programme is a portfolio comprised of multiple
projects that are managed and coordinated as one
unit with the objective of achieving common (often
intangible) outcomes and benefits at sector country
or even multi-country level
Project is a temporary entity established to
deliver specific (often tangible) outputs in line with
predefined time cost and quality constraints A
project should always be defined and executed and
evaluated relative to an approved business plan
which balances its costs benefits and risks
Whenever a project involves the decision to
use available economic resources (eg productive
capital infrastructure human capital knowledge) in
the anticipation of future benefits it is an lsquoinvestment
projectrsquo In brief an investment project is the decision
to make current expenditures in the anticipation of
future benefits
IFADacutes main activity is the financing of rural
investment projects through loans and grants EFA
provides clear and simple indicators to ensure that
a projectrsquos investments generate the anticipated
benefits at household and project levels Thus
IFAD requires this analysis in its project formulation
documents Apart from country-level decisions EFA
results are also used to inform approval decisions in
QEQA processes and by the Executive Board
In summary the main purpose of EFA is to
ensure an efficient allocation of resources proving
to governments the benefit of implementing one
particular investment rather than another option
which could be the lsquodo nothingrsquo alternative (Figure 2)
EFA is the most appropriate tool in appraising the
convenience of carrying out a project for both
the direct beneficiaries and the national economy
as a whole
Thus when appraising the economic and
financial viability of any project one must first
examine the lsquobusiness as usualrsquo (BAU) or lsquowithout
projectrsquo alternative and then compare it with proposed
options What the analyst needs to assess is the
value added (incremental approach) of the project
As a major methodological tool EFA makes use
of CBA but it also allows for other approaches
and studies such as cost-effectiveness and
multicriteria analyses Because costs and benefits
do not occur at the same time ndash with costs generally
preceding and exceeding benefits during the first
years of the project and benefits especially in
the agriculture sector being realized gradually
over a longer time period ndash the comparison is not
straightforward Hence lsquodiscounting techniquesrsquo
are applied This issue will be further developed in
the following sections
CBA was created as a lsquopre-investment toolrsquo
to facilitate investment decisions In these types
of ex ante decision-making tools there is a
trade-off between the amount invested in the
ex ante studies and the probability of making a
wrong investment decision
F IGUR E 2
Decision-making in project formulation
Decisionalternatives
Decision
criteria If XgtY recommend the project
Do not undertake the project
Resources for alternative
uses
Value of alternative
usesBenefit = Y
Undertake the project
Resources allocated to the project
Value of project
outcome Benefits = X
8
VOLUME 1 BASIC CONCEPTS AND RATIONALE
F IGUR E 3
Guiding questions during project assessment
Should resources be invested in this project
Could people afford to adopt the proposed intervention
Would they take the risk to change current practices
Viability
Feasibility
Uptake
BOX 1
Guiding questions
Should the government invest its scarce resources in this particular intervention Should the
producer adopt the proposed intervention
Replying to these questions will ensure that the proposal is solid from a technical financial and
economic point of view Analysis should assess the viability of the investment and compare it
with alternatives (at least with the presentBAU situation) to ensure that the project is generating
additional value This information is also used to ensure the economic profitability of the project
as a whole
Could the producer afford the proposed technology
From a purely financial point of view are available resources adequate for the producer to invest
in the proposed intervention If these resources are not sufficient alternative financing schemes
should be assessed by the project (eg loans savings schemes insurance grants) In addition
other context-specific restrictions should be considered at this stage ndash such as input availability
labour requirements and legal restrictions ndash that could be a barrier to modifying current practice
Would the producer take the risk Would the government take a loan to finance
this project
This is one of the most relevant questions for all project implementers Are incentives high enough
to convince producers to change their current situation Here not only monetary incentives
should be considered but also social cultural and environmental ones
A proper risk analysis would identify the critical economic parameters the government should
consider when making its investment decisions
The ability to support decision-making is a
key element of EFA It provides solid indicators for
answering questions regarding lsquothe best alternativersquo
from the points of view of different actors
Figure 3 shows guiding questions for the
assessment of any investment project and
box 1 provides more information on how these
can be used
9
VOLUME 1 BASIC CONCEPTS AND RATIONALE
The various steps in EFA provide information
to respond to these questions taking into account
that the decision is not simple projects require time
to develop and one wants to make certain that the
improvements in peoplersquos lives are permanent
EFA requirements technical and
institutional viability
EFA is only one part of the overall analysis of a
project it assumes that the project is technically
sound and that its institutional arrangements will
be effective during implementation In other words
EFA of investment projects requires at the least
that the project under analysis be feasible from the
technical and institutional points of view Projects
can be implemented through different institutional
arrangements and using different technical solutions
For a project to be viable at least one of these
institutional arrangements needs to be valid and at
least one technical solution needs to be viable As
will be seen the application of EFA during project
formulation will also help identify and select the lsquobestrsquo
project technical and institutional alternatives This
is a strong assumption as the review of numerous
cases has shown many inconsistencies in project
technical formulation
Commonly identified inconsistencies include
(a) incomplete or inadequate description of the
institutional arrangements for carrying out the
proposed project components (b) incomplete or
inadequate identification of constraints on productive
development For example the project (i) proposes
a new technology but there is no assessment
of the on-farm working capital requirements for
adopting it and consequently the project lacks the
required financing component (eg grants credit)
(ii) plans huge investments in irrigation facilities
but no provision has been made for the required
technological transfer services and working capital
needs (iii) proposes improvement of rural financial
services but there is no description of the expected
productive activities and technologies to be adopted
through the support of these facilities
Thus reviews of the technical proposals and
institutional arrangements for project implementation
are steps prior to EFA They involve preparation of an
adequate project logframe (reviewed at each stage
of the project cycle) which is essential in confirming
institutional viability
10
This section illustrates basic concepts so that the
non-specialist can become more familiar with the
terminology and purpose of EFA However detailed
information on carrying out EFA of projects is
provided in volume 2 of these guidelines
EFA is based on comparison of the net6 cash
flows of investment alternatives The present or
BAU cash flow is compared with at least one
other investment alternative which according
to the projectrsquos technical specialists will result in
amelioration of the producerrsquos situation
6 Net cash flows defined as Benefits discounted cash flow net from costs discounted cash flows
However in order to assess if the project is
making good use of public funds the costs of
implementing it (including the institutional setting
and capacity-building of both implementers and
producers) must be compared with the benefits
produced In other words the value added by the
project is compared with the incremental costs of
implementing it
In practical terms the analyst models diverse
beneficiary livelihood strategies to compare BAU
situations with the project proposal Description
of the BAU or without project (WOP) situation
although simple at first sight can confuse the analyst
regarding many aspects (box 2)
BOX 2
With project (WP) and without project (WOP) scenarios common issues
Accurate description of both WP and WOP scenarios is essential to a realistic assessment of
incremental benefits
1 WOP equal to zero When the project proposes development of a new activity many analysts
represent the WOP as a null scenario because the activity wasnrsquot present in the past
However the correct approach is to realistically represent the alternative activities
(eg off-farm employment)
2 Static or unrealistic WOP Generally WOP scenarios are presented as a static situation that
repeats itself through the years This is often underestimating the capacity of people to adapt
and progress Projects generally assist these processes and accelerate their returns
3 An inaccurate WP fails to assess the incremental net value of the project In a woodlot project
in Malawi that aimed to produce firewood analysts spent a great deal of time studying how
to value the incremental wood production since there was no market for the wood Finally
they decided on an international valuation of the energy created They missed the point In
the without situation women spent a great deal of time travelling to procure firewood with
the project they could spend their time producing more maize If the analysts had developed
realistic WOP and WP situations they would have realized that the benefits of the project
came from incremental maize not wood production
Basic concepts in undertaking EFA
SECTION III
11
VOLUME 1 BASIC CONCEPTS AND RATIONALE
Next one needs to formulate the WP situation
defining expected outcomes in the future by
identifying the requested investment and operating
costs as well as projecting estimated benefits7 In
order to convert future costs and benefits which do
not occur at the same time into todayrsquos values for
comparison discounting techniques are applied
Discounting permits comparison of the value of
money in different time periods considering that
a dollar today is worth more than a dollar received
tomorrow (ie the fact that we have to postpone
consumption makes tomorrowrsquos dollar less valuable
than todayrsquos) How much is $1 received in lsquonrsquo years
worth today The answer depends on the adopted
discount rate (r) and the discount period (n)8
Thus the aggregation of project flows occurring
in different years requires adoption of an appropriate
discount rate to calculate the present value of future
flows As a guiding principle discount rates should
represent the opportunity cost of capital for the
agent (producer or government)9 The other essential
element in discounting is definition of the discount
period (also called lsquoproject economic lifersquo or lsquotime
horizon analysisrsquo)
Usually the discount period is equivalent to the
lifespan of the largest investment components of
the project10
Finally the project net cash flows (ie financial
andor economic)11 are based on the incremental
approach which results from comparing the
WP and WOP situations With these elements it
is possible to calculate the corresponding project
lsquoprofitability indicatorsrsquo
7 The analysis is looking at future investments and outcomes thus sunk costs are irrelevant
8 The present value (PV) = future value(1+r)n If r = 10 and n = 8 years the present value of $1 would be $051
9 For the producer a realistic alternative is an average of the passive deposit rate of local commercial banks The government should instead consider the interest rate at which the country can actually borrow capital from a relevant international capital market alternatively the return on long-term public treasury bonds is also a suitable option More information on determining a relevant discount rate is provided in volume 2
10 This rule might change when (i) technological progress would make the investment obsolete before the end of its useful life (ii) the investment period is lsquotoo longrsquo (ie very common in environmental projects ship construction etc) or (iii) other factors exist (ie legal institutional etc) that justify another specific choice for the discount period
11 See the following subsection for differences between the two
Investment criteria profitability indicatorsGenerally speaking a project is considered lsquoviablersquo
if the sum of expected incremental benefits is
larger than the sum of all costs accrued in project
implementation This can be assessed through
profitability indicators12 The most relevant indicators
for these IGs are the net present value internal rate
of return and benefitcost (BC) ratio
bull The net present value (NPV) indicator is defined
as the sum that results when the expected
costs of the investment are deducted from
the discounted value of the expected benefits
(revenues) Whenever NPV gt 0 the project is
considered worthwhile or profitable Among
mutually exclusive projects the one with the
highest NPV should be chosen
bull The internal rate of return (IRR) indicator is
defined as the discount rate (r) that produces
a zero NPV This represents the maximum
interest rate that a project could face and still
not waste resources
For the project to be profitable the IRR has
to be greater than the interest rate that could be
earned in alternative investments thus when
IRR gt r the project is considered viable If the
(alternative) interest rate (imkt) also called opportunity
costs of capital is lower than the IRR the NPV is
positive and vice versa
IRR NPV 0gt gti mkt
IRR NPV 0lt lti mkt
12 Formulas can be found in the technical annex
12
VOLUME 1 BASIC CONCEPTS AND RATIONALE
Both NPV and IRR are calculated on the same
project cash flows of incremental net benefits
However in certain cases the calculation of
IRR is not possible and thus it cannot be used as a
profitability indicator
This is the case when (a) the flow of net
incremental benefits does not have a negative
element or (b) it presents more than one IRR
complicating the decision as to which one to
consider as the profitability indicator
Moreover IRR is an indicator that should not be
used to rank or select mutually exclusive project
options as it cannot provide a measure of the size or
magnitude of project value13 (box 3)
The NPV on the other hand is an indicator that
can always be calculated as is the case with the
benefitcost ratio
bull The (BC) ratio indicator is the ratio of the
present value of benefits to the present value
of costs over the time horizon The BC ratio
provides some advantages when a ranking of
alternative investment projects is needed under
budget constraints
If BC ge 1 the project is accepted
If BC lt 1 the project is rejected
13 Where a project is the only alternative proposal to the status quo the issue is whether the IRR provides worthwhile additional information Views differ in this respect Some argue that there is little merit in calculating a statistic that is either misleading or subservient to the NPV Others see a role for the IRR in providing a clear signal as regards the sensitivity of a projectrsquos net benefits to the discount rate Yet whichever perspective is taken this does not alter the broad conclusion on the general primacy of the NPV rule
These IGs consider that the most appropriate
indicator for appraising an investment project is
the NPV as the investment decision criterion is
straightforward if NPV is gt 0 the project is viable
It means that the proposed investment is a profitable
alternative in terms of resource allocations It is better
than the present and WOP situations and also better
than allocating the same resources to other economic
activities that will yield the average profit rate
Economic and financial analysis the differencesAll investment projects include a number of
stakeholders and this has implications for the
valuation of the benefits and costs accrued by
project interventions Whose costs and benefits
count14 Governments and society as a whole will
consider and value costs and benefits differently
from producers or any other private actor individually
From the perspective of a development agency such
as IFAD both points of view are relevant to a reply
to the guiding questions stated before Should the
government invest in this project Will the producer
take the risk
14 In the CBAEFA literature the question of lsquowhose costs and benefits countrsquo is known as the lsquostandingrsquo issue (ie whose welfare counts in the aggregation of net benefits)
BOX 3
IRR or NPV
Although the most appropriate indicator for appraising an investment project is the NPV ndash as it
can always be calculated and will provide information on the magnitude of the return ndash the IRR is
the most commonly used This is probably due to the fact that IRR is expressed as a percentage
which is often wrongly associated with other rates of return such as interest rates (r) or profit rates in
alternative allocations In fact the IRR has no meaning in terms of project value or size
To prove this letrsquos suppose a project is one thousandth the size of another project Simply multiply
each side of the equation by 1000 The calculated IRR will not change but the small project entails
less value The project to be chosen from a social point of view would be the one producing the
bigger returns to the economy and the NPV will clearly show this while the IRR will not
13
VOLUME 1 BASIC CONCEPTS AND RATIONALE
In order to consider these points of view analysis
will be conducted on two levels (a) financial analysis
will consider private stakeholdersrsquo interests15 and
(b) economic analysis will consider government
and society perspectives These two viewpoints will
require the analyst to consider different items
when looking at the benefits and costs of a project
valuate them differently and in some cases even
use different rates to discount the streams of costs
and benefits
The private investor exclusively considers the
costs and benefits related to the productivemarket
aspects of the project while analysis from an
economic point of view considers that benefits are
defined as an increase in social well-being16 The
costs are defined as reductions in social well-being
For a project to be economically viable its social
benefits must exceed its social costs
15 This point of view is also applied to the executing agency of a public project
16 The term lsquosocial welfarersquo or lsquowell-beingrsquo is used in these IGs as a simple monetary measure The definition is taken from neoclassical economics and prevailing economic theories of well-being No attempts are made to include any type of measurement of subjective happiness or to develop any well-being indexes or social indicators
Thus from the perspective of a private
stakeholder (financial analysis) participating in the
investment with risk capital the wealth created by
a project in lsquonrsquo periods of time is defined as the
financial NPV (FNPV) The economic or cost-benefit
analysis looks at the overall impact of the project
and takes the point of view of the collective agent
(eg society) and the wealth created by a project in
lsquonrsquo periods of time is defined as the economic NPV
(ENPV) of the investment produced by the project17
In financial analysis all costs and benefits
should be valued at market prices Only cash inflows
and outflows are considered (depreciation reserves
and other accounting items not corresponding to
actual flows are excluded)
17 In rural development projects where the agent is a subsistence farmer accumulated generated cash per year must be at least equal to or higher than the BAU situation that was ensuring hisher familyrsquos survival
BOX 4
Steps in financial analysis
The typical sequence of tasks to be undertaken in financial analysis is the following
1 Develop farmenterprise models and identify benefits and costs (investment and recurrent) for
WOP and WP scenarios (based on crop budgets)
2 Compare the discounted flows of benefits and costs and calculate the differences between the
obtained results and the WOP scenario in order to determine the net incremental benefits (NIB) of
the proposed interventions
3 Calculate the project financial profitability indicators of each model (ie financial NPV financial
IRR and BC ratio) applying these investment criteria to make an investment decision (positive or
negative)
4 Assess family incomes and establish financingcredit needs by performing a lsquosustainability analysisrsquo
Financial sustainability is ensured if the accumulated generated cash per year is positive or
at most equal to zero17 for all years considered On the contrary if this figure is negative at any
point in time the project is not sustainable meaning that there are not enough financial resources
to cover all the costs and it will be necessary to reassess project financing mechanisms
14
VOLUME 1 BASIC CONCEPTS AND RATIONALE
Economic analysis or cost-benefit analysis
builds on the results of financial analysis with the
additional consideration of impacts and benefits not
directly captured by the latter These analyses are
strictly related as shown in Figure 4
The main steps in financial analysis are
summarized in box 4 A detailed description of
building economic analysis from financial models is
provided in volume 2 which illustrates each step in
EFA of a typical IFAD production-oriented project
In economic analysis the analyst needs to
complement financial analysis by considering all
project impacts on the society The private actor is
generally not interested in considering all negative
or positive impacts that his actions may have on the
rest of society In terms of environmental impact
for example polluting rivers through production
discharges or emitting CO2 are social costs generally
not considered by the private agent These are called
lsquoexternalitiesrsquo as in practical terms the private agent
is lsquoexternalizingrsquo a production cost making the whole
society pay for it On the other hand there also exist
positive effects not counted by the private agent
such as the introduction of new pastures by a single
producer which can increase honey production in
the area and benefit neighbouring beekeepers
These aspects are known as positive and
negative externalities In addition economic analysis
must eliminate all transfer costs between national
and private actors (ie subsidies and taxes) Lastly all
costs and benefits need to be valued at their social
opportunity cost rather than at their market price
F IGUR E 4
Economic and financial analysis links
Aggregation
Project net incremental
benefits(NIB)
Farm budgets properly phased
Activity budgets (eg processing enterprises)
phased
Government implementing
agencies
Financial analysis(market prices)
123n
123n
Farm budgets properly phased
Activity budgets (eg processing enterprises)
phased
Government implementing
agencies
sum
sum
sum
Economic analysis(economic values)
123n
123n
Adjust market values to economic
values
Eliminate transfer
payments (taxes and subsidies)
Quantify externalities
15
VOLUME 1 BASIC CONCEPTS AND RATIONALE
Many times for example when trade barriers
are in place or when currencies are controlled
market prices do not reflect the social value of
goods In order to account for these distortions
one of the most critical tasks is the calculation of
economic or shadow prices Another critical aspect
is the establishment of a social rate of discount
that realistically reflects an investment alternative
(opportunity cost) for the government18 Detailed
explanations and guidelines for these calculations
are also included in volume 2
Table 1 illustrates the process of going from
financial to economic analysis19 The financial
analysis section at the top shows revenues and 20
production costs (operating and investment) of a
hypothetical enterprise The enterprise is experiencing
18 As a general rule when a country is a capital borrower the social rate of discount should be no less than the actual rate of interest on the capital market from which the capital is borrowed
19 Clicking on the table reveals the formulas
20 See section on ldquoUse of SA to assess project risks an examplerdquo
several years of negative net cash flows resulting
in a negative NPV and IRR This is caused by high
operating costs as well as recurrent needs for
investment Economic analysis converts market
prices into economic prices As reflected by the
application of conversion factors (CF) market prices
of outputs and inputs are different from their social
value For example the CF applied to wages reflects
the presence of high unemployment (20 per cent)
in the area which would push people to work for
lower than market wages (thus CF = 08)21 In the
same way the CF applied to investments reflects
the presence of high transport costs or duties that
make the productrsquos market price overestimate its
social value In fact the market price is 83 while the
economic price is 75 and thus the CF is 09
21 Market wage (mW) = US$100 unemployment = 20 economic wage(eW) = US$80 (observed given the high unemployment) CF = eWmW = 80100 = 08
BOX 5
Steps in economic analysis
Economic analysis requires assessment of a projectrsquos net impact on economic welfare
by considering
5 Convert all market prices into economicshadow prices (SP) that better reflect the social
opportunity cost of the good
6 Remove transfer payments (taxes and subsidies) and quantify externalities (positive and negative)
7 Aggregate all modelrsquos NIB cash flows respecting incorporation phasing patterns of targeted
beneficiaries into projectrsquos activities
8 Compare aggregated benefits with other project costs to obtain incremental discounted cash
flows Calculate economic performance indicators adopting a social discount rate ENPV ERR
BC ratio
9 Perform sensitivity analysis (SA) in order to deal with the main risks and uncertainties that could
affect the proposed project20
Critical parameters are (i) SP for tradable and non-tradable goods (ii) SP of foreign exchange
(iii) SP for labour costs (shadow wage) and (iv) the social discount rate
16
VOLUME 1 BASIC CONCEPTS AND RATIONALE
Fiscal corrections are also applied and
10 per cent VAT is deducted from all inputs and
outputs with indirect taxes Finally externalities
are accounted for and quantified both negatives
(increases in noise) and positives (decrease
in pollution)
The project under analysis resulted not profitable from a financial point of view but viable
from an economic point of view This means that
the overall impact for society is positive (also
reflected by the positive externalities) but there
are no sufficient incentives for the private
individual agent to undertake these activities
This conclusion suggests that if the development
objectives achieved through this investment are
significant enough for the government then the
project should develop an incentive scheme to
attract the private agent
These results may be used in policy dialogue
suggesting that the government could reduce the
level of targeted import duties and thus make this
investment proposal financially profitable
TA BLE 1
From financial to economic analysis an example
Financial analysis (market prices)Thousands of United States dollars
Years
1 2 3 4 5 6 7 8 9 10
Total operating revenues 0 42 115 119 126 126 126 126 126 126
Total Inflows 0 42 115 119 126 126 126 126 126 126
Total operating costs 0 -56 -75 -98 -101 -101 -101 -101 -117 -117
Total investment costs -165 -4 -4 -25 -3 0 -25 0 0 12
Total outflows -165 -60 -79 -123 -104 -101 -126 -101 -117 -105
Net cash flow -165 -18 36 -4 22 25 0 25 9 21
Financial rate of return -6
Financial NPV10 US$(89)
Economic rate of return 36
Economic NPV10 US$473
Years
Economic analysis CF 1 2 3 4 5 6 7 8 9 10
Output X 12 0 49 134 139 147 147 147 147 147 147
Total operating revenues 0 49 134 139 147 147 147 147 147 147
Labour costs 08 0 -18 -18 -26 -26 -26 -26 -26 -30 -30
Operating costs 11 0 -36 -57 -73 -76 -76 -76 -76 -87 -87
Total investment costs 09 -149 -4 -4 -22 -3 0 -22 0 0 11
Fiscal correction outputsa 09 0 44 121 125 132 132 132 132 132 132
Fiscal correction inputsa 09 -134 -36 -55 -85 -71 -68 -88 -68 -78 -68
Externalities 0 20 20 20 20 20 20 20 20 20
Decreased pollution 0 23 23 23 23 23 23 23 23 23
Increased noise 0 -3 -3 -3 -3 -3 -3 -3 -3 -3
Net cash flow -282 39 161 98 144 149 107 149 124 145
a VTA of 10 has been eliminated
1 Adjust market values to economic values applying CF2 Eliminate transfer payments (taxes and subsidies)
3 Quantify externalities
17
SECTION IV
IFAD rural investment projects include projects
in integrated rural development irrigation rural
finance value chain development natural resource
management (NRM) climate-change adaptation
and mitigation community development and
institutional strengthening
As IFAD follows its main mandate of focusing its
projects on benefiting poor rural people22 projects
are characterized and designed through identification
of a target group composed mostly of rural people
Poor rural people represent different productive
and economic categories the main one being
smallholders Others include the landless population
engaged in rural non-agricultural microenterprises
rural workers fishers and finally special vulnerable
groups such as women indigenous minorities and
youth All IFAD projects must be formulated on
the basis of benefiting one or more of the above-
mentioned poor rural groups
The increased number of value chain projects
in IFADrsquos portfolio23 ndash aiming to integrate IFADrsquos
traditional target groups into these chains to improve
their access to secure markets and sustainably raise
their incomes ndash has expanded the definition of IFADrsquos
target group to all rural people including small- and
medium-scale entrepreneurs in rural areas However
for the purposes of EFA the impact on poor rural
people is the one that matters the most to IFAD24 and
22 See IFAD Lending Policies and Criteria I (5) ldquoIFAD will concentrate its resources upon activities that promise to achieve in a cost-effective way a reduction of poverty in rural areas where most poor people live and work The Fundrsquos major target groups irrespective of the stage of economic development of the country will be the small and landless farmersrdquo
23 From only 3 per cent in 1999 to 46 per cent in 2009 (Raswant and Heinemann 2012)
24 However when possible and relevant distribution of benefits among value chain actors is a complement to CBA
to the poverty-reduction development objectives of
each government
This IFAD specificity has direct consequences for
CBA discussion of the lsquostandingrsquo issue As previously
stated investment projects include a number
of social stakeholders However for IFAD rural
investment projects this is not a major issue as the
formulation of IFAD projects is focused on benefiting
a specific target group poor rural people25
Focusing on lsquotypicalrsquo IFAD rural investment projects and their main benefitsThe typical IFAD project is usually production
oriented26 and its main outcomes (ie financial and
economic benefits) are frequently net production
increases In other words most IFAD projects will
have a direct impact on the production levels
of target groups which in turn will lead to net
income increases
IFAD projects have an impact on the incomes
of poor rural people by increasing their access to
inputs and services that will subsequently increase
their production volumes andor productivity
The most common areas of intervention include
technical assistance (TA) for crops and livestock
through extension services rural finance services
25 There might be exceptional situations in which other social groups could benefit from an IFAD project These cases might require additional analyses (eg distributional effects analysis) when undertaking EFA
26 Of 114 projects reviewed by QE from 2009 to 2011 73 per cent were agriculture- or rural development-related while in 16 per cent the core objective was to strengthen financial services The rest focused on capacity-building or NRM These data show that most IFAD projects can be characterized as production-oriented that is designed to have direct impact on production and productivity increase
EFA of IFAD rural investment projects
18
VOLUME 1 BASIC CONCEPTS AND RATIONALE
to support on-farm investments and increased
access to working capital through creditloan27 or
grant facilities improved water management through
the construction of irrigation structures provision
of storage drying and cooling facilities to enhance
post-harvest preservation and technical advisory
and financial resources to support entrepreneurs
in starting small and microenterprises ndash as well as
combinations of the above
This IFAD specificity leads to some
straightforward requirements when analysing its
financial and economic results First the project
should be assessed in terms of the financial feasibility
and sustainability of targeted beneficiaries second
the project should be assessed in terms of economic
profitability for the whole national economy
Thus in IFAD production-oriented projects the
main household-level goal in financial analysis is to
determine whether the producer28 will have enough
incentives to participate in the project
In simple terms analysis needs to establish
whether the farmer should undertake the proposed
intervention under the criterion that it is financially
viable (ie the benefits over time are higher than the
investment and recurrent costs) and that these net
benefits exceed present returns (ie incremental
benefits are positive)
However even if the new situation (WP) is more
appealing than the present one (WOP) could the
farmer afford to adopt improved practices Although
viable the investment may still not be profitable if it
does not generate enough returns (mostly during the
first years) to cover the farmerrsquos needs Where the
producer is living under the poverty line the project
should at least generate the same net income each
year as in the BAU situation (subsistence system)
to ensure hisher participation Where poverty levels
are lower incomes should be adequate to cover
investment and working capital needs in addition to
27 Comprising inclusive innovativeadapted rural finance products and services including risk management strategies savings financial literacyeducation programmes etc
28 The terms lsquofarmerrsquo lsquoproducerrsquo or lsquoprivate stakeholderrsquo will be used throughout the IGs as synonyms for the term lsquoprivate agentrsquo in financial analysis
the farmerrsquos living expenses The lack of initial capital
to invest is generally a huge barrier to engaging in
a new activity A financial analysis will determine if
farmersrsquo cash flows are adequate to undertake the
activities (ie it will clearly identify a farmerrsquos financial
needs and hisher repayment capacity)
Even when a financing scheme will prove the
feasibility of the investment there are many risks
involved in changing a farmerrsquos practices (business
as usual) above all if it involves taking out a loan
in an uncertain agricultural environment Thus the
last question to be answered is would the farmer
take the risk are there enough incentives Risks
faced by farmers are many and extremely difficult
to manage29 The only measure of their willingness
to change habitstechnologies will be by comparing
their returns to the opportunity costs of remaining
in the actual situation If for example the returns to
labour of the new activity prove to be much higher
than the average rural wage it is probable that a
farmer would be willing to invest his time in his own
farm and take the risk
In other words financial analysis will establish
whether farmers will obtain a net incremental benefit
(financial viability and profitability analysis) if theyrsquoll
have enough working capital to buy the additional
farm inputs or to bear the costs of stocking
processed goods (financial sustainability) and finally
if financial incentives are enough to convince them to
change existing practices
The practical way to undertake this analysis is by
developing different beneficiary productive profiles
ndash considering several types of productive activities
lsquofarm-systemsrsquo and lsquoactivity-modelsrsquo ndash as well as how
many and which types of people generally engage in
these activities in this particular area
On the basis of the individual models of financial
analysis ndash and once the three steps in converting
market prices into their economic value have been
29 For example risks in the areas of production prices casualties technology climate ndash to name just a few
19
VOLUME 1 BASIC CONCEPTS AND RATIONALE
completed ndash economic analysis of the project as a
whole can be undertaken30 This is done by means
of the aggregation that in project analysis is the
process of adding together the costs and benefits
of all the entities participating to reach a summary
account from which a measure of project worth can
be derived The result of the aggregation is the net
incremental benefit or cash flow of the project31
Lastly the goal of economic analysis is to answer
the question of whether it is worthwhile to invest
public resources in the overall project proposal
(should the government invest) It will focus on the
perspective of the entire country and it measures the
effects of the project on the economy as a whole
Unquantified benefits alternative methodologies to CBAThe majority of IFADrsquos projects are production-
oriented interventions in which expected outcomes
are tangible and easily quantifiable however due to
IFADrsquos typical target group many of these projects
are complemented by activities seeking an impact
on less-tangible aspects of rural poverty alleviation
Womenrsquos empowerment increased access to assets
and services enhanced capacities ownership and
land titling are examples of this important part of
IFADrsquos overall project impact However these types
of benefits which are more difficult to measure or not
measurable in monetary terms (intangible benefits)
are often excluded from CBA
In addition environmental and social benefits
resulting from the promotion of resilient agricultural
practices or social infrastructure such as rural roads
irrigation schemes or market infrastructure are also
seldom included in CBA In order to change this
trend these IGs will provide some ideas on how to
allocate value through the use of valid proxies to
measure the impact of these intangible social andor
environmental benefits
30 Some analysts proceed by aggregating the financial analysis and then converting the aggregated results into their economic value It can be argued that this stage of analysis is useless as the financial profitability indicators for the project as a whole have no use in terms of investment decisions
31 See volume 2 and its annex for more details on the lsquoaggregation issuersquo and common mistakes
In the particular case of CDD projects where
communities collectively decide on the allocation
of project resources it is very difficult to foresee
which productive activities will be targeted However
markets and agronomic conditions in the project
area will limit the scope of activities that can be
successfully undertaken In these cases the fact
that communities are making participatory decisions
will grant the additional benefits that ownership
provides ensuring higher adoption rates than
average and increasing the sustainability of the
chosen interventions
In cases where the identification and valuation
of benefits is difficult simple and sensible ways
of estimating tangible benefits should be applied
Table 2 presents an overview of suggested
approaches to transforming such benefits into
tangible values so as to include them in overall
project cash-flow analysis from the most common
complementary activities in IFADrsquos projects
Additionally the IGs will introduce two methods
alternative to CBA for those cases where not even
proxies could be measured cost-effectiveness
and MCA32 The latter has not yet been tested
as a suitable tool in IFAD project designs but is
suggested as an alternative in cases of complex
decision-making
Cost-effectiveness
When tangible benefits from a given investment
are difficult to quantify but the costs are easily
identifiable the most commonly used valuation
method is cost-effectiveness which is used to select
the least-costly alternative among a set of options
that will achieve the same result (a given set of
predetermined objectives) Once the purpose of the
project has been decided for example construction
of a market storage facility cost-effectiveness would
be used to compare scale location technology
etc in order to choose between investment
32 See the technical annex for more details
20
VOLUME 1 BASIC CONCEPTS AND RATIONALE
Project componentsactivity Quantifiable benefits
Productivity enhancement (including irrigation post-harvest and processing) Storage drying cooling facilities irrigation
bull Reduced post-harvest losses
bull Increased value and volumes of production due to investments in storage cooling or small processing facilities (drying or milling)
bull Increased production and productivity due to water provision
Value chain (VC) Collective marketing warehouse receipt systems increased market information
bull Increased value of final product owing to increased quality and access to markets improved handling packaging and commercialization
bull Financial benefits to all actors along the VC
bull Microenterprise and employment creation
bull Creation of internal and external markets that did not exist before investments
Rural roads bull Reduced transport and vehicle maintenance costs (incl vehicle operating costs [VOC] and travel-time costs [TTC])
bull Access to areas not accessible before hence increased total production
bull Increased volume of transported agricultural products for sale (reduced losses)
bull Reduced transport costs due to better access to sales points
Domestic water supply bull Time saved in procuring water
bull Reduced sickness through better water quality
bull Reduced water losses due to leakage
bull Increased productivity through small-plot crop irrigation and through provision of water for livestock
bull Introduction of backyard gardening
Climate adaptation and resilience practices Changes in tillage practices crop rotations landsoil conversion afforestation energy-efficient systems flood prevention
bull Reduced land erosion an estimate of saved nutrient content can be valued at price of fertilizer needed to replace that nutrient content
bull Increased crop timber and livestock yields through soil preservation conservation tillage and agriculture
bull Increased final product value due to labelling as organic agricultural practices
bull Avoided rehabilitation costs for public infrastructure destroyed by natural disasters
bull Energy savings owing to replacement of old practices by eco-friendly artefacts (eco-stoves solar panels etc)
Land registration Land tenure security may translate into increased land value explained by
bull Long-term Investments in land fertility
bull Improved access to credit as land can be used as collateral
bull Greater dynamism of land markets
bull Environmental benefits as a result of better NRM (people improve or maintain forest andor tree cover)
TA BLE 2
Simple sensible ways of valuing different types of benefits
21
VOLUME 1 BASIC CONCEPTS AND RATIONALE
options (eg open storage location of a facility
construction materials) Unfortunately the results of
this method which can justify project investment
decisions cannot be integrated into the streams of
incremental net benefits resulting from classic CBA
thus underestimating the overall benefits of
the investment
Multicriteria analysis
MCA is a decision-making tool for evaluating
complex decision problems where the options
entail many different objectives Unlike CBA MCA
allows consideration of aspects other than economic
and financial ones for example both quantitative
and qualitative data It builds trade-offs between
criteria that in complex decision-making are usually
in conflict (efficiency and equity for example) 33
and is an important instrument in ranking different
options and discriminating between acceptable and
unacceptable possibilities
The main advantages of MCA are its openness
explicitness and power to simplify complex
situations This process eases the discussion and
promotes communication first within the decision-
33 Another example would be when production objectives are in contraposition to environmental ones For example to increase livestock production for food security and at the same time reduce CO2 emissions
Project componentsactivity Quantifiable benefits
Rural finance bull Efficiency gains in financial system can lower operational costs and ensure self-sufficiency and sustainability of financial services supply
bull Shifts in portfolio composition of financial service providers (productive loans versus consumption)
bull Incremental taxation revenues to government
bull Potential productivity increases through financing of working capital (incremental benefits to clientsborrowers)
bull Economic benefits of transfer effects
Community development (CD) bull Improvements in lives of beneficiary households (value these in money equivalents if possible)
bull CD activities result in high empowerment and ownership of project activities which could translate into greater sustainability
Indigenous peoplesrsquo (IPs) knowledge
bull When IPs are supported in applying their knowledge ownership of project activities is ensured as well as sustainability of activities This can translate into low implementation risk and high uptake (adoption rates)
bull Generally IP practice are environmentally friendly thus reducing stress on natural resources
bull Nutritional aspects are also part of the positive impacts
Institutional strengthening bull Improved institutional capacity has generated or will generate benefits for target groups
bull Losses avoided by strengthening the institution looking at the sensitivity analysis assess how delays in implementation (due to institutional weak capacities) affect project outcomes and use that data to calculate losses avoided
Source PTA ndash EFA desk elaboration
22
VOLUME 1 BASIC CONCEPTS AND RATIONALE
making body and later between that body and
stakeholders MCA can be an ex ante (lsquobefore the
factrsquo) and an ex post (lsquoafter the factrsquo) evaluation tool
This type of analysis also presents some difficulties
One concerns definition of the comparative criteria
Use of MCA requires knowledge of mathematical
notions data aggregation methodologies and
computer applications to perform analysis following
a structured process and to avoid weak conclusions
It is often costly and time-consuming
EFA data sources collection and coherenceThe value of EFA as a decision tool hinges on the
quality of the data and assumptions that underpin
it Data availability is a widespread problem for
EFA analysts who should always work in close
collaboration with expert colleagues (agronomy
livestock and rural infrastructure experts) who will
provide or validate the key technical parameters of
the analysis34
Data regarding project costs should be collected
during design missions in consultation with the rest
of the team Once the first results from EFA are
reached they should also be shared with the team
to discuss how they affect expected outcomes and
assumptions For example planned investment costs
may not be sufficient to reach the number of target
beneficiaries outcomes of specific components may
not be appealing from a financial point of view etc
Although it is the responsibility of the EFA analyst
to gather and ensure data consistency among
sources the mission leader should promote and
facilitate dialogue among mission members and
provide sufficient time for the analyst to collect and
process data to ensure EFA quality and coherence35
34 Alternatively FAOSTAT is the most reliable and recommended source of data (httpfaostatfaoorg)
35 It is estimated that at least five weeks are needed for elaboration of a complete EFA one week for data gathering two weeks of mission and two weeks for data processing
For the other parameters of EFA analysis such
as conversion factors and discount rates one
of the most important sources of data is always
the national planning offices If these data are not
available evaluations of completed operations by
the Independent Office of Evaluation of IFAD (IOE)
can be used as a reference36 These can provide
reference values for similar projects or projects
in the same country (and region) for example on
uptake (adoption rates) of a specific technology or
constraints on input availability
Moreover economic and financial analysis in
appraisal reports for the same country (andor region
andor sector) ndash from IFAD and other IFIs such as
the World Bank or regional development banks ndash are
potential sources of information on key parameters
such as discount rates37
However any project analyst should rely on his
her best judgment accumulated through experience
when deciding on the assumptions to be used
36 Evaluations by country and region are available at wwwifadorgevaluationpublic_htmleksystdocprjindexhtm
37 FAOrsquos Monitoring and Analysing Food and Agricultural Policies (MAFAP) programme develops estimates for standard conversion factors the social exchange rate (SER) for different countries and currencies and other important parameters for estimating shadow prices such as the transport costs duties and taxes instrumental in calculating parityborder prices for tradable goods (wwwfaoorgmafaphomeen Country reports can be found at wwwfaoorgmafapproductscountry-reports-technical-notesen)
23
SECTION V
To increase the efficient use of EFA it is important to
view this analysis as an integral part of project design
information and not only as a mandatory study done
for compliance with IFAD quality requirements
To do so there should be continuous review and
refinement of EFA at all stages of the project cycle
It is part of the monitoring and evaluation (MampE) and
knowledge management functions to inform decisions
on adjustments to design and implementation
modalities in pursuit of project objectives
As a first step the data used for EFA in
project design should be periodically updated
by the projectrsquos MampE system and supervision
implementation support missions should verify that
this has taken place If significant changes occur in
the data ndash particularly those for which the sensitivity
analysis showed higher sensitivity ndash the IRR NPV
and cost-benefit ratio should be recalculated
In the light of new data (eg prices for inputs
and outputs demand forecast for project outputs
andor adoption rates) ndash and taking into account
the results of updated EFA including identified
risks and suggested mitigation measures ndash it may
become appropriate during project supervision
andor implementation support missions to decide
to reallocate resources among activities andor
components shifting from those that contribute less
according to the new constellation of data to those
that would contribute more to the projectrsquos objectives
Moreover the EFA spreadsheet prepared during
project appraisal should remain available for review
during project implementation and evaluation This
serves as an indicator of compliance with the EFA
requirement for design documents and the new RMF
indicator as stated in the relevance section It would
also facilitate the updating process indicated in the
preceding paragraph
The purpose of EFA in each phase of the project
cycle including evaluation is indicated in the
following table
TA BLE 3
EFA at different stages of project cycle
Project cycle stage Role of EFA Form of analysis
Concept Definition of investment criteria
bull Purely ex ante ndash all benefits and costs are based on estimates of future values
Project design Resource allocation decisions
bull Purely ex ante ndash all benefits and costs are based on estimates of future values
Supervision ndash early stage
Resource reallocation decisions
Newly Identified risks
bull Mainly ex ante ndash some costs may be ex post but most benefits will still be based on future estimates
Midterm review (MTR) bull Mainly ex ante ndash some costs will be ex post but estimation of future benefits will be based on evidence accrued during first half of project
Supervision ndash later stages
bull About 50 ex post50 ex ante ndash costs will be increasingly based on actual results but benefits are generally lagged by several years at least and will continue to accrue over life of investment
Project completion report (PCR)
Assessment of results bull Mainly ex post ndash all costs and some benefits will be based on actual results but benefit stream for residual life of investment will remain an estimate of future values
EFA role throughout IFADrsquos project cycle
24
VOLUME 1 BASIC CONCEPTS AND RATIONALE
Table 3 also describes the form of analysis
undertaken at each stage of the project cycle which
ranges from purely ex ante during project design to
partly ex post initially with regard to costs and later
to benefits and finally purely ex post for investment
costs but only partly ex post for recurrent costs
and benefits In this example a fully ex post analysis
would only be possible after 20 years which lies
more in the realm of policy analysis than project EFA
Given its purpose EFA is currently used mostly
as an ex ante tool to guide project formulation and
justify investment decisions Nevertheless it could
make a bigger contribution to IFADrsquos mandate for
rural poverty reduction if it were used in some of
the following ways
At concept
bull At COSOP38 andor project conception previous
evaluation ex post reports elements from
previous EFAs or speedy financial assessments
of intended investments could serve as
screening criteria for the validation of proposed
investment ideas For example a previous study
on the investment requirements for a specific
irrigation technology may help establish a
minimum area to be covered by projects in order
to produce sufficient benefits to overcome
project investments
At design
bull For component selection ex ante assessment of
component viability during design
bull For cost validation EFA will confirm whether
estimated project investment costs are sufficient
to cover proposed interventions as well as define
beneficiariesrsquo contributions and their financial needs
bull In the logframe EFA can provide realistic and
consistent outcome indicators
bull For risk management EFA will provide grounded
information for the effective design of mitigation
measures applied to changing circumstances in
order to understand and manage risk
38 Country strategic opportunities programme
At implementation
bull To terminate or modify activities that are not
generating satisfactory financial results for the
intended beneficiaries and economic impact for
the country as a whole
bull For MampE Updating EFA to changing
circumstances will provide up-to-date evidence
of realistic outputs outcomes and impacts As
an MampE and knowledge management tool it can
facilitate learning within and between countries
about what works and what doesnrsquot in terms of
financial and economic impact This knowledge
can also be used to guide the design of country
programmes through the COSOP
bull EFA can also be used as a risk management
tool during implementation Where new risks
are identified or design assumptions are found
to be incorrect remedial action may be needed
including reallocation of resources among
components andor expenditure categories
Early in implementation EFA could contribute
to adaptation to changing circumstances such
as commodity prices production technologies
and institutional and policy changes which
may suggest that different or better approaches
be adopted modifying the design andor
implementation arrangements
At evaluation
bull As an ex post impact assessment tool by
incorporating EFA in IOErsquos PCR and country or
project evaluations in order to compare expected
and actual project results
bull To inform decisions on scaling up or replication
of successful initiatives including the scaling
up of grant-funded activities into full-scale
loan-funded projects
bull Ex post EFA assessment may suggest
discontinuation of approaches that are not
working and scaling up of those that are
25
VOLUME 1 BASIC CONCEPTS AND RATIONALE
Goal bull 20 increased average
income in 29000 HH
C1 bull 29000 farmers linked
with VCbull US$64 m in loans
distributed
C2 bull 29500 HH new crops
amp improved yields 15bull 2000 ha irrigatedbull 83 km rural roads
C3 Overall implementation
EFA in project design Links with the logframe and MampEIn addition to a complete EFA assessment IFADrsquos
mandatory design documents require presentation
of a logframe detailed cost tables disaggregated by
component financier and expenditure categories
and formulation of an MampE system
These three elements should be closely linked
The logframe provides a global picture of project
objectives and describes through components the
activities that will be put in place to achieve them
along with measurable indicators to monitor progress
and achievements The cost tables assign a cost
to each of these activities and MampE measures their
impact EFA is the technical vehicle that attaches an
expected benefit or outcome to the costs of each
envisaged activity It defines the causal chain of
effects between a projectrsquos inputs and outcomes
In other words many of the logframe sections
can and should be completed with information
coming from EFA These indicators should also be
used as part of the MampE system in order to maintain
coherence between planned interventions and
expected outcomes from the very beginning
In order to illustrate this causal chain a clarifying
example is provided in Figure 5 to explain how through
EFA certain inputs will be transformed into outcomes as
a result of the project The example has been extracted
from an ongoing IFAD project with a total project cost
of US$119 million to finance three main components
C1 value-chain market linkages development C2
improved agricultural practices and infrastructure
and C3 the project management unit (PMU)
As shown in Figure 5 uptake indicators
(ie number of expected beneficiaries) and overall
project impact of 20 increased incomes in
29000 HH have been directly estimated through
EFA (shown by the visible arrow) The same has
been done for expected outcomes from productive
interventions ndash such as improved crops and cropping
techniques complemented by irrigation infrastructure
under C2 ndash that will result in an average increase
in yields of 15 per cent However there are some
project activities for which it is more difficult to
F IGUR E 5
Practical example of linking EFA with the logframe costs and MampE With what For what
Objective Increase sustainable HH income
C1 Promote VCbull Capacity-building for
farmersrsquo groupsbull Link with farmers
and investment fund
C2 Support farmersbull Improved crop varieties
and TAbull Irrigation and road
infrastructure
C3 PMU
Total costs bull US$11946 m
Costpers US$740
C1 US$1875 mbull Capacity-building
US$3Mbull Link US$063 mbull Investment fund US$1512 m
C2 US$787 mbull Better crops US$643 mbull TA US$5 mbull Infrastructure
US$94 m
C3 US$105 m
LogframeImpact (MampE)
Projectcosts
Logframe Projectcosts
Impact (MampE)
EFA defines the causal chain
EFA can translate project inputs into results
26
VOLUME 1 BASIC CONCEPTS AND RATIONALE
measure impact (represented by the fading arrow)
In the example the development of stronger links
between farmers and agribusiness and improved
market access through construction of rural roads
will certainly have an impact on beneficiary access
to markets but this is not easily quantified by
measuring the number of meetings held by these
groups It would be better reflected in increases in
volumes sold and the prices received by farmers
Moreover indirect benefits from project activities
should also account for other rural people that will
benefit from the roads and are also not included in
the analysis Finally several project costs will not
produce any direct benefits but the activities they
fund are fundamental in the delivery of the overall
project For example all costs regarding the PMU
as well as awareness-raising campaigns and other
types of lsquosoftrsquo interventions
In summary the logframe provides a structure
that can help organize the data and assumptions
used in EFA elaboration Key data for estimating
costs and benefits and assumptions made
concerning incremental yields adoption rates etc
should be incorporated into the logframe and used
as indicators in the MampE system
While useful EFA cannot provide all relevant
indicators required in the logframe For example
third-level indicators (eg on reduced stunting or
increased HH assets) in IFADrsquos Results and Impact
Management System (RIMS) will still need to be
collected through baseline surveys in the early phase
of implementation
Finally it is important to distinguish output from
outcome indicators in the logframe39 During the
initial years of a project supervision should focus
on the output indicators As project implementation
proceeds the focus should shift to (or at least
include) outcome indicators which provide key data
to compare with the initial EFA assessment
39 A good practice example of a logframe distinguishing between output and outcome indicators is the Project for Agricultural Development and Economic Empowerment in Cambodia (EB 2012105R15Rev1 wwwifadorggbdocseb105eindexhtm) It should be noted that Annual Reports on Quality Assurance in IFADrsquos Projects and Programmes (eg document EB 200998R57) have called attention to imprecise development objectives and lack of quantified final and intermediate outcome indicators to track progress towards achieving objectives This deficiency also affects the quality of EFA and the possibility of using it during project supervision and implementation support Thus improved quality of the logframe can contribute to improving the quality of EFA and to enhancing its use during this phase
EFA in project design Risk analysisEconomic analysis of projects is by definition
built on uncertain future events Estimation of the
basic elements of this analysis (costs and profits)
inevitably involves explicit or implicit probability
judgments In order to contain and measure
the impact of these uncertainties on project
results there are some techniques that help
detect the lsquocritical variablesrsquo or sources of major
risks and set the basis for introducing effective
mitigating measures
The most common tools used in EFA are the
sensitivity analysis (SA) and the switching value (SV)
analysis40 Both enable testing and measurement
of the effect of changes in key project variables on
the final outcomes of our project and hence its
economic indicators (NPV and IRR) Although SA is
frequently used to assess the robustness of projects
and their resilience to shocks its outcomes are
seldom linked to risk analysis
In other words the most relevant question at
this stage is to know how fluctuation in critical
parameters (eg increases in costs delays in
implementation) will affect project performance and
which of the identified risks are the ones that need
close monitoring
Considering the effects of risks and mitigation
measures identified at the project design stage on
EFA results would not only represent a more realistic
approach to assessing the projectrsquos profitability but
would also help identify the nature of those risks
ndash acknowledged but not mitigated by the project ndash
whose existence is regarded as acceptable
In practical terms the SA tests percentage
increases and decreases in estimated benefits and
costs to assess their impact on NPV and IRR while
the SV provides the percentage change in cost
or benefits that will cause project outcomes to fall
below the minimum level of acceptability (NPV lt 0)
40 In volume 2 the IGs also provide information on more sophisticated tools using probabilistic approaches such as Crystal Ball and Risk
27
VOLUME 1 BASIC CONCEPTS AND RATIONALE
Both analyses are extremely useful if linked to
identified project risks For example SV can identify
benchmarks (maximum percentage increases in costs
or decreases in benefits) for lsquotrigger valuesrsquo to activate
specific mitigation measures (eg if the internal price
of a specific input increases to 30 per cent activities
should shift to an alternative crop)
Another way of looking at this analysis is
through the graphic in Figure 6 Here variations
in expected benefits and costs are represented
in the vertical and horizontal axes respectively
Calculation of the switching values of our project
identifies the maximum reduction in benefits (Bmin)
and the maximum increase in costs (Cmax) that
would result in an NPV of zero Thus the switching
value frontier (SVF) represented by the black line
between Bmin and Cmax encloses all possible
combinations of reduction in benefits and increase
in costs that would bring the NPV to zero Implicitly
the area (O Bmin Cmax) represents the set of all the
different combinations of decrease in benefits and
simultaneously increase in costs that would not
endanger project viability
Once the SVF has been identified and after a
proper evaluation of the country context and project
risks and mitigation measures we could eventually
assume that benefits and costs are very unlikely to
attain the levels represented by the two dotted lines
(B0 C0) As a result we narrow down our uncertainty
area defining a lsquosafe zonersquo identified by the blue area
(A) and a lsquorisky zonersquo identified by the orange area
(R) Area A represents the set of combinations that
falls into the viable cases where increases in costs
or decreases in benefits are not jeopardizing the
overall outcome of the project Area R represents all
the diverse combinations of costs and benefits that
will render the project unprofitable (NPV lt 0)
An analysis including probabilistic approaches
could provide a better understanding of the likelihood
that the project would fall into one of the two areas
and thus assess how much at risk it would be if
certain events occurred Details of these types of
analysis can be found in volume 2
Use of SA to assess project risks an example
SA provides grounded information to the design
team to develop effective mitigation measures for
each identified potential risk The first step then
is to add a proxy to the classic table or section on
project risk of the project design report (PDR) ndash a
proxy that responds to the question How will this
risk affect project performance For example if
F IGUR E 6
Identification of the risk zone
0
A
R
Switching value frontier(NPV=0)
Cmax + Costs
- Benefits
B0
Bmin
Cmax
28
VOLUME 1 BASIC CONCEPTS AND RATIONALE
local implementation capacities are low SA can
test how a delay in implementation of one or more
years (a realistic possibility of this risk occurring) will
affect project outcomes Similarly if there is a high
probability of the introduction of import taxes this
can be tested by increasing input costs
The next step is to closely observe the SA results
in order to assess to what extent these events
will change the profitability indicators (ie project
performance) By answering the question Which
variables need to be closely monitored the project
team can easily identify the lsquocritical risksrsquo and better
allocate resources for their mitigation
In the example below (Table 4 and Table 5)
SA shows that this project is more sensitive to
decreases and delays in benefits than to cost
increases Thus although there is a high risk of the
introduction of import taxes on fertilizer this will not
drastically affect project performance On the other
side delays in implementation are a high risk that
could compromise overall project outcomes Project
teams should allocate more efforts and resources to
mitigate this risk rather than others
To summarize EFA analytical tools can contribute
to risk assessment and informed decision-making
for the efficient allocation of project resources when
designing mitigation measures
TA BLE 4
Risk analysis and mitigation measures (classic table prepared for the PDR)
Risk description Probability of occurrence
Mitigation measure Proxy to compare with SA results
Institutional risksLow local implementation capacity
High Capacity-building Delays in benefits
Market risks Import duties on fertilizer High Local production Increased costs
Climate risks Floods Low Infrastructure Reduced benefits
TA BLE 5
Sensitivity analysis for informed decision-making
SA Base case
( 12)
Costs increased Decrease in benefits Delay of benefits
+10 +20 +50 -10 -20 -50 1 year 2 years
IRR 28 27 25 21 22 20 18 23 19
NPV (lsquo000 US$)
37 160 8 068 6 895 3 376 4 047 2 949 1 564 5 173 1 984
29
VOLUME 1 BASIC CONCEPTS AND RATIONALE
EFA in project supervision implementation and ex post evaluationThe underlying principles for the use of EFA in project
implementation are no different from those for project
design and are detailed in a number of old and
well-known sources Squire and van der Tak (1975)
Gittinger (1985) Belli et al (1998) and IFADrsquos draft EFA
guidelines of September 2012 However although the
principles are the same the methods of application
differ to some extent as shown in Table 6
The approach to EFA both before and during
project implementation should be tailored to
the nature of the project What to look for in the
field and the type of analysis undertaken vary
considerably among different project categories
More detailed information is provided in Table 7 in
the technical annex
Ex ante and ex post EFA
It is important to distinguish between ex ante and ex
post EFA and to appreciate their roles in the various
stages of the project cycle Ex ante is the more
familiar form of EFA Undertaken as a key part of the
project design process it is used to inform decision-
making on the nature of the project and its expected
financial and economic impacts Ex post EFA is
undertaken after an investment project has been
completed There are also intermediate forms of
analysis undertaken during project implementation
which are partly ex post and partly ex ante
It is important to distinguish between the
implementation period and the life of the investment
The implementation period typically five to seven
years is the period in which project activities are
undertaken and IFAD funds disbursed The life of
the investment is much longer typically 20 years
or more during which economic and financial
benefits are expected to accrue Figure 7 shows
a typical IFAD project profile with the investment
costs incurred during years 1-5 recurrent costs
over the 20-year project life and benefits beginning
to flow in year 3 and reaching a plateau from
year 10 onwards
TA BLE 6
Application of general principles of EFA
Key principle Methods of application
Ex ante EFA Implementation
With and without project comparison
Prepare lsquobusiness as usualrsquo scenario on the basis of lsquodo nothingrsquo option
bull Conduct baseline survey to define pre-project status
bull Estimate what would have happened without the project
bull Paired comparisons can help (eg inoutside project area)
Financial analysis Construct farm models showing expected revenue and expenditure for beneficiaries
bull Survey beneficiaries to estimate actual revenue and expenditure
bull Validate andor adjust farm models accordingly
Discounting future benefits and costs
Discount future costs and benefits back to year zero
bull Discount future and previous benefits and costs back to year zero
Accounting for externalities
Identify and quantify all externalities where possible
bull Check for signs of positive and negative externalities emerging during implementation
Adjusting for distortions Deduct taxes add subsidies use shadow prices estimate conversion factors
bull Check for changes in tax and subsidy rates and adjust prices accordingly
bull Update conversion factors on the basis of trade andor tariff data
30
VOLUME 1 BASIC CONCEPTS AND RATIONALE
Methodological issues of ex post and
ex ante analysis
The key aspect to understand when performing
this analysis is that as shown in Figure 7 project
costs and benefits will occur in different moments of
project life
Methodologically speaking if this analysis will
be used for comparison of appraised (ex ante) and
real impacts (ex post) (as is generally the goal) we
need to lsquoplacersquo the comparison in the same point in
time The point in time could be at the beginning or
completion of the project or any other point What
is important is to bring all cash flows to that point in
time using discount techniques Then calculate the
NPVs and compare You will be able to use IRRs only
if the cash flow allows it mathematically (ie if there is
a negative Figure in the first year)
But this is not the only consideration to bear in
mind Other issues arise such as
bull Attribution effects of achieved results given
IFADrsquos scale of intervention it could claim
contribution but not full attribution of increased
beneficiary incomes or decline in food insecurity
bull At completion could be too early to capture all
expected benefits (see Figure 7)
bull A mixed approach in order to compensate for
this second issue is to try to estimate benefits
yet to be produced include them in cash flows
and then perform the discounting (however the
results could be questioned)
bull In order to make a realistic comparison CBA
should be done 10 years after implementation
and this has rarely been done
On a more positive note the alternative would be
to choose some activityfarm models effectively
put in place by the project Perform a financial
analysis at completion and compare it with appraisal
estimations (models developed at design for the
WOP situation) in order to estimate how things
have changed This analysis will not be based on
cash flows but on annual bases thus comparing
F IGUR E 7
Profile of costs and benefits over the project cycle
0
20
40
60
80
100
120
Investment costs
Recurrent costs
Benefits
MTR
Supervision EvaluationDesign
PCR
1Years
2 3 4 5 6 7 8 9 10 11 12 13 14 15 16 17 18 19 20
Implementation period years 1-5
Life of the investment years 1-20
31
VOLUME 1 BASIC CONCEPTS AND RATIONALE
annual financial indicators such as total sales total
production costs employment created Hopefully
full development of the model would have been
achieved by completion so as to provide information
on how adequate project interventions had been
This could also potentially provide information on the
reasons underpinning adoption rates
Ex post EFA and scaling upConfronted with the large-scale problem of reducing
rural poverty which it is mandated to address
and the limited resources available from official
development assistance (ODA) IFAD is compelled
to increase the impact of every dollar it invests in
agriculture and rural development For this reason
scaling up the results of successful development
initiatives is an overarching priority that directly
supports the achievement of IFADrsquos mandate To
deliver on this priority IFADrsquos operational practices
must be geared towards supporting all concerned
actors and institutions ndash including poor rural women
and men and their organizations ndash in achieving
impact at scale
The formal IFAD definition of lsquoscaling uprsquo is
expanding adapting and supporting successful
policies programmes and knowledge in order to
leverage resources and partners to deliver larger
more sustainable results for a greater number of
poor rural people Scaling up results means that
IFAD interventions will not be viewed as a way of
expanding small projects into larger ones Instead
they will focus on how successful local initiatives
will sustainably leverage policy changes additional
resources and learning to bring the results to scale
EFA has an important role to play in informing
scaling-up decisions since evidence of favourable
financial and economic impacts should be a key
criterion for deciding whether or not to scale up
Thus the framing questions must incorporate an
economic and financial dimension as follows
bull Idea If a project is referred to as one that is
being scaled up or otherwise further developed
from previous interventions in the host country
or region what were the economic and financial
outcomes of the activity to be scaled up Have
economic and financial impacts been estimated
or measured
bull Vision How many poor rural men and women
will benefit financially and to what extent What
will be the overall economic impact
bull Drivers Are the economic and financial benefits
sufficiently attractive to drive the expansion and
sustain the initiative over the long term
bull Spaces Is there sufficient capacity to finance
the proposed expansion Is the local regional or
national economy large enough to accommodate
it Can markets absorb the level of production
envisaged
bull Pathways What are the financial and economic
implications of alternative scaling-up pathways Is
a gradual or a fast-track approach preferred
bull IFADrsquos role How will IFAD ensure that economic
and financial impacts of the expansion are
properly monitored and evaluated
Scaling-up issues often need to be addressed during
COSOP formulation or country portfolio reviews
especially where grant-funded pilot programmes
have been implemented and are being considered
for scaling up into full-scale investment projects In
these cases EFA of pilot programmes during and
after implementation becomes an important part of
the strategic process
32
Formulas for profitability indicatorsThe net present value (NPV) indicator defined as
the sum that results when the expected costs of the
investment are deducted from the discounted value
of the expected benefits (revenues) is calculated
through the following formula
Where
Bt = benefits at time t Ct = costs at time tIt = investment costs n = project economic life
r = interest rate used as indicator of opportunity
cost discount rate
The internal rate of return (IRR) indicator is defined
as the discount rate (r) that produces a zero NPV
This represents the maximum interest rate that a
project could face and still not waste resources
This is called the internal rate of return (IRR) It is
calculated through
IRR = (r NPV = 0)
For the project to be profitable the IRR has to be
greater than the interest rate that could be earned in
alternative investments thus whenever IRR gt r the
project is considered viable If the (alternative) interest
rate (imkt) is lower than the IRR the NPV is positive
and vice versa
The benefitcost ratio (BC) indicator is the ratio of
the present value of benefits to the present value of
costs over the time horizon The BC ratio provides
some advantages when it is necessary to formulate
a lsquorankingrsquo of alternative investment projects under
budget constraints
If BC ge1 the project is accepted
If BC lt1 the project is rejected
Cost-effectivenessWhen tangible benefits from a given investment
are difficult to quantify but the costs are easily
identifiable the most common valuation method
is cost-effectiveness It is used to select the least
costly alternative among a set of options that will
achieve the same result (a given set of predetermined
objectives) Once the purpose of the project has
been decided for example construction of a market
storage facility cost-effectiveness would be used to
compare scale location technology etc to choose
among investment options (eg open storage
location of the facility construction materials)
The methodology consists in first listing and
measuring in monetary terms the costs of the
options available and then comparing them with
the costs occurring in the base scenario (without
the project) Total costs are then discounted at
year 1 and the results compared to identify the
cheapest intervention In other words valuation by
cost-effectiveness consists in comparing on a
present-worth basis all alternatives that can achieve
the same benefit (Gittinger 1985) and selecting the
least costly
IRR NPV 0gt gti mkt
IRR NPV 0lt lti mkt
IRR NPV 0gt gti mkt
IRR NPV 0lt lti mkt
IRR NPV 0gt gti mkt
IRR NPV 0lt lti mkt
IRR NPV 0gt gti mkt
IRR NPV 0lt lti mkt
Technical annex
33
VOLUME 1 BASIC CONCEPTS AND RATIONALE
Unfortunately the results of this method which
can justify project investment decisions cannot be
integrated into the streams of incremental net benefits
resulting from classic CBA ndash thus underestimating
the overall benefits of the investment
Multicriteria analysis41
MCA is a decision-making tool used to evaluate
complex decision problems With this tool it is
possible to identify overall preferences among
alternative options where the options entail many
diverse objectives Unlike CBA MCA allows
consideration of aspects other than economic and
financial ones for example social technological and
environmental issues Its use is particularly relevant
when other single-criterion approaches cannot
provide monetary valuations42
In the same model thanks to these techniques
it is possible to consider quantitative and qualitative
data It builds on trade-offs between criteria that
in complex decision-making are usually in conflict
(efficiency and equity for example) Choices are
classified aggregating various items of information
in a common index of utility value Since policy
decisions may be influenced by both monetary
and non-monetary objectives it offers a technique
capable of ranking diverse outcomes
MCA establishes preferences among options
referring to a set of objectives identified by decision
makers It is an important instrument for ranking
options and discriminating between acceptable and
unacceptable possibilities Decision makers must
define quantifiable criteria to judge how an objective
has been achieved and MCA allows them to
41 MCA has not yet been tested as a suitable tool for IFAD project design but is suggested as an alternative in the extreme cases mentioned above of complex decision-making
42 One example would be when production objectives are in contraposition to environmental ones For example to increase livestock production for food security and at the same time reduce CO2 emissions
aggregate the data on individual criteria in order to
provide indicators of the overall performance of the
options It brings out the points of view of the actors
involved in the judgment and is characterized by the
subjectivity related to the opinions of the decision-
making group43
The main advantages of MCA are its openness
explicitness and its power to simplify complex
situations In fact it splits the components of
intricate situations and organizes them so as to find
a solution step by step and clearly Objectives and
criteria chosen by the decision group can in fact be
analysed and changed if they are not considered
suitable This process eases the discussion and
promotes communication within the decision-making
body first and later between that body and the
stakeholders MCA can be both an ex ante and an ex
post evaluation tool
This type of analysis also presents some
difficulties One concerns the choice of the activities
or variables to be studied and definition of the
comparative criteria These operations are often
very complicated and require much time spent
in discussions and negotiations Use of MCA
requires knowledge of mathematical notions
data aggregation methodologies and computer
applications in order to perform analysis following a
structured process and to avoid weak conclusions
It is often costly and time-consuming
43 Indeed the opinion team establishes objectives and criteria assesses relative importance weights and judges the contribution of every option to each performance criterion MCA can be preceded by strengths weaknesses opportunities and threats (SWOT) analysis for the choice of criteria it can be supported by an expert panel to help the negotiating group develop an assessment of a specific topic or it can be assisted by focus groups questionnaires and case studies to choose criteria and rate them In addition criteria can be evaluated using cost-effectiveness analysis
34
VOLUME 1 BASIC CONCEPTS AND RATIONALE
Types of projects and EFA activitiesAspects to look for in the field and the type of
analysis undertaken vary considerably among project
categories as shown in Table 7
TA BLE 7
Main EFA tasks by type of project
Project category Main EFA tasks during implementation
Productivity enhancement (including irrigation)
bull Estimate number of beneficiaries and technology adoption rates by target group households
bull Monitor productivity changes product quality and prices
bull Estimate gross margins (per unit of land and labour) for project and non-project households
bull Update farm models based on observedactual results revise economic analysis as necessary and consider adjustments to project design to improve results
Rural infrastructure bull Review construction schedule and costs relative to design estimates
bull Estimate utilization rates for new or upgraded infrastructure
bull Assess arrangements for operation and maintenance
bull Estimate benefits derived by target group households (eg reduced costs increased prices improved market access)
bull Update farm models based on observedactual results revise economic analysis as necessary and consider adjustments to project design to improve results
Natural resource management
bull Undertake a comparison of NRM activities with and without project
bull Review with and without project scenarios of agricultural productivity
bull Seek evidence of more sustainable and responsible NRM practices
bull Identify and if possible quantify value of environmental benefits
bull Update farm models based on observedactual results revise economic analysis as necessary and consider adjustments to project design to improve results
Community development bull Determine number of target group beneficiaries participating in community development activities
bull Identify what has changed in the community and individual households as a result of these activities
bull Describe improvements in the lives of beneficiary households and value these in monetary equivalents if possible
bull Revise economic analysis as necessary and consider adjustments to project design to improve results
35
VOLUME 1 BASIC CONCEPTS AND RATIONALE
Project category Main EFA tasks during implementation
Institutional strengthening bull Prepare inventory of actual institutional-strengthening activities undertaken
bull Complete assessment of institutional capacity and projectrsquos impact on it
bull Identify how improved institutional capacity has or will generate benefits for target groups
bull Revise economic analysis as necessary and consider adjustments to project design to improve results
Marketing and value chain development
bull Review value chain analysis undertaken during project preparation to update data on volumes costs prices and value addition
bull Identify ways in which improvements in value chain efficiency have improved or are likely to improve market access and farmgate prices for beneficiaries
bull Estimate financial benefits accruing to target group farmers and other value chain actors
bull Update farm models based on observedactual results revise economic analysis as necessary and consider adjustments to project design to improve results
Rural financial services bull Estimate number of beneficiaries with improved access to financial services types of services offered and acceptance rates
bull Monitor cost of financial services at different levels (cost of loanable funds retail service costs at client level) and compare with project design estimates
bull Assess actual or likely changes in farm and non-farm economic activities arising from improved access to rural financial services
bull Estimate the net financial benefits accruing to target group beneficiaries from these changes
bull Update farm models based on observedactual results revise economic analysis as necessary and consider adjustments to project design to improve results
36
Anandajayasekeram P CJ Van Rooyen F Liebenberg 2004 Agricultural project planning and analysis A sourcebook Second Edition Network Activity Program ndash Institutional University Cooperation (IUC) between the Flemish Universities of Belgium and University of Pretoria
Asian Development Bank 2013 Cost-benefit analysis for development A practical guide Manila httpwwwadborgdocumentscost-benefit-analysis-development-practical-guide
Australian Department of Infrastructure and Planning Queensland Government 2012 Project assurance framework ndash Cost benefit analysis guidelines Brisbane Queensland Australia
Belli P J Anderson H Barnum J Dixon and J-P Tan 1998 Handbook on economic analysis of investment operations Washington DC Operational Core Services Network Learning and Leadership Center World Bank httpsiteresourcesworldbankorgINTCDDResourcesHandbookEApdf
Belli P 2001 Economic analysis of investment operations Analytical tools and practical operations Washington DC World Bank
Campell H R Brown 2003 Benefit cost analysis financial and economic appraisal using spreadsheet Cambridge University Press
CIFOR 1999 Guidelines for applying multi-criteria analysis to the assessment of criteria and indicators Bogor Indonesia Center for International Forestry Research wwwcifororgacmmethodstoolbox9html
Department for Communities and Local Government 2009 Multi-criteria analysis A manual London httpeprintslseacuk127611Multi-criteria_Analysispdf
DFID 2011 Guidance for country offices on measuring and maximising value for money in cash transfer programmes London Department for International Development (UK)
European Commission 2008 Guide to cost-benefit analysis of investment projects Brussels httpeceuropaeuregional_policysourcesdocgenerguidescostguide2008_enpdf
FAO 1979 Economic analysis of forestry projects Case studies FAO Forestry Paper No 17 Supp 1 Rome Food and Agriculture Organization of the United Nations
FAO 1995 Guidelines for the design of agricultural investment projects Investment Centre Technical Paper No 7 Rome Food and Agriculture Organization of the United Nations
FAO 2010 Estimating mitigation potential of agricultural projects An application of the EX-ante carbon balance tool (EX-ACT) in Brazil Rome Food and Agriculture Organization of the United Nations
Gittinger J Price 1985 Economic analysis of agricultural projects Washington DC Economic Development Institute World Bank httpdocumentsworldbankorgcurateden198501437966economic-analysis-agricultural-projects
Government of South Africa 2004 Cost-benefit analysis Pretoria Department of Environmental Affairs and Tourism
IFAD 2012 Review of post-harvest systems in IFAD programmes Rome
Jenkins G C Kuo A Harberger 2011 Cost-benefit analysis for investment decisions httpwwwqueensjdiexecorgpublicationsqed_dp_206pdf
Lewis DL 1999 Road user and mitigation costs in highway pavement projects Washington DC Transportation Research Board National Research Council
Mishan EJ 1971 Cost-benefit analysis London George Allen and Unwin
Potts D 2002 Project planning and analysis for development httpswwwriennercomtitleProject_Planning_and_Analysis_for_Development
Raswant V and E Heinemann 2012 Access to markets Making value chains work for poor rural people Rome IFAD
Squire L and HG van der Tak 1975 Economic analysis of projects Baltimore MD USA Johns Hopkins University Press
References
37
VOLUME 1 BASIC CONCEPTS AND RATIONALE
Treasury Board of Canada 2007 Canadian cost-benefit analysis guide Ottawa Secretariat Treasury Board of Canada analys-engpdf
UNIDO 1972 reprinted 1993 Guidelines for project evaluation Order No IDSERH2 Vienna United Nations Industrial Development Organization
UNIDO 1986 Manual for evaluation of industrial projects Vienna United Nations Industrial Development Organization wwwunidoorgfileadminuser_mediaPublicationsdownloadManual_for_Evaluation_of_Industrial_Projectspdf
USAIDINDIA 2000 REFORM Project compendium with practitionersrsquo guide State fiscal management reform Vol V Project appraisal practitionersrsquo guide New Delhi US Agency for International DevelopmentIndia httppdfusaidgovpdf_docsPNADM777pdf
World Bank 2013 Investment Project Financing Economic Analysis Guidance Note httpsiteresourcesworldbankorgPROJECTSResources40940-1365611011935Guidance_Note_Economic_Analysispdf
World Bank 2012 A guide to assessing needs Essential tools for collecting information making decisions and achieving development results by Watkins R Meiers M amp Visser Y httpsopenknowledgeworldbankorgbitstreamhandle109862231663920PUB0EPI00essing09780821388686pdfsequence=1
38
Glossary
Aggregation 15 16 20 in project analysis the process of adding together the costs and benefits of all the entities participating in a project to reach a summary account from which a measure of project worth can be derived Often the result of the aggregation is the Incremental Net Benefit or Cash Flow of a project
Appraisal 7 24 31 A before the fact (ex- ante) evaluation of a proposed investment project to determine its merit and acceptability in accordance with established decision-making criteria
Benefitcost ratio (BC ratio) 13 33 a discounted measure of project worth The ratio of benefits to costs It should be calculated using the present values of each discounted at an appropriate discount rate Most often the opportunity cost of capital The ratio should be at least 1 for the project to be acceptable It may give incorrect ranking among independent projects and cannot be used for choosing among mutually exclusive alternatives
Border price 23 The border price is the unit price of a traded good at the countryrsquos border For exports it is the FOB (free on board) price and for imports it is the CIF (cost insurance and freight) price
Business as Usual (BAU) 8 9 11 14 19 a reference scenario which assumes that future evolution is an extension of the current trends See also lsquodo nothing scenariorsquo
Cash flow 11 12 16 19 20 31 The funds generated or used by the project Reflects the costs and benefits over time from a stated point of view Incomebenefit is a positive cash flow and expensescosts are negative flows
Constant price A price that has been deflated to real terms by an appropriate price index They should be distinguished from current or nominal prices Often used as synonym of real prices
Contingent valuation A method of inferring the value of benefits and costs in the absence of a market What people would be willing to pay to gain a benefit (or willing to accept in recompense for a loss) if a market existed for the good
Conversion factor 5 16 23 30 the factor that converts the domestic market price to an economic price Conversion factors are the ratios of economic to financial prices Thus a conversion factor is a number that is used to convert the domestic market price of an item into its economic opportunity cost to the
economy by multiplying the market price of the item by the conversion factor
Cost An expense related to purchase of inputs including capital equipment buildings materials labour and public utilities Costs such as environmental damage or injuries to health are sometimes referred to as negative externalities
Cost Benefit Analysis (CBA) 7 8 18 31 conceptual framework applied to any systematic quantitative appraisal of a public or private project to determine whether or to what extent that project is worthwhile from a social perspective Cost-benefit analysis differs from a straightforward financial appraisal in that it considers all gains (benefits) and losses (costs) to social agents CBA usually implies the use of economicsocial prices
Cost effectiveness analysis (CEA) 20 33 an appraisal technique used in projects and programs in which benefits cannot be reasonably measured in money terms Cost-effectiveness analysis is used in one of two forms to select least-cost alternatives either holding constant the level of benefits and varying the level of costs or holding constant the level of cost and varying the level of benefits In either form the ratio of cost to benefits is known as the cost-effectiveness ratio
Current prices (Nominal prices) prices as actually observed at a given time They refer to prices that include the effects of general inflation and should be contrasted with constant prices
Cut-off rate the rate below which a project is considered unacceptable It is often taken to be the opportunity cost of capital The cut-off rate would be the minimum acceptable internal rate of return for a project or the discount rate used to calculate the net present value the net-benefit investment ratio or the benefit-cost ratio
Depreciation 14 Not a term used in cost-benefit analysis In other financial frameworks depreciation is the allocation of the cost of an asset over time Depreciation is a method of allocating the cost of a tangible asset over its useful life For accounting purposes depreciation indicates how much of an assetrsquos value has been used up For intangible assets amortization is the correct term However these are accounting concepts that makes no sense in financial analysis Here the full investment costs will be computed every time the asset needs replacement
39
VOLUME 1 BASIC CONCEPTS AND RATIONALE
Direct transfer payment 15-17 Transfer payments are transfers of money among residents of a country without a corresponding exchange of goods and services Taxes are transfer payments from individuals to the government Subsidies are transfer payments from the government to individuals Gifts are transfers ldquoin kindrdquo from one individual to another Because transfer payments are not made in return for goods and services they do not add to total output When transfer payments occur in the context of projects they redistribute project costs or benefits from the project entity to some other group or individual in the country
Discount rate 12 14 16 23 the interest rate at which future values are discounted to the present It usually represents the cost of capital for the person or entity calculating the net present value of the stream The financial discount rate and economic or social discount rate may differ in the same way that market prices may differ from economic prices The selection of the discount rate in financial analysis is a relative straightforward process and that is calculated as the potential gains of alternative safe investments on the market In economic analysis where project viewpoint is overturned toward the socio-economic context this parameter needs to be estimated properly so as to i) reflect the public nature of the investment ii) account for scarcity of resources and iii) ensure good use of public funds (See also social discount rate)
Discounted cash flow 14 The costs and benefits (cash flows) discounted to present values to give a common basis for comparison
Discounting 12 31 The process of adjusting future values to an equivalent present value at a stated point in time by a discount rate
Distortion 16 30 A difference between market prices and true values (economic prices) A distortion is any interference with market forces that renders the resulting quantity produced and price different from the price and quantity that would result under conditions of perfect competition
Distributional effect A change in the income or wealth of the people from whose point of view the benefit-cost analysis is done
Do nothing scenario the baseline scenario lsquobusiness as usualrsquo against which the additional benefits and costs of the lsquowith project scenariorsquo can be measured (often a synonym for the lsquowithout projectrsquo scenario)
Economic analysis 7 14-17 20 30 analysis that is undertaken using economic values reflecting the values that society would be willing to pay for a good or service In general economic analysis values all items at their value in use or their opportunity cost to
society (often a border price for tradable items) It has the same meaning as social cost-benefit analysis
Economic cost The economic cost of an activity or resource is the cost to society of that activity or resource Economic costs include the private costs borne directly by economic agents undertaking the activity and all other costs borne by other economic agents For example the economic costs of driving automobiles include the private costs of petrol plus the additional costs of congestion borne by other users of the roads plus the costs of pollution borne by society in general
Economic impact analysis the analysis of the total effects on the level of economic activity (output income employment) associated with the intervention This kind of analysis focuses on macroeconomic indicators and forecasts the influence of the project on these indicators It goes beyond CBA when very large projects are considered in relatively small economies
Economic net present value (ENPV) 16 The net present value of a project calculated using true or economic values Synonymous with social net present value
Economic price 16 Price that reflects the relative value that should be assigned to inputs and outputs if the economy is to produce the maximum value of physical output efficiently There is no consideration of income distribution or other non-efficiency goals in such a price Synonymous with efficiency price and true price
Economic rate of return (ERR) 16 An internal rate of return based on economic prices and social opportunity costs of capital expressing the socio-economic profitability of a project (See internal rate of return)
Environmental impact analysis the statement of the environmental impact of a project that identifies its physical or biological effects on the environment in a broad sense This would include the forecasting of potential pollution emissions loss of visual amenity and so on
Export parity price 23 footnote The export parity price is the FOB price of a good or service valued at point of export net of taxes and subsidies and suitably adjusted for internal transport costs to a location in a country The export parity price is the net-of-taxes-and-subsidies price that exporters would need to receive for a good or service sold in the domestic market in order to make them indifferent between selling in the domestic market or exporting
Externalities 5 15-17 30 A benefit or cost falling on third parties who normally cannot pay or be compensated for it through a market mechanism An external benefit is a positive externality an external
40
VOLUME 1 BASIC CONCEPTS AND RATIONALE
cost is a negative externality A positive externality may reduce the costs of a production process of an unrelated economic agent as when the bees of a bee grower pollinate a neighbourrsquos apple orchard They may also increase the enjoyment of another economic agent as when musicians playing for their own pleasure delight those around them A negative externality increases the production costs or reduces enjoyment for another economic agent Traffic congestion and the numerous forms of environmental pollution such as the pollution created by a manufacturing plant are examples of negative externalities Externalities are not reflected in the financial analysis For economic analysis however it is necessary to take such externalities into account and place a value on them
Ex-ante evaluation 24-25 30 the evaluation carried out in order to take the investment decision It serves to select the best option from the socio economic and financial point of view It provides the necessary base for the monitoring and subsequent evaluations ensuring that wherever possible the objectives are quantified
Ex-post evaluation 24-25 30-32 an evaluation carried out a certain length of time after the conclusion of the initiative It consists of describing the impact achieved by the initiative compared to the overall objectives and project purpose (ex-ante)
Farm gate price The price received by farmers for their products net of transport costs to the market where the products are sold
Feasibility study 9 19 a study of a proposed project to indicate whether the proposal is attractive enough to justify more detailed preparation It contains the detailed technical information necessary for the financial and economic evaluation
Financial analysis 7 14-17 19 30 31 the analysis carried out using market prices and taking a commercial point of view It allows one to 1) verify and guarantee cash balance (verify the financial sustainability) 2) calculate the indices of financial return on the investment project based on the net discounted cash flows
Financial sustainability analysis 14 19 20 analysis carried out in order to verify that financial resources are sufficient to cover all financial outflows year after year for the whole time horizon of the project Financial sustainability is verified if the cumulated net cash flow is never negative during all the years considered
Financial rate of return An internal rate of return based on market prices and opportunity costs of capital(See internal rate of return)
Human capital Human capital is the stock of skills and productive knowledge embodied in people The
purpose of investing in human capital is to improve the productivity of human beings
Impact 25-27 a generic term for describing the changes or the long term effects on society that can be attributed to the project Impacts should be expressed in the units of measurement adopted to deal with the objectives to be addressed by the project
Import parity price 23 footnote The import parity price is the CIF price of a good or service valued in a specific geographical location It includes the CIF price of the good suitably adjusted for transport costs net of taxes and subsidies The import parity price aims to measure the price that producers in the country would receive for a good or service produced in the country for sale in the domestic market under conditions of free trade
Incremental 11-14 19-20 Additional or marginal
Inflation A general increase in market price levels (a fall in the general purchasing power of the currency unit)
Input 26 28 That which is consumed by the project (as opposed to the projectrsquos output) Usually refers to the physical inputs used by the project including materials capital labour and public utilities Inputs like environmental quality foreign exchange and workersrsquo health are usually termed externalities
Internal rate of return (IRR) 12 33 The yield or profitability of a project based on discounted cash-flow analysis The IRR is the discount rate at which a stream of costs and benefits has a net present value of zero It is equivalent to the discount rate r that satisfies the following relationship
IRR NPV 0gt gti mkt
IRR NPV 0lt lti mkt
where Bt is the benefit stream and Ct is the cost stream The internal rate of return is compared with a benchmark in order to evaluate the performance of the proposed project The internal rate of return is then compared with the market rate of interest to determine whether or not a proposed project should be undertaken (See cut-off rate)
Financial Rate of Return is the internal rate of return calculated when all the inputs and outputs are calculated using financial values Economic rate of Return is based on economic opportunity costs
Logframe 10 25-27 is a management tool mainly used for designingand MampE of development projects It consists of four steps (1) establishing objectives (2) establishing cause-and-effect relationships (causal linkages) among activities inputs outputs and objectives (3) identifying assumptions underlying the causal linkages and (4) identifying objectively-verifiable measures for evaluating progress and success
41
VOLUME 1 BASIC CONCEPTS AND RATIONALE
Market price 14-17 (a) The price of a good in the domestic market (see financial prices) as opposed to the economic price shadow price or social price (b) the cost of a good including indirect taxes and subsidies It is the price relevant for financial analysis
Model A representation or simulation of a system or process showing how parameters benefits and costs interact to produce a bottom-line result by which the project can be judged
Monitoring 25-27 the systematic examination of the state of advancement of an activity according to a pre-determined calendar and on the basis of significant and representative indicators
Multi-criteria analysis 22 34 MCA is an evaluation methodology that considers many objectives by the attribution of a weight to each measurable objective In contrast to CBA that focuses on a unique criterion (the maximisation of social welfare) Multi Criteria Analysis is a tool for dealing with a set of different objectives that cannot be aggregated through shadow prices and welfare weights as in standard CBA
Mutually exclusive 8 12 13 Alternatives that cannot be undertaken simultaneously if one alternative is carried out the other cannot be The alternatives may be mutually exclusive because they represent alternative times of beginning the same project because funds are limited or because if one is carried out the other will not be required (for example a choice between a thermal and a hydro power station)
Net present value (NPV) 12 13 27-29 33 The net value of an investment when all costs and benefits expressed in standard units of value (numeraires) are summed up The sum that results when the discounted value of the expected costs of an investment are deducted from the discounted value of the expected revenues The net present value of a stream of costs and benefits is a number that results from discounting the values of the stream at a given discount rate It is equivalent to the number that results from the following expression
IRR NPV 0gt gti mkt
IRR NPV 0lt lti mkt
whereBt = benefits at time t Ct = costs at time tIt = investment costs n = project economic lifer = discount rate
Net revenues the amount remaining after all outflows have been subtracted from all inflows Discounting the incremental net revenues before financing gives a measure of the project worth of all resources engaged discounting the incremental net revenues after financing gives a measure of the project worth of the entityrsquos own resources or equity
Nominal prices Prices prevailing in a particular year Synonymous with budget-year dollars
Non-tradable good 16 23 footnote good or service that by its very nature cannot be exported or imported Land and buildings are examples of a non-tradable good
Non-traded good 16 23 footnote A non-traded good or service is one that is neither exported nor imported in a particular country for a variety of reasons including quotas and prohibitions Common examples of non-traded items are certain drugs haircuts etc In project analysis non-traded refers to goods and services not traded by the country in which the project is located
Numeraire a standard unit of value Money is a numeraire by which the values of different commodities can be compared In cost-benefit analysis the numeraire is the common denominator for measuring benefits and costs Widely used numeraires are the willingness to pay or aggregate consumption numeraire and the foreign exchange numeraire
Operational and maintenance costs 21 35 The recurring costs for operating and maintaining the value of physical assets
Opportunity cost 12 16 19 The best alternative return foregone elsewhere by committing assets to the project The value of something foregone For example the direct opportunity cost of a person-day of labour is what the person would otherwise have produced or being paid for that day of work The value of a resource in its best alternative use For the financial analysis the opportunity cost of a purchased input is always its market price In economic analysis the opportunity cost of a purchased input is its marginal social value in its best non-project alternative use
Output 27 That which is produced Usually refers to the physical product of the project Other effects of the project such as housing for workers employment training of labour and foreign-exchange savings are usually called externalities
Payback period The time required for the cumulative present value of benefits to become equal to the cumulative present value of costs
Programme 8 is a portfolio of multiple projects that are managed and coordinated as one unit with the objective of achieving common (often intangible) outcomes and benefits at sector country or even multi-country level
Project 8 is a temporary entity established to deliver specific (often tangible) outputs in line with predefined time cost and quality constraints A project should always be defined executed and evaluated relative to an approved business plan which balances its costs benefits and risks
42
VOLUME 1 BASIC CONCEPTS AND RATIONALE
Project analysis 8 20 the analytical framework for the evaluation of a projectrsquos feasibility and performance It includes the analysis of the context the objectives technical aspects demand forecasts and financial and economic costs and benefits Project analysis is needed to determine if given the alternatives a proposed project will sufficiently advance the objectives of the entity from whose standpoint the analysis is being undertaken to justify the project
Project cycle 24-25 30-31 a sequence of the series of necessary and pre-defined activities carried out for each project Typically it is separated into the following phases conceptualization inception formulation appraisal ex-ante evaluation financing implementation and ex-post evaluation
Real prices calculated by adjusting market prices by an appropriate price index to eliminate the effects of inflation Prices of goods and services change over time either because the general price level rises that is because of inflation or because the underlying conditions of supply and demand change Real prices refer to prices of goods and services that reflect changes in the underlying conditions of supply and demand but that do not reflect the effects of inflation The terms real prices and constant prices are used interchangeably but referring to real prices as constant prices is misleading Real prices do not necessarily remain constant over time as they change in response to changes in supply and demand Real prices should be distinguished from current prices which reflect inflation as well as changes in supply and demand
Relative prices the exchange value of two goods given by the ratio between the quantity exchanged and their nominal prices
Risk 10 25-27 The degree to which outcomes are uncertain The extent of possible variation in the outcome
Risk analysis 10 25-27 Risk analysis is a technique for assessing the expected net present value of a project in relation with project risks By taking into account the probability distribution of critical variables and the correlations among them it enables analysts not only to assess the expected net present value of a project but also its associated probability distribution In cost-benefit analysis it recognizes the simultaneous variation of the values of several inputs according to specified ranges and probabilities and analyses the resulting variability in the bottom line
Scale 31-33 The size of a project
Scenario 11 14 30 An outline or portrait of a possible future usually portrays unfolding events rather than being static in time
Sensitivity analysis 16 27-29 Sensitivity analysis is an analytical technique to test systematically the
effects on a projectrsquos outcome of changes in its basic assumptions Sensitivity analysis is carried out by varying one element or a combination of elements and determining the effect of that change on projectrsquos profitability indicators (NPV and IRR)
Shadow price 16 23 footnote 30 A shadow price of a good or service is the economic opportunity cost to society of that good or service The true or economic value of a good (as opposed to the market price which might be distorted) Synonymous with economic or social price
Social price 16 A price that reflects the true value to the country of inputs and outputs of the project Synonymous with economic price and shadow price
Social discount rate 12 footnote 16 It attempts to reflect the social view on how the future should be valued against the present (See Discount rate)
Socio-economic costs and benefits 13 opportunity costs or benefits for the economy as a whole They may differ from private costs and benefits to the extent that actual prices differ from economic prices
Switching value 27-28 The switching value of a variable is that value that it would have to attain in order for the outcome of the project to fall below the minimum level of acceptability (net present value of the project equal to nil)
Time value of money Time value of money refers to the concept that money received in the present is more valuable than money received in the future It is the concept underlying discounting
Tradable 16 23 footnote Referring to a good that could be traded internationally in the absence of restrictive trade policies
Traded good 16 23 footnote A traded good is a good that is either exported or imported by some country
Transfer payments 15-17 22 Payments that redistribute wealth but do not use up resources or create them
Willingness to pay What consumers are willing to pay for a good or service Consumers willing to pay substantially more than the actual market price enjoy a consumer surplus (the amount they would pay minus the amount they actually have to pay)
With project scenario (WP) 11 Box 2 estimation simulation modelling of project envisaged costs and benefits
Without project scenario (WOP) 11 Box 2 the baseline scenario against which the additional benefits and costs of the with project scenario can be measured (eg business as usual)
43
VOLUME 1 BASIC CONCEPTS AND RATIONALE
Steps in economic analysis
Economic analysis requires assessment of a projectrsquos net impact on economic welfare
by considering
5 Convert all market prices into economicshadow prices (SP) that better reflect the social
opportunity cost of the good
6 Remove transfer payments (taxes and subsidies) and quantify externalities (positive
and negative)
7 Aggregate all modelsrsquo NIB cash flows respecting incorporation phasing patterns of targeted
beneficiaries into projectrsquos activities
8 Compare aggregated benefits with other project costs to obtain incremental discounted
cash flows Calculate economic performance indicators adopting a social discount rate
ENPV ERR BC ratio
9 Perform sensitivity analysis (SA) in order to deal with the main risks and uncertainties that
could affect the proposed project
Steps in financial analysis
The typical sequence of tasks to be undertaken in financial analysis is the following
1 Develop farmenterprise models and identify benefits and costs (investment and recurrent) for
WOP and WP scenarios (based on crop budgets)
2 Compare the discounted flows of benefits and costs and calculate the differences between the
obtained results and the WOP scenario in order to determine the net incremental benefits (NIB)
of the proposed interventions
3 Calculate the project financial profitability indicators of each model (ie financial NPV financial
IRR and BC ratio) applying these investment criteria to make an investment decision
(positive or negative)
4 Assess family incomes and establish financingcredit needs by performing a lsquosustainability analysisrsquo
Summary steps in financial and economic analysis
44
WP-WOP develop and identify
Develop farmenterprise models and identify benefits and costs (investment and recurrent) for WOP and WP scenarios (based on crop budgets)
Calculate indicators
Calculate the project financial profitability indicators of each model (ie financial NPV financial IRR and BC ratio) applying these criteria to make an investment decision
Financial sustainability
Assess family incomes and establish credit needs by performing a lsquosustainability analysisrsquo
Discount flows ndash costs and benefits
Compare the discounted flows of benefits and costs and calculate the differences between the obtained results and the WOP scenario in order to determine the net incremental benefits (NIB) of the proposed interventions
Shadow prices
Convert all market prices into economicshadow prices (SP) that better reflect the social opportunity cost of the good
Aggregation
Aggregate all modelrsquos NIB cash flows respecting incorporation phasing patterns of targeted beneficiaries
Cash flows
Compare aggregated benefits with other project costs to obtain incremental discounted cash flows Calculate economic performance indicators adopting a social discount rate ENPV ERR BC ratio
Transfers and externalities
Deduct taxes and subsidies ndash Consider positive and negative externalities
Perform sensitivity analysis
in order to deal with the main risks and uncertainties that could affect the proposed project
1
5
6
7
8
9
2
3
4
Economic analysisFinancial analysis
EFA step by step
International Fund for Agricultural Development
Via Paolo di Dono 44 - 00142 Rome ItalyTel +39 06 54591 - Fax +39 06 5043463E-mail ifadifadorgwwwifadorgwwwruralpovertyportalorg
ifad-unblogspotcom
wwwfacebookcomifad
instagramcomifadnews
wwwtwittercomifadnews
wwwyoutubecomuserifadTV
Contacts EFA desk
Eloisa de Villalobos Thomann
EFA Technical Adviser Tel +39 06 5459 2827Email edevillalobosifadorg
Enrico Mazzoli
Technical Adviser Tel +39 06 5459 2462Email emazzoliifadorg
- Acknowledgements
- Contents
- Abbreviations and acronyms
- Section I - Introduction
-
- Background
- Scope
- Outline
- How to read the guidelines
-
- Section II - Relevance of EFA
-
- Relevance of economic and financial analysis
- EFA as a decision-making tool in project planning
-
- Section III - Basic concepts in undertaking EFA
-
- Investment criteria profitability indicators
- Economic and financial analysis the differences
-
- Section IV - EFA of IFAD rural
-
- Focusing on lsquotypicalrsquo IFAD rural investment projects and their main benefits
- Unquantified benefits alternative methodologies to CBA
- EFA data sources collection and coherence
-
- Section V - EFA role throughout
-
- EFA in project design Links with the logframe and MampE
- EFA in project design Risk analysis
- EFA in project supervision implementation and ex post evaluation
- Ex post EFA and scaling up
-
- Technical annex
-
- Formulas for profitability indicators
- Cost-effectiveness
- Multicriteria analysis
- Types of projects and EFA activities
-
- References
- Glossary
- Summary steps in financial and economic analysis
-
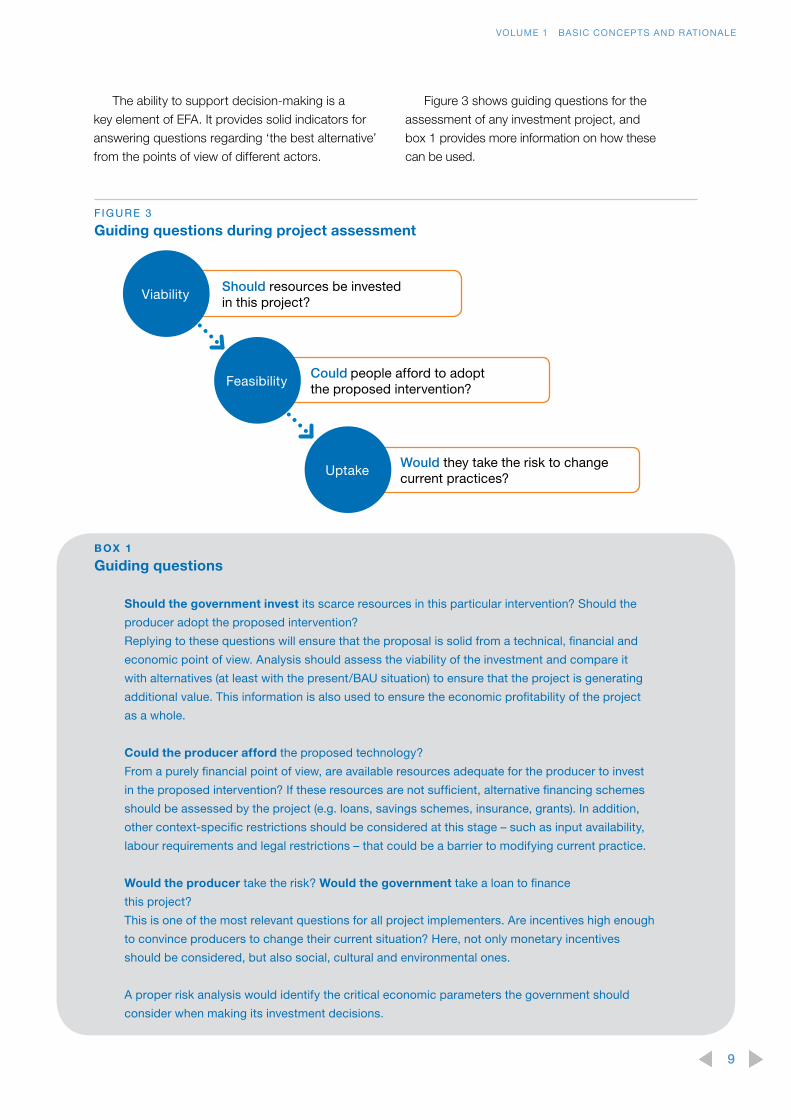
VOLUME 1 BASIC CONCEPTS AND RATIONALE
F IGUR E 3
Guiding questions during project assessment
Should resources be invested in this project
Could people afford to adopt the proposed intervention
Would they take the risk to change current practices
Viability
Feasibility
Uptake
BOX 1
Guiding questions
Should the government invest its scarce resources in this particular intervention Should the
producer adopt the proposed intervention
Replying to these questions will ensure that the proposal is solid from a technical financial and
economic point of view Analysis should assess the viability of the investment and compare it
with alternatives (at least with the presentBAU situation) to ensure that the project is generating
additional value This information is also used to ensure the economic profitability of the project
as a whole
Could the producer afford the proposed technology
From a purely financial point of view are available resources adequate for the producer to invest
in the proposed intervention If these resources are not sufficient alternative financing schemes
should be assessed by the project (eg loans savings schemes insurance grants) In addition
other context-specific restrictions should be considered at this stage ndash such as input availability
labour requirements and legal restrictions ndash that could be a barrier to modifying current practice
Would the producer take the risk Would the government take a loan to finance
this project
This is one of the most relevant questions for all project implementers Are incentives high enough
to convince producers to change their current situation Here not only monetary incentives
should be considered but also social cultural and environmental ones
A proper risk analysis would identify the critical economic parameters the government should
consider when making its investment decisions
The ability to support decision-making is a
key element of EFA It provides solid indicators for
answering questions regarding lsquothe best alternativersquo
from the points of view of different actors
Figure 3 shows guiding questions for the
assessment of any investment project and
box 1 provides more information on how these
can be used
9
VOLUME 1 BASIC CONCEPTS AND RATIONALE
The various steps in EFA provide information
to respond to these questions taking into account
that the decision is not simple projects require time
to develop and one wants to make certain that the
improvements in peoplersquos lives are permanent
EFA requirements technical and
institutional viability
EFA is only one part of the overall analysis of a
project it assumes that the project is technically
sound and that its institutional arrangements will
be effective during implementation In other words
EFA of investment projects requires at the least
that the project under analysis be feasible from the
technical and institutional points of view Projects
can be implemented through different institutional
arrangements and using different technical solutions
For a project to be viable at least one of these
institutional arrangements needs to be valid and at
least one technical solution needs to be viable As
will be seen the application of EFA during project
formulation will also help identify and select the lsquobestrsquo
project technical and institutional alternatives This
is a strong assumption as the review of numerous
cases has shown many inconsistencies in project
technical formulation
Commonly identified inconsistencies include
(a) incomplete or inadequate description of the
institutional arrangements for carrying out the
proposed project components (b) incomplete or
inadequate identification of constraints on productive
development For example the project (i) proposes
a new technology but there is no assessment
of the on-farm working capital requirements for
adopting it and consequently the project lacks the
required financing component (eg grants credit)
(ii) plans huge investments in irrigation facilities
but no provision has been made for the required
technological transfer services and working capital
needs (iii) proposes improvement of rural financial
services but there is no description of the expected
productive activities and technologies to be adopted
through the support of these facilities
Thus reviews of the technical proposals and
institutional arrangements for project implementation
are steps prior to EFA They involve preparation of an
adequate project logframe (reviewed at each stage
of the project cycle) which is essential in confirming
institutional viability
10
This section illustrates basic concepts so that the
non-specialist can become more familiar with the
terminology and purpose of EFA However detailed
information on carrying out EFA of projects is
provided in volume 2 of these guidelines
EFA is based on comparison of the net6 cash
flows of investment alternatives The present or
BAU cash flow is compared with at least one
other investment alternative which according
to the projectrsquos technical specialists will result in
amelioration of the producerrsquos situation
6 Net cash flows defined as Benefits discounted cash flow net from costs discounted cash flows
However in order to assess if the project is
making good use of public funds the costs of
implementing it (including the institutional setting
and capacity-building of both implementers and
producers) must be compared with the benefits
produced In other words the value added by the
project is compared with the incremental costs of
implementing it
In practical terms the analyst models diverse
beneficiary livelihood strategies to compare BAU
situations with the project proposal Description
of the BAU or without project (WOP) situation
although simple at first sight can confuse the analyst
regarding many aspects (box 2)
BOX 2
With project (WP) and without project (WOP) scenarios common issues
Accurate description of both WP and WOP scenarios is essential to a realistic assessment of
incremental benefits
1 WOP equal to zero When the project proposes development of a new activity many analysts
represent the WOP as a null scenario because the activity wasnrsquot present in the past
However the correct approach is to realistically represent the alternative activities
(eg off-farm employment)
2 Static or unrealistic WOP Generally WOP scenarios are presented as a static situation that
repeats itself through the years This is often underestimating the capacity of people to adapt
and progress Projects generally assist these processes and accelerate their returns
3 An inaccurate WP fails to assess the incremental net value of the project In a woodlot project
in Malawi that aimed to produce firewood analysts spent a great deal of time studying how
to value the incremental wood production since there was no market for the wood Finally
they decided on an international valuation of the energy created They missed the point In
the without situation women spent a great deal of time travelling to procure firewood with
the project they could spend their time producing more maize If the analysts had developed
realistic WOP and WP situations they would have realized that the benefits of the project
came from incremental maize not wood production
Basic concepts in undertaking EFA
SECTION III
11
VOLUME 1 BASIC CONCEPTS AND RATIONALE
Next one needs to formulate the WP situation
defining expected outcomes in the future by
identifying the requested investment and operating
costs as well as projecting estimated benefits7 In
order to convert future costs and benefits which do
not occur at the same time into todayrsquos values for
comparison discounting techniques are applied
Discounting permits comparison of the value of
money in different time periods considering that
a dollar today is worth more than a dollar received
tomorrow (ie the fact that we have to postpone
consumption makes tomorrowrsquos dollar less valuable
than todayrsquos) How much is $1 received in lsquonrsquo years
worth today The answer depends on the adopted
discount rate (r) and the discount period (n)8
Thus the aggregation of project flows occurring
in different years requires adoption of an appropriate
discount rate to calculate the present value of future
flows As a guiding principle discount rates should
represent the opportunity cost of capital for the
agent (producer or government)9 The other essential
element in discounting is definition of the discount
period (also called lsquoproject economic lifersquo or lsquotime
horizon analysisrsquo)
Usually the discount period is equivalent to the
lifespan of the largest investment components of
the project10
Finally the project net cash flows (ie financial
andor economic)11 are based on the incremental
approach which results from comparing the
WP and WOP situations With these elements it
is possible to calculate the corresponding project
lsquoprofitability indicatorsrsquo
7 The analysis is looking at future investments and outcomes thus sunk costs are irrelevant
8 The present value (PV) = future value(1+r)n If r = 10 and n = 8 years the present value of $1 would be $051
9 For the producer a realistic alternative is an average of the passive deposit rate of local commercial banks The government should instead consider the interest rate at which the country can actually borrow capital from a relevant international capital market alternatively the return on long-term public treasury bonds is also a suitable option More information on determining a relevant discount rate is provided in volume 2
10 This rule might change when (i) technological progress would make the investment obsolete before the end of its useful life (ii) the investment period is lsquotoo longrsquo (ie very common in environmental projects ship construction etc) or (iii) other factors exist (ie legal institutional etc) that justify another specific choice for the discount period
11 See the following subsection for differences between the two
Investment criteria profitability indicatorsGenerally speaking a project is considered lsquoviablersquo
if the sum of expected incremental benefits is
larger than the sum of all costs accrued in project
implementation This can be assessed through
profitability indicators12 The most relevant indicators
for these IGs are the net present value internal rate
of return and benefitcost (BC) ratio
bull The net present value (NPV) indicator is defined
as the sum that results when the expected
costs of the investment are deducted from
the discounted value of the expected benefits
(revenues) Whenever NPV gt 0 the project is
considered worthwhile or profitable Among
mutually exclusive projects the one with the
highest NPV should be chosen
bull The internal rate of return (IRR) indicator is
defined as the discount rate (r) that produces
a zero NPV This represents the maximum
interest rate that a project could face and still
not waste resources
For the project to be profitable the IRR has
to be greater than the interest rate that could be
earned in alternative investments thus when
IRR gt r the project is considered viable If the
(alternative) interest rate (imkt) also called opportunity
costs of capital is lower than the IRR the NPV is
positive and vice versa
IRR NPV 0gt gti mkt
IRR NPV 0lt lti mkt
12 Formulas can be found in the technical annex
12
VOLUME 1 BASIC CONCEPTS AND RATIONALE
Both NPV and IRR are calculated on the same
project cash flows of incremental net benefits
However in certain cases the calculation of
IRR is not possible and thus it cannot be used as a
profitability indicator
This is the case when (a) the flow of net
incremental benefits does not have a negative
element or (b) it presents more than one IRR
complicating the decision as to which one to
consider as the profitability indicator
Moreover IRR is an indicator that should not be
used to rank or select mutually exclusive project
options as it cannot provide a measure of the size or
magnitude of project value13 (box 3)
The NPV on the other hand is an indicator that
can always be calculated as is the case with the
benefitcost ratio
bull The (BC) ratio indicator is the ratio of the
present value of benefits to the present value
of costs over the time horizon The BC ratio
provides some advantages when a ranking of
alternative investment projects is needed under
budget constraints
If BC ge 1 the project is accepted
If BC lt 1 the project is rejected
13 Where a project is the only alternative proposal to the status quo the issue is whether the IRR provides worthwhile additional information Views differ in this respect Some argue that there is little merit in calculating a statistic that is either misleading or subservient to the NPV Others see a role for the IRR in providing a clear signal as regards the sensitivity of a projectrsquos net benefits to the discount rate Yet whichever perspective is taken this does not alter the broad conclusion on the general primacy of the NPV rule
These IGs consider that the most appropriate
indicator for appraising an investment project is
the NPV as the investment decision criterion is
straightforward if NPV is gt 0 the project is viable
It means that the proposed investment is a profitable
alternative in terms of resource allocations It is better
than the present and WOP situations and also better
than allocating the same resources to other economic
activities that will yield the average profit rate
Economic and financial analysis the differencesAll investment projects include a number of
stakeholders and this has implications for the
valuation of the benefits and costs accrued by
project interventions Whose costs and benefits
count14 Governments and society as a whole will
consider and value costs and benefits differently
from producers or any other private actor individually
From the perspective of a development agency such
as IFAD both points of view are relevant to a reply
to the guiding questions stated before Should the
government invest in this project Will the producer
take the risk
14 In the CBAEFA literature the question of lsquowhose costs and benefits countrsquo is known as the lsquostandingrsquo issue (ie whose welfare counts in the aggregation of net benefits)
BOX 3
IRR or NPV
Although the most appropriate indicator for appraising an investment project is the NPV ndash as it
can always be calculated and will provide information on the magnitude of the return ndash the IRR is
the most commonly used This is probably due to the fact that IRR is expressed as a percentage
which is often wrongly associated with other rates of return such as interest rates (r) or profit rates in
alternative allocations In fact the IRR has no meaning in terms of project value or size
To prove this letrsquos suppose a project is one thousandth the size of another project Simply multiply
each side of the equation by 1000 The calculated IRR will not change but the small project entails
less value The project to be chosen from a social point of view would be the one producing the
bigger returns to the economy and the NPV will clearly show this while the IRR will not
13
VOLUME 1 BASIC CONCEPTS AND RATIONALE
In order to consider these points of view analysis
will be conducted on two levels (a) financial analysis
will consider private stakeholdersrsquo interests15 and
(b) economic analysis will consider government
and society perspectives These two viewpoints will
require the analyst to consider different items
when looking at the benefits and costs of a project
valuate them differently and in some cases even
use different rates to discount the streams of costs
and benefits
The private investor exclusively considers the
costs and benefits related to the productivemarket
aspects of the project while analysis from an
economic point of view considers that benefits are
defined as an increase in social well-being16 The
costs are defined as reductions in social well-being
For a project to be economically viable its social
benefits must exceed its social costs
15 This point of view is also applied to the executing agency of a public project
16 The term lsquosocial welfarersquo or lsquowell-beingrsquo is used in these IGs as a simple monetary measure The definition is taken from neoclassical economics and prevailing economic theories of well-being No attempts are made to include any type of measurement of subjective happiness or to develop any well-being indexes or social indicators
Thus from the perspective of a private
stakeholder (financial analysis) participating in the
investment with risk capital the wealth created by
a project in lsquonrsquo periods of time is defined as the
financial NPV (FNPV) The economic or cost-benefit
analysis looks at the overall impact of the project
and takes the point of view of the collective agent
(eg society) and the wealth created by a project in
lsquonrsquo periods of time is defined as the economic NPV
(ENPV) of the investment produced by the project17
In financial analysis all costs and benefits
should be valued at market prices Only cash inflows
and outflows are considered (depreciation reserves
and other accounting items not corresponding to
actual flows are excluded)
17 In rural development projects where the agent is a subsistence farmer accumulated generated cash per year must be at least equal to or higher than the BAU situation that was ensuring hisher familyrsquos survival
BOX 4
Steps in financial analysis
The typical sequence of tasks to be undertaken in financial analysis is the following
1 Develop farmenterprise models and identify benefits and costs (investment and recurrent) for
WOP and WP scenarios (based on crop budgets)
2 Compare the discounted flows of benefits and costs and calculate the differences between the
obtained results and the WOP scenario in order to determine the net incremental benefits (NIB) of
the proposed interventions
3 Calculate the project financial profitability indicators of each model (ie financial NPV financial
IRR and BC ratio) applying these investment criteria to make an investment decision (positive or
negative)
4 Assess family incomes and establish financingcredit needs by performing a lsquosustainability analysisrsquo
Financial sustainability is ensured if the accumulated generated cash per year is positive or
at most equal to zero17 for all years considered On the contrary if this figure is negative at any
point in time the project is not sustainable meaning that there are not enough financial resources
to cover all the costs and it will be necessary to reassess project financing mechanisms
14
VOLUME 1 BASIC CONCEPTS AND RATIONALE
Economic analysis or cost-benefit analysis
builds on the results of financial analysis with the
additional consideration of impacts and benefits not
directly captured by the latter These analyses are
strictly related as shown in Figure 4
The main steps in financial analysis are
summarized in box 4 A detailed description of
building economic analysis from financial models is
provided in volume 2 which illustrates each step in
EFA of a typical IFAD production-oriented project
In economic analysis the analyst needs to
complement financial analysis by considering all
project impacts on the society The private actor is
generally not interested in considering all negative
or positive impacts that his actions may have on the
rest of society In terms of environmental impact
for example polluting rivers through production
discharges or emitting CO2 are social costs generally
not considered by the private agent These are called
lsquoexternalitiesrsquo as in practical terms the private agent
is lsquoexternalizingrsquo a production cost making the whole
society pay for it On the other hand there also exist
positive effects not counted by the private agent
such as the introduction of new pastures by a single
producer which can increase honey production in
the area and benefit neighbouring beekeepers
These aspects are known as positive and
negative externalities In addition economic analysis
must eliminate all transfer costs between national
and private actors (ie subsidies and taxes) Lastly all
costs and benefits need to be valued at their social
opportunity cost rather than at their market price
F IGUR E 4
Economic and financial analysis links
Aggregation
Project net incremental
benefits(NIB)
Farm budgets properly phased
Activity budgets (eg processing enterprises)
phased
Government implementing
agencies
Financial analysis(market prices)
123n
123n
Farm budgets properly phased
Activity budgets (eg processing enterprises)
phased
Government implementing
agencies
sum
sum
sum
Economic analysis(economic values)
123n
123n
Adjust market values to economic
values
Eliminate transfer
payments (taxes and subsidies)
Quantify externalities
15
VOLUME 1 BASIC CONCEPTS AND RATIONALE
Many times for example when trade barriers
are in place or when currencies are controlled
market prices do not reflect the social value of
goods In order to account for these distortions
one of the most critical tasks is the calculation of
economic or shadow prices Another critical aspect
is the establishment of a social rate of discount
that realistically reflects an investment alternative
(opportunity cost) for the government18 Detailed
explanations and guidelines for these calculations
are also included in volume 2
Table 1 illustrates the process of going from
financial to economic analysis19 The financial
analysis section at the top shows revenues and 20
production costs (operating and investment) of a
hypothetical enterprise The enterprise is experiencing
18 As a general rule when a country is a capital borrower the social rate of discount should be no less than the actual rate of interest on the capital market from which the capital is borrowed
19 Clicking on the table reveals the formulas
20 See section on ldquoUse of SA to assess project risks an examplerdquo
several years of negative net cash flows resulting
in a negative NPV and IRR This is caused by high
operating costs as well as recurrent needs for
investment Economic analysis converts market
prices into economic prices As reflected by the
application of conversion factors (CF) market prices
of outputs and inputs are different from their social
value For example the CF applied to wages reflects
the presence of high unemployment (20 per cent)
in the area which would push people to work for
lower than market wages (thus CF = 08)21 In the
same way the CF applied to investments reflects
the presence of high transport costs or duties that
make the productrsquos market price overestimate its
social value In fact the market price is 83 while the
economic price is 75 and thus the CF is 09
21 Market wage (mW) = US$100 unemployment = 20 economic wage(eW) = US$80 (observed given the high unemployment) CF = eWmW = 80100 = 08
BOX 5
Steps in economic analysis
Economic analysis requires assessment of a projectrsquos net impact on economic welfare
by considering
5 Convert all market prices into economicshadow prices (SP) that better reflect the social
opportunity cost of the good
6 Remove transfer payments (taxes and subsidies) and quantify externalities (positive and negative)
7 Aggregate all modelrsquos NIB cash flows respecting incorporation phasing patterns of targeted
beneficiaries into projectrsquos activities
8 Compare aggregated benefits with other project costs to obtain incremental discounted cash
flows Calculate economic performance indicators adopting a social discount rate ENPV ERR
BC ratio
9 Perform sensitivity analysis (SA) in order to deal with the main risks and uncertainties that could
affect the proposed project20
Critical parameters are (i) SP for tradable and non-tradable goods (ii) SP of foreign exchange
(iii) SP for labour costs (shadow wage) and (iv) the social discount rate
16
VOLUME 1 BASIC CONCEPTS AND RATIONALE
Fiscal corrections are also applied and
10 per cent VAT is deducted from all inputs and
outputs with indirect taxes Finally externalities
are accounted for and quantified both negatives
(increases in noise) and positives (decrease
in pollution)
The project under analysis resulted not profitable from a financial point of view but viable
from an economic point of view This means that
the overall impact for society is positive (also
reflected by the positive externalities) but there
are no sufficient incentives for the private
individual agent to undertake these activities
This conclusion suggests that if the development
objectives achieved through this investment are
significant enough for the government then the
project should develop an incentive scheme to
attract the private agent
These results may be used in policy dialogue
suggesting that the government could reduce the
level of targeted import duties and thus make this
investment proposal financially profitable
TA BLE 1
From financial to economic analysis an example
Financial analysis (market prices)Thousands of United States dollars
Years
1 2 3 4 5 6 7 8 9 10
Total operating revenues 0 42 115 119 126 126 126 126 126 126
Total Inflows 0 42 115 119 126 126 126 126 126 126
Total operating costs 0 -56 -75 -98 -101 -101 -101 -101 -117 -117
Total investment costs -165 -4 -4 -25 -3 0 -25 0 0 12
Total outflows -165 -60 -79 -123 -104 -101 -126 -101 -117 -105
Net cash flow -165 -18 36 -4 22 25 0 25 9 21
Financial rate of return -6
Financial NPV10 US$(89)
Economic rate of return 36
Economic NPV10 US$473
Years
Economic analysis CF 1 2 3 4 5 6 7 8 9 10
Output X 12 0 49 134 139 147 147 147 147 147 147
Total operating revenues 0 49 134 139 147 147 147 147 147 147
Labour costs 08 0 -18 -18 -26 -26 -26 -26 -26 -30 -30
Operating costs 11 0 -36 -57 -73 -76 -76 -76 -76 -87 -87
Total investment costs 09 -149 -4 -4 -22 -3 0 -22 0 0 11
Fiscal correction outputsa 09 0 44 121 125 132 132 132 132 132 132
Fiscal correction inputsa 09 -134 -36 -55 -85 -71 -68 -88 -68 -78 -68
Externalities 0 20 20 20 20 20 20 20 20 20
Decreased pollution 0 23 23 23 23 23 23 23 23 23
Increased noise 0 -3 -3 -3 -3 -3 -3 -3 -3 -3
Net cash flow -282 39 161 98 144 149 107 149 124 145
a VTA of 10 has been eliminated
1 Adjust market values to economic values applying CF2 Eliminate transfer payments (taxes and subsidies)
3 Quantify externalities
17
SECTION IV
IFAD rural investment projects include projects
in integrated rural development irrigation rural
finance value chain development natural resource
management (NRM) climate-change adaptation
and mitigation community development and
institutional strengthening
As IFAD follows its main mandate of focusing its
projects on benefiting poor rural people22 projects
are characterized and designed through identification
of a target group composed mostly of rural people
Poor rural people represent different productive
and economic categories the main one being
smallholders Others include the landless population
engaged in rural non-agricultural microenterprises
rural workers fishers and finally special vulnerable
groups such as women indigenous minorities and
youth All IFAD projects must be formulated on
the basis of benefiting one or more of the above-
mentioned poor rural groups
The increased number of value chain projects
in IFADrsquos portfolio23 ndash aiming to integrate IFADrsquos
traditional target groups into these chains to improve
their access to secure markets and sustainably raise
their incomes ndash has expanded the definition of IFADrsquos
target group to all rural people including small- and
medium-scale entrepreneurs in rural areas However
for the purposes of EFA the impact on poor rural
people is the one that matters the most to IFAD24 and
22 See IFAD Lending Policies and Criteria I (5) ldquoIFAD will concentrate its resources upon activities that promise to achieve in a cost-effective way a reduction of poverty in rural areas where most poor people live and work The Fundrsquos major target groups irrespective of the stage of economic development of the country will be the small and landless farmersrdquo
23 From only 3 per cent in 1999 to 46 per cent in 2009 (Raswant and Heinemann 2012)
24 However when possible and relevant distribution of benefits among value chain actors is a complement to CBA
to the poverty-reduction development objectives of
each government
This IFAD specificity has direct consequences for
CBA discussion of the lsquostandingrsquo issue As previously
stated investment projects include a number
of social stakeholders However for IFAD rural
investment projects this is not a major issue as the
formulation of IFAD projects is focused on benefiting
a specific target group poor rural people25
Focusing on lsquotypicalrsquo IFAD rural investment projects and their main benefitsThe typical IFAD project is usually production
oriented26 and its main outcomes (ie financial and
economic benefits) are frequently net production
increases In other words most IFAD projects will
have a direct impact on the production levels
of target groups which in turn will lead to net
income increases
IFAD projects have an impact on the incomes
of poor rural people by increasing their access to
inputs and services that will subsequently increase
their production volumes andor productivity
The most common areas of intervention include
technical assistance (TA) for crops and livestock
through extension services rural finance services
25 There might be exceptional situations in which other social groups could benefit from an IFAD project These cases might require additional analyses (eg distributional effects analysis) when undertaking EFA
26 Of 114 projects reviewed by QE from 2009 to 2011 73 per cent were agriculture- or rural development-related while in 16 per cent the core objective was to strengthen financial services The rest focused on capacity-building or NRM These data show that most IFAD projects can be characterized as production-oriented that is designed to have direct impact on production and productivity increase
EFA of IFAD rural investment projects
18
VOLUME 1 BASIC CONCEPTS AND RATIONALE
to support on-farm investments and increased
access to working capital through creditloan27 or
grant facilities improved water management through
the construction of irrigation structures provision
of storage drying and cooling facilities to enhance
post-harvest preservation and technical advisory
and financial resources to support entrepreneurs
in starting small and microenterprises ndash as well as
combinations of the above
This IFAD specificity leads to some
straightforward requirements when analysing its
financial and economic results First the project
should be assessed in terms of the financial feasibility
and sustainability of targeted beneficiaries second
the project should be assessed in terms of economic
profitability for the whole national economy
Thus in IFAD production-oriented projects the
main household-level goal in financial analysis is to
determine whether the producer28 will have enough
incentives to participate in the project
In simple terms analysis needs to establish
whether the farmer should undertake the proposed
intervention under the criterion that it is financially
viable (ie the benefits over time are higher than the
investment and recurrent costs) and that these net
benefits exceed present returns (ie incremental
benefits are positive)
However even if the new situation (WP) is more
appealing than the present one (WOP) could the
farmer afford to adopt improved practices Although
viable the investment may still not be profitable if it
does not generate enough returns (mostly during the
first years) to cover the farmerrsquos needs Where the
producer is living under the poverty line the project
should at least generate the same net income each
year as in the BAU situation (subsistence system)
to ensure hisher participation Where poverty levels
are lower incomes should be adequate to cover
investment and working capital needs in addition to
27 Comprising inclusive innovativeadapted rural finance products and services including risk management strategies savings financial literacyeducation programmes etc
28 The terms lsquofarmerrsquo lsquoproducerrsquo or lsquoprivate stakeholderrsquo will be used throughout the IGs as synonyms for the term lsquoprivate agentrsquo in financial analysis
the farmerrsquos living expenses The lack of initial capital
to invest is generally a huge barrier to engaging in
a new activity A financial analysis will determine if
farmersrsquo cash flows are adequate to undertake the
activities (ie it will clearly identify a farmerrsquos financial
needs and hisher repayment capacity)
Even when a financing scheme will prove the
feasibility of the investment there are many risks
involved in changing a farmerrsquos practices (business
as usual) above all if it involves taking out a loan
in an uncertain agricultural environment Thus the
last question to be answered is would the farmer
take the risk are there enough incentives Risks
faced by farmers are many and extremely difficult
to manage29 The only measure of their willingness
to change habitstechnologies will be by comparing
their returns to the opportunity costs of remaining
in the actual situation If for example the returns to
labour of the new activity prove to be much higher
than the average rural wage it is probable that a
farmer would be willing to invest his time in his own
farm and take the risk
In other words financial analysis will establish
whether farmers will obtain a net incremental benefit
(financial viability and profitability analysis) if theyrsquoll
have enough working capital to buy the additional
farm inputs or to bear the costs of stocking
processed goods (financial sustainability) and finally
if financial incentives are enough to convince them to
change existing practices
The practical way to undertake this analysis is by
developing different beneficiary productive profiles
ndash considering several types of productive activities
lsquofarm-systemsrsquo and lsquoactivity-modelsrsquo ndash as well as how
many and which types of people generally engage in
these activities in this particular area
On the basis of the individual models of financial
analysis ndash and once the three steps in converting
market prices into their economic value have been
29 For example risks in the areas of production prices casualties technology climate ndash to name just a few
19
VOLUME 1 BASIC CONCEPTS AND RATIONALE
completed ndash economic analysis of the project as a
whole can be undertaken30 This is done by means
of the aggregation that in project analysis is the
process of adding together the costs and benefits
of all the entities participating to reach a summary
account from which a measure of project worth can
be derived The result of the aggregation is the net
incremental benefit or cash flow of the project31
Lastly the goal of economic analysis is to answer
the question of whether it is worthwhile to invest
public resources in the overall project proposal
(should the government invest) It will focus on the
perspective of the entire country and it measures the
effects of the project on the economy as a whole
Unquantified benefits alternative methodologies to CBAThe majority of IFADrsquos projects are production-
oriented interventions in which expected outcomes
are tangible and easily quantifiable however due to
IFADrsquos typical target group many of these projects
are complemented by activities seeking an impact
on less-tangible aspects of rural poverty alleviation
Womenrsquos empowerment increased access to assets
and services enhanced capacities ownership and
land titling are examples of this important part of
IFADrsquos overall project impact However these types
of benefits which are more difficult to measure or not
measurable in monetary terms (intangible benefits)
are often excluded from CBA
In addition environmental and social benefits
resulting from the promotion of resilient agricultural
practices or social infrastructure such as rural roads
irrigation schemes or market infrastructure are also
seldom included in CBA In order to change this
trend these IGs will provide some ideas on how to
allocate value through the use of valid proxies to
measure the impact of these intangible social andor
environmental benefits
30 Some analysts proceed by aggregating the financial analysis and then converting the aggregated results into their economic value It can be argued that this stage of analysis is useless as the financial profitability indicators for the project as a whole have no use in terms of investment decisions
31 See volume 2 and its annex for more details on the lsquoaggregation issuersquo and common mistakes
In the particular case of CDD projects where
communities collectively decide on the allocation
of project resources it is very difficult to foresee
which productive activities will be targeted However
markets and agronomic conditions in the project
area will limit the scope of activities that can be
successfully undertaken In these cases the fact
that communities are making participatory decisions
will grant the additional benefits that ownership
provides ensuring higher adoption rates than
average and increasing the sustainability of the
chosen interventions
In cases where the identification and valuation
of benefits is difficult simple and sensible ways
of estimating tangible benefits should be applied
Table 2 presents an overview of suggested
approaches to transforming such benefits into
tangible values so as to include them in overall
project cash-flow analysis from the most common
complementary activities in IFADrsquos projects
Additionally the IGs will introduce two methods
alternative to CBA for those cases where not even
proxies could be measured cost-effectiveness
and MCA32 The latter has not yet been tested
as a suitable tool in IFAD project designs but is
suggested as an alternative in cases of complex
decision-making
Cost-effectiveness
When tangible benefits from a given investment
are difficult to quantify but the costs are easily
identifiable the most commonly used valuation
method is cost-effectiveness which is used to select
the least-costly alternative among a set of options
that will achieve the same result (a given set of
predetermined objectives) Once the purpose of the
project has been decided for example construction
of a market storage facility cost-effectiveness would
be used to compare scale location technology
etc in order to choose between investment
32 See the technical annex for more details
20
VOLUME 1 BASIC CONCEPTS AND RATIONALE
Project componentsactivity Quantifiable benefits
Productivity enhancement (including irrigation post-harvest and processing) Storage drying cooling facilities irrigation
bull Reduced post-harvest losses
bull Increased value and volumes of production due to investments in storage cooling or small processing facilities (drying or milling)
bull Increased production and productivity due to water provision
Value chain (VC) Collective marketing warehouse receipt systems increased market information
bull Increased value of final product owing to increased quality and access to markets improved handling packaging and commercialization
bull Financial benefits to all actors along the VC
bull Microenterprise and employment creation
bull Creation of internal and external markets that did not exist before investments
Rural roads bull Reduced transport and vehicle maintenance costs (incl vehicle operating costs [VOC] and travel-time costs [TTC])
bull Access to areas not accessible before hence increased total production
bull Increased volume of transported agricultural products for sale (reduced losses)
bull Reduced transport costs due to better access to sales points
Domestic water supply bull Time saved in procuring water
bull Reduced sickness through better water quality
bull Reduced water losses due to leakage
bull Increased productivity through small-plot crop irrigation and through provision of water for livestock
bull Introduction of backyard gardening
Climate adaptation and resilience practices Changes in tillage practices crop rotations landsoil conversion afforestation energy-efficient systems flood prevention
bull Reduced land erosion an estimate of saved nutrient content can be valued at price of fertilizer needed to replace that nutrient content
bull Increased crop timber and livestock yields through soil preservation conservation tillage and agriculture
bull Increased final product value due to labelling as organic agricultural practices
bull Avoided rehabilitation costs for public infrastructure destroyed by natural disasters
bull Energy savings owing to replacement of old practices by eco-friendly artefacts (eco-stoves solar panels etc)
Land registration Land tenure security may translate into increased land value explained by
bull Long-term Investments in land fertility
bull Improved access to credit as land can be used as collateral
bull Greater dynamism of land markets
bull Environmental benefits as a result of better NRM (people improve or maintain forest andor tree cover)
TA BLE 2
Simple sensible ways of valuing different types of benefits
21
VOLUME 1 BASIC CONCEPTS AND RATIONALE
options (eg open storage location of a facility
construction materials) Unfortunately the results of
this method which can justify project investment
decisions cannot be integrated into the streams of
incremental net benefits resulting from classic CBA
thus underestimating the overall benefits of
the investment
Multicriteria analysis
MCA is a decision-making tool for evaluating
complex decision problems where the options
entail many different objectives Unlike CBA MCA
allows consideration of aspects other than economic
and financial ones for example both quantitative
and qualitative data It builds trade-offs between
criteria that in complex decision-making are usually
in conflict (efficiency and equity for example) 33
and is an important instrument in ranking different
options and discriminating between acceptable and
unacceptable possibilities
The main advantages of MCA are its openness
explicitness and power to simplify complex
situations This process eases the discussion and
promotes communication first within the decision-
33 Another example would be when production objectives are in contraposition to environmental ones For example to increase livestock production for food security and at the same time reduce CO2 emissions
Project componentsactivity Quantifiable benefits
Rural finance bull Efficiency gains in financial system can lower operational costs and ensure self-sufficiency and sustainability of financial services supply
bull Shifts in portfolio composition of financial service providers (productive loans versus consumption)
bull Incremental taxation revenues to government
bull Potential productivity increases through financing of working capital (incremental benefits to clientsborrowers)
bull Economic benefits of transfer effects
Community development (CD) bull Improvements in lives of beneficiary households (value these in money equivalents if possible)
bull CD activities result in high empowerment and ownership of project activities which could translate into greater sustainability
Indigenous peoplesrsquo (IPs) knowledge
bull When IPs are supported in applying their knowledge ownership of project activities is ensured as well as sustainability of activities This can translate into low implementation risk and high uptake (adoption rates)
bull Generally IP practice are environmentally friendly thus reducing stress on natural resources
bull Nutritional aspects are also part of the positive impacts
Institutional strengthening bull Improved institutional capacity has generated or will generate benefits for target groups
bull Losses avoided by strengthening the institution looking at the sensitivity analysis assess how delays in implementation (due to institutional weak capacities) affect project outcomes and use that data to calculate losses avoided
Source PTA ndash EFA desk elaboration
22
VOLUME 1 BASIC CONCEPTS AND RATIONALE
making body and later between that body and
stakeholders MCA can be an ex ante (lsquobefore the
factrsquo) and an ex post (lsquoafter the factrsquo) evaluation tool
This type of analysis also presents some difficulties
One concerns definition of the comparative criteria
Use of MCA requires knowledge of mathematical
notions data aggregation methodologies and
computer applications to perform analysis following
a structured process and to avoid weak conclusions
It is often costly and time-consuming
EFA data sources collection and coherenceThe value of EFA as a decision tool hinges on the
quality of the data and assumptions that underpin
it Data availability is a widespread problem for
EFA analysts who should always work in close
collaboration with expert colleagues (agronomy
livestock and rural infrastructure experts) who will
provide or validate the key technical parameters of
the analysis34
Data regarding project costs should be collected
during design missions in consultation with the rest
of the team Once the first results from EFA are
reached they should also be shared with the team
to discuss how they affect expected outcomes and
assumptions For example planned investment costs
may not be sufficient to reach the number of target
beneficiaries outcomes of specific components may
not be appealing from a financial point of view etc
Although it is the responsibility of the EFA analyst
to gather and ensure data consistency among
sources the mission leader should promote and
facilitate dialogue among mission members and
provide sufficient time for the analyst to collect and
process data to ensure EFA quality and coherence35
34 Alternatively FAOSTAT is the most reliable and recommended source of data (httpfaostatfaoorg)
35 It is estimated that at least five weeks are needed for elaboration of a complete EFA one week for data gathering two weeks of mission and two weeks for data processing
For the other parameters of EFA analysis such
as conversion factors and discount rates one
of the most important sources of data is always
the national planning offices If these data are not
available evaluations of completed operations by
the Independent Office of Evaluation of IFAD (IOE)
can be used as a reference36 These can provide
reference values for similar projects or projects
in the same country (and region) for example on
uptake (adoption rates) of a specific technology or
constraints on input availability
Moreover economic and financial analysis in
appraisal reports for the same country (andor region
andor sector) ndash from IFAD and other IFIs such as
the World Bank or regional development banks ndash are
potential sources of information on key parameters
such as discount rates37
However any project analyst should rely on his
her best judgment accumulated through experience
when deciding on the assumptions to be used
36 Evaluations by country and region are available at wwwifadorgevaluationpublic_htmleksystdocprjindexhtm
37 FAOrsquos Monitoring and Analysing Food and Agricultural Policies (MAFAP) programme develops estimates for standard conversion factors the social exchange rate (SER) for different countries and currencies and other important parameters for estimating shadow prices such as the transport costs duties and taxes instrumental in calculating parityborder prices for tradable goods (wwwfaoorgmafaphomeen Country reports can be found at wwwfaoorgmafapproductscountry-reports-technical-notesen)
23
SECTION V
To increase the efficient use of EFA it is important to
view this analysis as an integral part of project design
information and not only as a mandatory study done
for compliance with IFAD quality requirements
To do so there should be continuous review and
refinement of EFA at all stages of the project cycle
It is part of the monitoring and evaluation (MampE) and
knowledge management functions to inform decisions
on adjustments to design and implementation
modalities in pursuit of project objectives
As a first step the data used for EFA in
project design should be periodically updated
by the projectrsquos MampE system and supervision
implementation support missions should verify that
this has taken place If significant changes occur in
the data ndash particularly those for which the sensitivity
analysis showed higher sensitivity ndash the IRR NPV
and cost-benefit ratio should be recalculated
In the light of new data (eg prices for inputs
and outputs demand forecast for project outputs
andor adoption rates) ndash and taking into account
the results of updated EFA including identified
risks and suggested mitigation measures ndash it may
become appropriate during project supervision
andor implementation support missions to decide
to reallocate resources among activities andor
components shifting from those that contribute less
according to the new constellation of data to those
that would contribute more to the projectrsquos objectives
Moreover the EFA spreadsheet prepared during
project appraisal should remain available for review
during project implementation and evaluation This
serves as an indicator of compliance with the EFA
requirement for design documents and the new RMF
indicator as stated in the relevance section It would
also facilitate the updating process indicated in the
preceding paragraph
The purpose of EFA in each phase of the project
cycle including evaluation is indicated in the
following table
TA BLE 3
EFA at different stages of project cycle
Project cycle stage Role of EFA Form of analysis
Concept Definition of investment criteria
bull Purely ex ante ndash all benefits and costs are based on estimates of future values
Project design Resource allocation decisions
bull Purely ex ante ndash all benefits and costs are based on estimates of future values
Supervision ndash early stage
Resource reallocation decisions
Newly Identified risks
bull Mainly ex ante ndash some costs may be ex post but most benefits will still be based on future estimates
Midterm review (MTR) bull Mainly ex ante ndash some costs will be ex post but estimation of future benefits will be based on evidence accrued during first half of project
Supervision ndash later stages
bull About 50 ex post50 ex ante ndash costs will be increasingly based on actual results but benefits are generally lagged by several years at least and will continue to accrue over life of investment
Project completion report (PCR)
Assessment of results bull Mainly ex post ndash all costs and some benefits will be based on actual results but benefit stream for residual life of investment will remain an estimate of future values
EFA role throughout IFADrsquos project cycle
24
VOLUME 1 BASIC CONCEPTS AND RATIONALE
Table 3 also describes the form of analysis
undertaken at each stage of the project cycle which
ranges from purely ex ante during project design to
partly ex post initially with regard to costs and later
to benefits and finally purely ex post for investment
costs but only partly ex post for recurrent costs
and benefits In this example a fully ex post analysis
would only be possible after 20 years which lies
more in the realm of policy analysis than project EFA
Given its purpose EFA is currently used mostly
as an ex ante tool to guide project formulation and
justify investment decisions Nevertheless it could
make a bigger contribution to IFADrsquos mandate for
rural poverty reduction if it were used in some of
the following ways
At concept
bull At COSOP38 andor project conception previous
evaluation ex post reports elements from
previous EFAs or speedy financial assessments
of intended investments could serve as
screening criteria for the validation of proposed
investment ideas For example a previous study
on the investment requirements for a specific
irrigation technology may help establish a
minimum area to be covered by projects in order
to produce sufficient benefits to overcome
project investments
At design
bull For component selection ex ante assessment of
component viability during design
bull For cost validation EFA will confirm whether
estimated project investment costs are sufficient
to cover proposed interventions as well as define
beneficiariesrsquo contributions and their financial needs
bull In the logframe EFA can provide realistic and
consistent outcome indicators
bull For risk management EFA will provide grounded
information for the effective design of mitigation
measures applied to changing circumstances in
order to understand and manage risk
38 Country strategic opportunities programme
At implementation
bull To terminate or modify activities that are not
generating satisfactory financial results for the
intended beneficiaries and economic impact for
the country as a whole
bull For MampE Updating EFA to changing
circumstances will provide up-to-date evidence
of realistic outputs outcomes and impacts As
an MampE and knowledge management tool it can
facilitate learning within and between countries
about what works and what doesnrsquot in terms of
financial and economic impact This knowledge
can also be used to guide the design of country
programmes through the COSOP
bull EFA can also be used as a risk management
tool during implementation Where new risks
are identified or design assumptions are found
to be incorrect remedial action may be needed
including reallocation of resources among
components andor expenditure categories
Early in implementation EFA could contribute
to adaptation to changing circumstances such
as commodity prices production technologies
and institutional and policy changes which
may suggest that different or better approaches
be adopted modifying the design andor
implementation arrangements
At evaluation
bull As an ex post impact assessment tool by
incorporating EFA in IOErsquos PCR and country or
project evaluations in order to compare expected
and actual project results
bull To inform decisions on scaling up or replication
of successful initiatives including the scaling
up of grant-funded activities into full-scale
loan-funded projects
bull Ex post EFA assessment may suggest
discontinuation of approaches that are not
working and scaling up of those that are
25
VOLUME 1 BASIC CONCEPTS AND RATIONALE
Goal bull 20 increased average
income in 29000 HH
C1 bull 29000 farmers linked
with VCbull US$64 m in loans
distributed
C2 bull 29500 HH new crops
amp improved yields 15bull 2000 ha irrigatedbull 83 km rural roads
C3 Overall implementation
EFA in project design Links with the logframe and MampEIn addition to a complete EFA assessment IFADrsquos
mandatory design documents require presentation
of a logframe detailed cost tables disaggregated by
component financier and expenditure categories
and formulation of an MampE system
These three elements should be closely linked
The logframe provides a global picture of project
objectives and describes through components the
activities that will be put in place to achieve them
along with measurable indicators to monitor progress
and achievements The cost tables assign a cost
to each of these activities and MampE measures their
impact EFA is the technical vehicle that attaches an
expected benefit or outcome to the costs of each
envisaged activity It defines the causal chain of
effects between a projectrsquos inputs and outcomes
In other words many of the logframe sections
can and should be completed with information
coming from EFA These indicators should also be
used as part of the MampE system in order to maintain
coherence between planned interventions and
expected outcomes from the very beginning
In order to illustrate this causal chain a clarifying
example is provided in Figure 5 to explain how through
EFA certain inputs will be transformed into outcomes as
a result of the project The example has been extracted
from an ongoing IFAD project with a total project cost
of US$119 million to finance three main components
C1 value-chain market linkages development C2
improved agricultural practices and infrastructure
and C3 the project management unit (PMU)
As shown in Figure 5 uptake indicators
(ie number of expected beneficiaries) and overall
project impact of 20 increased incomes in
29000 HH have been directly estimated through
EFA (shown by the visible arrow) The same has
been done for expected outcomes from productive
interventions ndash such as improved crops and cropping
techniques complemented by irrigation infrastructure
under C2 ndash that will result in an average increase
in yields of 15 per cent However there are some
project activities for which it is more difficult to
F IGUR E 5
Practical example of linking EFA with the logframe costs and MampE With what For what
Objective Increase sustainable HH income
C1 Promote VCbull Capacity-building for
farmersrsquo groupsbull Link with farmers
and investment fund
C2 Support farmersbull Improved crop varieties
and TAbull Irrigation and road
infrastructure
C3 PMU
Total costs bull US$11946 m
Costpers US$740
C1 US$1875 mbull Capacity-building
US$3Mbull Link US$063 mbull Investment fund US$1512 m
C2 US$787 mbull Better crops US$643 mbull TA US$5 mbull Infrastructure
US$94 m
C3 US$105 m
LogframeImpact (MampE)
Projectcosts
Logframe Projectcosts
Impact (MampE)
EFA defines the causal chain
EFA can translate project inputs into results
26
VOLUME 1 BASIC CONCEPTS AND RATIONALE
measure impact (represented by the fading arrow)
In the example the development of stronger links
between farmers and agribusiness and improved
market access through construction of rural roads
will certainly have an impact on beneficiary access
to markets but this is not easily quantified by
measuring the number of meetings held by these
groups It would be better reflected in increases in
volumes sold and the prices received by farmers
Moreover indirect benefits from project activities
should also account for other rural people that will
benefit from the roads and are also not included in
the analysis Finally several project costs will not
produce any direct benefits but the activities they
fund are fundamental in the delivery of the overall
project For example all costs regarding the PMU
as well as awareness-raising campaigns and other
types of lsquosoftrsquo interventions
In summary the logframe provides a structure
that can help organize the data and assumptions
used in EFA elaboration Key data for estimating
costs and benefits and assumptions made
concerning incremental yields adoption rates etc
should be incorporated into the logframe and used
as indicators in the MampE system
While useful EFA cannot provide all relevant
indicators required in the logframe For example
third-level indicators (eg on reduced stunting or
increased HH assets) in IFADrsquos Results and Impact
Management System (RIMS) will still need to be
collected through baseline surveys in the early phase
of implementation
Finally it is important to distinguish output from
outcome indicators in the logframe39 During the
initial years of a project supervision should focus
on the output indicators As project implementation
proceeds the focus should shift to (or at least
include) outcome indicators which provide key data
to compare with the initial EFA assessment
39 A good practice example of a logframe distinguishing between output and outcome indicators is the Project for Agricultural Development and Economic Empowerment in Cambodia (EB 2012105R15Rev1 wwwifadorggbdocseb105eindexhtm) It should be noted that Annual Reports on Quality Assurance in IFADrsquos Projects and Programmes (eg document EB 200998R57) have called attention to imprecise development objectives and lack of quantified final and intermediate outcome indicators to track progress towards achieving objectives This deficiency also affects the quality of EFA and the possibility of using it during project supervision and implementation support Thus improved quality of the logframe can contribute to improving the quality of EFA and to enhancing its use during this phase
EFA in project design Risk analysisEconomic analysis of projects is by definition
built on uncertain future events Estimation of the
basic elements of this analysis (costs and profits)
inevitably involves explicit or implicit probability
judgments In order to contain and measure
the impact of these uncertainties on project
results there are some techniques that help
detect the lsquocritical variablesrsquo or sources of major
risks and set the basis for introducing effective
mitigating measures
The most common tools used in EFA are the
sensitivity analysis (SA) and the switching value (SV)
analysis40 Both enable testing and measurement
of the effect of changes in key project variables on
the final outcomes of our project and hence its
economic indicators (NPV and IRR) Although SA is
frequently used to assess the robustness of projects
and their resilience to shocks its outcomes are
seldom linked to risk analysis
In other words the most relevant question at
this stage is to know how fluctuation in critical
parameters (eg increases in costs delays in
implementation) will affect project performance and
which of the identified risks are the ones that need
close monitoring
Considering the effects of risks and mitigation
measures identified at the project design stage on
EFA results would not only represent a more realistic
approach to assessing the projectrsquos profitability but
would also help identify the nature of those risks
ndash acknowledged but not mitigated by the project ndash
whose existence is regarded as acceptable
In practical terms the SA tests percentage
increases and decreases in estimated benefits and
costs to assess their impact on NPV and IRR while
the SV provides the percentage change in cost
or benefits that will cause project outcomes to fall
below the minimum level of acceptability (NPV lt 0)
40 In volume 2 the IGs also provide information on more sophisticated tools using probabilistic approaches such as Crystal Ball and Risk
27
VOLUME 1 BASIC CONCEPTS AND RATIONALE
Both analyses are extremely useful if linked to
identified project risks For example SV can identify
benchmarks (maximum percentage increases in costs
or decreases in benefits) for lsquotrigger valuesrsquo to activate
specific mitigation measures (eg if the internal price
of a specific input increases to 30 per cent activities
should shift to an alternative crop)
Another way of looking at this analysis is
through the graphic in Figure 6 Here variations
in expected benefits and costs are represented
in the vertical and horizontal axes respectively
Calculation of the switching values of our project
identifies the maximum reduction in benefits (Bmin)
and the maximum increase in costs (Cmax) that
would result in an NPV of zero Thus the switching
value frontier (SVF) represented by the black line
between Bmin and Cmax encloses all possible
combinations of reduction in benefits and increase
in costs that would bring the NPV to zero Implicitly
the area (O Bmin Cmax) represents the set of all the
different combinations of decrease in benefits and
simultaneously increase in costs that would not
endanger project viability
Once the SVF has been identified and after a
proper evaluation of the country context and project
risks and mitigation measures we could eventually
assume that benefits and costs are very unlikely to
attain the levels represented by the two dotted lines
(B0 C0) As a result we narrow down our uncertainty
area defining a lsquosafe zonersquo identified by the blue area
(A) and a lsquorisky zonersquo identified by the orange area
(R) Area A represents the set of combinations that
falls into the viable cases where increases in costs
or decreases in benefits are not jeopardizing the
overall outcome of the project Area R represents all
the diverse combinations of costs and benefits that
will render the project unprofitable (NPV lt 0)
An analysis including probabilistic approaches
could provide a better understanding of the likelihood
that the project would fall into one of the two areas
and thus assess how much at risk it would be if
certain events occurred Details of these types of
analysis can be found in volume 2
Use of SA to assess project risks an example
SA provides grounded information to the design
team to develop effective mitigation measures for
each identified potential risk The first step then
is to add a proxy to the classic table or section on
project risk of the project design report (PDR) ndash a
proxy that responds to the question How will this
risk affect project performance For example if
F IGUR E 6
Identification of the risk zone
0
A
R
Switching value frontier(NPV=0)
Cmax + Costs
- Benefits
B0
Bmin
Cmax
28
VOLUME 1 BASIC CONCEPTS AND RATIONALE
local implementation capacities are low SA can
test how a delay in implementation of one or more
years (a realistic possibility of this risk occurring) will
affect project outcomes Similarly if there is a high
probability of the introduction of import taxes this
can be tested by increasing input costs
The next step is to closely observe the SA results
in order to assess to what extent these events
will change the profitability indicators (ie project
performance) By answering the question Which
variables need to be closely monitored the project
team can easily identify the lsquocritical risksrsquo and better
allocate resources for their mitigation
In the example below (Table 4 and Table 5)
SA shows that this project is more sensitive to
decreases and delays in benefits than to cost
increases Thus although there is a high risk of the
introduction of import taxes on fertilizer this will not
drastically affect project performance On the other
side delays in implementation are a high risk that
could compromise overall project outcomes Project
teams should allocate more efforts and resources to
mitigate this risk rather than others
To summarize EFA analytical tools can contribute
to risk assessment and informed decision-making
for the efficient allocation of project resources when
designing mitigation measures
TA BLE 4
Risk analysis and mitigation measures (classic table prepared for the PDR)
Risk description Probability of occurrence
Mitigation measure Proxy to compare with SA results
Institutional risksLow local implementation capacity
High Capacity-building Delays in benefits
Market risks Import duties on fertilizer High Local production Increased costs
Climate risks Floods Low Infrastructure Reduced benefits
TA BLE 5
Sensitivity analysis for informed decision-making
SA Base case
( 12)
Costs increased Decrease in benefits Delay of benefits
+10 +20 +50 -10 -20 -50 1 year 2 years
IRR 28 27 25 21 22 20 18 23 19
NPV (lsquo000 US$)
37 160 8 068 6 895 3 376 4 047 2 949 1 564 5 173 1 984
29
VOLUME 1 BASIC CONCEPTS AND RATIONALE
EFA in project supervision implementation and ex post evaluationThe underlying principles for the use of EFA in project
implementation are no different from those for project
design and are detailed in a number of old and
well-known sources Squire and van der Tak (1975)
Gittinger (1985) Belli et al (1998) and IFADrsquos draft EFA
guidelines of September 2012 However although the
principles are the same the methods of application
differ to some extent as shown in Table 6
The approach to EFA both before and during
project implementation should be tailored to
the nature of the project What to look for in the
field and the type of analysis undertaken vary
considerably among different project categories
More detailed information is provided in Table 7 in
the technical annex
Ex ante and ex post EFA
It is important to distinguish between ex ante and ex
post EFA and to appreciate their roles in the various
stages of the project cycle Ex ante is the more
familiar form of EFA Undertaken as a key part of the
project design process it is used to inform decision-
making on the nature of the project and its expected
financial and economic impacts Ex post EFA is
undertaken after an investment project has been
completed There are also intermediate forms of
analysis undertaken during project implementation
which are partly ex post and partly ex ante
It is important to distinguish between the
implementation period and the life of the investment
The implementation period typically five to seven
years is the period in which project activities are
undertaken and IFAD funds disbursed The life of
the investment is much longer typically 20 years
or more during which economic and financial
benefits are expected to accrue Figure 7 shows
a typical IFAD project profile with the investment
costs incurred during years 1-5 recurrent costs
over the 20-year project life and benefits beginning
to flow in year 3 and reaching a plateau from
year 10 onwards
TA BLE 6
Application of general principles of EFA
Key principle Methods of application
Ex ante EFA Implementation
With and without project comparison
Prepare lsquobusiness as usualrsquo scenario on the basis of lsquodo nothingrsquo option
bull Conduct baseline survey to define pre-project status
bull Estimate what would have happened without the project
bull Paired comparisons can help (eg inoutside project area)
Financial analysis Construct farm models showing expected revenue and expenditure for beneficiaries
bull Survey beneficiaries to estimate actual revenue and expenditure
bull Validate andor adjust farm models accordingly
Discounting future benefits and costs
Discount future costs and benefits back to year zero
bull Discount future and previous benefits and costs back to year zero
Accounting for externalities
Identify and quantify all externalities where possible
bull Check for signs of positive and negative externalities emerging during implementation
Adjusting for distortions Deduct taxes add subsidies use shadow prices estimate conversion factors
bull Check for changes in tax and subsidy rates and adjust prices accordingly
bull Update conversion factors on the basis of trade andor tariff data
30
VOLUME 1 BASIC CONCEPTS AND RATIONALE
Methodological issues of ex post and
ex ante analysis
The key aspect to understand when performing
this analysis is that as shown in Figure 7 project
costs and benefits will occur in different moments of
project life
Methodologically speaking if this analysis will
be used for comparison of appraised (ex ante) and
real impacts (ex post) (as is generally the goal) we
need to lsquoplacersquo the comparison in the same point in
time The point in time could be at the beginning or
completion of the project or any other point What
is important is to bring all cash flows to that point in
time using discount techniques Then calculate the
NPVs and compare You will be able to use IRRs only
if the cash flow allows it mathematically (ie if there is
a negative Figure in the first year)
But this is not the only consideration to bear in
mind Other issues arise such as
bull Attribution effects of achieved results given
IFADrsquos scale of intervention it could claim
contribution but not full attribution of increased
beneficiary incomes or decline in food insecurity
bull At completion could be too early to capture all
expected benefits (see Figure 7)
bull A mixed approach in order to compensate for
this second issue is to try to estimate benefits
yet to be produced include them in cash flows
and then perform the discounting (however the
results could be questioned)
bull In order to make a realistic comparison CBA
should be done 10 years after implementation
and this has rarely been done
On a more positive note the alternative would be
to choose some activityfarm models effectively
put in place by the project Perform a financial
analysis at completion and compare it with appraisal
estimations (models developed at design for the
WOP situation) in order to estimate how things
have changed This analysis will not be based on
cash flows but on annual bases thus comparing
F IGUR E 7
Profile of costs and benefits over the project cycle
0
20
40
60
80
100
120
Investment costs
Recurrent costs
Benefits
MTR
Supervision EvaluationDesign
PCR
1Years
2 3 4 5 6 7 8 9 10 11 12 13 14 15 16 17 18 19 20
Implementation period years 1-5
Life of the investment years 1-20
31
VOLUME 1 BASIC CONCEPTS AND RATIONALE
annual financial indicators such as total sales total
production costs employment created Hopefully
full development of the model would have been
achieved by completion so as to provide information
on how adequate project interventions had been
This could also potentially provide information on the
reasons underpinning adoption rates
Ex post EFA and scaling upConfronted with the large-scale problem of reducing
rural poverty which it is mandated to address
and the limited resources available from official
development assistance (ODA) IFAD is compelled
to increase the impact of every dollar it invests in
agriculture and rural development For this reason
scaling up the results of successful development
initiatives is an overarching priority that directly
supports the achievement of IFADrsquos mandate To
deliver on this priority IFADrsquos operational practices
must be geared towards supporting all concerned
actors and institutions ndash including poor rural women
and men and their organizations ndash in achieving
impact at scale
The formal IFAD definition of lsquoscaling uprsquo is
expanding adapting and supporting successful
policies programmes and knowledge in order to
leverage resources and partners to deliver larger
more sustainable results for a greater number of
poor rural people Scaling up results means that
IFAD interventions will not be viewed as a way of
expanding small projects into larger ones Instead
they will focus on how successful local initiatives
will sustainably leverage policy changes additional
resources and learning to bring the results to scale
EFA has an important role to play in informing
scaling-up decisions since evidence of favourable
financial and economic impacts should be a key
criterion for deciding whether or not to scale up
Thus the framing questions must incorporate an
economic and financial dimension as follows
bull Idea If a project is referred to as one that is
being scaled up or otherwise further developed
from previous interventions in the host country
or region what were the economic and financial
outcomes of the activity to be scaled up Have
economic and financial impacts been estimated
or measured
bull Vision How many poor rural men and women
will benefit financially and to what extent What
will be the overall economic impact
bull Drivers Are the economic and financial benefits
sufficiently attractive to drive the expansion and
sustain the initiative over the long term
bull Spaces Is there sufficient capacity to finance
the proposed expansion Is the local regional or
national economy large enough to accommodate
it Can markets absorb the level of production
envisaged
bull Pathways What are the financial and economic
implications of alternative scaling-up pathways Is
a gradual or a fast-track approach preferred
bull IFADrsquos role How will IFAD ensure that economic
and financial impacts of the expansion are
properly monitored and evaluated
Scaling-up issues often need to be addressed during
COSOP formulation or country portfolio reviews
especially where grant-funded pilot programmes
have been implemented and are being considered
for scaling up into full-scale investment projects In
these cases EFA of pilot programmes during and
after implementation becomes an important part of
the strategic process
32
Formulas for profitability indicatorsThe net present value (NPV) indicator defined as
the sum that results when the expected costs of the
investment are deducted from the discounted value
of the expected benefits (revenues) is calculated
through the following formula
Where
Bt = benefits at time t Ct = costs at time tIt = investment costs n = project economic life
r = interest rate used as indicator of opportunity
cost discount rate
The internal rate of return (IRR) indicator is defined
as the discount rate (r) that produces a zero NPV
This represents the maximum interest rate that a
project could face and still not waste resources
This is called the internal rate of return (IRR) It is
calculated through
IRR = (r NPV = 0)
For the project to be profitable the IRR has to be
greater than the interest rate that could be earned in
alternative investments thus whenever IRR gt r the
project is considered viable If the (alternative) interest
rate (imkt) is lower than the IRR the NPV is positive
and vice versa
The benefitcost ratio (BC) indicator is the ratio of
the present value of benefits to the present value of
costs over the time horizon The BC ratio provides
some advantages when it is necessary to formulate
a lsquorankingrsquo of alternative investment projects under
budget constraints
If BC ge1 the project is accepted
If BC lt1 the project is rejected
Cost-effectivenessWhen tangible benefits from a given investment
are difficult to quantify but the costs are easily
identifiable the most common valuation method
is cost-effectiveness It is used to select the least
costly alternative among a set of options that will
achieve the same result (a given set of predetermined
objectives) Once the purpose of the project has
been decided for example construction of a market
storage facility cost-effectiveness would be used to
compare scale location technology etc to choose
among investment options (eg open storage
location of the facility construction materials)
The methodology consists in first listing and
measuring in monetary terms the costs of the
options available and then comparing them with
the costs occurring in the base scenario (without
the project) Total costs are then discounted at
year 1 and the results compared to identify the
cheapest intervention In other words valuation by
cost-effectiveness consists in comparing on a
present-worth basis all alternatives that can achieve
the same benefit (Gittinger 1985) and selecting the
least costly
IRR NPV 0gt gti mkt
IRR NPV 0lt lti mkt
IRR NPV 0gt gti mkt
IRR NPV 0lt lti mkt
IRR NPV 0gt gti mkt
IRR NPV 0lt lti mkt
IRR NPV 0gt gti mkt
IRR NPV 0lt lti mkt
Technical annex
33
VOLUME 1 BASIC CONCEPTS AND RATIONALE
Unfortunately the results of this method which
can justify project investment decisions cannot be
integrated into the streams of incremental net benefits
resulting from classic CBA ndash thus underestimating
the overall benefits of the investment
Multicriteria analysis41
MCA is a decision-making tool used to evaluate
complex decision problems With this tool it is
possible to identify overall preferences among
alternative options where the options entail many
diverse objectives Unlike CBA MCA allows
consideration of aspects other than economic and
financial ones for example social technological and
environmental issues Its use is particularly relevant
when other single-criterion approaches cannot
provide monetary valuations42
In the same model thanks to these techniques
it is possible to consider quantitative and qualitative
data It builds on trade-offs between criteria that
in complex decision-making are usually in conflict
(efficiency and equity for example) Choices are
classified aggregating various items of information
in a common index of utility value Since policy
decisions may be influenced by both monetary
and non-monetary objectives it offers a technique
capable of ranking diverse outcomes
MCA establishes preferences among options
referring to a set of objectives identified by decision
makers It is an important instrument for ranking
options and discriminating between acceptable and
unacceptable possibilities Decision makers must
define quantifiable criteria to judge how an objective
has been achieved and MCA allows them to
41 MCA has not yet been tested as a suitable tool for IFAD project design but is suggested as an alternative in the extreme cases mentioned above of complex decision-making
42 One example would be when production objectives are in contraposition to environmental ones For example to increase livestock production for food security and at the same time reduce CO2 emissions
aggregate the data on individual criteria in order to
provide indicators of the overall performance of the
options It brings out the points of view of the actors
involved in the judgment and is characterized by the
subjectivity related to the opinions of the decision-
making group43
The main advantages of MCA are its openness
explicitness and its power to simplify complex
situations In fact it splits the components of
intricate situations and organizes them so as to find
a solution step by step and clearly Objectives and
criteria chosen by the decision group can in fact be
analysed and changed if they are not considered
suitable This process eases the discussion and
promotes communication within the decision-making
body first and later between that body and the
stakeholders MCA can be both an ex ante and an ex
post evaluation tool
This type of analysis also presents some
difficulties One concerns the choice of the activities
or variables to be studied and definition of the
comparative criteria These operations are often
very complicated and require much time spent
in discussions and negotiations Use of MCA
requires knowledge of mathematical notions
data aggregation methodologies and computer
applications in order to perform analysis following a
structured process and to avoid weak conclusions
It is often costly and time-consuming
43 Indeed the opinion team establishes objectives and criteria assesses relative importance weights and judges the contribution of every option to each performance criterion MCA can be preceded by strengths weaknesses opportunities and threats (SWOT) analysis for the choice of criteria it can be supported by an expert panel to help the negotiating group develop an assessment of a specific topic or it can be assisted by focus groups questionnaires and case studies to choose criteria and rate them In addition criteria can be evaluated using cost-effectiveness analysis
34
VOLUME 1 BASIC CONCEPTS AND RATIONALE
Types of projects and EFA activitiesAspects to look for in the field and the type of
analysis undertaken vary considerably among project
categories as shown in Table 7
TA BLE 7
Main EFA tasks by type of project
Project category Main EFA tasks during implementation
Productivity enhancement (including irrigation)
bull Estimate number of beneficiaries and technology adoption rates by target group households
bull Monitor productivity changes product quality and prices
bull Estimate gross margins (per unit of land and labour) for project and non-project households
bull Update farm models based on observedactual results revise economic analysis as necessary and consider adjustments to project design to improve results
Rural infrastructure bull Review construction schedule and costs relative to design estimates
bull Estimate utilization rates for new or upgraded infrastructure
bull Assess arrangements for operation and maintenance
bull Estimate benefits derived by target group households (eg reduced costs increased prices improved market access)
bull Update farm models based on observedactual results revise economic analysis as necessary and consider adjustments to project design to improve results
Natural resource management
bull Undertake a comparison of NRM activities with and without project
bull Review with and without project scenarios of agricultural productivity
bull Seek evidence of more sustainable and responsible NRM practices
bull Identify and if possible quantify value of environmental benefits
bull Update farm models based on observedactual results revise economic analysis as necessary and consider adjustments to project design to improve results
Community development bull Determine number of target group beneficiaries participating in community development activities
bull Identify what has changed in the community and individual households as a result of these activities
bull Describe improvements in the lives of beneficiary households and value these in monetary equivalents if possible
bull Revise economic analysis as necessary and consider adjustments to project design to improve results
35
VOLUME 1 BASIC CONCEPTS AND RATIONALE
Project category Main EFA tasks during implementation
Institutional strengthening bull Prepare inventory of actual institutional-strengthening activities undertaken
bull Complete assessment of institutional capacity and projectrsquos impact on it
bull Identify how improved institutional capacity has or will generate benefits for target groups
bull Revise economic analysis as necessary and consider adjustments to project design to improve results
Marketing and value chain development
bull Review value chain analysis undertaken during project preparation to update data on volumes costs prices and value addition
bull Identify ways in which improvements in value chain efficiency have improved or are likely to improve market access and farmgate prices for beneficiaries
bull Estimate financial benefits accruing to target group farmers and other value chain actors
bull Update farm models based on observedactual results revise economic analysis as necessary and consider adjustments to project design to improve results
Rural financial services bull Estimate number of beneficiaries with improved access to financial services types of services offered and acceptance rates
bull Monitor cost of financial services at different levels (cost of loanable funds retail service costs at client level) and compare with project design estimates
bull Assess actual or likely changes in farm and non-farm economic activities arising from improved access to rural financial services
bull Estimate the net financial benefits accruing to target group beneficiaries from these changes
bull Update farm models based on observedactual results revise economic analysis as necessary and consider adjustments to project design to improve results
36
Anandajayasekeram P CJ Van Rooyen F Liebenberg 2004 Agricultural project planning and analysis A sourcebook Second Edition Network Activity Program ndash Institutional University Cooperation (IUC) between the Flemish Universities of Belgium and University of Pretoria
Asian Development Bank 2013 Cost-benefit analysis for development A practical guide Manila httpwwwadborgdocumentscost-benefit-analysis-development-practical-guide
Australian Department of Infrastructure and Planning Queensland Government 2012 Project assurance framework ndash Cost benefit analysis guidelines Brisbane Queensland Australia
Belli P J Anderson H Barnum J Dixon and J-P Tan 1998 Handbook on economic analysis of investment operations Washington DC Operational Core Services Network Learning and Leadership Center World Bank httpsiteresourcesworldbankorgINTCDDResourcesHandbookEApdf
Belli P 2001 Economic analysis of investment operations Analytical tools and practical operations Washington DC World Bank
Campell H R Brown 2003 Benefit cost analysis financial and economic appraisal using spreadsheet Cambridge University Press
CIFOR 1999 Guidelines for applying multi-criteria analysis to the assessment of criteria and indicators Bogor Indonesia Center for International Forestry Research wwwcifororgacmmethodstoolbox9html
Department for Communities and Local Government 2009 Multi-criteria analysis A manual London httpeprintslseacuk127611Multi-criteria_Analysispdf
DFID 2011 Guidance for country offices on measuring and maximising value for money in cash transfer programmes London Department for International Development (UK)
European Commission 2008 Guide to cost-benefit analysis of investment projects Brussels httpeceuropaeuregional_policysourcesdocgenerguidescostguide2008_enpdf
FAO 1979 Economic analysis of forestry projects Case studies FAO Forestry Paper No 17 Supp 1 Rome Food and Agriculture Organization of the United Nations
FAO 1995 Guidelines for the design of agricultural investment projects Investment Centre Technical Paper No 7 Rome Food and Agriculture Organization of the United Nations
FAO 2010 Estimating mitigation potential of agricultural projects An application of the EX-ante carbon balance tool (EX-ACT) in Brazil Rome Food and Agriculture Organization of the United Nations
Gittinger J Price 1985 Economic analysis of agricultural projects Washington DC Economic Development Institute World Bank httpdocumentsworldbankorgcurateden198501437966economic-analysis-agricultural-projects
Government of South Africa 2004 Cost-benefit analysis Pretoria Department of Environmental Affairs and Tourism
IFAD 2012 Review of post-harvest systems in IFAD programmes Rome
Jenkins G C Kuo A Harberger 2011 Cost-benefit analysis for investment decisions httpwwwqueensjdiexecorgpublicationsqed_dp_206pdf
Lewis DL 1999 Road user and mitigation costs in highway pavement projects Washington DC Transportation Research Board National Research Council
Mishan EJ 1971 Cost-benefit analysis London George Allen and Unwin
Potts D 2002 Project planning and analysis for development httpswwwriennercomtitleProject_Planning_and_Analysis_for_Development
Raswant V and E Heinemann 2012 Access to markets Making value chains work for poor rural people Rome IFAD
Squire L and HG van der Tak 1975 Economic analysis of projects Baltimore MD USA Johns Hopkins University Press
References
37
VOLUME 1 BASIC CONCEPTS AND RATIONALE
Treasury Board of Canada 2007 Canadian cost-benefit analysis guide Ottawa Secretariat Treasury Board of Canada analys-engpdf
UNIDO 1972 reprinted 1993 Guidelines for project evaluation Order No IDSERH2 Vienna United Nations Industrial Development Organization
UNIDO 1986 Manual for evaluation of industrial projects Vienna United Nations Industrial Development Organization wwwunidoorgfileadminuser_mediaPublicationsdownloadManual_for_Evaluation_of_Industrial_Projectspdf
USAIDINDIA 2000 REFORM Project compendium with practitionersrsquo guide State fiscal management reform Vol V Project appraisal practitionersrsquo guide New Delhi US Agency for International DevelopmentIndia httppdfusaidgovpdf_docsPNADM777pdf
World Bank 2013 Investment Project Financing Economic Analysis Guidance Note httpsiteresourcesworldbankorgPROJECTSResources40940-1365611011935Guidance_Note_Economic_Analysispdf
World Bank 2012 A guide to assessing needs Essential tools for collecting information making decisions and achieving development results by Watkins R Meiers M amp Visser Y httpsopenknowledgeworldbankorgbitstreamhandle109862231663920PUB0EPI00essing09780821388686pdfsequence=1
38
Glossary
Aggregation 15 16 20 in project analysis the process of adding together the costs and benefits of all the entities participating in a project to reach a summary account from which a measure of project worth can be derived Often the result of the aggregation is the Incremental Net Benefit or Cash Flow of a project
Appraisal 7 24 31 A before the fact (ex- ante) evaluation of a proposed investment project to determine its merit and acceptability in accordance with established decision-making criteria
Benefitcost ratio (BC ratio) 13 33 a discounted measure of project worth The ratio of benefits to costs It should be calculated using the present values of each discounted at an appropriate discount rate Most often the opportunity cost of capital The ratio should be at least 1 for the project to be acceptable It may give incorrect ranking among independent projects and cannot be used for choosing among mutually exclusive alternatives
Border price 23 The border price is the unit price of a traded good at the countryrsquos border For exports it is the FOB (free on board) price and for imports it is the CIF (cost insurance and freight) price
Business as Usual (BAU) 8 9 11 14 19 a reference scenario which assumes that future evolution is an extension of the current trends See also lsquodo nothing scenariorsquo
Cash flow 11 12 16 19 20 31 The funds generated or used by the project Reflects the costs and benefits over time from a stated point of view Incomebenefit is a positive cash flow and expensescosts are negative flows
Constant price A price that has been deflated to real terms by an appropriate price index They should be distinguished from current or nominal prices Often used as synonym of real prices
Contingent valuation A method of inferring the value of benefits and costs in the absence of a market What people would be willing to pay to gain a benefit (or willing to accept in recompense for a loss) if a market existed for the good
Conversion factor 5 16 23 30 the factor that converts the domestic market price to an economic price Conversion factors are the ratios of economic to financial prices Thus a conversion factor is a number that is used to convert the domestic market price of an item into its economic opportunity cost to the
economy by multiplying the market price of the item by the conversion factor
Cost An expense related to purchase of inputs including capital equipment buildings materials labour and public utilities Costs such as environmental damage or injuries to health are sometimes referred to as negative externalities
Cost Benefit Analysis (CBA) 7 8 18 31 conceptual framework applied to any systematic quantitative appraisal of a public or private project to determine whether or to what extent that project is worthwhile from a social perspective Cost-benefit analysis differs from a straightforward financial appraisal in that it considers all gains (benefits) and losses (costs) to social agents CBA usually implies the use of economicsocial prices
Cost effectiveness analysis (CEA) 20 33 an appraisal technique used in projects and programs in which benefits cannot be reasonably measured in money terms Cost-effectiveness analysis is used in one of two forms to select least-cost alternatives either holding constant the level of benefits and varying the level of costs or holding constant the level of cost and varying the level of benefits In either form the ratio of cost to benefits is known as the cost-effectiveness ratio
Current prices (Nominal prices) prices as actually observed at a given time They refer to prices that include the effects of general inflation and should be contrasted with constant prices
Cut-off rate the rate below which a project is considered unacceptable It is often taken to be the opportunity cost of capital The cut-off rate would be the minimum acceptable internal rate of return for a project or the discount rate used to calculate the net present value the net-benefit investment ratio or the benefit-cost ratio
Depreciation 14 Not a term used in cost-benefit analysis In other financial frameworks depreciation is the allocation of the cost of an asset over time Depreciation is a method of allocating the cost of a tangible asset over its useful life For accounting purposes depreciation indicates how much of an assetrsquos value has been used up For intangible assets amortization is the correct term However these are accounting concepts that makes no sense in financial analysis Here the full investment costs will be computed every time the asset needs replacement
39
VOLUME 1 BASIC CONCEPTS AND RATIONALE
Direct transfer payment 15-17 Transfer payments are transfers of money among residents of a country without a corresponding exchange of goods and services Taxes are transfer payments from individuals to the government Subsidies are transfer payments from the government to individuals Gifts are transfers ldquoin kindrdquo from one individual to another Because transfer payments are not made in return for goods and services they do not add to total output When transfer payments occur in the context of projects they redistribute project costs or benefits from the project entity to some other group or individual in the country
Discount rate 12 14 16 23 the interest rate at which future values are discounted to the present It usually represents the cost of capital for the person or entity calculating the net present value of the stream The financial discount rate and economic or social discount rate may differ in the same way that market prices may differ from economic prices The selection of the discount rate in financial analysis is a relative straightforward process and that is calculated as the potential gains of alternative safe investments on the market In economic analysis where project viewpoint is overturned toward the socio-economic context this parameter needs to be estimated properly so as to i) reflect the public nature of the investment ii) account for scarcity of resources and iii) ensure good use of public funds (See also social discount rate)
Discounted cash flow 14 The costs and benefits (cash flows) discounted to present values to give a common basis for comparison
Discounting 12 31 The process of adjusting future values to an equivalent present value at a stated point in time by a discount rate
Distortion 16 30 A difference between market prices and true values (economic prices) A distortion is any interference with market forces that renders the resulting quantity produced and price different from the price and quantity that would result under conditions of perfect competition
Distributional effect A change in the income or wealth of the people from whose point of view the benefit-cost analysis is done
Do nothing scenario the baseline scenario lsquobusiness as usualrsquo against which the additional benefits and costs of the lsquowith project scenariorsquo can be measured (often a synonym for the lsquowithout projectrsquo scenario)
Economic analysis 7 14-17 20 30 analysis that is undertaken using economic values reflecting the values that society would be willing to pay for a good or service In general economic analysis values all items at their value in use or their opportunity cost to
society (often a border price for tradable items) It has the same meaning as social cost-benefit analysis
Economic cost The economic cost of an activity or resource is the cost to society of that activity or resource Economic costs include the private costs borne directly by economic agents undertaking the activity and all other costs borne by other economic agents For example the economic costs of driving automobiles include the private costs of petrol plus the additional costs of congestion borne by other users of the roads plus the costs of pollution borne by society in general
Economic impact analysis the analysis of the total effects on the level of economic activity (output income employment) associated with the intervention This kind of analysis focuses on macroeconomic indicators and forecasts the influence of the project on these indicators It goes beyond CBA when very large projects are considered in relatively small economies
Economic net present value (ENPV) 16 The net present value of a project calculated using true or economic values Synonymous with social net present value
Economic price 16 Price that reflects the relative value that should be assigned to inputs and outputs if the economy is to produce the maximum value of physical output efficiently There is no consideration of income distribution or other non-efficiency goals in such a price Synonymous with efficiency price and true price
Economic rate of return (ERR) 16 An internal rate of return based on economic prices and social opportunity costs of capital expressing the socio-economic profitability of a project (See internal rate of return)
Environmental impact analysis the statement of the environmental impact of a project that identifies its physical or biological effects on the environment in a broad sense This would include the forecasting of potential pollution emissions loss of visual amenity and so on
Export parity price 23 footnote The export parity price is the FOB price of a good or service valued at point of export net of taxes and subsidies and suitably adjusted for internal transport costs to a location in a country The export parity price is the net-of-taxes-and-subsidies price that exporters would need to receive for a good or service sold in the domestic market in order to make them indifferent between selling in the domestic market or exporting
Externalities 5 15-17 30 A benefit or cost falling on third parties who normally cannot pay or be compensated for it through a market mechanism An external benefit is a positive externality an external
40
VOLUME 1 BASIC CONCEPTS AND RATIONALE
cost is a negative externality A positive externality may reduce the costs of a production process of an unrelated economic agent as when the bees of a bee grower pollinate a neighbourrsquos apple orchard They may also increase the enjoyment of another economic agent as when musicians playing for their own pleasure delight those around them A negative externality increases the production costs or reduces enjoyment for another economic agent Traffic congestion and the numerous forms of environmental pollution such as the pollution created by a manufacturing plant are examples of negative externalities Externalities are not reflected in the financial analysis For economic analysis however it is necessary to take such externalities into account and place a value on them
Ex-ante evaluation 24-25 30 the evaluation carried out in order to take the investment decision It serves to select the best option from the socio economic and financial point of view It provides the necessary base for the monitoring and subsequent evaluations ensuring that wherever possible the objectives are quantified
Ex-post evaluation 24-25 30-32 an evaluation carried out a certain length of time after the conclusion of the initiative It consists of describing the impact achieved by the initiative compared to the overall objectives and project purpose (ex-ante)
Farm gate price The price received by farmers for their products net of transport costs to the market where the products are sold
Feasibility study 9 19 a study of a proposed project to indicate whether the proposal is attractive enough to justify more detailed preparation It contains the detailed technical information necessary for the financial and economic evaluation
Financial analysis 7 14-17 19 30 31 the analysis carried out using market prices and taking a commercial point of view It allows one to 1) verify and guarantee cash balance (verify the financial sustainability) 2) calculate the indices of financial return on the investment project based on the net discounted cash flows
Financial sustainability analysis 14 19 20 analysis carried out in order to verify that financial resources are sufficient to cover all financial outflows year after year for the whole time horizon of the project Financial sustainability is verified if the cumulated net cash flow is never negative during all the years considered
Financial rate of return An internal rate of return based on market prices and opportunity costs of capital(See internal rate of return)
Human capital Human capital is the stock of skills and productive knowledge embodied in people The
purpose of investing in human capital is to improve the productivity of human beings
Impact 25-27 a generic term for describing the changes or the long term effects on society that can be attributed to the project Impacts should be expressed in the units of measurement adopted to deal with the objectives to be addressed by the project
Import parity price 23 footnote The import parity price is the CIF price of a good or service valued in a specific geographical location It includes the CIF price of the good suitably adjusted for transport costs net of taxes and subsidies The import parity price aims to measure the price that producers in the country would receive for a good or service produced in the country for sale in the domestic market under conditions of free trade
Incremental 11-14 19-20 Additional or marginal
Inflation A general increase in market price levels (a fall in the general purchasing power of the currency unit)
Input 26 28 That which is consumed by the project (as opposed to the projectrsquos output) Usually refers to the physical inputs used by the project including materials capital labour and public utilities Inputs like environmental quality foreign exchange and workersrsquo health are usually termed externalities
Internal rate of return (IRR) 12 33 The yield or profitability of a project based on discounted cash-flow analysis The IRR is the discount rate at which a stream of costs and benefits has a net present value of zero It is equivalent to the discount rate r that satisfies the following relationship
IRR NPV 0gt gti mkt
IRR NPV 0lt lti mkt
where Bt is the benefit stream and Ct is the cost stream The internal rate of return is compared with a benchmark in order to evaluate the performance of the proposed project The internal rate of return is then compared with the market rate of interest to determine whether or not a proposed project should be undertaken (See cut-off rate)
Financial Rate of Return is the internal rate of return calculated when all the inputs and outputs are calculated using financial values Economic rate of Return is based on economic opportunity costs
Logframe 10 25-27 is a management tool mainly used for designingand MampE of development projects It consists of four steps (1) establishing objectives (2) establishing cause-and-effect relationships (causal linkages) among activities inputs outputs and objectives (3) identifying assumptions underlying the causal linkages and (4) identifying objectively-verifiable measures for evaluating progress and success
41
VOLUME 1 BASIC CONCEPTS AND RATIONALE
Market price 14-17 (a) The price of a good in the domestic market (see financial prices) as opposed to the economic price shadow price or social price (b) the cost of a good including indirect taxes and subsidies It is the price relevant for financial analysis
Model A representation or simulation of a system or process showing how parameters benefits and costs interact to produce a bottom-line result by which the project can be judged
Monitoring 25-27 the systematic examination of the state of advancement of an activity according to a pre-determined calendar and on the basis of significant and representative indicators
Multi-criteria analysis 22 34 MCA is an evaluation methodology that considers many objectives by the attribution of a weight to each measurable objective In contrast to CBA that focuses on a unique criterion (the maximisation of social welfare) Multi Criteria Analysis is a tool for dealing with a set of different objectives that cannot be aggregated through shadow prices and welfare weights as in standard CBA
Mutually exclusive 8 12 13 Alternatives that cannot be undertaken simultaneously if one alternative is carried out the other cannot be The alternatives may be mutually exclusive because they represent alternative times of beginning the same project because funds are limited or because if one is carried out the other will not be required (for example a choice between a thermal and a hydro power station)
Net present value (NPV) 12 13 27-29 33 The net value of an investment when all costs and benefits expressed in standard units of value (numeraires) are summed up The sum that results when the discounted value of the expected costs of an investment are deducted from the discounted value of the expected revenues The net present value of a stream of costs and benefits is a number that results from discounting the values of the stream at a given discount rate It is equivalent to the number that results from the following expression
IRR NPV 0gt gti mkt
IRR NPV 0lt lti mkt
whereBt = benefits at time t Ct = costs at time tIt = investment costs n = project economic lifer = discount rate
Net revenues the amount remaining after all outflows have been subtracted from all inflows Discounting the incremental net revenues before financing gives a measure of the project worth of all resources engaged discounting the incremental net revenues after financing gives a measure of the project worth of the entityrsquos own resources or equity
Nominal prices Prices prevailing in a particular year Synonymous with budget-year dollars
Non-tradable good 16 23 footnote good or service that by its very nature cannot be exported or imported Land and buildings are examples of a non-tradable good
Non-traded good 16 23 footnote A non-traded good or service is one that is neither exported nor imported in a particular country for a variety of reasons including quotas and prohibitions Common examples of non-traded items are certain drugs haircuts etc In project analysis non-traded refers to goods and services not traded by the country in which the project is located
Numeraire a standard unit of value Money is a numeraire by which the values of different commodities can be compared In cost-benefit analysis the numeraire is the common denominator for measuring benefits and costs Widely used numeraires are the willingness to pay or aggregate consumption numeraire and the foreign exchange numeraire
Operational and maintenance costs 21 35 The recurring costs for operating and maintaining the value of physical assets
Opportunity cost 12 16 19 The best alternative return foregone elsewhere by committing assets to the project The value of something foregone For example the direct opportunity cost of a person-day of labour is what the person would otherwise have produced or being paid for that day of work The value of a resource in its best alternative use For the financial analysis the opportunity cost of a purchased input is always its market price In economic analysis the opportunity cost of a purchased input is its marginal social value in its best non-project alternative use
Output 27 That which is produced Usually refers to the physical product of the project Other effects of the project such as housing for workers employment training of labour and foreign-exchange savings are usually called externalities
Payback period The time required for the cumulative present value of benefits to become equal to the cumulative present value of costs
Programme 8 is a portfolio of multiple projects that are managed and coordinated as one unit with the objective of achieving common (often intangible) outcomes and benefits at sector country or even multi-country level
Project 8 is a temporary entity established to deliver specific (often tangible) outputs in line with predefined time cost and quality constraints A project should always be defined executed and evaluated relative to an approved business plan which balances its costs benefits and risks
42
VOLUME 1 BASIC CONCEPTS AND RATIONALE
Project analysis 8 20 the analytical framework for the evaluation of a projectrsquos feasibility and performance It includes the analysis of the context the objectives technical aspects demand forecasts and financial and economic costs and benefits Project analysis is needed to determine if given the alternatives a proposed project will sufficiently advance the objectives of the entity from whose standpoint the analysis is being undertaken to justify the project
Project cycle 24-25 30-31 a sequence of the series of necessary and pre-defined activities carried out for each project Typically it is separated into the following phases conceptualization inception formulation appraisal ex-ante evaluation financing implementation and ex-post evaluation
Real prices calculated by adjusting market prices by an appropriate price index to eliminate the effects of inflation Prices of goods and services change over time either because the general price level rises that is because of inflation or because the underlying conditions of supply and demand change Real prices refer to prices of goods and services that reflect changes in the underlying conditions of supply and demand but that do not reflect the effects of inflation The terms real prices and constant prices are used interchangeably but referring to real prices as constant prices is misleading Real prices do not necessarily remain constant over time as they change in response to changes in supply and demand Real prices should be distinguished from current prices which reflect inflation as well as changes in supply and demand
Relative prices the exchange value of two goods given by the ratio between the quantity exchanged and their nominal prices
Risk 10 25-27 The degree to which outcomes are uncertain The extent of possible variation in the outcome
Risk analysis 10 25-27 Risk analysis is a technique for assessing the expected net present value of a project in relation with project risks By taking into account the probability distribution of critical variables and the correlations among them it enables analysts not only to assess the expected net present value of a project but also its associated probability distribution In cost-benefit analysis it recognizes the simultaneous variation of the values of several inputs according to specified ranges and probabilities and analyses the resulting variability in the bottom line
Scale 31-33 The size of a project
Scenario 11 14 30 An outline or portrait of a possible future usually portrays unfolding events rather than being static in time
Sensitivity analysis 16 27-29 Sensitivity analysis is an analytical technique to test systematically the
effects on a projectrsquos outcome of changes in its basic assumptions Sensitivity analysis is carried out by varying one element or a combination of elements and determining the effect of that change on projectrsquos profitability indicators (NPV and IRR)
Shadow price 16 23 footnote 30 A shadow price of a good or service is the economic opportunity cost to society of that good or service The true or economic value of a good (as opposed to the market price which might be distorted) Synonymous with economic or social price
Social price 16 A price that reflects the true value to the country of inputs and outputs of the project Synonymous with economic price and shadow price
Social discount rate 12 footnote 16 It attempts to reflect the social view on how the future should be valued against the present (See Discount rate)
Socio-economic costs and benefits 13 opportunity costs or benefits for the economy as a whole They may differ from private costs and benefits to the extent that actual prices differ from economic prices
Switching value 27-28 The switching value of a variable is that value that it would have to attain in order for the outcome of the project to fall below the minimum level of acceptability (net present value of the project equal to nil)
Time value of money Time value of money refers to the concept that money received in the present is more valuable than money received in the future It is the concept underlying discounting
Tradable 16 23 footnote Referring to a good that could be traded internationally in the absence of restrictive trade policies
Traded good 16 23 footnote A traded good is a good that is either exported or imported by some country
Transfer payments 15-17 22 Payments that redistribute wealth but do not use up resources or create them
Willingness to pay What consumers are willing to pay for a good or service Consumers willing to pay substantially more than the actual market price enjoy a consumer surplus (the amount they would pay minus the amount they actually have to pay)
With project scenario (WP) 11 Box 2 estimation simulation modelling of project envisaged costs and benefits
Without project scenario (WOP) 11 Box 2 the baseline scenario against which the additional benefits and costs of the with project scenario can be measured (eg business as usual)
43
VOLUME 1 BASIC CONCEPTS AND RATIONALE
Steps in economic analysis
Economic analysis requires assessment of a projectrsquos net impact on economic welfare
by considering
5 Convert all market prices into economicshadow prices (SP) that better reflect the social
opportunity cost of the good
6 Remove transfer payments (taxes and subsidies) and quantify externalities (positive
and negative)
7 Aggregate all modelsrsquo NIB cash flows respecting incorporation phasing patterns of targeted
beneficiaries into projectrsquos activities
8 Compare aggregated benefits with other project costs to obtain incremental discounted
cash flows Calculate economic performance indicators adopting a social discount rate
ENPV ERR BC ratio
9 Perform sensitivity analysis (SA) in order to deal with the main risks and uncertainties that
could affect the proposed project
Steps in financial analysis
The typical sequence of tasks to be undertaken in financial analysis is the following
1 Develop farmenterprise models and identify benefits and costs (investment and recurrent) for
WOP and WP scenarios (based on crop budgets)
2 Compare the discounted flows of benefits and costs and calculate the differences between the
obtained results and the WOP scenario in order to determine the net incremental benefits (NIB)
of the proposed interventions
3 Calculate the project financial profitability indicators of each model (ie financial NPV financial
IRR and BC ratio) applying these investment criteria to make an investment decision
(positive or negative)
4 Assess family incomes and establish financingcredit needs by performing a lsquosustainability analysisrsquo
Summary steps in financial and economic analysis
44
WP-WOP develop and identify
Develop farmenterprise models and identify benefits and costs (investment and recurrent) for WOP and WP scenarios (based on crop budgets)
Calculate indicators
Calculate the project financial profitability indicators of each model (ie financial NPV financial IRR and BC ratio) applying these criteria to make an investment decision
Financial sustainability
Assess family incomes and establish credit needs by performing a lsquosustainability analysisrsquo
Discount flows ndash costs and benefits
Compare the discounted flows of benefits and costs and calculate the differences between the obtained results and the WOP scenario in order to determine the net incremental benefits (NIB) of the proposed interventions
Shadow prices
Convert all market prices into economicshadow prices (SP) that better reflect the social opportunity cost of the good
Aggregation
Aggregate all modelrsquos NIB cash flows respecting incorporation phasing patterns of targeted beneficiaries
Cash flows
Compare aggregated benefits with other project costs to obtain incremental discounted cash flows Calculate economic performance indicators adopting a social discount rate ENPV ERR BC ratio
Transfers and externalities
Deduct taxes and subsidies ndash Consider positive and negative externalities
Perform sensitivity analysis
in order to deal with the main risks and uncertainties that could affect the proposed project
1
5
6
7
8
9
2
3
4
Economic analysisFinancial analysis
EFA step by step
International Fund for Agricultural Development
Via Paolo di Dono 44 - 00142 Rome ItalyTel +39 06 54591 - Fax +39 06 5043463E-mail ifadifadorgwwwifadorgwwwruralpovertyportalorg
ifad-unblogspotcom
wwwfacebookcomifad
instagramcomifadnews
wwwtwittercomifadnews
wwwyoutubecomuserifadTV
Contacts EFA desk
Eloisa de Villalobos Thomann
EFA Technical Adviser Tel +39 06 5459 2827Email edevillalobosifadorg
Enrico Mazzoli
Technical Adviser Tel +39 06 5459 2462Email emazzoliifadorg
- Acknowledgements
- Contents
- Abbreviations and acronyms
- Section I - Introduction
-
- Background
- Scope
- Outline
- How to read the guidelines
-
- Section II - Relevance of EFA
-
- Relevance of economic and financial analysis
- EFA as a decision-making tool in project planning
-
- Section III - Basic concepts in undertaking EFA
-
- Investment criteria profitability indicators
- Economic and financial analysis the differences
-
- Section IV - EFA of IFAD rural
-
- Focusing on lsquotypicalrsquo IFAD rural investment projects and their main benefits
- Unquantified benefits alternative methodologies to CBA
- EFA data sources collection and coherence
-
- Section V - EFA role throughout
-
- EFA in project design Links with the logframe and MampE
- EFA in project design Risk analysis
- EFA in project supervision implementation and ex post evaluation
- Ex post EFA and scaling up
-
- Technical annex
-
- Formulas for profitability indicators
- Cost-effectiveness
- Multicriteria analysis
- Types of projects and EFA activities
-
- References
- Glossary
- Summary steps in financial and economic analysis
-
VOLUME 1 BASIC CONCEPTS AND RATIONALE
The various steps in EFA provide information
to respond to these questions taking into account
that the decision is not simple projects require time
to develop and one wants to make certain that the
improvements in peoplersquos lives are permanent
EFA requirements technical and
institutional viability
EFA is only one part of the overall analysis of a
project it assumes that the project is technically
sound and that its institutional arrangements will
be effective during implementation In other words
EFA of investment projects requires at the least
that the project under analysis be feasible from the
technical and institutional points of view Projects
can be implemented through different institutional
arrangements and using different technical solutions
For a project to be viable at least one of these
institutional arrangements needs to be valid and at
least one technical solution needs to be viable As
will be seen the application of EFA during project
formulation will also help identify and select the lsquobestrsquo
project technical and institutional alternatives This
is a strong assumption as the review of numerous
cases has shown many inconsistencies in project
technical formulation
Commonly identified inconsistencies include
(a) incomplete or inadequate description of the
institutional arrangements for carrying out the
proposed project components (b) incomplete or
inadequate identification of constraints on productive
development For example the project (i) proposes
a new technology but there is no assessment
of the on-farm working capital requirements for
adopting it and consequently the project lacks the
required financing component (eg grants credit)
(ii) plans huge investments in irrigation facilities
but no provision has been made for the required
technological transfer services and working capital
needs (iii) proposes improvement of rural financial
services but there is no description of the expected
productive activities and technologies to be adopted
through the support of these facilities
Thus reviews of the technical proposals and
institutional arrangements for project implementation
are steps prior to EFA They involve preparation of an
adequate project logframe (reviewed at each stage
of the project cycle) which is essential in confirming
institutional viability
10
This section illustrates basic concepts so that the
non-specialist can become more familiar with the
terminology and purpose of EFA However detailed
information on carrying out EFA of projects is
provided in volume 2 of these guidelines
EFA is based on comparison of the net6 cash
flows of investment alternatives The present or
BAU cash flow is compared with at least one
other investment alternative which according
to the projectrsquos technical specialists will result in
amelioration of the producerrsquos situation
6 Net cash flows defined as Benefits discounted cash flow net from costs discounted cash flows
However in order to assess if the project is
making good use of public funds the costs of
implementing it (including the institutional setting
and capacity-building of both implementers and
producers) must be compared with the benefits
produced In other words the value added by the
project is compared with the incremental costs of
implementing it
In practical terms the analyst models diverse
beneficiary livelihood strategies to compare BAU
situations with the project proposal Description
of the BAU or without project (WOP) situation
although simple at first sight can confuse the analyst
regarding many aspects (box 2)
BOX 2
With project (WP) and without project (WOP) scenarios common issues
Accurate description of both WP and WOP scenarios is essential to a realistic assessment of
incremental benefits
1 WOP equal to zero When the project proposes development of a new activity many analysts
represent the WOP as a null scenario because the activity wasnrsquot present in the past
However the correct approach is to realistically represent the alternative activities
(eg off-farm employment)
2 Static or unrealistic WOP Generally WOP scenarios are presented as a static situation that
repeats itself through the years This is often underestimating the capacity of people to adapt
and progress Projects generally assist these processes and accelerate their returns
3 An inaccurate WP fails to assess the incremental net value of the project In a woodlot project
in Malawi that aimed to produce firewood analysts spent a great deal of time studying how
to value the incremental wood production since there was no market for the wood Finally
they decided on an international valuation of the energy created They missed the point In
the without situation women spent a great deal of time travelling to procure firewood with
the project they could spend their time producing more maize If the analysts had developed
realistic WOP and WP situations they would have realized that the benefits of the project
came from incremental maize not wood production
Basic concepts in undertaking EFA
SECTION III
11
VOLUME 1 BASIC CONCEPTS AND RATIONALE
Next one needs to formulate the WP situation
defining expected outcomes in the future by
identifying the requested investment and operating
costs as well as projecting estimated benefits7 In
order to convert future costs and benefits which do
not occur at the same time into todayrsquos values for
comparison discounting techniques are applied
Discounting permits comparison of the value of
money in different time periods considering that
a dollar today is worth more than a dollar received
tomorrow (ie the fact that we have to postpone
consumption makes tomorrowrsquos dollar less valuable
than todayrsquos) How much is $1 received in lsquonrsquo years
worth today The answer depends on the adopted
discount rate (r) and the discount period (n)8
Thus the aggregation of project flows occurring
in different years requires adoption of an appropriate
discount rate to calculate the present value of future
flows As a guiding principle discount rates should
represent the opportunity cost of capital for the
agent (producer or government)9 The other essential
element in discounting is definition of the discount
period (also called lsquoproject economic lifersquo or lsquotime
horizon analysisrsquo)
Usually the discount period is equivalent to the
lifespan of the largest investment components of
the project10
Finally the project net cash flows (ie financial
andor economic)11 are based on the incremental
approach which results from comparing the
WP and WOP situations With these elements it
is possible to calculate the corresponding project
lsquoprofitability indicatorsrsquo
7 The analysis is looking at future investments and outcomes thus sunk costs are irrelevant
8 The present value (PV) = future value(1+r)n If r = 10 and n = 8 years the present value of $1 would be $051
9 For the producer a realistic alternative is an average of the passive deposit rate of local commercial banks The government should instead consider the interest rate at which the country can actually borrow capital from a relevant international capital market alternatively the return on long-term public treasury bonds is also a suitable option More information on determining a relevant discount rate is provided in volume 2
10 This rule might change when (i) technological progress would make the investment obsolete before the end of its useful life (ii) the investment period is lsquotoo longrsquo (ie very common in environmental projects ship construction etc) or (iii) other factors exist (ie legal institutional etc) that justify another specific choice for the discount period
11 See the following subsection for differences between the two
Investment criteria profitability indicatorsGenerally speaking a project is considered lsquoviablersquo
if the sum of expected incremental benefits is
larger than the sum of all costs accrued in project
implementation This can be assessed through
profitability indicators12 The most relevant indicators
for these IGs are the net present value internal rate
of return and benefitcost (BC) ratio
bull The net present value (NPV) indicator is defined
as the sum that results when the expected
costs of the investment are deducted from
the discounted value of the expected benefits
(revenues) Whenever NPV gt 0 the project is
considered worthwhile or profitable Among
mutually exclusive projects the one with the
highest NPV should be chosen
bull The internal rate of return (IRR) indicator is
defined as the discount rate (r) that produces
a zero NPV This represents the maximum
interest rate that a project could face and still
not waste resources
For the project to be profitable the IRR has
to be greater than the interest rate that could be
earned in alternative investments thus when
IRR gt r the project is considered viable If the
(alternative) interest rate (imkt) also called opportunity
costs of capital is lower than the IRR the NPV is
positive and vice versa
IRR NPV 0gt gti mkt
IRR NPV 0lt lti mkt
12 Formulas can be found in the technical annex
12
VOLUME 1 BASIC CONCEPTS AND RATIONALE
Both NPV and IRR are calculated on the same
project cash flows of incremental net benefits
However in certain cases the calculation of
IRR is not possible and thus it cannot be used as a
profitability indicator
This is the case when (a) the flow of net
incremental benefits does not have a negative
element or (b) it presents more than one IRR
complicating the decision as to which one to
consider as the profitability indicator
Moreover IRR is an indicator that should not be
used to rank or select mutually exclusive project
options as it cannot provide a measure of the size or
magnitude of project value13 (box 3)
The NPV on the other hand is an indicator that
can always be calculated as is the case with the
benefitcost ratio
bull The (BC) ratio indicator is the ratio of the
present value of benefits to the present value
of costs over the time horizon The BC ratio
provides some advantages when a ranking of
alternative investment projects is needed under
budget constraints
If BC ge 1 the project is accepted
If BC lt 1 the project is rejected
13 Where a project is the only alternative proposal to the status quo the issue is whether the IRR provides worthwhile additional information Views differ in this respect Some argue that there is little merit in calculating a statistic that is either misleading or subservient to the NPV Others see a role for the IRR in providing a clear signal as regards the sensitivity of a projectrsquos net benefits to the discount rate Yet whichever perspective is taken this does not alter the broad conclusion on the general primacy of the NPV rule
These IGs consider that the most appropriate
indicator for appraising an investment project is
the NPV as the investment decision criterion is
straightforward if NPV is gt 0 the project is viable
It means that the proposed investment is a profitable
alternative in terms of resource allocations It is better
than the present and WOP situations and also better
than allocating the same resources to other economic
activities that will yield the average profit rate
Economic and financial analysis the differencesAll investment projects include a number of
stakeholders and this has implications for the
valuation of the benefits and costs accrued by
project interventions Whose costs and benefits
count14 Governments and society as a whole will
consider and value costs and benefits differently
from producers or any other private actor individually
From the perspective of a development agency such
as IFAD both points of view are relevant to a reply
to the guiding questions stated before Should the
government invest in this project Will the producer
take the risk
14 In the CBAEFA literature the question of lsquowhose costs and benefits countrsquo is known as the lsquostandingrsquo issue (ie whose welfare counts in the aggregation of net benefits)
BOX 3
IRR or NPV
Although the most appropriate indicator for appraising an investment project is the NPV ndash as it
can always be calculated and will provide information on the magnitude of the return ndash the IRR is
the most commonly used This is probably due to the fact that IRR is expressed as a percentage
which is often wrongly associated with other rates of return such as interest rates (r) or profit rates in
alternative allocations In fact the IRR has no meaning in terms of project value or size
To prove this letrsquos suppose a project is one thousandth the size of another project Simply multiply
each side of the equation by 1000 The calculated IRR will not change but the small project entails
less value The project to be chosen from a social point of view would be the one producing the
bigger returns to the economy and the NPV will clearly show this while the IRR will not
13
VOLUME 1 BASIC CONCEPTS AND RATIONALE
In order to consider these points of view analysis
will be conducted on two levels (a) financial analysis
will consider private stakeholdersrsquo interests15 and
(b) economic analysis will consider government
and society perspectives These two viewpoints will
require the analyst to consider different items
when looking at the benefits and costs of a project
valuate them differently and in some cases even
use different rates to discount the streams of costs
and benefits
The private investor exclusively considers the
costs and benefits related to the productivemarket
aspects of the project while analysis from an
economic point of view considers that benefits are
defined as an increase in social well-being16 The
costs are defined as reductions in social well-being
For a project to be economically viable its social
benefits must exceed its social costs
15 This point of view is also applied to the executing agency of a public project
16 The term lsquosocial welfarersquo or lsquowell-beingrsquo is used in these IGs as a simple monetary measure The definition is taken from neoclassical economics and prevailing economic theories of well-being No attempts are made to include any type of measurement of subjective happiness or to develop any well-being indexes or social indicators
Thus from the perspective of a private
stakeholder (financial analysis) participating in the
investment with risk capital the wealth created by
a project in lsquonrsquo periods of time is defined as the
financial NPV (FNPV) The economic or cost-benefit
analysis looks at the overall impact of the project
and takes the point of view of the collective agent
(eg society) and the wealth created by a project in
lsquonrsquo periods of time is defined as the economic NPV
(ENPV) of the investment produced by the project17
In financial analysis all costs and benefits
should be valued at market prices Only cash inflows
and outflows are considered (depreciation reserves
and other accounting items not corresponding to
actual flows are excluded)
17 In rural development projects where the agent is a subsistence farmer accumulated generated cash per year must be at least equal to or higher than the BAU situation that was ensuring hisher familyrsquos survival
BOX 4
Steps in financial analysis
The typical sequence of tasks to be undertaken in financial analysis is the following
1 Develop farmenterprise models and identify benefits and costs (investment and recurrent) for
WOP and WP scenarios (based on crop budgets)
2 Compare the discounted flows of benefits and costs and calculate the differences between the
obtained results and the WOP scenario in order to determine the net incremental benefits (NIB) of
the proposed interventions
3 Calculate the project financial profitability indicators of each model (ie financial NPV financial
IRR and BC ratio) applying these investment criteria to make an investment decision (positive or
negative)
4 Assess family incomes and establish financingcredit needs by performing a lsquosustainability analysisrsquo
Financial sustainability is ensured if the accumulated generated cash per year is positive or
at most equal to zero17 for all years considered On the contrary if this figure is negative at any
point in time the project is not sustainable meaning that there are not enough financial resources
to cover all the costs and it will be necessary to reassess project financing mechanisms
14
VOLUME 1 BASIC CONCEPTS AND RATIONALE
Economic analysis or cost-benefit analysis
builds on the results of financial analysis with the
additional consideration of impacts and benefits not
directly captured by the latter These analyses are
strictly related as shown in Figure 4
The main steps in financial analysis are
summarized in box 4 A detailed description of
building economic analysis from financial models is
provided in volume 2 which illustrates each step in
EFA of a typical IFAD production-oriented project
In economic analysis the analyst needs to
complement financial analysis by considering all
project impacts on the society The private actor is
generally not interested in considering all negative
or positive impacts that his actions may have on the
rest of society In terms of environmental impact
for example polluting rivers through production
discharges or emitting CO2 are social costs generally
not considered by the private agent These are called
lsquoexternalitiesrsquo as in practical terms the private agent
is lsquoexternalizingrsquo a production cost making the whole
society pay for it On the other hand there also exist
positive effects not counted by the private agent
such as the introduction of new pastures by a single
producer which can increase honey production in
the area and benefit neighbouring beekeepers
These aspects are known as positive and
negative externalities In addition economic analysis
must eliminate all transfer costs between national
and private actors (ie subsidies and taxes) Lastly all
costs and benefits need to be valued at their social
opportunity cost rather than at their market price
F IGUR E 4
Economic and financial analysis links
Aggregation
Project net incremental
benefits(NIB)
Farm budgets properly phased
Activity budgets (eg processing enterprises)
phased
Government implementing
agencies
Financial analysis(market prices)
123n
123n
Farm budgets properly phased
Activity budgets (eg processing enterprises)
phased
Government implementing
agencies
sum
sum
sum
Economic analysis(economic values)
123n
123n
Adjust market values to economic
values
Eliminate transfer
payments (taxes and subsidies)
Quantify externalities
15
VOLUME 1 BASIC CONCEPTS AND RATIONALE
Many times for example when trade barriers
are in place or when currencies are controlled
market prices do not reflect the social value of
goods In order to account for these distortions
one of the most critical tasks is the calculation of
economic or shadow prices Another critical aspect
is the establishment of a social rate of discount
that realistically reflects an investment alternative
(opportunity cost) for the government18 Detailed
explanations and guidelines for these calculations
are also included in volume 2
Table 1 illustrates the process of going from
financial to economic analysis19 The financial
analysis section at the top shows revenues and 20
production costs (operating and investment) of a
hypothetical enterprise The enterprise is experiencing
18 As a general rule when a country is a capital borrower the social rate of discount should be no less than the actual rate of interest on the capital market from which the capital is borrowed
19 Clicking on the table reveals the formulas
20 See section on ldquoUse of SA to assess project risks an examplerdquo
several years of negative net cash flows resulting
in a negative NPV and IRR This is caused by high
operating costs as well as recurrent needs for
investment Economic analysis converts market
prices into economic prices As reflected by the
application of conversion factors (CF) market prices
of outputs and inputs are different from their social
value For example the CF applied to wages reflects
the presence of high unemployment (20 per cent)
in the area which would push people to work for
lower than market wages (thus CF = 08)21 In the
same way the CF applied to investments reflects
the presence of high transport costs or duties that
make the productrsquos market price overestimate its
social value In fact the market price is 83 while the
economic price is 75 and thus the CF is 09
21 Market wage (mW) = US$100 unemployment = 20 economic wage(eW) = US$80 (observed given the high unemployment) CF = eWmW = 80100 = 08
BOX 5
Steps in economic analysis
Economic analysis requires assessment of a projectrsquos net impact on economic welfare
by considering
5 Convert all market prices into economicshadow prices (SP) that better reflect the social
opportunity cost of the good
6 Remove transfer payments (taxes and subsidies) and quantify externalities (positive and negative)
7 Aggregate all modelrsquos NIB cash flows respecting incorporation phasing patterns of targeted
beneficiaries into projectrsquos activities
8 Compare aggregated benefits with other project costs to obtain incremental discounted cash
flows Calculate economic performance indicators adopting a social discount rate ENPV ERR
BC ratio
9 Perform sensitivity analysis (SA) in order to deal with the main risks and uncertainties that could
affect the proposed project20
Critical parameters are (i) SP for tradable and non-tradable goods (ii) SP of foreign exchange
(iii) SP for labour costs (shadow wage) and (iv) the social discount rate
16
VOLUME 1 BASIC CONCEPTS AND RATIONALE
Fiscal corrections are also applied and
10 per cent VAT is deducted from all inputs and
outputs with indirect taxes Finally externalities
are accounted for and quantified both negatives
(increases in noise) and positives (decrease
in pollution)
The project under analysis resulted not profitable from a financial point of view but viable
from an economic point of view This means that
the overall impact for society is positive (also
reflected by the positive externalities) but there
are no sufficient incentives for the private
individual agent to undertake these activities
This conclusion suggests that if the development
objectives achieved through this investment are
significant enough for the government then the
project should develop an incentive scheme to
attract the private agent
These results may be used in policy dialogue
suggesting that the government could reduce the
level of targeted import duties and thus make this
investment proposal financially profitable
TA BLE 1
From financial to economic analysis an example
Financial analysis (market prices)Thousands of United States dollars
Years
1 2 3 4 5 6 7 8 9 10
Total operating revenues 0 42 115 119 126 126 126 126 126 126
Total Inflows 0 42 115 119 126 126 126 126 126 126
Total operating costs 0 -56 -75 -98 -101 -101 -101 -101 -117 -117
Total investment costs -165 -4 -4 -25 -3 0 -25 0 0 12
Total outflows -165 -60 -79 -123 -104 -101 -126 -101 -117 -105
Net cash flow -165 -18 36 -4 22 25 0 25 9 21
Financial rate of return -6
Financial NPV10 US$(89)
Economic rate of return 36
Economic NPV10 US$473
Years
Economic analysis CF 1 2 3 4 5 6 7 8 9 10
Output X 12 0 49 134 139 147 147 147 147 147 147
Total operating revenues 0 49 134 139 147 147 147 147 147 147
Labour costs 08 0 -18 -18 -26 -26 -26 -26 -26 -30 -30
Operating costs 11 0 -36 -57 -73 -76 -76 -76 -76 -87 -87
Total investment costs 09 -149 -4 -4 -22 -3 0 -22 0 0 11
Fiscal correction outputsa 09 0 44 121 125 132 132 132 132 132 132
Fiscal correction inputsa 09 -134 -36 -55 -85 -71 -68 -88 -68 -78 -68
Externalities 0 20 20 20 20 20 20 20 20 20
Decreased pollution 0 23 23 23 23 23 23 23 23 23
Increased noise 0 -3 -3 -3 -3 -3 -3 -3 -3 -3
Net cash flow -282 39 161 98 144 149 107 149 124 145
a VTA of 10 has been eliminated
1 Adjust market values to economic values applying CF2 Eliminate transfer payments (taxes and subsidies)
3 Quantify externalities
17
SECTION IV
IFAD rural investment projects include projects
in integrated rural development irrigation rural
finance value chain development natural resource
management (NRM) climate-change adaptation
and mitigation community development and
institutional strengthening
As IFAD follows its main mandate of focusing its
projects on benefiting poor rural people22 projects
are characterized and designed through identification
of a target group composed mostly of rural people
Poor rural people represent different productive
and economic categories the main one being
smallholders Others include the landless population
engaged in rural non-agricultural microenterprises
rural workers fishers and finally special vulnerable
groups such as women indigenous minorities and
youth All IFAD projects must be formulated on
the basis of benefiting one or more of the above-
mentioned poor rural groups
The increased number of value chain projects
in IFADrsquos portfolio23 ndash aiming to integrate IFADrsquos
traditional target groups into these chains to improve
their access to secure markets and sustainably raise
their incomes ndash has expanded the definition of IFADrsquos
target group to all rural people including small- and
medium-scale entrepreneurs in rural areas However
for the purposes of EFA the impact on poor rural
people is the one that matters the most to IFAD24 and
22 See IFAD Lending Policies and Criteria I (5) ldquoIFAD will concentrate its resources upon activities that promise to achieve in a cost-effective way a reduction of poverty in rural areas where most poor people live and work The Fundrsquos major target groups irrespective of the stage of economic development of the country will be the small and landless farmersrdquo
23 From only 3 per cent in 1999 to 46 per cent in 2009 (Raswant and Heinemann 2012)
24 However when possible and relevant distribution of benefits among value chain actors is a complement to CBA
to the poverty-reduction development objectives of
each government
This IFAD specificity has direct consequences for
CBA discussion of the lsquostandingrsquo issue As previously
stated investment projects include a number
of social stakeholders However for IFAD rural
investment projects this is not a major issue as the
formulation of IFAD projects is focused on benefiting
a specific target group poor rural people25
Focusing on lsquotypicalrsquo IFAD rural investment projects and their main benefitsThe typical IFAD project is usually production
oriented26 and its main outcomes (ie financial and
economic benefits) are frequently net production
increases In other words most IFAD projects will
have a direct impact on the production levels
of target groups which in turn will lead to net
income increases
IFAD projects have an impact on the incomes
of poor rural people by increasing their access to
inputs and services that will subsequently increase
their production volumes andor productivity
The most common areas of intervention include
technical assistance (TA) for crops and livestock
through extension services rural finance services
25 There might be exceptional situations in which other social groups could benefit from an IFAD project These cases might require additional analyses (eg distributional effects analysis) when undertaking EFA
26 Of 114 projects reviewed by QE from 2009 to 2011 73 per cent were agriculture- or rural development-related while in 16 per cent the core objective was to strengthen financial services The rest focused on capacity-building or NRM These data show that most IFAD projects can be characterized as production-oriented that is designed to have direct impact on production and productivity increase
EFA of IFAD rural investment projects
18
VOLUME 1 BASIC CONCEPTS AND RATIONALE
to support on-farm investments and increased
access to working capital through creditloan27 or
grant facilities improved water management through
the construction of irrigation structures provision
of storage drying and cooling facilities to enhance
post-harvest preservation and technical advisory
and financial resources to support entrepreneurs
in starting small and microenterprises ndash as well as
combinations of the above
This IFAD specificity leads to some
straightforward requirements when analysing its
financial and economic results First the project
should be assessed in terms of the financial feasibility
and sustainability of targeted beneficiaries second
the project should be assessed in terms of economic
profitability for the whole national economy
Thus in IFAD production-oriented projects the
main household-level goal in financial analysis is to
determine whether the producer28 will have enough
incentives to participate in the project
In simple terms analysis needs to establish
whether the farmer should undertake the proposed
intervention under the criterion that it is financially
viable (ie the benefits over time are higher than the
investment and recurrent costs) and that these net
benefits exceed present returns (ie incremental
benefits are positive)
However even if the new situation (WP) is more
appealing than the present one (WOP) could the
farmer afford to adopt improved practices Although
viable the investment may still not be profitable if it
does not generate enough returns (mostly during the
first years) to cover the farmerrsquos needs Where the
producer is living under the poverty line the project
should at least generate the same net income each
year as in the BAU situation (subsistence system)
to ensure hisher participation Where poverty levels
are lower incomes should be adequate to cover
investment and working capital needs in addition to
27 Comprising inclusive innovativeadapted rural finance products and services including risk management strategies savings financial literacyeducation programmes etc
28 The terms lsquofarmerrsquo lsquoproducerrsquo or lsquoprivate stakeholderrsquo will be used throughout the IGs as synonyms for the term lsquoprivate agentrsquo in financial analysis
the farmerrsquos living expenses The lack of initial capital
to invest is generally a huge barrier to engaging in
a new activity A financial analysis will determine if
farmersrsquo cash flows are adequate to undertake the
activities (ie it will clearly identify a farmerrsquos financial
needs and hisher repayment capacity)
Even when a financing scheme will prove the
feasibility of the investment there are many risks
involved in changing a farmerrsquos practices (business
as usual) above all if it involves taking out a loan
in an uncertain agricultural environment Thus the
last question to be answered is would the farmer
take the risk are there enough incentives Risks
faced by farmers are many and extremely difficult
to manage29 The only measure of their willingness
to change habitstechnologies will be by comparing
their returns to the opportunity costs of remaining
in the actual situation If for example the returns to
labour of the new activity prove to be much higher
than the average rural wage it is probable that a
farmer would be willing to invest his time in his own
farm and take the risk
In other words financial analysis will establish
whether farmers will obtain a net incremental benefit
(financial viability and profitability analysis) if theyrsquoll
have enough working capital to buy the additional
farm inputs or to bear the costs of stocking
processed goods (financial sustainability) and finally
if financial incentives are enough to convince them to
change existing practices
The practical way to undertake this analysis is by
developing different beneficiary productive profiles
ndash considering several types of productive activities
lsquofarm-systemsrsquo and lsquoactivity-modelsrsquo ndash as well as how
many and which types of people generally engage in
these activities in this particular area
On the basis of the individual models of financial
analysis ndash and once the three steps in converting
market prices into their economic value have been
29 For example risks in the areas of production prices casualties technology climate ndash to name just a few
19
VOLUME 1 BASIC CONCEPTS AND RATIONALE
completed ndash economic analysis of the project as a
whole can be undertaken30 This is done by means
of the aggregation that in project analysis is the
process of adding together the costs and benefits
of all the entities participating to reach a summary
account from which a measure of project worth can
be derived The result of the aggregation is the net
incremental benefit or cash flow of the project31
Lastly the goal of economic analysis is to answer
the question of whether it is worthwhile to invest
public resources in the overall project proposal
(should the government invest) It will focus on the
perspective of the entire country and it measures the
effects of the project on the economy as a whole
Unquantified benefits alternative methodologies to CBAThe majority of IFADrsquos projects are production-
oriented interventions in which expected outcomes
are tangible and easily quantifiable however due to
IFADrsquos typical target group many of these projects
are complemented by activities seeking an impact
on less-tangible aspects of rural poverty alleviation
Womenrsquos empowerment increased access to assets
and services enhanced capacities ownership and
land titling are examples of this important part of
IFADrsquos overall project impact However these types
of benefits which are more difficult to measure or not
measurable in monetary terms (intangible benefits)
are often excluded from CBA
In addition environmental and social benefits
resulting from the promotion of resilient agricultural
practices or social infrastructure such as rural roads
irrigation schemes or market infrastructure are also
seldom included in CBA In order to change this
trend these IGs will provide some ideas on how to
allocate value through the use of valid proxies to
measure the impact of these intangible social andor
environmental benefits
30 Some analysts proceed by aggregating the financial analysis and then converting the aggregated results into their economic value It can be argued that this stage of analysis is useless as the financial profitability indicators for the project as a whole have no use in terms of investment decisions
31 See volume 2 and its annex for more details on the lsquoaggregation issuersquo and common mistakes
In the particular case of CDD projects where
communities collectively decide on the allocation
of project resources it is very difficult to foresee
which productive activities will be targeted However
markets and agronomic conditions in the project
area will limit the scope of activities that can be
successfully undertaken In these cases the fact
that communities are making participatory decisions
will grant the additional benefits that ownership
provides ensuring higher adoption rates than
average and increasing the sustainability of the
chosen interventions
In cases where the identification and valuation
of benefits is difficult simple and sensible ways
of estimating tangible benefits should be applied
Table 2 presents an overview of suggested
approaches to transforming such benefits into
tangible values so as to include them in overall
project cash-flow analysis from the most common
complementary activities in IFADrsquos projects
Additionally the IGs will introduce two methods
alternative to CBA for those cases where not even
proxies could be measured cost-effectiveness
and MCA32 The latter has not yet been tested
as a suitable tool in IFAD project designs but is
suggested as an alternative in cases of complex
decision-making
Cost-effectiveness
When tangible benefits from a given investment
are difficult to quantify but the costs are easily
identifiable the most commonly used valuation
method is cost-effectiveness which is used to select
the least-costly alternative among a set of options
that will achieve the same result (a given set of
predetermined objectives) Once the purpose of the
project has been decided for example construction
of a market storage facility cost-effectiveness would
be used to compare scale location technology
etc in order to choose between investment
32 See the technical annex for more details
20
VOLUME 1 BASIC CONCEPTS AND RATIONALE
Project componentsactivity Quantifiable benefits
Productivity enhancement (including irrigation post-harvest and processing) Storage drying cooling facilities irrigation
bull Reduced post-harvest losses
bull Increased value and volumes of production due to investments in storage cooling or small processing facilities (drying or milling)
bull Increased production and productivity due to water provision
Value chain (VC) Collective marketing warehouse receipt systems increased market information
bull Increased value of final product owing to increased quality and access to markets improved handling packaging and commercialization
bull Financial benefits to all actors along the VC
bull Microenterprise and employment creation
bull Creation of internal and external markets that did not exist before investments
Rural roads bull Reduced transport and vehicle maintenance costs (incl vehicle operating costs [VOC] and travel-time costs [TTC])
bull Access to areas not accessible before hence increased total production
bull Increased volume of transported agricultural products for sale (reduced losses)
bull Reduced transport costs due to better access to sales points
Domestic water supply bull Time saved in procuring water
bull Reduced sickness through better water quality
bull Reduced water losses due to leakage
bull Increased productivity through small-plot crop irrigation and through provision of water for livestock
bull Introduction of backyard gardening
Climate adaptation and resilience practices Changes in tillage practices crop rotations landsoil conversion afforestation energy-efficient systems flood prevention
bull Reduced land erosion an estimate of saved nutrient content can be valued at price of fertilizer needed to replace that nutrient content
bull Increased crop timber and livestock yields through soil preservation conservation tillage and agriculture
bull Increased final product value due to labelling as organic agricultural practices
bull Avoided rehabilitation costs for public infrastructure destroyed by natural disasters
bull Energy savings owing to replacement of old practices by eco-friendly artefacts (eco-stoves solar panels etc)
Land registration Land tenure security may translate into increased land value explained by
bull Long-term Investments in land fertility
bull Improved access to credit as land can be used as collateral
bull Greater dynamism of land markets
bull Environmental benefits as a result of better NRM (people improve or maintain forest andor tree cover)
TA BLE 2
Simple sensible ways of valuing different types of benefits
21
VOLUME 1 BASIC CONCEPTS AND RATIONALE
options (eg open storage location of a facility
construction materials) Unfortunately the results of
this method which can justify project investment
decisions cannot be integrated into the streams of
incremental net benefits resulting from classic CBA
thus underestimating the overall benefits of
the investment
Multicriteria analysis
MCA is a decision-making tool for evaluating
complex decision problems where the options
entail many different objectives Unlike CBA MCA
allows consideration of aspects other than economic
and financial ones for example both quantitative
and qualitative data It builds trade-offs between
criteria that in complex decision-making are usually
in conflict (efficiency and equity for example) 33
and is an important instrument in ranking different
options and discriminating between acceptable and
unacceptable possibilities
The main advantages of MCA are its openness
explicitness and power to simplify complex
situations This process eases the discussion and
promotes communication first within the decision-
33 Another example would be when production objectives are in contraposition to environmental ones For example to increase livestock production for food security and at the same time reduce CO2 emissions
Project componentsactivity Quantifiable benefits
Rural finance bull Efficiency gains in financial system can lower operational costs and ensure self-sufficiency and sustainability of financial services supply
bull Shifts in portfolio composition of financial service providers (productive loans versus consumption)
bull Incremental taxation revenues to government
bull Potential productivity increases through financing of working capital (incremental benefits to clientsborrowers)
bull Economic benefits of transfer effects
Community development (CD) bull Improvements in lives of beneficiary households (value these in money equivalents if possible)
bull CD activities result in high empowerment and ownership of project activities which could translate into greater sustainability
Indigenous peoplesrsquo (IPs) knowledge
bull When IPs are supported in applying their knowledge ownership of project activities is ensured as well as sustainability of activities This can translate into low implementation risk and high uptake (adoption rates)
bull Generally IP practice are environmentally friendly thus reducing stress on natural resources
bull Nutritional aspects are also part of the positive impacts
Institutional strengthening bull Improved institutional capacity has generated or will generate benefits for target groups
bull Losses avoided by strengthening the institution looking at the sensitivity analysis assess how delays in implementation (due to institutional weak capacities) affect project outcomes and use that data to calculate losses avoided
Source PTA ndash EFA desk elaboration
22
VOLUME 1 BASIC CONCEPTS AND RATIONALE
making body and later between that body and
stakeholders MCA can be an ex ante (lsquobefore the
factrsquo) and an ex post (lsquoafter the factrsquo) evaluation tool
This type of analysis also presents some difficulties
One concerns definition of the comparative criteria
Use of MCA requires knowledge of mathematical
notions data aggregation methodologies and
computer applications to perform analysis following
a structured process and to avoid weak conclusions
It is often costly and time-consuming
EFA data sources collection and coherenceThe value of EFA as a decision tool hinges on the
quality of the data and assumptions that underpin
it Data availability is a widespread problem for
EFA analysts who should always work in close
collaboration with expert colleagues (agronomy
livestock and rural infrastructure experts) who will
provide or validate the key technical parameters of
the analysis34
Data regarding project costs should be collected
during design missions in consultation with the rest
of the team Once the first results from EFA are
reached they should also be shared with the team
to discuss how they affect expected outcomes and
assumptions For example planned investment costs
may not be sufficient to reach the number of target
beneficiaries outcomes of specific components may
not be appealing from a financial point of view etc
Although it is the responsibility of the EFA analyst
to gather and ensure data consistency among
sources the mission leader should promote and
facilitate dialogue among mission members and
provide sufficient time for the analyst to collect and
process data to ensure EFA quality and coherence35
34 Alternatively FAOSTAT is the most reliable and recommended source of data (httpfaostatfaoorg)
35 It is estimated that at least five weeks are needed for elaboration of a complete EFA one week for data gathering two weeks of mission and two weeks for data processing
For the other parameters of EFA analysis such
as conversion factors and discount rates one
of the most important sources of data is always
the national planning offices If these data are not
available evaluations of completed operations by
the Independent Office of Evaluation of IFAD (IOE)
can be used as a reference36 These can provide
reference values for similar projects or projects
in the same country (and region) for example on
uptake (adoption rates) of a specific technology or
constraints on input availability
Moreover economic and financial analysis in
appraisal reports for the same country (andor region
andor sector) ndash from IFAD and other IFIs such as
the World Bank or regional development banks ndash are
potential sources of information on key parameters
such as discount rates37
However any project analyst should rely on his
her best judgment accumulated through experience
when deciding on the assumptions to be used
36 Evaluations by country and region are available at wwwifadorgevaluationpublic_htmleksystdocprjindexhtm
37 FAOrsquos Monitoring and Analysing Food and Agricultural Policies (MAFAP) programme develops estimates for standard conversion factors the social exchange rate (SER) for different countries and currencies and other important parameters for estimating shadow prices such as the transport costs duties and taxes instrumental in calculating parityborder prices for tradable goods (wwwfaoorgmafaphomeen Country reports can be found at wwwfaoorgmafapproductscountry-reports-technical-notesen)
23
SECTION V
To increase the efficient use of EFA it is important to
view this analysis as an integral part of project design
information and not only as a mandatory study done
for compliance with IFAD quality requirements
To do so there should be continuous review and
refinement of EFA at all stages of the project cycle
It is part of the monitoring and evaluation (MampE) and
knowledge management functions to inform decisions
on adjustments to design and implementation
modalities in pursuit of project objectives
As a first step the data used for EFA in
project design should be periodically updated
by the projectrsquos MampE system and supervision
implementation support missions should verify that
this has taken place If significant changes occur in
the data ndash particularly those for which the sensitivity
analysis showed higher sensitivity ndash the IRR NPV
and cost-benefit ratio should be recalculated
In the light of new data (eg prices for inputs
and outputs demand forecast for project outputs
andor adoption rates) ndash and taking into account
the results of updated EFA including identified
risks and suggested mitigation measures ndash it may
become appropriate during project supervision
andor implementation support missions to decide
to reallocate resources among activities andor
components shifting from those that contribute less
according to the new constellation of data to those
that would contribute more to the projectrsquos objectives
Moreover the EFA spreadsheet prepared during
project appraisal should remain available for review
during project implementation and evaluation This
serves as an indicator of compliance with the EFA
requirement for design documents and the new RMF
indicator as stated in the relevance section It would
also facilitate the updating process indicated in the
preceding paragraph
The purpose of EFA in each phase of the project
cycle including evaluation is indicated in the
following table
TA BLE 3
EFA at different stages of project cycle
Project cycle stage Role of EFA Form of analysis
Concept Definition of investment criteria
bull Purely ex ante ndash all benefits and costs are based on estimates of future values
Project design Resource allocation decisions
bull Purely ex ante ndash all benefits and costs are based on estimates of future values
Supervision ndash early stage
Resource reallocation decisions
Newly Identified risks
bull Mainly ex ante ndash some costs may be ex post but most benefits will still be based on future estimates
Midterm review (MTR) bull Mainly ex ante ndash some costs will be ex post but estimation of future benefits will be based on evidence accrued during first half of project
Supervision ndash later stages
bull About 50 ex post50 ex ante ndash costs will be increasingly based on actual results but benefits are generally lagged by several years at least and will continue to accrue over life of investment
Project completion report (PCR)
Assessment of results bull Mainly ex post ndash all costs and some benefits will be based on actual results but benefit stream for residual life of investment will remain an estimate of future values
EFA role throughout IFADrsquos project cycle
24
VOLUME 1 BASIC CONCEPTS AND RATIONALE
Table 3 also describes the form of analysis
undertaken at each stage of the project cycle which
ranges from purely ex ante during project design to
partly ex post initially with regard to costs and later
to benefits and finally purely ex post for investment
costs but only partly ex post for recurrent costs
and benefits In this example a fully ex post analysis
would only be possible after 20 years which lies
more in the realm of policy analysis than project EFA
Given its purpose EFA is currently used mostly
as an ex ante tool to guide project formulation and
justify investment decisions Nevertheless it could
make a bigger contribution to IFADrsquos mandate for
rural poverty reduction if it were used in some of
the following ways
At concept
bull At COSOP38 andor project conception previous
evaluation ex post reports elements from
previous EFAs or speedy financial assessments
of intended investments could serve as
screening criteria for the validation of proposed
investment ideas For example a previous study
on the investment requirements for a specific
irrigation technology may help establish a
minimum area to be covered by projects in order
to produce sufficient benefits to overcome
project investments
At design
bull For component selection ex ante assessment of
component viability during design
bull For cost validation EFA will confirm whether
estimated project investment costs are sufficient
to cover proposed interventions as well as define
beneficiariesrsquo contributions and their financial needs
bull In the logframe EFA can provide realistic and
consistent outcome indicators
bull For risk management EFA will provide grounded
information for the effective design of mitigation
measures applied to changing circumstances in
order to understand and manage risk
38 Country strategic opportunities programme
At implementation
bull To terminate or modify activities that are not
generating satisfactory financial results for the
intended beneficiaries and economic impact for
the country as a whole
bull For MampE Updating EFA to changing
circumstances will provide up-to-date evidence
of realistic outputs outcomes and impacts As
an MampE and knowledge management tool it can
facilitate learning within and between countries
about what works and what doesnrsquot in terms of
financial and economic impact This knowledge
can also be used to guide the design of country
programmes through the COSOP
bull EFA can also be used as a risk management
tool during implementation Where new risks
are identified or design assumptions are found
to be incorrect remedial action may be needed
including reallocation of resources among
components andor expenditure categories
Early in implementation EFA could contribute
to adaptation to changing circumstances such
as commodity prices production technologies
and institutional and policy changes which
may suggest that different or better approaches
be adopted modifying the design andor
implementation arrangements
At evaluation
bull As an ex post impact assessment tool by
incorporating EFA in IOErsquos PCR and country or
project evaluations in order to compare expected
and actual project results
bull To inform decisions on scaling up or replication
of successful initiatives including the scaling
up of grant-funded activities into full-scale
loan-funded projects
bull Ex post EFA assessment may suggest
discontinuation of approaches that are not
working and scaling up of those that are
25
VOLUME 1 BASIC CONCEPTS AND RATIONALE
Goal bull 20 increased average
income in 29000 HH
C1 bull 29000 farmers linked
with VCbull US$64 m in loans
distributed
C2 bull 29500 HH new crops
amp improved yields 15bull 2000 ha irrigatedbull 83 km rural roads
C3 Overall implementation
EFA in project design Links with the logframe and MampEIn addition to a complete EFA assessment IFADrsquos
mandatory design documents require presentation
of a logframe detailed cost tables disaggregated by
component financier and expenditure categories
and formulation of an MampE system
These three elements should be closely linked
The logframe provides a global picture of project
objectives and describes through components the
activities that will be put in place to achieve them
along with measurable indicators to monitor progress
and achievements The cost tables assign a cost
to each of these activities and MampE measures their
impact EFA is the technical vehicle that attaches an
expected benefit or outcome to the costs of each
envisaged activity It defines the causal chain of
effects between a projectrsquos inputs and outcomes
In other words many of the logframe sections
can and should be completed with information
coming from EFA These indicators should also be
used as part of the MampE system in order to maintain
coherence between planned interventions and
expected outcomes from the very beginning
In order to illustrate this causal chain a clarifying
example is provided in Figure 5 to explain how through
EFA certain inputs will be transformed into outcomes as
a result of the project The example has been extracted
from an ongoing IFAD project with a total project cost
of US$119 million to finance three main components
C1 value-chain market linkages development C2
improved agricultural practices and infrastructure
and C3 the project management unit (PMU)
As shown in Figure 5 uptake indicators
(ie number of expected beneficiaries) and overall
project impact of 20 increased incomes in
29000 HH have been directly estimated through
EFA (shown by the visible arrow) The same has
been done for expected outcomes from productive
interventions ndash such as improved crops and cropping
techniques complemented by irrigation infrastructure
under C2 ndash that will result in an average increase
in yields of 15 per cent However there are some
project activities for which it is more difficult to
F IGUR E 5
Practical example of linking EFA with the logframe costs and MampE With what For what
Objective Increase sustainable HH income
C1 Promote VCbull Capacity-building for
farmersrsquo groupsbull Link with farmers
and investment fund
C2 Support farmersbull Improved crop varieties
and TAbull Irrigation and road
infrastructure
C3 PMU
Total costs bull US$11946 m
Costpers US$740
C1 US$1875 mbull Capacity-building
US$3Mbull Link US$063 mbull Investment fund US$1512 m
C2 US$787 mbull Better crops US$643 mbull TA US$5 mbull Infrastructure
US$94 m
C3 US$105 m
LogframeImpact (MampE)
Projectcosts
Logframe Projectcosts
Impact (MampE)
EFA defines the causal chain
EFA can translate project inputs into results
26
VOLUME 1 BASIC CONCEPTS AND RATIONALE
measure impact (represented by the fading arrow)
In the example the development of stronger links
between farmers and agribusiness and improved
market access through construction of rural roads
will certainly have an impact on beneficiary access
to markets but this is not easily quantified by
measuring the number of meetings held by these
groups It would be better reflected in increases in
volumes sold and the prices received by farmers
Moreover indirect benefits from project activities
should also account for other rural people that will
benefit from the roads and are also not included in
the analysis Finally several project costs will not
produce any direct benefits but the activities they
fund are fundamental in the delivery of the overall
project For example all costs regarding the PMU
as well as awareness-raising campaigns and other
types of lsquosoftrsquo interventions
In summary the logframe provides a structure
that can help organize the data and assumptions
used in EFA elaboration Key data for estimating
costs and benefits and assumptions made
concerning incremental yields adoption rates etc
should be incorporated into the logframe and used
as indicators in the MampE system
While useful EFA cannot provide all relevant
indicators required in the logframe For example
third-level indicators (eg on reduced stunting or
increased HH assets) in IFADrsquos Results and Impact
Management System (RIMS) will still need to be
collected through baseline surveys in the early phase
of implementation
Finally it is important to distinguish output from
outcome indicators in the logframe39 During the
initial years of a project supervision should focus
on the output indicators As project implementation
proceeds the focus should shift to (or at least
include) outcome indicators which provide key data
to compare with the initial EFA assessment
39 A good practice example of a logframe distinguishing between output and outcome indicators is the Project for Agricultural Development and Economic Empowerment in Cambodia (EB 2012105R15Rev1 wwwifadorggbdocseb105eindexhtm) It should be noted that Annual Reports on Quality Assurance in IFADrsquos Projects and Programmes (eg document EB 200998R57) have called attention to imprecise development objectives and lack of quantified final and intermediate outcome indicators to track progress towards achieving objectives This deficiency also affects the quality of EFA and the possibility of using it during project supervision and implementation support Thus improved quality of the logframe can contribute to improving the quality of EFA and to enhancing its use during this phase
EFA in project design Risk analysisEconomic analysis of projects is by definition
built on uncertain future events Estimation of the
basic elements of this analysis (costs and profits)
inevitably involves explicit or implicit probability
judgments In order to contain and measure
the impact of these uncertainties on project
results there are some techniques that help
detect the lsquocritical variablesrsquo or sources of major
risks and set the basis for introducing effective
mitigating measures
The most common tools used in EFA are the
sensitivity analysis (SA) and the switching value (SV)
analysis40 Both enable testing and measurement
of the effect of changes in key project variables on
the final outcomes of our project and hence its
economic indicators (NPV and IRR) Although SA is
frequently used to assess the robustness of projects
and their resilience to shocks its outcomes are
seldom linked to risk analysis
In other words the most relevant question at
this stage is to know how fluctuation in critical
parameters (eg increases in costs delays in
implementation) will affect project performance and
which of the identified risks are the ones that need
close monitoring
Considering the effects of risks and mitigation
measures identified at the project design stage on
EFA results would not only represent a more realistic
approach to assessing the projectrsquos profitability but
would also help identify the nature of those risks
ndash acknowledged but not mitigated by the project ndash
whose existence is regarded as acceptable
In practical terms the SA tests percentage
increases and decreases in estimated benefits and
costs to assess their impact on NPV and IRR while
the SV provides the percentage change in cost
or benefits that will cause project outcomes to fall
below the minimum level of acceptability (NPV lt 0)
40 In volume 2 the IGs also provide information on more sophisticated tools using probabilistic approaches such as Crystal Ball and Risk
27
VOLUME 1 BASIC CONCEPTS AND RATIONALE
Both analyses are extremely useful if linked to
identified project risks For example SV can identify
benchmarks (maximum percentage increases in costs
or decreases in benefits) for lsquotrigger valuesrsquo to activate
specific mitigation measures (eg if the internal price
of a specific input increases to 30 per cent activities
should shift to an alternative crop)
Another way of looking at this analysis is
through the graphic in Figure 6 Here variations
in expected benefits and costs are represented
in the vertical and horizontal axes respectively
Calculation of the switching values of our project
identifies the maximum reduction in benefits (Bmin)
and the maximum increase in costs (Cmax) that
would result in an NPV of zero Thus the switching
value frontier (SVF) represented by the black line
between Bmin and Cmax encloses all possible
combinations of reduction in benefits and increase
in costs that would bring the NPV to zero Implicitly
the area (O Bmin Cmax) represents the set of all the
different combinations of decrease in benefits and
simultaneously increase in costs that would not
endanger project viability
Once the SVF has been identified and after a
proper evaluation of the country context and project
risks and mitigation measures we could eventually
assume that benefits and costs are very unlikely to
attain the levels represented by the two dotted lines
(B0 C0) As a result we narrow down our uncertainty
area defining a lsquosafe zonersquo identified by the blue area
(A) and a lsquorisky zonersquo identified by the orange area
(R) Area A represents the set of combinations that
falls into the viable cases where increases in costs
or decreases in benefits are not jeopardizing the
overall outcome of the project Area R represents all
the diverse combinations of costs and benefits that
will render the project unprofitable (NPV lt 0)
An analysis including probabilistic approaches
could provide a better understanding of the likelihood
that the project would fall into one of the two areas
and thus assess how much at risk it would be if
certain events occurred Details of these types of
analysis can be found in volume 2
Use of SA to assess project risks an example
SA provides grounded information to the design
team to develop effective mitigation measures for
each identified potential risk The first step then
is to add a proxy to the classic table or section on
project risk of the project design report (PDR) ndash a
proxy that responds to the question How will this
risk affect project performance For example if
F IGUR E 6
Identification of the risk zone
0
A
R
Switching value frontier(NPV=0)
Cmax + Costs
- Benefits
B0
Bmin
Cmax
28
VOLUME 1 BASIC CONCEPTS AND RATIONALE
local implementation capacities are low SA can
test how a delay in implementation of one or more
years (a realistic possibility of this risk occurring) will
affect project outcomes Similarly if there is a high
probability of the introduction of import taxes this
can be tested by increasing input costs
The next step is to closely observe the SA results
in order to assess to what extent these events
will change the profitability indicators (ie project
performance) By answering the question Which
variables need to be closely monitored the project
team can easily identify the lsquocritical risksrsquo and better
allocate resources for their mitigation
In the example below (Table 4 and Table 5)
SA shows that this project is more sensitive to
decreases and delays in benefits than to cost
increases Thus although there is a high risk of the
introduction of import taxes on fertilizer this will not
drastically affect project performance On the other
side delays in implementation are a high risk that
could compromise overall project outcomes Project
teams should allocate more efforts and resources to
mitigate this risk rather than others
To summarize EFA analytical tools can contribute
to risk assessment and informed decision-making
for the efficient allocation of project resources when
designing mitigation measures
TA BLE 4
Risk analysis and mitigation measures (classic table prepared for the PDR)
Risk description Probability of occurrence
Mitigation measure Proxy to compare with SA results
Institutional risksLow local implementation capacity
High Capacity-building Delays in benefits
Market risks Import duties on fertilizer High Local production Increased costs
Climate risks Floods Low Infrastructure Reduced benefits
TA BLE 5
Sensitivity analysis for informed decision-making
SA Base case
( 12)
Costs increased Decrease in benefits Delay of benefits
+10 +20 +50 -10 -20 -50 1 year 2 years
IRR 28 27 25 21 22 20 18 23 19
NPV (lsquo000 US$)
37 160 8 068 6 895 3 376 4 047 2 949 1 564 5 173 1 984
29
VOLUME 1 BASIC CONCEPTS AND RATIONALE
EFA in project supervision implementation and ex post evaluationThe underlying principles for the use of EFA in project
implementation are no different from those for project
design and are detailed in a number of old and
well-known sources Squire and van der Tak (1975)
Gittinger (1985) Belli et al (1998) and IFADrsquos draft EFA
guidelines of September 2012 However although the
principles are the same the methods of application
differ to some extent as shown in Table 6
The approach to EFA both before and during
project implementation should be tailored to
the nature of the project What to look for in the
field and the type of analysis undertaken vary
considerably among different project categories
More detailed information is provided in Table 7 in
the technical annex
Ex ante and ex post EFA
It is important to distinguish between ex ante and ex
post EFA and to appreciate their roles in the various
stages of the project cycle Ex ante is the more
familiar form of EFA Undertaken as a key part of the
project design process it is used to inform decision-
making on the nature of the project and its expected
financial and economic impacts Ex post EFA is
undertaken after an investment project has been
completed There are also intermediate forms of
analysis undertaken during project implementation
which are partly ex post and partly ex ante
It is important to distinguish between the
implementation period and the life of the investment
The implementation period typically five to seven
years is the period in which project activities are
undertaken and IFAD funds disbursed The life of
the investment is much longer typically 20 years
or more during which economic and financial
benefits are expected to accrue Figure 7 shows
a typical IFAD project profile with the investment
costs incurred during years 1-5 recurrent costs
over the 20-year project life and benefits beginning
to flow in year 3 and reaching a plateau from
year 10 onwards
TA BLE 6
Application of general principles of EFA
Key principle Methods of application
Ex ante EFA Implementation
With and without project comparison
Prepare lsquobusiness as usualrsquo scenario on the basis of lsquodo nothingrsquo option
bull Conduct baseline survey to define pre-project status
bull Estimate what would have happened without the project
bull Paired comparisons can help (eg inoutside project area)
Financial analysis Construct farm models showing expected revenue and expenditure for beneficiaries
bull Survey beneficiaries to estimate actual revenue and expenditure
bull Validate andor adjust farm models accordingly
Discounting future benefits and costs
Discount future costs and benefits back to year zero
bull Discount future and previous benefits and costs back to year zero
Accounting for externalities
Identify and quantify all externalities where possible
bull Check for signs of positive and negative externalities emerging during implementation
Adjusting for distortions Deduct taxes add subsidies use shadow prices estimate conversion factors
bull Check for changes in tax and subsidy rates and adjust prices accordingly
bull Update conversion factors on the basis of trade andor tariff data
30
VOLUME 1 BASIC CONCEPTS AND RATIONALE
Methodological issues of ex post and
ex ante analysis
The key aspect to understand when performing
this analysis is that as shown in Figure 7 project
costs and benefits will occur in different moments of
project life
Methodologically speaking if this analysis will
be used for comparison of appraised (ex ante) and
real impacts (ex post) (as is generally the goal) we
need to lsquoplacersquo the comparison in the same point in
time The point in time could be at the beginning or
completion of the project or any other point What
is important is to bring all cash flows to that point in
time using discount techniques Then calculate the
NPVs and compare You will be able to use IRRs only
if the cash flow allows it mathematically (ie if there is
a negative Figure in the first year)
But this is not the only consideration to bear in
mind Other issues arise such as
bull Attribution effects of achieved results given
IFADrsquos scale of intervention it could claim
contribution but not full attribution of increased
beneficiary incomes or decline in food insecurity
bull At completion could be too early to capture all
expected benefits (see Figure 7)
bull A mixed approach in order to compensate for
this second issue is to try to estimate benefits
yet to be produced include them in cash flows
and then perform the discounting (however the
results could be questioned)
bull In order to make a realistic comparison CBA
should be done 10 years after implementation
and this has rarely been done
On a more positive note the alternative would be
to choose some activityfarm models effectively
put in place by the project Perform a financial
analysis at completion and compare it with appraisal
estimations (models developed at design for the
WOP situation) in order to estimate how things
have changed This analysis will not be based on
cash flows but on annual bases thus comparing
F IGUR E 7
Profile of costs and benefits over the project cycle
0
20
40
60
80
100
120
Investment costs
Recurrent costs
Benefits
MTR
Supervision EvaluationDesign
PCR
1Years
2 3 4 5 6 7 8 9 10 11 12 13 14 15 16 17 18 19 20
Implementation period years 1-5
Life of the investment years 1-20
31
VOLUME 1 BASIC CONCEPTS AND RATIONALE
annual financial indicators such as total sales total
production costs employment created Hopefully
full development of the model would have been
achieved by completion so as to provide information
on how adequate project interventions had been
This could also potentially provide information on the
reasons underpinning adoption rates
Ex post EFA and scaling upConfronted with the large-scale problem of reducing
rural poverty which it is mandated to address
and the limited resources available from official
development assistance (ODA) IFAD is compelled
to increase the impact of every dollar it invests in
agriculture and rural development For this reason
scaling up the results of successful development
initiatives is an overarching priority that directly
supports the achievement of IFADrsquos mandate To
deliver on this priority IFADrsquos operational practices
must be geared towards supporting all concerned
actors and institutions ndash including poor rural women
and men and their organizations ndash in achieving
impact at scale
The formal IFAD definition of lsquoscaling uprsquo is
expanding adapting and supporting successful
policies programmes and knowledge in order to
leverage resources and partners to deliver larger
more sustainable results for a greater number of
poor rural people Scaling up results means that
IFAD interventions will not be viewed as a way of
expanding small projects into larger ones Instead
they will focus on how successful local initiatives
will sustainably leverage policy changes additional
resources and learning to bring the results to scale
EFA has an important role to play in informing
scaling-up decisions since evidence of favourable
financial and economic impacts should be a key
criterion for deciding whether or not to scale up
Thus the framing questions must incorporate an
economic and financial dimension as follows
bull Idea If a project is referred to as one that is
being scaled up or otherwise further developed
from previous interventions in the host country
or region what were the economic and financial
outcomes of the activity to be scaled up Have
economic and financial impacts been estimated
or measured
bull Vision How many poor rural men and women
will benefit financially and to what extent What
will be the overall economic impact
bull Drivers Are the economic and financial benefits
sufficiently attractive to drive the expansion and
sustain the initiative over the long term
bull Spaces Is there sufficient capacity to finance
the proposed expansion Is the local regional or
national economy large enough to accommodate
it Can markets absorb the level of production
envisaged
bull Pathways What are the financial and economic
implications of alternative scaling-up pathways Is
a gradual or a fast-track approach preferred
bull IFADrsquos role How will IFAD ensure that economic
and financial impacts of the expansion are
properly monitored and evaluated
Scaling-up issues often need to be addressed during
COSOP formulation or country portfolio reviews
especially where grant-funded pilot programmes
have been implemented and are being considered
for scaling up into full-scale investment projects In
these cases EFA of pilot programmes during and
after implementation becomes an important part of
the strategic process
32
Formulas for profitability indicatorsThe net present value (NPV) indicator defined as
the sum that results when the expected costs of the
investment are deducted from the discounted value
of the expected benefits (revenues) is calculated
through the following formula
Where
Bt = benefits at time t Ct = costs at time tIt = investment costs n = project economic life
r = interest rate used as indicator of opportunity
cost discount rate
The internal rate of return (IRR) indicator is defined
as the discount rate (r) that produces a zero NPV
This represents the maximum interest rate that a
project could face and still not waste resources
This is called the internal rate of return (IRR) It is
calculated through
IRR = (r NPV = 0)
For the project to be profitable the IRR has to be
greater than the interest rate that could be earned in
alternative investments thus whenever IRR gt r the
project is considered viable If the (alternative) interest
rate (imkt) is lower than the IRR the NPV is positive
and vice versa
The benefitcost ratio (BC) indicator is the ratio of
the present value of benefits to the present value of
costs over the time horizon The BC ratio provides
some advantages when it is necessary to formulate
a lsquorankingrsquo of alternative investment projects under
budget constraints
If BC ge1 the project is accepted
If BC lt1 the project is rejected
Cost-effectivenessWhen tangible benefits from a given investment
are difficult to quantify but the costs are easily
identifiable the most common valuation method
is cost-effectiveness It is used to select the least
costly alternative among a set of options that will
achieve the same result (a given set of predetermined
objectives) Once the purpose of the project has
been decided for example construction of a market
storage facility cost-effectiveness would be used to
compare scale location technology etc to choose
among investment options (eg open storage
location of the facility construction materials)
The methodology consists in first listing and
measuring in monetary terms the costs of the
options available and then comparing them with
the costs occurring in the base scenario (without
the project) Total costs are then discounted at
year 1 and the results compared to identify the
cheapest intervention In other words valuation by
cost-effectiveness consists in comparing on a
present-worth basis all alternatives that can achieve
the same benefit (Gittinger 1985) and selecting the
least costly
IRR NPV 0gt gti mkt
IRR NPV 0lt lti mkt
IRR NPV 0gt gti mkt
IRR NPV 0lt lti mkt
IRR NPV 0gt gti mkt
IRR NPV 0lt lti mkt
IRR NPV 0gt gti mkt
IRR NPV 0lt lti mkt
Technical annex
33
VOLUME 1 BASIC CONCEPTS AND RATIONALE
Unfortunately the results of this method which
can justify project investment decisions cannot be
integrated into the streams of incremental net benefits
resulting from classic CBA ndash thus underestimating
the overall benefits of the investment
Multicriteria analysis41
MCA is a decision-making tool used to evaluate
complex decision problems With this tool it is
possible to identify overall preferences among
alternative options where the options entail many
diverse objectives Unlike CBA MCA allows
consideration of aspects other than economic and
financial ones for example social technological and
environmental issues Its use is particularly relevant
when other single-criterion approaches cannot
provide monetary valuations42
In the same model thanks to these techniques
it is possible to consider quantitative and qualitative
data It builds on trade-offs between criteria that
in complex decision-making are usually in conflict
(efficiency and equity for example) Choices are
classified aggregating various items of information
in a common index of utility value Since policy
decisions may be influenced by both monetary
and non-monetary objectives it offers a technique
capable of ranking diverse outcomes
MCA establishes preferences among options
referring to a set of objectives identified by decision
makers It is an important instrument for ranking
options and discriminating between acceptable and
unacceptable possibilities Decision makers must
define quantifiable criteria to judge how an objective
has been achieved and MCA allows them to
41 MCA has not yet been tested as a suitable tool for IFAD project design but is suggested as an alternative in the extreme cases mentioned above of complex decision-making
42 One example would be when production objectives are in contraposition to environmental ones For example to increase livestock production for food security and at the same time reduce CO2 emissions
aggregate the data on individual criteria in order to
provide indicators of the overall performance of the
options It brings out the points of view of the actors
involved in the judgment and is characterized by the
subjectivity related to the opinions of the decision-
making group43
The main advantages of MCA are its openness
explicitness and its power to simplify complex
situations In fact it splits the components of
intricate situations and organizes them so as to find
a solution step by step and clearly Objectives and
criteria chosen by the decision group can in fact be
analysed and changed if they are not considered
suitable This process eases the discussion and
promotes communication within the decision-making
body first and later between that body and the
stakeholders MCA can be both an ex ante and an ex
post evaluation tool
This type of analysis also presents some
difficulties One concerns the choice of the activities
or variables to be studied and definition of the
comparative criteria These operations are often
very complicated and require much time spent
in discussions and negotiations Use of MCA
requires knowledge of mathematical notions
data aggregation methodologies and computer
applications in order to perform analysis following a
structured process and to avoid weak conclusions
It is often costly and time-consuming
43 Indeed the opinion team establishes objectives and criteria assesses relative importance weights and judges the contribution of every option to each performance criterion MCA can be preceded by strengths weaknesses opportunities and threats (SWOT) analysis for the choice of criteria it can be supported by an expert panel to help the negotiating group develop an assessment of a specific topic or it can be assisted by focus groups questionnaires and case studies to choose criteria and rate them In addition criteria can be evaluated using cost-effectiveness analysis
34
VOLUME 1 BASIC CONCEPTS AND RATIONALE
Types of projects and EFA activitiesAspects to look for in the field and the type of
analysis undertaken vary considerably among project
categories as shown in Table 7
TA BLE 7
Main EFA tasks by type of project
Project category Main EFA tasks during implementation
Productivity enhancement (including irrigation)
bull Estimate number of beneficiaries and technology adoption rates by target group households
bull Monitor productivity changes product quality and prices
bull Estimate gross margins (per unit of land and labour) for project and non-project households
bull Update farm models based on observedactual results revise economic analysis as necessary and consider adjustments to project design to improve results
Rural infrastructure bull Review construction schedule and costs relative to design estimates
bull Estimate utilization rates for new or upgraded infrastructure
bull Assess arrangements for operation and maintenance
bull Estimate benefits derived by target group households (eg reduced costs increased prices improved market access)
bull Update farm models based on observedactual results revise economic analysis as necessary and consider adjustments to project design to improve results
Natural resource management
bull Undertake a comparison of NRM activities with and without project
bull Review with and without project scenarios of agricultural productivity
bull Seek evidence of more sustainable and responsible NRM practices
bull Identify and if possible quantify value of environmental benefits
bull Update farm models based on observedactual results revise economic analysis as necessary and consider adjustments to project design to improve results
Community development bull Determine number of target group beneficiaries participating in community development activities
bull Identify what has changed in the community and individual households as a result of these activities
bull Describe improvements in the lives of beneficiary households and value these in monetary equivalents if possible
bull Revise economic analysis as necessary and consider adjustments to project design to improve results
35
VOLUME 1 BASIC CONCEPTS AND RATIONALE
Project category Main EFA tasks during implementation
Institutional strengthening bull Prepare inventory of actual institutional-strengthening activities undertaken
bull Complete assessment of institutional capacity and projectrsquos impact on it
bull Identify how improved institutional capacity has or will generate benefits for target groups
bull Revise economic analysis as necessary and consider adjustments to project design to improve results
Marketing and value chain development
bull Review value chain analysis undertaken during project preparation to update data on volumes costs prices and value addition
bull Identify ways in which improvements in value chain efficiency have improved or are likely to improve market access and farmgate prices for beneficiaries
bull Estimate financial benefits accruing to target group farmers and other value chain actors
bull Update farm models based on observedactual results revise economic analysis as necessary and consider adjustments to project design to improve results
Rural financial services bull Estimate number of beneficiaries with improved access to financial services types of services offered and acceptance rates
bull Monitor cost of financial services at different levels (cost of loanable funds retail service costs at client level) and compare with project design estimates
bull Assess actual or likely changes in farm and non-farm economic activities arising from improved access to rural financial services
bull Estimate the net financial benefits accruing to target group beneficiaries from these changes
bull Update farm models based on observedactual results revise economic analysis as necessary and consider adjustments to project design to improve results
36
Anandajayasekeram P CJ Van Rooyen F Liebenberg 2004 Agricultural project planning and analysis A sourcebook Second Edition Network Activity Program ndash Institutional University Cooperation (IUC) between the Flemish Universities of Belgium and University of Pretoria
Asian Development Bank 2013 Cost-benefit analysis for development A practical guide Manila httpwwwadborgdocumentscost-benefit-analysis-development-practical-guide
Australian Department of Infrastructure and Planning Queensland Government 2012 Project assurance framework ndash Cost benefit analysis guidelines Brisbane Queensland Australia
Belli P J Anderson H Barnum J Dixon and J-P Tan 1998 Handbook on economic analysis of investment operations Washington DC Operational Core Services Network Learning and Leadership Center World Bank httpsiteresourcesworldbankorgINTCDDResourcesHandbookEApdf
Belli P 2001 Economic analysis of investment operations Analytical tools and practical operations Washington DC World Bank
Campell H R Brown 2003 Benefit cost analysis financial and economic appraisal using spreadsheet Cambridge University Press
CIFOR 1999 Guidelines for applying multi-criteria analysis to the assessment of criteria and indicators Bogor Indonesia Center for International Forestry Research wwwcifororgacmmethodstoolbox9html
Department for Communities and Local Government 2009 Multi-criteria analysis A manual London httpeprintslseacuk127611Multi-criteria_Analysispdf
DFID 2011 Guidance for country offices on measuring and maximising value for money in cash transfer programmes London Department for International Development (UK)
European Commission 2008 Guide to cost-benefit analysis of investment projects Brussels httpeceuropaeuregional_policysourcesdocgenerguidescostguide2008_enpdf
FAO 1979 Economic analysis of forestry projects Case studies FAO Forestry Paper No 17 Supp 1 Rome Food and Agriculture Organization of the United Nations
FAO 1995 Guidelines for the design of agricultural investment projects Investment Centre Technical Paper No 7 Rome Food and Agriculture Organization of the United Nations
FAO 2010 Estimating mitigation potential of agricultural projects An application of the EX-ante carbon balance tool (EX-ACT) in Brazil Rome Food and Agriculture Organization of the United Nations
Gittinger J Price 1985 Economic analysis of agricultural projects Washington DC Economic Development Institute World Bank httpdocumentsworldbankorgcurateden198501437966economic-analysis-agricultural-projects
Government of South Africa 2004 Cost-benefit analysis Pretoria Department of Environmental Affairs and Tourism
IFAD 2012 Review of post-harvest systems in IFAD programmes Rome
Jenkins G C Kuo A Harberger 2011 Cost-benefit analysis for investment decisions httpwwwqueensjdiexecorgpublicationsqed_dp_206pdf
Lewis DL 1999 Road user and mitigation costs in highway pavement projects Washington DC Transportation Research Board National Research Council
Mishan EJ 1971 Cost-benefit analysis London George Allen and Unwin
Potts D 2002 Project planning and analysis for development httpswwwriennercomtitleProject_Planning_and_Analysis_for_Development
Raswant V and E Heinemann 2012 Access to markets Making value chains work for poor rural people Rome IFAD
Squire L and HG van der Tak 1975 Economic analysis of projects Baltimore MD USA Johns Hopkins University Press
References
37
VOLUME 1 BASIC CONCEPTS AND RATIONALE
Treasury Board of Canada 2007 Canadian cost-benefit analysis guide Ottawa Secretariat Treasury Board of Canada analys-engpdf
UNIDO 1972 reprinted 1993 Guidelines for project evaluation Order No IDSERH2 Vienna United Nations Industrial Development Organization
UNIDO 1986 Manual for evaluation of industrial projects Vienna United Nations Industrial Development Organization wwwunidoorgfileadminuser_mediaPublicationsdownloadManual_for_Evaluation_of_Industrial_Projectspdf
USAIDINDIA 2000 REFORM Project compendium with practitionersrsquo guide State fiscal management reform Vol V Project appraisal practitionersrsquo guide New Delhi US Agency for International DevelopmentIndia httppdfusaidgovpdf_docsPNADM777pdf
World Bank 2013 Investment Project Financing Economic Analysis Guidance Note httpsiteresourcesworldbankorgPROJECTSResources40940-1365611011935Guidance_Note_Economic_Analysispdf
World Bank 2012 A guide to assessing needs Essential tools for collecting information making decisions and achieving development results by Watkins R Meiers M amp Visser Y httpsopenknowledgeworldbankorgbitstreamhandle109862231663920PUB0EPI00essing09780821388686pdfsequence=1
38
Glossary
Aggregation 15 16 20 in project analysis the process of adding together the costs and benefits of all the entities participating in a project to reach a summary account from which a measure of project worth can be derived Often the result of the aggregation is the Incremental Net Benefit or Cash Flow of a project
Appraisal 7 24 31 A before the fact (ex- ante) evaluation of a proposed investment project to determine its merit and acceptability in accordance with established decision-making criteria
Benefitcost ratio (BC ratio) 13 33 a discounted measure of project worth The ratio of benefits to costs It should be calculated using the present values of each discounted at an appropriate discount rate Most often the opportunity cost of capital The ratio should be at least 1 for the project to be acceptable It may give incorrect ranking among independent projects and cannot be used for choosing among mutually exclusive alternatives
Border price 23 The border price is the unit price of a traded good at the countryrsquos border For exports it is the FOB (free on board) price and for imports it is the CIF (cost insurance and freight) price
Business as Usual (BAU) 8 9 11 14 19 a reference scenario which assumes that future evolution is an extension of the current trends See also lsquodo nothing scenariorsquo
Cash flow 11 12 16 19 20 31 The funds generated or used by the project Reflects the costs and benefits over time from a stated point of view Incomebenefit is a positive cash flow and expensescosts are negative flows
Constant price A price that has been deflated to real terms by an appropriate price index They should be distinguished from current or nominal prices Often used as synonym of real prices
Contingent valuation A method of inferring the value of benefits and costs in the absence of a market What people would be willing to pay to gain a benefit (or willing to accept in recompense for a loss) if a market existed for the good
Conversion factor 5 16 23 30 the factor that converts the domestic market price to an economic price Conversion factors are the ratios of economic to financial prices Thus a conversion factor is a number that is used to convert the domestic market price of an item into its economic opportunity cost to the
economy by multiplying the market price of the item by the conversion factor
Cost An expense related to purchase of inputs including capital equipment buildings materials labour and public utilities Costs such as environmental damage or injuries to health are sometimes referred to as negative externalities
Cost Benefit Analysis (CBA) 7 8 18 31 conceptual framework applied to any systematic quantitative appraisal of a public or private project to determine whether or to what extent that project is worthwhile from a social perspective Cost-benefit analysis differs from a straightforward financial appraisal in that it considers all gains (benefits) and losses (costs) to social agents CBA usually implies the use of economicsocial prices
Cost effectiveness analysis (CEA) 20 33 an appraisal technique used in projects and programs in which benefits cannot be reasonably measured in money terms Cost-effectiveness analysis is used in one of two forms to select least-cost alternatives either holding constant the level of benefits and varying the level of costs or holding constant the level of cost and varying the level of benefits In either form the ratio of cost to benefits is known as the cost-effectiveness ratio
Current prices (Nominal prices) prices as actually observed at a given time They refer to prices that include the effects of general inflation and should be contrasted with constant prices
Cut-off rate the rate below which a project is considered unacceptable It is often taken to be the opportunity cost of capital The cut-off rate would be the minimum acceptable internal rate of return for a project or the discount rate used to calculate the net present value the net-benefit investment ratio or the benefit-cost ratio
Depreciation 14 Not a term used in cost-benefit analysis In other financial frameworks depreciation is the allocation of the cost of an asset over time Depreciation is a method of allocating the cost of a tangible asset over its useful life For accounting purposes depreciation indicates how much of an assetrsquos value has been used up For intangible assets amortization is the correct term However these are accounting concepts that makes no sense in financial analysis Here the full investment costs will be computed every time the asset needs replacement
39
VOLUME 1 BASIC CONCEPTS AND RATIONALE
Direct transfer payment 15-17 Transfer payments are transfers of money among residents of a country without a corresponding exchange of goods and services Taxes are transfer payments from individuals to the government Subsidies are transfer payments from the government to individuals Gifts are transfers ldquoin kindrdquo from one individual to another Because transfer payments are not made in return for goods and services they do not add to total output When transfer payments occur in the context of projects they redistribute project costs or benefits from the project entity to some other group or individual in the country
Discount rate 12 14 16 23 the interest rate at which future values are discounted to the present It usually represents the cost of capital for the person or entity calculating the net present value of the stream The financial discount rate and economic or social discount rate may differ in the same way that market prices may differ from economic prices The selection of the discount rate in financial analysis is a relative straightforward process and that is calculated as the potential gains of alternative safe investments on the market In economic analysis where project viewpoint is overturned toward the socio-economic context this parameter needs to be estimated properly so as to i) reflect the public nature of the investment ii) account for scarcity of resources and iii) ensure good use of public funds (See also social discount rate)
Discounted cash flow 14 The costs and benefits (cash flows) discounted to present values to give a common basis for comparison
Discounting 12 31 The process of adjusting future values to an equivalent present value at a stated point in time by a discount rate
Distortion 16 30 A difference between market prices and true values (economic prices) A distortion is any interference with market forces that renders the resulting quantity produced and price different from the price and quantity that would result under conditions of perfect competition
Distributional effect A change in the income or wealth of the people from whose point of view the benefit-cost analysis is done
Do nothing scenario the baseline scenario lsquobusiness as usualrsquo against which the additional benefits and costs of the lsquowith project scenariorsquo can be measured (often a synonym for the lsquowithout projectrsquo scenario)
Economic analysis 7 14-17 20 30 analysis that is undertaken using economic values reflecting the values that society would be willing to pay for a good or service In general economic analysis values all items at their value in use or their opportunity cost to
society (often a border price for tradable items) It has the same meaning as social cost-benefit analysis
Economic cost The economic cost of an activity or resource is the cost to society of that activity or resource Economic costs include the private costs borne directly by economic agents undertaking the activity and all other costs borne by other economic agents For example the economic costs of driving automobiles include the private costs of petrol plus the additional costs of congestion borne by other users of the roads plus the costs of pollution borne by society in general
Economic impact analysis the analysis of the total effects on the level of economic activity (output income employment) associated with the intervention This kind of analysis focuses on macroeconomic indicators and forecasts the influence of the project on these indicators It goes beyond CBA when very large projects are considered in relatively small economies
Economic net present value (ENPV) 16 The net present value of a project calculated using true or economic values Synonymous with social net present value
Economic price 16 Price that reflects the relative value that should be assigned to inputs and outputs if the economy is to produce the maximum value of physical output efficiently There is no consideration of income distribution or other non-efficiency goals in such a price Synonymous with efficiency price and true price
Economic rate of return (ERR) 16 An internal rate of return based on economic prices and social opportunity costs of capital expressing the socio-economic profitability of a project (See internal rate of return)
Environmental impact analysis the statement of the environmental impact of a project that identifies its physical or biological effects on the environment in a broad sense This would include the forecasting of potential pollution emissions loss of visual amenity and so on
Export parity price 23 footnote The export parity price is the FOB price of a good or service valued at point of export net of taxes and subsidies and suitably adjusted for internal transport costs to a location in a country The export parity price is the net-of-taxes-and-subsidies price that exporters would need to receive for a good or service sold in the domestic market in order to make them indifferent between selling in the domestic market or exporting
Externalities 5 15-17 30 A benefit or cost falling on third parties who normally cannot pay or be compensated for it through a market mechanism An external benefit is a positive externality an external
40
VOLUME 1 BASIC CONCEPTS AND RATIONALE
cost is a negative externality A positive externality may reduce the costs of a production process of an unrelated economic agent as when the bees of a bee grower pollinate a neighbourrsquos apple orchard They may also increase the enjoyment of another economic agent as when musicians playing for their own pleasure delight those around them A negative externality increases the production costs or reduces enjoyment for another economic agent Traffic congestion and the numerous forms of environmental pollution such as the pollution created by a manufacturing plant are examples of negative externalities Externalities are not reflected in the financial analysis For economic analysis however it is necessary to take such externalities into account and place a value on them
Ex-ante evaluation 24-25 30 the evaluation carried out in order to take the investment decision It serves to select the best option from the socio economic and financial point of view It provides the necessary base for the monitoring and subsequent evaluations ensuring that wherever possible the objectives are quantified
Ex-post evaluation 24-25 30-32 an evaluation carried out a certain length of time after the conclusion of the initiative It consists of describing the impact achieved by the initiative compared to the overall objectives and project purpose (ex-ante)
Farm gate price The price received by farmers for their products net of transport costs to the market where the products are sold
Feasibility study 9 19 a study of a proposed project to indicate whether the proposal is attractive enough to justify more detailed preparation It contains the detailed technical information necessary for the financial and economic evaluation
Financial analysis 7 14-17 19 30 31 the analysis carried out using market prices and taking a commercial point of view It allows one to 1) verify and guarantee cash balance (verify the financial sustainability) 2) calculate the indices of financial return on the investment project based on the net discounted cash flows
Financial sustainability analysis 14 19 20 analysis carried out in order to verify that financial resources are sufficient to cover all financial outflows year after year for the whole time horizon of the project Financial sustainability is verified if the cumulated net cash flow is never negative during all the years considered
Financial rate of return An internal rate of return based on market prices and opportunity costs of capital(See internal rate of return)
Human capital Human capital is the stock of skills and productive knowledge embodied in people The
purpose of investing in human capital is to improve the productivity of human beings
Impact 25-27 a generic term for describing the changes or the long term effects on society that can be attributed to the project Impacts should be expressed in the units of measurement adopted to deal with the objectives to be addressed by the project
Import parity price 23 footnote The import parity price is the CIF price of a good or service valued in a specific geographical location It includes the CIF price of the good suitably adjusted for transport costs net of taxes and subsidies The import parity price aims to measure the price that producers in the country would receive for a good or service produced in the country for sale in the domestic market under conditions of free trade
Incremental 11-14 19-20 Additional or marginal
Inflation A general increase in market price levels (a fall in the general purchasing power of the currency unit)
Input 26 28 That which is consumed by the project (as opposed to the projectrsquos output) Usually refers to the physical inputs used by the project including materials capital labour and public utilities Inputs like environmental quality foreign exchange and workersrsquo health are usually termed externalities
Internal rate of return (IRR) 12 33 The yield or profitability of a project based on discounted cash-flow analysis The IRR is the discount rate at which a stream of costs and benefits has a net present value of zero It is equivalent to the discount rate r that satisfies the following relationship
IRR NPV 0gt gti mkt
IRR NPV 0lt lti mkt
where Bt is the benefit stream and Ct is the cost stream The internal rate of return is compared with a benchmark in order to evaluate the performance of the proposed project The internal rate of return is then compared with the market rate of interest to determine whether or not a proposed project should be undertaken (See cut-off rate)
Financial Rate of Return is the internal rate of return calculated when all the inputs and outputs are calculated using financial values Economic rate of Return is based on economic opportunity costs
Logframe 10 25-27 is a management tool mainly used for designingand MampE of development projects It consists of four steps (1) establishing objectives (2) establishing cause-and-effect relationships (causal linkages) among activities inputs outputs and objectives (3) identifying assumptions underlying the causal linkages and (4) identifying objectively-verifiable measures for evaluating progress and success
41
VOLUME 1 BASIC CONCEPTS AND RATIONALE
Market price 14-17 (a) The price of a good in the domestic market (see financial prices) as opposed to the economic price shadow price or social price (b) the cost of a good including indirect taxes and subsidies It is the price relevant for financial analysis
Model A representation or simulation of a system or process showing how parameters benefits and costs interact to produce a bottom-line result by which the project can be judged
Monitoring 25-27 the systematic examination of the state of advancement of an activity according to a pre-determined calendar and on the basis of significant and representative indicators
Multi-criteria analysis 22 34 MCA is an evaluation methodology that considers many objectives by the attribution of a weight to each measurable objective In contrast to CBA that focuses on a unique criterion (the maximisation of social welfare) Multi Criteria Analysis is a tool for dealing with a set of different objectives that cannot be aggregated through shadow prices and welfare weights as in standard CBA
Mutually exclusive 8 12 13 Alternatives that cannot be undertaken simultaneously if one alternative is carried out the other cannot be The alternatives may be mutually exclusive because they represent alternative times of beginning the same project because funds are limited or because if one is carried out the other will not be required (for example a choice between a thermal and a hydro power station)
Net present value (NPV) 12 13 27-29 33 The net value of an investment when all costs and benefits expressed in standard units of value (numeraires) are summed up The sum that results when the discounted value of the expected costs of an investment are deducted from the discounted value of the expected revenues The net present value of a stream of costs and benefits is a number that results from discounting the values of the stream at a given discount rate It is equivalent to the number that results from the following expression
IRR NPV 0gt gti mkt
IRR NPV 0lt lti mkt
whereBt = benefits at time t Ct = costs at time tIt = investment costs n = project economic lifer = discount rate
Net revenues the amount remaining after all outflows have been subtracted from all inflows Discounting the incremental net revenues before financing gives a measure of the project worth of all resources engaged discounting the incremental net revenues after financing gives a measure of the project worth of the entityrsquos own resources or equity
Nominal prices Prices prevailing in a particular year Synonymous with budget-year dollars
Non-tradable good 16 23 footnote good or service that by its very nature cannot be exported or imported Land and buildings are examples of a non-tradable good
Non-traded good 16 23 footnote A non-traded good or service is one that is neither exported nor imported in a particular country for a variety of reasons including quotas and prohibitions Common examples of non-traded items are certain drugs haircuts etc In project analysis non-traded refers to goods and services not traded by the country in which the project is located
Numeraire a standard unit of value Money is a numeraire by which the values of different commodities can be compared In cost-benefit analysis the numeraire is the common denominator for measuring benefits and costs Widely used numeraires are the willingness to pay or aggregate consumption numeraire and the foreign exchange numeraire
Operational and maintenance costs 21 35 The recurring costs for operating and maintaining the value of physical assets
Opportunity cost 12 16 19 The best alternative return foregone elsewhere by committing assets to the project The value of something foregone For example the direct opportunity cost of a person-day of labour is what the person would otherwise have produced or being paid for that day of work The value of a resource in its best alternative use For the financial analysis the opportunity cost of a purchased input is always its market price In economic analysis the opportunity cost of a purchased input is its marginal social value in its best non-project alternative use
Output 27 That which is produced Usually refers to the physical product of the project Other effects of the project such as housing for workers employment training of labour and foreign-exchange savings are usually called externalities
Payback period The time required for the cumulative present value of benefits to become equal to the cumulative present value of costs
Programme 8 is a portfolio of multiple projects that are managed and coordinated as one unit with the objective of achieving common (often intangible) outcomes and benefits at sector country or even multi-country level
Project 8 is a temporary entity established to deliver specific (often tangible) outputs in line with predefined time cost and quality constraints A project should always be defined executed and evaluated relative to an approved business plan which balances its costs benefits and risks
42
VOLUME 1 BASIC CONCEPTS AND RATIONALE
Project analysis 8 20 the analytical framework for the evaluation of a projectrsquos feasibility and performance It includes the analysis of the context the objectives technical aspects demand forecasts and financial and economic costs and benefits Project analysis is needed to determine if given the alternatives a proposed project will sufficiently advance the objectives of the entity from whose standpoint the analysis is being undertaken to justify the project
Project cycle 24-25 30-31 a sequence of the series of necessary and pre-defined activities carried out for each project Typically it is separated into the following phases conceptualization inception formulation appraisal ex-ante evaluation financing implementation and ex-post evaluation
Real prices calculated by adjusting market prices by an appropriate price index to eliminate the effects of inflation Prices of goods and services change over time either because the general price level rises that is because of inflation or because the underlying conditions of supply and demand change Real prices refer to prices of goods and services that reflect changes in the underlying conditions of supply and demand but that do not reflect the effects of inflation The terms real prices and constant prices are used interchangeably but referring to real prices as constant prices is misleading Real prices do not necessarily remain constant over time as they change in response to changes in supply and demand Real prices should be distinguished from current prices which reflect inflation as well as changes in supply and demand
Relative prices the exchange value of two goods given by the ratio between the quantity exchanged and their nominal prices
Risk 10 25-27 The degree to which outcomes are uncertain The extent of possible variation in the outcome
Risk analysis 10 25-27 Risk analysis is a technique for assessing the expected net present value of a project in relation with project risks By taking into account the probability distribution of critical variables and the correlations among them it enables analysts not only to assess the expected net present value of a project but also its associated probability distribution In cost-benefit analysis it recognizes the simultaneous variation of the values of several inputs according to specified ranges and probabilities and analyses the resulting variability in the bottom line
Scale 31-33 The size of a project
Scenario 11 14 30 An outline or portrait of a possible future usually portrays unfolding events rather than being static in time
Sensitivity analysis 16 27-29 Sensitivity analysis is an analytical technique to test systematically the
effects on a projectrsquos outcome of changes in its basic assumptions Sensitivity analysis is carried out by varying one element or a combination of elements and determining the effect of that change on projectrsquos profitability indicators (NPV and IRR)
Shadow price 16 23 footnote 30 A shadow price of a good or service is the economic opportunity cost to society of that good or service The true or economic value of a good (as opposed to the market price which might be distorted) Synonymous with economic or social price
Social price 16 A price that reflects the true value to the country of inputs and outputs of the project Synonymous with economic price and shadow price
Social discount rate 12 footnote 16 It attempts to reflect the social view on how the future should be valued against the present (See Discount rate)
Socio-economic costs and benefits 13 opportunity costs or benefits for the economy as a whole They may differ from private costs and benefits to the extent that actual prices differ from economic prices
Switching value 27-28 The switching value of a variable is that value that it would have to attain in order for the outcome of the project to fall below the minimum level of acceptability (net present value of the project equal to nil)
Time value of money Time value of money refers to the concept that money received in the present is more valuable than money received in the future It is the concept underlying discounting
Tradable 16 23 footnote Referring to a good that could be traded internationally in the absence of restrictive trade policies
Traded good 16 23 footnote A traded good is a good that is either exported or imported by some country
Transfer payments 15-17 22 Payments that redistribute wealth but do not use up resources or create them
Willingness to pay What consumers are willing to pay for a good or service Consumers willing to pay substantially more than the actual market price enjoy a consumer surplus (the amount they would pay minus the amount they actually have to pay)
With project scenario (WP) 11 Box 2 estimation simulation modelling of project envisaged costs and benefits
Without project scenario (WOP) 11 Box 2 the baseline scenario against which the additional benefits and costs of the with project scenario can be measured (eg business as usual)
43
VOLUME 1 BASIC CONCEPTS AND RATIONALE
Steps in economic analysis
Economic analysis requires assessment of a projectrsquos net impact on economic welfare
by considering
5 Convert all market prices into economicshadow prices (SP) that better reflect the social
opportunity cost of the good
6 Remove transfer payments (taxes and subsidies) and quantify externalities (positive
and negative)
7 Aggregate all modelsrsquo NIB cash flows respecting incorporation phasing patterns of targeted
beneficiaries into projectrsquos activities
8 Compare aggregated benefits with other project costs to obtain incremental discounted
cash flows Calculate economic performance indicators adopting a social discount rate
ENPV ERR BC ratio
9 Perform sensitivity analysis (SA) in order to deal with the main risks and uncertainties that
could affect the proposed project
Steps in financial analysis
The typical sequence of tasks to be undertaken in financial analysis is the following
1 Develop farmenterprise models and identify benefits and costs (investment and recurrent) for
WOP and WP scenarios (based on crop budgets)
2 Compare the discounted flows of benefits and costs and calculate the differences between the
obtained results and the WOP scenario in order to determine the net incremental benefits (NIB)
of the proposed interventions
3 Calculate the project financial profitability indicators of each model (ie financial NPV financial
IRR and BC ratio) applying these investment criteria to make an investment decision
(positive or negative)
4 Assess family incomes and establish financingcredit needs by performing a lsquosustainability analysisrsquo
Summary steps in financial and economic analysis
44
WP-WOP develop and identify
Develop farmenterprise models and identify benefits and costs (investment and recurrent) for WOP and WP scenarios (based on crop budgets)
Calculate indicators
Calculate the project financial profitability indicators of each model (ie financial NPV financial IRR and BC ratio) applying these criteria to make an investment decision
Financial sustainability
Assess family incomes and establish credit needs by performing a lsquosustainability analysisrsquo
Discount flows ndash costs and benefits
Compare the discounted flows of benefits and costs and calculate the differences between the obtained results and the WOP scenario in order to determine the net incremental benefits (NIB) of the proposed interventions
Shadow prices
Convert all market prices into economicshadow prices (SP) that better reflect the social opportunity cost of the good
Aggregation
Aggregate all modelrsquos NIB cash flows respecting incorporation phasing patterns of targeted beneficiaries
Cash flows
Compare aggregated benefits with other project costs to obtain incremental discounted cash flows Calculate economic performance indicators adopting a social discount rate ENPV ERR BC ratio
Transfers and externalities
Deduct taxes and subsidies ndash Consider positive and negative externalities
Perform sensitivity analysis
in order to deal with the main risks and uncertainties that could affect the proposed project
1
5
6
7
8
9
2
3
4
Economic analysisFinancial analysis
EFA step by step
International Fund for Agricultural Development
Via Paolo di Dono 44 - 00142 Rome ItalyTel +39 06 54591 - Fax +39 06 5043463E-mail ifadifadorgwwwifadorgwwwruralpovertyportalorg
ifad-unblogspotcom
wwwfacebookcomifad
instagramcomifadnews
wwwtwittercomifadnews
wwwyoutubecomuserifadTV
Contacts EFA desk
Eloisa de Villalobos Thomann
EFA Technical Adviser Tel +39 06 5459 2827Email edevillalobosifadorg
Enrico Mazzoli
Technical Adviser Tel +39 06 5459 2462Email emazzoliifadorg
- Acknowledgements
- Contents
- Abbreviations and acronyms
- Section I - Introduction
-
- Background
- Scope
- Outline
- How to read the guidelines
-
- Section II - Relevance of EFA
-
- Relevance of economic and financial analysis
- EFA as a decision-making tool in project planning
-
- Section III - Basic concepts in undertaking EFA
-
- Investment criteria profitability indicators
- Economic and financial analysis the differences
-
- Section IV - EFA of IFAD rural
-
- Focusing on lsquotypicalrsquo IFAD rural investment projects and their main benefits
- Unquantified benefits alternative methodologies to CBA
- EFA data sources collection and coherence
-
- Section V - EFA role throughout
-
- EFA in project design Links with the logframe and MampE
- EFA in project design Risk analysis
- EFA in project supervision implementation and ex post evaluation
- Ex post EFA and scaling up
-
- Technical annex
-
- Formulas for profitability indicators
- Cost-effectiveness
- Multicriteria analysis
- Types of projects and EFA activities
-
- References
- Glossary
- Summary steps in financial and economic analysis
-

VOLUME 1 BASIC CONCEPTS AND RATIONALE
Next one needs to formulate the WP situation
defining expected outcomes in the future by
identifying the requested investment and operating
costs as well as projecting estimated benefits7 In
order to convert future costs and benefits which do
not occur at the same time into todayrsquos values for
comparison discounting techniques are applied
Discounting permits comparison of the value of
money in different time periods considering that
a dollar today is worth more than a dollar received
tomorrow (ie the fact that we have to postpone
consumption makes tomorrowrsquos dollar less valuable
than todayrsquos) How much is $1 received in lsquonrsquo years
worth today The answer depends on the adopted
discount rate (r) and the discount period (n)8
Thus the aggregation of project flows occurring
in different years requires adoption of an appropriate
discount rate to calculate the present value of future
flows As a guiding principle discount rates should
represent the opportunity cost of capital for the
agent (producer or government)9 The other essential
element in discounting is definition of the discount
period (also called lsquoproject economic lifersquo or lsquotime
horizon analysisrsquo)
Usually the discount period is equivalent to the
lifespan of the largest investment components of
the project10
Finally the project net cash flows (ie financial
andor economic)11 are based on the incremental
approach which results from comparing the
WP and WOP situations With these elements it
is possible to calculate the corresponding project
lsquoprofitability indicatorsrsquo
7 The analysis is looking at future investments and outcomes thus sunk costs are irrelevant
8 The present value (PV) = future value(1+r)n If r = 10 and n = 8 years the present value of $1 would be $051
9 For the producer a realistic alternative is an average of the passive deposit rate of local commercial banks The government should instead consider the interest rate at which the country can actually borrow capital from a relevant international capital market alternatively the return on long-term public treasury bonds is also a suitable option More information on determining a relevant discount rate is provided in volume 2
10 This rule might change when (i) technological progress would make the investment obsolete before the end of its useful life (ii) the investment period is lsquotoo longrsquo (ie very common in environmental projects ship construction etc) or (iii) other factors exist (ie legal institutional etc) that justify another specific choice for the discount period
11 See the following subsection for differences between the two
Investment criteria profitability indicatorsGenerally speaking a project is considered lsquoviablersquo
if the sum of expected incremental benefits is
larger than the sum of all costs accrued in project
implementation This can be assessed through
profitability indicators12 The most relevant indicators
for these IGs are the net present value internal rate
of return and benefitcost (BC) ratio
bull The net present value (NPV) indicator is defined
as the sum that results when the expected
costs of the investment are deducted from
the discounted value of the expected benefits
(revenues) Whenever NPV gt 0 the project is
considered worthwhile or profitable Among
mutually exclusive projects the one with the
highest NPV should be chosen
bull The internal rate of return (IRR) indicator is
defined as the discount rate (r) that produces
a zero NPV This represents the maximum
interest rate that a project could face and still
not waste resources
For the project to be profitable the IRR has
to be greater than the interest rate that could be
earned in alternative investments thus when
IRR gt r the project is considered viable If the
(alternative) interest rate (imkt) also called opportunity
costs of capital is lower than the IRR the NPV is
positive and vice versa
IRR NPV 0gt gti mkt
IRR NPV 0lt lti mkt
12 Formulas can be found in the technical annex
12
VOLUME 1 BASIC CONCEPTS AND RATIONALE
Both NPV and IRR are calculated on the same
project cash flows of incremental net benefits
However in certain cases the calculation of
IRR is not possible and thus it cannot be used as a
profitability indicator
This is the case when (a) the flow of net
incremental benefits does not have a negative
element or (b) it presents more than one IRR
complicating the decision as to which one to
consider as the profitability indicator
Moreover IRR is an indicator that should not be
used to rank or select mutually exclusive project
options as it cannot provide a measure of the size or
magnitude of project value13 (box 3)
The NPV on the other hand is an indicator that
can always be calculated as is the case with the
benefitcost ratio
bull The (BC) ratio indicator is the ratio of the
present value of benefits to the present value
of costs over the time horizon The BC ratio
provides some advantages when a ranking of
alternative investment projects is needed under
budget constraints
If BC ge 1 the project is accepted
If BC lt 1 the project is rejected
13 Where a project is the only alternative proposal to the status quo the issue is whether the IRR provides worthwhile additional information Views differ in this respect Some argue that there is little merit in calculating a statistic that is either misleading or subservient to the NPV Others see a role for the IRR in providing a clear signal as regards the sensitivity of a projectrsquos net benefits to the discount rate Yet whichever perspective is taken this does not alter the broad conclusion on the general primacy of the NPV rule
These IGs consider that the most appropriate
indicator for appraising an investment project is
the NPV as the investment decision criterion is
straightforward if NPV is gt 0 the project is viable
It means that the proposed investment is a profitable
alternative in terms of resource allocations It is better
than the present and WOP situations and also better
than allocating the same resources to other economic
activities that will yield the average profit rate
Economic and financial analysis the differencesAll investment projects include a number of
stakeholders and this has implications for the
valuation of the benefits and costs accrued by
project interventions Whose costs and benefits
count14 Governments and society as a whole will
consider and value costs and benefits differently
from producers or any other private actor individually
From the perspective of a development agency such
as IFAD both points of view are relevant to a reply
to the guiding questions stated before Should the
government invest in this project Will the producer
take the risk
14 In the CBAEFA literature the question of lsquowhose costs and benefits countrsquo is known as the lsquostandingrsquo issue (ie whose welfare counts in the aggregation of net benefits)
BOX 3
IRR or NPV
Although the most appropriate indicator for appraising an investment project is the NPV ndash as it
can always be calculated and will provide information on the magnitude of the return ndash the IRR is
the most commonly used This is probably due to the fact that IRR is expressed as a percentage
which is often wrongly associated with other rates of return such as interest rates (r) or profit rates in
alternative allocations In fact the IRR has no meaning in terms of project value or size
To prove this letrsquos suppose a project is one thousandth the size of another project Simply multiply
each side of the equation by 1000 The calculated IRR will not change but the small project entails
less value The project to be chosen from a social point of view would be the one producing the
bigger returns to the economy and the NPV will clearly show this while the IRR will not
13
VOLUME 1 BASIC CONCEPTS AND RATIONALE
In order to consider these points of view analysis
will be conducted on two levels (a) financial analysis
will consider private stakeholdersrsquo interests15 and
(b) economic analysis will consider government
and society perspectives These two viewpoints will
require the analyst to consider different items
when looking at the benefits and costs of a project
valuate them differently and in some cases even
use different rates to discount the streams of costs
and benefits
The private investor exclusively considers the
costs and benefits related to the productivemarket
aspects of the project while analysis from an
economic point of view considers that benefits are
defined as an increase in social well-being16 The
costs are defined as reductions in social well-being
For a project to be economically viable its social
benefits must exceed its social costs
15 This point of view is also applied to the executing agency of a public project
16 The term lsquosocial welfarersquo or lsquowell-beingrsquo is used in these IGs as a simple monetary measure The definition is taken from neoclassical economics and prevailing economic theories of well-being No attempts are made to include any type of measurement of subjective happiness or to develop any well-being indexes or social indicators
Thus from the perspective of a private
stakeholder (financial analysis) participating in the
investment with risk capital the wealth created by
a project in lsquonrsquo periods of time is defined as the
financial NPV (FNPV) The economic or cost-benefit
analysis looks at the overall impact of the project
and takes the point of view of the collective agent
(eg society) and the wealth created by a project in
lsquonrsquo periods of time is defined as the economic NPV
(ENPV) of the investment produced by the project17
In financial analysis all costs and benefits
should be valued at market prices Only cash inflows
and outflows are considered (depreciation reserves
and other accounting items not corresponding to
actual flows are excluded)
17 In rural development projects where the agent is a subsistence farmer accumulated generated cash per year must be at least equal to or higher than the BAU situation that was ensuring hisher familyrsquos survival
BOX 4
Steps in financial analysis
The typical sequence of tasks to be undertaken in financial analysis is the following
1 Develop farmenterprise models and identify benefits and costs (investment and recurrent) for
WOP and WP scenarios (based on crop budgets)
2 Compare the discounted flows of benefits and costs and calculate the differences between the
obtained results and the WOP scenario in order to determine the net incremental benefits (NIB) of
the proposed interventions
3 Calculate the project financial profitability indicators of each model (ie financial NPV financial
IRR and BC ratio) applying these investment criteria to make an investment decision (positive or
negative)
4 Assess family incomes and establish financingcredit needs by performing a lsquosustainability analysisrsquo
Financial sustainability is ensured if the accumulated generated cash per year is positive or
at most equal to zero17 for all years considered On the contrary if this figure is negative at any
point in time the project is not sustainable meaning that there are not enough financial resources
to cover all the costs and it will be necessary to reassess project financing mechanisms
14
VOLUME 1 BASIC CONCEPTS AND RATIONALE
Economic analysis or cost-benefit analysis
builds on the results of financial analysis with the
additional consideration of impacts and benefits not
directly captured by the latter These analyses are
strictly related as shown in Figure 4
The main steps in financial analysis are
summarized in box 4 A detailed description of
building economic analysis from financial models is
provided in volume 2 which illustrates each step in
EFA of a typical IFAD production-oriented project
In economic analysis the analyst needs to
complement financial analysis by considering all
project impacts on the society The private actor is
generally not interested in considering all negative
or positive impacts that his actions may have on the
rest of society In terms of environmental impact
for example polluting rivers through production
discharges or emitting CO2 are social costs generally
not considered by the private agent These are called
lsquoexternalitiesrsquo as in practical terms the private agent
is lsquoexternalizingrsquo a production cost making the whole
society pay for it On the other hand there also exist
positive effects not counted by the private agent
such as the introduction of new pastures by a single
producer which can increase honey production in
the area and benefit neighbouring beekeepers
These aspects are known as positive and
negative externalities In addition economic analysis
must eliminate all transfer costs between national
and private actors (ie subsidies and taxes) Lastly all
costs and benefits need to be valued at their social
opportunity cost rather than at their market price
F IGUR E 4
Economic and financial analysis links
Aggregation
Project net incremental
benefits(NIB)
Farm budgets properly phased
Activity budgets (eg processing enterprises)
phased
Government implementing
agencies
Financial analysis(market prices)
123n
123n
Farm budgets properly phased
Activity budgets (eg processing enterprises)
phased
Government implementing
agencies
sum
sum
sum
Economic analysis(economic values)
123n
123n
Adjust market values to economic
values
Eliminate transfer
payments (taxes and subsidies)
Quantify externalities
15
VOLUME 1 BASIC CONCEPTS AND RATIONALE
Many times for example when trade barriers
are in place or when currencies are controlled
market prices do not reflect the social value of
goods In order to account for these distortions
one of the most critical tasks is the calculation of
economic or shadow prices Another critical aspect
is the establishment of a social rate of discount
that realistically reflects an investment alternative
(opportunity cost) for the government18 Detailed
explanations and guidelines for these calculations
are also included in volume 2
Table 1 illustrates the process of going from
financial to economic analysis19 The financial
analysis section at the top shows revenues and 20
production costs (operating and investment) of a
hypothetical enterprise The enterprise is experiencing
18 As a general rule when a country is a capital borrower the social rate of discount should be no less than the actual rate of interest on the capital market from which the capital is borrowed
19 Clicking on the table reveals the formulas
20 See section on ldquoUse of SA to assess project risks an examplerdquo
several years of negative net cash flows resulting
in a negative NPV and IRR This is caused by high
operating costs as well as recurrent needs for
investment Economic analysis converts market
prices into economic prices As reflected by the
application of conversion factors (CF) market prices
of outputs and inputs are different from their social
value For example the CF applied to wages reflects
the presence of high unemployment (20 per cent)
in the area which would push people to work for
lower than market wages (thus CF = 08)21 In the
same way the CF applied to investments reflects
the presence of high transport costs or duties that
make the productrsquos market price overestimate its
social value In fact the market price is 83 while the
economic price is 75 and thus the CF is 09
21 Market wage (mW) = US$100 unemployment = 20 economic wage(eW) = US$80 (observed given the high unemployment) CF = eWmW = 80100 = 08
BOX 5
Steps in economic analysis
Economic analysis requires assessment of a projectrsquos net impact on economic welfare
by considering
5 Convert all market prices into economicshadow prices (SP) that better reflect the social
opportunity cost of the good
6 Remove transfer payments (taxes and subsidies) and quantify externalities (positive and negative)
7 Aggregate all modelrsquos NIB cash flows respecting incorporation phasing patterns of targeted
beneficiaries into projectrsquos activities
8 Compare aggregated benefits with other project costs to obtain incremental discounted cash
flows Calculate economic performance indicators adopting a social discount rate ENPV ERR
BC ratio
9 Perform sensitivity analysis (SA) in order to deal with the main risks and uncertainties that could
affect the proposed project20
Critical parameters are (i) SP for tradable and non-tradable goods (ii) SP of foreign exchange
(iii) SP for labour costs (shadow wage) and (iv) the social discount rate
16
VOLUME 1 BASIC CONCEPTS AND RATIONALE
Fiscal corrections are also applied and
10 per cent VAT is deducted from all inputs and
outputs with indirect taxes Finally externalities
are accounted for and quantified both negatives
(increases in noise) and positives (decrease
in pollution)
The project under analysis resulted not profitable from a financial point of view but viable
from an economic point of view This means that
the overall impact for society is positive (also
reflected by the positive externalities) but there
are no sufficient incentives for the private
individual agent to undertake these activities
This conclusion suggests that if the development
objectives achieved through this investment are
significant enough for the government then the
project should develop an incentive scheme to
attract the private agent
These results may be used in policy dialogue
suggesting that the government could reduce the
level of targeted import duties and thus make this
investment proposal financially profitable
TA BLE 1
From financial to economic analysis an example
Financial analysis (market prices)Thousands of United States dollars
Years
1 2 3 4 5 6 7 8 9 10
Total operating revenues 0 42 115 119 126 126 126 126 126 126
Total Inflows 0 42 115 119 126 126 126 126 126 126
Total operating costs 0 -56 -75 -98 -101 -101 -101 -101 -117 -117
Total investment costs -165 -4 -4 -25 -3 0 -25 0 0 12
Total outflows -165 -60 -79 -123 -104 -101 -126 -101 -117 -105
Net cash flow -165 -18 36 -4 22 25 0 25 9 21
Financial rate of return -6
Financial NPV10 US$(89)
Economic rate of return 36
Economic NPV10 US$473
Years
Economic analysis CF 1 2 3 4 5 6 7 8 9 10
Output X 12 0 49 134 139 147 147 147 147 147 147
Total operating revenues 0 49 134 139 147 147 147 147 147 147
Labour costs 08 0 -18 -18 -26 -26 -26 -26 -26 -30 -30
Operating costs 11 0 -36 -57 -73 -76 -76 -76 -76 -87 -87
Total investment costs 09 -149 -4 -4 -22 -3 0 -22 0 0 11
Fiscal correction outputsa 09 0 44 121 125 132 132 132 132 132 132
Fiscal correction inputsa 09 -134 -36 -55 -85 -71 -68 -88 -68 -78 -68
Externalities 0 20 20 20 20 20 20 20 20 20
Decreased pollution 0 23 23 23 23 23 23 23 23 23
Increased noise 0 -3 -3 -3 -3 -3 -3 -3 -3 -3
Net cash flow -282 39 161 98 144 149 107 149 124 145
a VTA of 10 has been eliminated
1 Adjust market values to economic values applying CF2 Eliminate transfer payments (taxes and subsidies)
3 Quantify externalities
17
SECTION IV
IFAD rural investment projects include projects
in integrated rural development irrigation rural
finance value chain development natural resource
management (NRM) climate-change adaptation
and mitigation community development and
institutional strengthening
As IFAD follows its main mandate of focusing its
projects on benefiting poor rural people22 projects
are characterized and designed through identification
of a target group composed mostly of rural people
Poor rural people represent different productive
and economic categories the main one being
smallholders Others include the landless population
engaged in rural non-agricultural microenterprises
rural workers fishers and finally special vulnerable
groups such as women indigenous minorities and
youth All IFAD projects must be formulated on
the basis of benefiting one or more of the above-
mentioned poor rural groups
The increased number of value chain projects
in IFADrsquos portfolio23 ndash aiming to integrate IFADrsquos
traditional target groups into these chains to improve
their access to secure markets and sustainably raise
their incomes ndash has expanded the definition of IFADrsquos
target group to all rural people including small- and
medium-scale entrepreneurs in rural areas However
for the purposes of EFA the impact on poor rural
people is the one that matters the most to IFAD24 and
22 See IFAD Lending Policies and Criteria I (5) ldquoIFAD will concentrate its resources upon activities that promise to achieve in a cost-effective way a reduction of poverty in rural areas where most poor people live and work The Fundrsquos major target groups irrespective of the stage of economic development of the country will be the small and landless farmersrdquo
23 From only 3 per cent in 1999 to 46 per cent in 2009 (Raswant and Heinemann 2012)
24 However when possible and relevant distribution of benefits among value chain actors is a complement to CBA
to the poverty-reduction development objectives of
each government
This IFAD specificity has direct consequences for
CBA discussion of the lsquostandingrsquo issue As previously
stated investment projects include a number
of social stakeholders However for IFAD rural
investment projects this is not a major issue as the
formulation of IFAD projects is focused on benefiting
a specific target group poor rural people25
Focusing on lsquotypicalrsquo IFAD rural investment projects and their main benefitsThe typical IFAD project is usually production
oriented26 and its main outcomes (ie financial and
economic benefits) are frequently net production
increases In other words most IFAD projects will
have a direct impact on the production levels
of target groups which in turn will lead to net
income increases
IFAD projects have an impact on the incomes
of poor rural people by increasing their access to
inputs and services that will subsequently increase
their production volumes andor productivity
The most common areas of intervention include
technical assistance (TA) for crops and livestock
through extension services rural finance services
25 There might be exceptional situations in which other social groups could benefit from an IFAD project These cases might require additional analyses (eg distributional effects analysis) when undertaking EFA
26 Of 114 projects reviewed by QE from 2009 to 2011 73 per cent were agriculture- or rural development-related while in 16 per cent the core objective was to strengthen financial services The rest focused on capacity-building or NRM These data show that most IFAD projects can be characterized as production-oriented that is designed to have direct impact on production and productivity increase
EFA of IFAD rural investment projects
18
VOLUME 1 BASIC CONCEPTS AND RATIONALE
to support on-farm investments and increased
access to working capital through creditloan27 or
grant facilities improved water management through
the construction of irrigation structures provision
of storage drying and cooling facilities to enhance
post-harvest preservation and technical advisory
and financial resources to support entrepreneurs
in starting small and microenterprises ndash as well as
combinations of the above
This IFAD specificity leads to some
straightforward requirements when analysing its
financial and economic results First the project
should be assessed in terms of the financial feasibility
and sustainability of targeted beneficiaries second
the project should be assessed in terms of economic
profitability for the whole national economy
Thus in IFAD production-oriented projects the
main household-level goal in financial analysis is to
determine whether the producer28 will have enough
incentives to participate in the project
In simple terms analysis needs to establish
whether the farmer should undertake the proposed
intervention under the criterion that it is financially
viable (ie the benefits over time are higher than the
investment and recurrent costs) and that these net
benefits exceed present returns (ie incremental
benefits are positive)
However even if the new situation (WP) is more
appealing than the present one (WOP) could the
farmer afford to adopt improved practices Although
viable the investment may still not be profitable if it
does not generate enough returns (mostly during the
first years) to cover the farmerrsquos needs Where the
producer is living under the poverty line the project
should at least generate the same net income each
year as in the BAU situation (subsistence system)
to ensure hisher participation Where poverty levels
are lower incomes should be adequate to cover
investment and working capital needs in addition to
27 Comprising inclusive innovativeadapted rural finance products and services including risk management strategies savings financial literacyeducation programmes etc
28 The terms lsquofarmerrsquo lsquoproducerrsquo or lsquoprivate stakeholderrsquo will be used throughout the IGs as synonyms for the term lsquoprivate agentrsquo in financial analysis
the farmerrsquos living expenses The lack of initial capital
to invest is generally a huge barrier to engaging in
a new activity A financial analysis will determine if
farmersrsquo cash flows are adequate to undertake the
activities (ie it will clearly identify a farmerrsquos financial
needs and hisher repayment capacity)
Even when a financing scheme will prove the
feasibility of the investment there are many risks
involved in changing a farmerrsquos practices (business
as usual) above all if it involves taking out a loan
in an uncertain agricultural environment Thus the
last question to be answered is would the farmer
take the risk are there enough incentives Risks
faced by farmers are many and extremely difficult
to manage29 The only measure of their willingness
to change habitstechnologies will be by comparing
their returns to the opportunity costs of remaining
in the actual situation If for example the returns to
labour of the new activity prove to be much higher
than the average rural wage it is probable that a
farmer would be willing to invest his time in his own
farm and take the risk
In other words financial analysis will establish
whether farmers will obtain a net incremental benefit
(financial viability and profitability analysis) if theyrsquoll
have enough working capital to buy the additional
farm inputs or to bear the costs of stocking
processed goods (financial sustainability) and finally
if financial incentives are enough to convince them to
change existing practices
The practical way to undertake this analysis is by
developing different beneficiary productive profiles
ndash considering several types of productive activities
lsquofarm-systemsrsquo and lsquoactivity-modelsrsquo ndash as well as how
many and which types of people generally engage in
these activities in this particular area
On the basis of the individual models of financial
analysis ndash and once the three steps in converting
market prices into their economic value have been
29 For example risks in the areas of production prices casualties technology climate ndash to name just a few
19
VOLUME 1 BASIC CONCEPTS AND RATIONALE
completed ndash economic analysis of the project as a
whole can be undertaken30 This is done by means
of the aggregation that in project analysis is the
process of adding together the costs and benefits
of all the entities participating to reach a summary
account from which a measure of project worth can
be derived The result of the aggregation is the net
incremental benefit or cash flow of the project31
Lastly the goal of economic analysis is to answer
the question of whether it is worthwhile to invest
public resources in the overall project proposal
(should the government invest) It will focus on the
perspective of the entire country and it measures the
effects of the project on the economy as a whole
Unquantified benefits alternative methodologies to CBAThe majority of IFADrsquos projects are production-
oriented interventions in which expected outcomes
are tangible and easily quantifiable however due to
IFADrsquos typical target group many of these projects
are complemented by activities seeking an impact
on less-tangible aspects of rural poverty alleviation
Womenrsquos empowerment increased access to assets
and services enhanced capacities ownership and
land titling are examples of this important part of
IFADrsquos overall project impact However these types
of benefits which are more difficult to measure or not
measurable in monetary terms (intangible benefits)
are often excluded from CBA
In addition environmental and social benefits
resulting from the promotion of resilient agricultural
practices or social infrastructure such as rural roads
irrigation schemes or market infrastructure are also
seldom included in CBA In order to change this
trend these IGs will provide some ideas on how to
allocate value through the use of valid proxies to
measure the impact of these intangible social andor
environmental benefits
30 Some analysts proceed by aggregating the financial analysis and then converting the aggregated results into their economic value It can be argued that this stage of analysis is useless as the financial profitability indicators for the project as a whole have no use in terms of investment decisions
31 See volume 2 and its annex for more details on the lsquoaggregation issuersquo and common mistakes
In the particular case of CDD projects where
communities collectively decide on the allocation
of project resources it is very difficult to foresee
which productive activities will be targeted However
markets and agronomic conditions in the project
area will limit the scope of activities that can be
successfully undertaken In these cases the fact
that communities are making participatory decisions
will grant the additional benefits that ownership
provides ensuring higher adoption rates than
average and increasing the sustainability of the
chosen interventions
In cases where the identification and valuation
of benefits is difficult simple and sensible ways
of estimating tangible benefits should be applied
Table 2 presents an overview of suggested
approaches to transforming such benefits into
tangible values so as to include them in overall
project cash-flow analysis from the most common
complementary activities in IFADrsquos projects
Additionally the IGs will introduce two methods
alternative to CBA for those cases where not even
proxies could be measured cost-effectiveness
and MCA32 The latter has not yet been tested
as a suitable tool in IFAD project designs but is
suggested as an alternative in cases of complex
decision-making
Cost-effectiveness
When tangible benefits from a given investment
are difficult to quantify but the costs are easily
identifiable the most commonly used valuation
method is cost-effectiveness which is used to select
the least-costly alternative among a set of options
that will achieve the same result (a given set of
predetermined objectives) Once the purpose of the
project has been decided for example construction
of a market storage facility cost-effectiveness would
be used to compare scale location technology
etc in order to choose between investment
32 See the technical annex for more details
20
VOLUME 1 BASIC CONCEPTS AND RATIONALE
Project componentsactivity Quantifiable benefits
Productivity enhancement (including irrigation post-harvest and processing) Storage drying cooling facilities irrigation
bull Reduced post-harvest losses
bull Increased value and volumes of production due to investments in storage cooling or small processing facilities (drying or milling)
bull Increased production and productivity due to water provision
Value chain (VC) Collective marketing warehouse receipt systems increased market information
bull Increased value of final product owing to increased quality and access to markets improved handling packaging and commercialization
bull Financial benefits to all actors along the VC
bull Microenterprise and employment creation
bull Creation of internal and external markets that did not exist before investments
Rural roads bull Reduced transport and vehicle maintenance costs (incl vehicle operating costs [VOC] and travel-time costs [TTC])
bull Access to areas not accessible before hence increased total production
bull Increased volume of transported agricultural products for sale (reduced losses)
bull Reduced transport costs due to better access to sales points
Domestic water supply bull Time saved in procuring water
bull Reduced sickness through better water quality
bull Reduced water losses due to leakage
bull Increased productivity through small-plot crop irrigation and through provision of water for livestock
bull Introduction of backyard gardening
Climate adaptation and resilience practices Changes in tillage practices crop rotations landsoil conversion afforestation energy-efficient systems flood prevention
bull Reduced land erosion an estimate of saved nutrient content can be valued at price of fertilizer needed to replace that nutrient content
bull Increased crop timber and livestock yields through soil preservation conservation tillage and agriculture
bull Increased final product value due to labelling as organic agricultural practices
bull Avoided rehabilitation costs for public infrastructure destroyed by natural disasters
bull Energy savings owing to replacement of old practices by eco-friendly artefacts (eco-stoves solar panels etc)
Land registration Land tenure security may translate into increased land value explained by
bull Long-term Investments in land fertility
bull Improved access to credit as land can be used as collateral
bull Greater dynamism of land markets
bull Environmental benefits as a result of better NRM (people improve or maintain forest andor tree cover)
TA BLE 2
Simple sensible ways of valuing different types of benefits
21
VOLUME 1 BASIC CONCEPTS AND RATIONALE
options (eg open storage location of a facility
construction materials) Unfortunately the results of
this method which can justify project investment
decisions cannot be integrated into the streams of
incremental net benefits resulting from classic CBA
thus underestimating the overall benefits of
the investment
Multicriteria analysis
MCA is a decision-making tool for evaluating
complex decision problems where the options
entail many different objectives Unlike CBA MCA
allows consideration of aspects other than economic
and financial ones for example both quantitative
and qualitative data It builds trade-offs between
criteria that in complex decision-making are usually
in conflict (efficiency and equity for example) 33
and is an important instrument in ranking different
options and discriminating between acceptable and
unacceptable possibilities
The main advantages of MCA are its openness
explicitness and power to simplify complex
situations This process eases the discussion and
promotes communication first within the decision-
33 Another example would be when production objectives are in contraposition to environmental ones For example to increase livestock production for food security and at the same time reduce CO2 emissions
Project componentsactivity Quantifiable benefits
Rural finance bull Efficiency gains in financial system can lower operational costs and ensure self-sufficiency and sustainability of financial services supply
bull Shifts in portfolio composition of financial service providers (productive loans versus consumption)
bull Incremental taxation revenues to government
bull Potential productivity increases through financing of working capital (incremental benefits to clientsborrowers)
bull Economic benefits of transfer effects
Community development (CD) bull Improvements in lives of beneficiary households (value these in money equivalents if possible)
bull CD activities result in high empowerment and ownership of project activities which could translate into greater sustainability
Indigenous peoplesrsquo (IPs) knowledge
bull When IPs are supported in applying their knowledge ownership of project activities is ensured as well as sustainability of activities This can translate into low implementation risk and high uptake (adoption rates)
bull Generally IP practice are environmentally friendly thus reducing stress on natural resources
bull Nutritional aspects are also part of the positive impacts
Institutional strengthening bull Improved institutional capacity has generated or will generate benefits for target groups
bull Losses avoided by strengthening the institution looking at the sensitivity analysis assess how delays in implementation (due to institutional weak capacities) affect project outcomes and use that data to calculate losses avoided
Source PTA ndash EFA desk elaboration
22
VOLUME 1 BASIC CONCEPTS AND RATIONALE
making body and later between that body and
stakeholders MCA can be an ex ante (lsquobefore the
factrsquo) and an ex post (lsquoafter the factrsquo) evaluation tool
This type of analysis also presents some difficulties
One concerns definition of the comparative criteria
Use of MCA requires knowledge of mathematical
notions data aggregation methodologies and
computer applications to perform analysis following
a structured process and to avoid weak conclusions
It is often costly and time-consuming
EFA data sources collection and coherenceThe value of EFA as a decision tool hinges on the
quality of the data and assumptions that underpin
it Data availability is a widespread problem for
EFA analysts who should always work in close
collaboration with expert colleagues (agronomy
livestock and rural infrastructure experts) who will
provide or validate the key technical parameters of
the analysis34
Data regarding project costs should be collected
during design missions in consultation with the rest
of the team Once the first results from EFA are
reached they should also be shared with the team
to discuss how they affect expected outcomes and
assumptions For example planned investment costs
may not be sufficient to reach the number of target
beneficiaries outcomes of specific components may
not be appealing from a financial point of view etc
Although it is the responsibility of the EFA analyst
to gather and ensure data consistency among
sources the mission leader should promote and
facilitate dialogue among mission members and
provide sufficient time for the analyst to collect and
process data to ensure EFA quality and coherence35
34 Alternatively FAOSTAT is the most reliable and recommended source of data (httpfaostatfaoorg)
35 It is estimated that at least five weeks are needed for elaboration of a complete EFA one week for data gathering two weeks of mission and two weeks for data processing
For the other parameters of EFA analysis such
as conversion factors and discount rates one
of the most important sources of data is always
the national planning offices If these data are not
available evaluations of completed operations by
the Independent Office of Evaluation of IFAD (IOE)
can be used as a reference36 These can provide
reference values for similar projects or projects
in the same country (and region) for example on
uptake (adoption rates) of a specific technology or
constraints on input availability
Moreover economic and financial analysis in
appraisal reports for the same country (andor region
andor sector) ndash from IFAD and other IFIs such as
the World Bank or regional development banks ndash are
potential sources of information on key parameters
such as discount rates37
However any project analyst should rely on his
her best judgment accumulated through experience
when deciding on the assumptions to be used
36 Evaluations by country and region are available at wwwifadorgevaluationpublic_htmleksystdocprjindexhtm
37 FAOrsquos Monitoring and Analysing Food and Agricultural Policies (MAFAP) programme develops estimates for standard conversion factors the social exchange rate (SER) for different countries and currencies and other important parameters for estimating shadow prices such as the transport costs duties and taxes instrumental in calculating parityborder prices for tradable goods (wwwfaoorgmafaphomeen Country reports can be found at wwwfaoorgmafapproductscountry-reports-technical-notesen)
23
SECTION V
To increase the efficient use of EFA it is important to
view this analysis as an integral part of project design
information and not only as a mandatory study done
for compliance with IFAD quality requirements
To do so there should be continuous review and
refinement of EFA at all stages of the project cycle
It is part of the monitoring and evaluation (MampE) and
knowledge management functions to inform decisions
on adjustments to design and implementation
modalities in pursuit of project objectives
As a first step the data used for EFA in
project design should be periodically updated
by the projectrsquos MampE system and supervision
implementation support missions should verify that
this has taken place If significant changes occur in
the data ndash particularly those for which the sensitivity
analysis showed higher sensitivity ndash the IRR NPV
and cost-benefit ratio should be recalculated
In the light of new data (eg prices for inputs
and outputs demand forecast for project outputs
andor adoption rates) ndash and taking into account
the results of updated EFA including identified
risks and suggested mitigation measures ndash it may
become appropriate during project supervision
andor implementation support missions to decide
to reallocate resources among activities andor
components shifting from those that contribute less
according to the new constellation of data to those
that would contribute more to the projectrsquos objectives
Moreover the EFA spreadsheet prepared during
project appraisal should remain available for review
during project implementation and evaluation This
serves as an indicator of compliance with the EFA
requirement for design documents and the new RMF
indicator as stated in the relevance section It would
also facilitate the updating process indicated in the
preceding paragraph
The purpose of EFA in each phase of the project
cycle including evaluation is indicated in the
following table
TA BLE 3
EFA at different stages of project cycle
Project cycle stage Role of EFA Form of analysis
Concept Definition of investment criteria
bull Purely ex ante ndash all benefits and costs are based on estimates of future values
Project design Resource allocation decisions
bull Purely ex ante ndash all benefits and costs are based on estimates of future values
Supervision ndash early stage
Resource reallocation decisions
Newly Identified risks
bull Mainly ex ante ndash some costs may be ex post but most benefits will still be based on future estimates
Midterm review (MTR) bull Mainly ex ante ndash some costs will be ex post but estimation of future benefits will be based on evidence accrued during first half of project
Supervision ndash later stages
bull About 50 ex post50 ex ante ndash costs will be increasingly based on actual results but benefits are generally lagged by several years at least and will continue to accrue over life of investment
Project completion report (PCR)
Assessment of results bull Mainly ex post ndash all costs and some benefits will be based on actual results but benefit stream for residual life of investment will remain an estimate of future values
EFA role throughout IFADrsquos project cycle
24
VOLUME 1 BASIC CONCEPTS AND RATIONALE
Table 3 also describes the form of analysis
undertaken at each stage of the project cycle which
ranges from purely ex ante during project design to
partly ex post initially with regard to costs and later
to benefits and finally purely ex post for investment
costs but only partly ex post for recurrent costs
and benefits In this example a fully ex post analysis
would only be possible after 20 years which lies
more in the realm of policy analysis than project EFA
Given its purpose EFA is currently used mostly
as an ex ante tool to guide project formulation and
justify investment decisions Nevertheless it could
make a bigger contribution to IFADrsquos mandate for
rural poverty reduction if it were used in some of
the following ways
At concept
bull At COSOP38 andor project conception previous
evaluation ex post reports elements from
previous EFAs or speedy financial assessments
of intended investments could serve as
screening criteria for the validation of proposed
investment ideas For example a previous study
on the investment requirements for a specific
irrigation technology may help establish a
minimum area to be covered by projects in order
to produce sufficient benefits to overcome
project investments
At design
bull For component selection ex ante assessment of
component viability during design
bull For cost validation EFA will confirm whether
estimated project investment costs are sufficient
to cover proposed interventions as well as define
beneficiariesrsquo contributions and their financial needs
bull In the logframe EFA can provide realistic and
consistent outcome indicators
bull For risk management EFA will provide grounded
information for the effective design of mitigation
measures applied to changing circumstances in
order to understand and manage risk
38 Country strategic opportunities programme
At implementation
bull To terminate or modify activities that are not
generating satisfactory financial results for the
intended beneficiaries and economic impact for
the country as a whole
bull For MampE Updating EFA to changing
circumstances will provide up-to-date evidence
of realistic outputs outcomes and impacts As
an MampE and knowledge management tool it can
facilitate learning within and between countries
about what works and what doesnrsquot in terms of
financial and economic impact This knowledge
can also be used to guide the design of country
programmes through the COSOP
bull EFA can also be used as a risk management
tool during implementation Where new risks
are identified or design assumptions are found
to be incorrect remedial action may be needed
including reallocation of resources among
components andor expenditure categories
Early in implementation EFA could contribute
to adaptation to changing circumstances such
as commodity prices production technologies
and institutional and policy changes which
may suggest that different or better approaches
be adopted modifying the design andor
implementation arrangements
At evaluation
bull As an ex post impact assessment tool by
incorporating EFA in IOErsquos PCR and country or
project evaluations in order to compare expected
and actual project results
bull To inform decisions on scaling up or replication
of successful initiatives including the scaling
up of grant-funded activities into full-scale
loan-funded projects
bull Ex post EFA assessment may suggest
discontinuation of approaches that are not
working and scaling up of those that are
25
VOLUME 1 BASIC CONCEPTS AND RATIONALE
Goal bull 20 increased average
income in 29000 HH
C1 bull 29000 farmers linked
with VCbull US$64 m in loans
distributed
C2 bull 29500 HH new crops
amp improved yields 15bull 2000 ha irrigatedbull 83 km rural roads
C3 Overall implementation
EFA in project design Links with the logframe and MampEIn addition to a complete EFA assessment IFADrsquos
mandatory design documents require presentation
of a logframe detailed cost tables disaggregated by
component financier and expenditure categories
and formulation of an MampE system
These three elements should be closely linked
The logframe provides a global picture of project
objectives and describes through components the
activities that will be put in place to achieve them
along with measurable indicators to monitor progress
and achievements The cost tables assign a cost
to each of these activities and MampE measures their
impact EFA is the technical vehicle that attaches an
expected benefit or outcome to the costs of each
envisaged activity It defines the causal chain of
effects between a projectrsquos inputs and outcomes
In other words many of the logframe sections
can and should be completed with information
coming from EFA These indicators should also be
used as part of the MampE system in order to maintain
coherence between planned interventions and
expected outcomes from the very beginning
In order to illustrate this causal chain a clarifying
example is provided in Figure 5 to explain how through
EFA certain inputs will be transformed into outcomes as
a result of the project The example has been extracted
from an ongoing IFAD project with a total project cost
of US$119 million to finance three main components
C1 value-chain market linkages development C2
improved agricultural practices and infrastructure
and C3 the project management unit (PMU)
As shown in Figure 5 uptake indicators
(ie number of expected beneficiaries) and overall
project impact of 20 increased incomes in
29000 HH have been directly estimated through
EFA (shown by the visible arrow) The same has
been done for expected outcomes from productive
interventions ndash such as improved crops and cropping
techniques complemented by irrigation infrastructure
under C2 ndash that will result in an average increase
in yields of 15 per cent However there are some
project activities for which it is more difficult to
F IGUR E 5
Practical example of linking EFA with the logframe costs and MampE With what For what
Objective Increase sustainable HH income
C1 Promote VCbull Capacity-building for
farmersrsquo groupsbull Link with farmers
and investment fund
C2 Support farmersbull Improved crop varieties
and TAbull Irrigation and road
infrastructure
C3 PMU
Total costs bull US$11946 m
Costpers US$740
C1 US$1875 mbull Capacity-building
US$3Mbull Link US$063 mbull Investment fund US$1512 m
C2 US$787 mbull Better crops US$643 mbull TA US$5 mbull Infrastructure
US$94 m
C3 US$105 m
LogframeImpact (MampE)
Projectcosts
Logframe Projectcosts
Impact (MampE)
EFA defines the causal chain
EFA can translate project inputs into results
26
VOLUME 1 BASIC CONCEPTS AND RATIONALE
measure impact (represented by the fading arrow)
In the example the development of stronger links
between farmers and agribusiness and improved
market access through construction of rural roads
will certainly have an impact on beneficiary access
to markets but this is not easily quantified by
measuring the number of meetings held by these
groups It would be better reflected in increases in
volumes sold and the prices received by farmers
Moreover indirect benefits from project activities
should also account for other rural people that will
benefit from the roads and are also not included in
the analysis Finally several project costs will not
produce any direct benefits but the activities they
fund are fundamental in the delivery of the overall
project For example all costs regarding the PMU
as well as awareness-raising campaigns and other
types of lsquosoftrsquo interventions
In summary the logframe provides a structure
that can help organize the data and assumptions
used in EFA elaboration Key data for estimating
costs and benefits and assumptions made
concerning incremental yields adoption rates etc
should be incorporated into the logframe and used
as indicators in the MampE system
While useful EFA cannot provide all relevant
indicators required in the logframe For example
third-level indicators (eg on reduced stunting or
increased HH assets) in IFADrsquos Results and Impact
Management System (RIMS) will still need to be
collected through baseline surveys in the early phase
of implementation
Finally it is important to distinguish output from
outcome indicators in the logframe39 During the
initial years of a project supervision should focus
on the output indicators As project implementation
proceeds the focus should shift to (or at least
include) outcome indicators which provide key data
to compare with the initial EFA assessment
39 A good practice example of a logframe distinguishing between output and outcome indicators is the Project for Agricultural Development and Economic Empowerment in Cambodia (EB 2012105R15Rev1 wwwifadorggbdocseb105eindexhtm) It should be noted that Annual Reports on Quality Assurance in IFADrsquos Projects and Programmes (eg document EB 200998R57) have called attention to imprecise development objectives and lack of quantified final and intermediate outcome indicators to track progress towards achieving objectives This deficiency also affects the quality of EFA and the possibility of using it during project supervision and implementation support Thus improved quality of the logframe can contribute to improving the quality of EFA and to enhancing its use during this phase
EFA in project design Risk analysisEconomic analysis of projects is by definition
built on uncertain future events Estimation of the
basic elements of this analysis (costs and profits)
inevitably involves explicit or implicit probability
judgments In order to contain and measure
the impact of these uncertainties on project
results there are some techniques that help
detect the lsquocritical variablesrsquo or sources of major
risks and set the basis for introducing effective
mitigating measures
The most common tools used in EFA are the
sensitivity analysis (SA) and the switching value (SV)
analysis40 Both enable testing and measurement
of the effect of changes in key project variables on
the final outcomes of our project and hence its
economic indicators (NPV and IRR) Although SA is
frequently used to assess the robustness of projects
and their resilience to shocks its outcomes are
seldom linked to risk analysis
In other words the most relevant question at
this stage is to know how fluctuation in critical
parameters (eg increases in costs delays in
implementation) will affect project performance and
which of the identified risks are the ones that need
close monitoring
Considering the effects of risks and mitigation
measures identified at the project design stage on
EFA results would not only represent a more realistic
approach to assessing the projectrsquos profitability but
would also help identify the nature of those risks
ndash acknowledged but not mitigated by the project ndash
whose existence is regarded as acceptable
In practical terms the SA tests percentage
increases and decreases in estimated benefits and
costs to assess their impact on NPV and IRR while
the SV provides the percentage change in cost
or benefits that will cause project outcomes to fall
below the minimum level of acceptability (NPV lt 0)
40 In volume 2 the IGs also provide information on more sophisticated tools using probabilistic approaches such as Crystal Ball and Risk
27
VOLUME 1 BASIC CONCEPTS AND RATIONALE
Both analyses are extremely useful if linked to
identified project risks For example SV can identify
benchmarks (maximum percentage increases in costs
or decreases in benefits) for lsquotrigger valuesrsquo to activate
specific mitigation measures (eg if the internal price
of a specific input increases to 30 per cent activities
should shift to an alternative crop)
Another way of looking at this analysis is
through the graphic in Figure 6 Here variations
in expected benefits and costs are represented
in the vertical and horizontal axes respectively
Calculation of the switching values of our project
identifies the maximum reduction in benefits (Bmin)
and the maximum increase in costs (Cmax) that
would result in an NPV of zero Thus the switching
value frontier (SVF) represented by the black line
between Bmin and Cmax encloses all possible
combinations of reduction in benefits and increase
in costs that would bring the NPV to zero Implicitly
the area (O Bmin Cmax) represents the set of all the
different combinations of decrease in benefits and
simultaneously increase in costs that would not
endanger project viability
Once the SVF has been identified and after a
proper evaluation of the country context and project
risks and mitigation measures we could eventually
assume that benefits and costs are very unlikely to
attain the levels represented by the two dotted lines
(B0 C0) As a result we narrow down our uncertainty
area defining a lsquosafe zonersquo identified by the blue area
(A) and a lsquorisky zonersquo identified by the orange area
(R) Area A represents the set of combinations that
falls into the viable cases where increases in costs
or decreases in benefits are not jeopardizing the
overall outcome of the project Area R represents all
the diverse combinations of costs and benefits that
will render the project unprofitable (NPV lt 0)
An analysis including probabilistic approaches
could provide a better understanding of the likelihood
that the project would fall into one of the two areas
and thus assess how much at risk it would be if
certain events occurred Details of these types of
analysis can be found in volume 2
Use of SA to assess project risks an example
SA provides grounded information to the design
team to develop effective mitigation measures for
each identified potential risk The first step then
is to add a proxy to the classic table or section on
project risk of the project design report (PDR) ndash a
proxy that responds to the question How will this
risk affect project performance For example if
F IGUR E 6
Identification of the risk zone
0
A
R
Switching value frontier(NPV=0)
Cmax + Costs
- Benefits
B0
Bmin
Cmax
28
VOLUME 1 BASIC CONCEPTS AND RATIONALE
local implementation capacities are low SA can
test how a delay in implementation of one or more
years (a realistic possibility of this risk occurring) will
affect project outcomes Similarly if there is a high
probability of the introduction of import taxes this
can be tested by increasing input costs
The next step is to closely observe the SA results
in order to assess to what extent these events
will change the profitability indicators (ie project
performance) By answering the question Which
variables need to be closely monitored the project
team can easily identify the lsquocritical risksrsquo and better
allocate resources for their mitigation
In the example below (Table 4 and Table 5)
SA shows that this project is more sensitive to
decreases and delays in benefits than to cost
increases Thus although there is a high risk of the
introduction of import taxes on fertilizer this will not
drastically affect project performance On the other
side delays in implementation are a high risk that
could compromise overall project outcomes Project
teams should allocate more efforts and resources to
mitigate this risk rather than others
To summarize EFA analytical tools can contribute
to risk assessment and informed decision-making
for the efficient allocation of project resources when
designing mitigation measures
TA BLE 4
Risk analysis and mitigation measures (classic table prepared for the PDR)
Risk description Probability of occurrence
Mitigation measure Proxy to compare with SA results
Institutional risksLow local implementation capacity
High Capacity-building Delays in benefits
Market risks Import duties on fertilizer High Local production Increased costs
Climate risks Floods Low Infrastructure Reduced benefits
TA BLE 5
Sensitivity analysis for informed decision-making
SA Base case
( 12)
Costs increased Decrease in benefits Delay of benefits
+10 +20 +50 -10 -20 -50 1 year 2 years
IRR 28 27 25 21 22 20 18 23 19
NPV (lsquo000 US$)
37 160 8 068 6 895 3 376 4 047 2 949 1 564 5 173 1 984
29
VOLUME 1 BASIC CONCEPTS AND RATIONALE
EFA in project supervision implementation and ex post evaluationThe underlying principles for the use of EFA in project
implementation are no different from those for project
design and are detailed in a number of old and
well-known sources Squire and van der Tak (1975)
Gittinger (1985) Belli et al (1998) and IFADrsquos draft EFA
guidelines of September 2012 However although the
principles are the same the methods of application
differ to some extent as shown in Table 6
The approach to EFA both before and during
project implementation should be tailored to
the nature of the project What to look for in the
field and the type of analysis undertaken vary
considerably among different project categories
More detailed information is provided in Table 7 in
the technical annex
Ex ante and ex post EFA
It is important to distinguish between ex ante and ex
post EFA and to appreciate their roles in the various
stages of the project cycle Ex ante is the more
familiar form of EFA Undertaken as a key part of the
project design process it is used to inform decision-
making on the nature of the project and its expected
financial and economic impacts Ex post EFA is
undertaken after an investment project has been
completed There are also intermediate forms of
analysis undertaken during project implementation
which are partly ex post and partly ex ante
It is important to distinguish between the
implementation period and the life of the investment
The implementation period typically five to seven
years is the period in which project activities are
undertaken and IFAD funds disbursed The life of
the investment is much longer typically 20 years
or more during which economic and financial
benefits are expected to accrue Figure 7 shows
a typical IFAD project profile with the investment
costs incurred during years 1-5 recurrent costs
over the 20-year project life and benefits beginning
to flow in year 3 and reaching a plateau from
year 10 onwards
TA BLE 6
Application of general principles of EFA
Key principle Methods of application
Ex ante EFA Implementation
With and without project comparison
Prepare lsquobusiness as usualrsquo scenario on the basis of lsquodo nothingrsquo option
bull Conduct baseline survey to define pre-project status
bull Estimate what would have happened without the project
bull Paired comparisons can help (eg inoutside project area)
Financial analysis Construct farm models showing expected revenue and expenditure for beneficiaries
bull Survey beneficiaries to estimate actual revenue and expenditure
bull Validate andor adjust farm models accordingly
Discounting future benefits and costs
Discount future costs and benefits back to year zero
bull Discount future and previous benefits and costs back to year zero
Accounting for externalities
Identify and quantify all externalities where possible
bull Check for signs of positive and negative externalities emerging during implementation
Adjusting for distortions Deduct taxes add subsidies use shadow prices estimate conversion factors
bull Check for changes in tax and subsidy rates and adjust prices accordingly
bull Update conversion factors on the basis of trade andor tariff data
30
VOLUME 1 BASIC CONCEPTS AND RATIONALE
Methodological issues of ex post and
ex ante analysis
The key aspect to understand when performing
this analysis is that as shown in Figure 7 project
costs and benefits will occur in different moments of
project life
Methodologically speaking if this analysis will
be used for comparison of appraised (ex ante) and
real impacts (ex post) (as is generally the goal) we
need to lsquoplacersquo the comparison in the same point in
time The point in time could be at the beginning or
completion of the project or any other point What
is important is to bring all cash flows to that point in
time using discount techniques Then calculate the
NPVs and compare You will be able to use IRRs only
if the cash flow allows it mathematically (ie if there is
a negative Figure in the first year)
But this is not the only consideration to bear in
mind Other issues arise such as
bull Attribution effects of achieved results given
IFADrsquos scale of intervention it could claim
contribution but not full attribution of increased
beneficiary incomes or decline in food insecurity
bull At completion could be too early to capture all
expected benefits (see Figure 7)
bull A mixed approach in order to compensate for
this second issue is to try to estimate benefits
yet to be produced include them in cash flows
and then perform the discounting (however the
results could be questioned)
bull In order to make a realistic comparison CBA
should be done 10 years after implementation
and this has rarely been done
On a more positive note the alternative would be
to choose some activityfarm models effectively
put in place by the project Perform a financial
analysis at completion and compare it with appraisal
estimations (models developed at design for the
WOP situation) in order to estimate how things
have changed This analysis will not be based on
cash flows but on annual bases thus comparing
F IGUR E 7
Profile of costs and benefits over the project cycle
0
20
40
60
80
100
120
Investment costs
Recurrent costs
Benefits
MTR
Supervision EvaluationDesign
PCR
1Years
2 3 4 5 6 7 8 9 10 11 12 13 14 15 16 17 18 19 20
Implementation period years 1-5
Life of the investment years 1-20
31
VOLUME 1 BASIC CONCEPTS AND RATIONALE
annual financial indicators such as total sales total
production costs employment created Hopefully
full development of the model would have been
achieved by completion so as to provide information
on how adequate project interventions had been
This could also potentially provide information on the
reasons underpinning adoption rates
Ex post EFA and scaling upConfronted with the large-scale problem of reducing
rural poverty which it is mandated to address
and the limited resources available from official
development assistance (ODA) IFAD is compelled
to increase the impact of every dollar it invests in
agriculture and rural development For this reason
scaling up the results of successful development
initiatives is an overarching priority that directly
supports the achievement of IFADrsquos mandate To
deliver on this priority IFADrsquos operational practices
must be geared towards supporting all concerned
actors and institutions ndash including poor rural women
and men and their organizations ndash in achieving
impact at scale
The formal IFAD definition of lsquoscaling uprsquo is
expanding adapting and supporting successful
policies programmes and knowledge in order to
leverage resources and partners to deliver larger
more sustainable results for a greater number of
poor rural people Scaling up results means that
IFAD interventions will not be viewed as a way of
expanding small projects into larger ones Instead
they will focus on how successful local initiatives
will sustainably leverage policy changes additional
resources and learning to bring the results to scale
EFA has an important role to play in informing
scaling-up decisions since evidence of favourable
financial and economic impacts should be a key
criterion for deciding whether or not to scale up
Thus the framing questions must incorporate an
economic and financial dimension as follows
bull Idea If a project is referred to as one that is
being scaled up or otherwise further developed
from previous interventions in the host country
or region what were the economic and financial
outcomes of the activity to be scaled up Have
economic and financial impacts been estimated
or measured
bull Vision How many poor rural men and women
will benefit financially and to what extent What
will be the overall economic impact
bull Drivers Are the economic and financial benefits
sufficiently attractive to drive the expansion and
sustain the initiative over the long term
bull Spaces Is there sufficient capacity to finance
the proposed expansion Is the local regional or
national economy large enough to accommodate
it Can markets absorb the level of production
envisaged
bull Pathways What are the financial and economic
implications of alternative scaling-up pathways Is
a gradual or a fast-track approach preferred
bull IFADrsquos role How will IFAD ensure that economic
and financial impacts of the expansion are
properly monitored and evaluated
Scaling-up issues often need to be addressed during
COSOP formulation or country portfolio reviews
especially where grant-funded pilot programmes
have been implemented and are being considered
for scaling up into full-scale investment projects In
these cases EFA of pilot programmes during and
after implementation becomes an important part of
the strategic process
32
Formulas for profitability indicatorsThe net present value (NPV) indicator defined as
the sum that results when the expected costs of the
investment are deducted from the discounted value
of the expected benefits (revenues) is calculated
through the following formula
Where
Bt = benefits at time t Ct = costs at time tIt = investment costs n = project economic life
r = interest rate used as indicator of opportunity
cost discount rate
The internal rate of return (IRR) indicator is defined
as the discount rate (r) that produces a zero NPV
This represents the maximum interest rate that a
project could face and still not waste resources
This is called the internal rate of return (IRR) It is
calculated through
IRR = (r NPV = 0)
For the project to be profitable the IRR has to be
greater than the interest rate that could be earned in
alternative investments thus whenever IRR gt r the
project is considered viable If the (alternative) interest
rate (imkt) is lower than the IRR the NPV is positive
and vice versa
The benefitcost ratio (BC) indicator is the ratio of
the present value of benefits to the present value of
costs over the time horizon The BC ratio provides
some advantages when it is necessary to formulate
a lsquorankingrsquo of alternative investment projects under
budget constraints
If BC ge1 the project is accepted
If BC lt1 the project is rejected
Cost-effectivenessWhen tangible benefits from a given investment
are difficult to quantify but the costs are easily
identifiable the most common valuation method
is cost-effectiveness It is used to select the least
costly alternative among a set of options that will
achieve the same result (a given set of predetermined
objectives) Once the purpose of the project has
been decided for example construction of a market
storage facility cost-effectiveness would be used to
compare scale location technology etc to choose
among investment options (eg open storage
location of the facility construction materials)
The methodology consists in first listing and
measuring in monetary terms the costs of the
options available and then comparing them with
the costs occurring in the base scenario (without
the project) Total costs are then discounted at
year 1 and the results compared to identify the
cheapest intervention In other words valuation by
cost-effectiveness consists in comparing on a
present-worth basis all alternatives that can achieve
the same benefit (Gittinger 1985) and selecting the
least costly
IRR NPV 0gt gti mkt
IRR NPV 0lt lti mkt
IRR NPV 0gt gti mkt
IRR NPV 0lt lti mkt
IRR NPV 0gt gti mkt
IRR NPV 0lt lti mkt
IRR NPV 0gt gti mkt
IRR NPV 0lt lti mkt
Technical annex
33
VOLUME 1 BASIC CONCEPTS AND RATIONALE
Unfortunately the results of this method which
can justify project investment decisions cannot be
integrated into the streams of incremental net benefits
resulting from classic CBA ndash thus underestimating
the overall benefits of the investment
Multicriteria analysis41
MCA is a decision-making tool used to evaluate
complex decision problems With this tool it is
possible to identify overall preferences among
alternative options where the options entail many
diverse objectives Unlike CBA MCA allows
consideration of aspects other than economic and
financial ones for example social technological and
environmental issues Its use is particularly relevant
when other single-criterion approaches cannot
provide monetary valuations42
In the same model thanks to these techniques
it is possible to consider quantitative and qualitative
data It builds on trade-offs between criteria that
in complex decision-making are usually in conflict
(efficiency and equity for example) Choices are
classified aggregating various items of information
in a common index of utility value Since policy
decisions may be influenced by both monetary
and non-monetary objectives it offers a technique
capable of ranking diverse outcomes
MCA establishes preferences among options
referring to a set of objectives identified by decision
makers It is an important instrument for ranking
options and discriminating between acceptable and
unacceptable possibilities Decision makers must
define quantifiable criteria to judge how an objective
has been achieved and MCA allows them to
41 MCA has not yet been tested as a suitable tool for IFAD project design but is suggested as an alternative in the extreme cases mentioned above of complex decision-making
42 One example would be when production objectives are in contraposition to environmental ones For example to increase livestock production for food security and at the same time reduce CO2 emissions
aggregate the data on individual criteria in order to
provide indicators of the overall performance of the
options It brings out the points of view of the actors
involved in the judgment and is characterized by the
subjectivity related to the opinions of the decision-
making group43
The main advantages of MCA are its openness
explicitness and its power to simplify complex
situations In fact it splits the components of
intricate situations and organizes them so as to find
a solution step by step and clearly Objectives and
criteria chosen by the decision group can in fact be
analysed and changed if they are not considered
suitable This process eases the discussion and
promotes communication within the decision-making
body first and later between that body and the
stakeholders MCA can be both an ex ante and an ex
post evaluation tool
This type of analysis also presents some
difficulties One concerns the choice of the activities
or variables to be studied and definition of the
comparative criteria These operations are often
very complicated and require much time spent
in discussions and negotiations Use of MCA
requires knowledge of mathematical notions
data aggregation methodologies and computer
applications in order to perform analysis following a
structured process and to avoid weak conclusions
It is often costly and time-consuming
43 Indeed the opinion team establishes objectives and criteria assesses relative importance weights and judges the contribution of every option to each performance criterion MCA can be preceded by strengths weaknesses opportunities and threats (SWOT) analysis for the choice of criteria it can be supported by an expert panel to help the negotiating group develop an assessment of a specific topic or it can be assisted by focus groups questionnaires and case studies to choose criteria and rate them In addition criteria can be evaluated using cost-effectiveness analysis
34
VOLUME 1 BASIC CONCEPTS AND RATIONALE
Types of projects and EFA activitiesAspects to look for in the field and the type of
analysis undertaken vary considerably among project
categories as shown in Table 7
TA BLE 7
Main EFA tasks by type of project
Project category Main EFA tasks during implementation
Productivity enhancement (including irrigation)
bull Estimate number of beneficiaries and technology adoption rates by target group households
bull Monitor productivity changes product quality and prices
bull Estimate gross margins (per unit of land and labour) for project and non-project households
bull Update farm models based on observedactual results revise economic analysis as necessary and consider adjustments to project design to improve results
Rural infrastructure bull Review construction schedule and costs relative to design estimates
bull Estimate utilization rates for new or upgraded infrastructure
bull Assess arrangements for operation and maintenance
bull Estimate benefits derived by target group households (eg reduced costs increased prices improved market access)
bull Update farm models based on observedactual results revise economic analysis as necessary and consider adjustments to project design to improve results
Natural resource management
bull Undertake a comparison of NRM activities with and without project
bull Review with and without project scenarios of agricultural productivity
bull Seek evidence of more sustainable and responsible NRM practices
bull Identify and if possible quantify value of environmental benefits
bull Update farm models based on observedactual results revise economic analysis as necessary and consider adjustments to project design to improve results
Community development bull Determine number of target group beneficiaries participating in community development activities
bull Identify what has changed in the community and individual households as a result of these activities
bull Describe improvements in the lives of beneficiary households and value these in monetary equivalents if possible
bull Revise economic analysis as necessary and consider adjustments to project design to improve results
35
VOLUME 1 BASIC CONCEPTS AND RATIONALE
Project category Main EFA tasks during implementation
Institutional strengthening bull Prepare inventory of actual institutional-strengthening activities undertaken
bull Complete assessment of institutional capacity and projectrsquos impact on it
bull Identify how improved institutional capacity has or will generate benefits for target groups
bull Revise economic analysis as necessary and consider adjustments to project design to improve results
Marketing and value chain development
bull Review value chain analysis undertaken during project preparation to update data on volumes costs prices and value addition
bull Identify ways in which improvements in value chain efficiency have improved or are likely to improve market access and farmgate prices for beneficiaries
bull Estimate financial benefits accruing to target group farmers and other value chain actors
bull Update farm models based on observedactual results revise economic analysis as necessary and consider adjustments to project design to improve results
Rural financial services bull Estimate number of beneficiaries with improved access to financial services types of services offered and acceptance rates
bull Monitor cost of financial services at different levels (cost of loanable funds retail service costs at client level) and compare with project design estimates
bull Assess actual or likely changes in farm and non-farm economic activities arising from improved access to rural financial services
bull Estimate the net financial benefits accruing to target group beneficiaries from these changes
bull Update farm models based on observedactual results revise economic analysis as necessary and consider adjustments to project design to improve results
36
Anandajayasekeram P CJ Van Rooyen F Liebenberg 2004 Agricultural project planning and analysis A sourcebook Second Edition Network Activity Program ndash Institutional University Cooperation (IUC) between the Flemish Universities of Belgium and University of Pretoria
Asian Development Bank 2013 Cost-benefit analysis for development A practical guide Manila httpwwwadborgdocumentscost-benefit-analysis-development-practical-guide
Australian Department of Infrastructure and Planning Queensland Government 2012 Project assurance framework ndash Cost benefit analysis guidelines Brisbane Queensland Australia
Belli P J Anderson H Barnum J Dixon and J-P Tan 1998 Handbook on economic analysis of investment operations Washington DC Operational Core Services Network Learning and Leadership Center World Bank httpsiteresourcesworldbankorgINTCDDResourcesHandbookEApdf
Belli P 2001 Economic analysis of investment operations Analytical tools and practical operations Washington DC World Bank
Campell H R Brown 2003 Benefit cost analysis financial and economic appraisal using spreadsheet Cambridge University Press
CIFOR 1999 Guidelines for applying multi-criteria analysis to the assessment of criteria and indicators Bogor Indonesia Center for International Forestry Research wwwcifororgacmmethodstoolbox9html
Department for Communities and Local Government 2009 Multi-criteria analysis A manual London httpeprintslseacuk127611Multi-criteria_Analysispdf
DFID 2011 Guidance for country offices on measuring and maximising value for money in cash transfer programmes London Department for International Development (UK)
European Commission 2008 Guide to cost-benefit analysis of investment projects Brussels httpeceuropaeuregional_policysourcesdocgenerguidescostguide2008_enpdf
FAO 1979 Economic analysis of forestry projects Case studies FAO Forestry Paper No 17 Supp 1 Rome Food and Agriculture Organization of the United Nations
FAO 1995 Guidelines for the design of agricultural investment projects Investment Centre Technical Paper No 7 Rome Food and Agriculture Organization of the United Nations
FAO 2010 Estimating mitigation potential of agricultural projects An application of the EX-ante carbon balance tool (EX-ACT) in Brazil Rome Food and Agriculture Organization of the United Nations
Gittinger J Price 1985 Economic analysis of agricultural projects Washington DC Economic Development Institute World Bank httpdocumentsworldbankorgcurateden198501437966economic-analysis-agricultural-projects
Government of South Africa 2004 Cost-benefit analysis Pretoria Department of Environmental Affairs and Tourism
IFAD 2012 Review of post-harvest systems in IFAD programmes Rome
Jenkins G C Kuo A Harberger 2011 Cost-benefit analysis for investment decisions httpwwwqueensjdiexecorgpublicationsqed_dp_206pdf
Lewis DL 1999 Road user and mitigation costs in highway pavement projects Washington DC Transportation Research Board National Research Council
Mishan EJ 1971 Cost-benefit analysis London George Allen and Unwin
Potts D 2002 Project planning and analysis for development httpswwwriennercomtitleProject_Planning_and_Analysis_for_Development
Raswant V and E Heinemann 2012 Access to markets Making value chains work for poor rural people Rome IFAD
Squire L and HG van der Tak 1975 Economic analysis of projects Baltimore MD USA Johns Hopkins University Press
References
37
VOLUME 1 BASIC CONCEPTS AND RATIONALE
Treasury Board of Canada 2007 Canadian cost-benefit analysis guide Ottawa Secretariat Treasury Board of Canada analys-engpdf
UNIDO 1972 reprinted 1993 Guidelines for project evaluation Order No IDSERH2 Vienna United Nations Industrial Development Organization
UNIDO 1986 Manual for evaluation of industrial projects Vienna United Nations Industrial Development Organization wwwunidoorgfileadminuser_mediaPublicationsdownloadManual_for_Evaluation_of_Industrial_Projectspdf
USAIDINDIA 2000 REFORM Project compendium with practitionersrsquo guide State fiscal management reform Vol V Project appraisal practitionersrsquo guide New Delhi US Agency for International DevelopmentIndia httppdfusaidgovpdf_docsPNADM777pdf
World Bank 2013 Investment Project Financing Economic Analysis Guidance Note httpsiteresourcesworldbankorgPROJECTSResources40940-1365611011935Guidance_Note_Economic_Analysispdf
World Bank 2012 A guide to assessing needs Essential tools for collecting information making decisions and achieving development results by Watkins R Meiers M amp Visser Y httpsopenknowledgeworldbankorgbitstreamhandle109862231663920PUB0EPI00essing09780821388686pdfsequence=1
38
Glossary
Aggregation 15 16 20 in project analysis the process of adding together the costs and benefits of all the entities participating in a project to reach a summary account from which a measure of project worth can be derived Often the result of the aggregation is the Incremental Net Benefit or Cash Flow of a project
Appraisal 7 24 31 A before the fact (ex- ante) evaluation of a proposed investment project to determine its merit and acceptability in accordance with established decision-making criteria
Benefitcost ratio (BC ratio) 13 33 a discounted measure of project worth The ratio of benefits to costs It should be calculated using the present values of each discounted at an appropriate discount rate Most often the opportunity cost of capital The ratio should be at least 1 for the project to be acceptable It may give incorrect ranking among independent projects and cannot be used for choosing among mutually exclusive alternatives
Border price 23 The border price is the unit price of a traded good at the countryrsquos border For exports it is the FOB (free on board) price and for imports it is the CIF (cost insurance and freight) price
Business as Usual (BAU) 8 9 11 14 19 a reference scenario which assumes that future evolution is an extension of the current trends See also lsquodo nothing scenariorsquo
Cash flow 11 12 16 19 20 31 The funds generated or used by the project Reflects the costs and benefits over time from a stated point of view Incomebenefit is a positive cash flow and expensescosts are negative flows
Constant price A price that has been deflated to real terms by an appropriate price index They should be distinguished from current or nominal prices Often used as synonym of real prices
Contingent valuation A method of inferring the value of benefits and costs in the absence of a market What people would be willing to pay to gain a benefit (or willing to accept in recompense for a loss) if a market existed for the good
Conversion factor 5 16 23 30 the factor that converts the domestic market price to an economic price Conversion factors are the ratios of economic to financial prices Thus a conversion factor is a number that is used to convert the domestic market price of an item into its economic opportunity cost to the
economy by multiplying the market price of the item by the conversion factor
Cost An expense related to purchase of inputs including capital equipment buildings materials labour and public utilities Costs such as environmental damage or injuries to health are sometimes referred to as negative externalities
Cost Benefit Analysis (CBA) 7 8 18 31 conceptual framework applied to any systematic quantitative appraisal of a public or private project to determine whether or to what extent that project is worthwhile from a social perspective Cost-benefit analysis differs from a straightforward financial appraisal in that it considers all gains (benefits) and losses (costs) to social agents CBA usually implies the use of economicsocial prices
Cost effectiveness analysis (CEA) 20 33 an appraisal technique used in projects and programs in which benefits cannot be reasonably measured in money terms Cost-effectiveness analysis is used in one of two forms to select least-cost alternatives either holding constant the level of benefits and varying the level of costs or holding constant the level of cost and varying the level of benefits In either form the ratio of cost to benefits is known as the cost-effectiveness ratio
Current prices (Nominal prices) prices as actually observed at a given time They refer to prices that include the effects of general inflation and should be contrasted with constant prices
Cut-off rate the rate below which a project is considered unacceptable It is often taken to be the opportunity cost of capital The cut-off rate would be the minimum acceptable internal rate of return for a project or the discount rate used to calculate the net present value the net-benefit investment ratio or the benefit-cost ratio
Depreciation 14 Not a term used in cost-benefit analysis In other financial frameworks depreciation is the allocation of the cost of an asset over time Depreciation is a method of allocating the cost of a tangible asset over its useful life For accounting purposes depreciation indicates how much of an assetrsquos value has been used up For intangible assets amortization is the correct term However these are accounting concepts that makes no sense in financial analysis Here the full investment costs will be computed every time the asset needs replacement
39
VOLUME 1 BASIC CONCEPTS AND RATIONALE
Direct transfer payment 15-17 Transfer payments are transfers of money among residents of a country without a corresponding exchange of goods and services Taxes are transfer payments from individuals to the government Subsidies are transfer payments from the government to individuals Gifts are transfers ldquoin kindrdquo from one individual to another Because transfer payments are not made in return for goods and services they do not add to total output When transfer payments occur in the context of projects they redistribute project costs or benefits from the project entity to some other group or individual in the country
Discount rate 12 14 16 23 the interest rate at which future values are discounted to the present It usually represents the cost of capital for the person or entity calculating the net present value of the stream The financial discount rate and economic or social discount rate may differ in the same way that market prices may differ from economic prices The selection of the discount rate in financial analysis is a relative straightforward process and that is calculated as the potential gains of alternative safe investments on the market In economic analysis where project viewpoint is overturned toward the socio-economic context this parameter needs to be estimated properly so as to i) reflect the public nature of the investment ii) account for scarcity of resources and iii) ensure good use of public funds (See also social discount rate)
Discounted cash flow 14 The costs and benefits (cash flows) discounted to present values to give a common basis for comparison
Discounting 12 31 The process of adjusting future values to an equivalent present value at a stated point in time by a discount rate
Distortion 16 30 A difference between market prices and true values (economic prices) A distortion is any interference with market forces that renders the resulting quantity produced and price different from the price and quantity that would result under conditions of perfect competition
Distributional effect A change in the income or wealth of the people from whose point of view the benefit-cost analysis is done
Do nothing scenario the baseline scenario lsquobusiness as usualrsquo against which the additional benefits and costs of the lsquowith project scenariorsquo can be measured (often a synonym for the lsquowithout projectrsquo scenario)
Economic analysis 7 14-17 20 30 analysis that is undertaken using economic values reflecting the values that society would be willing to pay for a good or service In general economic analysis values all items at their value in use or their opportunity cost to
society (often a border price for tradable items) It has the same meaning as social cost-benefit analysis
Economic cost The economic cost of an activity or resource is the cost to society of that activity or resource Economic costs include the private costs borne directly by economic agents undertaking the activity and all other costs borne by other economic agents For example the economic costs of driving automobiles include the private costs of petrol plus the additional costs of congestion borne by other users of the roads plus the costs of pollution borne by society in general
Economic impact analysis the analysis of the total effects on the level of economic activity (output income employment) associated with the intervention This kind of analysis focuses on macroeconomic indicators and forecasts the influence of the project on these indicators It goes beyond CBA when very large projects are considered in relatively small economies
Economic net present value (ENPV) 16 The net present value of a project calculated using true or economic values Synonymous with social net present value
Economic price 16 Price that reflects the relative value that should be assigned to inputs and outputs if the economy is to produce the maximum value of physical output efficiently There is no consideration of income distribution or other non-efficiency goals in such a price Synonymous with efficiency price and true price
Economic rate of return (ERR) 16 An internal rate of return based on economic prices and social opportunity costs of capital expressing the socio-economic profitability of a project (See internal rate of return)
Environmental impact analysis the statement of the environmental impact of a project that identifies its physical or biological effects on the environment in a broad sense This would include the forecasting of potential pollution emissions loss of visual amenity and so on
Export parity price 23 footnote The export parity price is the FOB price of a good or service valued at point of export net of taxes and subsidies and suitably adjusted for internal transport costs to a location in a country The export parity price is the net-of-taxes-and-subsidies price that exporters would need to receive for a good or service sold in the domestic market in order to make them indifferent between selling in the domestic market or exporting
Externalities 5 15-17 30 A benefit or cost falling on third parties who normally cannot pay or be compensated for it through a market mechanism An external benefit is a positive externality an external
40
VOLUME 1 BASIC CONCEPTS AND RATIONALE
cost is a negative externality A positive externality may reduce the costs of a production process of an unrelated economic agent as when the bees of a bee grower pollinate a neighbourrsquos apple orchard They may also increase the enjoyment of another economic agent as when musicians playing for their own pleasure delight those around them A negative externality increases the production costs or reduces enjoyment for another economic agent Traffic congestion and the numerous forms of environmental pollution such as the pollution created by a manufacturing plant are examples of negative externalities Externalities are not reflected in the financial analysis For economic analysis however it is necessary to take such externalities into account and place a value on them
Ex-ante evaluation 24-25 30 the evaluation carried out in order to take the investment decision It serves to select the best option from the socio economic and financial point of view It provides the necessary base for the monitoring and subsequent evaluations ensuring that wherever possible the objectives are quantified
Ex-post evaluation 24-25 30-32 an evaluation carried out a certain length of time after the conclusion of the initiative It consists of describing the impact achieved by the initiative compared to the overall objectives and project purpose (ex-ante)
Farm gate price The price received by farmers for their products net of transport costs to the market where the products are sold
Feasibility study 9 19 a study of a proposed project to indicate whether the proposal is attractive enough to justify more detailed preparation It contains the detailed technical information necessary for the financial and economic evaluation
Financial analysis 7 14-17 19 30 31 the analysis carried out using market prices and taking a commercial point of view It allows one to 1) verify and guarantee cash balance (verify the financial sustainability) 2) calculate the indices of financial return on the investment project based on the net discounted cash flows
Financial sustainability analysis 14 19 20 analysis carried out in order to verify that financial resources are sufficient to cover all financial outflows year after year for the whole time horizon of the project Financial sustainability is verified if the cumulated net cash flow is never negative during all the years considered
Financial rate of return An internal rate of return based on market prices and opportunity costs of capital(See internal rate of return)
Human capital Human capital is the stock of skills and productive knowledge embodied in people The
purpose of investing in human capital is to improve the productivity of human beings
Impact 25-27 a generic term for describing the changes or the long term effects on society that can be attributed to the project Impacts should be expressed in the units of measurement adopted to deal with the objectives to be addressed by the project
Import parity price 23 footnote The import parity price is the CIF price of a good or service valued in a specific geographical location It includes the CIF price of the good suitably adjusted for transport costs net of taxes and subsidies The import parity price aims to measure the price that producers in the country would receive for a good or service produced in the country for sale in the domestic market under conditions of free trade
Incremental 11-14 19-20 Additional or marginal
Inflation A general increase in market price levels (a fall in the general purchasing power of the currency unit)
Input 26 28 That which is consumed by the project (as opposed to the projectrsquos output) Usually refers to the physical inputs used by the project including materials capital labour and public utilities Inputs like environmental quality foreign exchange and workersrsquo health are usually termed externalities
Internal rate of return (IRR) 12 33 The yield or profitability of a project based on discounted cash-flow analysis The IRR is the discount rate at which a stream of costs and benefits has a net present value of zero It is equivalent to the discount rate r that satisfies the following relationship
IRR NPV 0gt gti mkt
IRR NPV 0lt lti mkt
where Bt is the benefit stream and Ct is the cost stream The internal rate of return is compared with a benchmark in order to evaluate the performance of the proposed project The internal rate of return is then compared with the market rate of interest to determine whether or not a proposed project should be undertaken (See cut-off rate)
Financial Rate of Return is the internal rate of return calculated when all the inputs and outputs are calculated using financial values Economic rate of Return is based on economic opportunity costs
Logframe 10 25-27 is a management tool mainly used for designingand MampE of development projects It consists of four steps (1) establishing objectives (2) establishing cause-and-effect relationships (causal linkages) among activities inputs outputs and objectives (3) identifying assumptions underlying the causal linkages and (4) identifying objectively-verifiable measures for evaluating progress and success
41
VOLUME 1 BASIC CONCEPTS AND RATIONALE
Market price 14-17 (a) The price of a good in the domestic market (see financial prices) as opposed to the economic price shadow price or social price (b) the cost of a good including indirect taxes and subsidies It is the price relevant for financial analysis
Model A representation or simulation of a system or process showing how parameters benefits and costs interact to produce a bottom-line result by which the project can be judged
Monitoring 25-27 the systematic examination of the state of advancement of an activity according to a pre-determined calendar and on the basis of significant and representative indicators
Multi-criteria analysis 22 34 MCA is an evaluation methodology that considers many objectives by the attribution of a weight to each measurable objective In contrast to CBA that focuses on a unique criterion (the maximisation of social welfare) Multi Criteria Analysis is a tool for dealing with a set of different objectives that cannot be aggregated through shadow prices and welfare weights as in standard CBA
Mutually exclusive 8 12 13 Alternatives that cannot be undertaken simultaneously if one alternative is carried out the other cannot be The alternatives may be mutually exclusive because they represent alternative times of beginning the same project because funds are limited or because if one is carried out the other will not be required (for example a choice between a thermal and a hydro power station)
Net present value (NPV) 12 13 27-29 33 The net value of an investment when all costs and benefits expressed in standard units of value (numeraires) are summed up The sum that results when the discounted value of the expected costs of an investment are deducted from the discounted value of the expected revenues The net present value of a stream of costs and benefits is a number that results from discounting the values of the stream at a given discount rate It is equivalent to the number that results from the following expression
IRR NPV 0gt gti mkt
IRR NPV 0lt lti mkt
whereBt = benefits at time t Ct = costs at time tIt = investment costs n = project economic lifer = discount rate
Net revenues the amount remaining after all outflows have been subtracted from all inflows Discounting the incremental net revenues before financing gives a measure of the project worth of all resources engaged discounting the incremental net revenues after financing gives a measure of the project worth of the entityrsquos own resources or equity
Nominal prices Prices prevailing in a particular year Synonymous with budget-year dollars
Non-tradable good 16 23 footnote good or service that by its very nature cannot be exported or imported Land and buildings are examples of a non-tradable good
Non-traded good 16 23 footnote A non-traded good or service is one that is neither exported nor imported in a particular country for a variety of reasons including quotas and prohibitions Common examples of non-traded items are certain drugs haircuts etc In project analysis non-traded refers to goods and services not traded by the country in which the project is located
Numeraire a standard unit of value Money is a numeraire by which the values of different commodities can be compared In cost-benefit analysis the numeraire is the common denominator for measuring benefits and costs Widely used numeraires are the willingness to pay or aggregate consumption numeraire and the foreign exchange numeraire
Operational and maintenance costs 21 35 The recurring costs for operating and maintaining the value of physical assets
Opportunity cost 12 16 19 The best alternative return foregone elsewhere by committing assets to the project The value of something foregone For example the direct opportunity cost of a person-day of labour is what the person would otherwise have produced or being paid for that day of work The value of a resource in its best alternative use For the financial analysis the opportunity cost of a purchased input is always its market price In economic analysis the opportunity cost of a purchased input is its marginal social value in its best non-project alternative use
Output 27 That which is produced Usually refers to the physical product of the project Other effects of the project such as housing for workers employment training of labour and foreign-exchange savings are usually called externalities
Payback period The time required for the cumulative present value of benefits to become equal to the cumulative present value of costs
Programme 8 is a portfolio of multiple projects that are managed and coordinated as one unit with the objective of achieving common (often intangible) outcomes and benefits at sector country or even multi-country level
Project 8 is a temporary entity established to deliver specific (often tangible) outputs in line with predefined time cost and quality constraints A project should always be defined executed and evaluated relative to an approved business plan which balances its costs benefits and risks
42
VOLUME 1 BASIC CONCEPTS AND RATIONALE
Project analysis 8 20 the analytical framework for the evaluation of a projectrsquos feasibility and performance It includes the analysis of the context the objectives technical aspects demand forecasts and financial and economic costs and benefits Project analysis is needed to determine if given the alternatives a proposed project will sufficiently advance the objectives of the entity from whose standpoint the analysis is being undertaken to justify the project
Project cycle 24-25 30-31 a sequence of the series of necessary and pre-defined activities carried out for each project Typically it is separated into the following phases conceptualization inception formulation appraisal ex-ante evaluation financing implementation and ex-post evaluation
Real prices calculated by adjusting market prices by an appropriate price index to eliminate the effects of inflation Prices of goods and services change over time either because the general price level rises that is because of inflation or because the underlying conditions of supply and demand change Real prices refer to prices of goods and services that reflect changes in the underlying conditions of supply and demand but that do not reflect the effects of inflation The terms real prices and constant prices are used interchangeably but referring to real prices as constant prices is misleading Real prices do not necessarily remain constant over time as they change in response to changes in supply and demand Real prices should be distinguished from current prices which reflect inflation as well as changes in supply and demand
Relative prices the exchange value of two goods given by the ratio between the quantity exchanged and their nominal prices
Risk 10 25-27 The degree to which outcomes are uncertain The extent of possible variation in the outcome
Risk analysis 10 25-27 Risk analysis is a technique for assessing the expected net present value of a project in relation with project risks By taking into account the probability distribution of critical variables and the correlations among them it enables analysts not only to assess the expected net present value of a project but also its associated probability distribution In cost-benefit analysis it recognizes the simultaneous variation of the values of several inputs according to specified ranges and probabilities and analyses the resulting variability in the bottom line
Scale 31-33 The size of a project
Scenario 11 14 30 An outline or portrait of a possible future usually portrays unfolding events rather than being static in time
Sensitivity analysis 16 27-29 Sensitivity analysis is an analytical technique to test systematically the
effects on a projectrsquos outcome of changes in its basic assumptions Sensitivity analysis is carried out by varying one element or a combination of elements and determining the effect of that change on projectrsquos profitability indicators (NPV and IRR)
Shadow price 16 23 footnote 30 A shadow price of a good or service is the economic opportunity cost to society of that good or service The true or economic value of a good (as opposed to the market price which might be distorted) Synonymous with economic or social price
Social price 16 A price that reflects the true value to the country of inputs and outputs of the project Synonymous with economic price and shadow price
Social discount rate 12 footnote 16 It attempts to reflect the social view on how the future should be valued against the present (See Discount rate)
Socio-economic costs and benefits 13 opportunity costs or benefits for the economy as a whole They may differ from private costs and benefits to the extent that actual prices differ from economic prices
Switching value 27-28 The switching value of a variable is that value that it would have to attain in order for the outcome of the project to fall below the minimum level of acceptability (net present value of the project equal to nil)
Time value of money Time value of money refers to the concept that money received in the present is more valuable than money received in the future It is the concept underlying discounting
Tradable 16 23 footnote Referring to a good that could be traded internationally in the absence of restrictive trade policies
Traded good 16 23 footnote A traded good is a good that is either exported or imported by some country
Transfer payments 15-17 22 Payments that redistribute wealth but do not use up resources or create them
Willingness to pay What consumers are willing to pay for a good or service Consumers willing to pay substantially more than the actual market price enjoy a consumer surplus (the amount they would pay minus the amount they actually have to pay)
With project scenario (WP) 11 Box 2 estimation simulation modelling of project envisaged costs and benefits
Without project scenario (WOP) 11 Box 2 the baseline scenario against which the additional benefits and costs of the with project scenario can be measured (eg business as usual)
43
VOLUME 1 BASIC CONCEPTS AND RATIONALE
Steps in economic analysis
Economic analysis requires assessment of a projectrsquos net impact on economic welfare
by considering
5 Convert all market prices into economicshadow prices (SP) that better reflect the social
opportunity cost of the good
6 Remove transfer payments (taxes and subsidies) and quantify externalities (positive
and negative)
7 Aggregate all modelsrsquo NIB cash flows respecting incorporation phasing patterns of targeted
beneficiaries into projectrsquos activities
8 Compare aggregated benefits with other project costs to obtain incremental discounted
cash flows Calculate economic performance indicators adopting a social discount rate
ENPV ERR BC ratio
9 Perform sensitivity analysis (SA) in order to deal with the main risks and uncertainties that
could affect the proposed project
Steps in financial analysis
The typical sequence of tasks to be undertaken in financial analysis is the following
1 Develop farmenterprise models and identify benefits and costs (investment and recurrent) for
WOP and WP scenarios (based on crop budgets)
2 Compare the discounted flows of benefits and costs and calculate the differences between the
obtained results and the WOP scenario in order to determine the net incremental benefits (NIB)
of the proposed interventions
3 Calculate the project financial profitability indicators of each model (ie financial NPV financial
IRR and BC ratio) applying these investment criteria to make an investment decision
(positive or negative)
4 Assess family incomes and establish financingcredit needs by performing a lsquosustainability analysisrsquo
Summary steps in financial and economic analysis
44
WP-WOP develop and identify
Develop farmenterprise models and identify benefits and costs (investment and recurrent) for WOP and WP scenarios (based on crop budgets)
Calculate indicators
Calculate the project financial profitability indicators of each model (ie financial NPV financial IRR and BC ratio) applying these criteria to make an investment decision
Financial sustainability
Assess family incomes and establish credit needs by performing a lsquosustainability analysisrsquo
Discount flows ndash costs and benefits
Compare the discounted flows of benefits and costs and calculate the differences between the obtained results and the WOP scenario in order to determine the net incremental benefits (NIB) of the proposed interventions
Shadow prices
Convert all market prices into economicshadow prices (SP) that better reflect the social opportunity cost of the good
Aggregation
Aggregate all modelrsquos NIB cash flows respecting incorporation phasing patterns of targeted beneficiaries
Cash flows
Compare aggregated benefits with other project costs to obtain incremental discounted cash flows Calculate economic performance indicators adopting a social discount rate ENPV ERR BC ratio
Transfers and externalities
Deduct taxes and subsidies ndash Consider positive and negative externalities
Perform sensitivity analysis
in order to deal with the main risks and uncertainties that could affect the proposed project
1
5
6
7
8
9
2
3
4
Economic analysisFinancial analysis
EFA step by step
International Fund for Agricultural Development
Via Paolo di Dono 44 - 00142 Rome ItalyTel +39 06 54591 - Fax +39 06 5043463E-mail ifadifadorgwwwifadorgwwwruralpovertyportalorg
ifad-unblogspotcom
wwwfacebookcomifad
instagramcomifadnews
wwwtwittercomifadnews
wwwyoutubecomuserifadTV
Contacts EFA desk
Eloisa de Villalobos Thomann
EFA Technical Adviser Tel +39 06 5459 2827Email edevillalobosifadorg
Enrico Mazzoli
Technical Adviser Tel +39 06 5459 2462Email emazzoliifadorg
- Acknowledgements
- Contents
- Abbreviations and acronyms
- Section I - Introduction
-
- Background
- Scope
- Outline
- How to read the guidelines
-
- Section II - Relevance of EFA
-
- Relevance of economic and financial analysis
- EFA as a decision-making tool in project planning
-
- Section III - Basic concepts in undertaking EFA
-
- Investment criteria profitability indicators
- Economic and financial analysis the differences
-
- Section IV - EFA of IFAD rural
-
- Focusing on lsquotypicalrsquo IFAD rural investment projects and their main benefits
- Unquantified benefits alternative methodologies to CBA
- EFA data sources collection and coherence
-
- Section V - EFA role throughout
-
- EFA in project design Links with the logframe and MampE
- EFA in project design Risk analysis
- EFA in project supervision implementation and ex post evaluation
- Ex post EFA and scaling up
-
- Technical annex
-
- Formulas for profitability indicators
- Cost-effectiveness
- Multicriteria analysis
- Types of projects and EFA activities
-
- References
- Glossary
- Summary steps in financial and economic analysis
-
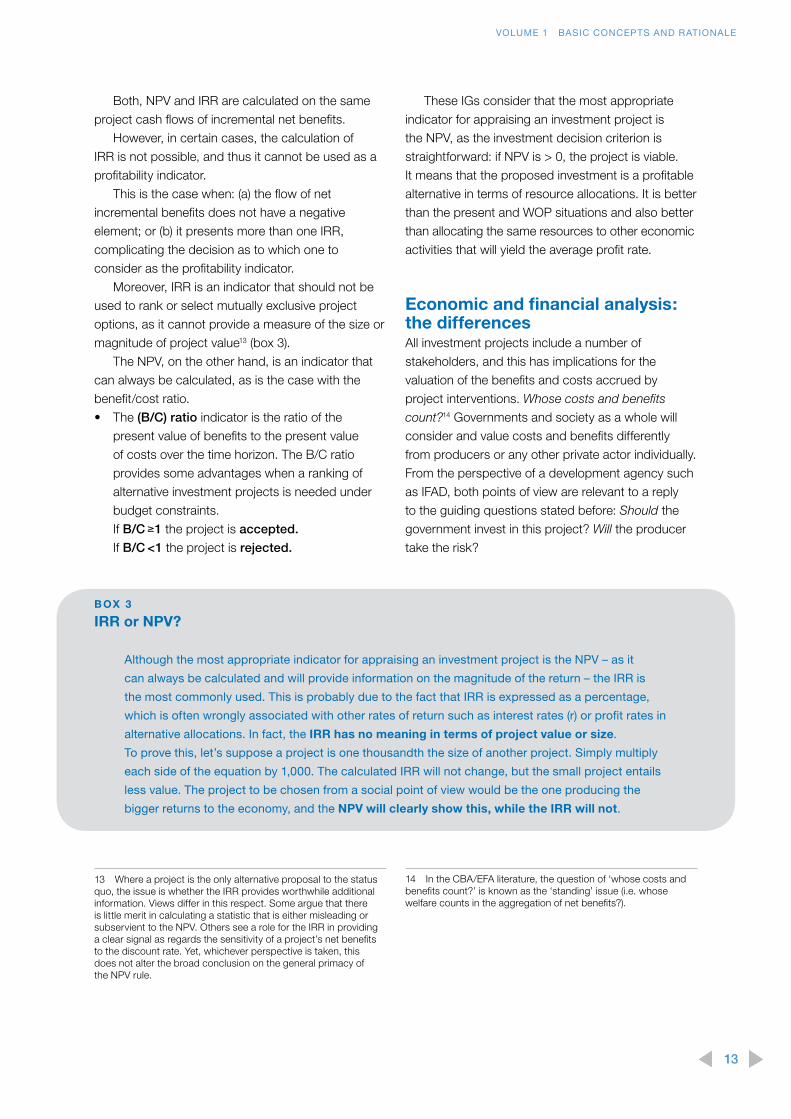
VOLUME 1 BASIC CONCEPTS AND RATIONALE
Both NPV and IRR are calculated on the same
project cash flows of incremental net benefits
However in certain cases the calculation of
IRR is not possible and thus it cannot be used as a
profitability indicator
This is the case when (a) the flow of net
incremental benefits does not have a negative
element or (b) it presents more than one IRR
complicating the decision as to which one to
consider as the profitability indicator
Moreover IRR is an indicator that should not be
used to rank or select mutually exclusive project
options as it cannot provide a measure of the size or
magnitude of project value13 (box 3)
The NPV on the other hand is an indicator that
can always be calculated as is the case with the
benefitcost ratio
bull The (BC) ratio indicator is the ratio of the
present value of benefits to the present value
of costs over the time horizon The BC ratio
provides some advantages when a ranking of
alternative investment projects is needed under
budget constraints
If BC ge 1 the project is accepted
If BC lt 1 the project is rejected
13 Where a project is the only alternative proposal to the status quo the issue is whether the IRR provides worthwhile additional information Views differ in this respect Some argue that there is little merit in calculating a statistic that is either misleading or subservient to the NPV Others see a role for the IRR in providing a clear signal as regards the sensitivity of a projectrsquos net benefits to the discount rate Yet whichever perspective is taken this does not alter the broad conclusion on the general primacy of the NPV rule
These IGs consider that the most appropriate
indicator for appraising an investment project is
the NPV as the investment decision criterion is
straightforward if NPV is gt 0 the project is viable
It means that the proposed investment is a profitable
alternative in terms of resource allocations It is better
than the present and WOP situations and also better
than allocating the same resources to other economic
activities that will yield the average profit rate
Economic and financial analysis the differencesAll investment projects include a number of
stakeholders and this has implications for the
valuation of the benefits and costs accrued by
project interventions Whose costs and benefits
count14 Governments and society as a whole will
consider and value costs and benefits differently
from producers or any other private actor individually
From the perspective of a development agency such
as IFAD both points of view are relevant to a reply
to the guiding questions stated before Should the
government invest in this project Will the producer
take the risk
14 In the CBAEFA literature the question of lsquowhose costs and benefits countrsquo is known as the lsquostandingrsquo issue (ie whose welfare counts in the aggregation of net benefits)
BOX 3
IRR or NPV
Although the most appropriate indicator for appraising an investment project is the NPV ndash as it
can always be calculated and will provide information on the magnitude of the return ndash the IRR is
the most commonly used This is probably due to the fact that IRR is expressed as a percentage
which is often wrongly associated with other rates of return such as interest rates (r) or profit rates in
alternative allocations In fact the IRR has no meaning in terms of project value or size
To prove this letrsquos suppose a project is one thousandth the size of another project Simply multiply
each side of the equation by 1000 The calculated IRR will not change but the small project entails
less value The project to be chosen from a social point of view would be the one producing the
bigger returns to the economy and the NPV will clearly show this while the IRR will not
13
VOLUME 1 BASIC CONCEPTS AND RATIONALE
In order to consider these points of view analysis
will be conducted on two levels (a) financial analysis
will consider private stakeholdersrsquo interests15 and
(b) economic analysis will consider government
and society perspectives These two viewpoints will
require the analyst to consider different items
when looking at the benefits and costs of a project
valuate them differently and in some cases even
use different rates to discount the streams of costs
and benefits
The private investor exclusively considers the
costs and benefits related to the productivemarket
aspects of the project while analysis from an
economic point of view considers that benefits are
defined as an increase in social well-being16 The
costs are defined as reductions in social well-being
For a project to be economically viable its social
benefits must exceed its social costs
15 This point of view is also applied to the executing agency of a public project
16 The term lsquosocial welfarersquo or lsquowell-beingrsquo is used in these IGs as a simple monetary measure The definition is taken from neoclassical economics and prevailing economic theories of well-being No attempts are made to include any type of measurement of subjective happiness or to develop any well-being indexes or social indicators
Thus from the perspective of a private
stakeholder (financial analysis) participating in the
investment with risk capital the wealth created by
a project in lsquonrsquo periods of time is defined as the
financial NPV (FNPV) The economic or cost-benefit
analysis looks at the overall impact of the project
and takes the point of view of the collective agent
(eg society) and the wealth created by a project in
lsquonrsquo periods of time is defined as the economic NPV
(ENPV) of the investment produced by the project17
In financial analysis all costs and benefits
should be valued at market prices Only cash inflows
and outflows are considered (depreciation reserves
and other accounting items not corresponding to
actual flows are excluded)
17 In rural development projects where the agent is a subsistence farmer accumulated generated cash per year must be at least equal to or higher than the BAU situation that was ensuring hisher familyrsquos survival
BOX 4
Steps in financial analysis
The typical sequence of tasks to be undertaken in financial analysis is the following
1 Develop farmenterprise models and identify benefits and costs (investment and recurrent) for
WOP and WP scenarios (based on crop budgets)
2 Compare the discounted flows of benefits and costs and calculate the differences between the
obtained results and the WOP scenario in order to determine the net incremental benefits (NIB) of
the proposed interventions
3 Calculate the project financial profitability indicators of each model (ie financial NPV financial
IRR and BC ratio) applying these investment criteria to make an investment decision (positive or
negative)
4 Assess family incomes and establish financingcredit needs by performing a lsquosustainability analysisrsquo
Financial sustainability is ensured if the accumulated generated cash per year is positive or
at most equal to zero17 for all years considered On the contrary if this figure is negative at any
point in time the project is not sustainable meaning that there are not enough financial resources
to cover all the costs and it will be necessary to reassess project financing mechanisms
14
VOLUME 1 BASIC CONCEPTS AND RATIONALE
Economic analysis or cost-benefit analysis
builds on the results of financial analysis with the
additional consideration of impacts and benefits not
directly captured by the latter These analyses are
strictly related as shown in Figure 4
The main steps in financial analysis are
summarized in box 4 A detailed description of
building economic analysis from financial models is
provided in volume 2 which illustrates each step in
EFA of a typical IFAD production-oriented project
In economic analysis the analyst needs to
complement financial analysis by considering all
project impacts on the society The private actor is
generally not interested in considering all negative
or positive impacts that his actions may have on the
rest of society In terms of environmental impact
for example polluting rivers through production
discharges or emitting CO2 are social costs generally
not considered by the private agent These are called
lsquoexternalitiesrsquo as in practical terms the private agent
is lsquoexternalizingrsquo a production cost making the whole
society pay for it On the other hand there also exist
positive effects not counted by the private agent
such as the introduction of new pastures by a single
producer which can increase honey production in
the area and benefit neighbouring beekeepers
These aspects are known as positive and
negative externalities In addition economic analysis
must eliminate all transfer costs between national
and private actors (ie subsidies and taxes) Lastly all
costs and benefits need to be valued at their social
opportunity cost rather than at their market price
F IGUR E 4
Economic and financial analysis links
Aggregation
Project net incremental
benefits(NIB)
Farm budgets properly phased
Activity budgets (eg processing enterprises)
phased
Government implementing
agencies
Financial analysis(market prices)
123n
123n
Farm budgets properly phased
Activity budgets (eg processing enterprises)
phased
Government implementing
agencies
sum
sum
sum
Economic analysis(economic values)
123n
123n
Adjust market values to economic
values
Eliminate transfer
payments (taxes and subsidies)
Quantify externalities
15
VOLUME 1 BASIC CONCEPTS AND RATIONALE
Many times for example when trade barriers
are in place or when currencies are controlled
market prices do not reflect the social value of
goods In order to account for these distortions
one of the most critical tasks is the calculation of
economic or shadow prices Another critical aspect
is the establishment of a social rate of discount
that realistically reflects an investment alternative
(opportunity cost) for the government18 Detailed
explanations and guidelines for these calculations
are also included in volume 2
Table 1 illustrates the process of going from
financial to economic analysis19 The financial
analysis section at the top shows revenues and 20
production costs (operating and investment) of a
hypothetical enterprise The enterprise is experiencing
18 As a general rule when a country is a capital borrower the social rate of discount should be no less than the actual rate of interest on the capital market from which the capital is borrowed
19 Clicking on the table reveals the formulas
20 See section on ldquoUse of SA to assess project risks an examplerdquo
several years of negative net cash flows resulting
in a negative NPV and IRR This is caused by high
operating costs as well as recurrent needs for
investment Economic analysis converts market
prices into economic prices As reflected by the
application of conversion factors (CF) market prices
of outputs and inputs are different from their social
value For example the CF applied to wages reflects
the presence of high unemployment (20 per cent)
in the area which would push people to work for
lower than market wages (thus CF = 08)21 In the
same way the CF applied to investments reflects
the presence of high transport costs or duties that
make the productrsquos market price overestimate its
social value In fact the market price is 83 while the
economic price is 75 and thus the CF is 09
21 Market wage (mW) = US$100 unemployment = 20 economic wage(eW) = US$80 (observed given the high unemployment) CF = eWmW = 80100 = 08
BOX 5
Steps in economic analysis
Economic analysis requires assessment of a projectrsquos net impact on economic welfare
by considering
5 Convert all market prices into economicshadow prices (SP) that better reflect the social
opportunity cost of the good
6 Remove transfer payments (taxes and subsidies) and quantify externalities (positive and negative)
7 Aggregate all modelrsquos NIB cash flows respecting incorporation phasing patterns of targeted
beneficiaries into projectrsquos activities
8 Compare aggregated benefits with other project costs to obtain incremental discounted cash
flows Calculate economic performance indicators adopting a social discount rate ENPV ERR
BC ratio
9 Perform sensitivity analysis (SA) in order to deal with the main risks and uncertainties that could
affect the proposed project20
Critical parameters are (i) SP for tradable and non-tradable goods (ii) SP of foreign exchange
(iii) SP for labour costs (shadow wage) and (iv) the social discount rate
16
VOLUME 1 BASIC CONCEPTS AND RATIONALE
Fiscal corrections are also applied and
10 per cent VAT is deducted from all inputs and
outputs with indirect taxes Finally externalities
are accounted for and quantified both negatives
(increases in noise) and positives (decrease
in pollution)
The project under analysis resulted not profitable from a financial point of view but viable
from an economic point of view This means that
the overall impact for society is positive (also
reflected by the positive externalities) but there
are no sufficient incentives for the private
individual agent to undertake these activities
This conclusion suggests that if the development
objectives achieved through this investment are
significant enough for the government then the
project should develop an incentive scheme to
attract the private agent
These results may be used in policy dialogue
suggesting that the government could reduce the
level of targeted import duties and thus make this
investment proposal financially profitable
TA BLE 1
From financial to economic analysis an example
Financial analysis (market prices)Thousands of United States dollars
Years
1 2 3 4 5 6 7 8 9 10
Total operating revenues 0 42 115 119 126 126 126 126 126 126
Total Inflows 0 42 115 119 126 126 126 126 126 126
Total operating costs 0 -56 -75 -98 -101 -101 -101 -101 -117 -117
Total investment costs -165 -4 -4 -25 -3 0 -25 0 0 12
Total outflows -165 -60 -79 -123 -104 -101 -126 -101 -117 -105
Net cash flow -165 -18 36 -4 22 25 0 25 9 21
Financial rate of return -6
Financial NPV10 US$(89)
Economic rate of return 36
Economic NPV10 US$473
Years
Economic analysis CF 1 2 3 4 5 6 7 8 9 10
Output X 12 0 49 134 139 147 147 147 147 147 147
Total operating revenues 0 49 134 139 147 147 147 147 147 147
Labour costs 08 0 -18 -18 -26 -26 -26 -26 -26 -30 -30
Operating costs 11 0 -36 -57 -73 -76 -76 -76 -76 -87 -87
Total investment costs 09 -149 -4 -4 -22 -3 0 -22 0 0 11
Fiscal correction outputsa 09 0 44 121 125 132 132 132 132 132 132
Fiscal correction inputsa 09 -134 -36 -55 -85 -71 -68 -88 -68 -78 -68
Externalities 0 20 20 20 20 20 20 20 20 20
Decreased pollution 0 23 23 23 23 23 23 23 23 23
Increased noise 0 -3 -3 -3 -3 -3 -3 -3 -3 -3
Net cash flow -282 39 161 98 144 149 107 149 124 145
a VTA of 10 has been eliminated
1 Adjust market values to economic values applying CF2 Eliminate transfer payments (taxes and subsidies)
3 Quantify externalities
17
SECTION IV
IFAD rural investment projects include projects
in integrated rural development irrigation rural
finance value chain development natural resource
management (NRM) climate-change adaptation
and mitigation community development and
institutional strengthening
As IFAD follows its main mandate of focusing its
projects on benefiting poor rural people22 projects
are characterized and designed through identification
of a target group composed mostly of rural people
Poor rural people represent different productive
and economic categories the main one being
smallholders Others include the landless population
engaged in rural non-agricultural microenterprises
rural workers fishers and finally special vulnerable
groups such as women indigenous minorities and
youth All IFAD projects must be formulated on
the basis of benefiting one or more of the above-
mentioned poor rural groups
The increased number of value chain projects
in IFADrsquos portfolio23 ndash aiming to integrate IFADrsquos
traditional target groups into these chains to improve
their access to secure markets and sustainably raise
their incomes ndash has expanded the definition of IFADrsquos
target group to all rural people including small- and
medium-scale entrepreneurs in rural areas However
for the purposes of EFA the impact on poor rural
people is the one that matters the most to IFAD24 and
22 See IFAD Lending Policies and Criteria I (5) ldquoIFAD will concentrate its resources upon activities that promise to achieve in a cost-effective way a reduction of poverty in rural areas where most poor people live and work The Fundrsquos major target groups irrespective of the stage of economic development of the country will be the small and landless farmersrdquo
23 From only 3 per cent in 1999 to 46 per cent in 2009 (Raswant and Heinemann 2012)
24 However when possible and relevant distribution of benefits among value chain actors is a complement to CBA
to the poverty-reduction development objectives of
each government
This IFAD specificity has direct consequences for
CBA discussion of the lsquostandingrsquo issue As previously
stated investment projects include a number
of social stakeholders However for IFAD rural
investment projects this is not a major issue as the
formulation of IFAD projects is focused on benefiting
a specific target group poor rural people25
Focusing on lsquotypicalrsquo IFAD rural investment projects and their main benefitsThe typical IFAD project is usually production
oriented26 and its main outcomes (ie financial and
economic benefits) are frequently net production
increases In other words most IFAD projects will
have a direct impact on the production levels
of target groups which in turn will lead to net
income increases
IFAD projects have an impact on the incomes
of poor rural people by increasing their access to
inputs and services that will subsequently increase
their production volumes andor productivity
The most common areas of intervention include
technical assistance (TA) for crops and livestock
through extension services rural finance services
25 There might be exceptional situations in which other social groups could benefit from an IFAD project These cases might require additional analyses (eg distributional effects analysis) when undertaking EFA
26 Of 114 projects reviewed by QE from 2009 to 2011 73 per cent were agriculture- or rural development-related while in 16 per cent the core objective was to strengthen financial services The rest focused on capacity-building or NRM These data show that most IFAD projects can be characterized as production-oriented that is designed to have direct impact on production and productivity increase
EFA of IFAD rural investment projects
18
VOLUME 1 BASIC CONCEPTS AND RATIONALE
to support on-farm investments and increased
access to working capital through creditloan27 or
grant facilities improved water management through
the construction of irrigation structures provision
of storage drying and cooling facilities to enhance
post-harvest preservation and technical advisory
and financial resources to support entrepreneurs
in starting small and microenterprises ndash as well as
combinations of the above
This IFAD specificity leads to some
straightforward requirements when analysing its
financial and economic results First the project
should be assessed in terms of the financial feasibility
and sustainability of targeted beneficiaries second
the project should be assessed in terms of economic
profitability for the whole national economy
Thus in IFAD production-oriented projects the
main household-level goal in financial analysis is to
determine whether the producer28 will have enough
incentives to participate in the project
In simple terms analysis needs to establish
whether the farmer should undertake the proposed
intervention under the criterion that it is financially
viable (ie the benefits over time are higher than the
investment and recurrent costs) and that these net
benefits exceed present returns (ie incremental
benefits are positive)
However even if the new situation (WP) is more
appealing than the present one (WOP) could the
farmer afford to adopt improved practices Although
viable the investment may still not be profitable if it
does not generate enough returns (mostly during the
first years) to cover the farmerrsquos needs Where the
producer is living under the poverty line the project
should at least generate the same net income each
year as in the BAU situation (subsistence system)
to ensure hisher participation Where poverty levels
are lower incomes should be adequate to cover
investment and working capital needs in addition to
27 Comprising inclusive innovativeadapted rural finance products and services including risk management strategies savings financial literacyeducation programmes etc
28 The terms lsquofarmerrsquo lsquoproducerrsquo or lsquoprivate stakeholderrsquo will be used throughout the IGs as synonyms for the term lsquoprivate agentrsquo in financial analysis
the farmerrsquos living expenses The lack of initial capital
to invest is generally a huge barrier to engaging in
a new activity A financial analysis will determine if
farmersrsquo cash flows are adequate to undertake the
activities (ie it will clearly identify a farmerrsquos financial
needs and hisher repayment capacity)
Even when a financing scheme will prove the
feasibility of the investment there are many risks
involved in changing a farmerrsquos practices (business
as usual) above all if it involves taking out a loan
in an uncertain agricultural environment Thus the
last question to be answered is would the farmer
take the risk are there enough incentives Risks
faced by farmers are many and extremely difficult
to manage29 The only measure of their willingness
to change habitstechnologies will be by comparing
their returns to the opportunity costs of remaining
in the actual situation If for example the returns to
labour of the new activity prove to be much higher
than the average rural wage it is probable that a
farmer would be willing to invest his time in his own
farm and take the risk
In other words financial analysis will establish
whether farmers will obtain a net incremental benefit
(financial viability and profitability analysis) if theyrsquoll
have enough working capital to buy the additional
farm inputs or to bear the costs of stocking
processed goods (financial sustainability) and finally
if financial incentives are enough to convince them to
change existing practices
The practical way to undertake this analysis is by
developing different beneficiary productive profiles
ndash considering several types of productive activities
lsquofarm-systemsrsquo and lsquoactivity-modelsrsquo ndash as well as how
many and which types of people generally engage in
these activities in this particular area
On the basis of the individual models of financial
analysis ndash and once the three steps in converting
market prices into their economic value have been
29 For example risks in the areas of production prices casualties technology climate ndash to name just a few
19
VOLUME 1 BASIC CONCEPTS AND RATIONALE
completed ndash economic analysis of the project as a
whole can be undertaken30 This is done by means
of the aggregation that in project analysis is the
process of adding together the costs and benefits
of all the entities participating to reach a summary
account from which a measure of project worth can
be derived The result of the aggregation is the net
incremental benefit or cash flow of the project31
Lastly the goal of economic analysis is to answer
the question of whether it is worthwhile to invest
public resources in the overall project proposal
(should the government invest) It will focus on the
perspective of the entire country and it measures the
effects of the project on the economy as a whole
Unquantified benefits alternative methodologies to CBAThe majority of IFADrsquos projects are production-
oriented interventions in which expected outcomes
are tangible and easily quantifiable however due to
IFADrsquos typical target group many of these projects
are complemented by activities seeking an impact
on less-tangible aspects of rural poverty alleviation
Womenrsquos empowerment increased access to assets
and services enhanced capacities ownership and
land titling are examples of this important part of
IFADrsquos overall project impact However these types
of benefits which are more difficult to measure or not
measurable in monetary terms (intangible benefits)
are often excluded from CBA
In addition environmental and social benefits
resulting from the promotion of resilient agricultural
practices or social infrastructure such as rural roads
irrigation schemes or market infrastructure are also
seldom included in CBA In order to change this
trend these IGs will provide some ideas on how to
allocate value through the use of valid proxies to
measure the impact of these intangible social andor
environmental benefits
30 Some analysts proceed by aggregating the financial analysis and then converting the aggregated results into their economic value It can be argued that this stage of analysis is useless as the financial profitability indicators for the project as a whole have no use in terms of investment decisions
31 See volume 2 and its annex for more details on the lsquoaggregation issuersquo and common mistakes
In the particular case of CDD projects where
communities collectively decide on the allocation
of project resources it is very difficult to foresee
which productive activities will be targeted However
markets and agronomic conditions in the project
area will limit the scope of activities that can be
successfully undertaken In these cases the fact
that communities are making participatory decisions
will grant the additional benefits that ownership
provides ensuring higher adoption rates than
average and increasing the sustainability of the
chosen interventions
In cases where the identification and valuation
of benefits is difficult simple and sensible ways
of estimating tangible benefits should be applied
Table 2 presents an overview of suggested
approaches to transforming such benefits into
tangible values so as to include them in overall
project cash-flow analysis from the most common
complementary activities in IFADrsquos projects
Additionally the IGs will introduce two methods
alternative to CBA for those cases where not even
proxies could be measured cost-effectiveness
and MCA32 The latter has not yet been tested
as a suitable tool in IFAD project designs but is
suggested as an alternative in cases of complex
decision-making
Cost-effectiveness
When tangible benefits from a given investment
are difficult to quantify but the costs are easily
identifiable the most commonly used valuation
method is cost-effectiveness which is used to select
the least-costly alternative among a set of options
that will achieve the same result (a given set of
predetermined objectives) Once the purpose of the
project has been decided for example construction
of a market storage facility cost-effectiveness would
be used to compare scale location technology
etc in order to choose between investment
32 See the technical annex for more details
20
VOLUME 1 BASIC CONCEPTS AND RATIONALE
Project componentsactivity Quantifiable benefits
Productivity enhancement (including irrigation post-harvest and processing) Storage drying cooling facilities irrigation
bull Reduced post-harvest losses
bull Increased value and volumes of production due to investments in storage cooling or small processing facilities (drying or milling)
bull Increased production and productivity due to water provision
Value chain (VC) Collective marketing warehouse receipt systems increased market information
bull Increased value of final product owing to increased quality and access to markets improved handling packaging and commercialization
bull Financial benefits to all actors along the VC
bull Microenterprise and employment creation
bull Creation of internal and external markets that did not exist before investments
Rural roads bull Reduced transport and vehicle maintenance costs (incl vehicle operating costs [VOC] and travel-time costs [TTC])
bull Access to areas not accessible before hence increased total production
bull Increased volume of transported agricultural products for sale (reduced losses)
bull Reduced transport costs due to better access to sales points
Domestic water supply bull Time saved in procuring water
bull Reduced sickness through better water quality
bull Reduced water losses due to leakage
bull Increased productivity through small-plot crop irrigation and through provision of water for livestock
bull Introduction of backyard gardening
Climate adaptation and resilience practices Changes in tillage practices crop rotations landsoil conversion afforestation energy-efficient systems flood prevention
bull Reduced land erosion an estimate of saved nutrient content can be valued at price of fertilizer needed to replace that nutrient content
bull Increased crop timber and livestock yields through soil preservation conservation tillage and agriculture
bull Increased final product value due to labelling as organic agricultural practices
bull Avoided rehabilitation costs for public infrastructure destroyed by natural disasters
bull Energy savings owing to replacement of old practices by eco-friendly artefacts (eco-stoves solar panels etc)
Land registration Land tenure security may translate into increased land value explained by
bull Long-term Investments in land fertility
bull Improved access to credit as land can be used as collateral
bull Greater dynamism of land markets
bull Environmental benefits as a result of better NRM (people improve or maintain forest andor tree cover)
TA BLE 2
Simple sensible ways of valuing different types of benefits
21
VOLUME 1 BASIC CONCEPTS AND RATIONALE
options (eg open storage location of a facility
construction materials) Unfortunately the results of
this method which can justify project investment
decisions cannot be integrated into the streams of
incremental net benefits resulting from classic CBA
thus underestimating the overall benefits of
the investment
Multicriteria analysis
MCA is a decision-making tool for evaluating
complex decision problems where the options
entail many different objectives Unlike CBA MCA
allows consideration of aspects other than economic
and financial ones for example both quantitative
and qualitative data It builds trade-offs between
criteria that in complex decision-making are usually
in conflict (efficiency and equity for example) 33
and is an important instrument in ranking different
options and discriminating between acceptable and
unacceptable possibilities
The main advantages of MCA are its openness
explicitness and power to simplify complex
situations This process eases the discussion and
promotes communication first within the decision-
33 Another example would be when production objectives are in contraposition to environmental ones For example to increase livestock production for food security and at the same time reduce CO2 emissions
Project componentsactivity Quantifiable benefits
Rural finance bull Efficiency gains in financial system can lower operational costs and ensure self-sufficiency and sustainability of financial services supply
bull Shifts in portfolio composition of financial service providers (productive loans versus consumption)
bull Incremental taxation revenues to government
bull Potential productivity increases through financing of working capital (incremental benefits to clientsborrowers)
bull Economic benefits of transfer effects
Community development (CD) bull Improvements in lives of beneficiary households (value these in money equivalents if possible)
bull CD activities result in high empowerment and ownership of project activities which could translate into greater sustainability
Indigenous peoplesrsquo (IPs) knowledge
bull When IPs are supported in applying their knowledge ownership of project activities is ensured as well as sustainability of activities This can translate into low implementation risk and high uptake (adoption rates)
bull Generally IP practice are environmentally friendly thus reducing stress on natural resources
bull Nutritional aspects are also part of the positive impacts
Institutional strengthening bull Improved institutional capacity has generated or will generate benefits for target groups
bull Losses avoided by strengthening the institution looking at the sensitivity analysis assess how delays in implementation (due to institutional weak capacities) affect project outcomes and use that data to calculate losses avoided
Source PTA ndash EFA desk elaboration
22
VOLUME 1 BASIC CONCEPTS AND RATIONALE
making body and later between that body and
stakeholders MCA can be an ex ante (lsquobefore the
factrsquo) and an ex post (lsquoafter the factrsquo) evaluation tool
This type of analysis also presents some difficulties
One concerns definition of the comparative criteria
Use of MCA requires knowledge of mathematical
notions data aggregation methodologies and
computer applications to perform analysis following
a structured process and to avoid weak conclusions
It is often costly and time-consuming
EFA data sources collection and coherenceThe value of EFA as a decision tool hinges on the
quality of the data and assumptions that underpin
it Data availability is a widespread problem for
EFA analysts who should always work in close
collaboration with expert colleagues (agronomy
livestock and rural infrastructure experts) who will
provide or validate the key technical parameters of
the analysis34
Data regarding project costs should be collected
during design missions in consultation with the rest
of the team Once the first results from EFA are
reached they should also be shared with the team
to discuss how they affect expected outcomes and
assumptions For example planned investment costs
may not be sufficient to reach the number of target
beneficiaries outcomes of specific components may
not be appealing from a financial point of view etc
Although it is the responsibility of the EFA analyst
to gather and ensure data consistency among
sources the mission leader should promote and
facilitate dialogue among mission members and
provide sufficient time for the analyst to collect and
process data to ensure EFA quality and coherence35
34 Alternatively FAOSTAT is the most reliable and recommended source of data (httpfaostatfaoorg)
35 It is estimated that at least five weeks are needed for elaboration of a complete EFA one week for data gathering two weeks of mission and two weeks for data processing
For the other parameters of EFA analysis such
as conversion factors and discount rates one
of the most important sources of data is always
the national planning offices If these data are not
available evaluations of completed operations by
the Independent Office of Evaluation of IFAD (IOE)
can be used as a reference36 These can provide
reference values for similar projects or projects
in the same country (and region) for example on
uptake (adoption rates) of a specific technology or
constraints on input availability
Moreover economic and financial analysis in
appraisal reports for the same country (andor region
andor sector) ndash from IFAD and other IFIs such as
the World Bank or regional development banks ndash are
potential sources of information on key parameters
such as discount rates37
However any project analyst should rely on his
her best judgment accumulated through experience
when deciding on the assumptions to be used
36 Evaluations by country and region are available at wwwifadorgevaluationpublic_htmleksystdocprjindexhtm
37 FAOrsquos Monitoring and Analysing Food and Agricultural Policies (MAFAP) programme develops estimates for standard conversion factors the social exchange rate (SER) for different countries and currencies and other important parameters for estimating shadow prices such as the transport costs duties and taxes instrumental in calculating parityborder prices for tradable goods (wwwfaoorgmafaphomeen Country reports can be found at wwwfaoorgmafapproductscountry-reports-technical-notesen)
23
SECTION V
To increase the efficient use of EFA it is important to
view this analysis as an integral part of project design
information and not only as a mandatory study done
for compliance with IFAD quality requirements
To do so there should be continuous review and
refinement of EFA at all stages of the project cycle
It is part of the monitoring and evaluation (MampE) and
knowledge management functions to inform decisions
on adjustments to design and implementation
modalities in pursuit of project objectives
As a first step the data used for EFA in
project design should be periodically updated
by the projectrsquos MampE system and supervision
implementation support missions should verify that
this has taken place If significant changes occur in
the data ndash particularly those for which the sensitivity
analysis showed higher sensitivity ndash the IRR NPV
and cost-benefit ratio should be recalculated
In the light of new data (eg prices for inputs
and outputs demand forecast for project outputs
andor adoption rates) ndash and taking into account
the results of updated EFA including identified
risks and suggested mitigation measures ndash it may
become appropriate during project supervision
andor implementation support missions to decide
to reallocate resources among activities andor
components shifting from those that contribute less
according to the new constellation of data to those
that would contribute more to the projectrsquos objectives
Moreover the EFA spreadsheet prepared during
project appraisal should remain available for review
during project implementation and evaluation This
serves as an indicator of compliance with the EFA
requirement for design documents and the new RMF
indicator as stated in the relevance section It would
also facilitate the updating process indicated in the
preceding paragraph
The purpose of EFA in each phase of the project
cycle including evaluation is indicated in the
following table
TA BLE 3
EFA at different stages of project cycle
Project cycle stage Role of EFA Form of analysis
Concept Definition of investment criteria
bull Purely ex ante ndash all benefits and costs are based on estimates of future values
Project design Resource allocation decisions
bull Purely ex ante ndash all benefits and costs are based on estimates of future values
Supervision ndash early stage
Resource reallocation decisions
Newly Identified risks
bull Mainly ex ante ndash some costs may be ex post but most benefits will still be based on future estimates
Midterm review (MTR) bull Mainly ex ante ndash some costs will be ex post but estimation of future benefits will be based on evidence accrued during first half of project
Supervision ndash later stages
bull About 50 ex post50 ex ante ndash costs will be increasingly based on actual results but benefits are generally lagged by several years at least and will continue to accrue over life of investment
Project completion report (PCR)
Assessment of results bull Mainly ex post ndash all costs and some benefits will be based on actual results but benefit stream for residual life of investment will remain an estimate of future values
EFA role throughout IFADrsquos project cycle
24
VOLUME 1 BASIC CONCEPTS AND RATIONALE
Table 3 also describes the form of analysis
undertaken at each stage of the project cycle which
ranges from purely ex ante during project design to
partly ex post initially with regard to costs and later
to benefits and finally purely ex post for investment
costs but only partly ex post for recurrent costs
and benefits In this example a fully ex post analysis
would only be possible after 20 years which lies
more in the realm of policy analysis than project EFA
Given its purpose EFA is currently used mostly
as an ex ante tool to guide project formulation and
justify investment decisions Nevertheless it could
make a bigger contribution to IFADrsquos mandate for
rural poverty reduction if it were used in some of
the following ways
At concept
bull At COSOP38 andor project conception previous
evaluation ex post reports elements from
previous EFAs or speedy financial assessments
of intended investments could serve as
screening criteria for the validation of proposed
investment ideas For example a previous study
on the investment requirements for a specific
irrigation technology may help establish a
minimum area to be covered by projects in order
to produce sufficient benefits to overcome
project investments
At design
bull For component selection ex ante assessment of
component viability during design
bull For cost validation EFA will confirm whether
estimated project investment costs are sufficient
to cover proposed interventions as well as define
beneficiariesrsquo contributions and their financial needs
bull In the logframe EFA can provide realistic and
consistent outcome indicators
bull For risk management EFA will provide grounded
information for the effective design of mitigation
measures applied to changing circumstances in
order to understand and manage risk
38 Country strategic opportunities programme
At implementation
bull To terminate or modify activities that are not
generating satisfactory financial results for the
intended beneficiaries and economic impact for
the country as a whole
bull For MampE Updating EFA to changing
circumstances will provide up-to-date evidence
of realistic outputs outcomes and impacts As
an MampE and knowledge management tool it can
facilitate learning within and between countries
about what works and what doesnrsquot in terms of
financial and economic impact This knowledge
can also be used to guide the design of country
programmes through the COSOP
bull EFA can also be used as a risk management
tool during implementation Where new risks
are identified or design assumptions are found
to be incorrect remedial action may be needed
including reallocation of resources among
components andor expenditure categories
Early in implementation EFA could contribute
to adaptation to changing circumstances such
as commodity prices production technologies
and institutional and policy changes which
may suggest that different or better approaches
be adopted modifying the design andor
implementation arrangements
At evaluation
bull As an ex post impact assessment tool by
incorporating EFA in IOErsquos PCR and country or
project evaluations in order to compare expected
and actual project results
bull To inform decisions on scaling up or replication
of successful initiatives including the scaling
up of grant-funded activities into full-scale
loan-funded projects
bull Ex post EFA assessment may suggest
discontinuation of approaches that are not
working and scaling up of those that are
25
VOLUME 1 BASIC CONCEPTS AND RATIONALE
Goal bull 20 increased average
income in 29000 HH
C1 bull 29000 farmers linked
with VCbull US$64 m in loans
distributed
C2 bull 29500 HH new crops
amp improved yields 15bull 2000 ha irrigatedbull 83 km rural roads
C3 Overall implementation
EFA in project design Links with the logframe and MampEIn addition to a complete EFA assessment IFADrsquos
mandatory design documents require presentation
of a logframe detailed cost tables disaggregated by
component financier and expenditure categories
and formulation of an MampE system
These three elements should be closely linked
The logframe provides a global picture of project
objectives and describes through components the
activities that will be put in place to achieve them
along with measurable indicators to monitor progress
and achievements The cost tables assign a cost
to each of these activities and MampE measures their
impact EFA is the technical vehicle that attaches an
expected benefit or outcome to the costs of each
envisaged activity It defines the causal chain of
effects between a projectrsquos inputs and outcomes
In other words many of the logframe sections
can and should be completed with information
coming from EFA These indicators should also be
used as part of the MampE system in order to maintain
coherence between planned interventions and
expected outcomes from the very beginning
In order to illustrate this causal chain a clarifying
example is provided in Figure 5 to explain how through
EFA certain inputs will be transformed into outcomes as
a result of the project The example has been extracted
from an ongoing IFAD project with a total project cost
of US$119 million to finance three main components
C1 value-chain market linkages development C2
improved agricultural practices and infrastructure
and C3 the project management unit (PMU)
As shown in Figure 5 uptake indicators
(ie number of expected beneficiaries) and overall
project impact of 20 increased incomes in
29000 HH have been directly estimated through
EFA (shown by the visible arrow) The same has
been done for expected outcomes from productive
interventions ndash such as improved crops and cropping
techniques complemented by irrigation infrastructure
under C2 ndash that will result in an average increase
in yields of 15 per cent However there are some
project activities for which it is more difficult to
F IGUR E 5
Practical example of linking EFA with the logframe costs and MampE With what For what
Objective Increase sustainable HH income
C1 Promote VCbull Capacity-building for
farmersrsquo groupsbull Link with farmers
and investment fund
C2 Support farmersbull Improved crop varieties
and TAbull Irrigation and road
infrastructure
C3 PMU
Total costs bull US$11946 m
Costpers US$740
C1 US$1875 mbull Capacity-building
US$3Mbull Link US$063 mbull Investment fund US$1512 m
C2 US$787 mbull Better crops US$643 mbull TA US$5 mbull Infrastructure
US$94 m
C3 US$105 m
LogframeImpact (MampE)
Projectcosts
Logframe Projectcosts
Impact (MampE)
EFA defines the causal chain
EFA can translate project inputs into results
26
VOLUME 1 BASIC CONCEPTS AND RATIONALE
measure impact (represented by the fading arrow)
In the example the development of stronger links
between farmers and agribusiness and improved
market access through construction of rural roads
will certainly have an impact on beneficiary access
to markets but this is not easily quantified by
measuring the number of meetings held by these
groups It would be better reflected in increases in
volumes sold and the prices received by farmers
Moreover indirect benefits from project activities
should also account for other rural people that will
benefit from the roads and are also not included in
the analysis Finally several project costs will not
produce any direct benefits but the activities they
fund are fundamental in the delivery of the overall
project For example all costs regarding the PMU
as well as awareness-raising campaigns and other
types of lsquosoftrsquo interventions
In summary the logframe provides a structure
that can help organize the data and assumptions
used in EFA elaboration Key data for estimating
costs and benefits and assumptions made
concerning incremental yields adoption rates etc
should be incorporated into the logframe and used
as indicators in the MampE system
While useful EFA cannot provide all relevant
indicators required in the logframe For example
third-level indicators (eg on reduced stunting or
increased HH assets) in IFADrsquos Results and Impact
Management System (RIMS) will still need to be
collected through baseline surveys in the early phase
of implementation
Finally it is important to distinguish output from
outcome indicators in the logframe39 During the
initial years of a project supervision should focus
on the output indicators As project implementation
proceeds the focus should shift to (or at least
include) outcome indicators which provide key data
to compare with the initial EFA assessment
39 A good practice example of a logframe distinguishing between output and outcome indicators is the Project for Agricultural Development and Economic Empowerment in Cambodia (EB 2012105R15Rev1 wwwifadorggbdocseb105eindexhtm) It should be noted that Annual Reports on Quality Assurance in IFADrsquos Projects and Programmes (eg document EB 200998R57) have called attention to imprecise development objectives and lack of quantified final and intermediate outcome indicators to track progress towards achieving objectives This deficiency also affects the quality of EFA and the possibility of using it during project supervision and implementation support Thus improved quality of the logframe can contribute to improving the quality of EFA and to enhancing its use during this phase
EFA in project design Risk analysisEconomic analysis of projects is by definition
built on uncertain future events Estimation of the
basic elements of this analysis (costs and profits)
inevitably involves explicit or implicit probability
judgments In order to contain and measure
the impact of these uncertainties on project
results there are some techniques that help
detect the lsquocritical variablesrsquo or sources of major
risks and set the basis for introducing effective
mitigating measures
The most common tools used in EFA are the
sensitivity analysis (SA) and the switching value (SV)
analysis40 Both enable testing and measurement
of the effect of changes in key project variables on
the final outcomes of our project and hence its
economic indicators (NPV and IRR) Although SA is
frequently used to assess the robustness of projects
and their resilience to shocks its outcomes are
seldom linked to risk analysis
In other words the most relevant question at
this stage is to know how fluctuation in critical
parameters (eg increases in costs delays in
implementation) will affect project performance and
which of the identified risks are the ones that need
close monitoring
Considering the effects of risks and mitigation
measures identified at the project design stage on
EFA results would not only represent a more realistic
approach to assessing the projectrsquos profitability but
would also help identify the nature of those risks
ndash acknowledged but not mitigated by the project ndash
whose existence is regarded as acceptable
In practical terms the SA tests percentage
increases and decreases in estimated benefits and
costs to assess their impact on NPV and IRR while
the SV provides the percentage change in cost
or benefits that will cause project outcomes to fall
below the minimum level of acceptability (NPV lt 0)
40 In volume 2 the IGs also provide information on more sophisticated tools using probabilistic approaches such as Crystal Ball and Risk
27
VOLUME 1 BASIC CONCEPTS AND RATIONALE
Both analyses are extremely useful if linked to
identified project risks For example SV can identify
benchmarks (maximum percentage increases in costs
or decreases in benefits) for lsquotrigger valuesrsquo to activate
specific mitigation measures (eg if the internal price
of a specific input increases to 30 per cent activities
should shift to an alternative crop)
Another way of looking at this analysis is
through the graphic in Figure 6 Here variations
in expected benefits and costs are represented
in the vertical and horizontal axes respectively
Calculation of the switching values of our project
identifies the maximum reduction in benefits (Bmin)
and the maximum increase in costs (Cmax) that
would result in an NPV of zero Thus the switching
value frontier (SVF) represented by the black line
between Bmin and Cmax encloses all possible
combinations of reduction in benefits and increase
in costs that would bring the NPV to zero Implicitly
the area (O Bmin Cmax) represents the set of all the
different combinations of decrease in benefits and
simultaneously increase in costs that would not
endanger project viability
Once the SVF has been identified and after a
proper evaluation of the country context and project
risks and mitigation measures we could eventually
assume that benefits and costs are very unlikely to
attain the levels represented by the two dotted lines
(B0 C0) As a result we narrow down our uncertainty
area defining a lsquosafe zonersquo identified by the blue area
(A) and a lsquorisky zonersquo identified by the orange area
(R) Area A represents the set of combinations that
falls into the viable cases where increases in costs
or decreases in benefits are not jeopardizing the
overall outcome of the project Area R represents all
the diverse combinations of costs and benefits that
will render the project unprofitable (NPV lt 0)
An analysis including probabilistic approaches
could provide a better understanding of the likelihood
that the project would fall into one of the two areas
and thus assess how much at risk it would be if
certain events occurred Details of these types of
analysis can be found in volume 2
Use of SA to assess project risks an example
SA provides grounded information to the design
team to develop effective mitigation measures for
each identified potential risk The first step then
is to add a proxy to the classic table or section on
project risk of the project design report (PDR) ndash a
proxy that responds to the question How will this
risk affect project performance For example if
F IGUR E 6
Identification of the risk zone
0
A
R
Switching value frontier(NPV=0)
Cmax + Costs
- Benefits
B0
Bmin
Cmax
28
VOLUME 1 BASIC CONCEPTS AND RATIONALE
local implementation capacities are low SA can
test how a delay in implementation of one or more
years (a realistic possibility of this risk occurring) will
affect project outcomes Similarly if there is a high
probability of the introduction of import taxes this
can be tested by increasing input costs
The next step is to closely observe the SA results
in order to assess to what extent these events
will change the profitability indicators (ie project
performance) By answering the question Which
variables need to be closely monitored the project
team can easily identify the lsquocritical risksrsquo and better
allocate resources for their mitigation
In the example below (Table 4 and Table 5)
SA shows that this project is more sensitive to
decreases and delays in benefits than to cost
increases Thus although there is a high risk of the
introduction of import taxes on fertilizer this will not
drastically affect project performance On the other
side delays in implementation are a high risk that
could compromise overall project outcomes Project
teams should allocate more efforts and resources to
mitigate this risk rather than others
To summarize EFA analytical tools can contribute
to risk assessment and informed decision-making
for the efficient allocation of project resources when
designing mitigation measures
TA BLE 4
Risk analysis and mitigation measures (classic table prepared for the PDR)
Risk description Probability of occurrence
Mitigation measure Proxy to compare with SA results
Institutional risksLow local implementation capacity
High Capacity-building Delays in benefits
Market risks Import duties on fertilizer High Local production Increased costs
Climate risks Floods Low Infrastructure Reduced benefits
TA BLE 5
Sensitivity analysis for informed decision-making
SA Base case
( 12)
Costs increased Decrease in benefits Delay of benefits
+10 +20 +50 -10 -20 -50 1 year 2 years
IRR 28 27 25 21 22 20 18 23 19
NPV (lsquo000 US$)
37 160 8 068 6 895 3 376 4 047 2 949 1 564 5 173 1 984
29
VOLUME 1 BASIC CONCEPTS AND RATIONALE
EFA in project supervision implementation and ex post evaluationThe underlying principles for the use of EFA in project
implementation are no different from those for project
design and are detailed in a number of old and
well-known sources Squire and van der Tak (1975)
Gittinger (1985) Belli et al (1998) and IFADrsquos draft EFA
guidelines of September 2012 However although the
principles are the same the methods of application
differ to some extent as shown in Table 6
The approach to EFA both before and during
project implementation should be tailored to
the nature of the project What to look for in the
field and the type of analysis undertaken vary
considerably among different project categories
More detailed information is provided in Table 7 in
the technical annex
Ex ante and ex post EFA
It is important to distinguish between ex ante and ex
post EFA and to appreciate their roles in the various
stages of the project cycle Ex ante is the more
familiar form of EFA Undertaken as a key part of the
project design process it is used to inform decision-
making on the nature of the project and its expected
financial and economic impacts Ex post EFA is
undertaken after an investment project has been
completed There are also intermediate forms of
analysis undertaken during project implementation
which are partly ex post and partly ex ante
It is important to distinguish between the
implementation period and the life of the investment
The implementation period typically five to seven
years is the period in which project activities are
undertaken and IFAD funds disbursed The life of
the investment is much longer typically 20 years
or more during which economic and financial
benefits are expected to accrue Figure 7 shows
a typical IFAD project profile with the investment
costs incurred during years 1-5 recurrent costs
over the 20-year project life and benefits beginning
to flow in year 3 and reaching a plateau from
year 10 onwards
TA BLE 6
Application of general principles of EFA
Key principle Methods of application
Ex ante EFA Implementation
With and without project comparison
Prepare lsquobusiness as usualrsquo scenario on the basis of lsquodo nothingrsquo option
bull Conduct baseline survey to define pre-project status
bull Estimate what would have happened without the project
bull Paired comparisons can help (eg inoutside project area)
Financial analysis Construct farm models showing expected revenue and expenditure for beneficiaries
bull Survey beneficiaries to estimate actual revenue and expenditure
bull Validate andor adjust farm models accordingly
Discounting future benefits and costs
Discount future costs and benefits back to year zero
bull Discount future and previous benefits and costs back to year zero
Accounting for externalities
Identify and quantify all externalities where possible
bull Check for signs of positive and negative externalities emerging during implementation
Adjusting for distortions Deduct taxes add subsidies use shadow prices estimate conversion factors
bull Check for changes in tax and subsidy rates and adjust prices accordingly
bull Update conversion factors on the basis of trade andor tariff data
30
VOLUME 1 BASIC CONCEPTS AND RATIONALE
Methodological issues of ex post and
ex ante analysis
The key aspect to understand when performing
this analysis is that as shown in Figure 7 project
costs and benefits will occur in different moments of
project life
Methodologically speaking if this analysis will
be used for comparison of appraised (ex ante) and
real impacts (ex post) (as is generally the goal) we
need to lsquoplacersquo the comparison in the same point in
time The point in time could be at the beginning or
completion of the project or any other point What
is important is to bring all cash flows to that point in
time using discount techniques Then calculate the
NPVs and compare You will be able to use IRRs only
if the cash flow allows it mathematically (ie if there is
a negative Figure in the first year)
But this is not the only consideration to bear in
mind Other issues arise such as
bull Attribution effects of achieved results given
IFADrsquos scale of intervention it could claim
contribution but not full attribution of increased
beneficiary incomes or decline in food insecurity
bull At completion could be too early to capture all
expected benefits (see Figure 7)
bull A mixed approach in order to compensate for
this second issue is to try to estimate benefits
yet to be produced include them in cash flows
and then perform the discounting (however the
results could be questioned)
bull In order to make a realistic comparison CBA
should be done 10 years after implementation
and this has rarely been done
On a more positive note the alternative would be
to choose some activityfarm models effectively
put in place by the project Perform a financial
analysis at completion and compare it with appraisal
estimations (models developed at design for the
WOP situation) in order to estimate how things
have changed This analysis will not be based on
cash flows but on annual bases thus comparing
F IGUR E 7
Profile of costs and benefits over the project cycle
0
20
40
60
80
100
120
Investment costs
Recurrent costs
Benefits
MTR
Supervision EvaluationDesign
PCR
1Years
2 3 4 5 6 7 8 9 10 11 12 13 14 15 16 17 18 19 20
Implementation period years 1-5
Life of the investment years 1-20
31
VOLUME 1 BASIC CONCEPTS AND RATIONALE
annual financial indicators such as total sales total
production costs employment created Hopefully
full development of the model would have been
achieved by completion so as to provide information
on how adequate project interventions had been
This could also potentially provide information on the
reasons underpinning adoption rates
Ex post EFA and scaling upConfronted with the large-scale problem of reducing
rural poverty which it is mandated to address
and the limited resources available from official
development assistance (ODA) IFAD is compelled
to increase the impact of every dollar it invests in
agriculture and rural development For this reason
scaling up the results of successful development
initiatives is an overarching priority that directly
supports the achievement of IFADrsquos mandate To
deliver on this priority IFADrsquos operational practices
must be geared towards supporting all concerned
actors and institutions ndash including poor rural women
and men and their organizations ndash in achieving
impact at scale
The formal IFAD definition of lsquoscaling uprsquo is
expanding adapting and supporting successful
policies programmes and knowledge in order to
leverage resources and partners to deliver larger
more sustainable results for a greater number of
poor rural people Scaling up results means that
IFAD interventions will not be viewed as a way of
expanding small projects into larger ones Instead
they will focus on how successful local initiatives
will sustainably leverage policy changes additional
resources and learning to bring the results to scale
EFA has an important role to play in informing
scaling-up decisions since evidence of favourable
financial and economic impacts should be a key
criterion for deciding whether or not to scale up
Thus the framing questions must incorporate an
economic and financial dimension as follows
bull Idea If a project is referred to as one that is
being scaled up or otherwise further developed
from previous interventions in the host country
or region what were the economic and financial
outcomes of the activity to be scaled up Have
economic and financial impacts been estimated
or measured
bull Vision How many poor rural men and women
will benefit financially and to what extent What
will be the overall economic impact
bull Drivers Are the economic and financial benefits
sufficiently attractive to drive the expansion and
sustain the initiative over the long term
bull Spaces Is there sufficient capacity to finance
the proposed expansion Is the local regional or
national economy large enough to accommodate
it Can markets absorb the level of production
envisaged
bull Pathways What are the financial and economic
implications of alternative scaling-up pathways Is
a gradual or a fast-track approach preferred
bull IFADrsquos role How will IFAD ensure that economic
and financial impacts of the expansion are
properly monitored and evaluated
Scaling-up issues often need to be addressed during
COSOP formulation or country portfolio reviews
especially where grant-funded pilot programmes
have been implemented and are being considered
for scaling up into full-scale investment projects In
these cases EFA of pilot programmes during and
after implementation becomes an important part of
the strategic process
32
Formulas for profitability indicatorsThe net present value (NPV) indicator defined as
the sum that results when the expected costs of the
investment are deducted from the discounted value
of the expected benefits (revenues) is calculated
through the following formula
Where
Bt = benefits at time t Ct = costs at time tIt = investment costs n = project economic life
r = interest rate used as indicator of opportunity
cost discount rate
The internal rate of return (IRR) indicator is defined
as the discount rate (r) that produces a zero NPV
This represents the maximum interest rate that a
project could face and still not waste resources
This is called the internal rate of return (IRR) It is
calculated through
IRR = (r NPV = 0)
For the project to be profitable the IRR has to be
greater than the interest rate that could be earned in
alternative investments thus whenever IRR gt r the
project is considered viable If the (alternative) interest
rate (imkt) is lower than the IRR the NPV is positive
and vice versa
The benefitcost ratio (BC) indicator is the ratio of
the present value of benefits to the present value of
costs over the time horizon The BC ratio provides
some advantages when it is necessary to formulate
a lsquorankingrsquo of alternative investment projects under
budget constraints
If BC ge1 the project is accepted
If BC lt1 the project is rejected
Cost-effectivenessWhen tangible benefits from a given investment
are difficult to quantify but the costs are easily
identifiable the most common valuation method
is cost-effectiveness It is used to select the least
costly alternative among a set of options that will
achieve the same result (a given set of predetermined
objectives) Once the purpose of the project has
been decided for example construction of a market
storage facility cost-effectiveness would be used to
compare scale location technology etc to choose
among investment options (eg open storage
location of the facility construction materials)
The methodology consists in first listing and
measuring in monetary terms the costs of the
options available and then comparing them with
the costs occurring in the base scenario (without
the project) Total costs are then discounted at
year 1 and the results compared to identify the
cheapest intervention In other words valuation by
cost-effectiveness consists in comparing on a
present-worth basis all alternatives that can achieve
the same benefit (Gittinger 1985) and selecting the
least costly
IRR NPV 0gt gti mkt
IRR NPV 0lt lti mkt
IRR NPV 0gt gti mkt
IRR NPV 0lt lti mkt
IRR NPV 0gt gti mkt
IRR NPV 0lt lti mkt
IRR NPV 0gt gti mkt
IRR NPV 0lt lti mkt
Technical annex
33
VOLUME 1 BASIC CONCEPTS AND RATIONALE
Unfortunately the results of this method which
can justify project investment decisions cannot be
integrated into the streams of incremental net benefits
resulting from classic CBA ndash thus underestimating
the overall benefits of the investment
Multicriteria analysis41
MCA is a decision-making tool used to evaluate
complex decision problems With this tool it is
possible to identify overall preferences among
alternative options where the options entail many
diverse objectives Unlike CBA MCA allows
consideration of aspects other than economic and
financial ones for example social technological and
environmental issues Its use is particularly relevant
when other single-criterion approaches cannot
provide monetary valuations42
In the same model thanks to these techniques
it is possible to consider quantitative and qualitative
data It builds on trade-offs between criteria that
in complex decision-making are usually in conflict
(efficiency and equity for example) Choices are
classified aggregating various items of information
in a common index of utility value Since policy
decisions may be influenced by both monetary
and non-monetary objectives it offers a technique
capable of ranking diverse outcomes
MCA establishes preferences among options
referring to a set of objectives identified by decision
makers It is an important instrument for ranking
options and discriminating between acceptable and
unacceptable possibilities Decision makers must
define quantifiable criteria to judge how an objective
has been achieved and MCA allows them to
41 MCA has not yet been tested as a suitable tool for IFAD project design but is suggested as an alternative in the extreme cases mentioned above of complex decision-making
42 One example would be when production objectives are in contraposition to environmental ones For example to increase livestock production for food security and at the same time reduce CO2 emissions
aggregate the data on individual criteria in order to
provide indicators of the overall performance of the
options It brings out the points of view of the actors
involved in the judgment and is characterized by the
subjectivity related to the opinions of the decision-
making group43
The main advantages of MCA are its openness
explicitness and its power to simplify complex
situations In fact it splits the components of
intricate situations and organizes them so as to find
a solution step by step and clearly Objectives and
criteria chosen by the decision group can in fact be
analysed and changed if they are not considered
suitable This process eases the discussion and
promotes communication within the decision-making
body first and later between that body and the
stakeholders MCA can be both an ex ante and an ex
post evaluation tool
This type of analysis also presents some
difficulties One concerns the choice of the activities
or variables to be studied and definition of the
comparative criteria These operations are often
very complicated and require much time spent
in discussions and negotiations Use of MCA
requires knowledge of mathematical notions
data aggregation methodologies and computer
applications in order to perform analysis following a
structured process and to avoid weak conclusions
It is often costly and time-consuming
43 Indeed the opinion team establishes objectives and criteria assesses relative importance weights and judges the contribution of every option to each performance criterion MCA can be preceded by strengths weaknesses opportunities and threats (SWOT) analysis for the choice of criteria it can be supported by an expert panel to help the negotiating group develop an assessment of a specific topic or it can be assisted by focus groups questionnaires and case studies to choose criteria and rate them In addition criteria can be evaluated using cost-effectiveness analysis
34
VOLUME 1 BASIC CONCEPTS AND RATIONALE
Types of projects and EFA activitiesAspects to look for in the field and the type of
analysis undertaken vary considerably among project
categories as shown in Table 7
TA BLE 7
Main EFA tasks by type of project
Project category Main EFA tasks during implementation
Productivity enhancement (including irrigation)
bull Estimate number of beneficiaries and technology adoption rates by target group households
bull Monitor productivity changes product quality and prices
bull Estimate gross margins (per unit of land and labour) for project and non-project households
bull Update farm models based on observedactual results revise economic analysis as necessary and consider adjustments to project design to improve results
Rural infrastructure bull Review construction schedule and costs relative to design estimates
bull Estimate utilization rates for new or upgraded infrastructure
bull Assess arrangements for operation and maintenance
bull Estimate benefits derived by target group households (eg reduced costs increased prices improved market access)
bull Update farm models based on observedactual results revise economic analysis as necessary and consider adjustments to project design to improve results
Natural resource management
bull Undertake a comparison of NRM activities with and without project
bull Review with and without project scenarios of agricultural productivity
bull Seek evidence of more sustainable and responsible NRM practices
bull Identify and if possible quantify value of environmental benefits
bull Update farm models based on observedactual results revise economic analysis as necessary and consider adjustments to project design to improve results
Community development bull Determine number of target group beneficiaries participating in community development activities
bull Identify what has changed in the community and individual households as a result of these activities
bull Describe improvements in the lives of beneficiary households and value these in monetary equivalents if possible
bull Revise economic analysis as necessary and consider adjustments to project design to improve results
35
VOLUME 1 BASIC CONCEPTS AND RATIONALE
Project category Main EFA tasks during implementation
Institutional strengthening bull Prepare inventory of actual institutional-strengthening activities undertaken
bull Complete assessment of institutional capacity and projectrsquos impact on it
bull Identify how improved institutional capacity has or will generate benefits for target groups
bull Revise economic analysis as necessary and consider adjustments to project design to improve results
Marketing and value chain development
bull Review value chain analysis undertaken during project preparation to update data on volumes costs prices and value addition
bull Identify ways in which improvements in value chain efficiency have improved or are likely to improve market access and farmgate prices for beneficiaries
bull Estimate financial benefits accruing to target group farmers and other value chain actors
bull Update farm models based on observedactual results revise economic analysis as necessary and consider adjustments to project design to improve results
Rural financial services bull Estimate number of beneficiaries with improved access to financial services types of services offered and acceptance rates
bull Monitor cost of financial services at different levels (cost of loanable funds retail service costs at client level) and compare with project design estimates
bull Assess actual or likely changes in farm and non-farm economic activities arising from improved access to rural financial services
bull Estimate the net financial benefits accruing to target group beneficiaries from these changes
bull Update farm models based on observedactual results revise economic analysis as necessary and consider adjustments to project design to improve results
36
Anandajayasekeram P CJ Van Rooyen F Liebenberg 2004 Agricultural project planning and analysis A sourcebook Second Edition Network Activity Program ndash Institutional University Cooperation (IUC) between the Flemish Universities of Belgium and University of Pretoria
Asian Development Bank 2013 Cost-benefit analysis for development A practical guide Manila httpwwwadborgdocumentscost-benefit-analysis-development-practical-guide
Australian Department of Infrastructure and Planning Queensland Government 2012 Project assurance framework ndash Cost benefit analysis guidelines Brisbane Queensland Australia
Belli P J Anderson H Barnum J Dixon and J-P Tan 1998 Handbook on economic analysis of investment operations Washington DC Operational Core Services Network Learning and Leadership Center World Bank httpsiteresourcesworldbankorgINTCDDResourcesHandbookEApdf
Belli P 2001 Economic analysis of investment operations Analytical tools and practical operations Washington DC World Bank
Campell H R Brown 2003 Benefit cost analysis financial and economic appraisal using spreadsheet Cambridge University Press
CIFOR 1999 Guidelines for applying multi-criteria analysis to the assessment of criteria and indicators Bogor Indonesia Center for International Forestry Research wwwcifororgacmmethodstoolbox9html
Department for Communities and Local Government 2009 Multi-criteria analysis A manual London httpeprintslseacuk127611Multi-criteria_Analysispdf
DFID 2011 Guidance for country offices on measuring and maximising value for money in cash transfer programmes London Department for International Development (UK)
European Commission 2008 Guide to cost-benefit analysis of investment projects Brussels httpeceuropaeuregional_policysourcesdocgenerguidescostguide2008_enpdf
FAO 1979 Economic analysis of forestry projects Case studies FAO Forestry Paper No 17 Supp 1 Rome Food and Agriculture Organization of the United Nations
FAO 1995 Guidelines for the design of agricultural investment projects Investment Centre Technical Paper No 7 Rome Food and Agriculture Organization of the United Nations
FAO 2010 Estimating mitigation potential of agricultural projects An application of the EX-ante carbon balance tool (EX-ACT) in Brazil Rome Food and Agriculture Organization of the United Nations
Gittinger J Price 1985 Economic analysis of agricultural projects Washington DC Economic Development Institute World Bank httpdocumentsworldbankorgcurateden198501437966economic-analysis-agricultural-projects
Government of South Africa 2004 Cost-benefit analysis Pretoria Department of Environmental Affairs and Tourism
IFAD 2012 Review of post-harvest systems in IFAD programmes Rome
Jenkins G C Kuo A Harberger 2011 Cost-benefit analysis for investment decisions httpwwwqueensjdiexecorgpublicationsqed_dp_206pdf
Lewis DL 1999 Road user and mitigation costs in highway pavement projects Washington DC Transportation Research Board National Research Council
Mishan EJ 1971 Cost-benefit analysis London George Allen and Unwin
Potts D 2002 Project planning and analysis for development httpswwwriennercomtitleProject_Planning_and_Analysis_for_Development
Raswant V and E Heinemann 2012 Access to markets Making value chains work for poor rural people Rome IFAD
Squire L and HG van der Tak 1975 Economic analysis of projects Baltimore MD USA Johns Hopkins University Press
References
37
VOLUME 1 BASIC CONCEPTS AND RATIONALE
Treasury Board of Canada 2007 Canadian cost-benefit analysis guide Ottawa Secretariat Treasury Board of Canada analys-engpdf
UNIDO 1972 reprinted 1993 Guidelines for project evaluation Order No IDSERH2 Vienna United Nations Industrial Development Organization
UNIDO 1986 Manual for evaluation of industrial projects Vienna United Nations Industrial Development Organization wwwunidoorgfileadminuser_mediaPublicationsdownloadManual_for_Evaluation_of_Industrial_Projectspdf
USAIDINDIA 2000 REFORM Project compendium with practitionersrsquo guide State fiscal management reform Vol V Project appraisal practitionersrsquo guide New Delhi US Agency for International DevelopmentIndia httppdfusaidgovpdf_docsPNADM777pdf
World Bank 2013 Investment Project Financing Economic Analysis Guidance Note httpsiteresourcesworldbankorgPROJECTSResources40940-1365611011935Guidance_Note_Economic_Analysispdf
World Bank 2012 A guide to assessing needs Essential tools for collecting information making decisions and achieving development results by Watkins R Meiers M amp Visser Y httpsopenknowledgeworldbankorgbitstreamhandle109862231663920PUB0EPI00essing09780821388686pdfsequence=1
38
Glossary
Aggregation 15 16 20 in project analysis the process of adding together the costs and benefits of all the entities participating in a project to reach a summary account from which a measure of project worth can be derived Often the result of the aggregation is the Incremental Net Benefit or Cash Flow of a project
Appraisal 7 24 31 A before the fact (ex- ante) evaluation of a proposed investment project to determine its merit and acceptability in accordance with established decision-making criteria
Benefitcost ratio (BC ratio) 13 33 a discounted measure of project worth The ratio of benefits to costs It should be calculated using the present values of each discounted at an appropriate discount rate Most often the opportunity cost of capital The ratio should be at least 1 for the project to be acceptable It may give incorrect ranking among independent projects and cannot be used for choosing among mutually exclusive alternatives
Border price 23 The border price is the unit price of a traded good at the countryrsquos border For exports it is the FOB (free on board) price and for imports it is the CIF (cost insurance and freight) price
Business as Usual (BAU) 8 9 11 14 19 a reference scenario which assumes that future evolution is an extension of the current trends See also lsquodo nothing scenariorsquo
Cash flow 11 12 16 19 20 31 The funds generated or used by the project Reflects the costs and benefits over time from a stated point of view Incomebenefit is a positive cash flow and expensescosts are negative flows
Constant price A price that has been deflated to real terms by an appropriate price index They should be distinguished from current or nominal prices Often used as synonym of real prices
Contingent valuation A method of inferring the value of benefits and costs in the absence of a market What people would be willing to pay to gain a benefit (or willing to accept in recompense for a loss) if a market existed for the good
Conversion factor 5 16 23 30 the factor that converts the domestic market price to an economic price Conversion factors are the ratios of economic to financial prices Thus a conversion factor is a number that is used to convert the domestic market price of an item into its economic opportunity cost to the
economy by multiplying the market price of the item by the conversion factor
Cost An expense related to purchase of inputs including capital equipment buildings materials labour and public utilities Costs such as environmental damage or injuries to health are sometimes referred to as negative externalities
Cost Benefit Analysis (CBA) 7 8 18 31 conceptual framework applied to any systematic quantitative appraisal of a public or private project to determine whether or to what extent that project is worthwhile from a social perspective Cost-benefit analysis differs from a straightforward financial appraisal in that it considers all gains (benefits) and losses (costs) to social agents CBA usually implies the use of economicsocial prices
Cost effectiveness analysis (CEA) 20 33 an appraisal technique used in projects and programs in which benefits cannot be reasonably measured in money terms Cost-effectiveness analysis is used in one of two forms to select least-cost alternatives either holding constant the level of benefits and varying the level of costs or holding constant the level of cost and varying the level of benefits In either form the ratio of cost to benefits is known as the cost-effectiveness ratio
Current prices (Nominal prices) prices as actually observed at a given time They refer to prices that include the effects of general inflation and should be contrasted with constant prices
Cut-off rate the rate below which a project is considered unacceptable It is often taken to be the opportunity cost of capital The cut-off rate would be the minimum acceptable internal rate of return for a project or the discount rate used to calculate the net present value the net-benefit investment ratio or the benefit-cost ratio
Depreciation 14 Not a term used in cost-benefit analysis In other financial frameworks depreciation is the allocation of the cost of an asset over time Depreciation is a method of allocating the cost of a tangible asset over its useful life For accounting purposes depreciation indicates how much of an assetrsquos value has been used up For intangible assets amortization is the correct term However these are accounting concepts that makes no sense in financial analysis Here the full investment costs will be computed every time the asset needs replacement
39
VOLUME 1 BASIC CONCEPTS AND RATIONALE
Direct transfer payment 15-17 Transfer payments are transfers of money among residents of a country without a corresponding exchange of goods and services Taxes are transfer payments from individuals to the government Subsidies are transfer payments from the government to individuals Gifts are transfers ldquoin kindrdquo from one individual to another Because transfer payments are not made in return for goods and services they do not add to total output When transfer payments occur in the context of projects they redistribute project costs or benefits from the project entity to some other group or individual in the country
Discount rate 12 14 16 23 the interest rate at which future values are discounted to the present It usually represents the cost of capital for the person or entity calculating the net present value of the stream The financial discount rate and economic or social discount rate may differ in the same way that market prices may differ from economic prices The selection of the discount rate in financial analysis is a relative straightforward process and that is calculated as the potential gains of alternative safe investments on the market In economic analysis where project viewpoint is overturned toward the socio-economic context this parameter needs to be estimated properly so as to i) reflect the public nature of the investment ii) account for scarcity of resources and iii) ensure good use of public funds (See also social discount rate)
Discounted cash flow 14 The costs and benefits (cash flows) discounted to present values to give a common basis for comparison
Discounting 12 31 The process of adjusting future values to an equivalent present value at a stated point in time by a discount rate
Distortion 16 30 A difference between market prices and true values (economic prices) A distortion is any interference with market forces that renders the resulting quantity produced and price different from the price and quantity that would result under conditions of perfect competition
Distributional effect A change in the income or wealth of the people from whose point of view the benefit-cost analysis is done
Do nothing scenario the baseline scenario lsquobusiness as usualrsquo against which the additional benefits and costs of the lsquowith project scenariorsquo can be measured (often a synonym for the lsquowithout projectrsquo scenario)
Economic analysis 7 14-17 20 30 analysis that is undertaken using economic values reflecting the values that society would be willing to pay for a good or service In general economic analysis values all items at their value in use or their opportunity cost to
society (often a border price for tradable items) It has the same meaning as social cost-benefit analysis
Economic cost The economic cost of an activity or resource is the cost to society of that activity or resource Economic costs include the private costs borne directly by economic agents undertaking the activity and all other costs borne by other economic agents For example the economic costs of driving automobiles include the private costs of petrol plus the additional costs of congestion borne by other users of the roads plus the costs of pollution borne by society in general
Economic impact analysis the analysis of the total effects on the level of economic activity (output income employment) associated with the intervention This kind of analysis focuses on macroeconomic indicators and forecasts the influence of the project on these indicators It goes beyond CBA when very large projects are considered in relatively small economies
Economic net present value (ENPV) 16 The net present value of a project calculated using true or economic values Synonymous with social net present value
Economic price 16 Price that reflects the relative value that should be assigned to inputs and outputs if the economy is to produce the maximum value of physical output efficiently There is no consideration of income distribution or other non-efficiency goals in such a price Synonymous with efficiency price and true price
Economic rate of return (ERR) 16 An internal rate of return based on economic prices and social opportunity costs of capital expressing the socio-economic profitability of a project (See internal rate of return)
Environmental impact analysis the statement of the environmental impact of a project that identifies its physical or biological effects on the environment in a broad sense This would include the forecasting of potential pollution emissions loss of visual amenity and so on
Export parity price 23 footnote The export parity price is the FOB price of a good or service valued at point of export net of taxes and subsidies and suitably adjusted for internal transport costs to a location in a country The export parity price is the net-of-taxes-and-subsidies price that exporters would need to receive for a good or service sold in the domestic market in order to make them indifferent between selling in the domestic market or exporting
Externalities 5 15-17 30 A benefit or cost falling on third parties who normally cannot pay or be compensated for it through a market mechanism An external benefit is a positive externality an external
40
VOLUME 1 BASIC CONCEPTS AND RATIONALE
cost is a negative externality A positive externality may reduce the costs of a production process of an unrelated economic agent as when the bees of a bee grower pollinate a neighbourrsquos apple orchard They may also increase the enjoyment of another economic agent as when musicians playing for their own pleasure delight those around them A negative externality increases the production costs or reduces enjoyment for another economic agent Traffic congestion and the numerous forms of environmental pollution such as the pollution created by a manufacturing plant are examples of negative externalities Externalities are not reflected in the financial analysis For economic analysis however it is necessary to take such externalities into account and place a value on them
Ex-ante evaluation 24-25 30 the evaluation carried out in order to take the investment decision It serves to select the best option from the socio economic and financial point of view It provides the necessary base for the monitoring and subsequent evaluations ensuring that wherever possible the objectives are quantified
Ex-post evaluation 24-25 30-32 an evaluation carried out a certain length of time after the conclusion of the initiative It consists of describing the impact achieved by the initiative compared to the overall objectives and project purpose (ex-ante)
Farm gate price The price received by farmers for their products net of transport costs to the market where the products are sold
Feasibility study 9 19 a study of a proposed project to indicate whether the proposal is attractive enough to justify more detailed preparation It contains the detailed technical information necessary for the financial and economic evaluation
Financial analysis 7 14-17 19 30 31 the analysis carried out using market prices and taking a commercial point of view It allows one to 1) verify and guarantee cash balance (verify the financial sustainability) 2) calculate the indices of financial return on the investment project based on the net discounted cash flows
Financial sustainability analysis 14 19 20 analysis carried out in order to verify that financial resources are sufficient to cover all financial outflows year after year for the whole time horizon of the project Financial sustainability is verified if the cumulated net cash flow is never negative during all the years considered
Financial rate of return An internal rate of return based on market prices and opportunity costs of capital(See internal rate of return)
Human capital Human capital is the stock of skills and productive knowledge embodied in people The
purpose of investing in human capital is to improve the productivity of human beings
Impact 25-27 a generic term for describing the changes or the long term effects on society that can be attributed to the project Impacts should be expressed in the units of measurement adopted to deal with the objectives to be addressed by the project
Import parity price 23 footnote The import parity price is the CIF price of a good or service valued in a specific geographical location It includes the CIF price of the good suitably adjusted for transport costs net of taxes and subsidies The import parity price aims to measure the price that producers in the country would receive for a good or service produced in the country for sale in the domestic market under conditions of free trade
Incremental 11-14 19-20 Additional or marginal
Inflation A general increase in market price levels (a fall in the general purchasing power of the currency unit)
Input 26 28 That which is consumed by the project (as opposed to the projectrsquos output) Usually refers to the physical inputs used by the project including materials capital labour and public utilities Inputs like environmental quality foreign exchange and workersrsquo health are usually termed externalities
Internal rate of return (IRR) 12 33 The yield or profitability of a project based on discounted cash-flow analysis The IRR is the discount rate at which a stream of costs and benefits has a net present value of zero It is equivalent to the discount rate r that satisfies the following relationship
IRR NPV 0gt gti mkt
IRR NPV 0lt lti mkt
where Bt is the benefit stream and Ct is the cost stream The internal rate of return is compared with a benchmark in order to evaluate the performance of the proposed project The internal rate of return is then compared with the market rate of interest to determine whether or not a proposed project should be undertaken (See cut-off rate)
Financial Rate of Return is the internal rate of return calculated when all the inputs and outputs are calculated using financial values Economic rate of Return is based on economic opportunity costs
Logframe 10 25-27 is a management tool mainly used for designingand MampE of development projects It consists of four steps (1) establishing objectives (2) establishing cause-and-effect relationships (causal linkages) among activities inputs outputs and objectives (3) identifying assumptions underlying the causal linkages and (4) identifying objectively-verifiable measures for evaluating progress and success
41
VOLUME 1 BASIC CONCEPTS AND RATIONALE
Market price 14-17 (a) The price of a good in the domestic market (see financial prices) as opposed to the economic price shadow price or social price (b) the cost of a good including indirect taxes and subsidies It is the price relevant for financial analysis
Model A representation or simulation of a system or process showing how parameters benefits and costs interact to produce a bottom-line result by which the project can be judged
Monitoring 25-27 the systematic examination of the state of advancement of an activity according to a pre-determined calendar and on the basis of significant and representative indicators
Multi-criteria analysis 22 34 MCA is an evaluation methodology that considers many objectives by the attribution of a weight to each measurable objective In contrast to CBA that focuses on a unique criterion (the maximisation of social welfare) Multi Criteria Analysis is a tool for dealing with a set of different objectives that cannot be aggregated through shadow prices and welfare weights as in standard CBA
Mutually exclusive 8 12 13 Alternatives that cannot be undertaken simultaneously if one alternative is carried out the other cannot be The alternatives may be mutually exclusive because they represent alternative times of beginning the same project because funds are limited or because if one is carried out the other will not be required (for example a choice between a thermal and a hydro power station)
Net present value (NPV) 12 13 27-29 33 The net value of an investment when all costs and benefits expressed in standard units of value (numeraires) are summed up The sum that results when the discounted value of the expected costs of an investment are deducted from the discounted value of the expected revenues The net present value of a stream of costs and benefits is a number that results from discounting the values of the stream at a given discount rate It is equivalent to the number that results from the following expression
IRR NPV 0gt gti mkt
IRR NPV 0lt lti mkt
whereBt = benefits at time t Ct = costs at time tIt = investment costs n = project economic lifer = discount rate
Net revenues the amount remaining after all outflows have been subtracted from all inflows Discounting the incremental net revenues before financing gives a measure of the project worth of all resources engaged discounting the incremental net revenues after financing gives a measure of the project worth of the entityrsquos own resources or equity
Nominal prices Prices prevailing in a particular year Synonymous with budget-year dollars
Non-tradable good 16 23 footnote good or service that by its very nature cannot be exported or imported Land and buildings are examples of a non-tradable good
Non-traded good 16 23 footnote A non-traded good or service is one that is neither exported nor imported in a particular country for a variety of reasons including quotas and prohibitions Common examples of non-traded items are certain drugs haircuts etc In project analysis non-traded refers to goods and services not traded by the country in which the project is located
Numeraire a standard unit of value Money is a numeraire by which the values of different commodities can be compared In cost-benefit analysis the numeraire is the common denominator for measuring benefits and costs Widely used numeraires are the willingness to pay or aggregate consumption numeraire and the foreign exchange numeraire
Operational and maintenance costs 21 35 The recurring costs for operating and maintaining the value of physical assets
Opportunity cost 12 16 19 The best alternative return foregone elsewhere by committing assets to the project The value of something foregone For example the direct opportunity cost of a person-day of labour is what the person would otherwise have produced or being paid for that day of work The value of a resource in its best alternative use For the financial analysis the opportunity cost of a purchased input is always its market price In economic analysis the opportunity cost of a purchased input is its marginal social value in its best non-project alternative use
Output 27 That which is produced Usually refers to the physical product of the project Other effects of the project such as housing for workers employment training of labour and foreign-exchange savings are usually called externalities
Payback period The time required for the cumulative present value of benefits to become equal to the cumulative present value of costs
Programme 8 is a portfolio of multiple projects that are managed and coordinated as one unit with the objective of achieving common (often intangible) outcomes and benefits at sector country or even multi-country level
Project 8 is a temporary entity established to deliver specific (often tangible) outputs in line with predefined time cost and quality constraints A project should always be defined executed and evaluated relative to an approved business plan which balances its costs benefits and risks
42
VOLUME 1 BASIC CONCEPTS AND RATIONALE
Project analysis 8 20 the analytical framework for the evaluation of a projectrsquos feasibility and performance It includes the analysis of the context the objectives technical aspects demand forecasts and financial and economic costs and benefits Project analysis is needed to determine if given the alternatives a proposed project will sufficiently advance the objectives of the entity from whose standpoint the analysis is being undertaken to justify the project
Project cycle 24-25 30-31 a sequence of the series of necessary and pre-defined activities carried out for each project Typically it is separated into the following phases conceptualization inception formulation appraisal ex-ante evaluation financing implementation and ex-post evaluation
Real prices calculated by adjusting market prices by an appropriate price index to eliminate the effects of inflation Prices of goods and services change over time either because the general price level rises that is because of inflation or because the underlying conditions of supply and demand change Real prices refer to prices of goods and services that reflect changes in the underlying conditions of supply and demand but that do not reflect the effects of inflation The terms real prices and constant prices are used interchangeably but referring to real prices as constant prices is misleading Real prices do not necessarily remain constant over time as they change in response to changes in supply and demand Real prices should be distinguished from current prices which reflect inflation as well as changes in supply and demand
Relative prices the exchange value of two goods given by the ratio between the quantity exchanged and their nominal prices
Risk 10 25-27 The degree to which outcomes are uncertain The extent of possible variation in the outcome
Risk analysis 10 25-27 Risk analysis is a technique for assessing the expected net present value of a project in relation with project risks By taking into account the probability distribution of critical variables and the correlations among them it enables analysts not only to assess the expected net present value of a project but also its associated probability distribution In cost-benefit analysis it recognizes the simultaneous variation of the values of several inputs according to specified ranges and probabilities and analyses the resulting variability in the bottom line
Scale 31-33 The size of a project
Scenario 11 14 30 An outline or portrait of a possible future usually portrays unfolding events rather than being static in time
Sensitivity analysis 16 27-29 Sensitivity analysis is an analytical technique to test systematically the
effects on a projectrsquos outcome of changes in its basic assumptions Sensitivity analysis is carried out by varying one element or a combination of elements and determining the effect of that change on projectrsquos profitability indicators (NPV and IRR)
Shadow price 16 23 footnote 30 A shadow price of a good or service is the economic opportunity cost to society of that good or service The true or economic value of a good (as opposed to the market price which might be distorted) Synonymous with economic or social price
Social price 16 A price that reflects the true value to the country of inputs and outputs of the project Synonymous with economic price and shadow price
Social discount rate 12 footnote 16 It attempts to reflect the social view on how the future should be valued against the present (See Discount rate)
Socio-economic costs and benefits 13 opportunity costs or benefits for the economy as a whole They may differ from private costs and benefits to the extent that actual prices differ from economic prices
Switching value 27-28 The switching value of a variable is that value that it would have to attain in order for the outcome of the project to fall below the minimum level of acceptability (net present value of the project equal to nil)
Time value of money Time value of money refers to the concept that money received in the present is more valuable than money received in the future It is the concept underlying discounting
Tradable 16 23 footnote Referring to a good that could be traded internationally in the absence of restrictive trade policies
Traded good 16 23 footnote A traded good is a good that is either exported or imported by some country
Transfer payments 15-17 22 Payments that redistribute wealth but do not use up resources or create them
Willingness to pay What consumers are willing to pay for a good or service Consumers willing to pay substantially more than the actual market price enjoy a consumer surplus (the amount they would pay minus the amount they actually have to pay)
With project scenario (WP) 11 Box 2 estimation simulation modelling of project envisaged costs and benefits
Without project scenario (WOP) 11 Box 2 the baseline scenario against which the additional benefits and costs of the with project scenario can be measured (eg business as usual)
43
VOLUME 1 BASIC CONCEPTS AND RATIONALE
Steps in economic analysis
Economic analysis requires assessment of a projectrsquos net impact on economic welfare
by considering
5 Convert all market prices into economicshadow prices (SP) that better reflect the social
opportunity cost of the good
6 Remove transfer payments (taxes and subsidies) and quantify externalities (positive
and negative)
7 Aggregate all modelsrsquo NIB cash flows respecting incorporation phasing patterns of targeted
beneficiaries into projectrsquos activities
8 Compare aggregated benefits with other project costs to obtain incremental discounted
cash flows Calculate economic performance indicators adopting a social discount rate
ENPV ERR BC ratio
9 Perform sensitivity analysis (SA) in order to deal with the main risks and uncertainties that
could affect the proposed project
Steps in financial analysis
The typical sequence of tasks to be undertaken in financial analysis is the following
1 Develop farmenterprise models and identify benefits and costs (investment and recurrent) for
WOP and WP scenarios (based on crop budgets)
2 Compare the discounted flows of benefits and costs and calculate the differences between the
obtained results and the WOP scenario in order to determine the net incremental benefits (NIB)
of the proposed interventions
3 Calculate the project financial profitability indicators of each model (ie financial NPV financial
IRR and BC ratio) applying these investment criteria to make an investment decision
(positive or negative)
4 Assess family incomes and establish financingcredit needs by performing a lsquosustainability analysisrsquo
Summary steps in financial and economic analysis
44
WP-WOP develop and identify
Develop farmenterprise models and identify benefits and costs (investment and recurrent) for WOP and WP scenarios (based on crop budgets)
Calculate indicators
Calculate the project financial profitability indicators of each model (ie financial NPV financial IRR and BC ratio) applying these criteria to make an investment decision
Financial sustainability
Assess family incomes and establish credit needs by performing a lsquosustainability analysisrsquo
Discount flows ndash costs and benefits
Compare the discounted flows of benefits and costs and calculate the differences between the obtained results and the WOP scenario in order to determine the net incremental benefits (NIB) of the proposed interventions
Shadow prices
Convert all market prices into economicshadow prices (SP) that better reflect the social opportunity cost of the good
Aggregation
Aggregate all modelrsquos NIB cash flows respecting incorporation phasing patterns of targeted beneficiaries
Cash flows
Compare aggregated benefits with other project costs to obtain incremental discounted cash flows Calculate economic performance indicators adopting a social discount rate ENPV ERR BC ratio
Transfers and externalities
Deduct taxes and subsidies ndash Consider positive and negative externalities
Perform sensitivity analysis
in order to deal with the main risks and uncertainties that could affect the proposed project
1
5
6
7
8
9
2
3
4
Economic analysisFinancial analysis
EFA step by step
International Fund for Agricultural Development
Via Paolo di Dono 44 - 00142 Rome ItalyTel +39 06 54591 - Fax +39 06 5043463E-mail ifadifadorgwwwifadorgwwwruralpovertyportalorg
ifad-unblogspotcom
wwwfacebookcomifad
instagramcomifadnews
wwwtwittercomifadnews
wwwyoutubecomuserifadTV
Contacts EFA desk
Eloisa de Villalobos Thomann
EFA Technical Adviser Tel +39 06 5459 2827Email edevillalobosifadorg
Enrico Mazzoli
Technical Adviser Tel +39 06 5459 2462Email emazzoliifadorg
- Acknowledgements
- Contents
- Abbreviations and acronyms
- Section I - Introduction
-
- Background
- Scope
- Outline
- How to read the guidelines
-
- Section II - Relevance of EFA
-
- Relevance of economic and financial analysis
- EFA as a decision-making tool in project planning
-
- Section III - Basic concepts in undertaking EFA
-
- Investment criteria profitability indicators
- Economic and financial analysis the differences
-
- Section IV - EFA of IFAD rural
-
- Focusing on lsquotypicalrsquo IFAD rural investment projects and their main benefits
- Unquantified benefits alternative methodologies to CBA
- EFA data sources collection and coherence
-
- Section V - EFA role throughout
-
- EFA in project design Links with the logframe and MampE
- EFA in project design Risk analysis
- EFA in project supervision implementation and ex post evaluation
- Ex post EFA and scaling up
-
- Technical annex
-
- Formulas for profitability indicators
- Cost-effectiveness
- Multicriteria analysis
- Types of projects and EFA activities
-
- References
- Glossary
- Summary steps in financial and economic analysis
-