BANKING Bank of Baroda - Business...
18
1 Bank of Baroda Analyst: Anand Dama [email protected] 91 22 3028 6391 Date: 10 th December, 2009 Strongly repositioned for next leg of growth: Bank of Baroda (BOB) has been steadily repositioning and consolidating its business position within PSU banking space, re‐gaining its lost market share. Bank has doubled its business with improved asset quality and profitability during past 3 years, taking the advantage of last economic cycle and is now bracing for next leg of growth. As a strategy, bank is focusing on branch expansion (particularly in south), improving CASA ratio, NIM’s, better operating efficiency and chase qualitative business growth, which should put the India’s international bank (BOB) in an advantageous position. Best in class asset quality and lowest stressed assets within PSU banking space: Bank has witnessed significant improvement in its asset quality with GNPA falling to about 1.3% in Q2FY10, from a high of about 12.6% in FY02, owing to banks strategy to chase growth only with quality. Overall stressed assets remain one of the lowest within PSU banking space at about 4.4%. However, considering still elevated macro risks and adopting conservative approach, we estimate GNPA at 2.4% and NNPA at 0.6% by FY12E. Healthy and improved return ratios: Bank has entered club of above 20% RoE PSU group from sub 15% levels during FY05‐ 07, owing to better profitability and improved capital leverage. RoA’s too have improved from sub 1% to above 1% levels. We expect the bank to register 17% CAGR in PAT over FY09‐12E, RoE at 20% and RoA at 1.2%, aided by healthy core revenue growth and better cost leverage. Improved fundamentals; Initiate with Buy: BOB offers a conservative but consistent PSU bank with improved fundamentals and a strong international character. After recent re‐rating, stock is currently trading at 1.5xFY10E and 1.3xFY11E Adj BV. We value BOB’s core banking business assigning a P/adj BV of 1.5x on FY11E adj.BV and stake in UTI MF at about Rs20 per share to arrive at a target price of Rs606. Our target price provides an upside of 19% from current levels and hence recommend a Buy on the stock. Key risks: Higher delinquencies and international exposure. Rating Buy Target Price Rs606 CMP Rs510 Upside 19% Sensex 17,189 Key Data Bloomberg Code BOB IN Equity Reuters Code BOB.BO NSE Code BANKBARODA Current Share o/s (mn) 364.3 Diluted Share o/s (mn) 364.3 MktCap (Rsbn/USDmn) 185.3/ 3984.4 52 WK H/L (Rs) 563.5/170.35 Daily Vol. (3M NSE Avg) 0.9mn Face Value (Rs) 10 Beta 1.0 1USD/INR 46.7 Shareholding Pattern (%) Promoters 53.8 FII 16.3 Others 29.9 Price Performance (%) 1M 6M 1yr BOB ‐ 9.0 3.5 15.1 NIFTY 5.2 6.5 75.3 Source: Bloomberg;*As on 10 th December, 09 INDIA Institutional Research BANKING Initiating Coverage Bank of Baroda Sunny days ahead… Y/E Mar (Rs Mn) NII YoY (%) Net Income YoY (%) Adj PAT YoY (%) EPS (Rs) Adj BV(Rs) RoE(%) RoA (%) P/E (x) P/ABV(x) FY08 39,118 9.3 59,697 20.2 14,355 39.9 39.3 222.1 16.0 1.0 13.0 2.3 FY09 51,234 31.0 78,838 32.1 22,272 55.1 60.9 271.3 21.3 1.3 8.4 1.9 FY10E 59,094 15.3 86,836 10.1 26,753 20.1 73.2 331.4 21.3 1.3 7.0 1.5 FY11E 72,690 23.0 103,690 19.4 30,651 14.6 83.9 390.8 20.4 1.2 6.1 1.3 FY12E 90,648 24.7 123,148 18.8 35,956 17.3 98.4 466.8 20.0 1.2 5.2 1.1 Source: Company, Networth Research Networth Research is also available on Bloomberg and Thomson Reuters.
Transcript of BANKING Bank of Baroda - Business...
1 Bank of Baroda
Analyst: Anand Dama [email protected] 91 22 3028 6391 Date: 10
th December, 2009
Strongly repositioned for next leg of growth: Bank of Baroda (BOB) has been steadily repositioning and consolidating its business position within PSU banking space, re‐gaining its lost market share. Bank has doubled its business with improved asset quality and profitability during past 3 years, taking the advantage of last economic cycle and is now bracing for next leg of growth. As a strategy, bank is focusing on branch expansion (particularly in south), improving CASA ratio, NIM’s, better operating efficiency and chase qualitative business growth, which should put the India’s international bank (BOB) in an advantageous position.
Best in class asset quality and lowest stressed assets within PSU banking space: Bank has witnessed significant improvement in its asset quality with GNPA falling to about 1.3% in Q2FY10, from a high of about 12.6% in FY02, owing to banks strategy to chase growth only with quality. Overall stressed assets remain one of the lowest within PSU banking space at about 4.4%. However, considering still elevated macro risks and adopting conservative approach, we estimate GNPA at 2.4% and NNPA at 0.6% by FY12E.
Healthy and improved return ratios: Bank has entered club of above 20% RoE PSU group from sub 15% levels during FY05‐07, owing to better profitability and improved capital leverage. RoA’s too have improved from sub 1% to above 1% levels. We expect the bank to register 17% CAGR in PAT over FY09‐12E, RoE at 20% and RoA at 1.2%, aided by healthy core revenue growth and better cost leverage.
Improved fundamentals; Initiate with Buy: BOB offers a conservative but consistent PSU bank with improved fundamentals and a strong international character. After recent re‐rating, stock is currently trading at 1.5xFY10E and 1.3xFY11E Adj BV. We value BOB’s core banking business assigning a P/adj BV of 1.5x on FY11E adj.BV and stake in UTI MF at about Rs20 per share to arrive at a target price of Rs606. Our target price provides an upside of 19% from current levels and hence recommend a Buy on the stock.
Key risks: Higher delinquencies and international exposure.
Rating BuyTarget Price Rs606CMP Rs510Upside 19%Sensex 17,189
Key Data Bloomberg Code BOB IN EquityReuters Code BOB.BONSE Code BANKBARODA
Current Share o/s (mn) 364.3Diluted Share o/s (mn) 364.3MktCap (Rsbn/USDmn) 185.3/3984.452 WK H/L (Rs) 563.5/170.35Daily Vol. (3M NSE Avg) 0.9mnFace Value (Rs) 10Beta 1.01USD/INR 46.7
Shareholding Pattern (%)Promoters 53.8FII 16.3Others 29.9
Price Performance (%) 1M 6M 1yr
BOB ‐9.0 3.5 15.1NIFTY 5.2 6.5 75.3Source: Bloomberg;*As on 10th December, 09
INDIA
Institutional Research
BANKING
Initiating Coverage
Bank of Baroda
Sunny days ahead…
Y/E Mar (Rs Mn) NII YoY (%) Net Income YoY (%) Adj PAT YoY (%) EPS (Rs) Adj BV(Rs) RoE(%) RoA (%) P/E (x) P/ABV(x)
FY08 39,118 9.3 59,697 20.2 14,355 39.9 39.3 222.1 16.0 1.0 13.0 2.3
FY09 51,234 31.0 78,838 32.1 22,272 55.1 60.9 271.3 21.3 1.3 8.4 1.9
FY10E 59,094 15.3 86,836 10.1 26,753 20.1 73.2 331.4 21.3 1.3 7.0 1.5
FY11E 72,690 23.0 103,690 19.4 30,651 14.6 83.9 390.8 20.4 1.2 6.1 1.3
FY12E 90,648 24.7 123,148 18.8 35,956 17.3 98.4 466.8 20.0 1.2 5.2 1.1
Source: Company, Networth Research
Networth Research is also available on Bloomberg and Thomson Reuters.

2 Bank of Baroda
Source: Networth Research
Company Background
Bank of Baroda (BoB), incorporated in 1908, is third largest PSU bank with a network of more than 3000 domestic branches and 78 overseas offices. Bank has one of the strongest international presence, amongst Indian banks, spanning across 25 countries and contributing about 24% of the business. Bank underwent a significant business and brand revamp in FY2006, signifying a change within and approach towards business. As a strategy, bank intends to focus on qualitative growth along with boosting CASA ratio and reducing dependency on high cost bulk deposits to improve margins. BOB is one of the conservative but consistent performers in PSU banking space with balance sheet size of more than Rs2274bn. BOB is also actively present in other financial services business such as asset management, cards and capital markets. Bank has also entered in to a JV with Legal & General of UK and Andhra Bank for Life Insurance business, which is likely to start its operations on full steam beginning 2010.
Exhibit 2: Key events
1908 Incorporated by Maharaja Sayajirao Gaekwad – III
1953 Started overseas operations1994 AMC JV ‐ Baroda Pioneer
1997 IPO @ Rs85
2006 FPO @ Rs230
2007 Agreement to enter Life insurance business; to be fully operational in CY10
Exhibit 3: Key management personnel
Name Position Profile
Mr. M.D.Mallya CMD He took over the position of CMD on May 7, 2008. Prior to joining BOB, he has served as CMD of another PSU bank ‐ Bank of Maharashtra. His banking career spans over 32 years (including ED‐OBC) and has vast experience in various other positions and assignments relating to banking and finance.
Mr.Rajiv Kumar Bakshi ED His earlier assignment was with Bank of India as General Manager. He started his banking career with Bank of India in 1975 & has wide overseas experience having worked at London & Singapore
Mr.N.S.Srinath ED He has been appointed as ED from December 7, 2009 till May 31, 2012. His earlier assignment was with Canara Bank as general manager.
Source: Company, Networth Research
Exhibit 1: DuPont analysis (FY09)
20.019.4
1.00.50.51.50.92.6
0
5
10
15
20
25
NII Non‐
Interest
Income
Opex Provisions Taxes RoA Avg.
Asset/Avg.
Eq
RoE
(%)
BOB (UK) ‐ 100%
BOB (Uganda) ‐ 80%
BOB (Kenya)‐87%
BOB (Guyana) ‐ 100%
BOB (Botswana) ‐ 100%
BOB (Tanzania) ‐ 100%
BOB (Trinidad & Tobago) ‐100%
BOB (Ghana) ‐ 100%
Baroda (New Zealand) ‐ 100%
BOB (Hongkong) ‐ 100%
Nainital Bank ‐ 98.4%
BOB Cards Ltd ‐ 100%
BOB Capital Market ‐ 100%
BOB AMC ‐ 100%
Indo Zambia Bank ‐ 20%
UTI AMC ‐ 18.5%
UTI Trustee Co ‐ 18.5%
Baroda Pioneer ‐ 49%
Domestic Foreign
Subsidiaries Associates

3 Bank of Baroda
Investment Rationale
Strongly repositioned for next leg of growth
Bank of Baroda (BOB) has been steadily repositioning and consolidating its business position within PSU banking space. Since it’s mire performance during FY03‐05, bank has emerged strongly and is gradually gaining market share with renewed focus on improving profitability over past 4 years, leading the bank to come out of rut of low RoAs (sub 1% ) and low RoEs (sub 20%). The bank has focused on improving operating efficiency, increasing fee income and cautious balance sheet growth strategy, which is also evident in the bank having best asset quality within PSU banking space and provides solid platform for next leg of growth. As a strategy, bank will be focusing on branch expansion (particularly in south), improving CASA ratio, NIM’s, cost efficiency and chase qualitative business growth, which we believe should put the India’s international Bank (BOB) in an advantageous position. We expect bank to register 19% CAGR asset growth, 17% PAT growth, NIM’s to improve to 2.7% levels, RoE at 20% and RoA at 1.2% levels over FY09‐12E.
Exhibit 4: Significant recovery in market share…
3.0
3.5
4.0
4.5
5.0
5.5
FY02 FY03 FY04 FY05 FY06 FY07 FY08 FY09
%
Advances Deposits CASA
Source: Company, RBI, Networth Research
The bank underwent a re‐branding exercise in FY06 (‘Baroda Sun’), as a part of major transformation process, which coincides with improvement in banks overall fundamentals and regained aggression. BoB has doubled its business with improved asset quality and profitability over past 3 years taking the advantage of last economic cycle. During past few quarters, bank has witnessed robust profitability, backed by strong core and fee income growth, which also led to re‐rating of the stock.
Exhibit 5: All‐round improvement in fundamentals
BOB
Branches (excl
branches of
subsidiaries)
Assets
(Rs bn)
YoY
growth
(%)
Loan
gr(YoY
%)
C‐D ratio
(%)
Domestic
CASA ratio
GNPA
ratio
PAT (Rs
bn)
YoY
growth
(%)
RoE (%)RoA
(%)
Business per
branch (Rs
mn)
PAT per
branch
(Rs mn)
CASA per
branch (Rs
mn)
Business
per
employee
(Rs mn)
PAT per
empl. (Rs
mn)
FY03 2753 764 7.8 5.0 53.2 35.0 11.2 7.7 41.8 18.8 1.2 370 2.8 82 25.2 0.2
FY04 2730 851 11.4 0.7 48.8 38.4 10.6 9.7 25.1 21.7 1.4 398 3.5 97 27.3 0.2
FY05 2738 947 11.2 21.9 53.4 38.8 7.4 6.8 ‐30.0 14.1 0.9 456 2.5 108 31.6 0.2
FY06 2743 1,134 19.8 38.0 64.0 42.0 3.9 8.3 22.2 13.5 0.9 560 3.0 130 39.6 0.2
FY07 2772 1,431 26.2 39.6 66.9 38.7 2.5 10.2 23.1 13.1 0.9 752 3.7 150 54.8 0.3
FY08 2899 1,796 25.5 27.6 70.2 36.0 1.8 14.4 40.9 16.0 1.0 892 5.0 164 70.4 0.4
FY09 2974 2,274 26.6 34.9 74.8 34.9 1.3 22.3 55.2 21.3 1.3 1131 7.5 191 91.3 0.6
FY10E 3138 2,665 17.2 17.5 74.5 36.7 1.7 26.8 20.1 21.3 1.3 1263 8.5 223 102.0 0.7
FY11E 3268 3,154 18.4 20.5 75.1 38.1 2.2 30.7 14.6 20.4 1.2 1454 9.4 266 114.9 0.7
FY12E 3398 3,803 20.6 22.0 75.1 39.3 2.4 36.0 17.3 20.0 1.2 1706 10.6 326 139.6 0.9
Source: Networth Research

4 Bank of Baroda
Outperformed system credit growth; to register 20% loan CAGR over FY09‐12E
From an under‐performer during FY03‐05, bank has out‐performed system credit growth during past 4 years, that too with significant improvement in asset quality. Out‐performance has been led by consistent growth in domestic as well as international loan book. International loan book now share about 26% of overall loan book, registering about 46% CAGR over past 4 years, to some extend aided by rupee appreciation also. Bank has come a long way with significant improvement in its C‐D ratio from sub 50% levels to above 70% levels in recent period. We expect bank to maintain C‐D ratio at above 70% and register above industry credit growth at about 20% CAGR over FY09‐12E.
Exhibit 6: Turned out‐performer from underperformer (Loan growth)… Exhibit 7: Significant improvement in C‐D ratio
‐5.0
0.0
5.0
10.0
15.0
20.0
25.0
30.0
35.0
40.0
45.0
FY02
FY03
FY04
FY05
FY06
FY07
FY08
FY09
1HFY10
BOB SCB PSU
53
49
53
64
67
70
75
49
45
50
64
6769
72
40
45
50
55
60
65
70
75
80
FY03 FY04 FY05 FY06 FY07 FY08 FY09
%
C-D ratio Domestic C-D ratio
Source: RBI, Networth Research, SCB – Schedule Commercial Banks Source: Company, Networth Research
Bank’s domestic loan portfolio remains highly skewed towards corporate loans in line with other PSU banks. But exposure to relatively high risk SME remains low. Bank is advantageously present in industrially well‐developed western region; however, is equally competitive putting pressure on yields. Bank has higher exposure to textiles and chemicals, which are major hub for these industries. However, off‐late exposure to chemicals has come down significantly to about 3.4% from 5.9% at the beginning of the year.
Exhibit 8: Domestic loan portfolio skewed towards corporate (%) Exhibit 9: Industry loan breakup as % of total loans( FY09)
SME, 15
Retail, 19
Corporate,
49
Agriculture
, 17
0%
5%
10%
15%
20%
25%
30%
BOB BOI UBI Canara PNB
Textiles Chemicals
Gems & Jewellery Construction/InfrastructureIron,steel & metals
Source: Company, Networth Research Source: Company, Networth Research

5 Bank of Baroda
One of the biggest overseas operations amongst PSU’s
BOB has one of the biggest overseas operations amongst Indian PSU banks accounting for about 24% (Q2FY10) of its business, spanning across 25 countries, catering primarily to Indian business operations. The bank began its international operations way back in 1953 and now has about 78 overseas offices, including 48 branches, 7 subsidiaries (27 branches) and 3 representative offices. Bank is present in all major global financial centre’s viz. New York, London, Brussels, Dubai, Singapore and Hong Kong, which further diversifies the international business risk. The bank has adopted “country‐specific strategy” with a mix of retail and wholesale business, quick product innovations, increase of delivery channels to increase the customer base and profitability.
International operations are considered to be more profitable with better RoA, higher C‐D ratio and lower cost‐income ratio. However, recent global economic crisis has also exposed the risk of international operations, to which Indian banks including BOB remained relatively less affected. We believe that apart from profitability considerations, international operations also provide hedge against domestic risks, better service to foreign operations of domestic corporations (which in turn leads to better domestic business relationships and loyalty) and international character, which is important factor in globalised market from long term perspective.
Exhibit 10: BOB has significant international business share & growth Exhibit 11: Composition of international loan book & NPA’s
24.1
17.4
9.2
46
33
42
0
5
10
15
20
25
30
BOB BOI SBI
%
0
5
10
15
20
25
30
35
40
45
50%
% of International/ global business 3 yr CAGR
40.2
9.4
20.9
45.1
19.4
15.4
3.48.8
16.1 21.2
0%
10%
20%
30%
40%
50%
60%
70%
80%
90%
100%
% of loans % of NPA
Industry Trading Service Real Estate Agri/Misc
Source: Company, Networth Research Source: Company, Networth Research
BOB has international loan book of about Rs394.4bn (GNPA ‐ 0.5%), of which UAE contributes about 25‐26% i.e Rs100bn and Dubai, which is the epicenter of recent crisis and contributes about Rs40bn. Of the overall international loan book, real estate sector contributes mere 3.4% of overall loan book. As per management, Dubai world contributes about Rs9.3bn (USD 200mn) and the first repayment is due only in 2011 and the next one in 2013, allaying the concern of any immediate elevated risks. Bank has no exposure to Dubai world’s subsidiaries Nakheel world and Limitless world. Further, bank has reported that so far the company has met all its interest obligations. However, it is still not known that whether BOB’s exposure is part of the USD26bn debt restructured by Dubai world and its subsidiaries, which if included would lead to increase in banks restructured assets by about 60bp (existing 3.1% of loans). We remain watchful on the Dubai episode; however, believe that at any downside to these exposures can be well absorbed by the bank’s pre‐provisioning profits without impacting its capital.

6 Bank of Baroda
Strong urban and west centric branch profile
Bank has very strong branch profile considering one of the highest share of metro branches amongst PSU and SCB. Further combined share of metro+urban branches (about 40%) too is higher than some of its peers such as SBI and BOI, which contribute significant portion of deposits and credit in the banking industry. Though branch expansion relative to PSU peers has been slower during past couple of years, share of metro+urban branches has witnessed significant improvement. Apart from strong urban presence, bank also has higher share of branches in west, which contributes significant portion of CASA deposits and credit in the industry. The improvement in branch profile, which is a part of transformation process, has resulted in above 15% CASA growth and significant improvement in C‐D ratio during past 4 years. Going forward, bank is strengthening its reach and liability franchise adding about 130‐160 branches every year, with major focus in urban and south region.
Exhibit 12: BOB has better share of metro branches Exhibit 13: ..but off‐late share of metro+urban branches improving significantly
21.8 19.4 22.0 16.3 21.1 21.1
18.5 18.823.7
19.022.6 22.8
22.2 20.7
24.4
30.222.1 25.0
37.6 41.229.8 34.5 34.2 31.0
0%
10%
20%
30%
40%
50%
60%
70%
80%
90%
100%
BOB BOI UBI SBI PSU SCB
Metro Urban Semi ‐urban Rural
M etro+Urban
36.636.3 36.4
36.6 36.5
39.7
40.2
34
35
36
37
38
39
40
41
FY03 FY04 FY05 FY06 FY07 FY08 FY09
%
Source: Company, RBI, Networth Research Source: Company, Networth Research
Strong in west…now to illuminate south
Western region contributes about 28% of overall industry CASA deposits in the country, whereas, North and South contributes equal share at about 21% each. Similarly, South contributes maximum share in credit and also has one of the best C‐D ratio. BOB already has strong presence in west and north, but has relatively weaker branch network in south. Hence, bank has envisaged significant branch expansion plan primarily focused in south to garner higher CASA and business growth. During 1HFY10, bank has opened about 20% of branches in southern region.
Exhibit 14: BOB has west centric branch network
35.8
15.5
11.3
28.1
52.9 56.4
0%
10%
20%
30%
40%
50%
60%
70%
80%
90%
100%
BOB SCB
West South North and rest of India
Source: Company, RBI, Networth Research
7 Bank of Baroda
Exhibit 15: South & west corner significant share of CASA deposits Exhibit 16: …Also corners significant portion of industry credit
27.8
21.2 21.0
14.4 13.5
2.1
0
5
10
15
20
25
30
WEST NORTH SOUTH CENTRAL EAST NORTH‐
EAST
%
30.3 27.8 21.2 9.7 9.2 1.7
85.9 85.6
69.6
48.0 43.638.8
0
5
10
15
20
25
30
35
South West North Eastern Central North‐
East
%
0
20
40
60
80
100%
Credit share C‐D ratio
Source: RBI, Networth Research Source: RBI, Networth Research
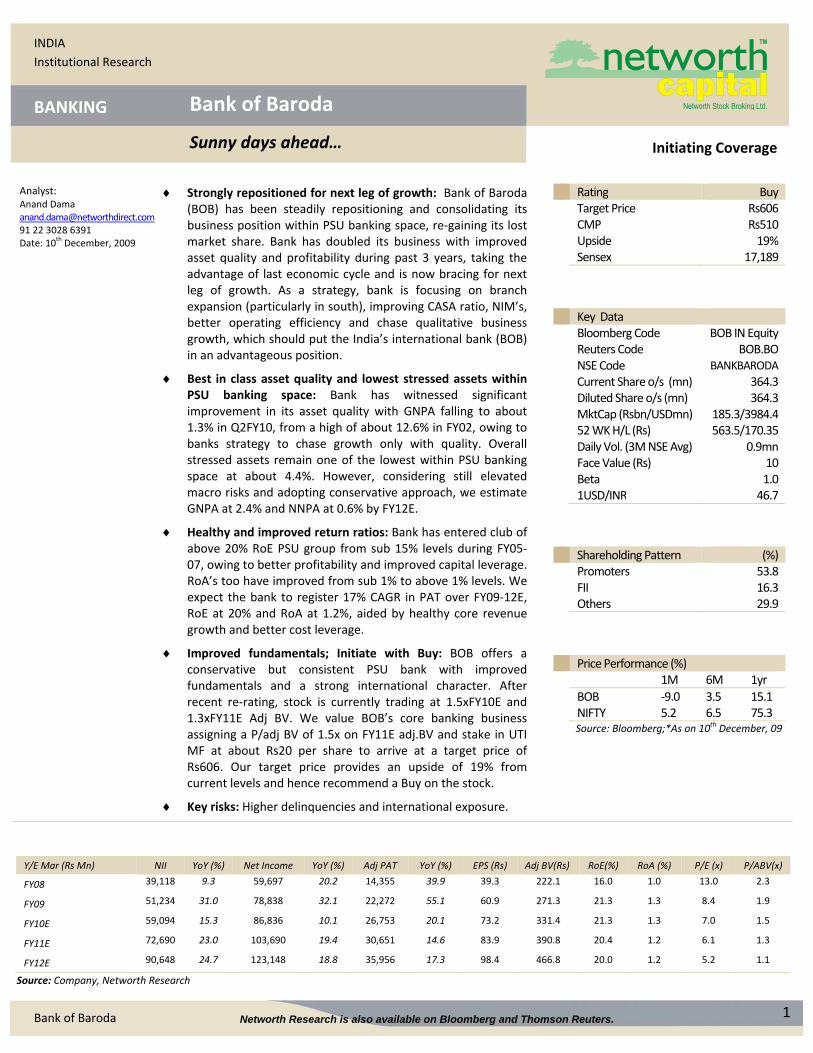
Improving CASA ratio ‐ a primary focus area for the bank
Despite one of the best branch profile, CASA ratio has been falling owing to industry‐wide phenomenon for PSU banks and banks strategy to fund credit expansion through short term high cost bulk deposits. CASA growth for BOB during FY05‐09 has been at about 17.7% vis‐à‐vis 19% for SCB, but better than 17% for PSU banks. However, improving CASA ratio and reducing dependency on bulk deposits are the primary focus areas for the bank. As on Q2FY10, bank has significantly reduced dependence on bulk deposits to about 8‐10% from above 20% in FY08 due to its conscious strategy and also to some extent due to slump credit growth. Falling term deposits rates have led to better CASA growth in 1HFY10. We believe that significant branch expansion, reducing spread between term and saving deposit rates, and concerted efforts to effectively utilise one of the best branch profile available along with branch expansion plan, will yield results in long run with improvement in CASA ratio. We expect CASA to register 25%CAGR over FY09‐12E and CASA ratio to improve to about 33.5% by FY12E.
Exhibit 17: Improving CASA ratio a positive Exh. 18: BOB has Lower CASA ratio but better CASA per branch (1HFY10)
33.8
36.4 36.537.9
33.2
31.229.6 30.2
35.0
38.4 38.8
42.0
38.7
36.034.9
36.2
20
25
30
35
40
45
FY03 FY04 FY05 FY06 FY07 FY08 FY09 Q2FY10
%
CASA ratio CASA ratio - domestic
38.5 33.0 30.2 29.0 26.6
193174
202 209
170
0.0
5.0
10.0
15.0
20.0
25.0
30.0
35.0
40.0
45.0
PNB UBI BOB Canara BOI
%
0
50
100
150
200
250Rs mn
CASA ratio (LHS) CASA per branch (RHS)
Source: Company, Networth Research Source: Company, Networth Research

8 Bank of Baroda
Margins to remain range bound at about 2.5‐2.7% levels over FY09‐12E
BOB has relatively lower NIMs as compared to its close PSU peers, primarily owing to lower yields on assets and lower international NIMs. Bank has lowest cost of deposits (about 5.3% in FY09) and cost of funds (about 5.4% in FY09) amongst PSU peers, however, lower yields remain a drag on NIM’s. Yields have been lower primarily owing to banks low risk‐low yield portfolio and stiff competition (higher volumes/market share at a cost of yields), which is also evident from banks better asset quality.
Going forward, we expect slide in yields to get arrested as the systemic risk concerns wane alluring bank to take incremental exposure to high yield earning assets. Further improving economic scenario for credit growth and thus C‐D ratio should further support yields. Investment – deposit ratio, which was as high as 52% in FY04 leading to relatively yield on assets, too has come‐off to about 27‐28%. On the cost front, better CASA ratio, reduced share of bulk deposits and incremental benefit from re‐pricing of deposits should further bring down the cost of funds. We expect bank to witness marginal improvement in NIM’s and to remain range bound at about 2.5‐2.7% over FY09‐12E.
Exhibit 19: Sliding NIMs, but to improve Exhibit 20: NIMs…peer comparison
2.7
3.0
3.43.5
3.22.9
2.5 2.62.5 2.6
0.0
0.5
1.0
1.5
2.0
2.5
3.0
3.5
4.0
FY03 FY04 FY05 FY06 FY07 FY08 FY09 FY10E FY11E FY12E
%
2.42.6
2.8 2.8
3.3
2.7 2.6
2.32.6
3.6
0.0
0.5
1.0
1.5
2.0
2.5
3.0
3.5
4.0
Canara BOB UBI BOI PNB
%
FY09 Q2FY10
Source: Company, Networth Research Source: Company, Networth Research
BOB has relatively lower interest spreads…
BOB has relatively lower interest spreads as compared to peer banks (except for Canara Bank), owing to lower yields. Lower yields have been primarily due to higher share of low yield‐low risk portfolio and stiff competition in western region, which contributes major share of business. BOB contracts nearly 60% of the business at relatively lower rates vis‐à‐vis its high margin peers, putting pressure on yields. However, now bank being on relatively better footing, should command better yields.
Exhibit: Comparative interest spreads, PLR, and maximum & minimum interest rates at which 60% of the business was contracted (March 2005 & 2009). These are just indicative rates.
In te re st P LR In te re st P LR
Sp re ad Sp re adM ax M in M ax M in
BO B 2 .2 12 .5 0 11 .0 0 7 .0 0 2 .9 10 .5 0 14 .2 5 8 .5 0
BO I 2 .5 12 .5 0 15 .0 0 9 .0 0 2 .4 10 .7 5 12 .0 0 8 .0 0
U B I 2 .5 12 .5 0 14 .0 0 5 .6 5 2 .6 10 .7 5 15 .2 5 5 .2 5
C an a ra 2 .0 12 .5 0 14 .0 0 10 .0 0 2 .8 10 .7 5 10 .7 5 10 .7 5
PN B 2 .5 12 .5 0 13 .0 0 9 .0 0 2 .9 10 .7 5 14 .7 5 8 .7 5
M ar ‐09
Te rm Lo anB an k M ar ‐05
Te rm Lo an
Source: RBI, Networth Research

9 Bank of Baroda
Cost‐income ratio on steady decline; scope for further improvement
Bank has witnessed considerable improvement in operating efficiency over past 3 years with C‐I (cost‐income) ratio falling to 45% in FY09 from a high of 54% in FY06, primarily due to better employee productivity leading to better income generation and concerted efforts to control cost. During past few years, bank has invested heavily in to human capital, technology up‐gradation including CBS implementation, brand make over and expansion, which should start yielding results with better income generation at relatively lower incremental cost. Though C‐I ratio for many PSU banks has nearly bottomed at about 40% levels, BOB is yet to reap the benefits. We expect cost‐income ratio to improve further to about 41‐42% level over FY11‐ FY12E.
Exhibit 21: Improving operating efficiency… Exhibit 22: BOB has higher cost ratios, but scope for improvement
41.741.244.645.450.851.254.146.140.148.4
2.2 2.2 2.22.3
2.01.9
1.8
1.61.51.5
0
10
20
30
40
50
60
FY03 FY04 FY05 FY06 FY07 FY08 FY09 FY10E FY11E FY12E
%
0.0
0.5
1.0
1.5
2.0
2.5
C-I ratio-LHS Opex as % of avg. assets - RHS
45.4 43.6 41.8 41.4 36.2
1.5 1.5
1.9
1.5
1.8
0
5
10
15
20
25
30
35
40
45
50
BOB Canara UBI PNB BOI
%
0.0
0.2
0.4
0.6
0.8
1.0
1.2
1.4
1.6
1.8
2.0
C-I ratio-LHS Opex/Avg. assets-RHS
Source: Company, Networth Research Source: Company, Networth Research
Higher employee cost led to higher opex…
As can be seen from the charts below, employee cost per employee, employee cost/opex and employee cost/net income has been relatively higher for BOB. However, improving employee productivity should improve this situation. Further, bank has been providing aggressively for wage hike revision since past 2 years and thus should not wield any significant burden.
Exhibit 23: Employee cost – Peer comparison Exhibit 24: BOB’s employee cost ratio coming down
5.0
6.4
4.8
4.3 4.2
0
10
20
30
40
50
60
70
80
PNB BOB BOI Canara UBI
%
0.0
1.0
2.0
3.0
4.0
5.0
6.0
7.0
Rs Lacs
Employee cost/Opex Employee cost/Net incomeCost per employee
3235
3332
30 2926 2670
6465
63
6665
6464
0
5
10
15
20
25
30
35
40
FY05 FY06 FY07 FY08 FY09 FY10E FY11E FY12E
%
58
60
62
64
66
68
70
72
Employee cost/Net income - LHS Employee cost/Opex - RHS
Source: Company, Networth Research Source: Company, Networth Research

10 Bank of Baroda
Best in class asset quality and lowest stressed assets within PSU banking space
BOB has witnessed significant improvement in its asset quality with GNPA falling to about 1.3% in Q2FY10, from a high of about 12.6% in FY02 and 7.4% in FY05. Overall stressed assets including GNPA and restructured loans remain one of the lowest within PSU banking space at about 4.4% for BOB. The primary reason for banks impeccable asset quality has been relatively lower exposure to high risk assets, which has also impacted banks yields and thus NIMs. Further, management has been continuously stressing to chase growth only with quality, which is translating in to better asset quality for the bank. However, macro and systemic risks still remain elevated, though moderated to some extent (particularly for corporate loans), make us to estimate banks NPA’s at higher levels. We estimate GNPA at 2.4% and NNPA at 0.6% by FY12E.
Exhibit 25: Improving asset quality Exhibit 26: Stressed assets – peer comparison
12.6
11.210.6
3.9
2.51.8
1.3 1.7 2.2 2.4
5.4
3.52.8
1.4 0.8 0.6 0.5 0.3 0.4 0.6 0.6
7.4
0
2
4
6
8
10
12
14
FY02
FY03
FY04
FY05
FY06
FY07
FY08
FY09
FY10E
FY11E
FY12E
%
GNPA NNPA
0
1
2
3
4
5
6
7
8
9
BOB Canara UBI PNB BOI
%
GNPA Restructured Loans
Source: Company, Networth Research Source: Company, Networth Research
BOB has relatively lower exposure to sensitive sectors and risky assets…
Bank has relatively lower exposure to highly sensitive sectors such as commercial real estate and capital market vis‐à‐vis its close peers. Similarly BOB has lower proportion of risk‐weighted assets (an another parameter to measure risk on the book) as compared to its peers.
Exhibit 27: BOB has low exposure to sensitive sectors (% of loans) Exhibit 28: RWA/Total Assets – peer comparison (FY09)
2.32.7
3.3
5.2
9.5
1.30.9
1.72.1 2.3
0
1
2
3
4
5
6
7
8
9
10
Canara BOB UBI BOI PNB
%
Commercial real estate Capital Market
57.0 57.0
59.0
61.0
63.0
54
55
56
57
58
59
60
61
62
63
64
BOB Canara UBI PNB BOI
%
Source: Company, Networth Research Source: Company, Networth Research

11 Bank of Baroda
RoE’s above 20% and RoA above 1% over FY09‐12E
Bank has witnessed significant improvement in RoE to above 20% levels during past 2 years from sub 15% levels during FY05‐07, owing to better profitability and improved capital leverage. RoA’s too which were sub 1% have improved to above 1%. We expect the bank to register 17% CAGR in PAT over FY09‐12E, aided by healthy core revenue growth and better cost leverage. We expect bank to maintain its RoE above 20% levels and RoA above 1% over FY09‐12E.
Exhibit 29: BOB has come a long way with RoE’s now back above 20% levels
18.8 21.7 14.1 13.5 13.1 16.0 21.3 21.3 20.4 20.0
1.2
1.4
0.90.9 0.9
1.0
1.3 1.3 1.2 1.2
0
5
10
15
20
25
FY03 FY04 FY05 FY06 FY07 FY08 FY09 FY10E FY11E FY12E
%
0.0
0.2
0.4
0.6
0.8
1.0
1.2
1.4
1.6
RoE - LHS RoA - RHS
Source: Company, Networth Research
On peer comparison of Du‐pont analysis, BoB’s RoE has been relatively lower due to lower NII contribution, higher opex and weaker capital leverage. Fee income contribution to profitability has been nearly at par with peers. Going forward, better NII and fee income contribution along with improved operating leverage should help bank sustain return ratios in higher and reasonable band.
Exhibit: Du‐pont comparison (FY09)
FY09 BOB BOI UBI Canara PNB% of Average assetsNet‐Interest Income 2.5 2.7 2.7 2.4 3.2Non‐Interest Income 1.4 1.5 1.0 1.2 1.4 Fee income 0.7 0.8 0.6 0.8 0.6
Treasury income 0.4 0.4 0.2 0.3 0.3
Forex income 0.2 0.3 0.2 0.1 0.1
Net Income 3.9 4.3 3.7 3.5 4.6Operating Expenses (1.8) (1.5) (1.5) (1.5) (1.9) Operating Profit 2.1 2.7 2.2 2.0 2.7Provisions (0.5) (0.6) (0.5) (0.7) (0.5) Taxes (0.5) (0.6) (0.4) (0.2) (0.8) RoA (%) 1.1 1.5 1.2 1.0 1.4Avg.assets/avg equity (x) 19.5 20.1 22.5 21.8 18.6RoE (%) 21.3 30.1 27.2 22.6 25.8
Source: Company, Networth Research

12 Bank of Baroda
Comfortable capital adequacy to fund normal business growth
BOB’s overall CAR at 14.7%, with Tier‐I capital of 8.9% is well within comfortable and better than optimal range (CAR – 12% and Tier‐I – 8%). Bank has been regularly shoring up its Tier‐II capital and obtained in‐principle approval to raise about Rs35bn in FY10. Though bank has sufficient head room available to raise Tier‐II capital, we believe that lower government stake of about 54% in the bank may limit banks capital raising option without government support. However, as a soother, government has obtained funds to recapitalise needed banks and thus if the need arises, government would provide required capital to fund banks growth.
Further, on our stress case analysis for next 4 years assuming RoE of about 20% and Tier I & Tier II capital ratio at the end of 4th year at 6% each (i.e overall CAR at optimal level of 12%) and existing RWA/Assets ratio of 57%, we derive that bank can fund 28% CAGR balance sheet growth without any fresh capital infusion. During past 3 years, bank has grown at about CAGR of 26% and thus we believe that bank can easily achieve at‐least historic pace of growth without any capital constraint. We estimate overall CAR to remain at comfortable levels at about 13.7% with Tier‐I at 8.7% in FY12E.
Part stake sale in UTI AMC
Bank has entered in to an agreement to part sale its 6.5% stake (to 18.5%) in UTI Mutual Fund to US based T Rowe Price for a consideration of USD33.8mn.The acquisition pegs the UTI MF valuation at about 3.5% of AUM, which is reasonable considering recent stake sales in the MF industry. Assuming the same as our base case valuation for banks balance stake in MF (18.5%) and 15% CAGR till FY11E in AUM, we arrive at a value of Rs20 per share for the bank.
Venturing in to Insurance business
Bank has entered into a life insurance JV under the name ‘India First Life Insurance Co Ltd, where the bank holds about 44% stake with UK’s Legal and General Group holding 26% and Andhra Bank holding 30% stake. The JV has received all necessary approvals and is likely to start operations in full steam towards the beginning of CY10. However, insurance venture is high gestationary, competitive and capital guzzler business, which will yield results only in long term.

13 Bank of Baroda
Valuation Analysis
Improved fundamentals; Initiate with Buy
BOB has witnessed all‐round improvement in fundamentals during past few years and is bracing for next leg of growth. Bank has completed CBS implementation, though late, and is now focusing on branch expansion in south, which should further help garner higher CASA, NIM and business growth. BOB offers a conservative but consistent PSU bank with improved fundamentals and a strong international character. Historically bank has traded at discount to peer banks, but has off‐late catched up supported by underlying strong fundamentals.
After recent re‐rating, stock is currently trading at 1.5xFY10E and 1.3xFY11E Adj BV. We value BOB’s core banking business assigning a P/adj BV of 1.5x on FY11E adj. BV and stake in UTI MF at about Rs20 per share to arrive at a target price of Rs606. Our target price provides an upside of 19% from current levels. Hence, recommend a buy on the stock.
Exhibit 30: One year forward P/Adj BV
0
100
200
300
400
500
600
700
Mar‐02
Aug‐02
Jan‐03
May‐03
Oct‐03
Feb‐04
Jul‐04
Dec‐04
Apr‐05
Sep‐05
Jan‐06
Jun‐06
Nov‐06
Mar‐07
Aug‐07
Dec‐07
May‐08
Oct‐08
Feb‐09
Jul‐09
BOB 0.6 0.8 1.1 1.3 1.6 1.8
Source: Networth Research
Peer comparison
BOB, BOI and UBI appear to be close competitors. BOB’s gradual fundamental out‐performance during past few quarters has led to re‐rating of the stock.
Exhibit 31: P/BV v/s RoE chart Exhibit 32: P/BV v/s RoA chart
UBI
BOB
PNBBOI
Canara
10
12
14
16
18
20
22
24
26
28
1.0 1.1 1.1 1.2 1.2 1.3 1.3 1.4 1.4 1.5 1.5 1.6 1.6
RoE (%)
P/BV (x)
UBIBOB PNB
BOI
Canara
0.6
0.7
0.8
0.9
1.0
1.1
1.2
1.3
1.4
1.5
1.0 1.1 1.1 1.2 1.2 1.3 1.3 1.4 1.4 1.5 1.5 1.6 1.6
RoA (%)
P/BV (x)
Source: Bloomberg, Networth Research Source: Bloomberg, Networth Research

14 Bank of Baroda
Bridging the gap…
Though the gap between BOB and UBI has been nearly flat, but earlier period stark discount as compared to BOI inversed in to premium and now is nearly flat vis‐à‐vis BOI. BOB’s out‐performance and BOI’s under‐performance during past few quarters has led to such a shift.
Exhibit 33: P/BV cycle – BOB v/s BOI & UBI Exhibit 34: P/BV cycle – BOB v/s Canara & PNB
‐0.5
‐0.4
‐0.3
‐0.2
‐0.1
0.0
0.1
0.2
0.3
0.4
0.5
0.6
Apr‐05
Jul‐05
Oct‐05
Jan‐06
Apr‐06
Jul‐06
Oct‐06
Jan‐07
Apr‐07
Jul‐07
Oct‐07
Jan‐08
Apr‐08
Jul‐08
Oct‐08
Jan‐09
Apr‐09
Jul‐09
Oct‐09
P/BV (x)
BOB/BOI BOB/UBI
‐0.5
‐0.4
‐0.3
‐0.2
‐0.1
0.0
0.1
0.2
0.3
0.4
0.5
0.6
Apr‐05
Jul‐05
Oct‐05
Jan‐06
Apr‐06
Jul‐06
Oct‐06
Jan‐07
Apr‐07
Jul‐07
Oct‐07
Jan‐08
Apr‐08
Jul‐08
Oct‐08
Jan‐09
Apr‐09
Jul‐09
Oct‐09
P/BV (x)
BOB/Canara BOB/PNB
Source: Bloomberg, Networth Research Source: Bloomberg, Networth Research
Except for PNB, BOB has been outperforming its close peers but remains laggard as compared to bankex
Exhibit 35: BOB’s relative performance with peers Exhibit 36: BOB’s relative performance with Sensex and Bankex
0
50
100
150
200
250
300
350
3‐M
ar‐09
12‐M
ar‐09
21‐M
ar‐09
30‐M
ar‐09
8‐Apr‐09
17‐Apr‐09
26‐Apr‐09
5‐M
ay‐09
14‐M
ay‐09
23‐M
ay‐09
1‐Jun‐09
10‐Jun‐09
19‐Jun‐09
28‐Jun‐09
7‐Jul‐09
16‐Jul‐09
25‐Jul‐09
3‐Aug‐09
12‐Aug‐09
21‐Aug‐09
30‐Aug‐09
8‐Sep‐09
17‐Sep‐09
26‐Sep‐09
5‐Oct‐09
14‐Oct‐09
23‐Oct‐09
1‐Nov‐09
10‐Nov‐09
19‐Nov‐09
28‐Nov‐09
7‐Dec‐09
BOI Canara PNB BOB UBI
40
80
120
160
200
240
280
3‐Mar‐09
12‐Mar‐09
21‐Mar‐09
30‐Mar‐09
8‐Apr‐09
17‐Apr‐09
26‐Apr‐09
5‐May‐09
14‐May‐09
23‐May‐09
1‐Jun‐09
10‐Jun‐09
19‐Jun‐09
28‐Jun‐09
7‐Jul‐09
16‐Jul‐09
25‐Jul‐09
3‐Aug‐09
12‐Aug‐09
21‐Aug‐09
30‐Aug‐09
8‐Sep‐09
17‐Sep‐09
26‐Sep‐09
5‐Oct‐09
14‐Oct‐09
23‐Oct‐09
1‐Nov‐09
10‐Nov‐09
19‐Nov‐09
28‐Nov‐09
7‐Dec‐09
BOB Sensex Bankex
Source: Bloomberg, Networth Research Source: Bloomberg, Networth Research

15 Bank of Baroda
Peer Comparison Metrics
We have put in a comparison of BOB with its peers on various business and qualitative parameters. BOB scores better on many of these parameters.
Comparative Parameters BOB BOI UBI Canara PNB
Business Metrics (%)
Branches (Q2FY10) 3103 3097 2821 2806 4611
Asset (3 yr CAGR) 24.5 24.2 22.2 18.8 18.3
Credit growth (3 yr CAGR) 35.0 26.7 24.6 23.0 26.5
C‐I ratio 45.4 36.2 41.8 43.6 41.4
CASA ratio (Q2FY10) 30.2 26.6 33.0 29.0 38.5
International/Global business 24.1 17.4 0.7 2.3 1.8
Capital Adequacy 14.7 13.5 13.8 14.5 14.3
Tier I 8.9 9.2 8.7 8.9 9.2
Margins (%)
NIM ‐ FY09 2.6 2.8 2.8 2.4 3.3
NIM ‐ Q2FY10 2.6 2.6 2.3 2.7 3.6
Interest spread 2.2 2.5 2.5 2.0 2.5
NII/Assets 2.5 2.7 2.7 2.4 3.2
Asset quality (%)
GNPA 1.3 1.7 2.0 1.6 1.8
Stressed Assets 4.4 7.7 6.4 5.3 7.7
Provision coverage (exc. Tech w/offs) 79.3 59.0 88.0 28.0 91.0
Capital Market exposure 0.9 2.1 1.7 1.3 2.2
Commercial real estate exposure 2.7 5.2 3.3 2.3 9.5
RWA/Total Assets 57.0 63.0 59.0 57.0 61.0
Qualitative parameters
Business per branch (Rs mn) 1131 1101 920 1190 884
PAT per branch (Rs mn) 7.5 10.0 6.7 7.6 7.0
CASA per branch (Rs mn) 202.1 170.4 174.2 208.8 192.6
Business per employee (Rs mn) 91.3 82.8 84.9 73.7 67.3
PAT per employee (Rs mn) 0.6 0.7 0.6 0.5 0.5
Profitability (%)
RoE 21.3 30.1 27.2 22.6 25.8
RoA 1.3 1.5 1.2 1.0 1.4 Source: Company, Networth Research
Note: Primarily FY09 figures; but used Q2FY10 numbers as well wherever available and relevant

16 Bank of Baroda
Key risks and concerns
Higher delinquencies: Stress in corporate loans has still not peaked and thus bank could witness delinquencies higher than expected.
Higher international exposure: International business along with opportunity also exposes bank to higher risks, which got exposed during sub‐prime crisis and recent Dubai crisis.
BOB could be one of the strong acquirer in banking consolidation, but stronger and influential unionism could affect any acquisition attempt and business ambitions.

17 Bank of Baroda
Financial Summary
Income Statement (Rs mn) Ratios
Y/E March FY08 FY09 FY10E FY11E FY12E Y/E March FY08 FY09 FY10E FY11E FY12E
Interest Earned 118,135 150,916 173,747 205,017 250,785 Bal. Sheet Ratios (%)
Interest Expended 79,017 99,682 114,653 132,327 160,138 Loans/Deposits 70.2 74.8 74.5 75.1 75.1
Net Interest Income 39,118 51,234 59,094 72,690 90,648 CASA Ratio 31.2 29.6 30.8 32.0 33.5
Growth (%) 9.3 31.0 15.3 23.0 24.7 Loan Growth 27.6 34.9 17.5 20.5 22.0
Non Interest Income 20,579 27,604 27,742 31,000 32,500 Deposit Growth 21.7 26.5 18.0 19.5 22.0
Growth (%) 48.1 34.1 0.5 11.7 4.8 Operating Ratios (%)
Fee, forex & other income 15,257 18,603 21,742 24,500 26,000 NIM 2.5 2.6 2.5 2.6 2.7
P/L on sale of investments 5,322 9,002 6,000 6,500 6,500 Non‐int inc/Net income 34.5 35.0 31.9 29.9 26.4
Net Income 59,697 78,838 86,836 103,690 123,148 Empl Costs/ Total Op Costs 62.7 65.7 64.6 64.3 63.6
Growth (%) 20.2 32.1 10.1 19.4 18.8 Cost/Income 50.8 45.4 44.6 41.2 41.7
Operating Expenses 30,343 35,761 38,702 42,746 51,292 Operating cost growth 19.3 17.9 8.2 10.4 20.0
Growth (%) 19.3 17.9 8.2 10.4 20.0 Credit Quality Ratios (%)
Employee expenses 19,038 23,481 25,020 27,472 32,602 Gross NPA 1.9 1.3 1.7 2.2 2.4
Other expenses 11,305 12,279 13,682 15,274 18,690 Net NPA 0.5 0.3 0.4 0.6 0.6
Pre‐Prov Profits 29,354 43,077 48,135 60,945 71,855 Slippage 0.9 0.7 1.1 1.3 1.1
Provisions & Conting. 7,283 9,648 7,905 14,679 17,376 NPL coverage ratio 75.1 75.5 75.5 73.4 73.6
Loan loss provisions 4,360 2,686 10,089 13,266 13,993 NPL provisions/Avg loans 0.9 0.6 1.0 1.4 1.7
Other provisions 2,923 6,962 (2,184) 1,413 3,383 Capital Adeq Ratios (%)
PBT 22,072 33,429 40,229 46,266 54,479 Total CAR 12.9 14.1 14.4 14.2 13.7
Provision for taxes 7,716 11,157 13,477 15,615 18,523 Tier 1 CAR 7.6 8.5 8.7 8.8 8.7
Effective tax rate (%) 35.0 33.4 33.5 33.8 34.0 Profitability Ratios (%)
PAT 14,355 22,272 26,753 30,651 35,956 RoAE 16.0 21.3 21.3 20.4 20.0
Growth (%) 39.9 55.1 20.1 14.6 17.3 RoAA 1.0 1.3 1.3 1.2 1.2
Valuations Ratios
BVPS (Rs) 235.6 283.6 349.6 422.4 508.8
Price/BV (x) 2.2 1.8 1.5 1.2 1.0
Adjusted BVPS (Rs) 222.1 271.3 331.4 390.8 466.8
Price/Adj. BV (x) 2.3 1.9 1.5 1.3 1.1
Balance Sheet (Rs mn) EPS (Rs) 39.3 60.9 73.2 83.9 98.4
Y/E March FY08 FY09 FY10E FY11E FY12E P/E (x) 13.0 8.4 7.0 6.1 5.2
Cash and balance with RBI 93,697 105,963 121,234 145,639 158,933 Dividend Yield 1.6 1.8 2.0 2.2 2.4
Bal with banks & at call 129,296 134,908 147,568 151,927 165,492
Loans 1,067,013 1,439,859 1,691,834 2,038,661 2,487,166 Dupont Analysis
Investments 438,701 524,459 635,680 737,933 903,588 Y/E March FY08 FY09 FY10E FY11E FY12E
Total int earning assets 1,728,707 2,205,189 2,596,316 3,074,160 3,715,179 % of Average assets
Fixed Assets 24,270 23,097 23,709 24,146 25,381 Net‐Interest Income 2.4 2.5 2.4 2.5 2.6
Other Assets 43,018 45,781 44,878 55,936 62,533 Non‐Interest Income 1.3 1.4 1.1 1.1 0.9
Total Assets 1,795,995 2,274,067 2,664,903 3,154,242 3,803,093 Net Income 3.7 3.9 3.5 3.6 3.5
Deposits 1,520,341 1,923,970 2,270,284 2,712,989 3,309,847 Operating Expenses (1.9) (1.8) (1.6) (1.5) (1.5)
Other Int bearing liab. 93,498 127,679 148,315 164,515 181,471 Operating Profit 1.8 2.1 1.9 2.1 2.1
Total Interest bearing liab 1,613,839 2,051,649 2,418,599 2,877,504 3,491,318 Provisions (0.5) (0.5) (0.3) (0.5) (0.5)
Other non‐int bearing liab 71,717 94,063 95,601 100,155 104,373 Taxes (0.5) (0.5) (0.5) (0.5) (0.5)
Total Liabilities 1,685,556 2,145,712 2,514,201 2,977,659 3,595,691 RoA (%) 0.9 1.1 1.1 1.1 1.0
Networth 110,439 128,355 150,703 176,583 207,403 Avg.assets/avg. equity (x) 18.0 19.5 19.7 19.4 19.4
Total Liabilities & Equity 1,795,995 2,274,067 2,664,903 3,154,242 3,803,093 RoE (%) 16.0 21.3 21.3 20.4 20.0
Source: Company, Networth Research

18 Bank of Baroda
Networth Research: E‐mail‐ [email protected]
Satish Pasari Head‐ Institutional Business [email protected] 022‐22823225/22840219
Anand Dama Banking & Financial Services [email protected] 022‐30286391
Sanjeev Hota IT / Education [email protected] 022‐ 30286407
Ashwani Sharma Power / Capital Goods [email protected] 022‐30286389
Kanika Bihany Dugar Engineering / Capital Goods [email protected] 022‐39517618
Gaurav Soni Cement [email protected] 022‐39517618
Rupali Nambiar Economy [email protected] 022‐39517620
Derivative & Technical Team
Akshata Deshmukh Sr. Technical & Derivatives Analyst [email protected] 022‐30286389
Amol Shrivastava Derivatives Analyst [email protected] 022‐30286389
Ankit Bhat Research Associate [email protected] 022‐30286389
Quantitative Research
Shubha Aggarwal Research Analyst [email protected] 022‐30281580
Ritesh Kumar Jain Research Analyst [email protected] 022‐30281580
Networth Institutional Sales: E‐mail‐ [email protected]
Prakash Diwan Head‐Institutional Sales & Strategy [email protected] 022‐30286403/30286389
Nilesh Sangani AVP – Institutional Sales and Dealing [email protected] 022‐30286403/39517635
Shalaka Jadhav Manager ‐ Institutional Sales & Dealing [email protected] 022‐22840217/39517636
Production Team
Sanjeev S. Parab Production [email protected] 022‐30281682
Mandar Puri Production [email protected] 022‐30281682
Key to NETWORTH Investment Rankings
Buy: Upside by>15, Accumulate: Upside by +5 to 15, Hold: Upside/Downside by ‐5 to +5, Reduce: Downside by 5 to 15, Sell: Downside by>15
Disclaimer: This document has been prepared by Networth Stock Broking Ltd. (NSBL). NSBL is a full service, integrated investment banking, portfolio management and brokerage group. Our research analysts and sales persons provide important input into our investment banking activities. This document does not constitute an offer or solicitation for the purchase or sale of any financial instrument or as an official confirmation of any transaction. The information contained herein is from publicly available data or other sources believed to be reliable, but we do not represent that it is accurate or complete and it should not be relied on as such. NSBL or any of its affiliates shall not be in any way responsible for any loss or damage that may arise to any person from any inadvertent error in the information contained in this report. This document is provided for assistance only and is not intended to be and must not alone be taken as the basis for an investment decision. The user assumes the entire risk of any use made of this information. Each recipient of this document should make such investigation as it deems necessary to arrive at an independent evaluation of an investment in the securities of companies referred to in this document (including the merits and risks involved), and should consult his own advisors to determine the merits and risks of such investment. The investment discussed or views expressed may not be suitable for all investors. We and our affiliates, officers, directors, and employees may: (a) from time to time, have long or short positions in, and buy or sell the securities thereof, of company (ies) mentioned herein or (b) be engaged in any other transaction involving such securities and earn brokerage or other compensation or act as advisor or lender / borrower to such company (ies) or have other potential conflict of interest with respect to any recommendation and related information and opinions. This information is strictly confidential and is being furnished to you solely for your information. This information should not be reproduced or redistributed or passed on directly or indirectly in any form to any other person or published, copied, in whole or in part, for any purpose. This report is not directed or intended for distribution to, or use by, any person or entity who is a citizen or resident of or located in any locality, state, country or other jurisdiction, where such distribution, publication, availability or use would be contrary to law, regulation or which would subject NSBL and affiliates to any registration or licensing requirements within such jurisdiction. The distribution of this document in certain jurisdictions may be restricted by law, and persons in whose possession this document comes, should inform themselves about and observe, any such restrictions. The information given in this document is as of the date of this report and there can be no assurance that future results or events will be consistent with this information. This information is subject to change without any prior notice. NSBL reserves the right to make modifications and alterations to this statement as may be required from time to time. However, NSBL is under no obligation to update or keep the information current. Nevertheless, NSBL is committed to providing independent and transparent recommendation to its client and would be happy to provide any information in response to specific client queries. Neither NSBL nor any of its affiliates, directors, employees, agents or representatives shall be liable for any damages whether direct, indirect, special or consequential including lost revenue or lost profits that may arise from or in connection with the use of the information. The analyst for this report certifies that all of the views expressed in this report accurately reflect his or her personal views about the subject company or companies and its or their securities, and no part of his or her compensation was, is or will be, directly or indirectly related to specific recommendations or views expressed in this report. Analyst holding in stock: no.
Networth Stock Broking Ltd. (www.networthcapital.com)
Regd. Office:‐ 2nd Floor, D. C. Silk Mills Compound, Kondivita Road, Opp J.B. Nagar Market, Andheri (E), Mumbai ‐ 400059. Tel Phone nos.: 022 – 30641600
Corporate Office :‐ 1/A/A, Ground Floor, Mittal Court, “A” Wing, 224, Nariman Point, Mumbai – 400021. Tel Phone nos.: 022 ‐ 30286389 Fax nos.: 022 ‐ 22836306