BANK OF AFRICA GROUPBANK OF AFRICA Group The BANK OF AFRICA Group A leading bankig partner, BMCE...
191
BANK OF AFRICA GROUP BENIN BURKINA FASO BURUNDI COTE D’IVOIRE DJIBOUTI DRC ETHIOPIA FRANCE GHANA KENYA MADAGASCAR MALI NIGER RWANDA SENEGAL TANZANIA TOGO UGANDA Annual Report 2016
Transcript of BANK OF AFRICA GROUPBANK OF AFRICA Group The BANK OF AFRICA Group A leading bankig partner, BMCE...
BANK OF AFRICAGROUPBENIN
BURKINA FASOBURUNDI
COTE D’IVOIREDJIBOUTI
DRCETHIOPIA
FRANCEGHANAKENYA
MADAGASCARMALI
NIGERRWANDA
SENEGALTANZANIA
TOGOUGANDA
A n n u a l R e p o r t 2 0 1 6
Table of contents
The BANK OF AFRICA Group 2
35 years of growth and expansion 4
Products & services 6
Message from the Chairman 8
Message from the CEO 10
Message from Deputy Manager Director 12
Group Key Figures 14
Managing Directors 16
Board of Directors Chairpersons 17
History of the BANK OF AFRICA Group 18
The development of BOA Group Banks 22
2016 Group Highlights 24
Deployment of the Group’s new strategy 26
Synopsis 32
The 20 subsidiaries of the Group, from BOA-BENIN to ATTICA 32-167
Consolidated annual accounts 169
Consolidated key figures 170
Financial analysis of consolidated accounts 171
Report by the Authorized Statutory Auditor 177
Auditors’ report on the consolidated accounts 179
Notes to the consolidated annual accounts 180
Consolidated Balance Sheet 186
Consolidated Income Statement 188
2
ANNUAL REPORT 2
016
BANK O
F A
FRIC
A G
roup
The BANK OF AFRICA Group
A leading bankig partner, BMCE Bank of Africa
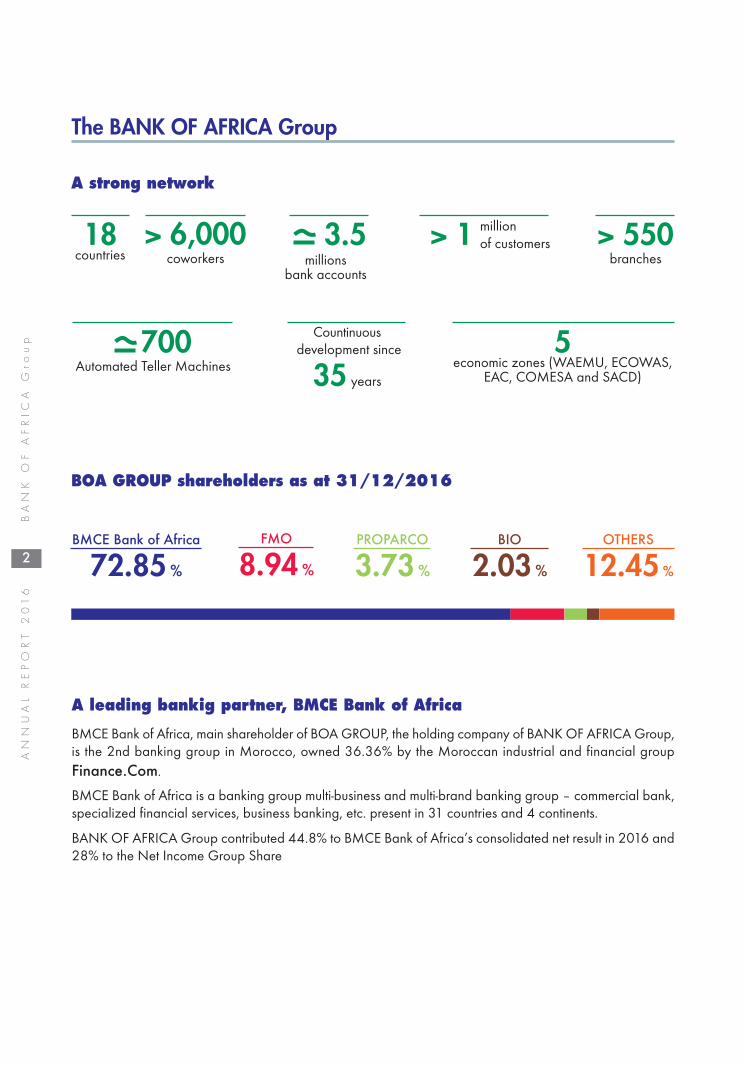
BMCE Bank of Africa, main shareholder of BOA GROUP, the holding company of BANK OF AFRICA Group,is the 2nd banking group in Morocco, owned 36.36% by the Moroccan industrial and financial groupFinance.Com.
BMCE Bank of Africa is a banking group multi-business and multi-brand banking group – commercial bank,specialized financial services, business banking, etc. present in 31 countries and 4 continents.
BANK OF AFRICA Group contributed 44.8% to BMCE Bank of Africa’s consolidated net result in 2016 and28% to the Net Income Group Share
A strong network
BOA GROUP shareholders as at 31/12/2016
18countries
> 6,000coworkers
3.5millions
bank accounts
> 1 million of customers > 550
branches
700Automated Teller Machines
Countinuousdevelopment since
35 years
5economic zones (WAEMU, ECOWAS,
EAC, COMESA and SACD)
BMCE Bank of Africa
72.85 %
FMO
8.94 %
PROPARCO
3.73 %
BIO
2.03 %
OTHERS
12.45 %

3
BANK O
F A
FRIC
A G
roup
ANNUAL REPORT 2
016
BENIN 17.3 %
BURKINA FASO 12.9 %
COTE D'IVOIRE 11.2 %
SENEGAL 9.4 %
MALI 9.3 %
NIGER 5.2 %
TOGO 2.1 %
MADAGASCAR 7.0 %
KENYA 6.1 %
DJIBOUTI 6.0 %
TANZANIA 3.2 %
GHANA 3.0 %
BURUNDI 2.2 %
UGANDA 2.1 %
DRC 2.1 %
FRANCE 0.7 %
WAEMU67.5 %
NonWAEMU32.5 %
Breakdown of Assets per Country
Consolidated key figures of BANK OF AFRICA
EUR millions 2015 2016 VariationTOTAL ASSET 7,201 7,813 8.5%LOANS 3,505 3,816 8.9%DEPOSITS 4,683 5,012 7.0%NET OPERATING INCOME 440 470 6.8%NET INCOME GROUP SHARE 56,2 67,4 20.0%COST TO INCOME RATIO (OPERATING EXPENSES / NET OPERATING INCOME) 61.7% 61.4%COST OF RISK 2.17% 1.76%ROE (NET INCOME GROUP SHARE /AVERAGE EQUITY GROUP SHARE) 13.7% 13.8%ROA (NET INCOME GROUP SHARE / AVERAGE ASSET) 0.8% 0.9%CAPITAL ADEQUACY RATIO (ESTIMATIONS)
RISK WEIGHTED ASSET (*) 4,340 4,804 10.7%
TIER 1 + TIER 2 (**) 499 558 11.9%
CAPITAL ADEQUACY RATIO 11.5% 11.6%
(*) Risk Weighted Asset: 20 % of interbank assets + 100% of loans & advances to customers + 100 % of Fixed assets(**) Tier 1 estimated: Share Capital + Share premium + Group’s share of Reserves + Retained earnings + Group’s share of Net Profit
Tier 2 estimated: Subordinated debts + Provisions
Banking network*
4
ANNUAL REPORT 2
016
BANK O
F A
FRIC
A G
roup
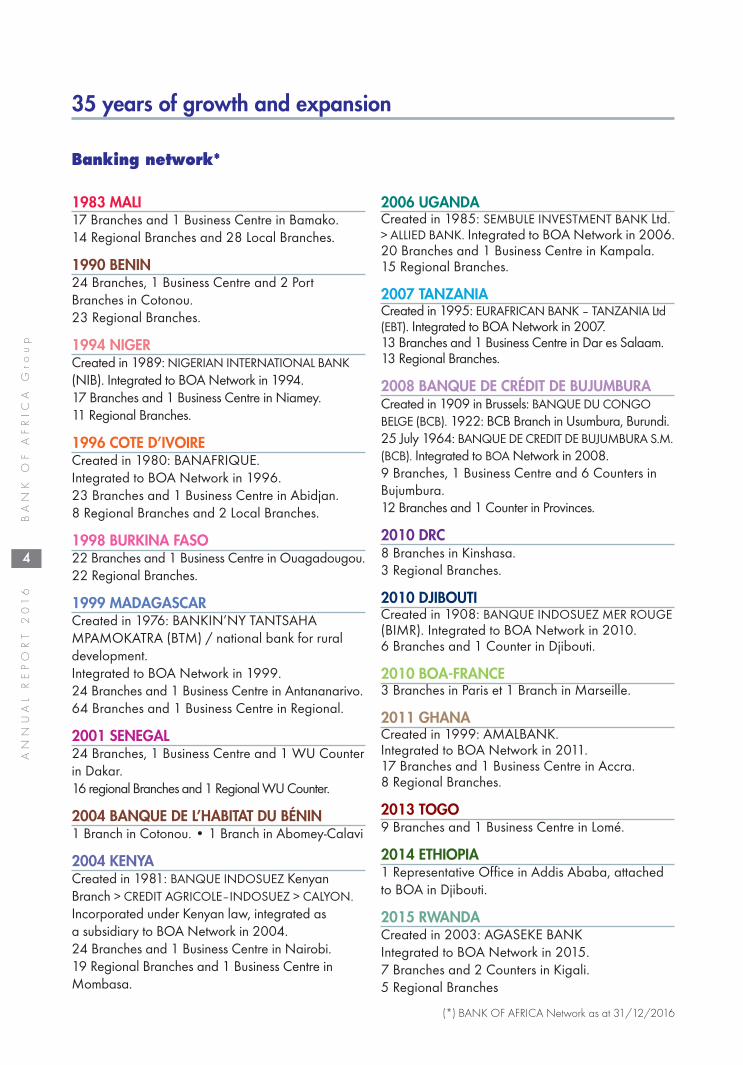
35 years of growth and expansion
1983 MALI17 Branches and 1 Business Centre in Bamako.14 Regional Branches and 28 Local Branches.
1990 BENIN24 Branches, 1 Business Centre and 2 PortBranches in Cotonou.23 Regional Branches.
1994 NIGERCreated in 1989: NIGERIAN INTERNATIONAL BANK(NIB). Integrated to BOA Network in 1994.17 Branches and 1 Business Centre in Niamey.11 Regional Branches.
1996 COTE D’IVOIRECreated in 1980: BANAFRIQUE.Integrated to BOA Network in 1996.23 Branches and 1 Business Centre in Abidjan.8 Regional Branches and 2 Local Branches.
1998 BURKINA FASO22 Branches and 1 Business Centre in Ouagadougou.22 Regional Branches.
1999 MADAGASCARCreated in 1976: BANKIN’NY TANTSAHAMPAMOKATRA (BTM) / national bank for ruraldevelopment.Integrated to BOA Network in 1999.24 Branches and 1 Business Centre in Antananarivo.64 Branches and 1 Business Centre in Regional.
2001 SENEGAL24 Branches, 1 Business Centre and 1 WU Counterin Dakar.16 regional Branches and 1 Regional WU Counter.
2004 BANQUE DE L’HABITAT DU BÉNIN1 Branch in Cotonou. • 1 Branch in Abomey-Calavi
2004 KENYACreated in 1981: BANQUE INDOSUEZ KenyanBranch > CREDIT AGRICOLE–INDOSUEZ > CALYON.Incorporated under Kenyan law, integrated asa subsidiary to BOA Network in 2004.24 Branches and 1 Business Centre in Nairobi.19 Regional Branches and 1 Business Centre inMombasa.
2006 UGANDACreated in 1985: SEMBULE INVESTMENT BANK Ltd.> ALLIED BANK. Integrated to BOA Network in 2006.20 Branches and 1 Business Centre in Kampala.15 Regional Branches.
2007 TANZANIACreated in 1995: EURAFRICAN BANK – TANZANIA Ltd(EBT). Integrated to BOA Network in 2007.13 Branches and 1 Business Centre in Dar es Salaam.13 Regional Branches.
2008 BANQUE DE CRÉDIT DE BUJUMBURACreated in 1909 in Brussels: BANQUE DU CONGOBELGE (BCB). 1922: BCB Branch in Usumbura, Burundi.25 July 1964: BANQUE DE CREDIT DE BUJUMBURA S.M.(BCB). Integrated to BOANetwork in 2008.9 Branches, 1 Business Centre and 6 Counters inBujumbura.12 Branches and 1 Counter in Provinces.
2010 DRC8 Branches in Kinshasa.3 Regional Branches.
2010 DJIBOUTICreated in 1908: BANQUE INDOSUEZ MER ROUGE(BIMR). Integrated to BOA Network in 2010.6 Branches and 1 Counter in Djibouti.
2010 BOA-FRANCE3 Branches in Paris et 1 Branch in Marseille.
2011 GHANACreated in 1999: AMALBANK.Integrated to BOA Network in 2011.17 Branches and 1 Business Centre in Accra.8 Regional Branches.
2013 TOGO9 Branches and 1 Business Centre in Lomé.
2014 ETHIOPIA1 Representative Office in Addis Ababa, attachedto BOA in Djibouti.
2015 RWANDACreated in 2003: AGASEKE BANKIntegrated to BOA Network in 2015.7 Branches and 2 Counters in Kigali.5 Regional Branches
(*) BANK OF AFRICA Network as at 31/12/2016

5
BANK O
F A
FRIC
A G
roup
ANNUAL REPORT 2
016
Non-banking subsidiaries*
2002 AÏSSA (IT company)Head Office in Cotonou.
2002 AGORA (Investment company)Head Office in Abidjan.
2004 ATTICA (Investment company)Head Office in Abidjan.
BOA SERVICES (Banking services company)Head Office in Dakar.
Other entities
1999 BANK OF AFRICA FOUNDATIONPresent in many countries where the Group operates.
2000 BANK OF AFRICA GROUP EIGRepresentative Office of the Group in Paris, France.
Group presence
(*) Representative Offices
France
Djibouti
Addis Ababa*
Uganda
Kenya
Rwanda
Tanzania
Burundi
Madagascar
Niger
Mali
Senegal
Burkina Faso
Cote d’Ivoire
Ghana
Togo
Benin
DRC
6
ANNUAL REPORT 2
016
BANK O
F A
FRIC
A G
roup
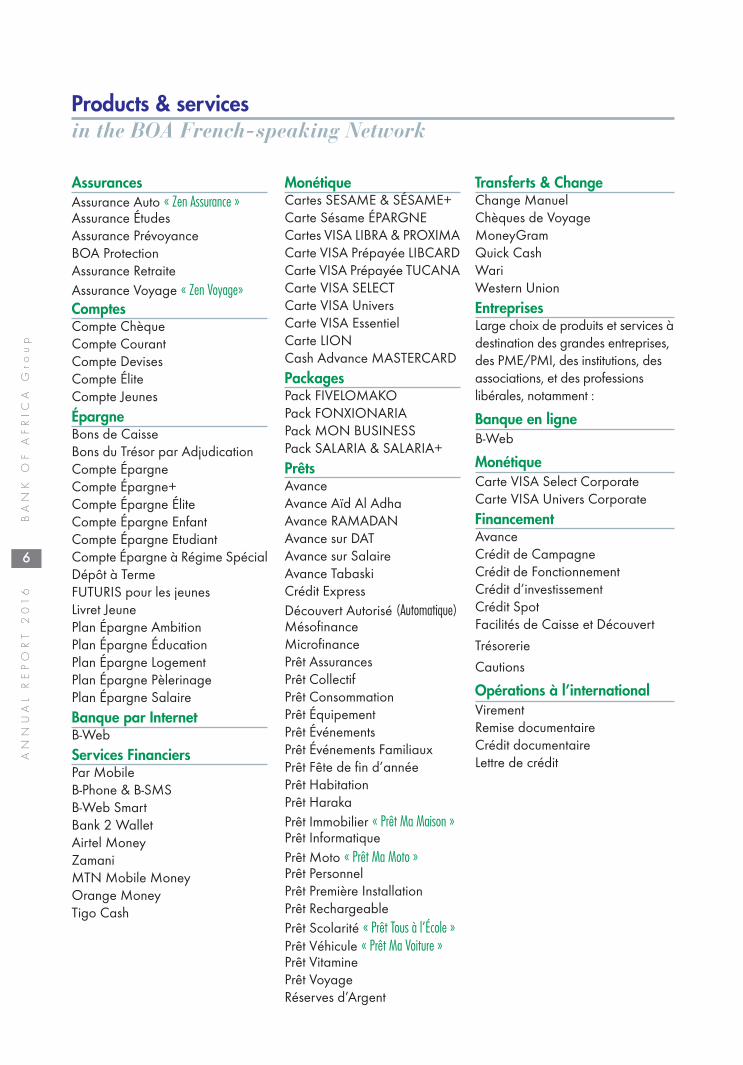
Products & servicesin the BOA French-speaking Network
AssurancesAssurance Auto « Zen Assurance »Assurance ÉtudesAssurance PrévoyanceBOA ProtectionAssurance RetraiteAssurance Voyage « Zen Voyage»ComptesCompte ChèqueCompte CourantCompte DevisesCompte ÉliteCompte JeunesÉpargneBons de CaisseBons du Trésor par AdjudicationCompte ÉpargneCompte Épargne+Compte Épargne ÉliteCompte Épargne EnfantCompte Épargne EtudiantCompte Épargne à Régime SpécialDépôt à TermeFUTURIS pour les jeunesLivret JeunePlan Épargne AmbitionPlan Épargne ÉducationPlan Épargne LogementPlan Épargne PèlerinagePlan Épargne SalaireBanque par InternetB-WebServices FinanciersPar MobileB-Phone & B-SMSB-Web SmartBank 2 WalletAirtel MoneyZamaniMTN Mobile MoneyOrange MoneyTigo Cash
MonétiqueCartes SESAME & SÉSAME+Carte Sésame ÉPARGNECartes VISA LIBRA & PROXIMACarte VISA Prépayée LIBCARDCarte VISA Prépayée TUCANACarte VISA SELECTCarte VISA UniversCarte VISA EssentielCarte LIONCash Advance MASTERCARDPackagesPack FIVELOMAKOPack FONXIONARIAPack MON BUSINESSPack SALARIA & SALARIA+PrêtsAvanceAvance Aïd Al AdhaAvance RAMADANAvance sur DATAvance sur SalaireAvance TabaskiCrédit ExpressDécouvert Autorisé (Automatique)MésofinanceMicrofinancePrêt AssurancesPrêt CollectifPrêt ConsommationPrêt ÉquipementPrêt Événements Prêt Événements FamiliauxPrêt Fête de fin d’annéePrêt HabitationPrêt HarakaPrêt Immobilier « Prêt Ma Maison »Prêt InformatiquePrêt Moto « Prêt Ma Moto »Prêt PersonnelPrêt Première InstallationPrêt RechargeablePrêt Scolarité « Prêt Tous à l’École »Prêt Véhicule « Prêt Ma Voiture »Prêt VitaminePrêt VoyageRéserves d’Argent
Transferts & ChangeChange ManuelChèques de VoyageMoneyGramQuick CashWariWestern UnionEntreprisesLarge choix de produits et services àdestination des grandes entreprises,des PME/PMI, des institutions, desassociations, et des professionslibérales, notamment :
Banque en ligneB-Web
MonétiqueCarte VISA Select CorporateCarte VISA Univers CorporateFinancementAvanceCrédit de CampagneCrédit de FonctionnementCrédit d’investissementCrédit SpotFacilités de Caisse et Découvert
Trésorerie
Cautions
Opérations à l’internationalVirementRemise documentaireCrédit documentaireLettre de crédit

7
BANK O
F A
FRIC
A G
roup
ANNUAL REPORT 2
016
Products & services in the BOA English-speaking Network
AccountsBusiness Current AccountCollection Current AccountElite Current AccountEmbassy NGO Current AccountEmbassy Staff Current AccountExecutive Current AccountGoodwill AccountMwanariadha AccountPay as you Go – IndividualPay as you Go - BusinessPersonal Current AccountRemunerated Current AccountSalary AccountSingle Fee Business CurrentAccountSingle Fee Salary AccountKids & Teen AccountStudents’ AccountTrust AccountWakili Current AccountInvestment ProductsAmbitions / Ambitious Savings PlanCall Deposits AccountChama AccountChildren Savings AccountEro Savings AccountExecutive Savings AccountFamily Savings AccountFixed Deposit AccountForexave AccountGold Plus AccountGroup Savings Account ‘VLSA’Investment Club AccountOrdinary Savings AccountPremium Plus AccountReward Savings AccountSchool Fees Collection AccountStudent AccountTerm DepositTreasury BillsVuna AccountElectronic bankingB-WebE-StatementE-tax Payments
Electronic Tuition PaymentsElectronic Utility Bill PaymentsSESAME ATM CardVISA LIBRA CardVISA Prepaid TOUCAN CardVISA PROXIMA CardMobile Financial ServicesAirtel MoneyBANK OF AFRICA MobileWalletB-Mobile, B-Phone & B-SMSB-Web SmartE-ChamaM-Pesa & Tigo PesaMTN Mobile MoneySMS AlertPacksEMPLOYEE PackMY BUSINESS PackPUBLIC SERVICE PackLoansBridging OverdraftHome FinanceInstant CashInsurance Premium FinanceMortgage FinanceMotor Cycle & Motor VehicleLoansOverdraft & TemporateOverdraftPersonal & Personal MotorLoansProject FinacingSalary AdvanceScheme LoanSchool Fees LoanTransfers& Foreign ExchangeForeign ExchangeForward ContractsMoneyGramOceanic Transfert PaymentPayment OrdersTravellers ChequesWariWestern Union
Other Products & ServicesBancassuranceBanker’s ChequeCustodial ServicesUtility Bill Payments
Company ServicesThe Network also offers a widerange of products and services to:Corporates, SMEs, Organizations,Institutions and Professionals. Theseinclude :Credit FacilitiesAsset FinancingCommercial MortgageContract FinancingInvoice & Certificate DiscountingLand Title Loan Lease FinancingOverdraftsSME Proposition LoansRenewable Energy and EnergyEfficiency FinancingTerm LoanWarehouse Receipt FinancingE-BankingB-WebPayment Collection System Salary Payment Processing System(SPPS)Implant TellersInvestment & Treasury ServicesCash & Spot TransactionsCurrency ForwardsCurrency SwapsCustodial Services
Trade FinanceBills for CollectionGuarantees and BondsLetters of Credit Tax LoanTrade Export LoanTrade Import Loan

8
ANNUAL REPORT 2
016
BANK O
F A
FRIC
A G
roup
2016 saw the achievement of honourable results, as evidenced by a net profit risingabove the 100 million euro mark for the first time in the Group's history, representingdouble-digit growth from the previous year.
This performance augurs well for the success of the new Three-Year DevelopmentPlan 2016-2018.
In a contrasting and particularly difficult situation in some of the countries in whichwe operate, the BANK OF AFRICA Group has demonstrated resilience andadaptability in meeting its challenges, at the same time as reaffirming the solidity ofits fundamentals.
This adaptability serves as a bulwark against circumstancial turmoil, and in helpingmeet the requirements of our increasingly demanding three million customers in the17 countries in sub-Saharan Africa, to whom we offer services integrating the mostappropriate technological advances for the African banking landscape.
The strength of our Group lies in its 6,000 employees who are the pride of theBANK OF AFRICA network and who put their professionalism, commitment andexperience at its service on a daily basis.
The same pride is shared by all the other employees of the expanded 'BMCE Bankof Africa' Group, operating, besides Morocco, across several other countries aroundthe world in North Africa, Europe, Asia and even America.
The virtuous circle in which BANK OF AFRICA is fully engaged is supported, as itis each year, by its main shareholder, BMCE Bank, with its Chairman, Mr. OthmanBenjelloun, at the helm. The Bank instils a culture of excellence and sense ofbelonging within a genuinely African, multinational and plural group.
Message from the Chairmanof BOA GROUP S.A.

9
BANK O
F A
FRIC
A G
roup
ANNUAL REPORT 2
016
At the same time, the BANK OF AFRICA Group is united around strong values that underpin itsDNA, including social responsibility, care and respect for all stakeholders in our banking institutions,whether internal or external, public or private.
All these attributes strengthen BANK OF AFRICA in its primary role of driving forward the emergenceof the continent and as an effective contributor to its economic and social development: economicallyviable, ecologically responsible development across the many regions and peoples of Africa.
Brahim BENJELLOUN-TOUIMIBOA GROUP S.A. Chairman

Economicdownturn andPoliticaluncertaintiesperiod
10
ANNUAL REPORT 2
016
BANK O
F A
FRIC
A G
roup
Dear Shareholders
Year 2016 has been characterized by slowdown of the economic growth in Sub-saharian Africa with an average GDP growth of 1,4%, last two decades low. Alloil exporters countries were in recession while natural resources countries werestill suffering from low commodities prices.
Regarding Countries where our Group, Bank of Africa is operating, we willhighlight the followings:
- Kenya has been hit by severe drought with significant impact on economicgrowth as well as low to medium class prurchasing power; adding to that anew banking regulation on interest rate capping led by politics, that had asevere effect on the banking industry : loans slowdown (10 years low growth3%), non performing loans up 30%, SME excluded from Banking system,Profitability plunging, Banks downsizing balance sheets…
- Democratic Republic of Congo, after unexpected Presidential electionpostponed, weak governance, country weak economic fundamentals withhigh inflation of 19%, domestic currency depreciated by 33% vs USD;
- Burkina, Benin, Niger, Ghana, Uganda and Djibouti had allpresidential election with all political uncertainties before election that freezeall investments and economic activities…
- Neighboring countries to Nigeria suffers and still suffering from thesignificant drop in economic trade with this great country hit by economicrecession;
- Madagascar, a new foreign exchange regulation hit severely the BankingFX revenues by 50%.
Message from the CEOBOA GROUP
© Stéphane Tourné - BOA
11
BANK O
F A
FRIC
A G
roup
ANNUAL REPORT 2
016
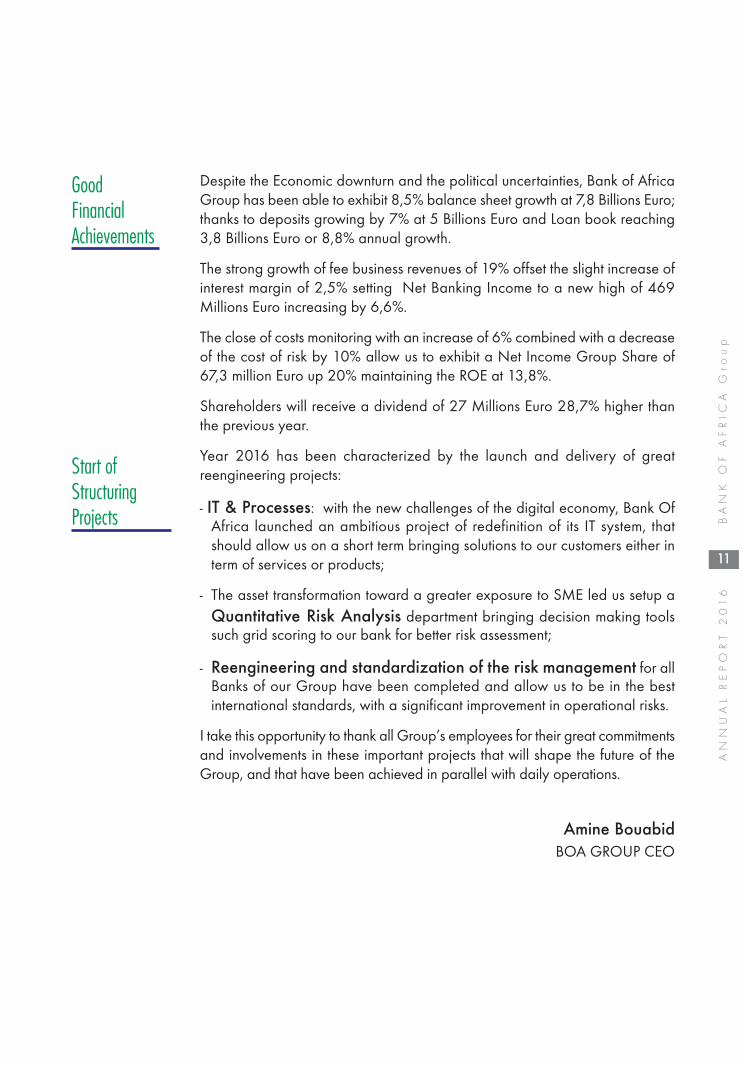
Despite the Economic downturn and the political uncertainties, Bank of AfricaGroup has been able to exhibit 8,5% balance sheet growth at 7,8 Billions Euro;thanks to deposits growing by 7% at 5 Billions Euro and Loan book reaching3,8 Billions Euro or 8,8% annual growth.
The strong growth of fee business revenues of 19% offset the slight increase ofinterest margin of 2,5% setting Net Banking Income to a new high of 469Millions Euro increasing by 6,6%.
The close of costs monitoring with an increase of 6% combined with a decreaseof the cost of risk by 10% allow us to exhibit a Net Income Group Share of67,3 million Euro up 20% maintaining the ROE at 13,8%.
Shareholders will receive a dividend of 27 Millions Euro 28,7% higher thanthe previous year.
Year 2016 has been characterized by the launch and delivery of greatreengineering projects:
- IT & Processes: with the new challenges of the digital economy, Bank OfAfrica launched an ambitious project of redefinition of its IT system, thatshould allow us on a short term bringing solutions to our customers either interm of services or products;
- The asset transformation toward a greater exposure to SME led us setup aQuantitative Risk Analysis department bringing decision making toolssuch grid scoring to our bank for better risk assessment;
- Reengineering and standardization of the risk management for allBanks of our Group have been completed and allow us to be in the bestinternational standards, with a significant improvement in operational risks.
I take this opportunity to thank all Group’s employees for their great commitmentsand involvements in these important projects that will shape the future of theGroup, and that have been achieved in parallel with daily operations.
Amine BouabidBOA GROUP CEO
Start ofStructuringProjects
GoodFinancialAchievements

12
ANNUAL REPORT 2
016
BANK O
F A
FRIC
A G
roup
Despite the external environments and economies in the countries where weare operating, and the internal organisational and technological developmentsthat took place this year, it is worth mentioning that BANK OF AFRICA Group’s2016 good financial results are first and foremost a consequence of itscommercial activities.
Although our Group’s commercial performance has followed the same upwardtrend for a decade, this performance was particularly significant and evenimpressive in 2016.
Between 2015 and 2016, we registered (or opened) more than 450,000 newaccounts. We improved our global equipment rate by 6%, while deposits grewby nearly €350 million, representing an increase of more than 7% over the year.
I particularly want to highlight how these figures reflect a structural trend, andare the result of a system imbedded in the framework of our activities.
In the past ten years, the number of accounts held by our banks was multipliedby almost seven. Our equipment rate, a new concept that was unknown adecade ago, rose from 0% to 66%. Our deposits, which were roughly at €1billion in 1996, increased by more than fivefold.
Naturally, these results should be a source of great pride for all the BANK OFAFRICA workforce. They are the consequence of strategic choices made nearlyten years ago, choices which have been strongly supported by the Group'semployees.
Within a few years, we have established at the heart of BANK OF AFRICA’soperations, which were already robust and effective, a powerful commercialorganisation that has structured the Group’s development and significantlypositively impacted the relationship with our customers.
Message from the Deputy Managing Director BOA GROUP S.A.
Remarkableperformances.
Compellingperformances.

13
BANK O
F A
FRIC
A G
roup
ANNUAL REPORT 2
016
Now, we must go even further in our efforts to attract new customers, andespecially focus on how to support them in their daily life. This determinationis reflected in our new 2016-2018 IT Master Plan, which is designed todigitalise our working practices, while maintaining our primary goal of makingour customers’ lives easier through concrete, practical and innovative solutions.
This digital transformation is one of our main motivations to achieve ourcommercial goals, for at least two reasons. The first one is that we need to fundthis technological change, which will require major financial, organisationaland human investments.
The second one is that we must lead this process of transformation, which willbe long, progressive and involves several aspects, while maintaining a provensolid model, and continuing to focus on the quality of customer relations, whichhas always been our strength.
I am therefore particularly delighted to announce these results, not onlybecause they demonstrate our commercial effectiveness and the relevance ofour strategy, but also because they form the basis of our future.
With this in mind, I wish to thank the thousands of women and men who helpus in achieving these results every day, and encourage them to continue alltogether in this momentum.
Abderrazzak ZebdaniDeputy Managing Director.
14
ANNUAL REPORT 2
016
BANK O
F A
FRIC
A G
roup
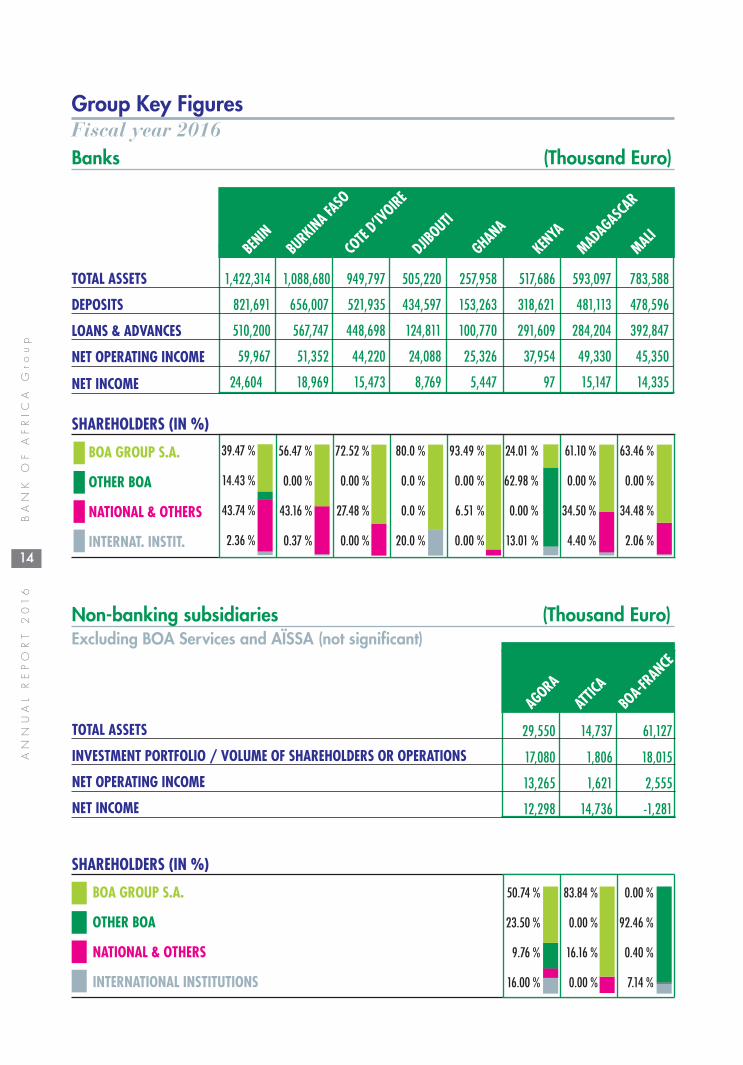
Group Key FiguresFiscal year 2016
SHAREHOLDERS (IN %)
Non-banking subsidiaries (Thousand Euro)Excluding BOA Services and AÏSSA (not significant)
TOTAL ASSETS
DEPOSITS
LOANS & ADVANCES
NET OPERATING INCOME
NET INCOME
TOTAL ASSETS
INVESTMENT PORTFOLIO / VOLUME OF SHAREHOLDERS OR OPERATIONS
NET OPERATING INCOME
NET INCOME
BENIN
BURKINA FASO
COTE D’IVOIRE
AGORA
ATTICA
BOA-FRANCE
DJIBOUTI
GHANA
KENYA
MADAGASCAR
BOA GROUP S.A.
OTHER BOA
NATIONAL & OTHERS
INTERNAT. INSTIT.
BOA GROUP S.A.
OTHER BOA
NATIONAL & OTHERS
INTERNATIONAL INSTITUTIONS
1,422,314 1,088,680 949,797 505,220 257,958 517,686 593,097 783,588
821,691 656,007 521,935 434,597 153,263 318,621 481,113 478,596
510,200 567,747 448,698 124,811 100,770 291,609 284,204 392,847
59,967 51,352 44,220 24,088 25,326 37,954 49,330 45,350
24,604 18,969 15,473 8,769 5,447 97 15,147 14,335
56.47 %
0.00 %
43.16 %
0.37 %
72.52 %
0.00 %
27.48 %
0.00 %
80.0 %
0.0 %
0.0 %
20.0 %
24.01 %
62.98 %
0.00 %
13.01 %
93.49 %
0.00 %
6.51 %
0.00 %
61.10 %
0.00 %
34.50 %
4.40 %
63.46 %
0.00 %
34.48 %
2.06 %
50.74 %
23.50 %
9.76 %
16.00 %
83.84 %
0.00 %
16.16 %
0.00 %
0.00 %
92.46 %
0.40 %
7.14 %
29,550 14,737 61,127
17,080 1,806 18,015
13,265 1,621 2,555
12,298 14,736 -1,281
39.47 %
14.43 %
43.74 %
2.36 %
SHAREHOLDERS (IN %)
Banks (Thousand Euro)
MALI

15
BANK O
F A
FRIC
A G
roup
ANNUAL REPORT 2
016
Exculding restatement of intra-group operations carried out within the consolidated accounts
NIGER
DRC
SENEGAL
TANZANIA
TOGO
UGANDA
BCB
BHB
RWANDA
59.1 %
0.4 %
33.6 %
6.9 %
65.0 %
0.0 %
0.0 %
35.0 %
61.8 %
0.0 %
38.2 %
0.0 %
25.9 %
48.0 %
5.2 %
20.8 %
94.4 %
0.0 %
5.6 %
0.0 %
38.0 %
43.2 %
7.8 %
11.0 %
20.2 %
0.0 %
45.0 %
34.8 %
58.4 %
31.1 %
10.6 %
0.0 %
90.0 %
0.0 %
10.0 %
0.0 %
(Thousand Euro)
437,131 175,261 795,366 273,279 178,389 180,878 182,855 34,738 19,354
221,558 93,523 486,003 171,054 49,576 126,156 144,493 29,115 10,974
250,376 131,148 358,847 141,173 84,404 77,042 64,094 26,681 9,583
29,098 17,578 33,514 20,678 5,433 20,666 17,930 2,131 1,989
10,062 1,389 6,176 1,602 -1,600 3,189 4,092 -6,416 -652
Synthesis of banks aggregated figures (Thousand Euro)
VariationTOTAL ASSETS 8,395,592 7.3 %DEPOSITS 5,198,275 7.2 %LOANS & ADVANCES 3,864,234 9.2 %OPERATING INCOME 486,604 7.3 %NET INCOME 120,682 22.1 %

16
ANNUAL REPORT 2
016
BANK O
F A
FRIC
A G
roup
Managing Directorsof the BOA Banking Network as at 31/12/ 2016
BeninFaustin AMOUSSOU
KenyaRonald MARAMBII
MadagascarOthmane ALAOUI
MaliAbdallah IKCHED
NigerSadio CISSE
UgandaArthur ISIKO
DRCAlain CHAPUIS
RwandaAbderrahmane BELBACHIR
SenegalMamadou Igor DIARRA
TanzaniaAmmishaddai OWUSU-AMOAH
TogoToubi REDOUANE
Burundi (BCB)Tharcisse RUTUMO
Benin (BHB)Mamadou M’BENGUE
Burkina FasoSébastien TONI
Cote d’ivoireAbdelali NADIFI
GhanaKobby ANDAH
© BOA - G Akoum - Haidara - Ralphotography - E. Legouhy
TanzaniaAmbassador Mwanaidi SINARE MAAJAR
RwandaLouis RUGERINYANYE
17
BANK O
F A
FRIC
A G
roup
ANNUAL REPORT 2
016
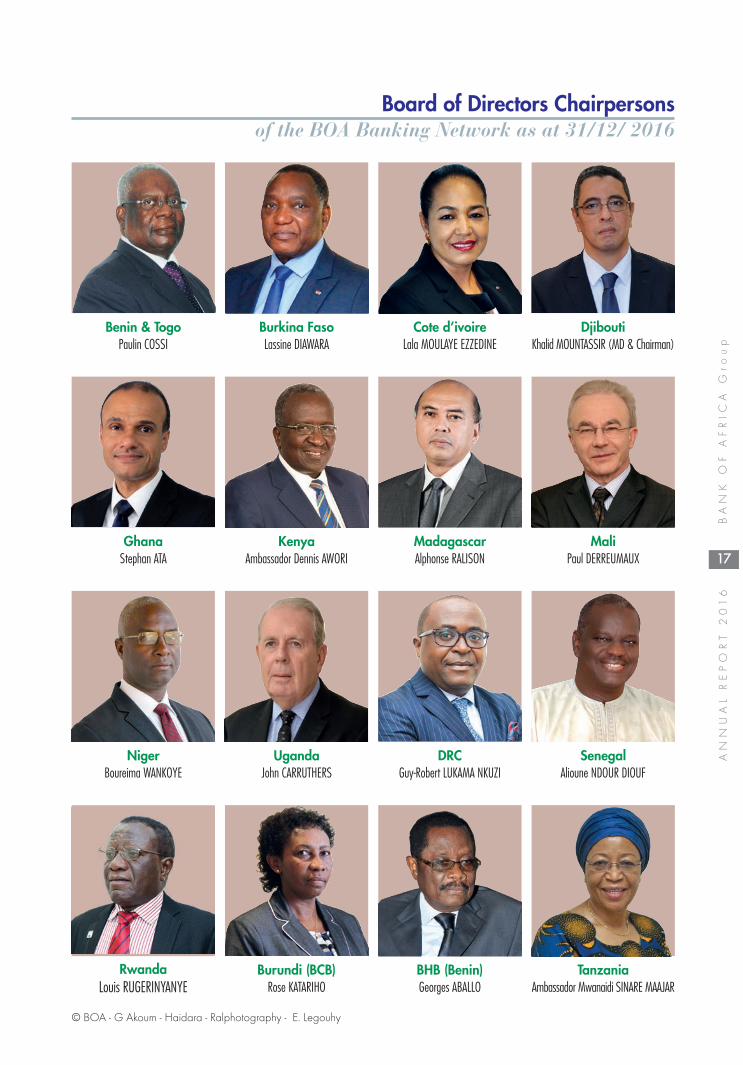
Board of Directors Chairpersons of the BOA Banking Network as at 31/12/ 2016
Benin & TogoPaulin COSSI
GhanaStephan ATA
KenyaAmbassador Dennis AWORI
MadagascarAlphonse RALISON
MaliPaul DERREUMAUX
NigerBoureima WANKOYE
UgandaJohn CARRUTHERS
DRCGuy-Robert LUKAMA NKUZI
SenegalAlioune NDOUR DIOUF
Burundi (BCB)Rose KATARIHO
BHB (Benin)Georges ABALLO
Burkina FasoLassine DIAWARA
Cote d’ivoireLala MOULAYE EZZEDINE
DjiboutiKhalid MOUNTASSIR (MD & Chairman)
© BOA - G Akoum - Haidara - Ralphotography - E. Legouhy

18
ANNUAL REPORT 2
016
BANK O
F A
FRIC
A G
roup
History of the BANK OF AFRICA GroupSince the creation of the Group until today
Launch 1982 / 1990
It started out as a pioneering project to create an African bank that is independent of major internationalgroups, and founded thanks to private and well diversified African share capital.
After BANK OF AFRICA - MALI was established in 1982, a holding structure was set up in 1988, calledAFRICAN FINANCIAL HOLDING (AFH), which later became BOA GROUP S.A.
This led to establishing BANK OF AFRICA - BENIN in 1989 and its reference shareholder, a subsidiary thatis now the leader in its country.
Expansion 1991 / 1998
The “BANK OF AFRICA” concept, based on the balance of a diversified shareholder structure and ona singlestrategy, was then fine-tuned, developed and consolidated. Simultaneously, the decision was made to expandthroughout the West African Economic and Monetary Union (WAEMU), based on its basic principles of asingle brand and a standardised organisational set-up. Three new BANK OF AFRICA subsidiaries wereestablished: in Niger in 1994, in Côte d’Ivoire in 1996 and in Burkina Faso in 1998.
The Group’s Corporate Structures began to be built, with their organisational and supervisory roles.
Diversification 1999 / 2010
This determination to diversify, driven by growth objectives, manifested itself at three distinct andcomplementary levels: 1) to be upgraded from a loose group of banks to a real group structure; 2) to shiftfrom purely commercial banking activities towards a greater focus on bank intermediation, asset management,and insurance, in order to create a diversified financial group able to offer a full range of products andfinancial services; and 3) to expand into other parts of sub-Saharan Africa, including English-speakingcountries.
During this period, seven new BANK OF AFRICA subsidiaries were added, in Madagascar in 1999, inSenegal in 2001, in Kenya in 2004, in Uganda in 2006, in Tanzania in 2007, in Burundi in 2008, and inthe Democratic Republic of Congo and Djibouti in 2010, not to mention the establishment of an investmentfirm operating on behalf of the entire group, a finance company in France dedicated to the African diaspora,a bank specialised in mortgage lending in Benin, and a significant stake in a major insurance company.
Since it was founded in Mali in 1982,the Group has expanded in four broad stages,
each one corresponding to a specific development.

19
BANK O
F A
FRIC
A G
roup
ANNUAL REPORT 2
016
Creation of an institution started from 2010
This strategy also requires developing the Group’s resources, financial in particular, which is why the Groupdecided as far back as 2005 to find a banking partner able to both enhance its financial means and enrichits human and operational resources.
This alliance was born on 25 February 2008, with a 35% increase in the capital of BOA GROUP S.A., asthe AFH holding structure was then named, reserved exclusively for BMCE Bank, which thus became ashareholder of BANK OF AFRICA Group.
This significant capital increase, as well as the appointment of a Deputy Managing Director from BMCEBank, provided the means for greater ambitions by helping to expand each of the BANK OF AFRICA entitiesand facilitating geographical and sector-based expansion projects.
On 31 December 2009, BOA GROUP’s share capital amounted to about 40.3 million euros, of which BMCEBank owned 42.5%, and collaboration between the two Groups unfolded as originally envisioned, in a spiritof dialogue and complementarity.
In 2010 the alliance between BOA and BMCE Bank was consolidated:
– the Moroccan bank’s acquisition of a majority equity stake in BOA GROUP S.A., the BANK OF AFRICAGroup’s holding company, and raising that stake from 55.77% at the end of 2010 to 65.23% at theend of 2012;
– a 10.1 million euro capital increase by BOA GROUP S.A., from 40.3 million to 50.4 million euros,through the issue of 65,077 new shares, and the change in BOA GROUP’s Chairman and CEO,effective 1 January 2011.
Meeting session of the Managing Commitee in Dakar

20
ANNUAL REPORT 2
016
BANK O
F A
FRIC
A G
roup
The Group today
Today, the BANK OF AFRICA Group continues to reinforce its equity and financial structure. Itis modernising and upgrading its institutional profile, while continuing to expand –geographically, through the establishment of BANK OF AFRICA - GHANA in 2011, BANK OFAFRICA - TOGO in 2013, and BANK OF AFRICA – MER ROUGE Representative Office inEthiopia in 2014, and by sector, with the opening of 16 Business Centres (as at 31 December2016) dedicated exclusively to our corporate customers and the official opening of BANK OFAFRICA – RWANDA at the end of 2016.
Our focus now is on further expansion and on making sure that BOA remains a big sustainable transafricangroup, based on five strategic pillars:
– Boost its involvement in financing the economy, for retail customers and companies of all sizesand comprising major private or public projects. However, emphasis will be put on SME.
– Increase its risk control, both for financial and operational risks, whilst developing, reinforcing andfostering a risk management culture.
– Better control its financial and operational expenses, with a view to optimising its operations.
– Pursue targeted external growth, in a prudent and judicious way, as part of a balanceddevelopment process.
– Pursue the development of synergies with BMCE Bank of Africa, exploiting the manypossibilities offered by our majority shareholder, whose ownership of BOA GROUP stands at about73% as at 31 December 2016.
Directors’ Meetings in Marrakech - Marocco

21
BANK O
F A
FRIC
A G
roup
ANNUAL REPORT 2
016
The BANK OF AFRICA Group adheres to the strategy that is it fine-tuned and that has served it well since 35years, while maintaining the values and points of reference that have constantly driven its activities:
– professionalism and rigor;
– proximity to customers and involvement in national development;
– promotion of Africans, whether they are employees, shareholders, clients or partners.
The development of BANK OF AFRICA Group Banksover the past five years is outlined hereinafter
Inauguration of BANK OF AFRICA - RWANDA
Inauguration of the Business Centre of Ouagadougou in Burkina Faso

22
ANNUAL REPORT 2
016
BANK O
F A
FRIC
A G
roup
The development of BOA Group Banks(in thousands of Euros)
BENIN
BURKINA FASO
COTE D’IVOIRE
DJIBOUTI
GHANA
KENYA
MADAGASCAR
NIGER
MALI
941,93
398
8,52
11,17
8,74
61,29
6,61
61,42
2,31
4
530,72
163
1,18
075
7,88
71,00
1,28
01,08
8,68
0
413,64
254
1,31
574
8,90
092
5,57
694
9,79
7
278,52
429
2,35
933
6,86
746
8,59
150
5,22
0
228,42
321
1,95
523
7,64
527
6,17
225
7,95
8
431,20
744
2,63
856
4,48
362
2,80
051
7,68
6
495,10
648
1,72
552
1,01
353
1,96
059
3,09
7
326,63
047
5,92
876
5,19
981
6,61
878
3,58
8
286,40
829
3,90
835
5,39
940
0,85
543
7,13
1
12 13 14 15 16 12 13 14 15 16 12 13 14 15 16 12 13 14 15 16 12 13 14 15 16 12 13 14 15 16 12 13 14 15 16 12 13 14 15 16 12 13 14 15 16
610,69
468
5,85
973
3,37
978
7,67
982
1,69
1
399,08
943
7,62
149
3,28
059
7,48
465
6,00
7
311,23
736
1,48
541
8,73
046
0,05
552
1,93
5
244,02
924
5,25
529
1,90
440
8,79
243
4,59
7
146,50
813
4,23
314
1,22
815
0,62
915
3,26
3
309,15
030
8,68
537
8,10
442
6,89
331
8,62
1
405,99
239
1,82
540
9,13
442
2,10
748
1,11
3
245,09
332
7,90
939
5,59
448
8,35
947
8,59
6
170,56
018
3,13
819
0,75
221
8,95
822
1,55
8
12 13 14 15 16 12 13 14 15 16 12 13 14 15 16 12 13 14 15 16 12 13 14 15 16 12 13 14 15 16 12 13 14 15 16 12 13 14 15 16 12 13 14 15 16
340,64
234
1,16
839
8,24
639
9,60
251
0,20
0
292,11
641
6,75
351
9,21
753
2,66
956
7,74
7
230,24
623
6,75
830
6,83
139
4,81
744
8,69
8
66,791
71,494
79,342
112,79
412
4,81
1
122,78
611
1,85
187
,224
93,300
100,77
0
263,19
226
1,22
334
9,00
533
9,79
429
1,60
9
187,27
622
6,30
825
6,24
425
8,36
828
4,20
4
211,63
527
7,09
833
9,35
339
4,24
239
2,84
7
179,21
218
3,84
821
6,28
423
3,57
525
0,37
6
12 13 14 15 16 12 13 14 15 16 12 13 14 15 16 12 13 14 15 16 12 13 14 15 16 12 13 14 15 16 12 13 14 15 16 12 13 14 15 16 12 13 14 15 16
11,931
8,43
618
,202
19,106
24,604
12,068
15,478
15,974
18,337
18,969
4,75
47,70
012
,313
12,561
15,473
3 17
94 12
91 33
16 79
28 76
9
838
-956
7,19
36,62
65,44
7
4,17
36,34
91,30
8-9,
200 97
7,41
47,89
617
,655
15,904
15,147
2,29
53,40
06,13
010
,864
14,335
4,79
35,89
27,76
98,83
510
,062
12 13 14 15 16 12 13 14 15 16 12 13 14 15 16 12 13 14 15 16 12 13 14 15 16 12 13 14 15 16 12 13 14 15 16 12 13 14 15 16 12 13 14 15 16
TO
TAL
AS
SE
TS
DE
PO
SIT
SL
OA
NS
& A
DV
AN
CE
SN
ET
IN
CO
ME

23
BANK O
F A
FRIC
A G
roup
ANNUAL REPORT 2
016
From 2012 to 2016(in thousands of Euros)
RWANDA
DRC
SENEGAL
TANZANIA
TOGO
UGANDA
BCB
BHB
TOTALALL BANKS
19,354
239,08
429
3,24
843
4,61
055
1,67
879
5,36
6
164,38
219
4,94
023
5,71
624
4,82
627
3,27
9
17,974
42,192
132,49
717
8,38
9
125,17
812
3,53
914
7,94
417
1,42
318
0,87
8
135,41
313
5,93
218
4,31
218
3,72
618
2,85
5
44,927
46,424
45,672
42,979
34,738
4,68
5,00
35,23
6,86
76,65
8,94
77,82
4,04
48,39
5,59
2
12 13 14 15 16 12 13 14 15 16 12 13 14 15 16 12 13 14 15 16 12 13 14 15 16 12 13 14 15 16 12 13 14 15 16 12 13 14 15 16
10,974
185,27
816
8,18
722
1,91
131
4,23
448
6,00
3
126,84
613
6,02
714
8,72
314
9,24
017
1,05
4
2,64
719
,523
42,956
49,576
84 010
85 159
101 60
311
8 03
2
126 15
6
114,89
011
5,22
415
5,93
215
1,58
114
4,49
3
27,323
29,697
32,181
30,181
29,115
3,39
5,22
83,63
7,08
14,18
5,26
84,84
7,76
65,19
8,27
5
12 13 14 15 16 12 13 14 15 16 12 13 14 15 16 12 13 14 15 16 12 13 14 15 16 12 13 14 15 16 12 13 14 15 16 12 13 14 15 16
9,58
3
144,33
418
9,75
625
5,89
429
4,45
935
8,84
7
94,796
106,60
013
0,04
013
0,68
114
1,17
3
672
17,728
63,269
84,404
67,357
57,770
71,935
72,083
77,042
75,447
67,548
72,305
73,181
64,094
35,220
35,919
34,946
33,346
26,681
2,33
2,07
42,62
2,84
23,20
5,47
43,53
7,90
53,86
4,23
4
12 13 14 15 16 12 13 14 15 16 12 13 14 15 16 12 13 14 15 16 12 13 14 15 16 12 13 14 15 16 12 13 14 15 16 12 13 14 15 16
653
3,60
44,04
05,14
63,16
96,17
6
1,21
71,68
01,88
42,17
11,60
3
-719
-2,67
7-1,
586
-1,60
0
2,73
1-1,
956
359
141
3,19
0
1,80
995
11,06
62,93
54,09
2
277
199
-636 -77
-6,41
6
58,444
61,695
93,266
98,861
120,68
2
12 13 14 15 16
43,424
65,281
102,36
315
6,44
717
5,26
1
12 13 14 15 16
14,529
24,130
53,290
80,585
93,523
12 13 14 15 16
21,024
38,076
70,880
111,72
313
1,14
8
12 13 14 15 16
-2,63
9-82
4,250
2,28
11,38
9
12 13 14 15 16 12 13 14 15 16 12 13 14 15 16 12 13 14 15 16 12 13 14 15 16 12 13 14 15 16 12 13 14 15 16 12 13 14 15 16
24
ANNUAL REPORT 2
016
BANK O
F A
FRIC
A G
roup
2016 Group Highlights
January Launch of a new IT Master Plan for 2016-2018, an ambitious programme designed in 2016, withimplementation beginning at the start of 2017. This extensive transformation plan involves a complete andthorough modernisation of BOA Group's IT systems.
March
Signature of a partnership agreement with the SAHAM Assurances group for the marketing of two products:ZEN Assurance Auto and ZEN Assurance Voyage.
May
First listing of BANK OF AFRICA – MALI on the Regional Securities Market (BRVM), in Abidjan.
September
Organisation of the 2016 BANK OF AFRICA Directors’ Meetings, in Marrakesh, Morocco.
October
Partnership with seven money transfer companies: Moneygram, Wari, Orange Money, Tigo Cash, Wizall,RIA and JONI JONI.
December
Launch of W|BI, the first WAEMU bond index with BOA Capital.
Signature of a USD 12 million agreement with Agence Française pour le Développement (AFD) to provideloans for the renewable energy and energy efficiency sectors.
Inauguration of 17 branches since January in Benin, Côte d’Ivoire, Djibouti, Ghana, Niger, DRC and Senegal.
Official launch of BANK OF AFRICA – RWANDA, the 17th bank in the BANK OF AFRICA network.

25
BANK O
F A
FRIC
A G
roup
ANNUAL REPORT 2
016
Inauguration of BANK OF AFRICA - RWANDA
Directors’ Meetings in Marrakech, 2016

26
ANNUAL REPORT 2
016
BANK O
F A
FRIC
A G
roup
Deployment of the Group’s new strategy
2016 saw the start of numerous initiatives, the birth of several projects and the implementation of others,evidence of the vitality of a banking group undergoing a continuous process of reflection anddevelopment.
This is indeed a necessary approach in what is a rapidly changing financial world. The boundariesbetween our various activities are constantly changing and our clientele's business requirements arebecoming more complex whilst also being transformed in line with an increasingly varied,competitive and global offer.
Adaptability, agility and reactivity are the key strategies here.
Launch of the Three-Year Development Plan 2016 - 2018
The year under review corresponds to the first year of the Three-Year Development Plan launched in allsubsidiaries of the BANK OF AFRICA Group. The plan is based on two main strategic orientations:
• An increase in the profitability of the loan portfolio by gradually directing our focus towardsthe SME market.
• Defining a target of 12% for ROE (Return on Equity) for banking activity, which includes incomefrom loan activities and commissions, and excludes investment activity.
Special efforts have been made to guide banks in implementing the Three-Year Development Plan. The notionsof the cost of risk/interest rate pairing and Risk Weighted Asset (RWA) margin have thus been widelydisseminated and have now become normal and systematic elements of analysis.
There has also been significant reorganisation at Group level in the areas of risk, fund raising and IT inorder to support the banks in achieving their new objectives.
Deployment of the Quantitative Risk Analysis Department
The new strategy of focussing on SME customers entails even more thorough risk control than previously,this area becoming one of the main challenges for the banks. The Quantitative Risk Analysis Department, setup in late 2015, delivered its first scorecards this year. This tool, which will be rolled out throughout the Group,helps banks industrialise their risk management, particularly for SMEs.
Joint funding effort
The search for long-term funding to support the development of activities forecasted in the Three-YearDevelopment Plan has been pooled at Group level and is no longer at subsidiary level as waspreviously the case. This decision was taken to optimise financing costs and free up resourceswithin banks to focus on their core business.
Implementation of a new performance-based bonus system
A bonus based on the achievement of objectives in the Three-Year Development Plan for eachBank and on individual performances was set up in the course of 2016. This initiative is part of a strategyto increase the proportion of performance-related pay to better motivate individual employees.
27
BANK O
F A
FRIC
A G
roup
ANNUAL REPORT 2
016
IT Master Plan
To help banks meet the many challenges of the Three-Year Development Plan, the Group must make all thetools they need to succeed available to them. Digital transformation has become a must in thebanking sector. For the BANK OF AFRICA Group this mainly takes the form of a modern, efficient andflexible IT system to meet the requirements of all 18 of the Group's banks.
In addition, an ambitious IT Master Plan was designed in 2016 by teams at the Group's CorporateStructures, in close consultation with the banks.
This extensive transformation plan involves a complete and thorough modernisation of the IT systemsof the BANK OF AFRICA's subsidiaries, broken down into 5 main areas.
1. Infrastructure
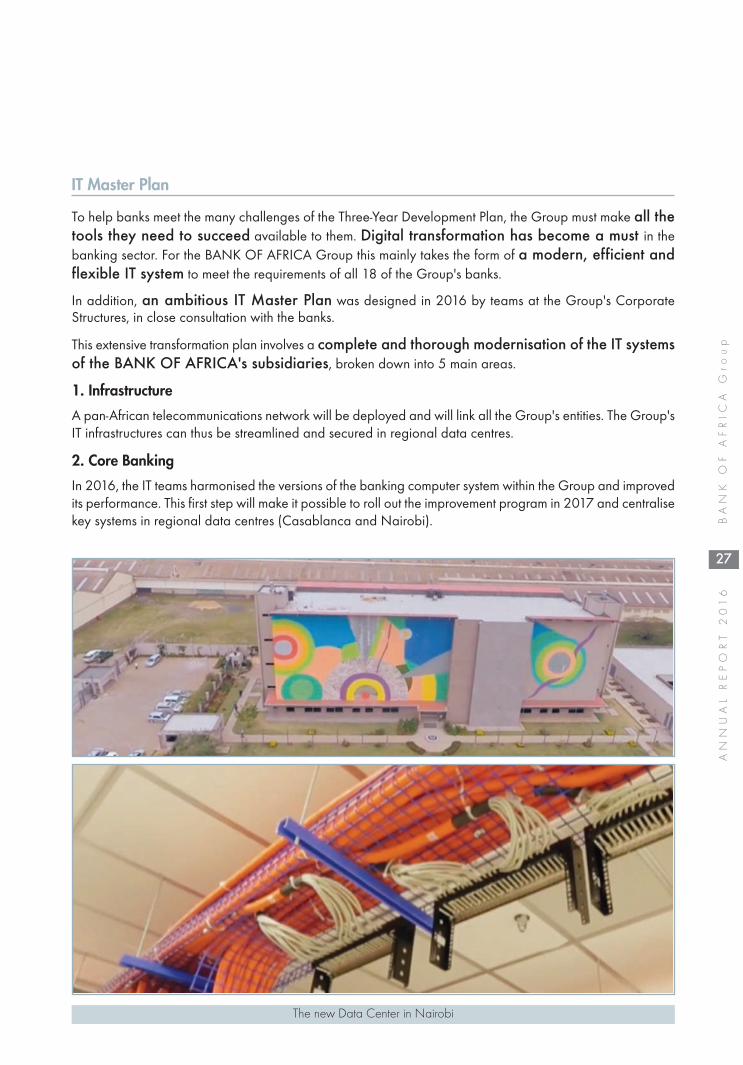
A pan-African telecommunications network will be deployed and will link all the Group's entities. The Group'sIT infrastructures can thus be streamlined and secured in regional data centres.
2. Core Banking
In 2016, the IT teams harmonised the versions of the banking computer system within the Group and improvedits performance. This first step will make it possible to roll out the improvement program in 2017 and centralisekey systems in regional data centres (Casablanca and Nairobi).
The new Data Center in Nairobi

28
ANNUAL REPORT 2
016
BANK O
F A
FRIC
A G
roup
3. New multi-bank information systems (X-banking and Cash)
A new unified application will be set up to manage and develop the electronic payment system and theGroup's digital offering. Furthermore, the organisation and implementation of a new global cash managementsystem will allow practices within all the Group's banks to be unified and secure cash operations.
4. IT Governance
A new project monitoring system has been set up to create specialised regional shared service centres tomeet the needs of the network, increase service quality and reduce costs.
5. Other IT Systems Projects
Finally, quantitative risk assessment tools, which are central components of the Three-Year Development Plan,will be better resourced and debt recovery will become more fluid with various updates to the collection toolalready implemented in the majority of banks.
Launch of W|BI, the first WAEMU bond index, with BOA Capital.
On 14 December 2016 in Dakar, the BANK OF AFRICA and BOA Capital launched the West AfricanEconomic and Monetary Union Bond Index (W|BI), the first WAEMU area bond index.This index was designed with the expertise of BMCE Capital, the BMCE Bank of Africa Group investmentbanking sub-Saharan market specialist, and sponsored by BANK OF AFRICA.
The W|BI is designed to calculate sovereign bond performance on the bond market in the region. Sincebond portfolio managers do not currently have any instrument for measuring their portfolios, this indexresponds to a real need. This new tool should ensure better liquidity on the market and thus help revitalisea secondary market within WAEMU.
02/0
7/14
02/0
8/14
02/0
9/14
02/1
0/14
02/1
1/14
02/1
2/14
02/0
1/15
02/0
2/15
02/0
3/15
02/0
4/15
02/0
5/15
02/0
6/15
02/0
7/15
02/0
8/15
02/0
9/15
02/1
0/15
02/1
1/15
02/1
2/15
02/0
1/16
02/0
2/16
02/0
3/16
02/0
4/16
02/0
5/16
02/0
6/16
02/0
7/16
02/0
8/16
02/0
9/16
02/1
0/16
02/1
1/16
02/1
2/16
02/0
1/17
02/0
2/17
02/0
3/17
02/0
4/17
02/0
5/17
125.00
120.00
115.00
110.00
105.00
100.00
95.00
90.00
• Performance from 02/07/2014 to 21/12/2014, annualised over the year.• Performance up to 30/11/2016, annualised over the year.• Figures as at 30 November 2016

29
BANK O
F A
FRIC
A G
roup
ANNUAL REPORT 2
016
Transformation of the Group's Corporate Structures into a service centre
A vast reorganisation of the Group's Corporate Structures has begun, aimed at better serving thebanks. Following the example of practices in international consulting firms, the various Corporate Structuredepartments have put into place a catalogue of services, some of which are recurrent, others on demand,which are available to banks in the same way as they would be for non-Group companies.
This system has the advantage of offering more transparency in the invoicing of the services provided bythe Corporate Structures to the banks.
Development of insurance products
The BANK OF AFRICA and SAHAM groups signed a partnership agreement to develop the insuranceoffering (life and non-life) in 2016. This partnership was born out of the desire of the two Moroccan groupsto develop synergies in sub-Saharan Africa in the 10 countries where they both have a presence.
SAHAM is expanding its distribution network and BANK OF AFRICA its commercial offering. A new brand,ZEN, has been created and a new financing solution 'Prêt Mon Assurance', the type of which isunprecedented on the market, has been launched.
Joint SAHAM / BANK OF AFRICA teams have been set up, life insurance products launched in three countriesand two ZEN products launched in three other countries: ZEN Assurance Auto and ZEN Assistance Voyage(car and travel insurance).
Finally, the creation of a specialised insurance division within the Corporate Structures reflects the Group'sdesire to make this activity one of its priorities.

30
ANNUAL REPORT 2
016
BANK O
F A
FRIC
A G
roup
31
BANK O
F A
FRIC
A G
roup
ANNUAL REPORT 2
016
The 'Bridge' project
In the context of the development of South - South cooperation, a demanding clientele requires expertiseand guidance on markets that it often finds complex The BMCE Bank of Africa Group has therefore decidedto develop commercial synergies between the BMCE BANK and BANK OF AFRICA networks through abusiness support platform.
This project, known as 'Bridge', pools and coordinates the efforts and expertise of the two groups in order tofacilitate the work of potential investors. Services for customers aspiring to develop their business on theContinent range from financing to consulting, through the provision of information and contacts.
In conclusion
After a year marked by the first steps in an ambitious modernisation strategy of the BANK OF AFRICAGroup, 2017 will be characterised by the implementation of all the IT projects in the IT Master Plan.
2017 should also see the first fruits of the Three-Year Development Plan and the strategy targetingSMEs.
The BANK OF AFRICA Group will finally prepare for the transition to Basel III standards withinWAEMU. A team has already been set up to manage the many changes to come, in particular in terms ofreporting, documentation, organisation and the IT system. This vast project will be carried out in cooperationwith BMCE Bank of Africa and will benefit from its expertise in this area.

Synopsisof BANK OF AFRICA Group Companies

33
BANK O
F A
FRIC
A G
roup
ANNUAL REPORT 2
016
Contents
BENIN 34
BURKINA FASO 42
BURUNDI 50
COTE D’IVOIRE 58
DJIBOUTI 66
GHANA 74
KENYA 80
MADAGASCAR 86
MALI 94
NIGER 102
DRC 110
RWANDA 118
SeNeGAL 124
TANZANIA 132
TOGO 138
UGANDA 146
FRANCE 152
BANQUE DE l’HABITAT DU BENIN (BHB) 158
AGORA 164
ATTICA 166

34
ANNUAL REPORT 2
016
BANK O
F A
FRIC
A G
roup
2016 Key figures (in CFAF million)
Opening date January 1990
Capital as at 31/12/2016CFAF 10.073 billion
Stock Market Launchon 17/11/2000
Board of Directors as at 31/12/2016Paulin Laurent COSSI, Chairman
Georges ABALLO
Jean Joachim ADJOVI
Edwige AKAN AHOUANMENOU
Driss BENJELLOUN
Benoît MAFFON
Gilbert MEHOU-LOKO
BOA GROUP S.A., Represented byAbderrazzak ZEBDANI
BOA WEST AFRICA, Represented byMamadou KA
BANQUE OUEST AFRICAINE DE DÉVELOPPEMENT (BOAD)
Principal Shareholders as at 31/12/2016
Represented by Bienvenu COMLAN
BMCE BANK, Represented by Amine BOUABID
Board of Advisors as at 31/12/2016Barthélémy ASSOGBA CAKPO, Chairman Léonide ASSANKON
Marie-Antoinette DOSSOU
Félicienne SOSSOUMIHEN
Raïmi OSSENI
AuditorsMAZARS BÉNINFIDUCIAIRE D'AFRIQUE
Registered officeAvenue Jean-Paul II - 08 BP 0879 - CotonouRÉPUBLIQUE DU BÉNINTel.: (229) 21 31 32 28Fax: (229) 21 31 31 17SWIFT: AFRIBJBJ
PRIVATE SHAREHOLDERS
43.47 %
BOA WEST AFRICA
39.47 %
BOA GROUP S.A.
14.43 %
OTHERSHAREHOLDERS
2.63 %
Activity 2015 2016 VariationDeposits 516,683 538,994 4.3 %
Loans 262,121 334,669 27.7 %
Number of branches at the end of the financial year 45 48 6.7 %
StructureTotal Assets 850,524 932,977 9.7 %
Shareholders’ equity 65,072 72,436 11.3 %
Number of employees at the end of the financial year 561 581 3.6 %
BENIN

35
BANK O
F A
FRIC
A G
roup
ANNUAL REPORT 2
016
Income 2015 2016 VariationNet operating income 39,186 39,335 0.4 %Operating expenses (including depreciation and amortization) 19,125 20,607 7.7 %Gross operating profit 20,061 18,728 -6.6 %Cost of risk (in value)* 7,237 1,563 -78.4 %Net income 12,533 16,139 28.8 %Operating ratio 48.8 % 52.4 %Cost of risk 2.8 % 0.5 %Return on Assets (ROA) 1.5 % 1.7 %Return on Equity (ROE) 20.4 % 24.0 %
Capital Adequacy Ratio 2015 2016Tier 1 31,860 33,083Tier 2 9,352 6,917Risk Weighted Asset (RWA) 281,442 313,863Tier 1 + Tier 2 / RWA 14.6 % 12.7 %(*) Including general provision
Financial analysisIn a difficult economic context marked by a slowdown in growth in Nigeria, Benin's main trading partner,BANK OF AFRICA - BENIN’s activities have recorded 10% of increase in its total balance sheet toCFAF 932,977 million as at 31 December 2016.
Customer deposits were up by 4.3% from CFAF 516,683 million at 31 December 2015 to CFAF538,994 million over the period under review. Customer demand deposits remained stable at 42% of overalldeposits.
In terms of market share, the Bank retained his leading position, with a 25% of market share.
Customer loans grew by 28% to CFAF 334,669 million between the closing dates of the two financialyears.
BANK OF AFRICA find back his leading position in term of loans with a 23% of market share.
Off-balance sheet commitments fell to CFAF 98,443 million, an annual decrease of 4.7%. With operatingincome of CFAF 93,967 million from which CFAF 54,632 million were deducted in banking expenses, NetOperating Income (NOI) grew by 0.4% to CFAF 39,335 million. This slow growth can beexplained by the fact that figures at end-December 2015 included a gain of CFAF 2,600 million on sharesheld by the Bank in certain Group subsidiaries.
The cost to income worsened to 52.4% at end December 2016 against 48.8% a year earlier.
Taking into account provisions for doubtful and litigious debts, down by 48% to CFAF 10,937 million, andthe positive outstanding exceptional income and expenses balance of CFAF 682 million, Profit BeforeIncome Tax stood at CFAF 16,858 million.
After taxes of CFAF 718 million, net income recorded an annual increase of 28.8% to reach CFAF16,139 million.
Return on equity (ROE) was up by 3.6% to 24% over the year.
Return on assets (ROA) followed the same trend with annual growth of 0.2% to 1.7%.

36
ANNUAL REPORT 2
016
BANK O
F A
FRIC
A G
roup
Significant performances (in CFAF billion)
Loans Net income
dec-15
jan-16
feb-16
mar-16
apr-16
may-16
jun-16
jul-16
aug-16
sept-16
oct-16
nov-16
dec-16
1,4001,2001,000
800600400200
0
Transactions
Monthly volume Benchmark prices
Price in CFAF
365,000
315,000
265,000
215,000
165,000
115,000
Changes in stock prices and volumes
Stock information (in CFAF)
2014 2015 2016 AAGR*Closing price at 31/12 82,005 130,000 167,995 43.1 %Performance 36.3 % 58.5 % 29.2 %Earning per share 11,854 11,854 16,023 16.3 %Shareholder’s equity per share 60,458 64,014 71,916 9.1 %Market capitalization as of 31/12 (In CFAF billion) 82.6 130.9 169.2 43.1 %Dividend 7,716 8,100 9,614 11.6 %PER (Price Earning Ratio) 9.41 % 6.23 % 5.72 % -22.0 %Price Earning Ratio 6.9x 11.0x 10.5xYield dividend 1.4x 2.0x 2.3x
(*) Average annual growth rate
12.516.1
262.1
334.6
2015 20162015 2016
27.7 % 28.8 %
2016
ROE
24.0 %

37
BANK O
F A
FRIC
A G
roup
ANNUAL REPORT 2
016
Highlights
MarchLaunch of the ''Epargne'' campaign to promote savings.
JuneLaunch of the ''Tous à l’Ecole'' campaign.
SeptemberParticipation in the 2016 BANK OF AFRICA Directors’Meetings, in Marrakech, Morocco.
NovemberLaunch of the ‘Tous en Fête’ campaign.
Inauguration of the Menontin Branch in Cotonou.
DecemberAwarded the prize for 'Best listed companyfor its contribution to promoting the WAEMURegional Financial Market' by the RegionalSecurities Market (BRVM).
BANK OF AFRICA - BENIN declared BestBenin Bank 2016 by the magazine TheBanker.
Menontin Branch
BOA-BENIN, the Best bank in Benin in 2016

Compared balance sheet for the past two fiscal years
38
ANNUAL REPORT 2
016
BANK O
F A
FRIC
A G
roup
ASSETS 2015 2016 VARIATION
CASH 12 536 437 744 13 050 565 648 4 %
INTERBANK LOANS 88 167 291 317 60 262 262 966 -32 %
CUSTOMER LOANS 262 121 405 136 334 669 024 144 28 %
- Portfolio of discounted bills 2 188 774 213 1 837 276 662 -16 %
- Other customer credit facilities 238 556 142 101 309 922 437 916 30 %
- Ordinary debtor accounts 21 376 488 822 22 909 309 566 7 %
- Factoring
INVESTMENT SECURITIES 256 383 290 104 439 385 576 733 71 %
FINANCIAL ASSETS 186 804 710 485 25 159 316 420 -87 %
LEASING AND SIMILAR TRANSACTIONS 1 209 347 963 2 261 994 200 87 %
FINANCIAL ASSETS AT EQUITY VALUE
INTANGIBLE ASSETS 496 914 122 2 943 932 106 492 %
FIXED ASSETS 19 292 917 208 20 856 058 170 8 %
SHAREHOLDERS & ASSOCIATES
OTHER ASSETS 18 261 363 425 29 613 716 786 62 %
SUNDRY ACCOUNTS 5 250 759 322 4 774 371 129 -9 %
CONSOLIDATED GOODWILL
TOTAL ASSETS 850 524 436 825 932 976 818 302 10 %
OFF-BALANCE-SHEET 2015 2016 VARIATIONCOMMITMENTS GIVEN 111 595 283 661 104 769 014 798 -6 %Credit commitments 8 275 569 067 11 319 344 342 37 %
• to credit institutions • to customers 8 275 569 067 11 319 344 342 37 %
Guarantees given 103 319 714 594 93 449 670 457 -10 %• on behalf of credit institutions 8 326 200 306 6 326 200 306 -24 %• on behalf of customers 94 993 514 288 87 123 470 151 -8 %
Commitments on securities
At 31/12/2016, 1 Euro = 655.957 CFAF

39
BANK O
F A
FRIC
A G
roup
ANNUAL REPORT 2
016
LIABILITIES 2015 2016 VARIATIONINTERBANK LIABILITIES 234 360 566 162 286 436 110 118 22 %
CUSTOMER DEPOSITS 516 683 285 594 538 993 860 635 4 %
- Savings deposit accounts 88 796 699 545 97 091 851 214 9 %
- Time deposit account 1 853 057 600 1 826 173 162 -1 %
- Short-term borrowings
- Other demand deposits 232 549 680 600 242 023 854 454 4 %
- Other time deposit accounts 193 483 847 849 198 051 981 805 2 %
DEBTS EVIDENCED BY SECURITIES
OTHER LIABILITIES 9 083 346 752 8 274 900 813 -9 %
SUNDRY ACCOUNTS 12 057 445 451 13 351 661 291 11 %
RESERVES FOR CONTINGENCIES & LOSSES 3 767 360 418 4 459 590 190 18 %
STATUTORY PROVISIONS
EARMARKED FUNDS
SUBORDINATED LOANS & SECURITIES 9 500 324 281 9 022 453 309 -5 %
INVESTMENT SUBSIDIES
RESERVES FOR GENERAL BANKING RISKS 1 638 593 313 1 638 593 313 0 %
SHARE CAPITAL 10 072 680 000 10 072 680 000 0 %
SHARE PREMIUMS 10 492 915 761 10 492 915 761 0 %
RESERVES 29 974 833 579 33 854 728 932 13 %
RETAINED EARNINGS ( +/- ) 360 449 825 239 885 881 -33 %
NET INCOME 12 532 635 689 16 139 438 060 29 %
TOTAL LIABILITIES 850 524 436 825 932 976 818 302 10 %
OFF-BALANCE-SHEET 2015 2016 VARIATIONCOMMITMENTS RECEIVED 847 952 958 650 855 177 618 219 1 %Credit commitments
• received from credit institutions• received from customers
Guarantees given 847 952 958 650 855 177 618 219 1 %• received from credit institutions 20 100 000 20 100 000 0 %• received from customers 847 932 858 650 855 157 518 219 1 %
Commitments on securities
(in CFAF)

40
ANNUAL REPORT 2
016
BANK O
F A
FRIC
A G
roup
Compared income for the past two fiscal years (in CFAF)
2015 2016 VARIATION
INTEREST INCOME 32 731 310 385 39 305 350 488 20 %
INTEREST EXPENSE -21 787 687 278 -25 959 715 229 19 %
NET INTEREST INCOME 10 943 623 107 13 345 635 259 22 %
FEE AND COMMISSION INCOME 71 402 917 034 52 524 339 725 -26 %
FEE AND COMMISSION EXPENSE -47 258 804 924 -28 221 499 538 -40 %
NET FEE AND COMMISSION INCOME 24 144 112 110 24 302 840 187 1 %
NET OTHER INCOME 4 098 571 072 1 686 971 980 -59 %
NET OPERATING INCOME 39 186 306 289 39 335 447 426 0 %
OPERATING EXPENSES -19 125 610 656 -20 607 343 745 8 %
GROSS OPERATING PROFIT 20 060 695 633 18 728 103 681 -7 %
IMPAIRMENT CHARGES -7 810 630 978 -2 553 080 700 -67 %
NET PROVISION FOR GENERAL BANKING RISKS
EXCEPTIONAL INCOME INCLUDING PREVIOUS FISCAL YEAR’ 1 112 567 160 682 515 448 -39 %
PROFIT BEFORE INCOME TAX 13 362 631 815 16 857 538 429 26 %
INCOME TAX EXPENSE -829 996 126 -718 100 369 -13 %
NET INCOME 12 532 635 689 16 139 438 060 29 %
At 31/12/2016, 1 Euro = 655.957 CFAF


42
ANNUAL REPORT 2
016
BANK O
F A
FRIC
A G
roup
2016 key figures (in CFAF million)
BURKINA FASO
Opening date March 1998
Capital as at 31/12/2016CFAF 11 Billion
Stock Market Launchon 30/12/2010
Board of Directors as at 31/12/2016Lassiné DIAWARA, Chairman
Amine BOUABID
BOA WEST AFRICA, Represented by
Lala MOULAYE EZZEDINE
Delchan OUEDRAOGO
UNION DES ASSURANCES DU BURKINA-VIE,Represented by Soumaila SORGHO
Abderrazzak ZEBDANI
Principal Shareholders as at 31/12/2016
AuditorsSOFIDEC-SARLCABINET ROSETTE NACRO
Registered office770, Avenue du Président AboubacarSangoulé Lamizana, 01 BP 1319Ouagadougou 01 - BURKINA FASOTel.: (226) 25 30 88 70 à 73Fax: (226) 25 30 88 74Télex: 5543 (BF) - SWIFT: AFRIBFBF
BOA WEST AFRICA
56.47 %
OTHER PRIVATESHAREHOLDERS
24.30 %
LASSINÉ DIAWARA
10.25 %
UNION DESASSURANCES
DU BURKINA-VIE
8.98 %
Activity 2015 2016 VariationDeposits 391,924 430,312 9.8 %
Loans 349,408 372,417 6.6 %
Number of branches at the end of the financial year 45 50 11.1 %
StructureTotal Assets 656,797 714,127 8.7 %
Shareholders’ equity 49,528 54,398 9.8 %
Number of employees at the end of the financial year 398 428 7.5 %

Income 2015 2016 VariationNet operating income 31,317 33,685 7.6 %Operating expenses (including depreciation and amortization) 14,029 16,172 15.3 %Gross operating profit 17,288 17,513 1.3 %Cost of risk (in value)* 2,532 3,597 42.1 %Net income 12,028 12,443 3.5 %Operating ratio 44.8 % 48.0 %Cost of risk 0.7 % 1.0 %Return on Assets (ROA) 2.1 % 1.8 %Return on Equity (ROE) 29.1 % 27.2 %
Capital adequacy ratio 2015 2016Tier 1 38,420 42,739 Tier 2 Risk Weighted Asset (RWA) 324,504 345,642 Tier 1 + Tier 2 / RWA 11.8 % 12.4 %
(*) Including general provision
43
BANK O
F A
FRIC
A G
roup
ANNUAL REPORT 2
016
Financial analysis
The financial year 2016 was marked by favourable trends in the key indicators for BANK OF AFRICA -BURKINA FASO (BOA-BURKINA FASO) in terms of business, structure and earnings.
Customer deposits grew by 9.8% to CFAF 430 billion.
Lending activities were also high, with loans totalling around CFAF 372.4 billion.
With the opening of 5 new entities, the branch network grew to 50 outlets by year end.
The bank's overall position was strengthened, with an 8.7% expansion in balance sheet assets to CFAF714.1 billion. This progression was accompanied by a consolidation of solvency, with capital resources up by9.8%.
Headcount increased by 7.5 %, in line with the bank's overall growth.
In terms of earnings, net operating income increased by 7.6% to CFAF 33.7 billion in December 2016.The banking margin made up 66% of NBI with income from commissions and others representing 31% andincome from securities 3%.
Operating expenses increased by 14.8% over the year, a result of the strengthening of the structure, the Bank'ssecurity apparatus and wage increases.
Favourable growth in intermediate management balances, combined with tax optimisation of incomefrom securities has made possible an increase in net income to CFAF 12.4 billion, up 3.5 % from theprevious fiscal year.

44
ANNUAL REPORT 2
016
BANK O
F A
FRIC
A G
roup
Significant performances (in CFAF billion)
Stock information (in CFAF)
31.333.6
391.9
430.3
2015 20162015 2016
Deposits Net operating income
dec-15
jan-16
feb-16
mar-16
apr-16
may-16
jun-16
jul-16
aug-16
sept-16
oct-16
nov-16
dec-16
1,600
1,400
1,200
1,000
800
600
400
200
0
Transactions
Monthly volume Benchmark prices
Price in CFAF
160,000155,000150,000145,000140,000135,000130,000125,000120,000115,000
Changes in stock prices and volumes
9.8 % 7.6 %
2014 2015 2016 AAGR*Closing price at 31/12 90,000 120,000 139,500 24.5 %Performance 11.1 % 33.3 % 16.3 %Earning per share 9,526 10,935 11,312 9.0 %Shareholder’s equity per share 40,116 45,025 49,453 11.0 %Market capitalization as of 31/12 (In CFAF billion) 99.0 132.0 153.5 24.5 %Dividend 5,845 6,692 7,920 16.4 %PER (Price Earning Ratio) 6.49 % 5.58 % 5.68 % -6.5 %Price Earning Ratio 9.4x 11.0x 12.3xYield dividend 2.2x 2.7x 2.8x
(*) Average annual growth rate
2016
ROE
27.2 %

45
BANK O
F A
FRIC
A G
roup
ANNUAL REPORT 2
016
Highlights
FebruaryNumber of customer accounts rose above the300,000 mark.
Launch of 'Prêt Ma Moto' loan.
MarchInauguration of Houndé Branch, a town located 250km on the west side of the capital.
Customer deposits rose above the CFAF 400 billionmark.
AprilInauguration of the branch in Orodara, a town 450km west of the capital.
Launch of ‘Epargne' campaign to promote savings.
JuneLaunch of the 'Tous à l’Ecole' campaign.
JulyBANK OF AFRICA received the Best Large Company.
award at the 5th “Prix Burkinabè de la Qualité”(Burkina Faso quality awards).
August Launch of the AIRTEL MONEY mobile moneytransfer service.
SeptemberParticipation in the 2016 BANK OF AFRICADirectors’ Meetings, in Marrakesh, Morocco.
OctoberLaunch of the MONEYGRAM money transferservice.
NovemberBalance sheet total rose above the CFAF 700billion mark.
DecemberInauguration of the 'Trame d’accueil' Branchlocated just to the south of the capital.
BOA-BURKINA FASO, Top Great Entreprise at the 5th edition of the ‘’Prix Burkinabè de la Qualité’’
46
ANNUAL REPORT 2
016
BANK O
F A
FRIC
A G
roup
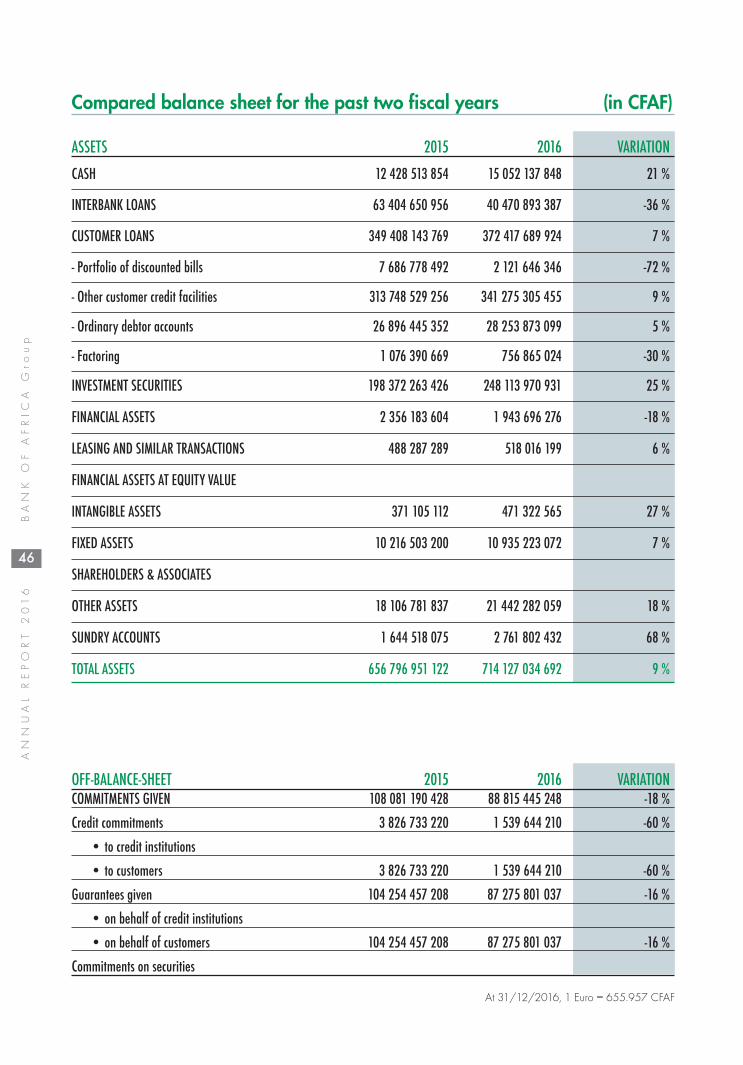
ASSETS 2015 2016 VARIATION
CASH 12 428 513 854 15 052 137 848 21 %
INTERBANK LOANS 63 404 650 956 40 470 893 387 -36 %
CUSTOMER LOANS 349 408 143 769 372 417 689 924 7 %
- Portfolio of discounted bills 7 686 778 492 2 121 646 346 -72 %
- Other customer credit facilities 313 748 529 256 341 275 305 455 9 %
- Ordinary debtor accounts 26 896 445 352 28 253 873 099 5 %
- Factoring 1 076 390 669 756 865 024 -30 %
INVESTMENT SECURITIES 198 372 263 426 248 113 970 931 25 %
FINANCIAL ASSETS 2 356 183 604 1 943 696 276 -18 %
LEASING AND SIMILAR TRANSACTIONS 488 287 289 518 016 199 6 %
FINANCIAL ASSETS AT EQUITY VALUE
INTANGIBLE ASSETS 371 105 112 471 322 565 27 %
FIXED ASSETS 10 216 503 200 10 935 223 072 7 %
SHAREHOLDERS & ASSOCIATES
OTHER ASSETS 18 106 781 837 21 442 282 059 18 %
SUNDRY ACCOUNTS 1 644 518 075 2 761 802 432 68 %
TOTAL ASSETS 656 796 951 122 714 127 034 692 9 %
Compared balance sheet for the past two fiscal years (in CFAF)
OFF-BALANCE-SHEET 2015 2016 VARIATION COMMITMENTS GIVEN 108 081 190 428 88 815 445 248 -18 %
Credit commitments 3 826 733 220 1 539 644 210 -60 %
• to credit institutions
• to customers 3 826 733 220 1 539 644 210 -60 %
Guarantees given 104 254 457 208 87 275 801 037 -16 %
• on behalf of credit institutions
• on behalf of customers 104 254 457 208 87 275 801 037 -16 %
Commitments on securities
At 31/12/2016, 1 Euro = 655.957 CFAF

47
BANK O
F A
FRIC
A G
roup
ANNUAL REPORT 2
016
LIABILITIES 2015 2016 VARIATIONINTERBANK LIABILITIES 197 607 834 655 213 013 393 178 8 %
CUSTOMER DEPOSITS 391 924 102 585 430 312 244 460 10 %
- Savings deposit accounts 76 297 795 135 88 291 323 577 16 %
- Time deposit account 1 510 754 529 2 510 337 282 66 %
- Short-term borrowings
- Other demand deposits 190 365 388 517 196 853 867 739 3 %
- Other time deposit accounts 123 750 164 404 142 656 715 862 15 %
DEBTS EVIDENCED BY SECURITIES 1 600 000 000 800 000 000 -50 %
OTHER LIABILITIES 8 227 601 129 7 426 603 281 -10 %
SUNDRY ACCOUNTS 7 837 492 048 8 097 961 054 3 %
RESERVES FOR CONTINGENCIES & LOSSES 71 950 677 78 816 097 10 %
STATUTORY PROVISIONS
EARMARKED FUNDS
SUBORDINATED LOANS & SECURITIES
INVESTMENT SUBSIDIES
RESERVES FOR GENERAL BANKING RISKS 5 784 739 968 6 624 739 968 15 %
SHARE CAPITAL 11 000 000 000 11 000 000 000 0 %
SHARE PREMIUMS 7 691 000 000 7 691 000 000 0 %
RESERVES 6 777 820 768 8 582 057 744 27 %
RETAINED EARNINGS ( +/- ) 6 246 162 787 8 057 372 316 29 %
NET INCOME 12 028 246 505 12 442 846 594 3 %
TOTAL LIABILITIES 656 796 951 122 714 127 034 692 9 %
OFF-BALANCE-SHEET 2015 2016 VARIATIONCOMMITMENTS RECEIVED 402 417 885 848 594 060 897 599 48 %
Credit commitments
• received from credit institutions
• received from customers
Guarantees given 402 417 885 848 594 060 897 599 48 %
• received from credit institutions 357 597 676 343 416 120 -4 %
• received from customers 402 060 288 172 593 717 481 479 48 %
Commitments on securities
(in CFAF)

48
ANNUAL REPORT 2
016
BANK O
F A
FRIC
A G
roup
2015 2016 VARIATION
INTEREST INCOME 34 656 409 148 41 928 936 930 21%
INTEREST EXPENSE -14 583 080 139 -19 594 056 921 34%
NET INTEREST INCOME 20 073 329 009 22 334 880 009 11%
FEE AND COMMISSION INCOME 160 168 767 136 173 332 050 647 8%
FEE AND COMMISSION EXPENSE -152 117 617 047 -164 832 636 134 8%
NET FEE AND COMMISSION INCOME 8 051 150 089 8 499 414 513 6%
NET OTHER INCOME 3 192 224 617 2 850 444 475 -11%
NET OPERATING INCOME 31 316 703 715 33 684 738 997 8%
OPERATING EXPENSES -14 029 086 002 -16 171 562 495 15%
GROSS OPERATING PROFIT 17 287 617 713 17 513 176 502 1%
IMPAIRMENT CHARGES -1 879 814 427 -2 854 636 062 52%
NET PROVISION FOR GENERAL BANKING RISK -720 000 000 -840 000 000 17%
EXCEPTIONAL INCOME INCLUDING PREVIOUS FISCAL YEARS’ -43 892 906 586 054 060 -1435%
PROFIT BEFORE INCOME TAX 14 643 910 380 14 404 594 500 -2%
INCOME TAX EXPENSE -2 615 663 875 -1 961 747 906 -25%
NET INCOME 12 028 246 505 12 442 846 594 3%
Compared income for the past two fiscal years (in CFAF)
At 31/12/2016, 1 Euro = 655.957 CFAF

50
ANNUAL REPORT 2
016
BANK O
F A
FRIC
A G
roup
2016 key figures (In BIF million)
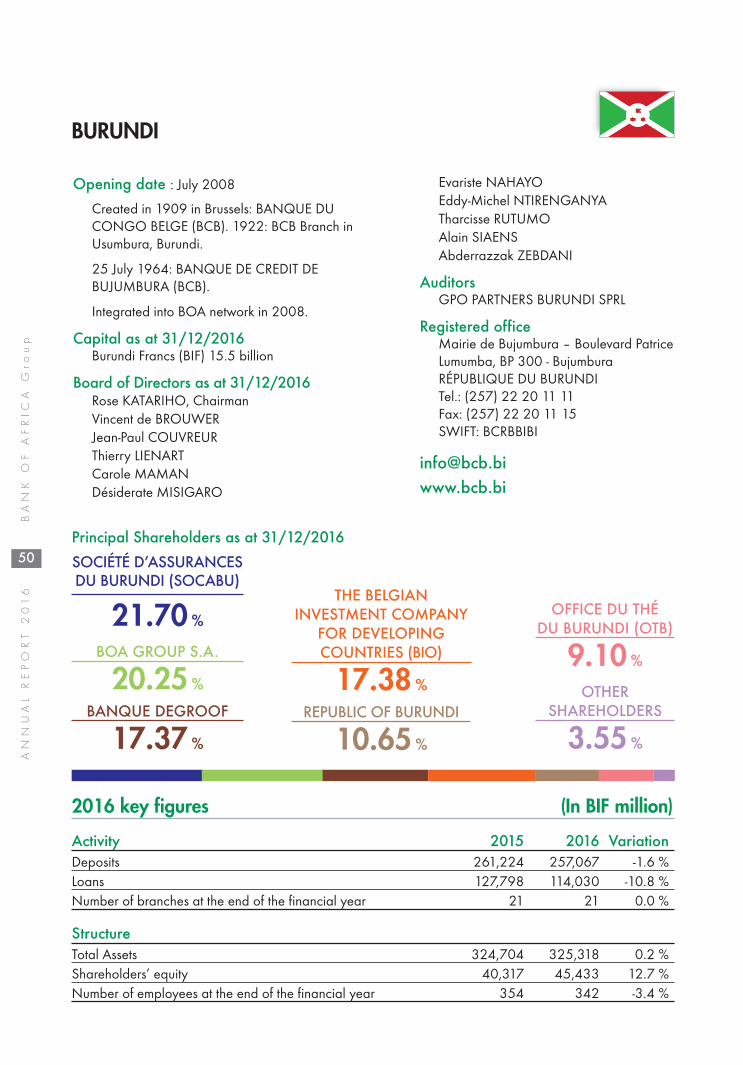
BURUNDI
Opening date : July 2008Created in 1909 in Brussels: BANQUE DUCONGO BELGE (BCB). 1922: BCB Branch inUsumbura, Burundi.
25 July 1964: BANQUE DE CREDIT DEBUJUMBURA (BCB).
Integrated into BOA network in 2008.
Capital as at 31/12/2016Burundi Francs (BIF) 15.5 billion
Board of Directors as at 31/12/2016Rose KATARIHO, ChairmanVincent de BROUWERJean-Paul COUVREURThierry LIENARTCarole MAMANDésiderate MISIGARO
Principal Shareholders as at 31/12/2016
Evariste NAHAYOEddy-Michel NTIRENGANYATharcisse RUTUMOAlain SIAENSAbderrazzak ZEBDANI
AuditorsGPO PARTNERS BURUNDI SPRL
Registered officeMairie de Bujumbura – Boulevard PatriceLumumba, BP 300 - BujumburaRÉPUBLIQUE DU BURUNDITel.: (257) 22 20 11 11Fax: (257) 22 20 11 15SWIFT: BCRBBIBI
SOCIÉTÉ D’ASSURANCESDU BURUNDI (SOCABU)
21.70 %
BOA GROUP S.A.
20.25 %
THE BELGIANINVESTMENT COMPANY
FOR DEVELOPINGCOUNTRIES (BIO)
17.38 %
BANQUE DEGROOF
17.37 %
REPUBLIC OF BURUNDI
10.65 %
OFFICE DU THÉ DU BURUNDI (OTB)
9.10 %
OTHERSHAREHOLDERS
3.55 %
Activity 2015 2016 VariationDeposits 261,224 257,067 -1.6 %Loans 127,798 114,030 -10.8 %Number of branches at the end of the financial year 21 21 0.0 %
StructureTotal Assets 324,704 325,318 0.2 %Shareholders’ equity 40,317 45,433 12.7 %Number of employees at the end of the financial year 354 342 -3.4 %

51
BANK O
F A
FRIC
A G
roup
ANNUAL REPORT 2
016
Income 2015 2016 VariationNet operating income 30,335 31,527 3.9 %
Operating expenses (including depreciation and amortization) 19,158 20,002 4.4 %
Gross operating profit 11,177 11,525 3.1 %
Cost of risk (in value)* 5,427 2,306 -57.5 %
Net income 5,187 7,280 40.4 %
Operating ratio 63.2 % 63.4 %
Cost of risk 4.1 % 1.9 %
Return on Assets (ROA) 1.5 % 2.2 %
Return on Equity (ROE) 13.7 % 17.0 %
Capital adequacy ratio 2015 2016Tier 1 29,458 33,625
Tier 2 5,256 5,563
Risk Weighted Asset (RWA) 254 824 193,814
Tier 1 + Tier 2 / RWA 13.6 % 20.2 % (*)Including general provision
Financial analysis
For BANQUE DE CREDIT DE BUJUMBURA S.M. (BCB), 2016 was affected by the negative effects ofthe political instability and security issues that marked election held last year in Burundi.
Customers’ deposits dropped by 1.6% to BIF 257.1 billion.
Net loans to customers decreased by 10.8% to BIF 114.0 billion.
Overall, the total balance sheet came out at BIF 325.3 billion, marking an increase of 0.2%.
In terms of earnings, Net Operating Income increased by 3.9% to BIF 31.5 billion.
Operating expenses were up by 4.4% to BIF 20.0 billion.
Finally, the Gross Operating Profit for 2016 is BIF 11.5 billion, up by 3.1%. The Net Income is BIF 7.3billion, up by 40.4%.

30,335.1
52
ANNUAL REPORT 2
016
BANK O
F A
FRIC
A G
roup
Significant performances (in BIF million)
Stock information (in thousands of BIF)
2014 2015 2016 AAGR*Earning per share 12.9 33.2 46.7 90.2 %
Shareholder’s equity per share** 226.9 258.4 291.2 13.3 %
Net dividend per share 0.0 11.8 21.4
*Average annual growth rate**Excluding PGBR
Net operating income Net income Cost of risk
5,187.07,280.1
31,526.8
2015 20162015 2016
3.9 % 40,4 %
1.9 %
4.1 %
2015 2016

53
BANK O
F A
FRIC
A G
roup
ANNUAL REPORT 2
016
8 March, International Women Day

54
ANNUAL REPORT 2
016
BANK O
F A
FRIC
A G
roup
ASSETS 2015 2016 VARIATION
CASH, BANK OF THE REPUBLIC OF BURUNDI 42 654 596 81 766 592 92 %
BALANCE DUE FROM BANKING INSTITUTIONS 46 922 877 13 278 141 -72 %
LOANS AND ADVANCES TO CUSTOMERS 127 798 436 114 029 934 -11 %
INVESTMENTS SECURITIES 53 901 651 72 156 841 34 %
TAX ASSET 1 188 181
OTHER ASSETS 26 723 555 16 726 619 -37 %
FIXED ASSETS 25 908 333 25 479 042 -2 %
INTANGIBLE ASSETS 794 667 692 300 -13 %
TOTAL ASSETS 324 704 115 325 317 650 0 %
OFF-BALANCE-SHEET 2015 2016 VARIATIONCOMMITMENTS GIVEN 18 480 933 13 578 342 -27 %
Credit commitments 10 471 509 6 714 769 -36 %
• to credit institutions
• to customers 10 471 509 6 714 769 -36 %
Guarantees given 8 009 424 6 863 573 -14 %
• on behalf of credit institutions
• on behalf of customers 8 009 424 6 863 573 -14 %
Commitments on securities
Compared balance sheet for the past two fiscal years (in thousands of BIF)
At 31/12/2016, 1 Euro = 1 779.0984 BIF
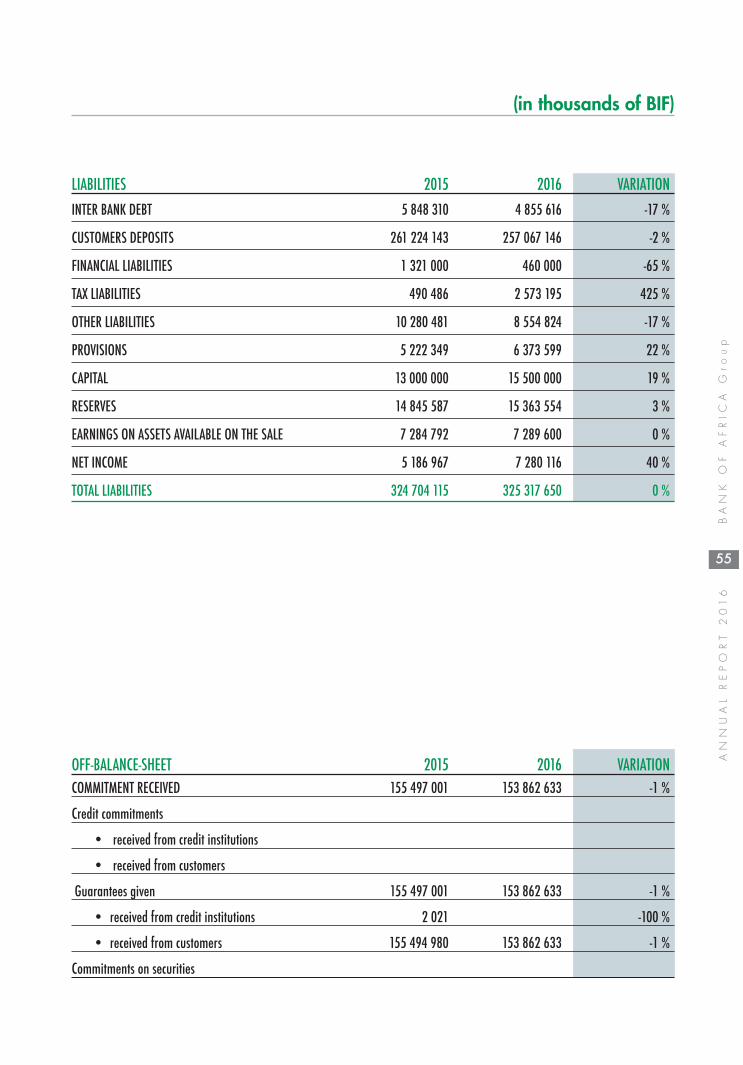
55
BANK O
F A
FRIC
A G
roup
ANNUAL REPORT 2
016
OFF-BALANCE-SHEET 2015 2016 VARIATIONCOMMITMENT RECEIVED 155 497 001 153 862 633 -1 %
Credit commitments
• received from credit institutions
• received from customers
Guarantees given 155 497 001 153 862 633 -1 %
• received from credit institutions 2 021 -100 %
• received from customers 155 494 980 153 862 633 -1 %
Commitments on securities
LIABILITIES 2015 2016 VARIATIONINTER BANK DEBT 5 848 310 4 855 616 -17 %
CUSTOMERS DEPOSITS 261 224 143 257 067 146 -2 %
FINANCIAL LIABILITIES 1 321 000 460 000 -65 %
TAX LIABILITIES 490 486 2 573 195 425 %
OTHER LIABILITIES 10 280 481 8 554 824 -17 %
PROVISIONS 5 222 349 6 373 599 22 %
CAPITAL 13 000 000 15 500 000 19 %
RESERVES 14 845 587 15 363 554 3 %
EARNINGS ON ASSETS AVAILABLE ON THE SALE 7 284 792 7 289 600 0 %
NET INCOME 5 186 967 7 280 116 40 %
TOTAL LIABILITIES 324 704 115 325 317 650 0 %
(in thousands of BIF)

56
ANNUAL REPORT 2
016
BANK O
F A
FRIC
A G
roup
2015 2016 VARIATION
INTEREST INCOME 31 836 887 31 707 030 0 %
INTEREST EXPENSE -8 298 603 -6 461 881 -22 %
NET INTEREST INCOME 23 538 284 25 245 149 7 %
FEE AND COMMISSION INCOME 5 421 373 4 851 282 -11 %
FEE AND COMMISSION EXPENSE -260 427 -136 910 -47 %
NET FEE AND COMMISSION INCOME 5 160 946 4 714 372 -9 %
OTHER INCOME 1 635 913 1 567 335 -4 %
NET OPERATING INCOME 30 335 143 31 526 856 4 %
OPERATING EXPENSES -19 157 866 -20 001 675 4 %
GROSS OPERATING PROFIT 11 177 277 11 525 181 3 %
IMPAIRMENT CHARGES -5 427 244 -2 306 399 -58 %
PROVISIONS FOR GENERAL BANKING RISK
EXCEPTIONAL INCOME INCLUDING PREVIOUS FISCAL YEARS’ 49 107 250 334 410 %
PROFIT BEFORE INCOME TAX 5 799 140 9 469 116 63 %
INCOME TAX EXPENSE -612 173 -2 189 000 258 %
NET INCOME 5 186 967 7 280 116 40 %
Compared income for the past two fiscal years (in thousands of BIF)

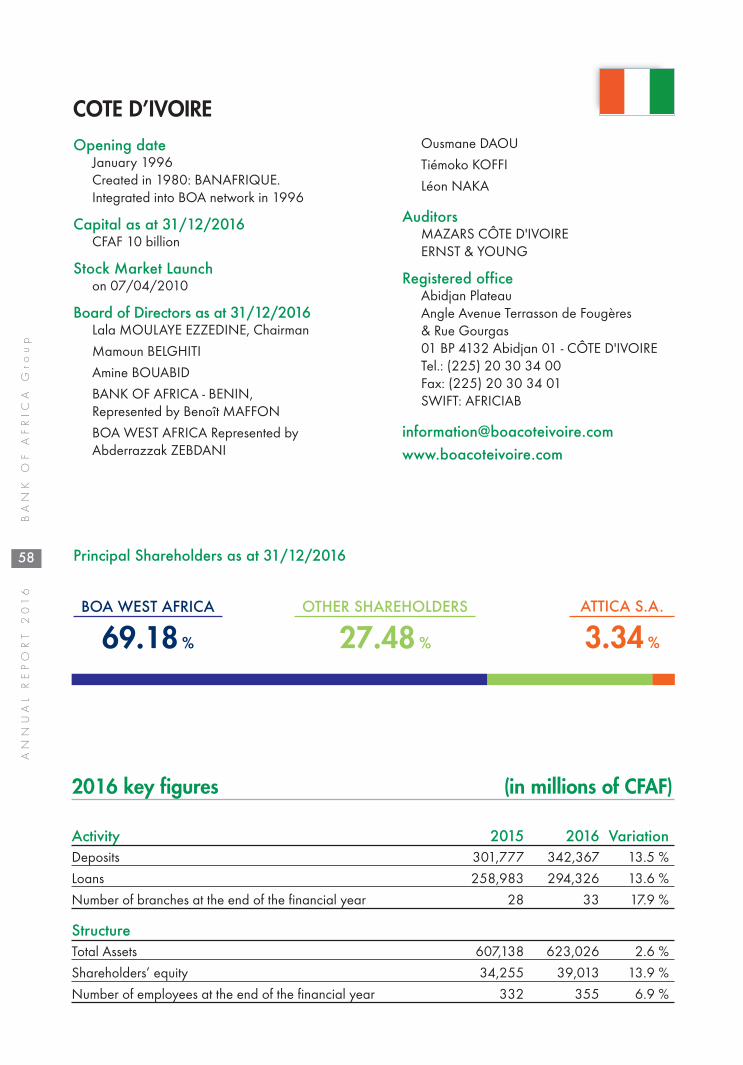
58
ANNUAL REPORT 2
016
BANK O
F A
FRIC
A G
roup
2016 key figures (in millions of CFAF)
Opening date January 1996Created in 1980: BANAFRIQUE.Integrated into BOA network in 1996
Capital as at 31/12/2016CFAF 10 billion
Stock Market Launchon 07/04/2010
Board of Directors as at 31/12/2016Lala MOULAYE EZZEDINE, Chairman
Mamoun BELGHITI
Amine BOUABID
BANK OF AFRICA - BENIN, Represented by Benoît MAFFON
BOA WEST AFRICA Represented byAbderrazzak ZEBDANI
Principal Shareholders as at 31/12/2016
Ousmane DAOU
Tiémoko KOFFI
Léon NAKA
AuditorsMAZARS CÔTE D'IVOIREERNST & YOUNG
Registered officeAbidjan PlateauAngle Avenue Terrasson de Fougères & Rue Gourgas01 BP 4132 Abidjan 01 - CÔTE D'IVOIRETel.: (225) 20 30 34 00Fax: (225) 20 30 34 01SWIFT: AFRICIAB
BOA WEST AFRICA
69.18 %
OTHER SHAREHOLDERS
27.48 %
ATTICA S.A.
3.34 %
Activity 2015 2016 VariationDeposits 301,777 342,367 13.5 %
Loans 258,983 294,326 13.6 %
Number of branches at the end of the financial year 28 33 17.9 %
StructureTotal Assets 607,138 623,026 2.6 %
Shareholders’ equity 34,255 39,013 13.9 %
Number of employees at the end of the financial year 332 355 6.9 %
COTE D’IVOIRE

59
BANK O
F A
FRIC
A G
roup
ANNUAL REPORT 2
016
Income 2015 2016 VariationNet operating income 25,269 29,006 14.8 %Operating expenses (including depreciation and amortization) 13,463 14,256 5.9 %Gross operating profit 11,806 14,751 24.9 %Cost of risk (in value)* 2,849 4,292 50.6 %Net income 8,240 10,149 23.2 %Operating ratio 53.3 % 49.1 %Cost of risk 1.2 % 1.6 %Return on Assets (ROA) 1.5 % 1.7 %Return on Equity (ROE) 25.9 % 28.7 %
Capital adequacy ratio 2015 2016Tier 1 20,886 23,741Tier 2 1,885 1,318Risk Weighted Asset (RWA) 247,336 285,815 Tier 1 + Tier 2 / RWA 9.2 % 8.8 %(*) Including general provision
Financial analysis
At end 2016, BANK OF AFRICA – CÔTE D’IVOIRE had 33 branches and 355 employees. In a highlycompetitive environment, deposits, up 13.5% to CFAF 342.3 billion, grew at the same rate asloans, which were up 13.6% to CFAF 294.3 billion.
At CFAF 623 billion, total assets were up 2.6%. With capital of CFAF 39 billion before allocation,the Bank's solvency ratio of 8.8% was down 0.4 points compared to 2015. The regulatoryrequirement is set at 8%.
Net banking income of CFAF 29.0 billion was up 14.8% compared to 2015. General operatingoverheads increased by 5.9% due to the opening of 5 new branches during the year and the increase instaff. However the cost to income fell to 49.1% compared to 53.3% in 2015, bearing witness to tight controlof overheads.
Cost of risk worsened to 1.6% compared to 1.2% at the end of 2015, due to consolidation of the bank'sportfolio. Net income grew 23.2 % on the previous year to CFAF 10,149 million.
Return on assets and return on equity came in at 1.7 % and 28.7 % respectively, animprovement on 2015.

2016
ROE
28.7 %
60
ANNUAL REPORT 2
016
BANK O
F A
FRIC
A G
roup
Significant performances (in CFAF billion)
Stock information (In CFAF)
2014 2015 2016 AAGR*Closing price at 31/12 90,000 125,000 139,000 24.3 %Performance 39.5 % 38.9 % 11.2 %Earning per share 9,850 9,850 10,149 1.5 %Shareholder’s equity per share 38,429 41,576 39,013 0.8 %Market capitalization as of 31/12 (In CFAF billion) 73.8 102.5 139.0 37.2 %Dividend 6,200 6,200 6,089 -0.9 %PER (Price Earning Ratio) 6.89 % 4.96 % 4.38 % -20.3 %P/B (Price to Book) 9.1x 12.7x 13.7xYield dividend 2.3x 3.0x 3.6x
(*) Average annual growth rate
dec-15
jan-16
feb-16
mar-16
apr-16
may-16
jun-16
jul-16
aug-16
sept-16
oct-16
nov-16
dec-16
1,000900800700600500400300200100
0
Transactions
Monthly volume Benchmark prices
Price in CFAF
270,000
250,000
230,000
210,000
190,000
170,000
150,000
130,000
110,000
Changes in stock prices and volumes
258.9
Loans Net income
8.210.1
294.3
2015 20162015 2016
13.6 % 23.2 %

61
BANK O
F A
FRIC
A G
roup
ANNUAL REPORT 2
016
Highlights
February Signature of an agreement with Société Ivoiriennede Raffinage (SIR) in relation to a loan of CFAF 32billion over three years to finance imports of crudepetroleum products.
March Inauguration of the Riviera Palmeraie Branch inAbidjan.
April Inauguration of the Angré – 8ème Tranche Branchin Abidjan.
Participation in the first Salon du Bâtiment (buildingand construction trade show) in Abidjan.
JuneInauguration of the Treichville Zone 3 Branch inAbidjan.
Signature of an agreement with Brassivoire inrelation to a loan of CFAF 56.3 billion to set up abarley malt production unit in Abidjan.
SeptemberLaunch of the 'Zen Voyage' and 'Zen Auto' insuranceproducts in partnership with the SAHAM group.
Participation in the 2016 BANK OF AFRICADirectors’ Meetings, in Marrakech, Morocco.
DecemberInauguration of two branches at Marcory VGE andthe Yopougon industrial zone in Abidjan.
Yopougon - Zone Industrielle new branch
Signature of BOA conventions: on the left, with Brassivoire, on the right, with SAHAM
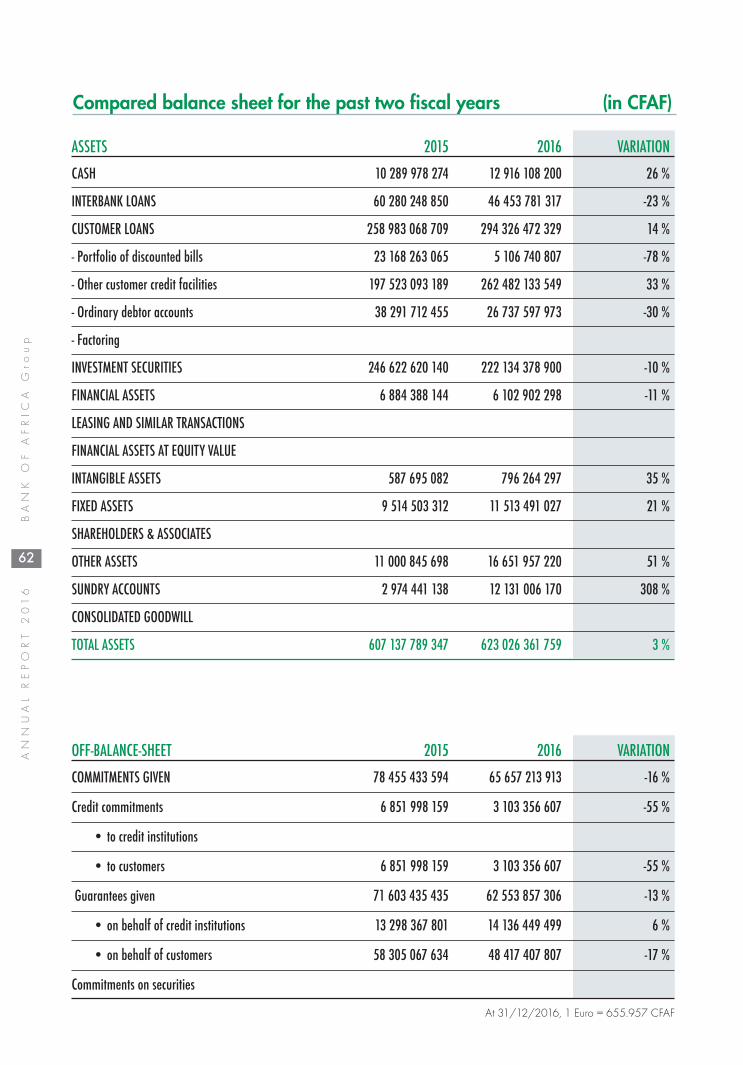
62
ANNUAL REPORT 2
016
BANK O
F A
FRIC
A G
roup
ASSETS 2015 2016 VARIATION
CASH 10 289 978 274 12 916 108 200 26 %
INTERBANK LOANS 60 280 248 850 46 453 781 317 -23 %
CUSTOMER LOANS 258 983 068 709 294 326 472 329 14 %
- Portfolio of discounted bills 23 168 263 065 5 106 740 807 -78 %
- Other customer credit facilities 197 523 093 189 262 482 133 549 33 %
- Ordinary debtor accounts 38 291 712 455 26 737 597 973 -30 %
- Factoring
INVESTMENT SECURITIES 246 622 620 140 222 134 378 900 -10 %
FINANCIAL ASSETS 6 884 388 144 6 102 902 298 -11 %
LEASING AND SIMILAR TRANSACTIONS
FINANCIAL ASSETS AT EQUITY VALUE
INTANGIBLE ASSETS 587 695 082 796 264 297 35 %
FIXED ASSETS 9 514 503 312 11 513 491 027 21 %
SHAREHOLDERS & ASSOCIATES
OTHER ASSETS 11 000 845 698 16 651 957 220 51 %
SUNDRY ACCOUNTS 2 974 441 138 12 131 006 170 308 %
CONSOLIDATED GOODWILL
TOTAL ASSETS 607 137 789 347 623 026 361 759 3 %
OFF-BALANCE-SHEET 2015 2016 VARIATION
COMMITMENTS GIVEN 78 455 433 594 65 657 213 913 -16 %
Credit commitments 6 851 998 159 3 103 356 607 -55 %
• to credit institutions
• to customers 6 851 998 159 3 103 356 607 -55 %
Guarantees given 71 603 435 435 62 553 857 306 -13 %
• on behalf of credit institutions 13 298 367 801 14 136 449 499 6 %
• on behalf of customers 58 305 067 634 48 417 407 807 -17 %
Commitments on securities
Compared balance sheet for the past two fiscal years (in CFAF)
At 31/12/2016, 1 Euro = 655.957 CFAF

63
BANK O
F A
FRIC
A G
roup
ANNUAL REPORT 2
016
LIABILITIES 2015 2016 VARIATIONINTERBANK LIABILITIES 255 094 250 412 220 195 033 282 -14 %CUSTOMER DEPOSITS 301 776 573 475 342 366 710 592 13 %- Savings deposit accounts 39 022 386 656 42 385 891 848 9 %- Time deposit account 3 336 306 376 4 368 037 307 31 %- Short-term borrowings 4 871 764 898 4 823 045 166 -1 %- Other demand deposits 176 305 761 524 211 153 588 413 20 %- Other time deposit accounts 78 240 354 021 79 636 147 858 2 %DEBTS EVIDENCED BY SECURITIES 1 600 000 000 800 000 000 -50 %OTHER LIABILITIES 9 274 809 749 15 197 009 019 64 %SUNDRY ACCOUNTS 3 119 752 075 3 712 306 408 19 %RESERVES FOR CONTINGENCIES & LOSSES 132 530 120 424 579 434 220 %STATUTORY PROVISIONSEARMARKED FUNDS SUBORDINATED LOANS & SECURITIES 1 884 564 876 1 317 837 159 -30 %INVESTMENT SUBSIDIESRESERVES FOR GENERAL BANKING RISKS 1 123 339 631 1 380 479 189 23 %SHARE CAPITAL 8 200 000 000 10 000 000 000 22 %SHARE PREMIUMS 6 675 372 000 6 675 372 000 0 %RESERVES 9 979 818 112 10 615 786 037 6 %RETAINED EARNINGS ( +/- ) 36 992 729 191 922 082 419 %NET INCOME 8 239 786 167 10 149 326 558 23 %TOTAL LIABILITIES 607 137 789 347 623 026 361 759 3 %
OFF-BALANCE-SHEET 2015 2016 VARIATION
COMMITMENTS RECEIVED 393 159 677 493 314 573 326 271 -20 %
Credit commitments
• received from credit institutions
• received from customers
Guarantees given 393 159 677 493 314 573 326 271 -20 %
• received from credit institutions 51 099 458 698 36 362 766 701 -29 %
• received from customers 342 060 218 795 278 210 559 570 -19 %
Commitments on securities
(in CFAF)

64
ANNUAL REPORT 2
016
BANK O
F A
FRIC
A G
roup
Compared income for the past two fiscal years (in CFAF)
2015 2016 VARIATION
INTEREST INCOME 28 755 465 274 34 029 937 657 18 %
INTEREST EXPENSE -11 875 371 791 -13 148 179 547 11 %
NET INTEREST INCOME 16 880 093 483 20 881 758 110 24 %
FEE AND COMMISSION INCOME 13 607 537 702 18 708 828 249 37 %
FEE AND COMMISSION EXPENSE -7 469 702 766 -11 298 156 542 51 %
NET FEE AND COMMISSION INCOME 6 137 834 936 7 410 671 707 21 %
NET OTHER INCOME 2 251 146 822 713 984 266 -68 %
NET OPERATING INCOME 25 269 075 241 29 006 414 083 15 %
OPERATING EXPENSES -13 462 836 343 -14 255 808 585 6 %
GROSS OPERATING PROFIT 11 806 238 898 14 750 605 498 25 %
IMPAIRMENT CHARGES -2 944 273 334 -4 442 545 663 51 %
NET PROVISION FOR GENERAL BANKING RISK -152 342 016 -257 139 558 69 %
EXCEPTIONAL INCOME INCLUDING PREVIOUS FISCAL YEARS’ -434 837 377 133 406 281 -131 %
PROFIT BEFORE INCOME TAX 8 274 786 171 10 184 326 558 23 %
INCOME TAX EXPENSE -35 000 004 -35 000 000 0 %
NET INCOME 8 239 786 167 10 149 326 558 23 %
At 31/12/2016, 1 Euro = 655.957 CFAF


66
ANNUAL REPORT 2
016
BANK O
F A
FRIC
A G
roup
2016 key figures (in millions of DJF)
Opening date December 2010, Created in 1908: BANQUE INDOSUEZMER ROUGE (BIRM)Integrated into BOA network in 2011
Capital as at 31/12/2016Djibouti Francs (DJF) 1.5 billion
Board of Directors as at 31/12/2016Khalid MOUNTASSIR, ChairmanAmine BOUABIDVincent de BROUWER Abdelafi NADIFIBOA GROUP S.A., Represented byAbderrazzak ZEBDANI
Principal Shareholders as at 31/12/2016
AuditorsSCP J. C. COLAS – Félix EMOK N’DOLOPRICEWATERHOUSECOOPERS SARL
Registered office10, Place Lagarde - BP 88 - DjiboutiDJIBOUTITel.: (253) 21 35 30 16 - Fax: (253) 2135 16 38Telex: 5543 (BF) - SWIFT: MRINDJ JD
Site: www.boamerrouge.com
BOA GROUP S.A.
80.00 %
PROPARCO
20.00 %
Activity 2015 2016 VariationDeposits 79,487 80,859 1.7 %
Loans 21,932 23,222 5.9 %
Number of branches at the end of the financial year 7 8 14.3 %
StructureTotal Assets 91,115 93,999 3.2 %
Shareholders’ equity 6,641 7,843 18.1 %
Number of employees at the end of the financial year 143 147 2.8 %
DJIBOUTI
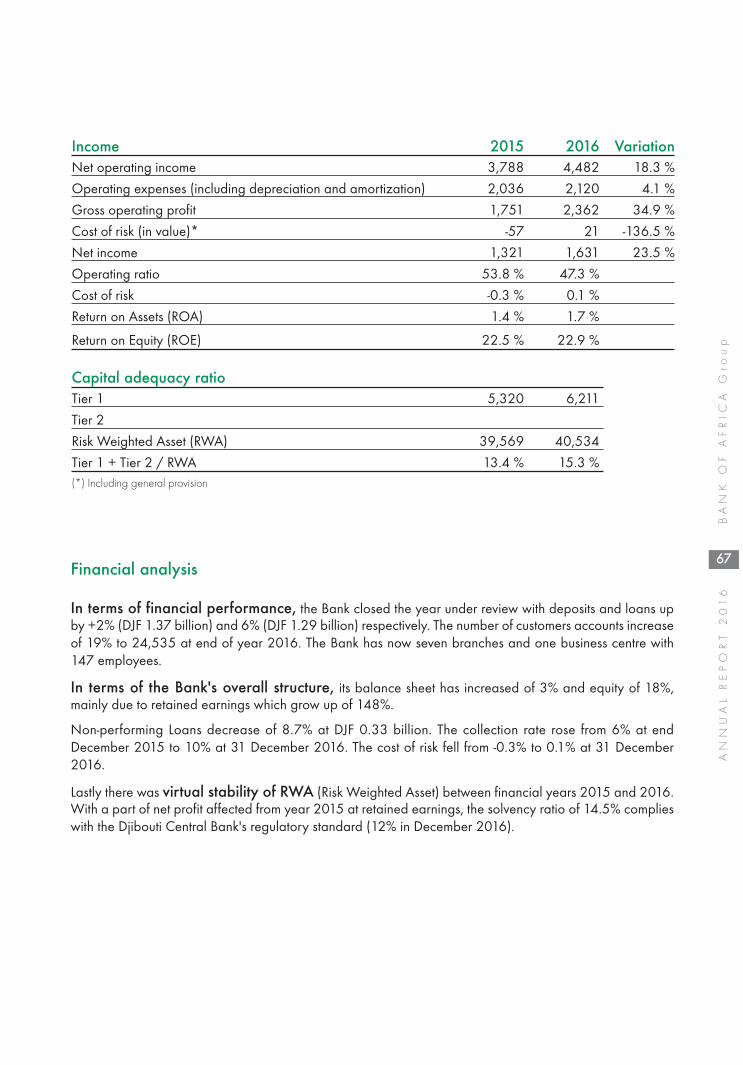
67
BANK O
F A
FRIC
A G
roup
ANNUAL REPORT 2
016
Income 2015 2016 VariationNet operating income 3,788 4,482 18.3 %
Operating expenses (including depreciation and amortization) 2,036 2,120 4.1 %
Gross operating profit 1,751 2,362 34.9 %
Cost of risk (in value)* -57 21 -136.5 %
Net income 1,321 1,631 23.5 %
Operating ratio 53.8 % 47.3 %
Cost of risk -0.3 % 0.1 %
Return on Assets (ROA) 1.4 % 1.7 %
Return on Equity (ROE) 22.5 % 22.9 %
Capital adequacy ratioTier 1 5,320 6,211
Tier 2
Risk Weighted Asset (RWA) 39,569 40,534
Tier 1 + Tier 2 / RWA 13.4 % 15.3 %(*) Including general provision
Financial analysis
In terms of financial performance, the Bank closed the year under review with deposits and loans upby +2% (DJF 1.37 billion) and 6% (DJF 1.29 billion) respectively. The number of customers accounts increaseof 19% to 24,535 at end of year 2016. The Bank has now seven branches and one business centre with147 employees.
In terms of the Bank's overall structure, its balance sheet has increased of 3% and equity of 18%,mainly due to retained earnings which grow up of 148%.
Non-performing Loans decrease of 8.7% at DJF 0.33 billion. The collection rate rose from 6% at endDecember 2015 to 10% at 31 December 2016. The cost of risk fell from -0.3% to 0.1% at 31 December2016.
Lastly there was virtual stability of RWA (Risk Weighted Asset) between financial years 2015 and 2016.With a part of net profit affected from year 2015 at retained earnings, the solvency ratio of 14.5% complieswith the Djibouti Central Bank's regulatory standard (12% in December 2016).

2016
ROE
22.9 %
68
ANNUAL REPORT 2
016
BANK O
F A
FRIC
A G
roup
Significant performances (in millions of DJF)
Stock information (in DJF)
2014 2015 2016 AAGR*Earning per share 4,798 22,013 27,191 138.05 %
Shareholder’s equity per share 88,417 110,679 130,712 21.59 %
Net dividend per share 0 8,000 13,596(*) Average annual growth rate
Prices award to Assan Gouled and Aviation branches, at the end of the commercial challenge
3,788
Net operating income Net income
1,3211,631
4,482
2015 20162015 2016
18.3 % 23.5 %

69
BANK O
F A
FRIC
A G
roup
ANNUAL REPORT 2
016
Highlights
‘’Route de l’Aéroport’’ branch in Djibouti
The staff posing on the occasion of the ‘’Soirée Cohésion’’
January Launch of the new website.
AprilInauguration of the 'Elite' Branch at the Bank'sregistered office.
May ''Prêt Ma Maison'' promotional campaign.
JuneSigning of an agreement with the 'International Schoolof Africa' (ISA) to provide priority access for fundingacademic studies.
Inauguration of the 'Route de l’Aéroport' Branch in thecapital.
JulyOfficial opening of the new Business Centre in thecity of Djibouti.
August Launch of the new 'Avance Aïd El-Adha' product.
September Participation in the 2016 BANK OF AFRICADirectors’ Meetings, in Marrakech, Morocco.

70
ANNUAL REPORT 2
016
BANK O
F A
FRIC
A G
roup
ASSETS 2015 2016 VARIATION CASH 1 151 648 519 1 513 824 572 31 %
INTERBANK LOANS 62 934 722 190 64 154 757 337 2 %
CUSTOMER LOANS 21 932 199 521 23 221 824 642 6 %
- Portfolio of discounted bills 558 199 517 178 117 294 -68 %
- Other customer credit facilities 17 569 687 591 18 951 620 874 8 %
- Ordinary debtor accounts 3 804 312 412 4 092 086 473 8 %
- Factoring
INVESTMENT SECURITIES 16 694 132
FINANCIAL ASSETS
LEASING AND SIMILAR TRANSACTIONS
FINANCIAL ASSETS AT EQUITY VALUE 1 223 122 388 1 197 673 262 -2 %
INTANGIBLE ASSETS 53 637 615 28 902 363 -46 %
FIXED ASSETS 566 322 100 530 083 238 -6 %
SHAREHOLDERS & ASSOCIATES
OTHER ASSETS 963 157 778 1 170 567 676 22 %
SUNDRY ACCOUNTS 2 290 157 932 2 164 871 788 -5 %
CONSOLIDATED GOODWILL
TOTAL ASSETS 91 114 968 043 93 999 199 010 3 %
OFF-BALANCE-SHEET 2015 2016 VARIATION COMMITMENTS GIVEN 9 494 045 325 8 344 682 339 -12 %
Credit commitments 5 067 096 292 3 796 600 504 -25 %
• to credit institutions
• to customers 5 067 096 292 3 796 600 504 -25 %
Guarantees given 4 426 949 033 4 548 081 834 3 %
• on behalf of credit institutions
• on behalf of customers 4 426 949 033 4 548 081 834 3 %
Commitments on securities
Compared balance sheet for the past two fiscal years (in DJF)
(DJF). The DJF has a fixed exchange rate with the USD, at a rate of USD 1 = DJF 177.721.Euro 1 = DJF 186.056 as at 31/12/2016

71
BANK O
F A
FRIC
A G
roup
ANNUAL REPORT 2
016
LIABILITIES 2015 2016 VARIATIONINTERBANK LIABILITIES 2 009 942 812 2 634 219 821 31 %CUSTOMER DEPOSITS 79 487 386 441 80 859 345 894 2 %- Savings deposit accounts 2 740 120 100 3 394 129 877 24 %- Time deposit account 31 415 445 41 486 351 32 %- Short-term borrowings 2 240 655 993 2 428 923 301 8 %- Other demand deposits 57 794 788 341 51 935 178 221 -10 %- Other time deposit accounts 16 680 406 563 23 059 628 144 38 %DEBTS EVIDENCED BY SECURITIESOTHER LIABILITIES 613 493 821 775 476 131 26 %SUNDRY ACCOUNTS 2 343 985 602 1 826 902 892 -22 %RESERVES FOR CONTINGENCIES & LOSSES 19 392 191 60 532 047 212 %STATUTORY PROVISIONSEARMARKED FUNDS SUBORDINATED LOANS & SECURITIES INVESTMENT SUBSIDIESRESERVES FOR GENERAL BANKING RISKS 102 312 133 152 785 524 49 %SHARE CAPITAL 1 500 000 000 1 500 000 000 0 %SHARE PREMIUMSRESERVES 3 150 000 000 3 150 000 000 0 %RETAINED EARNINGS ( +/- ) 567 693 210 1 408 455 043 148 %NET INCOME 1 320 761 833 1 631 481 658 24 %TOTAL LIABILITIES 91 114 968 043 93 999 199 011 3 %
OFF-BALANCE-SHEET 2015 2016 VARIATION COMMITMENTS RECEIVED 41 942 344 599 43 211 820 424 3 % Credit commitments 2 310 373 000 2 310 373 000 0 %
• received from credit institutions 2 310 373 000 2 310 373 000 0 %• received from customers
Guarantees given 39 631 971 599 40 901 447 424 3 %• received from credit institutions 767 488 378 1 091 236 484 42 %• received from customers 38 864 483 221 39 810 210 940 2 %
Commitments on securities
(in DJF)

Compared income for the past two fiscal years (in DJF)
2015 2016 VARIATION
INTEREST INCOME 2 635 337 335 3 146 662 470 19%
INTEREST EXPENSE -169 531 575 -228 919 248 35%
NET INTEREST INCOME 2 465 805 760 2 917 743 222 18%
FEE AND COMMISSION INCOME 1 296 493 523 8 650 976 432 567%
FEE AND COMMISSION EXPENSE -36 287 136 -7 168 325 114 19654%
NET FEE AND COMMISSION INCOME 1 260 206 387 1 482 651 318 18%
NET OTHER INCOME 61 586 835 81 305 205 32%
NET OPERATING INCOME 3 787 598 982 4 481 699 745 18%
OPERATING EXPENSES -2 036 427 060 -2 119 842 030 4%
GROSS OPERATING PROFIT 1 751 171 922 2 361 857 715 35%
IMPAIRMENT CHARGES 11 081 956 -101 015 757 -1012%
NET PROVISION FOR GENERAL BANKING RISK -15 000 000 -50 473 391 236%
EXCEPTIONAL INCOME INCLUDING PREVIOUS FISCAL YEARS’ 18 761 900 7 467 993 -60%
PROFIT BEFORE INCOME TAX 1 766 015 778 2 217 836 560 26%
INCOME TAX EXPENSE -445 253 945 -586 354 902 32%
NET INCOME 1 320 761 833 1 631 481 658 24%
72
ANNUAL REPORT 2
016
BANK O
F A
FRIC
A G
roup
(DJF). The DJF has a fixed exchange rate with the USD, at a rate of USD 1 = DJF 177.721.Euro 1 = DJF 186.056 as at 31/12/2016

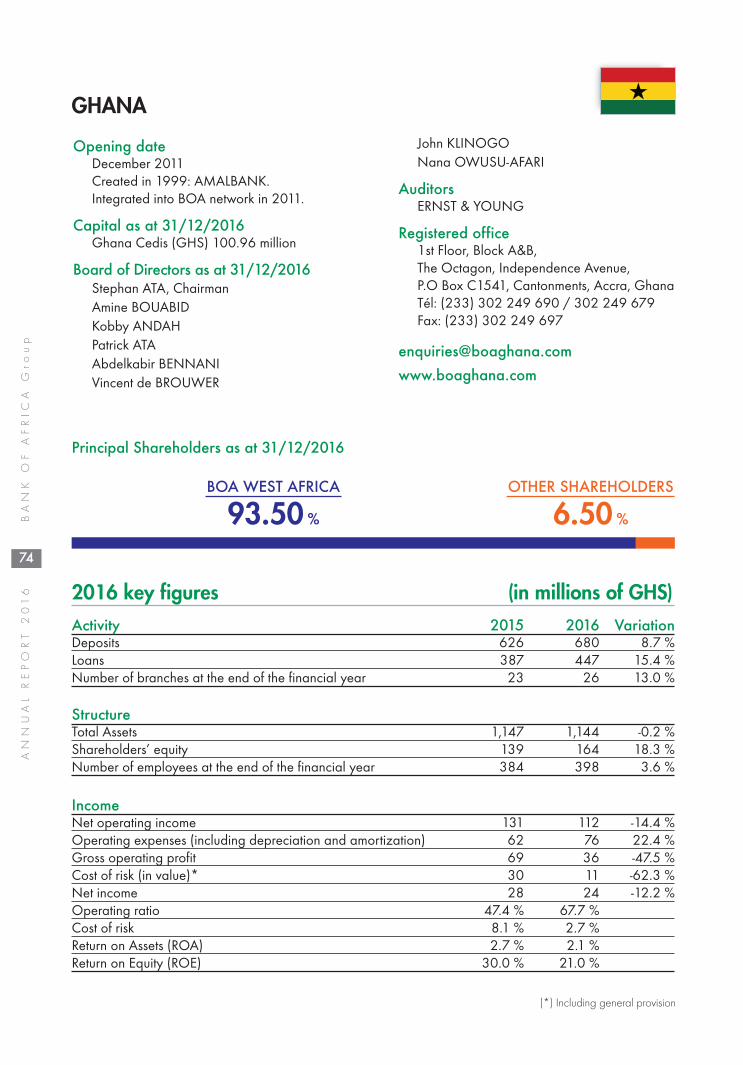
74
ANNUAL REPORT 2
016
BANK O
F A
FRIC
A G
roup
2016 key figures (in millions of GHS)
Opening date December 2011Created in 1999: AMALBANK.Integrated into BOA network in 2011.
Capital as at 31/12/2016Ghana Cedis (GHS) 100.96 million
Board of Directors as at 31/12/2016Stephan ATA, ChairmanAmine BOUABIDKobby ANDAHPatrick ATAAbdelkabir BENNANIVincent de BROUWER
Principal Shareholders as at 31/12/2016
John KLINOGONana OWUSU-AFARI
AuditorsERNST & YOUNG
Registered office1st Floor, Block A&B,The Octagon, Independence Avenue, P.O Box C1541, Cantonments, Accra, Ghana Tél: (233) 302 249 690 / 302 249 679Fax: (233) 302 249 697
BOA WEST AFRICA
93.50 %
OTHER SHAREHOLDERS
6.50 %
Activity 2015 2016 VariationDeposits 626 680 8.7 %Loans 387 447 15.4 %Number of branches at the end of the financial year 23 26 13.0 %
StructureTotal Assets 1,147 1,144 -0.2 %Shareholders’ equity 139 164 18.3 %Number of employees at the end of the financial year 384 398 3.6 %
IncomeNet operating income 131 112 -14.4 %Operating expenses (including depreciation and amortization) 62 76 22.4 %Gross operating profit 69 36 -47.5 %Cost of risk (in value)* 30 11 -62.3 %Net income 28 24 -12.2 %Operating ratio 47.4 % 67.7 %Cost of risk 8.1 % 2.7 %Return on Assets (ROA) 2.7 % 2.1 %Return on Equity (ROE) 30.0 % 21.0 %
(*) Including general provision
GHANA
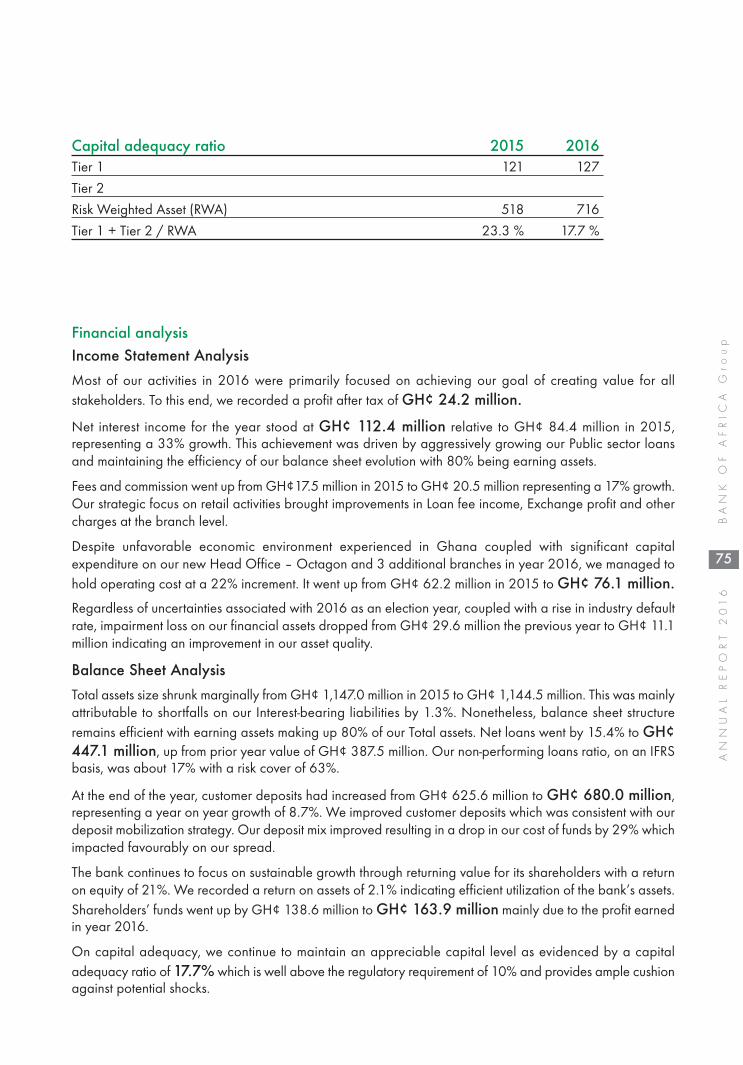
75
BANK O
F A
FRIC
A G
roup
ANNUAL REPORT 2
016
Capital adequacy ratio 2015 2016Tier 1 121 127
Tier 2
Risk Weighted Asset (RWA) 518 716
Tier 1 + Tier 2 / RWA 23.3 % 17.7 %
Financial analysisIncome Statement AnalysisMost of our activities in 2016 were primarily focused on achieving our goal of creating value for allstakeholders. To this end, we recorded a profit after tax of GH¢ 24.2 million.
Net interest income for the year stood at GH¢ 112.4 million relative to GH¢ 84.4 million in 2015,representing a 33% growth. This achievement was driven by aggressively growing our Public sector loansand maintaining the efficiency of our balance sheet evolution with 80% being earning assets.
Fees and commission went up from GH¢17.5 million in 2015 to GH¢ 20.5 million representing a 17% growth.Our strategic focus on retail activities brought improvements in Loan fee income, Exchange profit and othercharges at the branch level.
Despite unfavorable economic environment experienced in Ghana coupled with significant capitalexpenditure on our new Head Office – Octagon and 3 additional branches in year 2016, we managed tohold operating cost at a 22% increment. It went up from GH¢ 62.2 million in 2015 to GH¢ 76.1 million.Regardless of uncertainties associated with 2016 as an election year, coupled with a rise in industry defaultrate, impairment loss on our financial assets dropped from GH¢ 29.6 million the previous year to GH¢ 11.1million indicating an improvement in our asset quality.
Balance Sheet AnalysisTotal assets size shrunk marginally from GH¢ 1,147.0 million in 2015 to GH¢ 1,144.5 million. This was mainlyattributable to shortfalls on our Interest-bearing liabilities by 1.3%. Nonetheless, balance sheet structureremains efficient with earning assets making up 80% of our Total assets. Net loans went by 15.4% to GH¢447.1 million, up from prior year value of GH¢ 387.5 million. Our non-performing loans ratio, on an IFRSbasis, was about 17% with a risk cover of 63%.
At the end of the year, customer deposits had increased from GH¢ 625.6 million to GH¢ 680.0 million,representing a year on year growth of 8.7%. We improved customer deposits which was consistent with ourdeposit mobilization strategy. Our deposit mix improved resulting in a drop in our cost of funds by 29% whichimpacted favourably on our spread.
The bank continues to focus on sustainable growth through returning value for its shareholders with a returnon equity of 21%. We recorded a return on assets of 2.1% indicating efficient utilization of the bank’s assets.Shareholders’ funds went up by GH¢ 138.6 million to GH¢ 163.9 million mainly due to the profit earnedin year 2016.
On capital adequacy, we continue to maintain an appreciable capital level as evidenced by a capitaladequacy ratio of 17.7%which is well above the regulatory requirement of 10% and provides ample cushionagainst potential shocks.

2016
ROE
21.0 %
76
ANNUAL REPORT 2
016
BANK O
F A
FRIC
A G
roup
Significant performances (in millions of GHS)
625.6
DepositsLoans
387.5
447.1 680.0
2015 2016 2015 2016
8.7 %15.4 %
Operational performance
Our staff strength rose from 384 in 2015 to 398, this was necessitated by expansion in our branch networkby additional 3 in 2016. We continue to increase our presence across the country with our innovative productsand position the business for further growth.
We relocated to our new ultra-modern head office complex in the month of December 2016 which is situatedin the central business hub of the capital, Accra. This strategic location has further improved our corporateimage and placed us in a better position to attract a broader and higher value base of customers.
Our core banking software was upgraded during the year to a higher version. This has enhanced ourprocesses, improved our transaction cycle turnaround times, and led to improved customer service delivery.
Our customer base improved with number of customers and accounts increasing by 23.8% and 24.8% to210,166 and 227,888 respectively. This impacted favourably on customer deposits mobilized for the year.
ConclusionOverall the environment present opportunities going forward and our bank will position itself to takeadvantage and consolidate on the performance we have achieved in recent years. I must commend theBoard and the Group for their firm oversight and support to Management in the execution of their duties.
Stock information (in GHS)
2014 2015 2016 AAGR*Earning per share 0.29 0.28 0.24 -8.0%
Shareholder’s equity per share 0.75 1.09 1.23 27.6%
Net dividend per share
NB: No dividend paid over the period. (*) Average annual growth rate
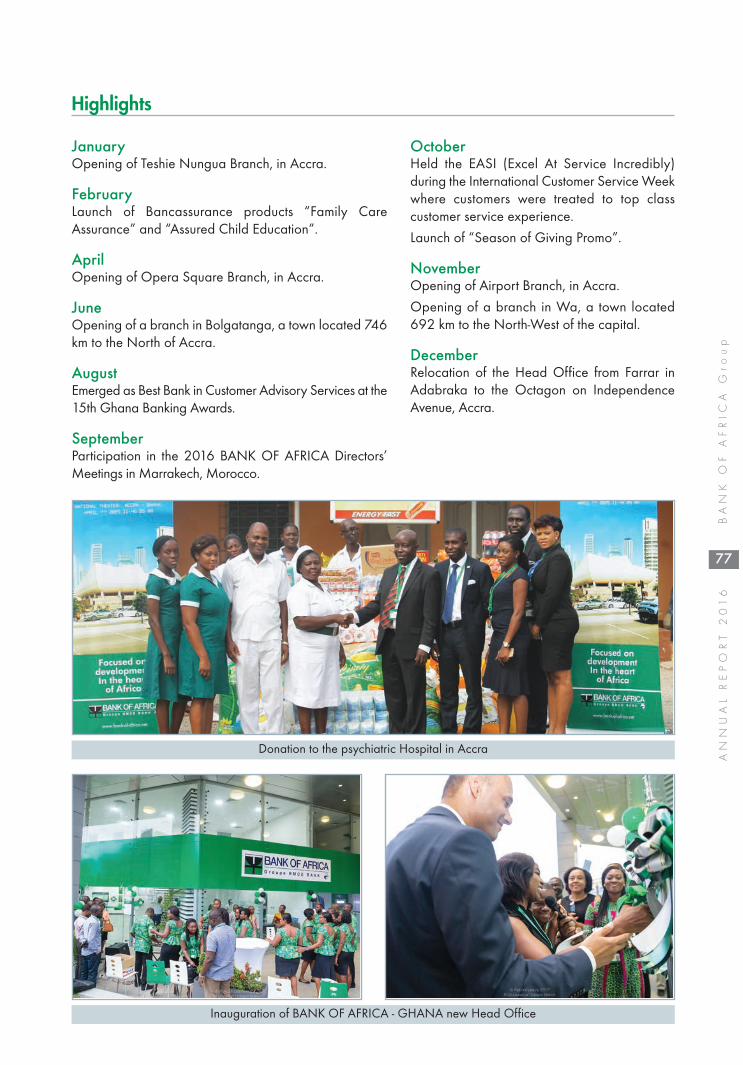
77
BANK O
F A
FRIC
A G
roup
ANNUAL REPORT 2
016
Highlights
JanuaryOpening of Teshie Nungua Branch, in Accra.
FebruaryLaunch of Bancassurance products “Family CareAssurance” and “Assured Child Education”.
AprilOpening of Opera Square Branch, in Accra.
JuneOpening of a branch in Bolgatanga, a town located 746km to the North of Accra.
AugustEmerged as Best Bank in Customer Advisory Services at the15th Ghana Banking Awards.
SeptemberParticipation in the 2016 BANK OF AFRICA Directors’Meetings in Marrakech, Morocco.
OctoberHeld the EASI (Excel At Service Incredibly)during the International Customer Service Weekwhere customers were treated to top classcustomer service experience.
Launch of “Season of Giving Promo”.
NovemberOpening of Airport Branch, in Accra.
Opening of a branch in Wa, a town located692 km to the North-West of the capital.
DecemberRelocation of the Head Office from Farrar inAdabraka to the Octagon on IndependenceAvenue, Accra.
Inauguration of BANK OF AFRICA - GHANA new Head Office
Donation to the psychiatric Hospital in Accra

78
ANNUAL REPORT 2
016
BANK O
F A
FRIC
A G
roup
ASSETS 2015 2016 VARIATIONCASH AND BALANCES WITH CENTRAL BANK 130 520 730 93 626 919 -28 %
GOVERNMENT SECURITIES 439 452 431 196 665 949 -55 %
BALANCES DUE FROM BANKS 113 875 359 266 385 061 134 %
DERIVATIVE ASSETS HELD FOR RISK MANAGEMENT 8 217 328 -100 %
LOANS AND ADVANCES TO CUSTOMERS 387 493 948 447 086 581 15 %
CURRENT INCOME TAX 1 361 769 1 962 548 44 %
PROPERTY AND EQUIPMENT 16 643 817 48 050 873 189 %
DEFERRED INCOME TAX 2 500 900
OTHER ASSETS 49 432 296 88 203 036 78 %
TOTAL ASSETS 1 146 997 678 1 144 481 867 0 %
OFF-BALANCE-SHEET 2015 2016 VARIATION
COMMITMENTS GIVEN 109 154 111 83 067 136 -24 %
Credit commitments 27 551 523 38 876 593 41 %
• to credit institutions
• to customers 27 551 523 38 876 593 41 %
Guarantees given 81 602 588 44 190 543 -46 %
• on behalf of credit institutions
• on behalf of customers 81 602 588 44 190 543 -46 %
Commitments on securities
Compared balance sheet for the past two fiscal years (in GHS)
At 31/12/2016, 1 Euro = 4.4367 Ghanaian Cedis

79
BANK O
F A
FRIC
A G
roup
ANNUAL REPORT 2
016
LIABILITIES 2015 2016 VARIATION
CUSTOMER DEPOSITS 625 592 038 679 980 171 9 %
INTERBANK LIABILITIES 316 846 508 249 992 506 -21 %
DERIVATIVE LIABILITIES HELD FOR RISK MANAGEMENT 21 129 834
OTHER LIABILITIES 44 848 606 50 568 400 13 %
TOTAL LIABILITIES 1 008 416 986 980 541 077 -3 %
SHARE CAPITAL 100 960 828 100 960 828 0 %
STATUTORY RESERVE 36 893 610 48 977 232 33 %
RETAINED EARNINGS (+/-) -29 746 898 -28 924 879 -3 %
CREDIT RISK RESERVE 30 396 925 41 658 527 37 %
AVAILABLE FOR SALE RESERVE 76 227 1 269 082 1565 %
TOTAL SHAREHOLDERS’ EQUITY 138 580 692 163 940 790 18 %
TOTAL LIABILITIES AND SHAREHOLDERS’ EQUITY 1 146 997 678 1 144 481 867 0 %
(in GHS)
Compared income for the past two fiscal years (in GHS)
2015 2016 VARIATIONINTEREST INCOME 115 920 431 134 719 885 16 %INTEREST EXPENSE -31 566 986 -22 345 961 -29 %NET INTEREST INCOME 84 353 445 112 373 924 33 %FEE AND COMMISSION INCOME 19 081 634 22 443 084 18 %FEE AND COMMISSION EXPENSE -1 625 291 -1 950 784 20 %NET FEE AND COMMISSION INCOME 17 456 343 20 492 300 17 %NET OTHER INCOME 29 461 854 -20 500 505 -170 %NET OPERATING INCOME 131 271 642 112 365 719 -14 %OPERATING EXPENSES -62 175 978 -76 110 717 22 %IMPAIRMENT CHARGES ON LOANS AND ADVANCES -29 554 470 -11 139 701 -62 %PROFIT BEFORE INCOME TAX 39 541 194 25 115 301 -36 %NATIONAL FISCAL STABILIZATION LEVY -1 977 060 -1 255 765 -36 %INCOME TAX EXPENSE -10 044 970 307 707 -103 %NET INCOME 27 519 164 24 167 243 -12 %

80
ANNUAL REPORT 2
016
BANK O
F A
FRIC
A G
roup
2016 key figures (in millions of KES)
Opening date : July 2004Created in 1981: BANQUE INDOSUEZKenyan Branch > CREDIT AGRICOLE–INDOSUEZ > CALYON.Incorporated under Kenyan law, integrated asa subsidiary into BOA network in 2004.
Capital as at 31/12/2016Kenyan Shillings (KES) 6.217 billion
Board of Directors as at 31/12/2016Ambassador Dennis AWORI, Chairman
Amine BOUABID
Abdelkabir BENNANI
Vincent de BROUWER
Susan KASINGA
Principal Shareholders as at 31/12/2016
Eunice MBOGO
Ronald MARAMBII
AuditorsPRICEWATERHOUSECOOPERS
Registered officeBOA House, Karuna Close off WaiyakiWay, WestlandsP.O. Box 69562-00400 - Nairobi - KenyaTel.: (254) (254) 20 327 5000 Fax: (254) 20 221 1477E-mail: <[email protected]>
BANK OF AFRICA - BENIN
32.28 %
NETHERLANDSDEVELOPMENT FINANCE
COMPANY (FMO)
13.41 %
AFH-OCEAN INDIEN
11.89 %
BANK OF AFRICA -MADAGASCAR
12.00 %
BANK OF AFRICA -CÔTE D'IVOIRE
11.33 %
BOA GROUP S.A.
12.09 %
OTHERSHAREHOLDERS
7.00 %
Activity 2015 2016 VariationDeposits 47,488 34,464 -27.4 %Loans 37,799 31,542 -16.6 %Number of branches at the end of the financial year 42 44 4.8 %
StructureTotal Assets 69,280 55,996 -19.2 %Shareholders’ equity 8,496 8,418 - 0.9 %Number of employees at the end of the financial year 511 515 0.8 %
KENYA

81
BANK O
F A
FRIC
A G
roup
ANNUAL REPORT 2
016
Income 2015 2016 VariationNet operating income 4,272 3,969 -7.1 %Operating expenses (including depreciation and amortization) 2,912 2,905 0.2 %Gross operating profit 1,360 1,063 -21.8 %Cost of risk (in value)* 2,778 1,216 -56.2 %Net income -1 023 10 -101.0 %Operating ratio 68.2 % 73.2 %Cost of risk 7.3 % 3.5 % Return on Assets (ROA) -1.5 % 0.0 % Return on Equity (ROE) -12.5 % 0.1 %
Capital adequacy ratioTier 1 6 970 5 585Tier 2 1 681 2 052Risk Weighted Asset (RWA) 52 778 47 248Tier 1 + Tier 2 / RWA 16.4 % 16.2 %
(*) Including general provision
Financial analysis
In 2016, BANK OF AFRICA - KENYA (BOA-KENYA) recorded a net profit of KES 10.4 million compared to anet loss of KES 1,023.4 million in 2015. The key drivers of the improved 2016 performance were as follows:
- Balance sheet shrinkage so as to let go of relatively expensive liabilities and assets whose return was belowexpected threshold.
- Improved asset and liability management leading to reduced cost of funds.
- Stringent management of the asset portfolio with close follow up leading to improved recoveries as well asprevention of further deterioration of the assets.
- Improved fees and commissions from branch operations following growth in account numbers and newelectronic products such as e-customs, i-Tax and enhanced mobile banking.
- Improved results of the Bank’s associated companies leading to increased share of income (BOA Ugandawhere BOA Kenya owns 43.24% shareholding).
- Tight control over operating expenses especially on staff costs.
Key strategies of the Bank however did not materialize during 2016 such as deepening business growth in theSME sector due to the challenging operating environment following a market confidence crisis in the BankingIndustry in Kenya and the interest rate regulation passed under the Banking (Amendment) Act 2016.
The results of the Bank therefore reflect the harsh operating environment which started in October 2015 followingthe collapse of Imperial Bank and the first recorded segmentation of the banking industry. The situation continuedin 2016 with the collapse of Chase Bank that triggered a run on banks following a market confidence crisisaffecting Tier 2 and 3 banks (BOA-KENYA is in Tier 2) where depositors moved their deposits to Tier 1 banks

82
ANNUAL REPORT 2
016
BANK O
F A
FRIC
A G
roup
Significant performances (in millions of KES)
Stock information (in KES)
2014 2015 2016 AAGR*Earning per share 27 -160 2 -75.54 %Shareholder’s equity per share 1,500 1,326 1,314 -6.39 %Dividendes par action 0 0 0
(*) Average annual growth rate
-1,023.3
Net income Cost of risk
6.9 %
3.3 %
10.4
2015 20162015
20162015 20162015
in what was described as a “flight to size”. The effects of this was far reaching and more intense than the October2015 flight with the near collapse of the money market (with banks not trusting each other), the suspension oftrade lines by correspondent banks abroad as they took steps to control their risk exposure in Kenya and theloss of funds by fund managers in collapsed banks (hence reducing liquidity avenues for Tier 2 and 3 Banks).Interest rate control was then introduced in quarter 2016 just as the market was recovering from the segmentationrisk, leading to the inability of banks in Kenya to price for risk on one end, and the inability to offer remunerateddeposits at a price that could support already booked assets (due to a floor being introduced on deposit rates).This affected strategies, with banks having to reorganize themselves both on the assets and liabilities side. Duringthe same year, private sector credit growth had started declining due to largely the market liquidity crisis, withmost liquid banks opting to invest surplus funds in Treasury bills and bonds. The interest rate control that happenedin September 2016 went further to aggravate the position. In the midst of all these, the non performing accountsin the industry had been on the upward trend and this too impacted negatively on the industry with heftyprovisions being taken and more caution being exercised on risk asset generation by the industry.
The Bank’s Management remains optimistic about 2017 and has reorganized the Bank so as to better manageits operating expenses and cost of risk. Further, the Bank is embarking on a digitalization strategy which willlead to enhanced IT systems capabilities. This is expected to improve customer experience, enhance transactionaldeposit collections as well as improve operating efficiencies. In line with the digitalization strategy, the Bank isrationalizing its branch network and is in the process of closing 12 retail branches out of its network of 44branches and leverage on technology to serve clients better.

83
BANK O
F A
FRIC
A G
roup
ANNUAL REPORT 2
016
Highlights
Debate with clients during the ‘’SupaMamas’’ events
MarchLaunch of the Bank’s new identity that brought about a newoutlook of the brand as part of the BMCE Bank Group.
AprilHeld World Marathon viewings, for the 2nd yearrunning, in an effort to reinforce the relationship with andsupport the Athletes community in Kenya.
MayPartnership with a social event engagement organizationfor mortgage, business and saving advice to women.
Customer SME and Chama Clinics on Investing in aTurbulent Economic Environment.
Sponsorship of the SupaMamas events in Kisumu andNairobi in support of women; the events providedplatforms for discussions on Property Ownership forWomen, Personal Branding and Financial Management
JuneLaunch of a branch in Kakamega (WesternKenya).
AugustLaunch of a branch in Ukunda (Coastal Kenya).
SeptemberParticipation in the 2016 BANK OF AFRICANetwork Management Meetings in Marrakech,Morocco.
DecemberRelocation of the Head Office from KenyaReinsurance Plaza on Taifa Road to BOA Houseon Karuna Close, off Waiyaki Way in Westlands,Nairobi.
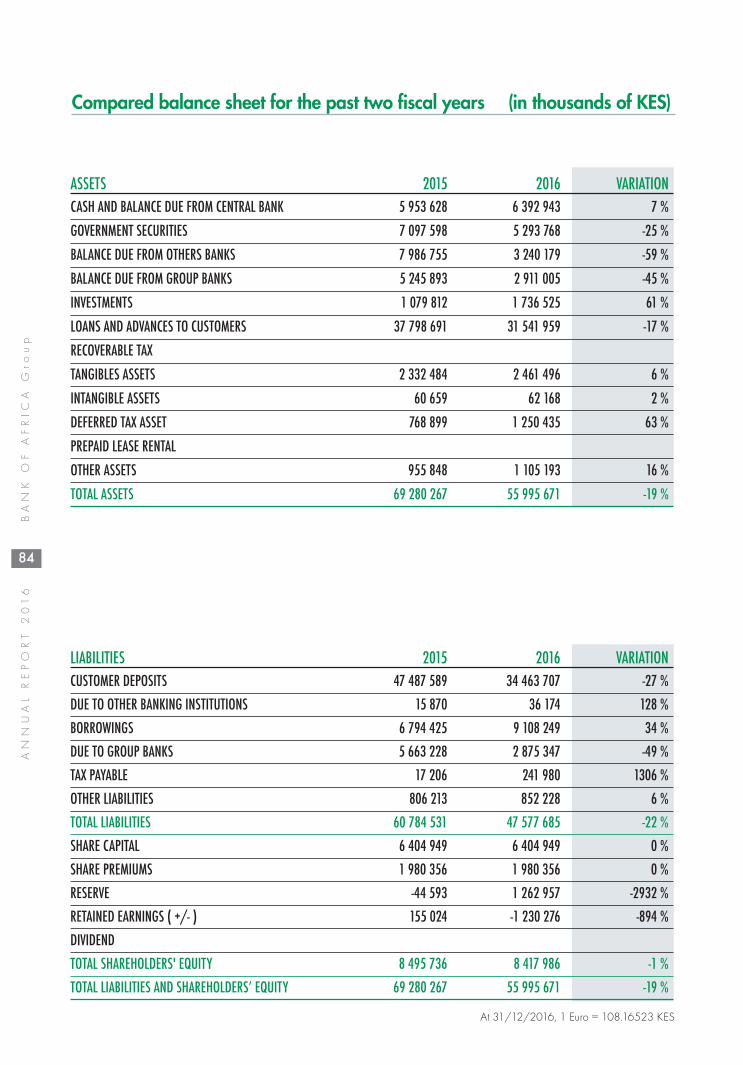
84
ANNUAL REPORT 2
016
BANK O
F A
FRIC
A G
roup
ASSETS 2015 2016 VARIATIONCASH AND BALANCE DUE FROM CENTRAL BANK 5 953 628 6 392 943 7 %
GOVERNMENT SECURITIES 7 097 598 5 293 768 -25 %
BALANCE DUE FROM OTHERS BANKS 7 986 755 3 240 179 -59 %
BALANCE DUE FROM GROUP BANKS 5 245 893 2 911 005 -45 %
INVESTMENTS 1 079 812 1 736 525 61 %
LOANS AND ADVANCES TO CUSTOMERS 37 798 691 31 541 959 -17 %
RECOVERABLE TAX
TANGIBLES ASSETS 2 332 484 2 461 496 6 %
INTANGIBLE ASSETS 60 659 62 168 2 %
DEFERRED TAX ASSET 768 899 1 250 435 63 %
PREPAID LEASE RENTAL
OTHER ASSETS 955 848 1 105 193 16 %
TOTAL ASSETS 69 280 267 55 995 671 -19 %
LIABILITIES 2015 2016 VARIATIONCUSTOMER DEPOSITS 47 487 589 34 463 707 -27 %DUE TO OTHER BANKING INSTITUTIONS 15 870 36 174 128 %BORROWINGS 6 794 425 9 108 249 34 %DUE TO GROUP BANKS 5 663 228 2 875 347 -49 %TAX PAYABLE 17 206 241 980 1306 % OTHER LIABILITIES 806 213 852 228 6 %TOTAL LIABILITIES 60 784 531 47 577 685 -22 %SHARE CAPITAL 6 404 949 6 404 949 0 %SHARE PREMIUMS 1 980 356 1 980 356 0 % RESERVE -44 593 1 262 957 -2932 %RETAINED EARNINGS ( +/- ) 155 024 -1 230 276 -894 %DIVIDENDTOTAL SHAREHOLDERS' EQUITY 8 495 736 8 417 986 -1 %TOTAL LIABILITIES AND SHAREHOLDERS’ EQUITY 69 280 267 55 995 671 -19 %
Compared balance sheet for the past two fiscal years (in thousands of KES)
At 31/12/2016, 1 Euro = 108.16523 KES

85
BANK O
F A
FRIC
A G
roup
ANNUAL REPORT 2
016
OFF-BALANCE-SHEET 2015 2016 VARIATION
COMMITMENTS GIVEN 13 593 177 11 914 084 -12 %
Credit commitments 3 781 511 1 124 045 -70 %
• to credit institutions 3 951 666 -100 %
• to customers 3 777 559 1 124 045 -70 %
Guarantees given 9 811 666 10 790 039 10 %
• on behalf of credit institutions 288 628 -100 %
• on behalf of customers 9 523 038 10 790 039 13 %
Commitments on securities
(in thousands of KES)
Compared income for the past two fiscal years
2015 2016 VARIATIONINTEREST RECEIVED 6 914 635 6 515 259 -6 %INTEREST PAID -3 764 295 -3 492 703 -7 %NET MARGIN ON BANKING ACTIVITIES 3 150 340 3 022 556 -4 %COMMISSIONS RECEIVED 813 443 699 336 -14 %COMMISSIONS PAID -9 538 -18 244 91 %NET COMMISSIONS AND OTHERS 803 905 681 092 -15 %INCOME OF CHANGE OPERATIONS 317 864 256 650 -19 %OTHER OPERATING INCOME 8 516TOTAL OPERATING INCOME 4 272 109 3 968 814 -7 %OPERATING EXPENSES -2 911 646 -2 905 496 0 %GROSS OPERATING PROFIT 1 360 463 1 063 318 -22 %IMPAIRMENT CHARGES -2 777 945 -1 216 268 -56 %NET PROVISION FOR GENERAL BANKING RISKPROFIT ON INVESTISSEMENT -16 706 136 453 917 %PROFIT BEFORE TAX -1 434 188 -16 497 -99 %INCOME TAX EXPENSE 410 827 26 967 -93 %NET PROFIT -1 023 361 10 470 101 %
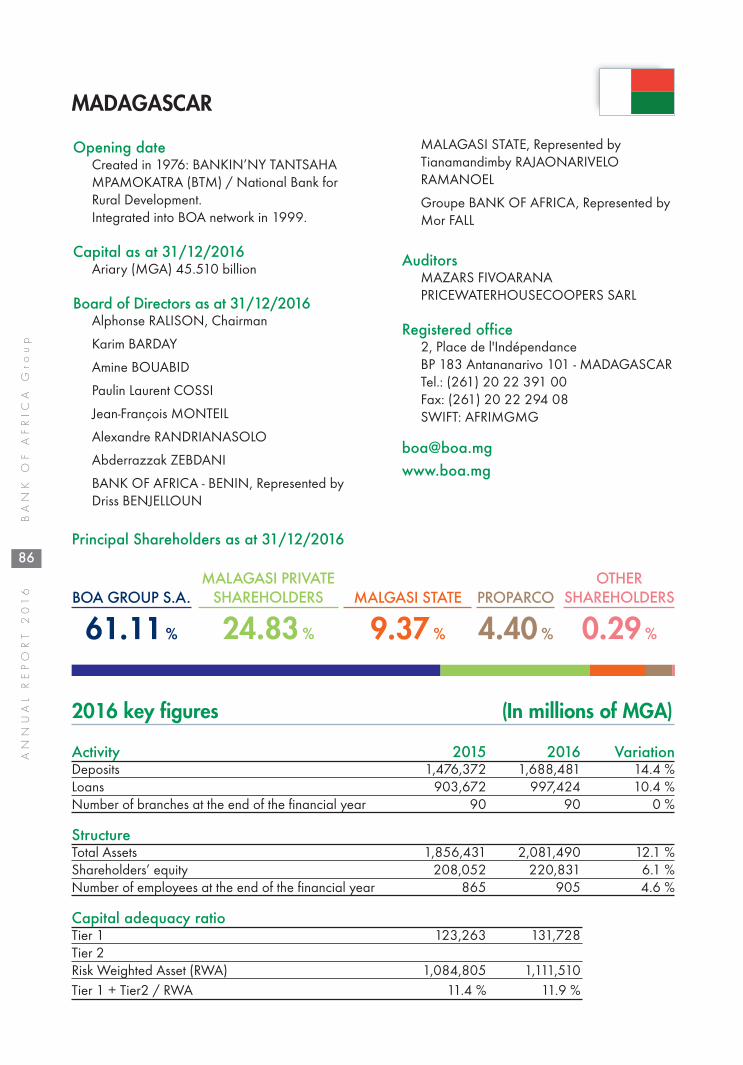
86
ANNUAL REPORT 2
016
BANK O
F A
FRIC
A G
roup
2016 key figures (In millions of MGA)
Opening date Created in 1976: BANKIN’NY TANTSAHAMPAMOKATRA (BTM) / National Bank forRural Development.Integrated into BOA network in 1999.
Capital as at 31/12/2016Ariary (MGA) 45.510 billion
Board of Directors as at 31/12/2016Alphonse RALISON, Chairman
Karim BARDAY
Amine BOUABID
Paulin Laurent COSSI
Jean-François MONTEIL
Alexandre RANDRIANASOLO
Abderrazzak ZEBDANI
BANK OF AFRICA - BENIN, Represented byDriss BENJELLOUN
Principal Shareholders as at 31/12/2016
MALAGASI STATE, Represented byTianamandimby RAJAONARIVELORAMANOEL
Groupe BANK OF AFRICA, Represented byMor FALL
AuditorsMAZARS FIVOARANAPRICEWATERHOUSECOOPERS SARL
Registered office2, Place de l'IndépendanceBP 183 Antananarivo 101 - MADAGASCARTel.: (261) 20 22 391 00Fax: (261) 20 22 294 08SWIFT: AFRIMGMG
BOA GROUP S.A.
61.11 %
MALAGASI PRIVATESHAREHOLDERS
24.83 %
MALGASI STATE
9.37 %
PROPARCO
4.40 %
OTHERSHAREHOLDERS
0.29 %
Activity 2015 2016 VariationDeposits 1,476,372 1,688,481 14.4 %Loans 903,672 997,424 10.4 %Number of branches at the end of the financial year 90 90 0 %
StructureTotal Assets 1,856,431 2,081,490 12.1 %Shareholders’ equity 208,052 220,831 6.1 %Number of employees at the end of the financial year 865 905 4.6 %
Capital adequacy ratioTier 1 123,263 131,728Tier 2 Risk Weighted Asset (RWA) 1,084,805 1,111,510Tier 1 + Tier2 / RWA 11.4 % 11.9 %
MADAGASCAR

87
BANK O
F A
FRIC
A G
roup
ANNUAL REPORT 2
016
Income 2015 2016 VariationNet operating income 155,229 173,125 11.5 %Operating expenses (including depreciation and amortization) 88,560 89,500 1.1 %Gross operating profit 53,642 70,501 31.4 %Cost of risk (in value)* -14,863 3,338 122.5 %Net income 54,641 53,159 -2.7 %Operating ratio 65.4 % 59.3 %Cost of risk -1.7 % 0.4 %Return on Assets (ROA) 3.1 % 2.7 %Return on Equity (ROE) 27.1 % 24.8 %(*) Including general provision
Financial analysis
The balance sheet for 2016 was positive overall, helping BANK OF AFRICA – MADAGASCAR (BOA-MADAGASCAR) to consolidate its top-ranking position in terms of numbers of customers and deposits. Therewas also a significant increase in customer loans, with a sustained contribution to the financing of thecountry's economic development.
Banking activities developed strongly in 2016, with increases in deposits (up 14.4%) and loans (up10.4%) and a total balance sheet going over the MGA 2,000 billion mark at MGA 2,081.5 billion at endDecember 2016, an annual increase of 12.1%.
In line with this increase in activities 2016 ended:
- Net interest income increased by 18.4% to MGA 105.0 billion, resulting in particular from thereduction in interest paid on customer deposits (down 15.4%) along with an increase of income fromcustomer loans (up 9.2%);
- Net Operating Income registered growth of 11.5% to MGA 173.1 billion, thanks to the significant increasein NBM, the increase recorded in net income from commissions (up 14.4%) in spite of the resultingdecrease in income from currency exchange (down 48.5%) following the regulatory change in this area;
- Direct operating costs showed an annual increase of 1.1%, reflecting the Bank's cost reduction strategy,helping to bring about a significant decrease in the operating ratio (down 6.1 points), which stood at59.3% at end December 2016;
- Gross operating profit (GOP) increased by 31.4% to MGA 70.5 billion, in particular thanks tokeeping a tight rein on general operating overheads;
- Net income stood at MGA 53.2 billion, a slight decrease compared to 2015, which was positivelyaffected by exceptional items, with the write-back of provisions on a major case in litigation. If we discountthis exceptional write-back from 2015, net income for 2016 would have shown an annualincrease of 21.8%;
- Financial profitability remained at a satisfactory level of ROE and ROA, which were recorded at24.8% and 2.7% respectively;
- The bank’s solvency ratio stood at 11.9 % at the end of December 2016, for a regulatory minimum of 8%.
These financial and commercial achievements made 2016 a generally positive year for BOA-MADAGASCAR, resulting in both the consolidation of the Bank's place on the market and its financial position.

88
ANNUAL REPORT 2
016
BANK O
F A
FRIC
A G
roup
Significant performances (in billions of MGA)
Stock Information (in MGA)
2014 2015 2016 AAGR*Net earnings per share 24,574.6 24,446.2 23,361.6 -2.5 %
Equity per share (before profit distribution) 86,071.4 93,262.3 97,047.9 6.2 %
Equity per share (after profit distribution) 68,871.4 76,062.3 79,847.9 7.7 %
Dividend per share 17,200.0 17,200.0 17,200.0 0.0 %
(*) Average annual growth rate
1,476.3
Deposits Net operating income
155.2
173.11,688.4
2015 20162015 2016
14.4 % 11.5 %
Chairman Othman Benjelloun visiting Madagascar
2016
ROE
24.8 %
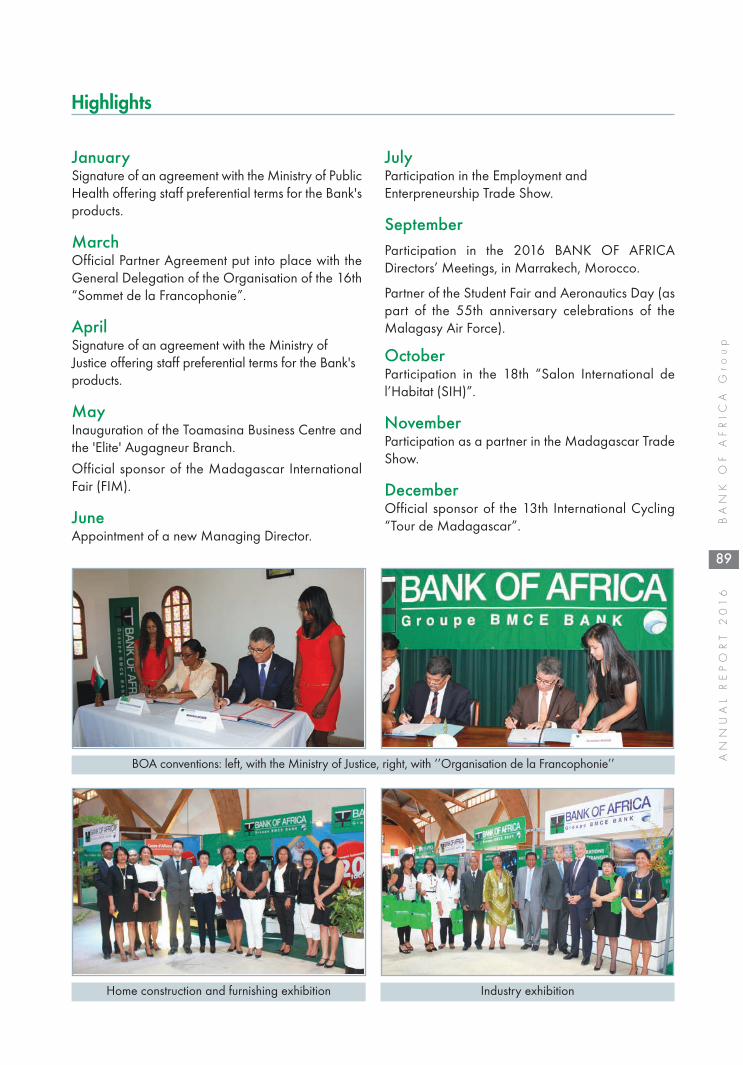
89
BANK O
F A
FRIC
A G
roup
ANNUAL REPORT 2
016
Highlights
JanuarySignature of an agreement with the Ministry of PublicHealth offering staff preferential terms for the Bank'sproducts.
MarchOfficial Partner Agreement put into place with theGeneral Delegation of the Organisation of the 16th“Sommet de la Francophonie”.
AprilSignature of an agreement with the Ministry ofJustice offering staff preferential terms for the Bank'sproducts.
MayInauguration of the Toamasina Business Centre andthe 'Elite' Augagneur Branch.
Official sponsor of the Madagascar InternationalFair (FIM).
JuneAppointment of a new Managing Director.
JulyParticipation in the Employment andEnterpreneurship Trade Show.
SeptemberParticipation in the 2016 BANK OF AFRICADirectors’ Meetings, in Marrakech, Morocco.
Partner of the Student Fair and Aeronautics Day (aspart of the 55th anniversary celebrations of theMalagasy Air Force).
OctoberParticipation in the 18th “Salon International del’Habitat (SIH)”.
NovemberParticipation as a partner in the Madagascar TradeShow.
DecemberOfficial sponsor of the 13th International Cycling“Tour de Madagascar”.
Home construction and furnishing exhibition Industry exhibition
BOA conventions: left, with the Ministry of Justice, right, with ‘’Organisation de la Francophonie’’

90
ANNUAL REPORT 2
016
BANK O
F A
FRIC
A G
roup
ASSETS 2015 2016 VARIATIONCASH 71 345 236 846 62 329 921 199 -13 %
INTERBANK LOANS 683 216 698 993 835 289 586 434 22 %
CUSTOMER LOANS 903 672 325 790 997 423 726 184 10 %
- Portfolio of discounted bills 76 981 532 909 69 636 692 274 -10 %
- Other customer credit facilities 674 591 752 472 764 092 065 937 13 %
- Ordinary debtor accounts 152 099 040 409 163 694 967 973 8 %
- Factoring
INVESTMENT SECURITIES
FINANCIAL ASSETS 40 168 879 868 41 541 215 098 3 %
LEASING AND SIMILAR TRANSACTIONS 14 833 517 -100 %
FINANCIAL ASSETS AT EQUITY VALUE
INTANGIBLE ASSETS 3 145 767 022 1 987 041 358 -37 %
FIXED ASSETS 81 736 295 156 77 403 375 037 -5 %
SHAREHOLDERS & ASSOCIATES
OTHER ASSETS 70 511 997 804 63 120 618 933 -11 %
SUNDRY ACCOUNTS 2 618 788 181 2 394 825 582 -9 %
CONSOLIDATED GOODWILL
TOTAL ASSETS 1 856 430 823 177 2 081 490 309 826 12 %
OFF-BALANCE-SHEET 2015 2016 VARIATIONCOMMITMENTS GIVEN 161 887 470 644 189 677 831 377 17 %Credit commitments 161 887 470 644 189 677 831 377 17 %
• to credit institutions 3 497 620 001 3 509 530 001 0 %• to customers 158 389 850 643 186 168 301 376 18 %
Guarantees given • on behalf of credit institutions • on behalf of customers
Commitments on securities
Compared balance sheet for the past two fiscal years (in MGA)
At 31/12/2016, 1 Euro = 3 509,530 MGA

91
BANK O
F A
FRIC
A G
roup
ANNUAL REPORT 2
016
LIABILITIES 2015 2016 VARIATIONINTERBANK LIABILITIES 57 177 661 968 66 888 479 919 17 %
CUSTOMER DEPOSITS 1 476 371 532 292 1 688 480 777 204 14 %
- Savings deposit accounts 494 125 822 221 603 961 743 482 22 %- Time deposit account- Short-term borrowings 16 702 668 856 25 682 860 826 54 %- Other demand deposits 760 726 077 521 879 026 832 161 16 %- Other time deposit accounts 204 816 963 694 179 809 340 736 -12 %DEBTS EVIDENCED BY SECURITIES
OTHER LIABILITIES 53 326 618 611 43 691 222 343 -18 %
SUNDRY ACCOUNTS 51 897 383 978 51 691 424 260 -0 %
RESERVES FOR CONTINGENCIES & LOSSES 8 420 526 057 9 150 239 801 9 %
STATUTORY PROVISIONS
EARMARKED FUNDS 1 184 124 215 756 766 898 -36 %
SUBORDINATED LOANS & SECURITIES
INVESTMENT SUBSIDIES
RESERVES FOR GENERAL BANKING RISKS
SHARE CAPITAL 45 509 740 000 45 509 740 000 0 %
SHARE PREMIUMS 25 642 392 144 25 642 392 144 0 %
RESERVES 66 563 847 556 88 031 639 915 32 %
RETAINED EARNINGS ( +/- ) 15 696 296 215 8 488 710 580 -46 %
NET INCOME 54 640 700 141 53 158 916 763 -3 %
TOTAL LIABILITIES 1 856 430 823 177 2 081 490 309 826 12 %
OFF-BALANCE-SHEET 2015 2016 VARIATIONCOMMITMENTS RECEIVED 317 915 206 486 339 041 639 869 7 %Credit commitments 37 407 053 805 35 740 890 205 -5 %
• received from credit institutions 37 407 053 805 35 740 890 205 -5 %• received from customers
Guarantees given 20 708 200 000 14 596 235 264 -30 %• received from credit institutions 20 708 200 000 14 596 235 264 -30 %• received from customers
Commitments on securities 259 799 952 681 288 704 514 399 11 %
(in MGA)

92
ANNUAL REPORT 2
016
BANK O
F A
FRIC
A G
roup
Compared income for the past two fiscal years (in MGA)
2015 2016 VARIATION
INTEREST INCOME 129 903 321 231 141 067 916 516 9 %
INTEREST EXPENSE -41 250 990 135 -36 079 475 769 -13 %
NET INTEREST INCOME 88 652 331 096 104 988 440 747 18 %
FEE AND COMMISSION INCOME 81 077 874 666 68 333 108 454 -16 %
FEE AND COMMISSION EXPENSE -17 468 266 386 -7 430 595 369 -57 %
NET FEE AND COMMISSION INCOME 63 609 608 280 60 902 513 084 -4 %
NET OTHER INCOME 2 967 973 451 7 233 684 560 144 %
NET OPERATING INCOME 155 229 912 827 173 124 638 391 12 %
OPERATING EXPENSES -101 587 929 065 -102 623 372 145 1 %
GROSS OPERATING PROFIT 53 641 983 762 70 501 266 246 31 %
IMPAIRMENT CHARGES 4 591 971 197 -3 993 150 975 -187 %
NET PROVISION FOR GENERAL BANKING RISK
EXCEPTIONAL INCOME INCLUDING PREVIOUS FISCAL YEARS’ 10 918 465 707 166 194 664 -98 %
PROFIT BEFORE INCOME TAX 69 152 420 665 66 674 309 934 -4 %
INCOME TAX EXPENSE -14 511 720 524 -13 515 393 171 -7 %
NET INCOME 54 640 700 141 53 158 916 763 -3 %
At 31/12/2016, 1 Euro = 3,509.530 MGA


94
ANNUAL REPORT 2
016
BANK O
F A
FRIC
A G
roup
2016 key figures (in millions of CFAF)
Opening date December 1983
Capital as at 31/12/2016CFAF billion 10.3
Board of Directors as at 31/12/2016Paul DERREUMAUX, Chairman
Amine BOUABID
BOA GROUP, Represented by Mamadou Igor DIARRA
Mamadou Sinsy COULIBALY
BOA WEST AFRICA, Represented byAbderrazzak ZEBDANI
BMCE BANK OF AFRICA, Represented byAmine BOUABID
Principal Shareholders as at 31/12/2016
AuditorsSARECI-SARLEGCC INTERNATIONAL SARL / GHA-EXCO
Registered office418, Avenue de la Marne - BP 2249 –Bozola - Bamako - MALITel.: (223) 20 70 05 00Fax: (223) 20 70 05 60Télex: 2581 - SWIFT: AFRIMLBAXXX
BOA WEST AFRICA
61.39 %
PHYSICAL PERSONS
31.07 %
ATTICA S.A.
2.07 %
OTHER LEGAL PERSONS
5.47 %
Activity 2015 2016 VariationDeposits 320,343 313,939 -2.0 %
Loans 258,606 257,691 -0.4 %
Number of branches at the end of the financial year 52 60 15.4 %
StructureTotal Assets 535,666 514,000 -4.0 %
Shareholders’ equity 38,010 41,268 8.6 %
Number of employees at the end of the financial year 365 366 0.3 %
MALI

95
BANK O
F A
FRIC
A G
roup
ANNUAL REPORT 2
016
Income 2015 2016 VariationNet operating income 30,210 29,747 -1.5 %
Operating expenses (including depreciation and amortization) 16,495 17,986 9.0 %
Gross operating profit 13,715 11,761 -14.2 %
Cost of risk (in value)* 2,811 3,515 25.0 %
Net income 7,126 9,403 32.0 %
Operating ratio 54.6 % 60.5 %
Cost of risk 1.2 % 1.4 %
Return on assets (ROA) 1.4 % 1.9 %
Return on equity (ROE) 25.7 % 25.9 %
Capital adequacy ratioTier 1 30,696 32,795
Tier 2 654 68
Risk Weighted Asset (RWA) 228,100 266,945
Tier 1 + Tier 2 / RWA 13.7 % 12.3 % (*) Including general provision
Financial analysis
In a global context marked by slow growth and a significant rise in political, economic and monetaryuncertainty, Mali should see an increase of 5.3% in its Gross Domestic Product (GDP) in spite of anincreasingly challenging security situation.
At year end BANK OF AFRICA - MALI (BOA-MALI) maintained the fundamentals of previous financialyears.
The Bank finished the year under review with a balance sheet total of CFAF 514,000 million and animprovement in capital resources before allocation of CFAF 41,268 million (8.6%).
Customer deposits fell by 2.0% to CFAF 313,939 million at the end of 2016 against CFAF 320,343million at end 2015.
Customer loans stood at CFAF 258,606 at end December 2015 against CFAF 257.691 million at endDecember 2016.
Economic stagnancy in several sectors led to an increase in non performing loans and, thanks to aprudent hedging to an increase in the cost of risk.
Net Banking Income stood at CFAF 29,747 million at end 2016.
However, net income was significantly up (32.0%) on 2015. The Bank closed 2016 in excess of thehistoric CFAF 9,000 million threshold: net income stood at CFAF 9,403 million compared to CFAF7,126 million in 2015.

2016
ROE
25.9 %
96
ANNUAL REPORT 2
016
BANK O
F A
FRIC
A G
roup
Significant performances (in CFAF billion)
Stock information (in CFAF)
2016Closing price at 31/12 40,000Performance NSEarning per share 4,565Shareholder’s equity per share 20,033Market capitalization as of 31/12 (In CFAF billion) 82.4Dividend 3,000PER (Price Earning Ratio) 7.50 %P/B (Price to Book) 8.8xYield dividend 2.0x
may-16 jun-16 jul-16 aug-16 sept-16 oct-16 nov-16 dec-16
1,000900800700600500400300200100
0
Transactions
Monthly volume Benchmark prices
Price in CFAF
70,00065,00060,00055,00050,00045,00040,00035,00030,00025,00020,000
Changes in stock prices and volumes
7.1
Net income
9.4
2015 2016
32.0 %
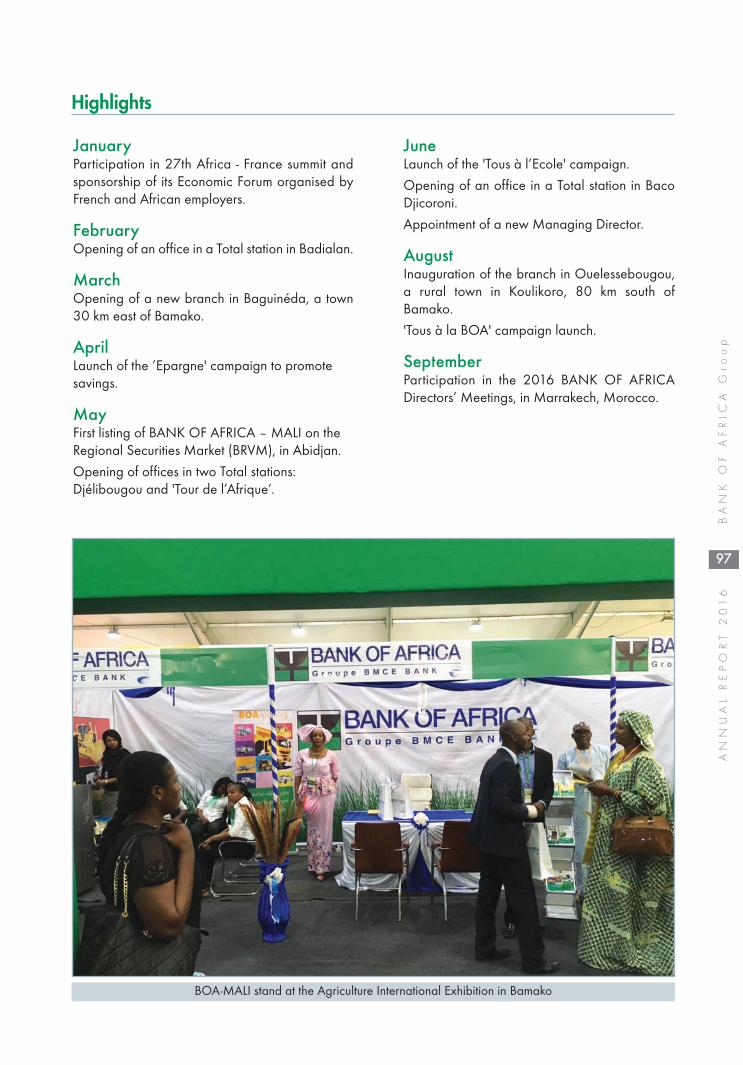
97
BANK O
F A
FRIC
A G
roup
ANNUAL REPORT 2
016
Highlights
JanuaryParticipation in 27th Africa - France summit andsponsorship of its Economic Forum organised byFrench and African employers.
February Opening of an office in a Total station in Badialan.
MarchOpening of a new branch in Baguinéda, a town30 km east of Bamako.
AprilLaunch of the ‘Epargne' campaign to promotesavings.
MayFirst listing of BANK OF AFRICA – MALI on theRegional Securities Market (BRVM), in Abidjan.
Opening of offices in two Total stations:Djélibougou and 'Tour de l’Afrique’.
JuneLaunch of the 'Tous à l’Ecole' campaign.
Opening of an office in a Total station in BacoDjicoroni.
Appointment of a new Managing Director.
AugustInauguration of the branch in Ouelessebougou,a rural town in Koulikoro, 80 km south ofBamako.
'Tous à la BOA' campaign launch.
SeptemberParticipation in the 2016 BANK OF AFRICADirectors’ Meetings, in Marrakech, Morocco.
BOA-MALI stand at the Agriculture International Exhibition in Bamako

98
ANNUAL REPORT 2
016
BANK O
F A
FRIC
A G
roup
ASSETS 2015 2016 VARIATIONCASH 7 983 821 214 8 854 682 614 11 %
INTERBANK LOANS 64 349 934 978 44 449 030 629 -31 %
CUSTOMER LOANS 258 605 546 919 257 690 645 439 0 %
- Portfolio of discounted bills 39 934 975 133 16 335 556 002 -59 %
- Other customer credit facilities 171 387 518 503 194 788 538 194 14 %
- Ordinary debtor accounts 47 283 053 283 46 566 551 243 -2 %
- Factoring
INVESTMENT SECURITIES 152 006 579 688 153 864 933 249 1 %
FINANCIAL ASSETS 1 641 906 265 1 274 583 303 -22 %
LEASING AND SIMILAR TRANSACTIONS 1 554 439 034 1 884 318 979 21 %
FINANCIAL ASSETS AT EQUITY VALUE
INTANGIBLE ASSETS 302 511 311 236 001 301 -22 %
FIXED ASSETS 20 583 589 534 18 793 680 510 -9 %
SHAREHOLDERS & ASSOCIATES
OTHER ASSETS 24 681 101 300 21 616 026 663 -12 %
SUNDRY ACCOUNTS 3 956 644 785 5 336 382 982 35 %
CONSOLIDATED GOODWILL
TOTAL ASSETS 535 666 075 028 514 000 285 669 -4 %
OFF-BALANCE-SHEET 2015 2016 VARIATIONCOMMITMENTS GIVEN 58 304 517 077 183 840 326 859 215 %
Credit commitments 6 141 089 149 2 954 394 867 -52 %
• to credit institutions
• to customers 6 141 089 149 2 954 394 867 -52 %
Guarantees given 52 163 427 928 180 885 931 992 247 %
• on behalf of credit institutions 2 806 841 387 1 840 386 421 -34 %
• on behalf of customers 49 356 586 541 179 045 545 571 263 %
Commitments on securities
Compared balance sheet for the past two fiscal years (in CFAF)
At 31/12/2016, 1 Euro = 655.957 CFAF

99
BANK O
F A
FRIC
A G
roup
ANNUAL REPORT 2
016
LIABILITIES 2015 2016 VARIATIONINTERBANK LIABILITIES 156 340 527 345 139 173 908 826 -11 %CUSTOMER DEPOSITS 320 342 815 054 313 938 664 456 -2 %- Savings deposit accounts 74 855 464 919 85 973 508 159 15 %- Time deposit account 44 333 442 67 119 068 51 %- Short-term borrowings- Other demand deposits 182 467 793 047 163 256 657 999 -11 %- Other time deposit accounts 62 975 223 646 64 641 379 230 3 %DEBTS EVIDENCED BY SECURITIESOTHER LIABILITIES 8 152 640 975 8 853 990 382 9 %SUNDRY ACCOUNTS 8 063 714 229 7 042 752 233 -13 %RESERVES FOR CONTINGENCIES & LOSSES 4 756 822 006 3 723 392 608 -22 %STATUTORY PROVISIONSEARMARKED FUNDS SUBORDINATED LOANS & SECURITIES INVESTMENT SUBSIDIESRESERVES FOR GENERAL BANKING RISKS 3 720 267 945 2 913 508 227 -22 %SHARE CAPITAL 10 300 000 000 10 300 000 000 0 %SHARE PREMIUMS 10 640 025 820 10 640 025 820 0 %RESERVES 4 191 715 777 5 260 662 592 26 %RETAINED EARNINGS ( +/- ) 2 031 233 775 2 750 255 002 35 %NET INCOME 7 126 312 102 9 403 125 523 32 %TOTAL LIABILITIES 535 666 075 028 514 000 285 669 -4 %
OFF-BALANCE-SHEET 2015 2016 VARIATIONCOMMITMENTS RECEIVED 114 546 445 999 234 663 337 152 105 %
Credit commitments
• received from credit institutions
• received from customers
Guarantees given 114 546 445 999 234 663 337 152 105 %
• received from credit institutions 16 600 337 051 121 829 363 977 634 %
• received from customers 97 946 108 948 112 833 973 175 15 %
Commitments on securities
(in CFAF)
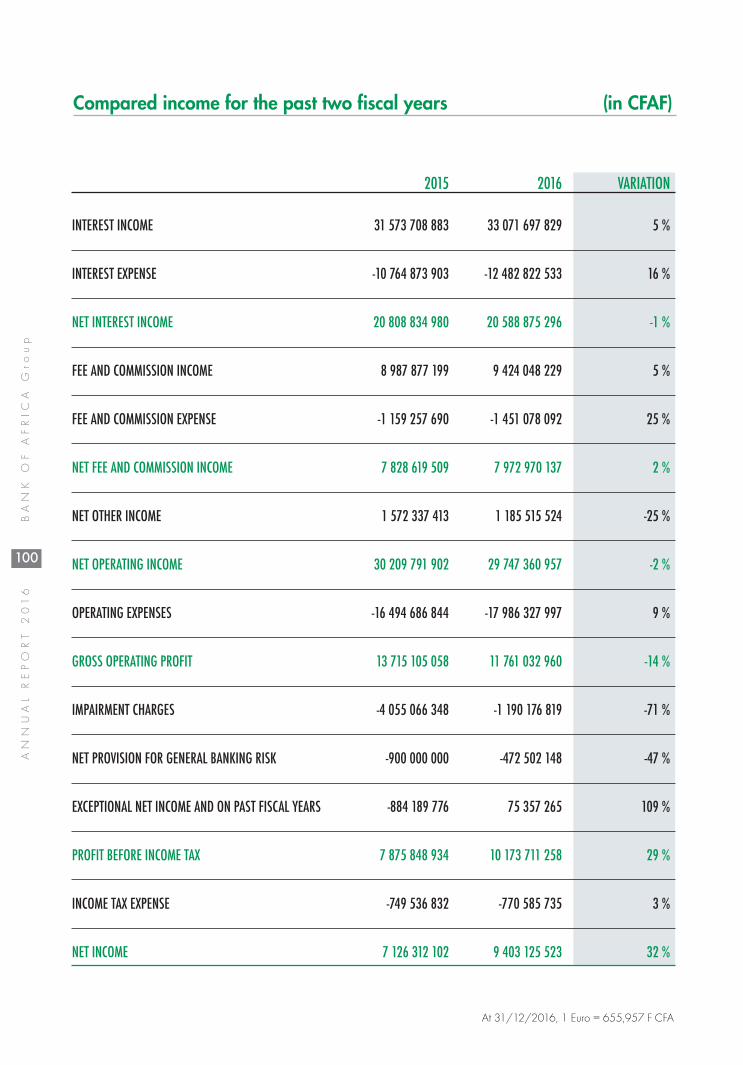
100
ANNUAL REPORT 2
016
BANK O
F A
FRIC
A G
roup
Compared income for the past two fiscal years (in CFAF)
2015 2016 VARIATION
INTEREST INCOME 31 573 708 883 33 071 697 829 5 %
INTEREST EXPENSE -10 764 873 903 -12 482 822 533 16 %
NET INTEREST INCOME 20 808 834 980 20 588 875 296 -1 %
FEE AND COMMISSION INCOME 8 987 877 199 9 424 048 229 5 %
FEE AND COMMISSION EXPENSE -1 159 257 690 -1 451 078 092 25 %
NET FEE AND COMMISSION INCOME 7 828 619 509 7 972 970 137 2 %
NET OTHER INCOME 1 572 337 413 1 185 515 524 -25 %
NET OPERATING INCOME 30 209 791 902 29 747 360 957 -2 %
OPERATING EXPENSES -16 494 686 844 -17 986 327 997 9 %
GROSS OPERATING PROFIT 13 715 105 058 11 761 032 960 -14 %
IMPAIRMENT CHARGES -4 055 066 348 -1 190 176 819 -71 %
NET PROVISION FOR GENERAL BANKING RISK -900 000 000 -472 502 148 -47 %
EXCEPTIONAL NET INCOME AND ON PAST FISCAL YEARS -884 189 776 75 357 265 109 %
PROFIT BEFORE INCOME TAX 7 875 848 934 10 173 711 258 29 %
INCOME TAX EXPENSE -749 536 832 -770 585 735 3 %
NET INCOME 7 126 312 102 9 403 125 523 32 %
At 31/12/2016, 1 Euro = 655,957 F CFA


102
ANNUAL REPORT 2
016
BANK O
F A
FRIC
A G
roup
2016 key figures (in millions of CFAF)
Opening date April 1994Created in 1989: NIGERIANINTERNATIONAL BANK (NIB).Integrated into BOA network in 1994.
Capital as at 31/12/2016CFAF 10 billion
Stock Market Launchon 30/12/2003
Board of Directors as at 31/12/2016Boureima WANKOYE, ChairmanGeorges ABALLOAmine BOUABIDOusmane DAOUMahaman IBRA KABOFati SITTI TCHIANABANK OF AFRICA - BENIN, Represented byBenoît MAFFON
Principal Shareholders as at 31/12/2016
BANQUE OUEST AFRICAINE DEDÉVELOPPEMENT (BOAD),Represented by Hamado ZANGO
BOA WEST AFRICA, Represented byAbderrazzak ZEBDANI
AuditorsFIDUCIAIRE CONSEIL & AUDIT (FCA)GUILBERT ET ASSOCIÉS
Registered officeImmeuble BANK OF AFRICA Rue du Gaweye - BP 10973Niamey - NIGERTel.: (227) 20 73 36 20 / 21 / 20 73 32 46Fax: (227) 20 73 38 18SWIFT: AFRINENIXXX
BOA WEST AFRICA
59.06 %
ATTICA S.A.
0.42 %
WEST AFRICANDEVELOPMENT BANK (BOAD)
6.88 %
OTHER SHAREHOLDERS
28.25 %
LOCAL SHAREHOLDERS
5.24 %
BOA-NIGER EMPLOYEES
0.15 %
Activity 2015 2016 VariationDeposits 143,627 145,333 1.2 %Loans 153,215 164,236 7.2 %Number of branches at the end of the financial year 25 28 12.0 %
StructureTotal Assets 262,944 286,739 9.0 %Shareholders’ equity 27,402 29,411 7.3 %Number of employees at the end of the financial year 232 245 5.6 %
NIGER

103
BANK O
F A
FRIC
A G
roup
ANNUAL REPORT 2
016
Income 2015 2016 VariationNet operating income 18,053 19,087 5.7 %Operating expenses (including depreciation and amortization) 8,166 9,237 13.1 %Gross operating profit 9,887 9,850 -0.4 %Cost of risk (in value)* 909 1,581 73.9 %Net income 5,795 6,600 13.9 %Operating ratio 45.2 % 48.4 %Cost of risk 0.6 % 1.0 % Return on Assets (ROA) 2.3 % 2.4 % Return on Equity (ROE) 23.4 % 24.7 %
Capital adequacy ratioTier 1 21,663 23,351 Tier 2 Risk Weighted Asset (RWA) 162,190 178,015 Tier 1 + Tier 2 / RWA 13.4 % 13.1 %(*) Including general provision
Financial analysis
In 2016, BANK OF AFRICA - NIGER was operating under favourable national economic conditions in spite ofless sustained economic conjuncture. After growth of 3.5% the previous year, GDP grew at 4.6%, lower thanthe 5.2% initially forecast.
However, these positive data hide the difficult economic context. In terms of public finances, fiscal revenue wasdown by 14.7% compared to the past year and there was a budget deficit of 7.7% of GDP. This is relatedto the worrying economic situation in Nigeria, Niger's main economic partner, the cost of organisingelections and the security and humanitarian impact of the intensification of attacks by Boko Haram.
In spite of these challenges, the Bank has managed to show great commercial vitality and achieve satisfying results.
Total balance sheet increased by 9% to CFAF 286,739 million against CFAF 262,944 million at 31December 2015. Customer deposits grew by 1.2%, rising to CFAF 145,333 million against CFAF 143,627million a year earlier.
Loans grew by 7.2% to CFAF 164,236 million against CFAF 153,215 million in 2015.
Net Operating Income increased by 5.7% to CFAF 19,087 million against CFAF 18,053 millionin 2015.
GROSS OPERATING PROFIT (GOI) remained almost constant at CFAF 9,850 million.
General operating overheads (amortisation included) grew by 13.1% in 2016, rising to CFAF 9,237 millionagainst CFAF 8,166 million a year earlier.
In spite of a stockholder’s equity increase of 7.3% to CFAF 29,411 million because of the profit in 2016, financialprofitability was strengthened with an ROE of 24.7%.
Net income reached CFAF 6,600 million on 31 December 2016 against CFAF 5,795 the previous year,an increase of 13.9%.
These results are the fruits of the efforts of the entire staff at the Bank combined with the judicious strategicguidance of the Board of Directors.
As the first company in Niger to be listed on the BRVM, BANK OF AFRICA remains a major player on thecountry's banking landscape.

104
ANNUAL REPORT 2
016
BANK O
F A
FRIC
A G
roup
Significant performances (in CFAF billion)
Stock information (in CFAF)
2014 2015 2016 AAGR*Closing price at 31/12 87,000 85,000 89,995 1.7 %Performance annuelle 101.4 % -2.3 % 5.9 %Earning per share 5,364 6,100 6,600 10.9 %Shareholder’s equity per share 26,499 28,844 29,411 5.4 %Market capitalization as of 31/12 (In CFAF billion) 82.7 80.8 90.0 4.3 %Dividend 3,492 4,817 5,600 26.6 %PER (Price Earning Ratio) 4.01 % 5.67 % 6.22 % 24.5 %P/B (Price to Book) 16.2x 13.9x 13.6xYield dividend 3.3x 2.9x 3.1x
(*) Average annual growth rate
dec-15
jan-16
feb-16
mar-16
apr-16
may-16
jun-16
jul-16
aug-16
sept-16
oct-16
nov-16
dec-16
1,000900800700600500400300200100
0
Transactions
Monthly volume Benchmark prices
Price in CFAF
135,000
125,000
115,000
105,000
95,000
85,000
75,000
Changes in stock prices and volumes
153.2
Loans Net income
5.7
6.6164.2
2015 20162015 2016
7.2 % 13.9 %
2016
ROE
24.7 %

105
BANK O
F A
FRIC
A G
roup
ANNUAL REPORT 2
016
Highlights
FebruaryCustomer deposits rose above the CFAF 160 billion mark.
MarchLaunch of the 'Compte Epargne' regional savingsaccount campaign.
Signature of an agreement with Agence Française deDéveloppement for ARIZ (Assurance Pour le Risqued’Investissement en Zone d’intervention), a dedicated risk-sharing tool facilitating access to bank credit.
AprilLaunch of the ‘Epargne' campaign to promote savings.
Launch of the 'Ressources Elite' campaign.
May Launch of the 'Commission CAF' campaign.
JuneAppointment of a new Managing Director. Inauguration of the Koubia branch in Niamey.
JulyIncrease in the Bank's share capital from CFAF9.5 billion to CFAF 10 billion by incorporationof share premiums.
AugustLaunch of the 'Avances Tabaski' campaign.
SeptemberParticipation in the 2016 BANK OF AFRICADirectors’ Meetings, in Marrakech, Morocco.
OctoberInauguration of the 'Recasement' Branch inNiamey.
NovemberLaunch of Money Gram service.
Number of customer accounts rose above the205,000 mark.
Trining on Managerial and Commercial Practivces
‘’Recasement’’ branch in Niamey

106
ANNUAL REPORT 2
016
BANK O
F A
FRIC
A G
roup
ASSETS 2015 2016 VARIATIONCASH 7 475 088 167 5 395 406 622 -28 %
INTERBANK LOANS 24 648 819 251 19 567 824 923 -21 %
CUSTOMER LOANS 153 215 102 894 164 235 918 200 7 %
- Portfolio of discounted bills 258 627 905 385 302 487 49 %
- Other customer credit facilities 128 048 963 377 136 350 730 561 6 %
- Ordinary debtor accounts 24 907 511 612 27 499 885 152 10 %
- Factoring
INVESTMENT SECURITIES 64 333 101 067 83 499 703 967 30 %
FINANCIAL ASSETS 1 084 836 811 814 130 069 -25 %
LEASING AND SIMILAR TRANSACTIONS
FINANCIAL ASSETS AT EQUITY VALUE
INTANGIBLE ASSETS 173 267 560 45 140 258 -74 %
FIXED ASSETS 6 194 894 580 6 784 656 304 10 %
SHAREHOLDERS & ASSOCIATES
OTHER ASSETS 4 880 601 916 5 355 495 973 10 %
SUNDRY ACCOUNTS 937 907 283 950 872 314 1 %
CONSOLIDATED GOODWILL
TOTAL ASSETS 262 943 619 529 286 739 148 630 9 %
OFF-BALANCE-SHEET 2015 2016 VARIATIONCOMMITMENTS GIVEN 70 392 073 282 61 956 278 808 -12 %Credit commitments 498 956 967 742 457 244 49 %
• to credit institutions • to customers 498 956 967 742 457 244 49 %
Guarantees given 69 893 116 315 61 213 821 564 -12 %• on behalf of credit institutions 4 782 563 068 4 782 563 068 0 %• on behalf of customers 65 110 553 247 56 431 258 496 -13 %
Commitments on securities
Compared balance sheet for the past two fiscal years (in CFAF)
At 31/12/2016, 1 Euro = 655.957 CFAF

107
BANK O
F A
FRIC
A G
roup
ANNUAL REPORT 2
016
LIABILITIES 2015 2016 VARIATIONINTERBANK LIABILITIES 84 111 868 523 104 572 121 388 24 %CUSTOMER DEPOSITS 143 627 012 984 145 332 771 842 1 %- Savings deposit accounts 28 687 469 692 31 133 167 648 9 %- Time deposit account 1 589 898 833 1 740 825 984 9 %- Short-term borrowings- Other demand deposits 97 910 761 577 94 876 584 194 -3 %- Other time deposit accounts 15 438 882 882 17 582 194 016 14 %DEBTS EVIDENCED BY SECURITIES 800 000 000 400 000 000 -50 %OTHER LIABILITIES 1 959 823 678 2 057 935 121 5 %SUNDRY ACCOUNTS 3 578 681 969 3 147 640 707 -12 %RESERVES FOR CONTINGENCIES & LOSSES 1 464 077 980 1 817 825 110 24 %STATUTORY PROVISIONSEARMARKED FUNDS SUBORDINATED LOANS & SECURITIES INVESTMENT SUBSIDIESRESERVES FOR GENERAL BANKING RISKS 1 482 189 334 1 811 786 281 22 %SHARE CAPITAL 9 500 000 000 10 000 000 000 5 %SHARE PREMIUMS 3 694 500 000 3 194 500 000 -14 %RESERVES 6 930 095 039 7 804 465 061 13 %RETAINED EARNINGS ( +/- )NET INCOME 5 795 370 022 6 600 103 120 14 %TOTAL LIABILITIES 262 943 619 529 286 739 148 630 9 %
OFF-BALANCE-SHEET 2015 2016 VARIATIONCOMMITMENTS RECEIVED 77 847 344 790 84 841 170 334 9 %Credit commitments
•received from credit institutions• received from customers
Guarantees given 77 847 344 790 84 841 170 334 9 %• received from credit institutions 28 789 559 340 32 944 847 034 14 %• received from customers 49 057 785 450 51 896 323 300 6 %
Commitments on securities
(in CFAF)

108
ANNUAL REPORT 2
016
BANK O
F A
FRIC
A G
roup
Compared income for the past two fiscal years (in CFAF)
2015 2016 VARIATION
INTEREST INCOME 17 311 521 516 19 245 206 980 11 %
INTEREST EXPENSE -5 272 104 139 -6 499 986 521 23 %
NET INTEREST INCOME 12 039 417 377 12 745 220 459 -6 %
FEE AND COMMISSION INCOME 5 642 343 666 6 151 191 907 9 %
FEE AND COMMISSION EXPENSE -605 009 552 -667 539 674 10 %
NET FEE AND COMMISSION INCOME 5 037 334 114 6 483 652 233 9 %
NET OTHER INCOME 976 565 545 858 005 343 -12 %
NET OPERATING INCOME 18 053 317 036 19 086 878 035 6 %
OPERATING EXPENSES -8 165 829 779 -9 236 528 506 13 %
GROSS OPERATING PROFIT 9 887 487 257 9 850 349 529 -0 %
IMPAIRMENT CHARGES -1 484 861 746 -1 678 500 585 13 %
NET PROVISION FOR GENERAL BANKING RISK -329 596 947
EXCEPTIONAL INCOME AND ON PREVIOUS FISCAL YEARS’ -712 552 389 -226 452 977 -68 %
PROFIT BEFORE INCOME TAX 7 690 073 122 7 615 799 020 -1 %
INCOME TAX EXPENSE -1 894 703 100 -1 015 695 900 -46 %
NET INCOME 5 795 370 022 6 600 103 120 14 %
At 31/12/2016, 1 Euro = 655.957 CFAF


110
ANNUAL REPORT 2
016
BANK O
F A
FRIC
A G
roup
2016 key figures (in millions of CDF)
Opening date April 2010
Capital as at 31/12/2016Congolese Francs (CDF) 19.387 million
Board of Directors as at 31/12/2016Guy-Robert LUKAMA – NKUZI, Chairman
BOA GROUP, Represented by AbderrazzakZEBDANI
Amine BOUABID
Henri LALOUX
Alain Chapuis
Olivier TOUSSAINT
Principal Shareholders as at 31/12/2016
AuditorsPRICEWATERHOUSECOOPERS
Registered office22, Avenue des AviateursKinshasa-Gombe - BP 7119 Kin1RÉPUBLIQUE DÉMOCRATIQUE DU CONGOTel.: (243) 99 300 46 00SWIFT: AFRICDKSXXX
BOA GROUP S.A.
65.02 %
BIO S.A.
19.98 %
PROPARCO S.A.
14.98 %
PRIVATE SHAREHOLDERS
0.02 %
Activity 2015 2016 VariationDeposits 81,464 117,373 44.1 %Loans 112,942 164,592 46.7 %Number of branches at the end of the financial year 10 11 10.0 %
StructureTotal Assets 158,153 219,955 39.1 %Shareholders’ equity 20,189 23,085 14.3 %Number of employees at the end of the financial year 191 198 3.7 %
DRC

111
BANK O
F A
FRIC
A G
roup
ANNUAL REPORT 2
016
Income 2015 2016 VariationNet operating income 15,884 22,061 38.9 %
Operating expenses (including depreciation and amortization) -12,041 -16,827 39.8 %Gross operating profit 3,844 5,234 36.2 %Cost of risk (in value)* -834 -2,860 242.9 %Net income 2,306 1,743 -24.4 %Operating ratio 75.8 % 76.3 %Cost of risk 0.9 % 2.1 %Return on Assets (ROA) 1.5 % 0.8 %Return on Equity (ROE) 15.9 % 10.6 %
Capital adequacy ratioTier 1 13,983 18,037 Tier 2 2,165 3,670Risk Weighted Asset (RWA) 119,511 192,003 Tier 1 + Tier 2 / RWA 13.5 % 11.3 %(*) Including general provision
Financial analysisAll economic indicators for the Democratic Republic of Congo deteriorated severely in 2016. At 2.5%, thegrowth rate remained very weak compared to 2015 (6.5%) and 2014 (9%), mainly due to the fall in theprice of mining products on international markets. This is the lowest growth recorded for the Congoleseeconomy in 15 years. The Congolese franc (CDF) fell by 12% against the American dollar whereas theUSD/CDF exchange rate varied very little in 2015 (down 0.50%)
The increase in customer deposits, up CDF 36 billion, amounted to an impressive 44% growthbetween December 2015 and December 2016, mainly due to corporate customer deposits.
Direct loans grew by more than 46%, giving the Bank a 5.9% share of the market and as much as22% of the consumer credit market.
Total balance sheet reached the equivalent of CDF 220 million, compared to CDF 158 million in2015, and have almost doubled in 2 years.As the whole banking sector, cost of risk deteriorated significantly in 2016 compared to 2015. Thus, the rateof loss ratio went from 3.1% in 2015 to 6.6 % in 2016. Provisions increased from CDF 1,972 million at end2015 to CDF 5,475 million at end 2016, a consequence both of an unfavourable economic context and achronic shortage of provisions made by the Bank since its creation.
Net Operating Income (NOI) was up 39%.
Direct operating costs increased by 40% compared to 2015. This is mainly due to IT expenses, which wereup 21%, and certain non-recurrent items in the communications budget in 2017.
As a direct result of the high level of provisioning, net income amounted to CDF 1,743 million compared toCDF 2,306 million in 2015.
In 2016, the Bank saw a significant rise in customer deposits and loans to large companies, while there wasa far more modest increase in loans to SMEs than in 2015.
These initiatives will continue in 2017 and the network will be expanded with the opening of 5 new branchesand the establishment of a business centre.

New Year wishes to the staff
112
ANNUAL REPORT 2
016
BANK O
F A
FRIC
A G
roup
Significant performances (CDF billion)
Stock Information (in CDF)
2013 2014 2015 2016 AAGR*Earning per share -52,085 11,240 92,250 69,708 15.69 %
Shareholder’s equity per share 510,723 715,310 807,560 923,399 34.46 %
(*) Average annual growth rate
112.9
Loans Net operating income
15.822.0
164.5
2015 20162015 2016
46.7 % 38.9 %
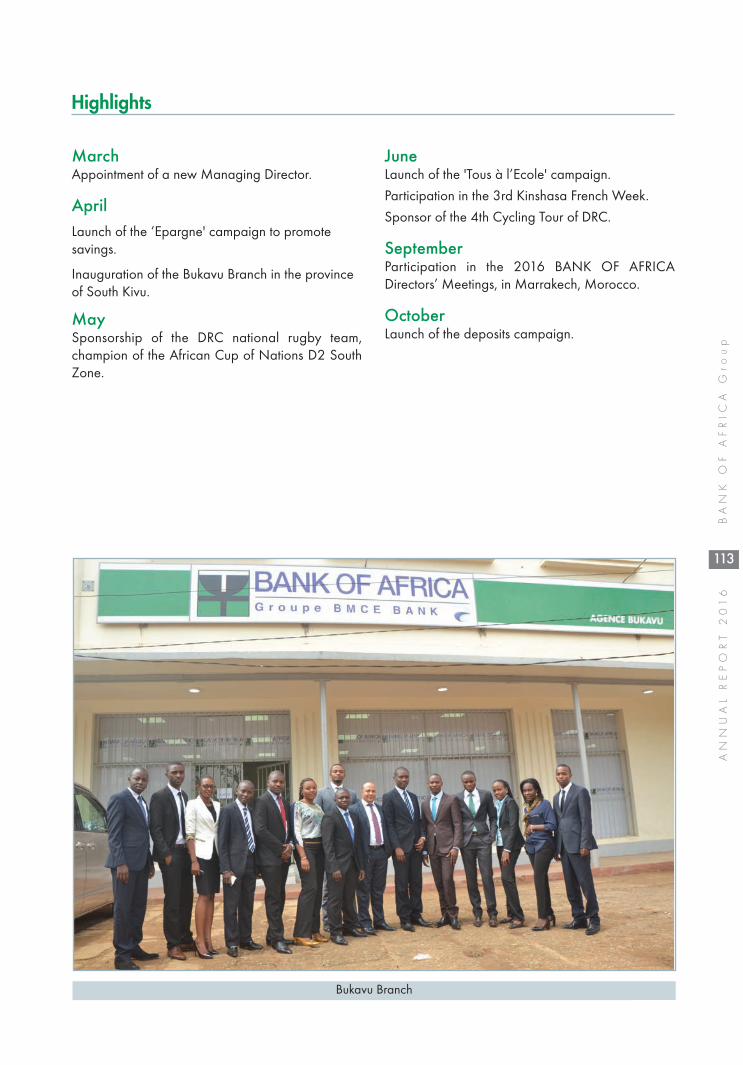
113
BANK O
F A
FRIC
A G
roup
ANNUAL REPORT 2
016
Highlights
MarchAppointment of a new Managing Director.
AprilLaunch of the ‘Epargne' campaign to promotesavings.
Inauguration of the Bukavu Branch in the provinceof South Kivu.
MaySponsorship of the DRC national rugby team,champion of the African Cup of Nations D2 SouthZone.
JuneLaunch of the 'Tous à l’Ecole' campaign.
Participation in the 3rd Kinshasa French Week.
Sponsor of the 4th Cycling Tour of DRC.
SeptemberParticipation in the 2016 BANK OF AFRICADirectors’ Meetings, in Marrakech, Morocco.
OctoberLaunch of the deposits campaign.
Bukavu Branch
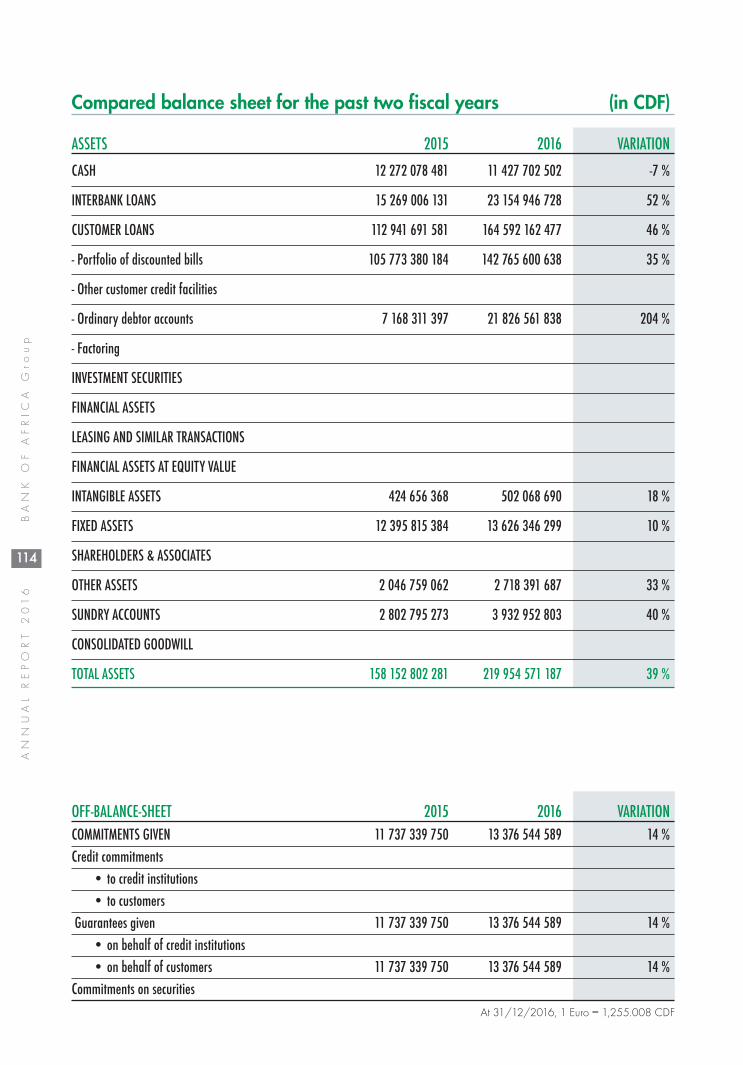
114
ANNUAL REPORT 2
016
BANK O
F A
FRIC
A G
roup
ASSETS 2015 2016 VARIATION
CASH 12 272 078 481 11 427 702 502 -7 %
INTERBANK LOANS 15 269 006 131 23 154 946 728 52 %
CUSTOMER LOANS 112 941 691 581 164 592 162 477 46 %
- Portfolio of discounted bills 105 773 380 184 142 765 600 638 35 %
- Other customer credit facilities
- Ordinary debtor accounts 7 168 311 397 21 826 561 838 204 %
- Factoring
INVESTMENT SECURITIES
FINANCIAL ASSETS
LEASING AND SIMILAR TRANSACTIONS
FINANCIAL ASSETS AT EQUITY VALUE
INTANGIBLE ASSETS 424 656 368 502 068 690 18 %
FIXED ASSETS 12 395 815 384 13 626 346 299 10 %
SHAREHOLDERS & ASSOCIATES
OTHER ASSETS 2 046 759 062 2 718 391 687 33 %
SUNDRY ACCOUNTS 2 802 795 273 3 932 952 803 40 %
CONSOLIDATED GOODWILL
TOTAL ASSETS 158 152 802 281 219 954 571 187 39 %
OFF-BALANCE-SHEET 2015 2016 VARIATIONCOMMITMENTS GIVEN 11 737 339 750 13 376 544 589 14 %Credit commitments
• to credit institutions • to customers
Guarantees given 11 737 339 750 13 376 544 589 14 %• on behalf of credit institutions • on behalf of customers 11 737 339 750 13 376 544 589 14 %
Commitments on securitiesAt 31/12/2016, 1 Euro = 1,255.008 CDF
Compared balance sheet for the past two fiscal years (in CDF)
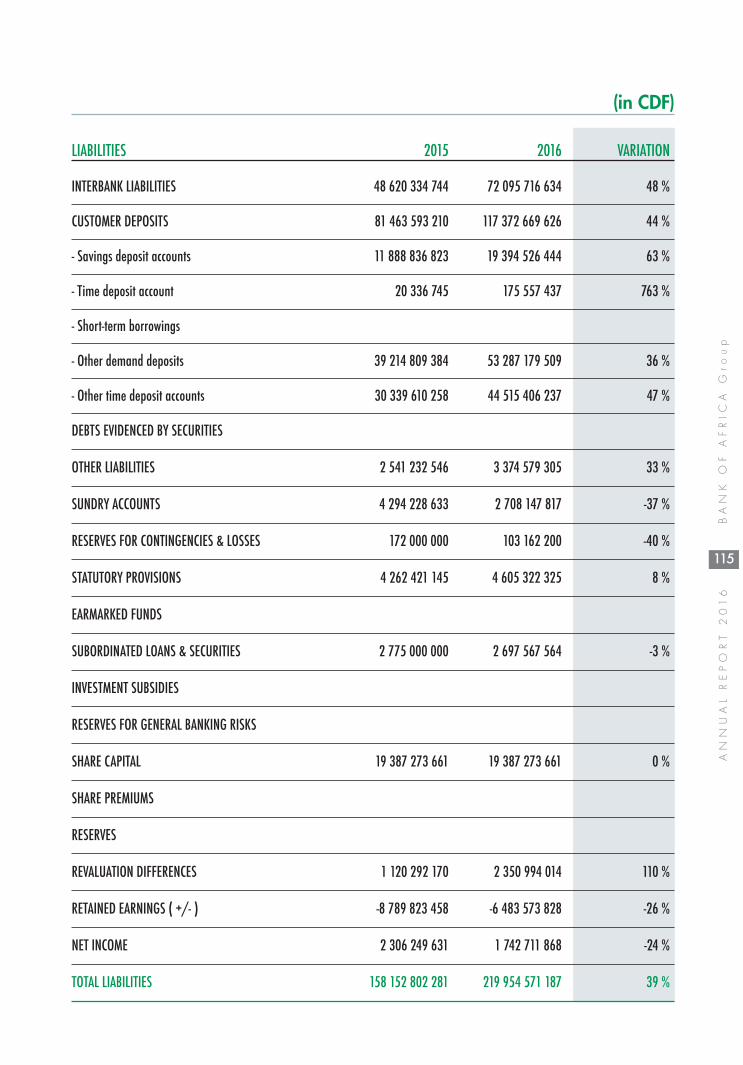
115
BANK O
F A
FRIC
A G
roup
ANNUAL REPORT 2
016
LIABILITIES 2015 2016 VARIATION
INTERBANK LIABILITIES 48 620 334 744 72 095 716 634 48 %
CUSTOMER DEPOSITS 81 463 593 210 117 372 669 626 44 %
- Savings deposit accounts 11 888 836 823 19 394 526 444 63 %
- Time deposit account 20 336 745 175 557 437 763 %
- Short-term borrowings
- Other demand deposits 39 214 809 384 53 287 179 509 36 %
- Other time deposit accounts 30 339 610 258 44 515 406 237 47 %
DEBTS EVIDENCED BY SECURITIES
OTHER LIABILITIES 2 541 232 546 3 374 579 305 33 %
SUNDRY ACCOUNTS 4 294 228 633 2 708 147 817 -37 %
RESERVES FOR CONTINGENCIES & LOSSES 172 000 000 103 162 200 -40 %
STATUTORY PROVISIONS 4 262 421 145 4 605 322 325 8 %
EARMARKED FUNDS
SUBORDINATED LOANS & SECURITIES 2 775 000 000 2 697 567 564 -3 %
INVESTMENT SUBSIDIES
RESERVES FOR GENERAL BANKING RISKS
SHARE CAPITAL 19 387 273 661 19 387 273 661 0 %
SHARE PREMIUMS
RESERVES
REVALUATION DIFFERENCES 1 120 292 170 2 350 994 014 110 %
RETAINED EARNINGS ( +/- ) -8 789 823 458 -6 483 573 828 -26 %
NET INCOME 2 306 249 631 1 742 711 868 -24 %
TOTAL LIABILITIES 158 152 802 281 219 954 571 187 39 %
(in CDF)

116
ANNUAL REPORT 2
016
BANK O
F A
FRIC
A G
roup
Compared income for the past two fiscal years (in CDF)
2015 2016 VARIATION
INTEREST INCOME 13 702 531 939 18 918 131 489 38 %
INTEREST EXPENSES -3 729 141 333 -4 605 745 618 24 %
NET INTEREST INCOME 9 973 390 606 14 312 385 871 44 %
FEE AND COMMISSION INCOME 4 992 661 933 5 585 379 291 12 %
FEE AND COMMISSION EXPENSE - 697 199 805 - 998 447 267 43 %
NET FEE AND COMMISSION INCOME 4 295 462 128 4 586 932 024 7 %
OTHER INCOME 1 615 364 733 3 161 551 657 96 %
OPERATING INCOME 15 884 217 467 22 060 869 552 39 %
OPERATING EXPENSES - 12 040 625 866 - 16 827 107 770 40 %
GROSS OPERATING PROFIT 3 843 591 601 5 233 761 782 36 %
IMPAIRMENT CHARGES - 939 220 717 - 2 766 337 978 195 %
NET PROVISION FOR GENERAL BANKING RISK
EXCEPTIONAL INCOME INCLUDING PREVIOUS FISCAL YEARS’ - 195 121 254 - 70 579 386 -64 %
PROFIT BEFORE INCOME TAX 2 709 249 630 2 396 844 418 -12 %
INCOME TAX EXPENSE - 403 000 000 - 654 132 550 62 %
NET INCOME 2 306 249 630 1 742 711 868 -24 %
At 31/12/2016, 1 Euro = 1,255.008 CDF


118
ANNUAL REPORT 2
016
BANK O
F A
FRIC
A G
roup
RWANDA
Opening date 13 October 2015
Capital as at 31/12/2016 Rwanda Francs (RWF) 6,581 million
Board of Directors as at 31/12/2016Louis RUGERINYANYE, ChairmanAmine BOUABID
Vincent de BROUWER
Charles MPORANYI
Emmanuel NTAGANDA
Abderrazzak ZEBDANI
AuditorsERNST &YOUNG RWANDALIMITED
Registered officeBANK OF AFRICAKN 46 Nyarugenge P.O. Box: 265, Kigali - RWANDATel: (250) 787 468 010Swift: AFRWRWRW
Principal shareholders as at 31/12/16
BANK OF AFRICA GROUP S.A.
89.4 %
Charles MPORANYI
10.6 %
Activity 2015 2016 VariationDeposits 7,585 9,438 24.4 %
Loans 5,636 8,243 46.2 %
Number of branches at the end of the financial year 11 12 9.1 %
StructureTotal Assets 15,319 16,646 8.7 %
Shareholders’ equity 7,335 6,774 -7.7 %
Number of employees at the end of the financial year 101 131 29.7 %
2016 key figures (in millions of FRW)
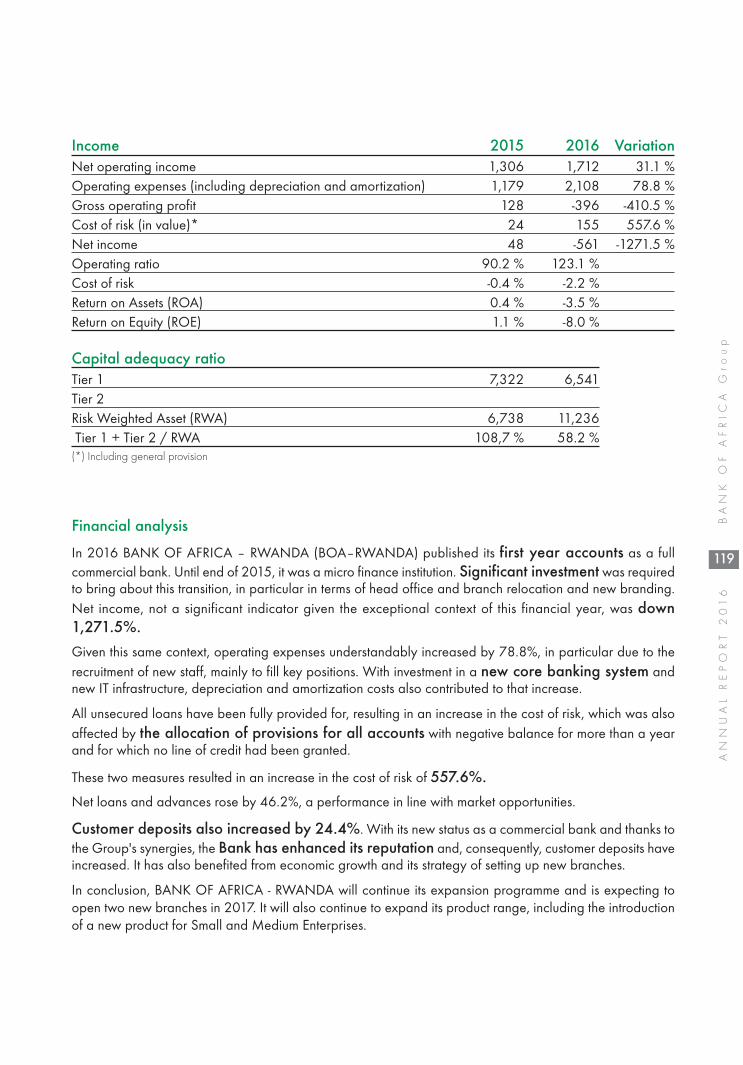
119
BANK O
F A
FRIC
A G
roup
ANNUAL REPORT 2
016
Income 2015 2016 VariationNet operating income 1,306 1,712 31.1 %Operating expenses (including depreciation and amortization) 1,179 2,108 78.8 %Gross operating profit 128 -396 -410.5 %Cost of risk (in value)* 24 155 557.6 %Net income 48 -561 -1271.5 %Operating ratio 90.2 % 123.1 %Cost of risk -0.4 % -2.2 %Return on Assets (ROA) 0.4 % -3.5 %Return on Equity (ROE) 1.1 % -8.0 %
Capital adequacy ratioTier 1 7,322 6,541Tier 2 Risk Weighted Asset (RWA) 6,738 11,236 Tier 1 + Tier 2 / RWA 108,7 % 58.2 %(*) Including general provision
Financial analysis
In 2016 BANK OF AFRICA – RWANDA (BOA–RWANDA) published its first year accounts as a fullcommercial bank. Until end of 2015, it was a micro finance institution. Significant investment was requiredto bring about this transition, in particular in terms of head office and branch relocation and new branding.Net income, not a significant indicator given the exceptional context of this financial year, was down1,271.5%.Given this same context, operating expenses understandably increased by 78.8%, in particular due to therecruitment of new staff, mainly to fill key positions. With investment in a new core banking system andnew IT infrastructure, depreciation and amortization costs also contributed to that increase.
All unsecured loans have been fully provided for, resulting in an increase in the cost of risk, which was alsoaffected by the allocation of provisions for all accounts with negative balance for more than a yearand for which no line of credit had been granted.
These two measures resulted in an increase in the cost of risk of 557.6%.Net loans and advances rose by 46.2%, a performance in line with market opportunities.
Customer deposits also increased by 24.4%. With its new status as a commercial bank and thanks tothe Group's synergies, the Bank has enhanced its reputation and, consequently, customer deposits haveincreased. It has also benefited from economic growth and its strategy of setting up new branches.
In conclusion, BANK OF AFRICA - RWANDA will continue its expansion programme and is expecting toopen two new branches in 2017. It will also continue to expand its product range, including the introductionof a new product for Small and Medium Enterprises.

120
ANNUAL REPORT 2
016
BANK O
F A
FRIC
A G
roup
Stock information (in thousands of FRW)
2015* 2016 AAGR**Net earnings per share 0.1 -0.9 -1,271%
Equity per share 11.1 10.3 -7.7%
Dividend per share
(*) Activity of Microfinance Agaseké Bank(**) Average annual growth rate
Outdoor dispaly in Kigali at the occasion of H.M. King Mohamed VI visting Rwanda
Significant performances (in FRW billion)
7.6
Deposits Loans Net Operating Income
5.68.2
9.4
2015 20162015 2016
24.4 % 46.2 %
1.7
1.3
2015 2016
31.1 %

121
BANK O
F A
FRIC
A G
roup
ANNUAL REPORT 2
016
Highlights
MayRelocation of Head Office from KN 46 Nyarugengeto KN 2 Chic Complex, Kigali.
JulyAppointment of a new Managing Director.
SeptemberParticipation in the 2016 BANK OF AFRICANetwork Management Meetings in Marrakech,Morocco.
OctoberLaunch of the “Savings promotional campaign”
Relocation of Rubavu, Kabuga and Nyabugogobranches.
Launch of a new saving product, “Ambition”
NovemberLaunch of a new Website.
DecemberLaunch of a new Business Centre, in Kigali.
Africa Business Connect participants in Kigali
Brahim BENJELLOUN-TOUIMI, BOA Group Chairman, visiting the Head Office in Kigali

122
ANNUAL REPORT 2
016
BANK O
F A
FRIC
A G
roup
ASSETS 2015 2016 VARIATION
CASH AND BALANCES WITH CENTRAL BANK 1 157 909 1 813 359 57 %
GOVERNMENT SECURITIES 997 582 -100 %
BALANCES DUE FROM BANKING INSTITUTIONS 7 208 685 4 542 577 -37 %
LOANS AND ADVANCES TO CUSTOMERS 5 636 402 8 242 509 46 %
CURRENT INCOME TAX 27 233 188 298 591 %
PROPERTY AND EQUIPMENT 57 271 1 587 984 2673 %
DEFERRED INCOME TAX 10 951 -100 %
OTHER ASSETS 222 694 271 569 22 %
TOTAL ASSETS 15 318 727 16 646 296 9 %
OFF-BALANCE-SHEET 2015 2016 VARIATION
COMMITMENTS GIVEN 124 349 393 594 217 %
Credit commitments 124 349 393 594 217 %
• to credit institutions
• to customers 124 349 393 594 217 %
Guarantees given
• on behalf of credit institutions
• on behalf of customers
Commitments on securities
Compared balance sheet for the past two fiscal years (in thousands of FRW)
At 31/12/2016, 1 Euro = 860.08181 Rwandan Francs

(in thousands of FRW)
123
BANK O
F A
FRIC
A G
roup
ANNUAL REPORT 2
016
LIABILITIES 2015 2016 VARIATION
CUSTOMER DEPOSITS 7 584 845 9 438 343 24 %
INTERBANK LIABILITIES 170 657 25 729 -85 %
LONG TERM BORROWINGS
OTHER LIABILITIES 228 167 408 554 79 %
TOTAL LIABILITIES 7 983 669 9 872 626 24 %
SHARE CAPITAL 6 580 870 6 580 870 0 %
SHARE PREMIUM 871 740 871 740 0 %
STATUTORY RESERVE
RETAINED EARNINGS (+/-) -117 552 -678 940 478 %
TOTAL SHAREHOLDERS EQUITY 7 335 058 6 773 670 -8 %
TOTAL LIABILITIES AND SHAREHOLDERS EQUITY 15 318 727 16 646 296 9 %
2015 2016 VARIATIONINTEREST INCOME 1 282 305 1 674 791 31 %
INTEREST EXPENSE -276 492 -320 143 16 %
NET INTEREST INCOME 1 005 813 1 354 648 35 %
FEE AND COMMISSION INCOME 229 799 252 372 10 %
FEE AND COMMISSION EXPENSE
NET FEE AND COMMISSION INCOME 229 799 252 372 10 %
NET OTHER INCOME 70 476 104 779 49 %
NET OPERATING INCOME 1 306 088 1 711 799 31 %
OPERATING EXPENSES -1 178 576 -2 107 675 79 %
IMPAIRMENT LOSSES ON LOANS AND ADVANCES -23 505 -154 561 558 %
PROFIT BEFORE INCOME TAX 104 007 -550 437 -629 %
INCOME TAX EXPENSE -56 086 -10 951 -80 %
NET INCOME 47 921 -561 388 -1271 %
Compared balance sheet for the past two fiscal years (in thousands of FRW)

124
ANNUAL REPORT 2
016
BANK O
F A
FRIC
A G
roup
2016 key figures (in millions of CFAF)
Opening date October 2001
Capital as at 31/12/2016CFAF 12 billion
Stock Market LaunchOn 22/10/2014
Board of Directors as at 31/12/2016Alioune N’Dour DIOUF, Chairman
AXA SENEGAL, Represented by AliouneDIAGNE,
Amine BOUABID
Abderrazzak ZEBDANI
Abdoulaye SEYDI
SDIH, Represented by Mohamed A. SOW
Principal Shareholders as at 31/12/2016
BOA WEST AFRICA, Represented byAbderrazzak ZEBDANI
BMCE BANK, Represented by Amine BOUABID
AuditorsMAZARS SÉNÉGALEUREKA AUDIT & CONSEILS
Registered officeBANK OF AFRICA - Immeuble Elan - Routede Ngor, Zone 12, quartier des Almadies -Dakar - SÉNÉGALTel.: (221) 33 865 64 67Fax: (221) 33 820 42 83SWIFT: AFRISNDA
BOA WEST AFRICA
61.74 %
PRIVATE SHAREHOLDERS
38.16 %
OTHER SHAREHOLDERS
0.10 %
Activity 2015 2016 VariationDeposits 206,124 318,797 54.7 %
Loans 193,153 235,388 21.9 %
Number of branches at the end of the financial year 33 42 27.3 %
StructureTotal Assets 361,877 521,726 44.2 %
Shareholders’ equity 26,279 29,330 11.6 %
Number of employees at the end of the financial year 323 346 7.1 %
SENEGAL

125
BANK O
F A
FRIC
A G
roup
ANNUAL REPORT 2
016
Income 2015 2016 VariationNet operating income 16,971 21,985 29.5 %Operating expenses (including depreciation and amortization) 10,808 11,245 4.0 %Gross operating profit 6,163 10,739 74.2 %Cost of risk (in value)* 3,757 6,139 63.4 %Net income 2,079 4,051 94.9 %Operating ratio 63.7 % 51.2 %Cost of risk 2.1 % 2.9 %Return on Assets (ROA) 0.6 % 0.9 %Return on Equity (ROE) 7.9 % 14.6 %
Capital adequacy ratioTier 1 22,457 24,228 Tier 2 5,248 Risk Weighted Asset (RWA) 264,443 257,259 Tier 1 + Tier 2 / RWA 8.4 % 11.5 % (*) Including general provision
Financial analysis
Despite a major effort to consolidate the Bank's portfolio (an additional CFAF 5,995 million were madein provisions) leading to a 1.6x increase in the cost of risk and in spite of a highly competitive environment,BANK OF AFRICA - SENEGAL (BOA-SENEGAL) maintained growth in customers’ deposits of 54.7%and net loans & advances to customers of 21.9% for the 2016 fiscal year. Deposits and loans amountedto CFAF 318,797 million and CFAF 235,388 million respectively.
In terms of key indicators, Net Operating Income grew by 29.5% to CFAF 21,985 million at the end ofDecember 2016.
After allocation of overhead costs, Gross Operating Profit reached CFAF 10,739 million at the end of the2016 fiscal year, up 74.2% on December 2015. With operating expenses under control, up by only4.0% year-on-year, coupled with significant progress in the Net Operating Income, the operating ratiorecorded a net improvement of 12.5 percentage points year-on-year, falling to 51.2% at December31, 2016.
After taking into account the recommendations by the Banking Commission and the Auditors, the cost of riskwas 2.9% at the end of 2016.
Net Income increased by 94.9% compared with end of December 2015 to CFAF 4,051 million atDecember 31, 2016.
Total assets, resulting from changes in loans and deposits balance, increased by 44.2% to CFAF 521,726million.
In its profitability analysis, the Bank had a ROA of 0.9%, up 30 basis points from the previous year. Thereturn on equity also rose by 6.7 points to 14.6%.
Except for the transformation ratio, all other regulatory ratios were complied with including the capitaladequacy ratio of 11.46%, against a regulatory requirement of 8%.
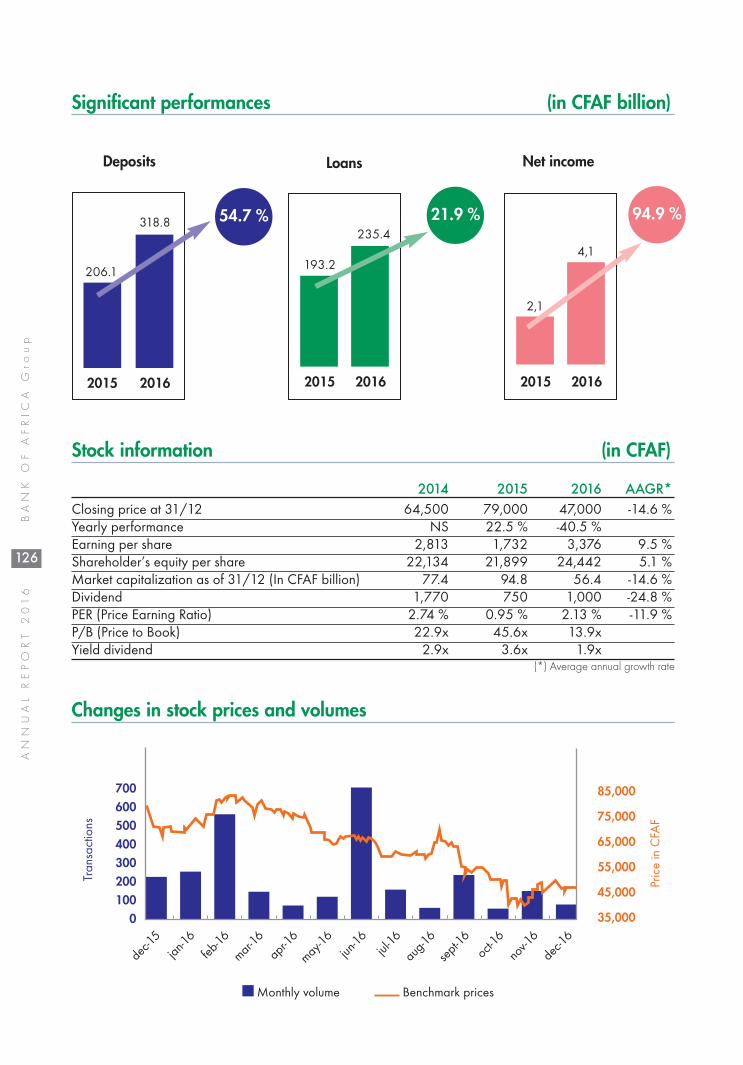
126
ANNUAL REPORT 2
016
BANK O
F A
FRIC
A G
roup
Significant performances (in CFAF billion)
Stock information (in CFAF)
2014 2015 2016 AAGR*Closing price at 31/12 64,500 79,000 47,000 -14.6 %Yearly performance NS 22.5 % -40.5 %Earning per share 2,813 1,732 3,376 9.5 %Shareholder’s equity per share 22,134 21,899 24,442 5.1 %Market capitalization as of 31/12 (In CFAF billion) 77.4 94.8 56.4 -14.6 %Dividend 1,770 750 1,000 -24.8 %PER (Price Earning Ratio) 2.74 % 0.95 % 2.13 % -11.9 %P/B (Price to Book) 22.9x 45.6x 13.9xYield dividend 2.9x 3.6x 1.9x
(*) Average annual growth rate
206.1
Deposits Loans Net income
193.2
235.4318.8
2015 20162015 2016
54.7 % 21.9 % 94.9 %
2,1
4,1
2015 2016
dec-15
jan-16
feb-16
mar-16
apr-16
may-16
jun-16
jul-16
aug-16
sept-16
oct-16
nov-16
dec-16
700600500400300200100
0
Transactions
Monthly volume Benchmark prices
Price in CFAF
85,000
75,000
65,000
55,000
45,000
35,000
Changes in stock prices and volumes

127
BANK O
F A
FRIC
A G
roup
ANNUAL REPORT 2
016
Highlights
FebruaryLaunch of the 'Zen Voyage' and 'Zen Auto' insuranceproducts in partnership with the SAHAM group.
MarchAppointment of a new Managing Director.
AprilLaunch of the ‘Epargne’ campaign.
June Inauguration of the branch in Mboro, a town 82 kmnorth of Dakar.
JulyLaunch of ‘Prêt Véhicule’, the first 72-month car loanproduct in Senegal.
AugustInauguration of the branch in Saint Louis, a town 250km north-west of the capital.
Launch of the ‘Tous à l’Ecole’ campaign
OctobrerCelebration of the Bank's 15th anniversary.
Inauguration of a 2nd Business Centre, in Dakar.
Inauguration of the 2 new VDN and Zone Industriellebranches, in Dakar.
NovemberInauguration of the branch in Kolda, a town more than650 km south-west of the capital.
Inauguration of the branch in Kédougou, a townaround 700 km south-east of the capital.
DecemberInauguration of 3 branches: Centenaire and Front deTerrein in Dakar, and in Rufisque, a town close to thecapital.
The Bank became Senegal’s 2nd banking network,with 42 branches.
Opening of Kedougou Branch
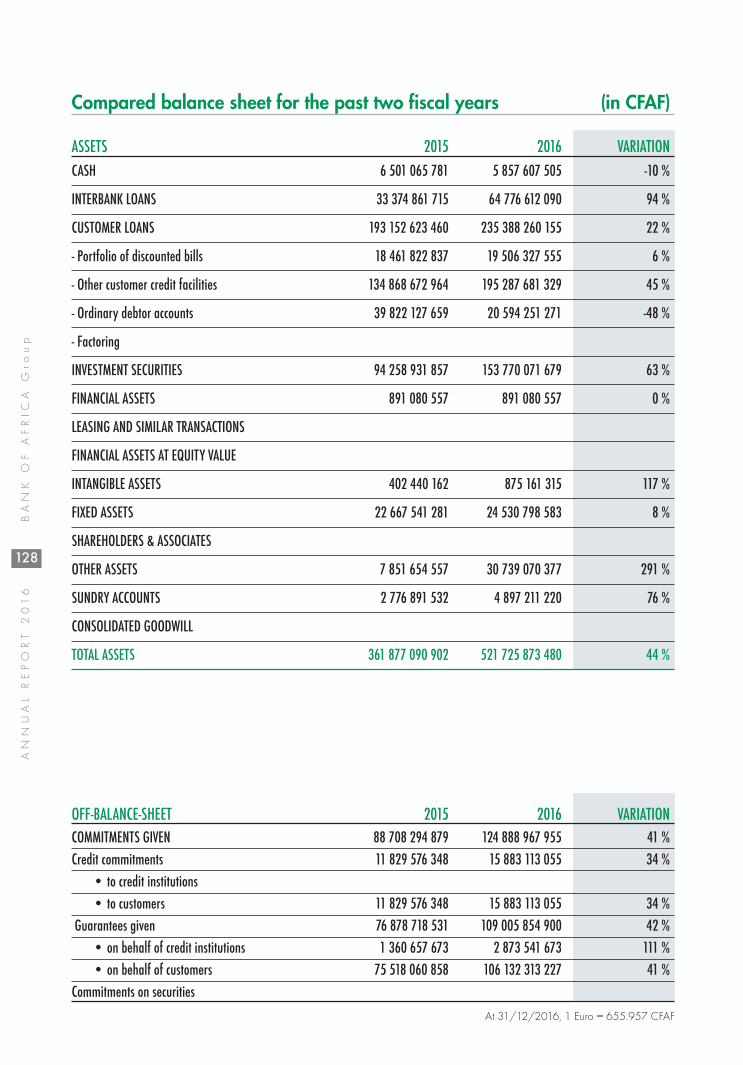
128
ANNUAL REPORT 2
016
BANK O
F A
FRIC
A G
roup
ASSETS 2015 2016 VARIATIONCASH 6 501 065 781 5 857 607 505 -10 %
INTERBANK LOANS 33 374 861 715 64 776 612 090 94 %
CUSTOMER LOANS 193 152 623 460 235 388 260 155 22 %
- Portfolio of discounted bills 18 461 822 837 19 506 327 555 6 %
- Other customer credit facilities 134 868 672 964 195 287 681 329 45 %
- Ordinary debtor accounts 39 822 127 659 20 594 251 271 -48 %
- Factoring
INVESTMENT SECURITIES 94 258 931 857 153 770 071 679 63 %
FINANCIAL ASSETS 891 080 557 891 080 557 0 %
LEASING AND SIMILAR TRANSACTIONS
FINANCIAL ASSETS AT EQUITY VALUE
INTANGIBLE ASSETS 402 440 162 875 161 315 117 %
FIXED ASSETS 22 667 541 281 24 530 798 583 8 %
SHAREHOLDERS & ASSOCIATES
OTHER ASSETS 7 851 654 557 30 739 070 377 291 %
SUNDRY ACCOUNTS 2 776 891 532 4 897 211 220 76 %
CONSOLIDATED GOODWILL
TOTAL ASSETS 361 877 090 902 521 725 873 480 44 %
OFF-BALANCE-SHEET 2015 2016 VARIATIONCOMMITMENTS GIVEN 88 708 294 879 124 888 967 955 41 %Credit commitments 11 829 576 348 15 883 113 055 34 %
• to credit institutions • to customers 11 829 576 348 15 883 113 055 34 %
Guarantees given 76 878 718 531 109 005 854 900 42 %• on behalf of credit institutions 1 360 657 673 2 873 541 673 111 %• on behalf of customers 75 518 060 858 106 132 313 227 41 %
Commitments on securities
Compared balance sheet for the past two fiscal years (in CFAF)
At 31/12/2016, 1 Euro = 655.957 CFAF

129
BANK O
F A
FRIC
A G
roup
ANNUAL REPORT 2
016
LIABILITIES 2015 2016 VARIATIONINTERBANK LIABILITIES 116 843 827 445 154 394 830 975 32 %CUSTOMER DEPOSITS 206 123 908 748 318 797 275 172 55 %- Savings deposit accounts 29 630 914 420 36 665 491 137 24 %- Time deposit account 344 529 649 406 803 116 18 %- Short-term borrowings- Other demand deposits 89 577 911 140 184 612 035 143 106 %- Other time deposit accounts 86 570 553 539 97 112 945 776 12 %DEBTS EVIDENCED BY SECURITIES 2 000 000 000 2 000 000 000 0 %OTHER LIABILITIES 5 426 490 425 3 401 126 347 -37 %SUNDRY ACCOUNTS 4 703 766 896 7 889 073 610 68 %RESERVES FOR CONTINGENCIES & LOSSES 500 208 712 665 840 308 33 %STATUTORY PROVISIONSEARMARKED FUNDS SUBORDINATED DEBTS & SECURITIES 5 247 656 001 INVESTMENT SUBSIDIESRESERVES FOR GENERAL BANKING RISKS SHARE CAPITAL 12 000 000 000 12 000 000 000 0 %SHARE PREMIUMS 6 912 500 000 6 912 500 000 0 %RESERVES 4 416 004 328 4 727 802 948 7 %RETAINED EARNINGS ( +/- ) 871 726 883 1 638 585 728 88 %NET INCOME 2 078 657 465 4 051 182 391 95 %TOTAL LIABILITIES 361 877 090 902 521 725 873 480 44 %
OFF-BALANCE-SHEET 2015 2016 VARIATIONCOMMITMENTS RECEIVED 237 230 625 102 302 866 761 878 28 %Credit commitments
• received from credit institutions• received from customers
Guarantees given 237 230 625 102 302 866 761 878 28 %• received from credit institutions 1 233 262 735 1 236 137 735 0 %• received from customers 235 997 362 367 301 630 624 143 28 %
Commitments on securities
(in CFAF)

130
ANNUAL REPORT 2
016
BANK O
F A
FRIC
A G
roup
Compared income for the past two fiscal years (in CFAF)
2015 2016 VARIATION
INTEREST INCOME 20 119 301 983 26 001 894 999 29 %
INTEREST EXPENSE -9 352 541 147 -11 927 368 730 28 %
NET INTEREST INCOME 10 766 760 836 14 074 526 269 31 %
FEE AND COMMISSION INCOME 7 759 975 639 10 686 216 840 38 %
FEE AND COMMISSION EXPENSE -3 225 079 047 -5 048 044 951 57 %
NET FEE AND COMMISSION INCOME 4 534 896 592 5 638 171 889 24 %
NET OTHER INCOME 1 669 202 771 2 271 804 862 36 %
NET OPERATING INCOME 16 970 860 199 21 984 503 020 30 %
OPERATING EXPENSES -10 807 765 359 -11 245 162 784 4 %
GROSS OPERATING PROFIT 6 163 094 840 10 739 340 236 74 %
IMPAIRMENT CHARGES -3 751 841 058 -6 309 769 021 68 %
PROVISION FOR GENEAL BANKING RISKS
EXCEPTIONAL INCOME AND PREVIOUS YEARS’ GAIN/LOSS -327 596 317 -373 388 824 14 %
PROFIT BEFORE INCOME TAX 2 083 657 465 4 056 182 391 95 %
INCOME TAX EXPENSE -5 000 000 -5 000 000 0 %
NET INCOME 2 078 657 465 4 051 182 391 95 %
At 31/12/2016, 1 Euro = 655.957 CFAF


2016 key figures (in millions of TZS)
132
ANNUAL REPORT 2
016
BANK O
F A
FRIC
A G
roup
Opening date October 2007Created in 1995: EURAFRICAN BANK –TANZANIA Ltd (EBT).Integrated into BOA network in 2007.
Capital as at 31/12/2016Tanzanian Shillings (TZS) 37.02 billion
Board of Directors as at 31/12/2016Mwanaidi SINARE MAAJAR, ChairmanAmine BOUABIDAbdelkabir BENNANIVincent de BROUWERHenri LALOUXEmmanuel Ole NAIKOMoremi MARWA
Principal Shareholders as at 31/12/2016
AuditorsDELOITTE & TOUCHE
Registered officeNDC Development House - Ohio Street /Kivukoni FrontP.O. Box 3054 - Dar Es Salaam -TANZANIATel.: (255) 22 211 01 04 / 12 90Fax: (255) 22 211 37 40SWIFT: EUAFTZTZ
BOA GROUP S.A.
30.50 %
BELGIAN INVESTMENT COMPANY FORDEVELOPING COUNTRIES (BIO)
16.30 %
BANK OF AFRICA -KENYA
15.70 %
BOA WEST AFRICA
14.50 %
AFH-OCÉANINDIEN
14.30 %
TANZANIA DEVELOPMENTFINANCE LTD (TDFL)
5.20 %
OTHERSHAREHOLDERS
3.50 %
Activity 2015 2016 VariationDeposits 350,714 393,635 12.2 %Loans 307,101 324,870 5.8 %Number of branches at the end of the financial year 23 27 17.4 %
StructureTotal Assets 575,340 628,877 9.3 %Shareholders’ equity 68,319 72,006 5.4 %Number of employees at the end of the financial year 346 309 -10.7 %
Capital adequacy ratioTier 1 56,924 60,668Tier 2 5,823 4,306Risk Weighted Asset (RWA) 291,170 400,612 Tier 1 + Tier 2 / RWA 21.5 % 16.2 %
TANZANIA
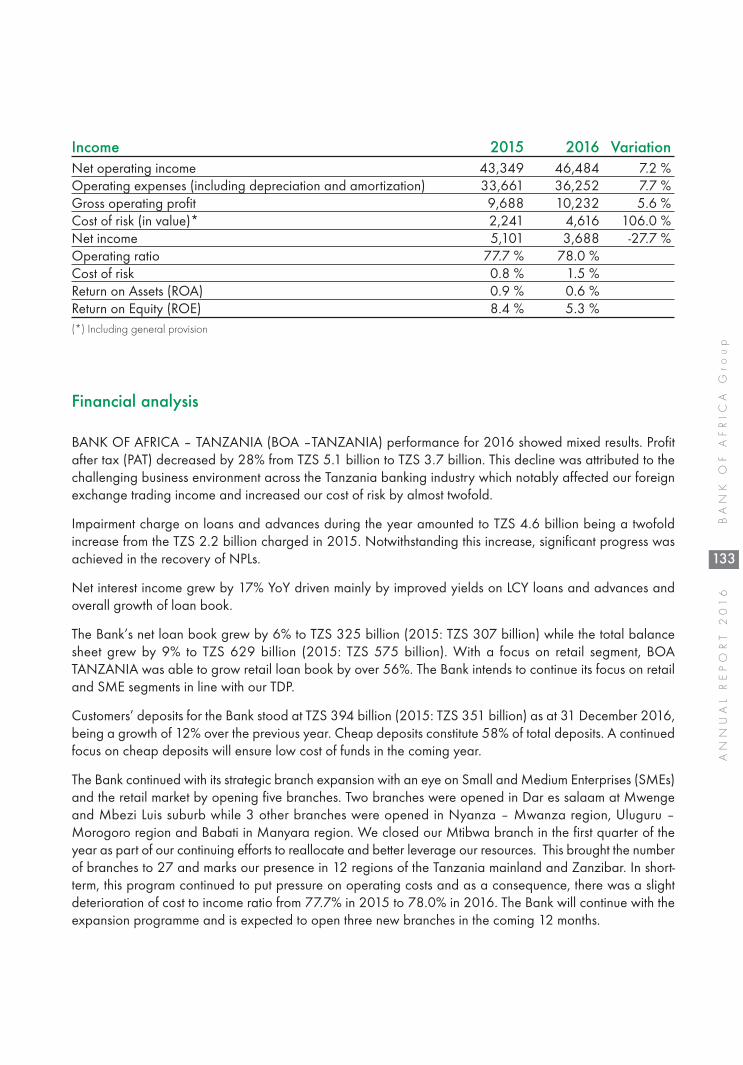
133
BANK O
F A
FRIC
A G
roup
ANNUAL REPORT 2
016
Income 2015 2016 VariationNet operating income 43,349 46,484 7.2 %Operating expenses (including depreciation and amortization) 33,661 36,252 7.7 %Gross operating profit 9,688 10,232 5.6 %Cost of risk (in value)* 2,241 4,616 106.0 %Net income 5,101 3,688 -27.7 %Operating ratio 77.7 % 78.0 %Cost of risk 0.8 % 1.5 %Return on Assets (ROA) 0.9 % 0.6 %Return on Equity (ROE) 8.4 % 5.3 %(*) Including general provision
Financial analysis
BANK OF AFRICA – TANZANIA (BOA –TANZANIA) performance for 2016 showed mixed results. Profitafter tax (PAT) decreased by 28% from TZS 5.1 billion to TZS 3.7 billion. This decline was attributed to thechallenging business environment across the Tanzania banking industry which notably affected our foreignexchange trading income and increased our cost of risk by almost twofold.
Impairment charge on loans and advances during the year amounted to TZS 4.6 billion being a twofoldincrease from the TZS 2.2 billion charged in 2015. Notwithstanding this increase, significant progress wasachieved in the recovery of NPLs.
Net interest income grew by 17% YoY driven mainly by improved yields on LCY loans and advances andoverall growth of loan book.
The Bank’s net loan book grew by 6% to TZS 325 billion (2015: TZS 307 billion) while the total balancesheet grew by 9% to TZS 629 billion (2015: TZS 575 billion). With a focus on retail segment, BOATANZANIA was able to grow retail loan book by over 56%. The Bank intends to continue its focus on retailand SME segments in line with our TDP.
Customers’ deposits for the Bank stood at TZS 394 billion (2015: TZS 351 billion) as at 31 December 2016,being a growth of 12% over the previous year. Cheap deposits constitute 58% of total deposits. A continuedfocus on cheap deposits will ensure low cost of funds in the coming year.
The Bank continued with its strategic branch expansion with an eye on Small and Medium Enterprises (SMEs)and the retail market by opening five branches. Two branches were opened in Dar es salaam at Mwengeand Mbezi Luis suburb while 3 other branches were opened in Nyanza – Mwanza region, Uluguru –Morogoro region and Babati in Manyara region. We closed our Mtibwa branch in the first quarter of theyear as part of our continuing efforts to reallocate and better leverage our resources. This brought the numberof branches to 27 and marks our presence in 12 regions of the Tanzania mainland and Zanzibar. In short-term, this program continued to put pressure on operating costs and as a consequence, there was a slightdeterioration of cost to income ratio from 77.7% in 2015 to 78.0% in 2016. The Bank will continue with theexpansion programme and is expected to open three new branches in the coming 12 months.

134
ANNUAL REPORT 2
016
BANK O
F A
FRIC
A G
roup
Significant performances (in billion of TZS)
Breaking the fast with clients during Ramadan
350.7
Deposits Net operating income
43.346.5393.6
2015 20162015 2016
12.2 % 7.2 %
Stock information (in million of TZS)
2014 2015 2016 AAGR*Earning per share 19.0 20.7 15.0 -11.4 %
Shareholder’s equity per share 255.3 276.9 291.8 6.9 %
Dividend per share 9.4
(*) Average annual growth rate

135
BANK O
F A
FRIC
A G
roup
ANNUAL REPORT 2
016
Highlights
Inauguration of Mwanza Branch
AprilLaunch of a new Website.
MayLaunch of a Campaign on “Bid Bonds”. The campaignwas centred around the promotion of an unsecured bidguarantee of up to TZS 1 billion (approx. EUR 410,000).
JuneParticipation in the “World Blood Donor Day” as oneof the main sponsors of the event.
AugustLaunch of the “Deposit campaign”.
SeptemberLaunch of “Visa Cards”
Official launch of “Lease Finance”.
Participation in the 2016 BANK OF AFRICANetwork Management Meetings in Marrakech,Morocco.
OctoberLaunch of the “Recovery campaign”
NovemberSigning of a financing agreement with AgenceFrançaise de Développement (AFD), for a credit lineamounting to TZS 25.67 billion (USD 11.84 millionfor renewable energy and energy efficiency).
Launch of Home Construction Loan branded“WEZESHA LOAN“.
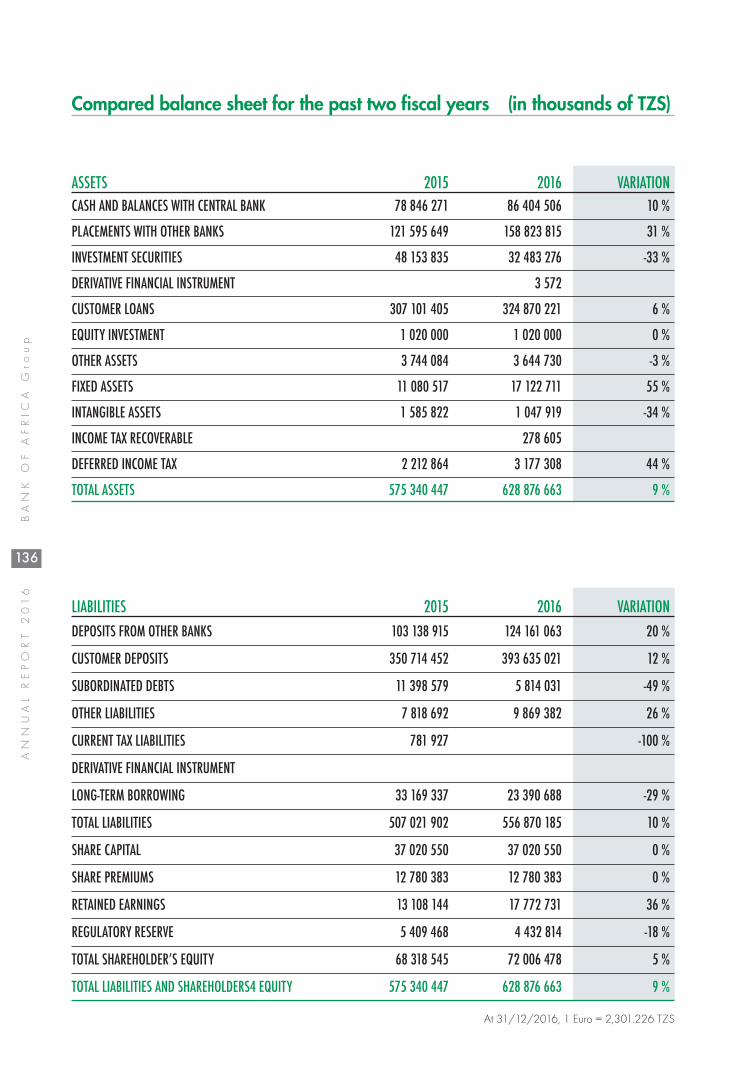
136
ANNUAL REPORT 2
016
BANK O
F A
FRIC
A G
roup
ASSETS 2015 2016 VARIATIONCASH AND BALANCES WITH CENTRAL BANK 78 846 271 86 404 506 10 %
PLACEMENTS WITH OTHER BANKS 121 595 649 158 823 815 31 %
INVESTMENT SECURITIES 48 153 835 32 483 276 -33 %
DERIVATIVE FINANCIAL INSTRUMENT 3 572
CUSTOMER LOANS 307 101 405 324 870 221 6 %
EQUITY INVESTMENT 1 020 000 1 020 000 0 %
OTHER ASSETS 3 744 084 3 644 730 -3 %
FIXED ASSETS 11 080 517 17 122 711 55 %
INTANGIBLE ASSETS 1 585 822 1 047 919 -34 %
INCOME TAX RECOVERABLE 278 605
DEFERRED INCOME TAX 2 212 864 3 177 308 44 %
TOTAL ASSETS 575 340 447 628 876 663 9 %
LIABILITIES 2015 2016 VARIATIONDEPOSITS FROM OTHER BANKS 103 138 915 124 161 063 20 %
CUSTOMER DEPOSITS 350 714 452 393 635 021 12 %
SUBORDINATED DEBTS 11 398 579 5 814 031 -49 %
OTHER LIABILITIES 7 818 692 9 869 382 26 %
CURRENT TAX LIABILITIES 781 927 -100 %
DERIVATIVE FINANCIAL INSTRUMENT
LONG-TERM BORROWING 33 169 337 23 390 688 -29 %
TOTAL LIABILITIES 507 021 902 556 870 185 10 %
SHARE CAPITAL 37 020 550 37 020 550 0 %
SHARE PREMIUMS 12 780 383 12 780 383 0 %
RETAINED EARNINGS 13 108 144 17 772 731 36 %
REGULATORY RESERVE 5 409 468 4 432 814 -18 %
TOTAL SHAREHOLDER’S EQUITY 68 318 545 72 006 478 5 %
TOTAL LIABILITIES AND SHAREHOLDERS4 EQUITY 575 340 447 628 876 663 9 %
Compared balance sheet for the past two fiscal years (in thousands of TZS)
At 31/12/2016, 1 Euro = 2,301.226 TZS

137
BANK O
F A
FRIC
A G
roup
ANNUAL REPORT 2
016
OFF-BALANCE-SHEET 2015 2016 VARIATIONCOMMITMENTS GIVEN 14 251 177 94 404 935 562 %
Credit commitments 8 170 616 30 148 117 269 %
• to credit institutions
• to customers 8 170 616 30 148 117 269 %
Guarantees given 6 080 561 64 256 818 957 %
• on behalf of credit institutions
• on behalf of customers 6 080 561 64 256 818 957 %
Commitments on securities
(in thousands of TZS)
Compared income for the past two fiscal years
2015 2016 VARIATIONINTEREST AND SIMILAR INCOME 46 713 104 53 999 031 16 %
INTEREST AND SIMILAR EXPENSES -18 392 082 -20 852 228 13 %
NET INTEREST INCOME 28 321 022 33 146 803 17 %
FEE AND COMMISSION INCOME 11 322 202 13 444 849 19 %
FEE AND COMMISSION EXPENSE -1 804 274 -2 725 144 51 %
NET COMMISSION 9 517 928 10 719 705 13 %
FOREIGN EXCHANGE INCOME 5 509 674 2 592 933 -53 %
OTHER INCOME 24 513
NET OPERATING INCOME 43 348 624 46 483 954 7 %
WRITE-BACK OF PROVISIONS 357 010 135 710 -62 %
IMPAIRMENT CHARGES ON LOANS AND ADVANCES -2 597 671 -4 751 655 83 %
OPERATING EXPENSES -33 660 887 -36 251 527 8 %
PROFIT BEFORE INCOME TAX 7 447 076 5 616 482 -25 %
INCOME TAX EXPENSE -2 345 586 -1 928 549 -18 %
NET INCOME 5 101 490 3 687 933 -28 %

138
ANNUAL REPORT 2
016
BANK O
F A
FRIC
A G
roup
2016 key figures (in thousands of CFAF)
Opening date October 2013
Capital as at 31/12/2016CFAF 10 billion
Board of Directors as at 31/12/2016Paulin Laurent COSSI, Chairman
Lassiné DIAWARA
Noël EKLO
Homialo GBEASOR
AGORA S.A., Represented by Abderrazzak ZEBDANI
BOA WEST AFRICA, Represented by Amine BOUABID
Principal Shareholders as at 31/12/2016
AuditorsAFRIQUE AUDIT CONSULTINGFICAO
Registered officeBoulevard de la RépubliqueBP 229 - Lomé - TOGOTel.: (228) 22 53 62 62
BOA WEST AFRICA
94.44 %
LASSINÉ DIAWARRA
5.00 %
PRIVATE SHAREHOLDERS
0.56 %
Activity 2015 2016 VariationDeposits 28,177 32,520 15.4 %Loans 41,502 55,365 33.4 %Number of branches at the end of the financial year 8 10 25.0 %
StructureTotal Assets 86,912 117,016 34.6 %Shareholders’ equity 6,502 5,453 -16.1 %Number of employees at the end of the financial year 95 104 9.5 %
TOGO
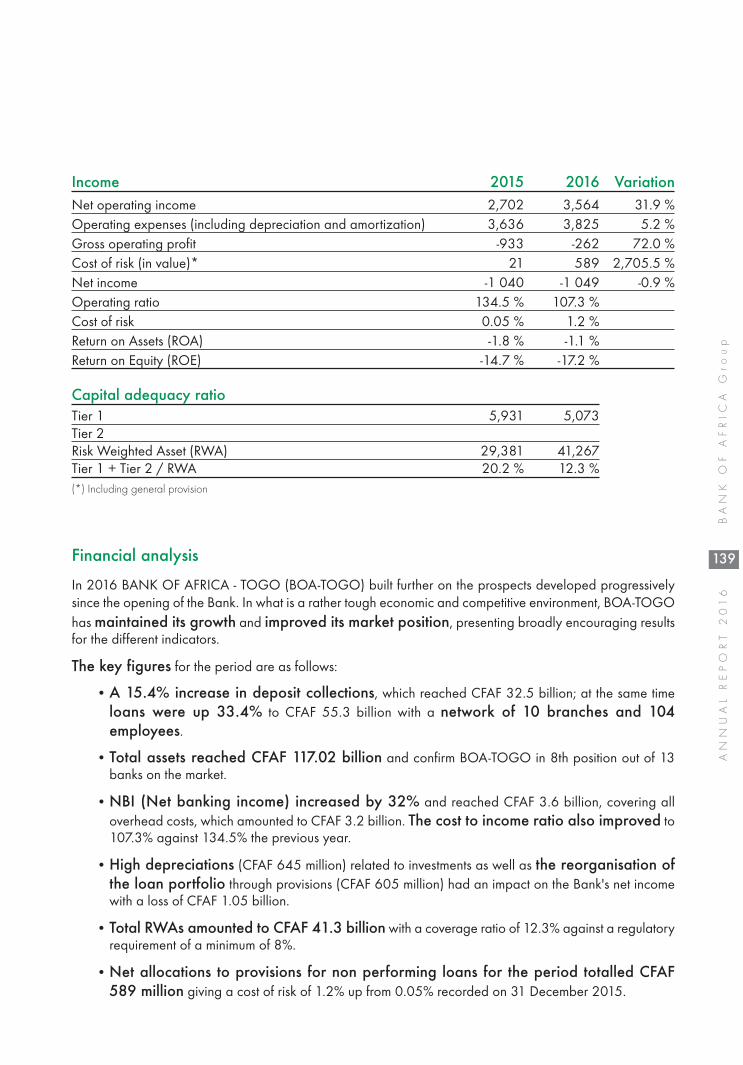
139
BANK O
F A
FRIC
A G
roup
ANNUAL REPORT 2
016
Income 2015 2016 VariationNet operating income 2,702 3,564 31.9 %Operating expenses (including depreciation and amortization) 3,636 3,825 5.2 %Gross operating profit -933 -262 72.0 %Cost of risk (in value)* 21 589 2,705.5 %Net income -1 040 -1 049 -0.9 %Operating ratio 134.5 % 107.3 %Cost of risk 0.05 % 1.2 %Return on Assets (ROA) -1.8 % -1.1 %Return on Equity (ROE) -14.7 % -17.2 %
Capital adequacy ratioTier 1 5,931 5,073 Tier 2 Risk Weighted Asset (RWA) 29,381 41,267 Tier 1 + Tier 2 / RWA 20.2 % 12.3 %(*) Including general provision
Financial analysis
In 2016 BANK OF AFRICA - TOGO (BOA-TOGO) built further on the prospects developed progressivelysince the opening of the Bank. In what is a rather tough economic and competitive environment, BOA-TOGOhas maintained its growth and improved its market position, presenting broadly encouraging resultsfor the different indicators.
The key figures for the period are as follows:
•A 15.4% increase in deposit collections, which reached CFAF 32.5 billion; at the same timeloans were up 33.4% to CFAF 55.3 billion with a network of 10 branches and 104employees.
• Total assets reached CFAF 117.02 billion and confirm BOA-TOGO in 8th position out of 13banks on the market.
•NBI (Net banking income) increased by 32% and reached CFAF 3.6 billion, covering alloverhead costs, which amounted to CFAF 3.2 billion. The cost to income ratio also improved to107.3% against 134.5% the previous year.
•High depreciations (CFAF 645 million) related to investments as well as the reorganisation ofthe loan portfolio through provisions (CFAF 605 million) had an impact on the Bank's net incomewith a loss of CFAF 1.05 billion.
• Total RWAs amounted to CFAF 41.3 billion with a coverage ratio of 12.3% against a regulatoryrequirement of a minimum of 8%.
•Net allocations to provisions for non performing loans for the period totalled CFAF589 million giving a cost of risk of 1.2% up from 0.05% recorded on 31 December 2015.

140
ANNUAL REPORT 2
016
BANK O
F A
FRIC
A G
roup
Significant performances (in CFAF billion)
Donation of school kits in a primary school in Lomé
41.5
Loans Net operating income
2.7
3.5
55.3
2015 20162015 2016
33.4 % 31.9 %

141
BANK O
F A
FRIC
A G
roup
ANNUAL REPORT 2
016
Highlights
April Launch of the 'Campagne Epargne' campaignto promote savings.
June Launch of the 'Tous à l’Ecole' campaign.
JulyAppointment of a new Managing Director.
SeptemberLaunch of 'Tous à la BOA' and 'Fonxionaria'campaigns.
Participation in the 2016 BANK OF AFRICADirectors’ Meetings, in Marrakesh, Morocco.
DecemberInauguration of the Baguida Branch, around Lomé.
Inauguration of Baguida Branch

142
ANNUAL REPORT 2
016
BANK O
F A
FRIC
A G
roup
ASSETS 2015 2016 VARIATIONCASH 779 950 289 1 515 600 231 94 %
INTERBANK LOANS 14 883 829 562 14 256 194 535 -4 %
CUSTOMER LOANS 41 501 588 155 55 365 427 790 33 %
- Portfolio of discounted bills 48 500 000 324 500 000 569 %
- Other customer credit facilities 40 306 290 496 53 479 111 516 33 %
- Ordinary debtor accounts 1 146 797 659 1 561 816 274 36 %
- Factoring
INVESTMENT SECURITIES 23 966 400 000 37 956 250 000 58 %
FINANCIAL ASSETS 130 970 000 130 970 000 0 %
LEASING AND SIMILAR TRANSACTIONS
FINANCIAL ASSETS AT EQUITY VALUE
INTANGIBLE ASSETS 455 423 740 263 819 313 -42 %
FIXED ASSETS 2 431 244 452 2 755 487 971 13 %
SHAREHOLDERS & ASSOCIATES
OTHER ASSETS 1 936 074 119 2 172 619 826 12 %
SUNDRY ACCOUNTS 826 856 875 2 599 240 601 214 %
CONSOLIDATED GOODWILL
TOTAL ASSETS 86 912 337 192 117 015 610 267 35 %
OFF-BALANCE-SHEET 2015 2016 VARIATIONCOMMITMENTS GIVEN 2 432 146 547 2 022 152 130 -17 %Credit commitments 420 398 340 247 652 138 -41 %
• to credit institutions • to customers 420 398 340 247 652 138 -41 %
Guarantees given 2 011 748 207 1 774 499 992 -12 %• on behalf of credit institutions • on behalf of customers 2 011 748 207 1 774 499 992 -12 %
Commitments on securities
Compared balance sheet for the past two fiscal years (in CFAF)
At 31/12/2016, 1 Euro = 655.957 CFAF

143
BANK O
F A
FRIC
A G
roup
ANNUAL REPORT 2
016
LIABILITIES 2015 2016 VARIATION
INTERBANK LIABILITIES 49 425 315 539 74 424 828 256 51 %
CUSTOMER DEPOSITS 28 177 250 505 32 519 941 199 15 %
- Savings deposit accounts 2 589 733 670 4 135 886 460 60 %
- Time deposit account 257 190 698 571 923 347 122 %
- Short-term borrowings
- Other demand deposits 11 567 684 585 11 346 688 708 -2 %
- Other time deposit accounts 13 762 641 552 16 465 442 684 20 %
DEBTS EVIDENCED BY SECURITIES
OTHER LIABILITIES 2 249 022 848 2 068 921 028 -8 %
SUNDRY ACCOUNTS 474 748 482 2 375 291 921 400 %
RESERVES FOR CONTINGENCIES & LOSSES 83 915 940 174 007 078 107 %
STATUTORY PROVISIONS
EARMARKED FUNDS
SUBORDINATED LOANS & SECURITIES
INVESTMENT SUBSIDIES
RESERVES FOR GENERAL BANKING RISKS
SHARE CAPITAL 10 000 000 000 10 000 000 000 0 %
SHARE PREMIUMS
RESERVES
RETAINED EARNINGS ( +/- ) -2 457 856 311 -3 497 916 122 42 %
NET INCOME -1 040 059 811 -1 049 463 093 1 %
TOTAL LIABILITIES 86 912 337 192 117 015 610 267 35 %
OFF-BALANCE-SHEET 2015 2016 VARIATIONCOMMITMENTS RECEIVED 46 982 030 405 56 592 934 693 20 %Credit commitments
• received from credit institutions• received from customers
Guarantees given 46 982 030 405 56 592 934 693 20 %• received from credit institutions 12 500 000 000 16 460 000 000 32 % • received from customers 34 482 030 405 40 132 934 693 16 %
Commitments on securities
(in CFAF)

144
ANNUAL REPORT 2
016
BANK O
F A
FRIC
A G
roup
Compared income for the past two fiscal years (in CFAF)
2015 2016 VARIATION
INTEREST INCOME 3 520 033 235 5 952 541 727 69 %
INTEREST EXPENSE -1 617 136 169 -3 406 291 836 111 %
NET INTEREST INCOME 1 902 897 066 2 546 249 891 34 %
FEE AND COMMISSION INCOME 835 362 433 1 393 696 774 67 %
FEE AND COMMISSION EXPENSE -146 284 975 -828 303 909 466 %
NET FEE AND COMMISSION INCOME 689 077 458 565 392 865 -18 %
NET OTHER INCOME 110 101 271 452 176 198 311 %
NET OPERATING INCOME 2 702 075 795 3 563 818 954 32 %
OPERATING EXPENSES -3 635 500 707 -3 825 344 767 5 %
GROSS OPERATING PROFIT -933 424 912 -261 525 813 72 %
IMPAIRMENT CHARGES -91 849 022 -679 236 576 640 %
NET PROVISION FOR GENERAL BANKING RISK
EXCEPTIONAL INCOME AND ON PAST FISCAL YEARS’ -859 575 -95 849 311 -11051 %
PROFIT BEFORE INCOME TAX -1 026 133 509 -1 036 611 700 -1 %
INCOME TAX EXPENSE -13 926 302 -12 851 393 -8 %
NET INCOME -1 040 059 811 -1 049 463 093 -1 %
At 31/12/2016, 1 Euro = 655.957 CFAF


146
ANNUAL REPORT 2
016
BANK O
F A
FRIC
A G
roup
2016 key figures (in millions of UGX)
Opening date October 2006Created in 1985: SEMBULE INVESTMENTBANK Ltd > ALLIED BANK. Integrated into BOAnetwork in 2006.
Capital as at 31/12/2016Uganda Shillings (UGX) 46.775 billion
Board of Directors as at 31/12/2016John CARRUTHERS, Chairman
Amine BOUABID
Abdelkabir BENNANI
Mohan Musisi KIWANUKA
Vincent de BROUWER
Gertrude K. BYARUHANGA
Principal Shareholders as at 31/12/2016
Bernard R. MAGULU
Arthur ISIKO
AuditorsPRICEWATERHOUSECOOPERS
Registered officeBANK OF AFRICA HousePlot 45, Jinja RoadP.O. Box 2750 - Kampala - UGANDATel.: (256) 414 302001Fax: (256) 414 230 902SWIFT: AFRIUGKA
BANK OF AFRICA - KENYA
43.24 %
AFH-OCÉAN INDIEN
37.96 %
NETHERLANDS DEVELOPMENTFINANCE COMPANY (FMO)
11.04 %
CENTRAL HOLDINGS Ltd.
7.76 %
Activity 2015 2016 VariationDeposits 433,368 480,246 10.8 %
Loans 264,666 293,281 10.8 %
Number of branches at the end of the financial year 36 35 -2.8 %
StructureTotal Assets 629,407 688,560 9.4 %
Shareholders’ equity 84,387 96,530 14.4 %
Number of employees at the end of the financial year 445 443 -0.4 %
UGANDA

147
BANK O
F A
FRIC
A G
roup
ANNUAL REPORT 2
016
Income 2015 2016 VariationNet operating income 58,129 78,668 35.3 %
Operating expenses (including depreciation and amortization) 53,654 60,042 11.9 %
Gross operating profit 4,475 18,626 316.2 %
Cost of risk (in value)* 5,968 2,868 -51.9 %
Net income 519 12,143 2,239.7 %
Operating ratio 92.3 % 76.3 %
Cost of risk 2.4 % 1.0 %
Return on Assets (ROA) 0.1 % 1.8 %
Return on Equity (ROE) 0.7 % 13.4 %
Capital adequacy ratioTier 1 64,374 69,212
Tier 2 5,405 3,001
Risk Weighted Asset (RWA) 431,650 412,237
Tier 1 + Tier 2 / RWA 16.2 % 17.5 %
(*) Including general provision
Financial analysis
In an election year characterized by relatively weak GDP growth and significant uncertainty, our 2016financial results reflected resilience. Our growth in most metrics was better than industry outturns with goodprogress recorded in loan growth, deposit growth, credit quality, capital growth, liquidity management andcost management.
Despite a relatively higher operational and credit risk environment, we recorded the highest level of net profitsin the history of the Bank. This was largely driven by strong growth in net interest income and improvementin credit risk management efforts that yielded a lower cost of risk and superior credit provision buffers. Non-interest income also performed better than in the previous period with a large contribution of this performancearising from a return to profitable but sustainable treasury operations. Investment in human capital andtechnology continued to dominate our operating costs as we sought to build on competencies in servicedelivery in not just the physical but also the digital interactions that we have with our customers.
During 2017, our focus will continue to emphasize the use of new distribution channels to enrich customerexperiences and improve business processes. More emphasis will also be placed on contributing to thegrowth of our economy through increased support to the small and medium enterprises in the country whoare the true engines for growth. This, together with our continuing commitment to a risk focused culture willensure better delivery and protection of value to our customers, our shareholders, our employees, ourregulators and the communities in which we operate.
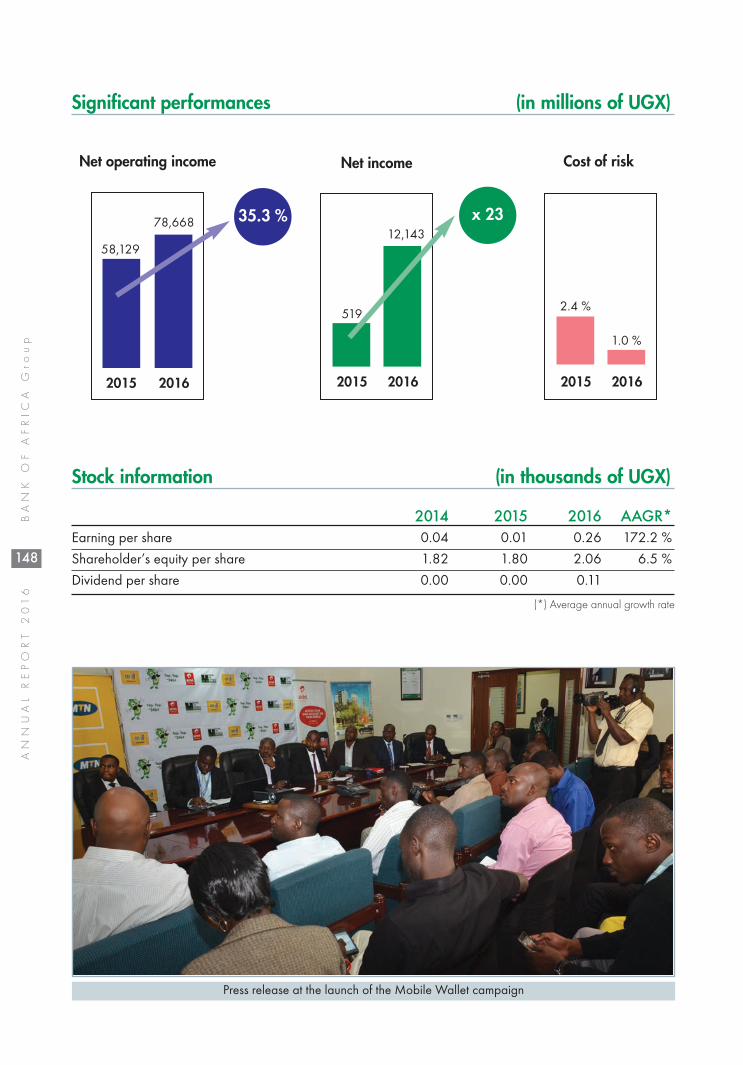
148
ANNUAL REPORT 2
016
BANK O
F A
FRIC
A G
roup
Significant performances (in millions of UGX)
Press release at the launch of the Mobile Wallet campaign
58,129
Net operating income Net income Cost of risk
519
12,14378,668
2015 20162015 2016
35.3 % x 23
2.4 %
1.0 %
2015 2016
Stock information (in thousands of UGX)
2014 2015 2016 AAGR*Earning per share 0.04 0.01 0.26 172.2 %
Shareholder’s equity per share 1.82 1.80 2.06 6.5 %
Dividend per share 0.00 0.00 0.11
(*) Average annual growth rate

149
BANK O
F A
FRIC
A G
roup
ANNUAL REPORT 2
016
Highlights
MarchSponsored and participated in the annualBanking Finance and Insurance Expo themed“Strategic new ventures for financial andinsurance players”.
MayDeposit mobilization campaign dubbed - Dreamdash campaign.
JulySponsored and participated in the WAWI Fistulacharity walk.
AugustLaunched 2 campaigns: VISA and FUNAEKYAPA.
OctoberLaunched 2 new accounts: “Investment Club” and“Insurance Premium Financing”.
NovemberLaunched externally the Enhanced Mobile walletcampaign: (M-Saving & M-Loans).
MTN Marathon under the theme “Run for Kampala”aimed at collecting funds to support and improve thequality of lives of our children and Community.
DecemberHeld the customer service week in line with the theme“Customer experience simplified”.
Kampala Business Centre in Uganda
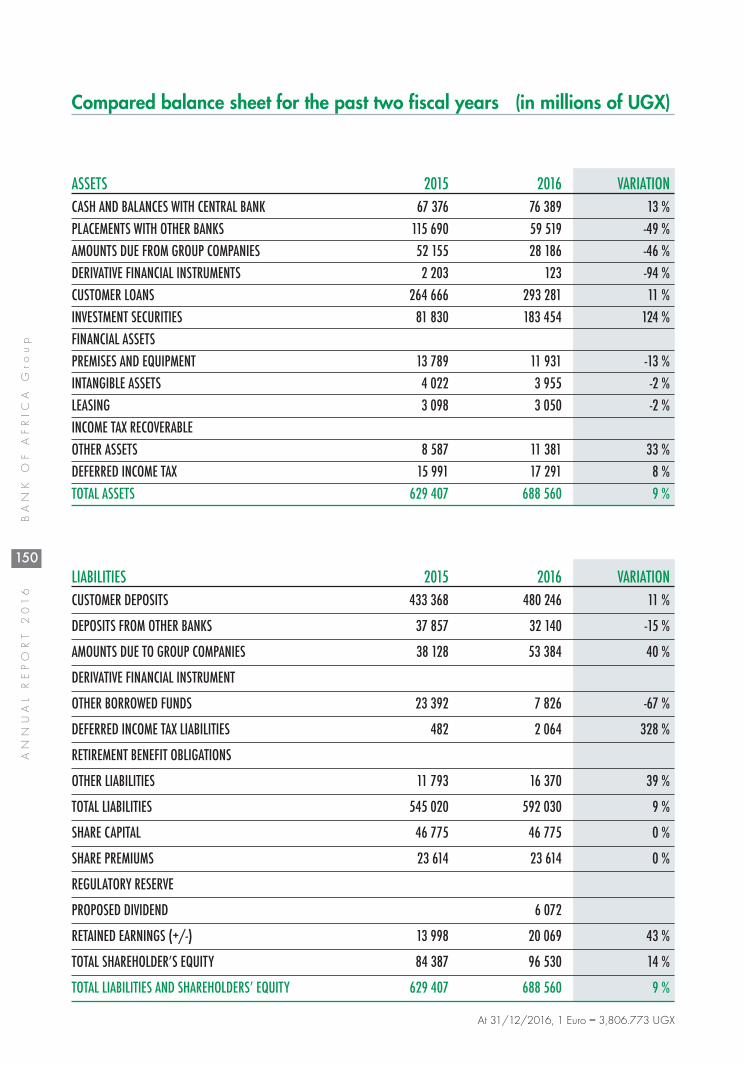
150
ANNUAL REPORT 2
016
BANK O
F A
FRIC
A G
roup
ASSETS 2015 2016 VARIATIONCASH AND BALANCES WITH CENTRAL BANK 67 376 76 389 13 %PLACEMENTS WITH OTHER BANKS 115 690 59 519 -49 %AMOUNTS DUE FROM GROUP COMPANIES 52 155 28 186 -46 %DERIVATIVE FINANCIAL INSTRUMENTS 2 203 123 -94 %CUSTOMER LOANS 264 666 293 281 11 %INVESTMENT SECURITIES 81 830 183 454 124 %FINANCIAL ASSETSPREMISES AND EQUIPMENT 13 789 11 931 -13 %INTANGIBLE ASSETS 4 022 3 955 -2 %LEASING 3 098 3 050 -2 %INCOME TAX RECOVERABLEOTHER ASSETS 8 587 11 381 33 %DEFERRED INCOME TAX 15 991 17 291 8 %TOTAL ASSETS 629 407 688 560 9 %
LIABILITIES 2015 2016 VARIATIONCUSTOMER DEPOSITS 433 368 480 246 11 %
DEPOSITS FROM OTHER BANKS 37 857 32 140 -15 %
AMOUNTS DUE TO GROUP COMPANIES 38 128 53 384 40 %
DERIVATIVE FINANCIAL INSTRUMENT
OTHER BORROWED FUNDS 23 392 7 826 -67 %
DEFERRED INCOME TAX LIABILITIES 482 2 064 328 %
RETIREMENT BENEFIT OBLIGATIONS
OTHER LIABILITIES 11 793 16 370 39 %
TOTAL LIABILITIES 545 020 592 030 9 %
SHARE CAPITAL 46 775 46 775 0 %
SHARE PREMIUMS 23 614 23 614 0 %
REGULATORY RESERVE
PROPOSED DIVIDEND 6 072
RETAINED EARNINGS (+/-) 13 998 20 069 43 %
TOTAL SHAREHOLDER’S EQUITY 84 387 96 530 14 %
TOTAL LIABILITIES AND SHAREHOLDERS’ EQUITY 629 407 688 560 9 %
Compared balance sheet for the past two fiscal years (in millions of UGX)
At 31/12/2016, 1 Euro = 3,806.773 UGX

151
BANK O
F A
FRIC
A G
roup
ANNUAL REPORT 2
016
OFF-BALANCE-SHEET 2015 2016 VARIATIONCOMMITMENTS GIVEN 63 280 86 044 36 %Credit commitments 14 652 16 694 14 %
• to credit institutions • to customers 14 652 16 694 14 %
Guarantees given 48 628 69 350 43 %• on behalf of credit institutions • on behalf of customers 48 628 69 350 43 %
Commitments on securities
(in millions of UGX)
Compared income for the past two fiscal years (in millions of UGX)
2015 2016 VARIATIONINTEREST AND SIMILAR INCOME 52 552 70 607 34 %
INTEREST AND SIMILAR EXPENSES -14 244 -13 427 -6 %
NET INTEREST INCOME 38 308 57 180 49 %
FEE AND COMMISSION INCOME 37 459 25 426 -32 %
'FEE AND COMMISSION EXPENSE -13 881 -8 025 -42 %
NET COMMISSION 23 578 17 401 -26 %
FOREIGN EXCHANGE INCOME -6 165 1 129 -118 %
OTHER INCOME 2 408 2 958 23 %
NET OPERATING INCOME 58 129 78 668 35 %
IMPAIRMENT LOSSES ON LOANS AND ADVANCES -5 968 -2 868 -52 %
OPERATING EXPENSES -53 654 -60 042 12 %
PROFIT BEFORE INCOME TAX -1 493 15 758 -1155 %
INCOME TAX EXPENSE / TAXATION CREDIT 2 012 -3 615 -280 %
NET INCOME 519 12 143 2240 %
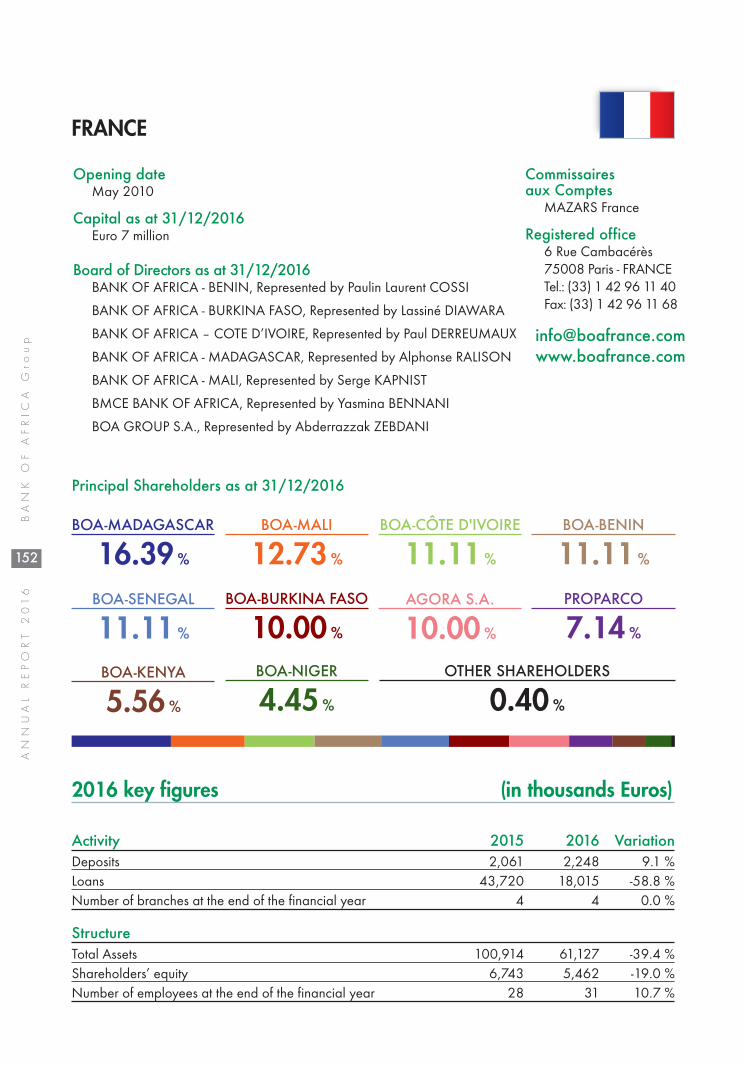
152
ANNUAL REPORT 2
016
BANK O
F A
FRIC
A G
roup
FRANCE
2016 key figures (in thousands Euros)
Opening date May 2010
Capital as at 31/12/2016Euro 7 million
Board of Directors as at 31/12/2016BANK OF AFRICA - BENIN, Represented by Paulin Laurent COSSI
BANK OF AFRICA - BURKINA FASO, Represented by Lassiné DIAWARA
BANK OF AFRICA – COTE D’IVOIRE, Represented by Paul DERREUMAUX
BANK OF AFRICA - MADAGASCAR, Represented by Alphonse RALISON
BANK OF AFRICA - MALI, Represented by Serge KAPNIST
BMCE BANK OF AFRICA, Represented by Yasmina BENNANI
BOA GROUP S.A., Represented by Abderrazzak ZEBDANI
Principal Shareholders as at 31/12/2016
BOA-MADAGASCAR
16.39 %
BOA-MALI
12.73 %
BOA-CÔTE D'IVOIRE
11.11 %
BOA-BENIN
11.11 %
BOA-SENEGAL
11.11 %
BOA-BURKINA FASO
10.00 %
AGORA S.A.
10.00 %
PROPARCO
7.14 %
BOA-KENYA
5.56 %
BOA-NIGER
4.45 %
OTHER SHAREHOLDERS
0.40 %
Activity 2015 2016 VariationDeposits 2,061 2,248 9.1 %Loans 43,720 18,015 -58.8 %Number of branches at the end of the financial year 4 4 0.0 %
StructureTotal Assets 100,914 61,127 -39.4 %Shareholders’ equity 6,743 5,462 -19.0 %Number of employees at the end of the financial year 28 31 10.7 %
Commissaires aux Comptes
MAZARS France
Registered office6 Rue Cambacérès75008 Paris - FRANCETel.: (33) 1 42 96 11 40 Fax: (33) 1 42 96 11 68

Income 2015 2016 VariationNet operating income 3,025 2,555 -15.5 %Operating expenses (including depreciation and amortization) 3,508 3,831 9.2 %Gross operating profit -482 -1,276 nsCost of risk (in value)* -6 -27 nsNet income -797 -1 281 nsOperating ratio 115.9 % 149.9 %Cost of risk 0.02 % 0.1 %Return on Assets (ROA) -0.9 % -1.6 %Return on Equity (ROE) -13.4 % -21.0 %
Capital adequacy ratioTier 1 6,171 5,030Tier 2 Risk Weighted Asset (RWA) 17,505 11,460Tier 1 + Tier 2 / RWA 35.2 % 43.9 %(*) Including general provision
153
BANK O
F A
FRIC
A G
roup
ANNUAL REPORT 2
016
Financial Analysis
The continued efforts of BOA-FRANCE in 2016 regarding consolidation and prudential upgrading resultedin a substantial slowdown in commercial activities, be it in the diaspora, Trade Finance or CorrespondentBanking. 2016 was a turning point that marked a new start for BOA-FRANCE on a healthier basis,on the road to further development and a vision resolutely supported by BMCE Bank Of Africa Group.
Customer deposits fell as a result of the desire to reduce the size of the balance sheet in 2016. Thesedeposits containing deposits of guarantees were in line with the Trade Finance and CorrespondentBanking activities.
Interbank demand deposits amounted to EUR 29 million at the end of 2016 vs. EUR 38 million end 2015.Term deposits fell sharply from EUR 53 million in 2015 to EUR 24 million in 2016, down 55%.
Lending also fell with a total of EUR 18 million at the end of 2016 vs. EUR 43 million at the end of 2015, adecrease of 59%, in a context in which priority was given to regulatory requirements.
The total balance sheet came to EUR 61 million at the end of December 2016, a significant decrease of39% compared to 2015.
In terms of earnings, Net Operating Income amounted to EUR 2,6 million versus EUR 3 million in 2015, adecrease of 16%.
The Net Operating Income is made up of 8% Net Interest and 92% of commissions and others.
Overhead costs increased reasonably, rising from EUR 3.5 million in 2015 to EUR 3.8 million in 2016, agrowth of 9%. This increase was mainly due to the staff costs and various IT system developments but remainswell contained.
At an insignificant cost of risk and in the absence of significant exceptional items for 2016, the Bank showeda net loss of EUR 1.3 million vs EUR 0.8 million in 2015. Shareholders' equity amounted to EUR 5.5million at the end of 2016.

154
ANNUAL REPORT 2
016
BANK O
F A
FRIC
A G
roup
ASSETS 2015 2016 VARIATION
CASH 258 433 269 732 4 %
INTERBANK LOANS 39 141 688 17 779 834 -55 %
CUSTOMER LOANS 43 720 071 18 014 925 -59 %
- Portfolio of discounted bills 43 670 843 18 014 920 -59 %
- Other customer credit facilities
- Ordinary debtor accounts 49 212 5 -100 %
- Factoring
INVESTMENT SECURITIES 16 272 442 23 521 980 45 %
FINANCIAL ASSETS
LEASING AND SIMILAR TRANSACTIONS
FINANCIAL ASSETS AT EQUITY VALUE
INTANGIBLE ASSETS 354 227 432 079 22 %
FIXED ASSETS 832 655 800 596 -4 %
SHAREHOLDERS & ASSOCIATES
OTHER ASSETS 290 178 232 587 -20 %
SUNDRY ACCOUNTS 44 017 75 613 72 %
CONSOLIDATED GOODWILL
TOTAL ASSETS 100 913 710 61 127 346 -39 %
Compared balance sheet for the past two fiscal years (in Euro)

155
BANK O
F A
FRIC
A G
roup
ANNUAL REPORT 2
016
LIABILITIES 2015 2016 VARIATION
INTERBANK LIABILITIES 90 790 783 52 069 373 -43 %
CUSTOMER DEPOSITS 2 060 622 2 248 476 9 %
- Savings deposit accounts 2 059 622 2 248 476 9 %
- Time deposit account
- Short-term borrowings
- Other demand deposits
- Other time deposit accounts
DEBTS EVIDENCED BY SECURITIES
OTHER LIABILITIES 122 429 138 059 13 %
SUNDRY ACCOUNTS 1 195 783 1 194 917 0 %
RESERVES FOR CONTINGENCIES & LOSSES 1 450 14 447 896 %
STATUTORY PROVISIONS
EARMARKED FUNDS
SUBORDINATED LOANS & SECURITIES
INVESTMENT SUBSIDIES
RESERVES FOR GENERAL BANKING RISKS
SHARE CAPITAL 7 000 000 7 000 000 0 %
SHARE PREMIUMS
RESERVES 539 888 -100 %
RETAINED EARNINGS ( +/- ) -257 358 0 %
NET INCOME -797 247 -1 280 568 61 %
TOTAL LIABILITIES 100 913 710 61 127 346 -39 %
(in Euro)

156
ANNUAL REPORT 2
016
BANK O
F A
FRIC
A G
roup
2015 2016 VARIATION
INTEREST INCOME 887 957 776 956 -13%
INTEREST EXPENSE -486 868 -563 337 16%
NET INTEREST INCOME 401 089 213 619 -47%
FEE AND COMMISSION INCOME 2 742 991 2 403 371 -12%
FEE AND COMMISSION EXPENSE -189 500 -163 216 -14%
NET FEE AND COMMISSION INCOME 2 553 491 2 240 155 -12%
NET OTHER INCOME 70 650 101 351 43%
NET OPERATING INCOME 3 025 229 2 555 125 -16%
OPERATING EXPENSES -3 507 596 -3 830 972 9%
GROSS OPERATING PROFIT -482 366 -1 275 846 164%
IMPAIRMENT CHARGES -6 462 -27 041 318%
NET PROVISION FOR GENERAL BANKING RISK
EXCEPTIONAL INCOME AND ON PAST FISCAL YEARS’ -308 418 22 320 -107%
PROFIT BEFORE INCOME TAX -797 247 -1 280 568 -61%
INCOME TAX EXPENSE
NET INCOME -797 247 -1 280 568 -61%
Compared income for the past two fiscal years (in Euro)


158
ANNUAL REPORT 2
016
BANK O
F A
FRIC
A G
roup
BANQUE DE l’HABITAT DU BENIN (BHB)
2016 key figures (in millions of CFAF)
Opening date April 2004
Capital as at 31/12/2016CFAF 5 billion
Board of Directors as at 31/12/2016Georges ABALLO, Chairman
Amine BOUABID
BANK OF AFRICA - BENIN, Represented by Faustin AMOUSSOU
CNSS, Represented by Moussa MORA JEREMIE
ÉTAT DU BÉNIN, Represented by Job OLOU
Benoît MAFFON
Abderrazzak ZEBDANI
Principal Shareholders as at 31/12/2016
AuditorsFIDUCIAIRE D'AFRIQUE: JOHANNESDAGNONMAZARS: ARMAND FANDOHAN
Registered officeBoulevard de France01 BP 6555 - CotonouRÉPUBLIQUE DU BÉNINTel.: (229) 21 31 24 25Fax: (229) 21 31 24 60
BOA WEST AFRICA
58.36 %
BANK OF AFRICA - BENIN
31.07 %
OTHER SHAREHOLDERS
10.57 %
Activity 2015 2016 VariationDeposits 19,798 19,098 -3.5 %
Loans 21,874 17,501 -19.9 %
Number of branches at the end of the financial year 2 2 0
StructureTotal Assets 28,142 22,787 -19.0 %
Shareholders’ equity 6,124 1,893 -69.1 %
Number of employees at the end of the financial year 24 23 -4.2 %
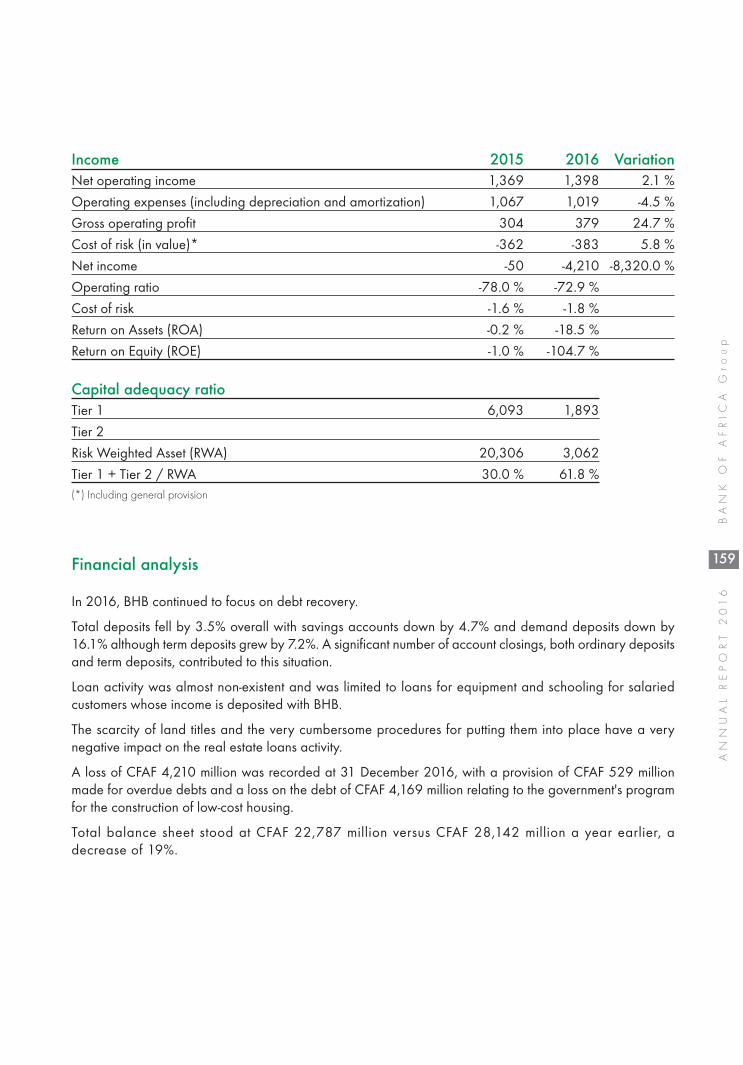
159
BANK O
F A
FRIC
A G
roup
ANNUAL REPORT 2
016
Income 2015 2016 VariationNet operating income 1,369 1,398 2.1 %
Operating expenses (including depreciation and amortization) 1,067 1,019 -4.5 %
Gross operating profit 304 379 24.7 %
Cost of risk (in value)* -362 -383 5.8 %
Net income -50 -4,210 -8,320.0 %
Operating ratio -78.0 % -72.9 %
Cost of risk -1.6 % -1.8 %
Return on Assets (ROA) -0.2 % -18.5 %
Return on Equity (ROE) -1.0 % -104.7 %
Capital adequacy ratioTier 1 6,093 1,893
Tier 2
Risk Weighted Asset (RWA) 20,306 3,062
Tier 1 + Tier 2 / RWA 30.0 % 61.8 %(*) Including general provision
Financial analysis
In 2016, BHB continued to focus on debt recovery.
Total deposits fell by 3.5% overall with savings accounts down by 4.7% and demand deposits down by16.1% although term deposits grew by 7.2%. A significant number of account closings, both ordinary depositsand term deposits, contributed to this situation.
Loan activity was almost non-existent and was limited to loans for equipment and schooling for salariedcustomers whose income is deposited with BHB.
The scarcity of land titles and the very cumbersome procedures for putting them into place have a verynegative impact on the real estate loans activity.
A loss of CFAF 4,210 million was recorded at 31 December 2016, with a provision of CFAF 529 millionmade for overdue debts and a loss on the debt of CFAF 4,169 million relating to the government's programfor the construction of low-cost housing.
Total balance sheet stood at CFAF 22,787 million versus CFAF 28,142 million a year earlier, adecrease of 19%.

160
ANNUAL REPORT 2
016
BANK O
F A
FRIC
A G
roup
ASSETS 2015 2016 VARIATION
CASH 92 256 741 71 095 039 -23 %
INTERBANK LOANS 5 237 767 790 3 811 731 255 -27 %
CUSTOMER LOANS 21 873 676 969 17 501 465 626 -20 %
- Portfolio of discounted bills
- Other customer credit facilities 5 333 546 152 17 499 048 278 228 %
- Ordinary debtor accounts 16 540 130 817 2 417 348 -100 %
- Factoring
INVESTMENT SECURITIES 187 500 000 125 000 000 -33 %
FINANCIAL ASSETS 100 000 000 100 000 000 0 %
LEASING AND SIMILAR TRANSACTIONS
FINANCIAL ASSETS AT EQUITY VALUE
INTANGIBLE ASSETS 30 962 583 21 324 217 -31 %
FIXED ASSETS 422 602 355 976 335 817 131 %
SHAREHOLDERS & ASSOCIATES
OTHER ASSETS 172 185 144 153 753 159 -11 %
SUNDRY ACCOUNTS 25 373 849 26 069 348 3 %
CONSOLIDATED GOODWILL
TOTAL ASSETS 28 142 325 431 22 786 774 461 -19 %
OFF-BALANCE-SHEET 2015 2016 VARIATIONCOMMITMENTS GIVEN 462 233 633 706 261 000 53 %Credit commitments
• to credit institutions • to customers
Guarantees given 462 233 633 706 261 000 53 % • on behalf of credit institutions 462 233 633 706 261 000 53 %• on behalf of customers
Commitments on securities
Compared balance sheet for the past two fiscal years (in CFAF)
At 31/12/2016, 1 Euro = 655.957 CFAF

161
BANK O
F A
FRIC
A G
roup
ANNUAL REPORT 2
016
LIABILITIES 2015 2016 VARIATIONINTERBANK LIABILITIES 703 957 548 606 850 264 -14 %
CUSTOMER DEPOSITS 19 797 501 499 19 098 460 656 -4 %
- Savings deposit accounts 6 943 000 233 6 543 297 302 -6 %
- Time deposit account 1 847 122 299 1 832 393 890 -1 %
- Short-term borrowings
- Other demand deposits 2 058 968 429 1 140 322 192 -45 %
- Other time deposit accounts 8 948 410 538 9 582 447 272 7 %
DEBTS EVIDENCED BY SECURITIES 800 000 000 400 000 000 -50 %
OTHER LIABILITIES 348 358 326 404 965 273 16 %
SUNDRY ACCOUNTS 270 238 156 256 542 523 -5 %
RESERVES FOR CONTINGENCIES & LOSSES 100 545 174 104 154 353 4 %
STATUTORY PROVISIONS
EARMARKED FUNDS 1 000 000 000 1 000 000 000 0 %
SUBORDINATED LOANS & SECURITIES
INVESTMENT SUBSIDIES
RESERVES FOR GENERAL BANKING RISKS
SHARE CAPITAL 5 000 000 000 5 000 000 000 0 %
SHARE PREMIUMS
RESERVES 111 232 189 111 232 189 0 %
RETAINED EARNINGS ( +/- ) 63 080 806 12 837 179 -80 %
NET INCOME -52 588 267 -4 208 267 976 7902 %
TOTAL LIABILITIES 28 142 325 431 22 786 774 461 -19 %
OFF-BALANCE-SHEET 2015 2016 VARIATIONCOMMITMENTS RECEIVED 11 920 685 400 10 956 000 000 -8 %Credit commitments 2 375 000 000 2 375 000 000 0 %
• received from credit institutions 2 375 000 000 2 375 000 000 0 %• received from customers
Guarantees given 9 545 685 400 8 581 000 000 -10 % • received from credit institutions • received from customers 9 545 685 400 8 581 000 000 -10 %
Commitments on securities
(in CFAF)
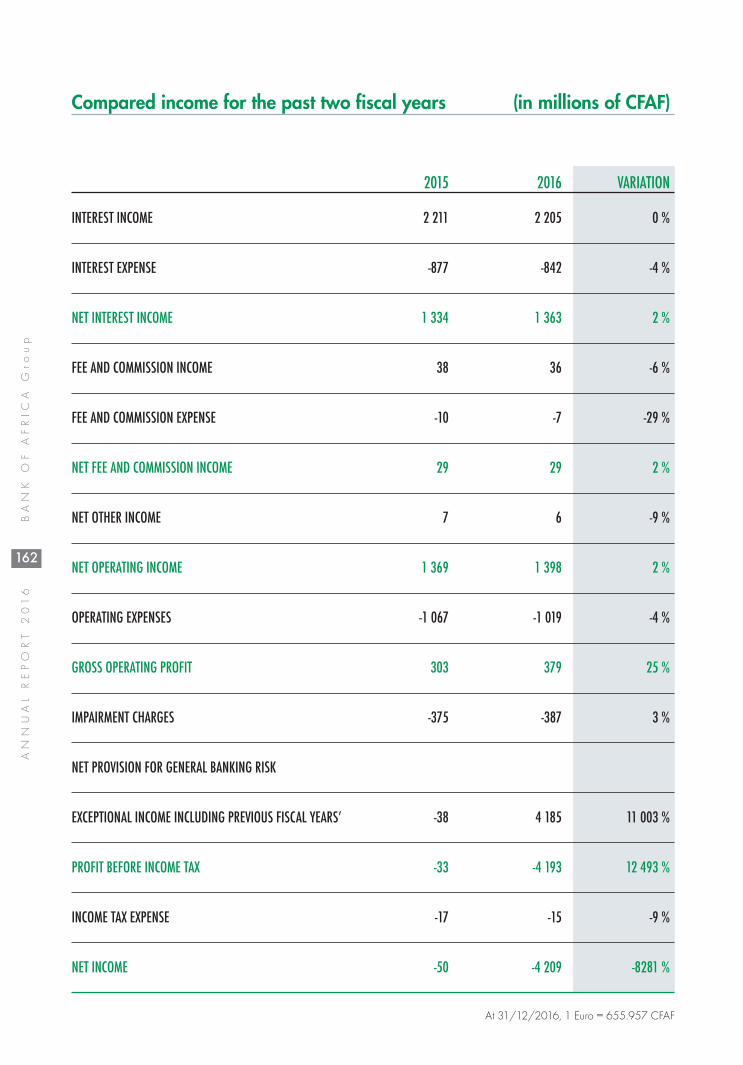
162
ANNUAL REPORT 2
016
BANK O
F A
FRIC
A G
roup
Compared income for the past two fiscal years (in millions of CFAF)
2015 2016 VARIATION
INTEREST INCOME 2 211 2 205 0 %
INTEREST EXPENSE -877 -842 -4 %
NET INTEREST INCOME 1 334 1 363 2 %
FEE AND COMMISSION INCOME 38 36 -6 %
FEE AND COMMISSION EXPENSE -10 -7 -29 %
NET FEE AND COMMISSION INCOME 29 29 2 %
NET OTHER INCOME 7 6 -9 %
NET OPERATING INCOME 1 369 1 398 2 %
OPERATING EXPENSES -1 067 -1 019 -4 %
GROSS OPERATING PROFIT 303 379 25 %
IMPAIRMENT CHARGES -375 -387 3 %
NET PROVISION FOR GENERAL BANKING RISK
EXCEPTIONAL INCOME INCLUDING PREVIOUS FISCAL YEARS’ -38 4 185 11 003 %
PROFIT BEFORE INCOME TAX -33 -4 193 12 493 %
INCOME TAX EXPENSE -17 -15 -9 %
NET INCOME -50 -4 209 -8281 %
At 31/12/2016, 1 Euro = 655.957 CFAF


164
ANNUAL REPORT 2
016
BANK O
F A
FRIC
A G
roup
Opening date July 2002
Capital as at 31/12/2016CFAF 5 billion
Board of Directors as at 31/12/2016Amine BOUABID, Chairman
Abderrazzak ZEBDANI
Jean-François MONTEIL
Lala MOULAYE
Principal Shareholders as at 31/12/2016
AuditorsMAZARS CÔTE D'IVOIRE
Registered officeAbidjan PlateauAngle Avenue Terrasson de FougèresRue Gourgas,01 BP 4132 Abidjan 01CÔTE D'IVOIRE
BOA GROUP S.A.
50.74 %
NETHERLANDS DEVELOPMENTFINANCE COMPANY (FMO)
16.00 %
BOA-BÉNIN
7.50 %
OTHER COMPANIES
5.39 %
BOA-BURKINA FASO
5.00 %
BOA-MALI
5.00 %
BOA-NIGER
5.00 %
FONDS OUEST AFRICAIND'INVESTISSEMENT
0.91 %
BOA-CÔTE D'IVOIRE
0.57 %
BOA-SÉNÉGAL
0.43 %
PRIVATESHAREHOLDERS
3.46 %
AGORA

ASSETS 2015 2016 VARIATION CASH
INTERBANK LOANS 7 442 8 179 10 %
CUSTOMER LOANS
- Portfolio of discounted bills
- Other customer credit facilities
- Ordinary debtor accounts
- Factoring
INVESTMENT SECURITIES 573 387 -32 %
FINANCIAL ASSETS 11 788 10 817 -8 %
INTANGIBLE ASSETS
FIXED ASSETS
SHAREHOLDERS & ASSOCIATES
OTHER ASSETS
SUNDRY ACCOUNTS
TOTAL ASSETS 19 803 19 383 -2 %
2015 2016 VARIATION INTEREST INCOME 309 339 10 %
INTEREST EXPENSE
NET INTEREST INCOME 309 339 10 %
FEE AND COMMISSION INCOME
FEE AND COMMISSION EXPENSE
NET FEE AND COMMISSION INCOME
OTHER INCOME 7 996 8 362 5 %
OPERATING INCOME 8 305 8 701 5 %
OPERATING EXPENSES 1 783 1 788 0 %
GROSS OPERATING PROFIT 6 522 6 913 6 %
IMPAIRMENT CHARGES -300
EXCEPTIONAL INCOME 1 337 1 087 -19 %
PROFIT BEFORE INCOME TAX 7 859 8 300 6 %
INCOME TAX EXPENSE 241 233 -3 %
NET INCOME 7 618 8 067 6 %
LIABILITIES 2015 2016 VARIATIONINTERBANK LIABILITIES 31 37 19 %CUSTOMER DEPOSITS- Savings deposit accounts- Time deposit account- Short-term borrowings- Other demand deposits - Other time deposit accounts DEBTS EVIDENCED BY SECURITIES 962 976 1 %OTHER LIABILITIES 1 201 495 -59 %SUNDRY ACCOUNTSRESERVES FOR CONTINGENCIES & LOSSES 300STATUTORY PROVISIONSSUBORDINATED LOANS & SECURITIES RESERVES FOR GENERAL BANKING RISKS SHARE CAPITAL 5 000 5 000 0 %SHARE PREMIUMSRESERVES 2 186 2 186 0 %RETAINED EARNINGS ( +/- ) 2 503 2 622 5 %NET INCOME 7 619 8 067 6 %TOTAL LIABILITIES 19 803 19 383 -2 %
Compared balance sheet for the past two fiscal years (in millions of CFAF)
Compared income for the past two fiscal years (in millions of CFAF)
At 31/12/2016, 1 Euro = 655.957 CFAF
165
BANK O
F A
FRIC
A G
roup
ANNUAL REPORT 2
016

166
ANNUAL REPORT 2
016
BANK O
F A
FRIC
A G
roup
Opening date October 2004
Capital as at 31/12/2016CFAF 2.5 billion
Board of Directors as at 31/12/2016Benoit MAFFON, Chairman
BOA GROUP S.A,Represented by Amine BOUABID
SUNU, Represented by Lassina COULIBALY
Jean-François MONTEIL
Mor FALL
Principal Shareholders as at 31/12/2016
AuditorsMAZARS CÔTE D'IVOIRE
Registered officeAbidjan PlateauAngle Avenue Terrasson de FougèresRue Gourgas, 01 BP 4132 Abidjan 01CÔTE D'IVOIRE
BOA GROUP S.A.
83.84 %
SUNU
11.76 %
GÉNÉRALE DESASSURANCES DU BÉNIN
4.00 %
PRIVATESHAREHOLDERS
0.40 %
ATTICA

ASSETS 2015 2016 VARIATIONCASH
INTERBANK LOANS 660 14 233 2 057 %
CUSTOMER LOANS
- Portfolio of discounted bills
- Other customer credit facilities
- Ordinary debtor accounts
- Factoring
INVESTMENT SECURITIES 161 120 -25 %
FINANCIAL ASSETS 2 736 1 185 -57 %
INTANGIBLE ASSETS
FIXED ASSETS
SHAREHOLDERS & ASSOCIATES
OTHER ASSETS
SUNDRY ACCOUNTS
TOTAL ASSETS 3 556 15 538 337 %
LIABILITIES 2015 2016 VARIATIONINTERBANK LIABILITIES 15 19 23 %CUSTOMER DEPOSITS- Savings deposit accounts- Time deposit account- Short-term borrowings- Other demand deposits - Other time deposit accounts DEBTS EVIDENCED BY SECURITIESOTHER LIABILITIES 75 3 037 3 928 %SUNDRY ACCOUNTSRESERVES FOR CONTINGENCIES & LOSSESSTATUTORY PROVISIONSSUBORDINATED LOANS & SECURITIES RESERVES FOR GENERAL BANKING RISKS SHARE CAPITAL 2 500 2 500 0 %SHARE PREMIUMSRESERVES 215 287 33 %RETAINED EARNINGS ( +/- ) 31 29 -7 %NET INCOME 719 9 667 1 244 %TOTAL LIABILITIES 3 556 15 538 337 %
Compared income for the past two fiscal years (in millions of CFAF)
Compared balance sheet for the past two fiscal years (in millions of CFAF)
At 31/12/2016, 1 Euro = 655.957 CFAF
167
BANK O
F A
FRIC
A G
roup
ANNUAL REPORT 2
016
2015 2016 VARIATION INTEREST INCOME
INTEREST EXPENSE
NET INTEREST INCOME
FEE AND COMMISSION INCOME
FEE AND COMMISSION EXPENSE
NET FEE AND COMMISSION INCOME
OTHER INCOME 829 1 063 28 %
OPERATING INCOME 829 1 063 28 %
OPERATING EXPENSES 103 211 105 %
GROSS OPERATING PROFIT 726 852 17 %
IMPAIRMENT CHARGES
EXCEPTIONAL INCOME 5 11 774 252 841 %
PROFIT BEFORE INCOME TAX 731 12 627 1 628 %
INCOME TAX EXPENSE 11 2 960 25 854 %
NET INCOME 719 9 666 1 244 %


169
BANK O
F A
FRIC
A G
roup
ANNUAL REPORT 2
016
Consolidated annual accountsof BANK OF AFRICA Group

170
ANNUAL REPORT 2
016
BANK O
F A
FRIC
A G
roup
BANKING STAFF 5,514 5,655 2.5 %BRANCHES 508 553 8.8 %BALANCE SHEETS KEY FIGURESTOTAL ASSETS 7,201.09 7,812.61 8.5 %CUSTOMER MOANS 3,504.52 3,815.57 8.9 %CUSTOMER DEPOSITS 4,682.99 5,011.56 7.0 %EQUITY GROUP SHARE 453.65 520.86 14.8 %INCOME STATEMENTNET BANKING INCOME 439.96 469.69 6.8 %
OF WHICH NET INTEREST MARGIN 200.57 205.60 2.5 %OF WHICH COMMISSIONS 130.35 133.54 2.4 %OF WHICH NET INCOME ON INVESTMENTS 109.04 129.91 19.1 %
NON-BANKING NET INCOME 16.87 16.33 -3.2 %OPERATING EXPENSES (*) 271.62 287.95 6.0 %NET INCOME BEFORE PROVISIONS 185.21 197.43 6.6 %NET PROVISIONS FOR RISK 71.93 64.45 -10.4 %GOOD WILL AMORTIZATION 3.62 3.75 3.6 %OPERATING INCOME 109.7 129.2 17.8 %COMPANIES ACCOUNTED FOR BY THE EQUITY METHOD AND EXCEPTIONAL NET INCOME 8.08 7.15 -11.5 %TAXES 22 23 4.1 %CONSOLIDATED NET INCOME 95.59 113.31 18.5 %NET INCOME GROUP SHARE 56.18 67.31 19.8 %
COST TO INCOME RATIO 61.74 % 61.41 %
COST OF RISK RATIO 2.17 % 1.76 %NON PERFORMING LOANS RATIO 10.1 % 10.8 %NON PERFORMING LOANS COVERAGE RATIO 61.91 % 66.07 % ROE (NET INCOME GROUP SHARE /AVERAGE EQUITY GROUP SHARE) 13.75 % 13.83 %ROA (NET INCOME GROUP SHARE / AVERAGE ASSET) 0.85 % 0.90 %(*) including amortizations
2015 2016 Variation
Consolidated key figuresin millions of Euros
Breakdown of consolidated income of BOA Group as at 2016
Others*30 %
Commissions28 %
Interestmargin42 %
*Others: Investment securities & non-banking activity

171
BANK O
F A
FRIC
A G
roup
ANNUAL REPORT 2
016
Financial analysis of consolidated accountsin millions of Euros
Continuous balance sheet growth
BANK OF AFRICA Group’s total consolidated balance sheet increased by 8.5% between2015 and 2016 to 7,813 million euros. Despite a slight decline in the growth rate this year compared toprevious years, the group's consolidated balance sheet is showing a sustained average annual growth of15.5% since 2012.
This balance sheet growth is partly due to the increase in the group share of shareholders’ equity, whichincreased by an average of 16.2% per year over the period 2012-2016.
4,383
2012 2013 2014 2015 2016
4,807 6,055
Increase in total consolidated balance sheet
7,201
7,813
+ 15.5 %AAGR
2013 2014 2015 2016
332 364
Increase in shareholders’ equity group share
453521
+ 16.2 %AAGR
The strengthening of the Group's financial base is partly due to the strong and continuous growth inconsolidated net earnings, up by an average of 23.2% per year since 2012, as well as to several capitalincreases.
In 2016, shareholders' equity increased by 48 million euros, a rise of 15.1% compared to 2015. BOA GROUPincreased its share capital by 16.2 million euros through acquisitions from FMO, one of the Group's mainshareholders, in exchange for shareholdings held by FMO in some of its subsidiaries.

7 %
65 %
6 %
22 %
172
ANNUAL REPORT 2
016
BANK O
F A
FRIC
A G
roup
+ 8.5 %
2015
Others Shareholders' equity group share Interbank and subordinated debts Customer deposits
2016
Evolution of consolidated liabilitiesand shareholders funds structure
7 %
64 %
7 %
22 %
7,201 MEUR7,813 MEUR
Through these operations BANK OF AFRICA Group strengthened its holding in the following threesubsidiaries:
- BOA-MADAGASCAR: the purchase of FMO shares increased BOA GROUP's ownership interest to 61.1%in 2016 vs. 51.7% in 2017;
- BOA-MER ROUGE: acquisition of 20% of the Bank's shares, increasing BOA GROUP's stake from 60.0%to 80.0%;
- BOA-TANZANIA: acquisition of some of FMO’s shares (transaction currently being finalised). BOAGROUP's stake in this subsidiary will eventually be 30.5%.
In addition, BOA GROUP acquired the FMO stake in Banque de l'Habitat du Bénin (BHB) as part of thestreamlining programme for the Group's shareholdings. Thus, BOA GROUP's stake in BHB increased from64.2% in 2015 to 75.2% in 2016.
With the aim of simplifying the Group's shareholder structure, BOA GROUP disposed of all its shareholdingin BOA-BENIN to BOA West Africa.
Finally, following a capital increase by BOA-NIGER, BOA GROUP's stake in this subsidiary increased by1.3% to 59.4% at the end of 2016.
Strong balance sheet structure
The liability structure remained broadly stable between 2015 and 2016. The proportion of customer depositsdecreased slightly from 65% to 64% of total assets, while the group share in shareholders' equity increasedslightly to 7% in 2016 vs. 6% of total liabilities in 2015. Interbank and subordinated debts make up 22% ofliabilities.

173
BANK O
F A
FRIC
A G
roup
ANNUAL REPORT 2
016
65 %
26 %
7,201 MEUR7,813 MEUR
25 %
+ 8.5 %
2015
Others Securities Customer loans and leasing
2016
Evolution of consolidated asset structure
64 %
27 %
24 %
The asset structure has changed very little over the year. Customer loans and leasing account for almost halfof total assets (49%), while outstanding securities represent almost one quarter of assets (24% in 2016 vs.25% in 2015).
Sustained activity in a difficult economic environment
BANK OF AFRICA Group's outstanding customer loans increased by 8.9% over the year to 3,816 millioneuros in December 2016, representing 49% of consolidated assets (stable compared to previous year).The banks in the WAEMU area account for 67% of the Group's outstanding loans and are the maincontributors to this growth. Total outstandings of the eight WAEMU subsidiaries increased by 12.8% between2015 and 2016, while banking subsidiaries located outside the WAEMU area saw outstanding loansdecrease by 2.4% over the same period. This was largely due to the banking crisis in Kenya, where thesubsidiary deliberately reduce its appetite for lending (16.5% decrease in customer loans over the year)following new regulations capping interest rates at 14%.
2,239
2012 2013 2014 2015 2016
2,5403,128
Increase in outstanding customer loans
3,4983,816
+ 14.5 %AAGR
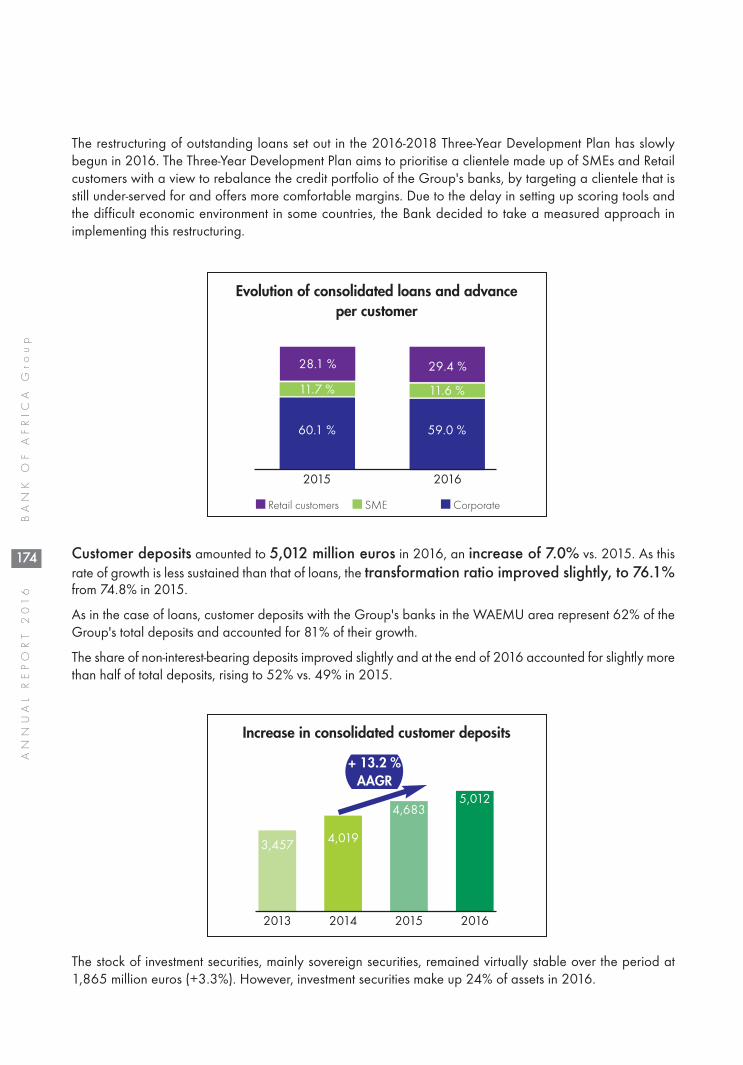
174
ANNUAL REPORT 2
016
BANK O
F A
FRIC
A G
roup
The restructuring of outstanding loans set out in the 2016-2018 Three-Year Development Plan has slowlybegun in 2016. The Three-Year Development Plan aims to prioritise a clientele made up of SMEs and Retailcustomers with a view to rebalance the credit portfolio of the Group's banks, by targeting a clientele that isstill under-served for and offers more comfortable margins. Due to the delay in setting up scoring tools andthe difficult economic environment in some countries, the Bank decided to take a measured approach inimplementing this restructuring.
28.1 %
11.7 %
60.1 %
2015
Retail customers SME Corporate
2016
Evolution of consolidated loans and advanceper customer
29.4 %
11.6 %
59.0 %
Customer deposits amounted to 5,012 million euros in 2016, an increase of 7.0% vs. 2015. As thisrate of growth is less sustained than that of loans, the transformation ratio improved slightly, to 76.1%from 74.8% in 2015.
As in the case of loans, customer deposits with the Group's banks in the WAEMU area represent 62% of theGroup's total deposits and accounted for 81% of their growth.
The share of non-interest-bearing deposits improved slightly and at the end of 2016 accounted for slightly morethan half of total deposits, rising to 52% vs. 49% in 2015.
The stock of investment securities, mainly sovereign securities, remained virtually stable over the period at1,865 million euros (+3.3%). However, investment securities make up 24% of assets in 2016.
2013 2014 2015 2016
3,457 4,019
Increase in consolidated customer deposits
4,6835,012
+ 13.2 %AAGR

175
BANK O
F A
FRIC
A G
roup
ANNUAL REPORT 2
016
Strong growth in financial results
2015 2016 VARIATIONNET BANKING INCOME 440.0 469.7 6.8 %
INTEREST MARGIN 200.6 205.6 2.5 %COMMISSIONS 130.3 134.2 2.9 %SECURITIES OPERATIONS AND FINANCIAL INVESTMENTS 109.0 129.9 19.1 %
OTHER INCOME FROM NON-BANKING OPERATIONS 16.9 16.3 -3.2 %GENERAL OPERATING EXPENSES -271.6 -288.4 6.2 %NET INCOME BEFORE PROVISIONS 185.2 197.6 6.7 %COST OF RISK -71.9 -64.5 -10.4 %NET PROVISIONS FOR ADJUSTMENTS TO GOODWILL -3.6 -3.7 3.5 %OPERATING INCOME 109.7 129.4 18.0 %INCOME FROM PREVIOUS FINANCIAL PERIODS AND INCOME ACCOUNTED FOR BY THE EQUITY METHOD 8.1 7.2 -11.5 %CORPORATE INCOME TAX -22.2 -23.1 4.3 %CONSOLIDATED NET INCOME 95.6 113.4 18.7 %NET INCOME GROUP SHARE 56.2 67.4 20.0 %
The Group's consolidated net banking income grew by 6.8% between 2015 and 2016 to 470million euros. This performance was supported by securities transactions, which increased by 19.1% to129.9 million euros. The interest margin, coupled with commissions, increased by just 2.7% to 339.8 millioneuros. Income from commissions and others marginally increased due to the non-renewal of one-offstreamlining transactions resulting both in significant capital gains in 2015 and a fall in foreign exchangeincome at BOA-MADAGASCAR following a change in local regulations in force.
The poor performance in interest margins is explained by an increase in the cost of deposits, which waslargely due to a change in regulations in the WAEMU about the refinancing rate. The targeting of SMEsunder the Three-Year Development Plan should gradually help to increase the interest margin. Similarly, aplan to systematically review and automate commissions was launched in 2016, and is expected to increasenet income from commissions from 2017.
Despite the addition of 45 branches to the banking network representing an increase of 8.8% over the year,bank headcount only increased by 2.5% due to optimised management of personnel at bank headquarters andreassignments to the new branches. Also, general operating expenses were contained at 288.4 million euros, agrowth of 6.2%, and the operating ratio improved slightly from 61.74% in 2015 to 61.41% in 2016.As a result of efforts in debt recovery and the restructuring of bank organisation in this area, net provisionsfor contingencies and losses decreased by 7.5 million euros, or 10.4% vs. 2015. The cost of risk, whencompared to the average outstanding loans, decreased from 2.17% in 2015 to 1.76% in 2016.
2015 2016COST OF RISK 2.17 % 1.76 %NON-PERFORMING LOANS RATIO 10.1 % 10.8 %COVERAGE OF NON-PERFORMING LOANS 61.91 % 66.07 %
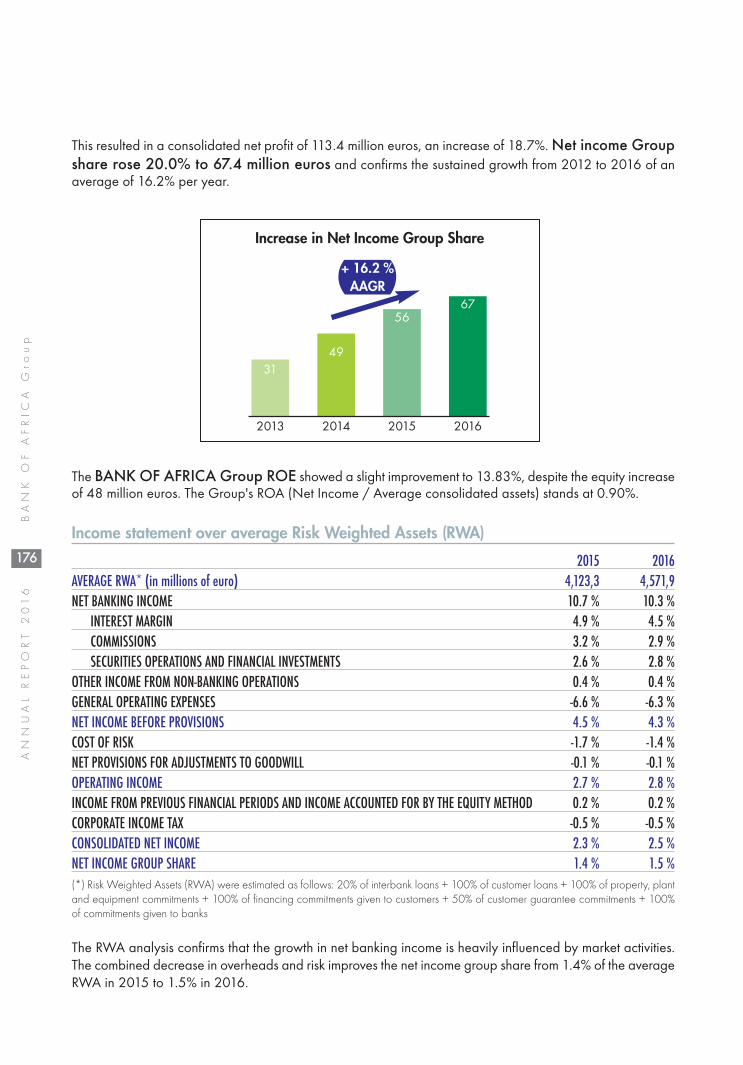
176
ANNUAL REPORT 2
016
BANK O
F A
FRIC
A G
roup
This resulted in a consolidated net profit of 113.4 million euros, an increase of 18.7%. Net income Groupshare rose 20.0% to 67.4 million euros and confirms the sustained growth from 2012 to 2016 of anaverage of 16.2% per year.
2013 2014 2015 2016
3149
Increase in Net Income Group Share
5667
+ 16.2 %AAGR
The BANK OF AFRICA Group ROE showed a slight improvement to 13.83%, despite the equity increaseof 48 million euros. The Group's ROA (Net Income / Average consolidated assets) stands at 0.90%.
Income statement over average Risk Weighted Assets (RWA)
2015 2016AVERAGE RWA* (in millions of euro) 4,123,3 4,571,9NET BANKING INCOME 10.7 % 10.3 %
INTEREST MARGIN 4.9 % 4.5 %COMMISSIONS 3.2 % 2.9 %SECURITIES OPERATIONS AND FINANCIAL INVESTMENTS 2.6 % 2.8 %
OTHER INCOME FROM NON-BANKING OPERATIONS 0.4 % 0.4 %GENERAL OPERATING EXPENSES -6.6 % -6.3 %NET INCOME BEFORE PROVISIONS 4.5 % 4.3 %COST OF RISK -1.7 % -1.4 %NET PROVISIONS FOR ADJUSTMENTS TO GOODWILL -0.1 % -0.1 %OPERATING INCOME 2.7 % 2.8 %INCOME FROM PREVIOUS FINANCIAL PERIODS AND INCOME ACCOUNTED FOR BY THE EQUITY METHOD 0.2 % 0.2 %CORPORATE INCOME TAX -0.5 % -0.5 %CONSOLIDATED NET INCOME 2.3 % 2.5 %NET INCOME GROUP SHARE 1.4 % 1.5 %(*) Risk Weighted Assets (RWA) were estimated as follows: 20% of interbank loans + 100% of customer loans + 100% of property, plantand equipment commitments + 100% of financing commitments given to customers + 50% of customer guarantee commitments + 100%of commitments given to banks
The RWA analysis confirms that the growth in net banking income is heavily influenced by market activities.The combined decrease in overheads and risk improves the net income group share from 1.4% of the averageRWA in 2015 to 1.5% in 2016.

177
BANK O
F A
FRIC
A G
roup
ANNUAL REPORT 2
016
Report by the Authorized Statutory Auditoron the annual consolidated accounts at 31 December 2016
Board of Director’s responsibility for preparing and presenting theconsolidated annual accounts
The Board of Directors is responsible for the preparation and fair presentation of these consolidated annualaccounts in accordance with legal and regulatory requirements relating to the preparation and presentationof consolidated annual accounts in force in Luxembourg, and any internal control processes it deemsnecessary to enable the preparation of consolidated annual accounts that are free from significant anomalies,whether due to fraud or error.
Authorized Statutory Auditor’s responsibility
Our responsibility is to express an opinion on these consolidated annual accounts based on our audit. Weconducted our audit in accordance with International Standards on Auditing as adopted for Luxembourg bythe Commission de Surveillance du Secteur Financier (supervisory authority). These standards require thatwe comply with ethical requirements and plan and perform the audit to obtain reasonable assurance thatthe consolidated annual accounts are free from material misstatement.
An audit involves implementing procedures to obtain evidence about the amounts and disclosures in theconsolidated annual accounts. The procedures selected depend on the Authorized Statutory Auditor’sjudgement, including assessing the risks of material misstatement of the consolidated annual accounts, whetherdue to fraud or error.
In conducting our assessment, the Authorized Statutory Auditor’s takes into consideration internal controlimplemented in the entity for the preparation and fair presentation of the consolidated annual accounts, inorder to define appropriate auditing procedures in the circumstances but not with a view to expressing anopinion on the effectiveness of this control.
An audit also involves assessing the suitability of the accounting methods used and the soundness of theaccounting estimates made by the Board of Directors, as well as assessing the overall presentation of theconsolidated annual accounts.
We believe that the audit evidence we have obtained is sufficient and provides an appropriate basis for theopinion expressed below.
Opinion
In our opinion, the consolidated annual accounts give a true and fair image of the consolidated financialposition of BOA GROUP S.A. at 31 December 2016, and of its results for the year ended, in accordancewith legal and regulatory requirements in force in Luxembourg relating to the preparation and presentationof consolidated annual accounts.
In accordance with our appointment by the General Meeting of Shareholders, we have auditedthe consolidated annual accounts of BOA GROUP S.A., which comprise the consolidated balancesheet as at 31 December 2016, the consolidated profit and loss account ending on this date anda summary of the principal accounting methods and other explanatory notes.

Other information
Responsibility for other information rests with the Board of Directors. The other information comprisesinformation contained in the management report but does not include the annual accounts and our authorisedstatutory auditor's report on these annual accounts.
Our opinion on the annual accounts does not extend to the other information and we do not give anyassurances on this information.
As regards our audit of the annual accounts, our responsibility is to read the other information and, in doingso, to assess whether there is significant inconsistency between this information and the annual accounts orthe knowledge we have acquired during the audit, or if the other information appears to contain any othermaterial misstatement. If, in the light of our work, we conclude that there is a significant anomaly in the otherinformation, we are obliged to report this fact. We have nothing to report in this respect.
Report on other legal and regulatory requirements
The management report is in line with the annual accounts and has been prepared in accordance with theapplicable legal requirements.
Luxembourg, 29 June 2017
For MAZARS LUXEMBOURGAuthorized Statutory Auditor10A, rue Henri M. SchnadtL-2530 LUXEMBOURG
Bernard TREINENAuthorized Independent Auditor
178
ANNUAL REPORT 2
016
BANK O
F A
FRIC
A G
roup

179
BANK O
F A
FRIC
A G
roup
ANNUAL REPORT 2
016
Auditors’ report on the consolidated accountsFiscal year ending 31 December 2016
We have audited the euro-denominated consolidated financial statements of the BOA GROUPS.A. company appended to this report, including the consolidated balance sheet of 31December 2016 with positive equity of euros 746 751 181, with the consolidated incomestatement showing net income of euros 113 310 400 for the financial year, the consolidatedstatement of changes in equity, as well as a summary of the main accounting methods usedand other explanatory information.
The managers of the BANK OF AFRICA Group are responsible for the preparation and faithful presentationof these consolidated financial statements, in accordance with the accounting law provisions of theOrganisation for the Harmonisation of Business Law in Africa (OHADA) and the accounting rules and principlesof the bank accounting principles of the West African Monetary Union (WAMU), as well as the internal controlsthat it considers necessary to ensure that the consolidated financial statements are free of material misstatements,whether resulting from fraud or error. We are required to express an opinion on these consolidated financialstatements on the basis of our audit.
We have undertaken our audit on the basis of international auditing standards. These standards require thatwe comply with ethical rules and that we plan and undertake the audit in order to obtain reasonable assurancethat the consolidated financial statements contain no material misstatements.
An audit is a set of procedures to gather relevant items regarding the amounts and information providedin the consolidated financial statements. The choice of procedures is at the auditor’s discretion, includingits assurance that the consolidated financial statements do not contain any material misstatements, whetherdue to fraud or error.
In assessing these risks, the auditor takes into consideration the entity’s internal controls of the preparationand faithful presentation of the consolidated financial statements, in order to design audit procedures thatare suited to the circumstances, and not to express an opinion on the effectiveness of the entity’s internalcontrols. An audit also includes an assessment of the appropriateness of the accounting methods used andof the management’s accounting estimates, as well as an assessment of the presentation of all consolidatedfinancial statements.
We believe that the relevant items that we obtained are a sufficient and appropriate basis for our audit opinion.
Thus, based on the procedures implemented at the date of this report, we believe that BOA Group'sconsolidated financial statements provide, in all material respects, a true and fair view of the consolidatedfinancial position of the BOA GROUP SA holding company at 31 December 2016 and the consolidated resultsof the Group's operations for the year ended in accordance with the OHADA accounting law and WAMUaccounting rules and principles, adopted by the Group for the establishment of its consolidated position.
Abidjan, 3 March 2017MAZARS COTE D’IVOIRE
Armand FANDOHANCertified Public AccountantPartner

180
ANNUAL REPORT 2
016
BANK O
F A
FRIC
A G
roup
Notes to the consolidated annual accountsFiscal year ending 31 December 2016
Note 1 - Significant accounting policies
A. Significant events of year 2016
Change in Group’s scope of consolidation
On 1 January 2016 the Group deconsolidated without transfer of the AGORA MALI securities.
Capital increases realised by Group companies
• Capital increase
Four Group entities undertook capital increases during 2016.
- BOA GROUP S.A. increased its capital by 2.6 million euros from 90.5 million euros in 2015 to 93.1million euros.
- Banque de Crédit de Bujumbura (BCB) increased its capital through incorporation of reserves of BIF 2.5billion. The number of shares and equity interest remain unchanged at 156,018 shares and 20.25%.
- BANK OF AFRICA - NIGER increased its capital through incorporation of reserves of CFAF 500 million,representing 50,000 shares. Equity interest increased from 58.12% in December 2015 to 59.41% inDecember 2016.
- BANK OF AFRICA - COTE D’IVOIRE increased its capital through incorporation of reserves of CFAF 1.8billion, representing 180,000 shares. Equity interest remains unchanged at 71.98% at December 2016.
• Reduction of the nominal value of BANK OF AFRICA - MALI shares
After its capital increase in December 2015 BANK OF AFRICA - MALI carried out a reduction in the nominalvalue of its shares from CFAF 10,000 to CFAF 5,000 in the first half year of 2016. The number of shares ofthe following subsidiaries have been doubled:
- BOA WEST AFRICA: from 623,348 shares in 2015 to 1,264,696 shares in 2016.
- ATTICA: from 21,281 shares in 2015 to 42,562 shares in 2016
Changes in shareholder structure of Group companies
In addition to the capital increases mentioned above, BOA WEST AFRICA and BOA GROUP S.A. haveincreased their holdings in some subsidiaries as part of the policy of streamlining Group shareholding byrepurchasing consolidated shares from other group subsidiaries and minority shareholders.

181
BANK O
F A
FRIC
A G
roup
ANNUAL REPORT 2
016
BOA WEST AFRICA
• Repurchase of shares in the following subsidiaries:
- BHB: purchase of 55,000 shares from minority shareholders, increasing equity interest from 64.18% inDecember 2015 to 75.18% in December 2016.
- BANK OF AFRICA - BURKINA FASO: purchase of 42,759 shares from minority shareholders, increasingequity interest from 55.85% in December 2015 to 56.48% in December 2016.
- BANK OF AFRICA – BENIN: purchase of 145,351 shares from BOA GROUP S.A. with no change inequity interest, which remains at 54.13% at December 2016.
- BANK OF AFRICA - NIGER: purchase of 79,895 shares from ATTICA. In addition to the capital increasethe group equity percentage increased from 58.12% in December 2015 to 59.41% in December 2016.
BOA GROUP S.A.
• Repurchase of shares in the following subsidiaries:
- BANK OF AFRICA - MADAGASCAR: purchase of 214,960 shares from minority shareholders, increasingequity interest from 51.66% in December 2015 to 61.11 % in December 2016.
- BANK OF AFRICA - MER ROUGE: purchase of 12,000 shares from minority shareholders, increasingequity interest from 59.99% in December 2015 to 79.99% in December 2016.
- BANK OF AFRICA - TANZANIA: purchase of 1.689 shares from minority shareholders, increasing equityinterest from 66.43% in December 2015 to 67.35% in December 2016.
• Sale of shares in BOA GROUP S.A. to minority shareholders (FMO) by the followingsubsidiaries:
- AFH SERVICE: sale of 9 BOA Group S.A. shares.
- AGORA : sale of 1,947 BOA Group S.A. shares.
- BANK OF AFRICA - BENIN: sale of 175 BOA Group S.A. shares.
These sales have no impact on the scope of consolidation because BOA GROUP is the consolidating entity.
B. Consolidation principles
The consolidated financial statements have been prepared in accordance with generally acceptedinternational accounting standards and presented in the format required for banks and financial institutions.
In order to provide better visibility for the shareholders and given the geographic and economic pre-eminenceof the Group's original entities, the presentation adopted is that laid down in the West African MonetaryUnion (WAMU) banking chart of accounts.
The method of full consolidation has been applied for the accounts of all subsidiaries of the Group over
which it has exclusive control. Exclusive control is presumed to exist when the Group directly or indirectly
holds the majority of the voting rights or has effective control through the ability to appoint the majority of themembers of the administrative and management bodies. Full consolidation consists of combining all the assets,liabilities and income statement items of the companies concerned after eliminating intergroup transactionsand gains or losses. The equity and income of consolidated companies attributable to the Group (Group
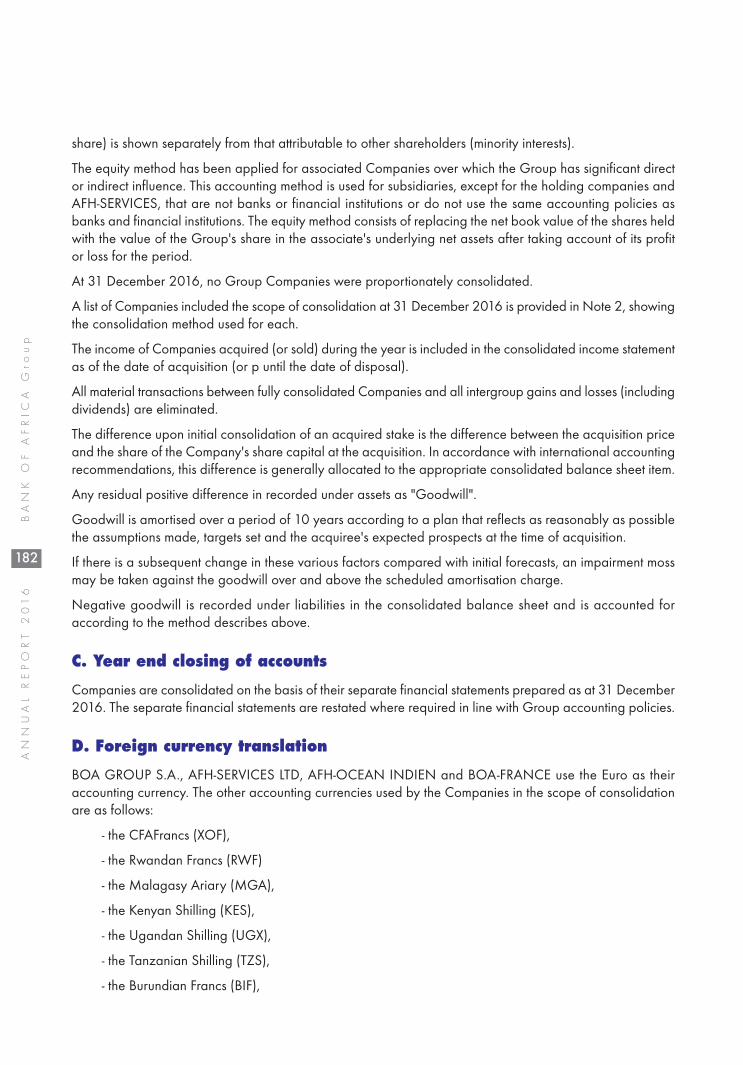
182
ANNUAL REPORT 2
016
BANK O
F A
FRIC
A G
roup
share) is shown separately from that attributable to other shareholders (minority interests).
The equity method has been applied for associated Companies over which the Group has significant director indirect influence. This accounting method is used for subsidiaries, except for the holding companies andAFH-SERVICES, that are not banks or financial institutions or do not use the same accounting policies asbanks and financial institutions. The equity method consists of replacing the net book value of the shares heldwith the value of the Group's share in the associate's underlying net assets after taking account of its profitor loss for the period.
At 31 December 2016, no Group Companies were proportionately consolidated.
A list of Companies included the scope of consolidation at 31 December 2016 is provided in Note 2, showingthe consolidation method used for each.
The income of Companies acquired (or sold) during the year is included in the consolidated income statementas of the date of acquisition (or p until the date of disposal).
All material transactions between fully consolidated Companies and all intergroup gains and losses (includingdividends) are eliminated.
The difference upon initial consolidation of an acquired stake is the difference between the acquisition priceand the share of the Company's share capital at the acquisition. In accordance with international accountingrecommendations, this difference is generally allocated to the appropriate consolidated balance sheet item.
Any residual positive difference in recorded under assets as "Goodwill".
Goodwill is amortised over a period of 10 years according to a plan that reflects as reasonably as possiblethe assumptions made, targets set and the acquiree's expected prospects at the time of acquisition.
If there is a subsequent change in these various factors compared with initial forecasts, an impairment mossmay be taken against the goodwill over and above the scheduled amortisation charge.
Negative goodwill is recorded under liabilities in the consolidated balance sheet and is accounted foraccording to the method describes above.
C. Year end closing of accounts
Companies are consolidated on the basis of their separate financial statements prepared as at 31 December2016. The separate financial statements are restated where required in line with Group accounting policies.
D. Foreign currency translation
BOA GROUP S.A., AFH-SERVICES LTD, AFH-OCEAN INDIEN and BOA-FRANCE use the Euro as theiraccounting currency. The other accounting currencies used by the Companies in the scope of consolidationare as follows:
- the CFAFrancs (XOF),
- the Rwandan Francs (RWF)
- the Malagasy Ariary (MGA),
- the Kenyan Shilling (KES),
- the Ugandan Shilling (UGX),
- the Tanzanian Shilling (TZS),
- the Burundian Francs (BIF),
183
BANK O
F A
FRIC
A G
roup
ANNUAL REPORT 2
016
- the Congolese Francs (CDF),
- the Djiboutian Francs (DJF),
- the Ghanaian Cedi (GHS),
- the Moroccan Dirham (MAD)
The consolidated balance sheet, consolidated income statements and figures provides in the Notes to theconsolidated accounts are expresses in euros. Assets and liabilities to third parties are translated at the closingon 31 December 2016, except for equity.
Foreign exchange differences on assets and liabilities to third parties except for equity are recorded in theprofit and loss account under “Foreign exchange expenses” or “Income from foreign exchange transactions”.
Equity is translated into foreign currency using the historic exchange rate. The income statements weretranslated at the average rate at 31 December 2016.
E. Funds for General Banking Risks (GBR)
The provisions for General Banking Risks are calculated separately by each Bank, in proportion to its totalon- and off -balance sheet commitments excluding any guarantees, in accordance with the method set outby the Group's Investment Department. Commitments to public and semi-public companies and exposurecovered by cash collateral or first demand bank guarantees are not included in the basis of calculation.
A progressive scale is used by the Banks that calculate this provision, with a target rate of 7%.
Provisions booked in the financial statements of the Group entities are similar to reserves and are accordinglyincluded in the basis reserves.
F. Leasing operations
Financial leases, operating leases with purchase option and hire purchase agreements are booked in theconsolidated balance sheet on basis of the financial amount outstanding and not the amount carried in theseparate financial statements of the subsidiaries. The lease equalisation reserve is recorded underconsolidated reserves net of deferred tax.
G. Intangible assets
Purchased goodwill, licences, patents and leasehold rights are booked at purchase cost. Purchased goodwillis not amortised. Other tangible assets are amortised on a straight-line basis over their estimated economic lives.
H. Fixed assets
Land, buildings and equipment are measured at historical cost. They are depreciated on a straight-line basisover their estimated useful lives.
I. Equity investment
Equity investments include "Investments in associates" and "Equity method investments".
The line item "Investments in associates" includes equity investments in non-consolidated companies.
It corresponds to the purchase cost of shares in non-consolidated companies, less any provisions forimpairment laid down to offset under valuation when assessing the Group share of the last known net worthof investments concerned.

184
ANNUAL REPORT 2
016
BANK O
F A
FRIC
A G
roup
The line item "Equity method investments" corresponds to the Group share of net worth of companiesaccounted for by the equity method.
J. Deferred tax
Deferred taxes are recognised on all temporary differences between taxable income and accounting income.They include the elimination of entries made in the separate financial statements in application of tax electionsand also restatements according to the accounting principles applied for drawing up the consolidatedaccounts. Deferred tax is determined on the basis of the tax rates and fiscal regulations adopted at the dateof the balance sheet, or using the expected tax rates for the fiscal period in which the deferred tax liabilitieswill be paid.
Deferred tax assets are only recognized if there is reasonable assurance that sufficient taxable profit will beavailable in the future to utilise them.
Deferred tax assets are presented under “Other assets” and deferred tax liabilities under “Other liabilities”.
K. Retirement benefit obligations
Employee retirement benefit obligations are determined by each subsidiary in accordance with locallegislation. Retirement benefit provisions are not discounted to present value. They are booked in theconsolidated financial statements on this basis.
Retirement benefit obligation premiums paid for Group companies which have outsourced this service toinsurance companies are accounted as expenses.
L. Comparability from one year to the next
The consolidated financial statements of BOA Group at 31 December 2016 have been prepared using similaraccounting methods to those used to prepare consolidated financial statements at 31 December 2015presented for comparison.
The consolidation method used for each subsidiary is determined not only on the basis of the Group’spercentage control but also on the criteria of "effective control".

185
BANK O
F A
FRIC
A G
roup
ANNUAL REPORT 2
016

186
ANNUAL REPORT 2
016
BANK O
F A
FRIC
A G
roup
Consolidated Balance Sheet (in Euros)
CASH 171 769 053 177 032 952 INTERBANK LOANS 881 471 769 885 364 722 • DEMANDE LOANS 723 904 920 623 301 104 • CENTRAL BANKS 406 185 698 381 269 819 • TREASURY, POST OFFICE BANK 77 611 723 78 531 440 • OTHER CREDIT INSTITUTIONS 240 107 499 163 499 845 • TERM LOANS 157 566 849 262 063 618 CUSTOMER LOANS 3 497 683 777 3 806 338 365 • PORTFOLIO OF DISCOUNTED BILLS 218 415 079 113 071 866
• SEASONAL CREDIT• ORDINARY CREDIT 218 415 079 113 071 866
• OVERDRAFTS 522 547 248 478 488 940 • OTHER CUSTOMER CREDIT FACILITIES 2 755 080 503 3 213 623 726
• SEASONAL CREDIT 109 997 184 130 421 386 • ORDINARY CREDIT 2 645 083 319 3 083 202 340
• FACTORING 1 640 947 1 153 833 LEASING & RELATED OPERATIONS 6 836 839 9 231 777 INVESTMENT SECURITIES 1 804 794 130 1 865 093 014 FINANCIAL ASSETS 289 154 436 394 570 523 FINANCIAL ASSETS AT EQUITY VALUE 10 244 919 10 848 520 INTANGIBLE ASSETS 10 305 147 14 297 906 FIXED ASSETS 225 562 852 243 268 171 SHAREHOLDERS & ASSOCIATESOTHER ASSETS 199 417 352 261 810 562 SUNDRY ACCOUNTS 67 251 035 112 316 800 CONSOLIDATED GOODWILL 36 595 096 32 438 983 TOTAL ASSETS 7 201 086 405 7 812 612 295
COMMITMENTS GIVEN 934 120 940 1 194 562 267 CREDIT COMMITMENTS 181 100 269 167 305 370 • TO CREDIT INSTITUTIONS 1 796 180 3 861 518 • TO CUSTOMERS 179 304 089 163 443 852 GUARANTEE GIVEN 753 020 671 1 027 256 897• ON BEHALF OF CREDIT INSTITUTIONS 17 325 523 23 135 177 • ON BEHALF OF CUSTOMERS 735 695 148 1 004 121 720 COMMITMENTS ON SECURITIES
Assets 2015 2016
Off-Balance-Sheet 2015 2016

187
BANK O
F A
FRIC
A G
roup
ANNUAL REPORT 2
016
(in Euros)
INTERBANK LIABILITIES 1 527 178 792 1 736 822 059 • DEMANDE LOANS 103 514 723 91 281 536 • TREASURY, POST OFFICE BANK 26 069 201 20 508 495 • OTHER CREDIT INSTITUTIONS 77 445 522 70 773 041 • TERM DEPOSITS 1 423 664 069 1 645 540 523 CUSTOMER DEPOSITS 4 682 986 689 5 011 564 746• SAVINGS DEPOSIT ACCOUNTS 786 375 485 910 556 998 • TERM DEPOSIT ACCOUNTS 16 620 555 20 674 572 • SHORT-TERM BORROWINGS 23 725 764 27 725 508 • OTHER DEMAND DEPOSITS 2 378 677 864 2 613 349 155 • OTHER TER DEPOSIT ACCOUNTS 1 477 587 021 1 439 258 513 DEBTS EVIDENCED BY SECURITIES 12 503 053 5 949 042 OTHER LIABILITIES 108 442 803 115 889 874 SUNDRY ACCOUNTS 109 739 696 115 982 509 CONSOLIDATED GOODWILL 17 756 044 13 734 956 RESERVES FOR CONTINGENCUES & LOSSES 24 262 918 27 617 743 STATUTORY PROVISIONSSUBORDINATED LOANS AND SECURITIES 21 313 684 9 230 382 INVESTMENT SUBSIDIESRESERVES FOR GENERAL BANKING RISKSEARMARKED FUNDS 18 782 704 29 069 803 CAPITAL 90 489 465 93 154 535 SHARE PREMIUMSCONSOLIDATED RESERVES, CURRENCY TRANSLATION ADJUSTMENTDIFFERENCE ON EQUITY ACCOUNTED SECURITES 492 044 953 540 286 246 • GROUP 306 981 273 360 400 942 • MINORITY SHAREHOLDERS 185 063 680 179 885 304 RETAINED EARNINGS (+/-)NET INCOME 95 585 604 113 310 400 • GROUP 56 183 360 67 308 337 • MINORITY SHAREHOLDERS 39 402 244 46 002 063 TOTAL LIABILITIES 7 201 086 405 7 812 612 295
Liabilities 2015 2016
Off-Balance-Sheet 2015 2016
COMMITMENTS RECEIVED 4 785 986 771 5 825 651 098
CREDIT COMMITMENTS 31 654 256 16 197 411
• RECEIVED FROM CREDIT INSTITUTIONS 31 654 256 16 197 411
GUARANTEE RECEIVED 4 754 332 515 5 809 453 687
• RECEIVED FROM CREDIT INSTITUTIONS 129 106 608 330 590 749
• RECEIVED FROM CUSTOMERS 4 625 225 907 5 478 862 938
COMMITMENTS ON SECUTITY 148 558 136 164 526 027
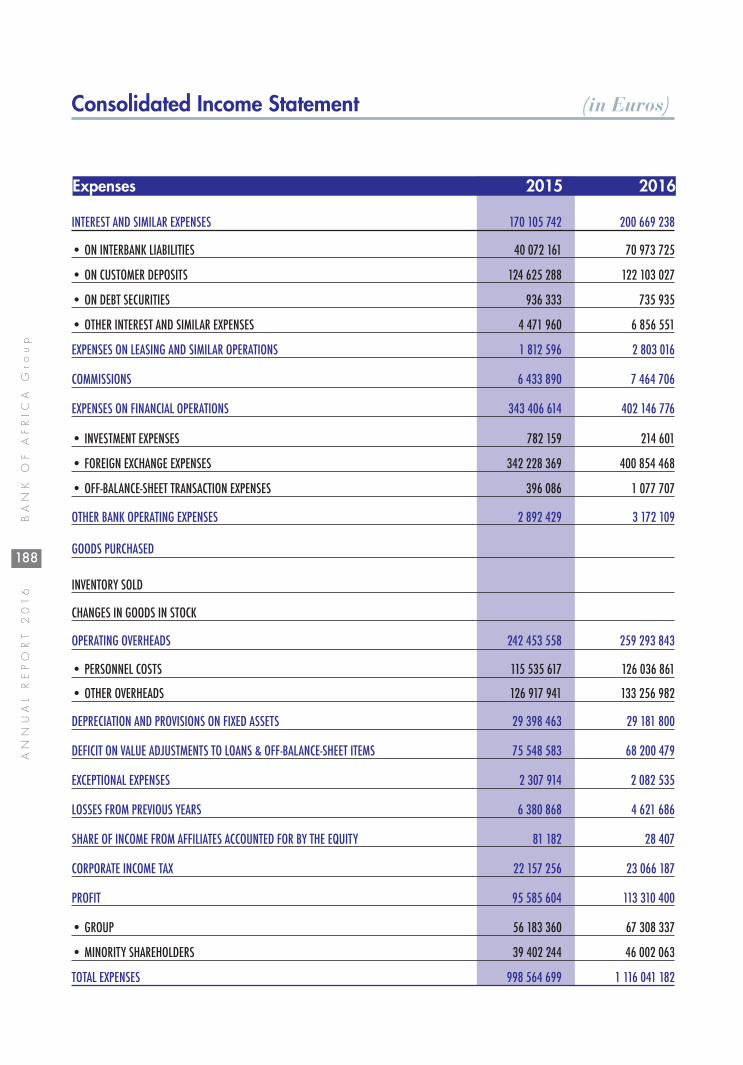
188
ANNUAL REPORT 2
016
BANK O
F A
FRIC
A G
roup
Consolidated Income Statement (in Euros)
INTEREST AND SIMILAR EXPENSES 170 105 742 200 669 238
• ON INTERBANK LIABILITIES 40 072 161 70 973 725
• ON CUSTOMER DEPOSITS 124 625 288 122 103 027
• ON DEBT SECURITIES 936 333 735 935
• OTHER INTEREST AND SIMILAR EXPENSES 4 471 960 6 856 551
EXPENSES ON LEASING AND SIMILAR OPERATIONS 1 812 596 2 803 016
COMMISSIONS 6 433 890 7 464 706
EXPENSES ON FINANCIAL OPERATIONS 343 406 614 402 146 776
• INVESTMENT EXPENSES 782 159 214 601
• FOREIGN EXCHANGE EXPENSES 342 228 369 400 854 468
• OFF-BALANCE-SHEET TRANSACTION EXPENSES 396 086 1 077 707
OTHER BANK OPERATING EXPENSES 2 892 429 3 172 109
GOODS PURCHASED
INVENTORY SOLD
CHANGES IN GOODS IN STOCK
OPERATING OVERHEADS 242 453 558 259 293 843
• PERSONNEL COSTS 115 535 617 126 036 861
• OTHER OVERHEADS 126 917 941 133 256 982
DEPRECIATION AND PROVISIONS ON FIXED ASSETS 29 398 463 29 181 800
DEFICIT ON VALUE ADJUSTMENTS TO LOANS & OFF-BALANCE-SHEET ITEMS 75 548 583 68 200 479
EXCEPTIONAL EXPENSES 2 307 914 2 082 535
LOSSES FROM PREVIOUS YEARS 6 380 868 4 621 686
SHARE OF INCOME FROM AFFILIATES ACCOUNTED FOR BY THE EQUITY 81 182 28 407
CORPORATE INCOME TAX 22 157 256 23 066 187
PROFIT 95 585 604 113 310 400
• GROUP 56 183 360 67 308 337
• MINORITY SHAREHOLDERS 39 402 244 46 002 063
TOTAL EXPENSES 998 564 699 1 116 041 182
Expenses 2015 2016

189
BANK O
F A
FRIC
A G
roup
ANNUAL REPORT 2
016
(in Euros)
INTEREST AND SIMILAR INCOME 369 689 349 405 819 178
• ON INTERBANK LOANS 19 293 485 22 771 351
• ON CUSTOMER LOANS 324 555 420 349 175 131
• ON SECURITIES 22 989 465 31 429 811
• OTHER INTEREST AND SIMILAR INCOME 2 850 979 2 442 885
INCOME FROM LEASING AND SIMILAR OPERATIONS 2 799 162 3 249 921
COMMISSIONS 68 644 542 80 927 449
INCOME FROM FINANCIAL OPERATIONS 502 383 003 586 733 031
• INCOME FROM INVESTMENT SECURITIES 96 824 439 113 660 201
• DIVIDENDS AND SIMILAR INCOME 13 001 222 16 469 331
• INCOME FROM FOREIGN EXCHANGE TRANSACTIONS 379 678 136 441 900 856
• INCOME FROM OFF-BALANCE SHEET TRANSACTIONS 12 879 206 14 702 643
OTHER INCOME FROM BANKING OPERATIONS 21 094 094 8 574 371
PROFIT MARGINS
SALE OF PRODUCTS
CHANGES IN GOODS IN STOCK
GENERAL OPERATING INCOME 16 868 846 16 328 314
WRITE-BACK OF DEPRECIATION AND PROVISIONS ON FIXED ASSETS 233 309 524 304
SURPLUS ON CORRECTIONS TO VALUE OF LOANS AND OFF-BALANCE SHEET ITEMS
EXCEPTIONAL INCOME 10 555 016 5 820 505
INCOME FROM PREVIOUS YEARS 5 143 177 6 391 402
SHARE OF INCOME FROM AFFILIATES ACCOUNTED FOR BY THE EQUITY 1 154 201 1 672 707
LOSS
TOTAL INCOME 998 564 699 1 116 041 182
Income 2015 2016

190
ANNUAL REPORT 2
016
BANK O
F A
FRIC
A G
roup
Consolidated Income Statement (in Euros)
INTEREST AND SIMILAR INCOME 369 689 349 405 819 178 • ON INTERBANK LOANS 19 293 485 22 771 351 • ON CUSTOMER LOANS 324 555 420 349 175 131 • ON SECURITIES 22 989 465 31 429 811 • OTHER INTEREST AND SIMILAR INCOME 2 850 979 2 442 885 INCOME FROM LEASING AND SIMILAR OPERATIONS 2 799 162 3 249 921 INTEREST AND SIMILAR EXPENSES -170 105 742 -200 669 238• ON INTERBANK LIABILITIES -40 072 161 -70 973 725 • ON CUSTOMER DEPOSITS -124 625 288 -122 103 027 • ON DEBT SECURITIES -936 333 -735 935 • OTHER INTEREST AND SIMILAR EXPENSES -4 471 960 -6 856 551 EXPENSES ON LEASING AND SIMILAR OPERATIONS -1 812 596 -2 803 016 INTEREST MARGIN 200 570 173 205 596 845• COMMISSION INCCOME 68 644 542 80 927 449 • COMMISSION EXPENSES -6 433 890 -7 464 706 NET RESULT FROM COMMISSION 62 210 652 73 462 743 NET RESULTS FROM:• INVESTMENT SECURITIES TRANSACTIONS 96 042 280 113 445 600 • DIVIDENDS AND SIMILAR TRANSACTIONS 13 001 222 16 469 331 • FOREIGN EXCHANGE TRANSACTIONS 37 449 767 41 046 388 • OFF-BALANCE-SHEET TRANSACTIONS 12 483 120 13 624 936 NET INCOME FROM FINANCIAL OPERATIONS 158 976 389 184 586 255 OTHER INCOME FROM BANKING OPERATIONS 21 094 094 8 574 371 OTHER BANK OPERATING EXPENSES -2 892 429 -3 172 109 OTHER INCOME FROM NON-BANKING OPERATIONS 16 868 846 16 328 314 OPERATING OVERHEADS -242 453 558 -259 293 843• PERSONNEL COSTS -115 535 617 -126 036 861 • OTHER OVERHEADS -126 917 941 -133 256 982 DEPRECIATION & AMORTIZATION AND PROVISIONS ON FIXED ASSETS -29 398 463 -29 181 800 WRITE-BACK OF DEPRECIATION AND PROVISIONS ON FIXED ASSETS 233 309 524 304 GROSS OPERATING PROFIT 185 209 013 197 425 080 NET INCOME FROM VALUE ADJUSTMENTS -75 548 583 -68 200 479 EXCESS OF PROVISIONING & WRITE-BACK OF FUNDS FOR GENERAL BANKING RISKSPRE-TAX OPERATING INCOME 109 660 430 129 224 601 EXTRAORDINARY ITEMS 8 247 102 3 737 970 RESULT FROM PREVIOUS FINANCIAL PERIODS -1 237 691 1 769 716 CORPORATE INCOME TAX -22 157 256 -23 066 187 SHARE OF INCOME FROM AFFILIATES ACCOUNTED FOR BY THE EQUITY METHOD 1 073 019 1 644 300 NET INCOME FOR THIS FINANCIAL PERIOD• GROUP 56 183 360 67 308 337 • MINORITY SHAREHOLDERS 39 402 244 46 002 063 CONSOLIDATED NET INCOME 95 585 604 113 310 400
Income & Expenses 2015 2016