
BMCE BANK...BMCE Bank, Morocco’s third largest bank in terms of market share for deposits and...
52
Financial Communication Tél. : +212 522 49 80 03/04 - Fax : +212 522 26 49 65 E-mail : [email protected] Web site : www.bmcebank.ma Kasbah Ait Hammou Ou Said, rehabilitated and transformed 2014 Results into Mederset.com School by the BMCE Bank Foundation BMCE BANK’S CONSOLIDATED FINANCIAL STATEMENTS UNDER IAS/IFRS AND NOTES TO THE FINANCIAL STATEMENTS 31 December 2014 BMCE BANK
Transcript of BMCE BANK...BMCE Bank, Morocco’s third largest bank in terms of market share for deposits and...

Financial CommunicationTél. : +212 522 49 80 03/04 - Fax : +212 522 26 49 65E-mail : [email protected] Web site : www.bmcebank.ma
Kasbah Ait Hammou Ou Said, rehabilitated and transformed 2014 Results into Mederset.com School by the BMCE Bank Foundation
BMCE BANK’SCONSOLIDATED FINANCIAL STATEMENTS UNDER
IAS/IFRS AND NOTES TO THE FINANCIAL STATEMENTS
31 December 2014
BMCE BANK

Established in 1959 and privatised in 1995, BMCE Bank is a universal bank which offers a diversified range of products and services through a domestic
network of 662 branches. BMCE Bank, Morocco’s third largest bank in terms of market share for deposits and loans, currently has operations in about
thirty countries in sub-Saharan Africa, Europe and Asia.
BMCE Bank’s activities primarily include commercial banking, specialised financial services, asset management, investment banking and international
activities.
BMCE Bank in Morocco
BMCE Bank’s activities in Morocco include:
- Retail Banking, sub-divided by market specialisation – retail customers, professional banking customers, private clients and Moroccans living abroad;
- Corporate Banking, including SMEs and large enterprises.
It is worth noting that BMCE Bank has embarked on a regional strategy aimed at moving the decision-making process closer to the customer and
improving the Bank’s impact from a commercial perspective. The Bank’s distribution network, now organised on a regional basis and enjoying greater
independence, encompasses both Retail Banking as well as Corporate Banking activities.
- BMCE Capital, the Bank’s investment banking subsidiary, is organised by business line on an integrated basis which include asset management, wealth
management, brokerage and capital markets activities as well as M&A and other corporate advisory services.
- Specialised financial subsidiaries, whose products are primarily marketed via the branch network, the aim being to develop intra-Group commercial
and operational synergies – consumer credit, leasing, bank-insurance, factoring and vehicle leasing. RM Experts, subsidiary specialising in recovery, was
established in 2010.
BMCE Bank’s international activities
BMCE Bank’s international vocation can be traced back to its origins as a bank specialising in foreign trade. The Bank rapidly turned to international
markets by building a strong presence in Europe. In 1972, it became the first Moroccan bank to open a branch in Paris. The Group’s European activities
are conducted through BMCE Bank International in London, Paris and Madrid, which constitute the Group’s European platform for investing in Africa.
The Bank also has twenty or so representative offices providing banking services to Moroccans living abroad. The Bank recently established BMCE
Euroservices as a result of the recent re-organisation of its European business. This entity, which is responsible for banking for expatriates, will work closely
with the domestic branch network.
BMCE Bank has also developed, since the 1980s, sizeable operations in the African market following the restructuring of Banque de Développement du
Mali, the country’s leading bank, in which it has a 27.4% stake.
Similarly, in 2003, in Congo Brazzaville, BMCE Bank acquired a 25% stake in La Congolaise de Banque, which it restructured, resulting in it becoming the
undisputed market leader in its industry.
BMCE Bank’s development accelerated in 2007 following the acquisition of a 25% stake in Bank of Africa which has operations in about fifteen countries.
BMCE Bank has since increased its stake the pan-African bank to 72.70%.
As part of on-going efforts to improve governance across the Bank’s various operations, a major project got underway at end-June 2012 relating to the
implementation of a global risk control and internal control policy. On the project’s completion, BMCE Bank will boast a new organisational structure
commensurate with international banking groups and a significantly enhanced system of governance in respect of Group risk.
ContentI. CONSOLIDATED BALANCE SHEET, CONSOLIDATED INCOME STATEMENT, STATEMENT OF NET INCOME, STATEMENT OF CHANgES IN SHAREHOLDERS’
EqUITy, CASH FLOw STATEMENTS AND SUMMARy OF ACCOUNTINg POLICIES
1.1. Consolidated Balance Sheet
1.2. Consolidated Income Statement
1.3. Statement of Net Income and Gains and Losses Recognised Directly in Shareholders’ Equity
1.4. Statement of Changes in Shareholders’ Equity
1.5. Cash Flow Statements at 31 december 2014
1.6. Summary of Accounting Policies Applied by the Group
II. NOTES TO THE INCOME STATEMENT FOR THE yEAR ENDED 31 DECEMBER 2014
2.1. Net Interest Income
2.2. Net Fee Income .
2.3. Net Gains on Financial Instruments at Fair Value Through Profit or Loss
2.4. Net Gains on Available-For-Sale Financial Assets
2.5. Net Income From Other Activities .
2.6. Cost of Risk .
2.7. Net Gains on Other Assets
2.8. Income Tax .
2.9. General Operating Expenses .
III. SEgMENT INFORMATION .
3.1. Income by Business Activity .
3.2. Assets and Liabilities by Business Activity
3.3. Information by Geographical Region
3.4. Analysis of Concentrations
3.5. Breakdown of Loans and Receivables
Iv. NOTES TO THE BALANCE SHEET FOR THE yEAR ENDED 31 DECEMBER 2014
4.1. Cash, Amounts due From Central Banks, banks and the Post Office
4.2. Assets and Liabilities at Fair Value Through Income
4.3. Available-For-Sale Financial Assets
4.4. Interbank Transactions, Receivables and Amounts due From Credit Institutions
4.5. Loans, Receivables and Amounts due From Customers .
4.6. Debt Securities, Subordinated Debt and Special Guarantee Funds
4.7. Held-To-Maturity Financial Assets
4.8. Current and Deferred Tax .
4.9. Accrued Income and Expenses, Other Assets and Liabilities .
4.10. Investments in Companies Accounted for Under the Equity Method .
4.11. Property, Plant and Equipment and Intangible Assets Used in Operations and Investment Property .
4.12. Goodwill .
4.13. Provisions for Risks and Charges
4.14. Transfers on Financial Assets
4.15. Fair Value .
v FINANCINg AND gUARANTEE COMMITMENTS
5.1. Financing Commitments .
5.2. Guarantee Commitments .
vI SALARy AND EMPLOyEE BENEFITS
6.1. Description of Calculation Method
6.2. Summary of Provisions and Description of Existing Schemes
6.3. Share-Based Payments .
vII ADDITIONAL INFORMATION
7.1. Changes in Share Capital and Earnings Per Share .
7.2. Scope of Consolidation
7.3. Remuneration and Benefits Awarded to the Main Directors
7.4. Relations With Related Parties
7.5. Leases .
vIII NOTE CONCERNINg RISKS
8.1. Risk Management Policy
8.2. Credit Risk
8.3. Rating Model
8.4. Exposure to Credit Risk
8.5. Credit Risk Control and Monitoring Procedure
8.6. Description of the Policy for Managing Liquidity and Interest Rate Risks
8.7. Market Risk
8.8. Operational Risk

4
I. CONSOLIDATED BALANCE SHEET, CONSOLIDATED INCOME STATEMENT, STATEMENT OF NET INCOME, STATEMENT OF CHANgES IN SHAREHOLDERS’ EqUITy, CHASH FLOw STATEMENT AND SUMMARy OF ACCOUTINg POLICIES
1.1. CONSOLIDATED BALANCE SHEET
the consolidated financial statements at 31 december 2013 were approved by the board of directors on 21 march 2014.
Balance SheetAssets NOTES dec-14 dec-13Cash and amounts due from central banks and post office banks 4.1 9 966 747 11 939 091
Financial assets at fair value through profit or loss 4.2 28 609 790 28 223 948
Derivatives used for hedging purposes - -
Available-for-sale financial assets 4.3 4 891 427 3 319 804
Loans and receivables due from credit institutions 4.4 16 072 610 18 145 727
Loans and receivables due from customers 4.5 155 152 943 149 374 957
Remeasurement adjustment on interest rate risk hedged assets - -
Held-to-maturity financial assets 4.7 18 153 337 12 536 742
Current tax assets 4.8 199 008 92 432
Deferred tax assets 4.8 445 733 257 635
Accrued income and other assets 4.9 4 978 851 4 317 433
Non current assets held for sale - -
Investment associates 4.10 513 766 472 624
Investment property 4.11 835 047 947 602
Property, plant and equipment 4.11 5 847 075 5 465 769
Intangible assets 4.11 744 273 770 522
Goodwill 4.12 832 470 832 470
TOTAL ASSETS 247 243 077 236 696 756
(In thousand MAD)
LIABILITIES & SHAREHOLDERS EqUITy NOTES dec-14 dec-13
Due to Central Banks and Post Office Banks - 68 253
Financial liabilities at fair value through profit or loss 4.2 2 745 648 2 437 494
Derivatives used for hedging purposes 2 018 -
Due to credit institutions 4.4 33 142 978 35 068 715
Due to customers 4.5 161 268 876 148 790 337
Debt securities 4.6 13 170 353 12 451 775
Remeasurement adjustment on interest rate risk hedged portfolios - -
Current tax liabilities 4.8 55 341 94 368
Deferred tax liabilities 4.8 1 099 810 989 759
Accrued expenses and other liabilities 4.9 7 636 569 11 380 363
Liabilities related to non-current assets held for sale - -
Technical reserves of insurance companies - -
Provisions for contingencies and charges 4.13 523 011 456 573
Subsidies, assigned public funds and special guarantee funds - -
Subordinated debts 4.6 6 795 304 5 815 661
TOTAL DEBTS 226 439 908 217 553 298
Capital and related reserves 12 488 381 12 104 178
Consolidated reserves - -
- Attributable to parent 1 481 861 1 456 083
- Non-controlling interests 4 000 114 3 612 458
Unrealized or deferred gains or losses, attributable to parent 149 436 107 914
Unrealized or deferred gains or losses, non-controlling interests -8 802 -17 778
Net Income
- Attributable to parent 1 943 864 1 230 796
- Non-controlling interests 748 315 649 807
TOTAL CONSOLIDATED SHARE HOLDERS’S EQUITY 20 803 169 19 143 458
TOTAL 247 243 077 236 696 756
(In thousand MAD)

5
NOTES dec-14 dec-13 + Interests and similar income 12 701 901 11 446 765
- Interests and similar expense -4 959 094 -4 801 885
Net Interest income 2.1 7 742 807 6 644 880 + Fees received and commission income 2 247 263 2 206 721
- Fees paid and commission expense -333 395 -459 319
Net fee income 2.2 1 913 868 1 747 402 +/- Net gains or losses on financial instruments at fair value through profit or loss 2.3 1 093 341 798 364
+/- Net gains or losses on available for sale financial assets 2.4 100 886 162 635
Income from market transactions 1 194 227 960 999 + Other banking revenues 2.5 1 022 668 896 079
- Other banking expenses 2.5 -376 343 -358 334
Net Banking Income 11 497 227 9 891 026 - General Operating Expenses 2,9 -5 827 763 -5 300 375
- Allowances for depreciation and amortization PE and intangible assets 2,9 -666 100 -654 657
gross Operating Income 5 003 364 3 935 994 - Cost of Risk 2.6 -1 778 322 -1 295 268
Operating Income 3 225 042 2 640 726 +/- Share in net income of companies accounted for by equity method 81 621 69 089
+/- Net gains or losses on other assets 2.7 17 306 12 207
+/- Change in goodwill - -
Pre-tax earnings 3 323 969 2 722 022 +/- Corporate income tax 2.8 -631 790 -841 419
Net income 2 692 179 1 880 603 Non-controlling interests 748 315 649 807
Net income attributable to parent 1 943 864 1 230 796 Earnings per share 10,8 6,9
Diluted Earnings per share 10,8 6,9
(In thousand MAD)
1.2. CONSOLIDATED INCOME STATEMENT
1.3. STATEMENT OF NET INCOME AND gAINS AND LOSSES RECOgNISED DIRECTLy IN SHAREHOLDERS’ EqUITy
dec-14 dec-13Net income 2 692 179 1 880 603Currency tranlation adjustment 50 497 12 379
Reevaluation of available for sale financial assets -6 334 -3 039
Reevaluation of hedging instruments 56 831 15 418
Reevaluation of fixed assets 56 831 15 418
Actuarial gains and losses on defined plans 0 14 817
Proportion of gains and losses directly recognised in shareholders equity
on companies consolidated under equity method0 14 817
Total gains and losses directly recognised in shareholders equity 50 497 27 195Net income and gains and losses directly recognised in shareholders equity 2 742 677 1 907 798
attributable to parent 1 985 386 1 256 799
Non-controlling interests 757 291 650 999
(In thousand MAD)

6
Share CapitalReserves related
to stockTreasury stock
Reserves & consolidated
earnings
Unrealised or deferred gains or
losses
Shareholder’s Equity attributable
to parent
Non-controlling interests
Total
Ending balance of Shareholder’s Equity 12.31.2011 1 794 634 10 186 734 0 2 191 425 81 911 14 254 704 4 153 339 18 408 043
Change in the accounting methods 7 152 7 152 7 152
Beginning Balance of adjusted Shareholder’s Equity
12.31.20111 794 634 10 186 734 0 2 198 577 81 911 14 261 856 4 153 339 18 415 195
Operations on capital 122 810 -122 810 0 0
Share-based payment plans 0 0
Operations on treasury stock -35 727 -35 727 0 -35 727
Dividends -592 198 -592 198 -343 582 -935 780
Net income 1 230 796 1 230 796 649 807 1 880 603
PP&E and intangible assets : Revaluations and disposals (A) 0 0 0
Financial instruments : change in fair Value and transfer to
earnings (B)14 226 14 226 1 192 15 418
Currency translation adjustments : Changes and transfer to
earnings (C)-3 039 -3 039 -3 039
Change in the scope of consolidation (1) 14 817 14 817 14 817
Unrealized or deferred gains or losses (A)+ (B) + (C) 0 26 003 26 003 1 192 27 195
Others (2) -36 716 -36 716 -167 092 -203 808
Others 44 956 44 956 -49 178 -4 221
Ending Balance of Shareholder’s Equity 12.31.2012 1 794 634 10 309 544 -35 727 2 722 605 107 914 14 898 970 4 244 486 19 143 458
Impact of changes in accounting methods (1) 0 0
Ending Balance of adjusted Shareholder’s Equity 12.31.2012 1 794 634 10 309 544 -35 727 2 722 605 107 914 14 898 970 4 244 486 19 143 458
Operations on capital (2) 384 203 -384 203 0 0
Share-based payment plans 0 0
Operations on treasury stock 35 727 35 727 35 727
Dividends -717 829 -717 829 -337 936 -1 055 765
Net income 1 943 864 1 943 864 748 315 2 692 179
PP&E and intangible assets: Revaluations and disposals (E) 0 0
Financial instruments: change in fair Value and transfer to
earnings (F)47 856 47 856 8 976 56 832
Currency translation adjustments: Changes and transfer to
earnings (G)-6 334 -6 334 -6 334
Avantages au personnel IAS 19R (1) 0 0
Unrealized or deferred gains or losses (E)+ (F) + (G) 0 41 522 41 522 8 976 50 498
Change in the scope of consolidation (3) -18 092 -18 092 200 689 182 597
Others -120 621 -120 620 -124 903 -245 525
Ending Balance of adjusted Shareholder’s Equity 12.31.2013 1 794 634 10 693 747 0 3 425 724 149 436 16 063 542 4 739 627 20 803 169
(In thousand MAD)
(*) Change in the consolidation scope 2014It is the acquisition of new stakes in BOA Group and SALAFIN and leaving the scope of Hanouty.
1.4. STATEMENT OF CHANgES IN SHAREHOLDER’S EqUITy

7
1.5. CASH FLOw STATEMENTS AS OF DECEMBER 31st, 2014
1.1.1.1. Cash Flow Statement dec-14 dec-13
Pre-tax net income 3 323 969 2 722 022 +/- Net depreciation/amortization expense on property, plant, and equipment and intangible assets 3 463 904 3 380 727 +/- Impairment of goodwill and other non- current assets - - +/- Impairment of financial assets 173 473 35 273 +/- Net allowances for provisions 1 106 319 927 426 +/- Share of earnings in subsidiaries accounted for by equity method -65 808 -69 089 +/- Net loss (income) from investing activities -1 346 058 -1 008 589 +/- Net loss (income) from financing activities - - +/- Other movements 58 543 -61 503 Non monetary items included in pre-tax net income and other adjustments 3 390 373 3 204 245 +/- Cash flows related to transactions with credit institutions -2 073 872 3 464 610 +/- Cash flows related to transactions with customers 3 260 835 -11 587 602 +/- Cash flows related to transactions involving other financial assets and liabilities -6 036 643 4 993 174 +/- Cash flows related to transactions involving non financial assets and liabilities -4 488 481 -2 839 357 +/- Taxes paid -806 052 -636 635 Net Increase (Decrease) in cash related to assets and liabilities generated by operating activities -10 144 213 -6 605 810 Net Cash Flows from Operating Activities -3 429 871 -679 544 +/- Cash Flows related to financial assets and equity investments -732 356 -997 292 +/- Cash flows related to investment property -187 -174 +/- Cash flows related to PP&E and intangible assets -849 669 -1 502 270 Net Cash Flows from Investing Activities -1 582 212 -2 499 736 +/- Cash flows related to transactions with shareholders -909 304 612 593 +/- Cash flows generated by other financing activities 1 844 774 1 940 935 Net Cash Flows from Financing Activities 935 470 2 553 528 Effect of movements in exchange rates on cash and equivalents -252 118 71 311 Net Increase in Cash and equivalents -4 328 731 -554 441 Beginning Balance of Cash and Equivalents 15 544 470 16 098 911 Net Balance of cash accounts and accounts with central banks and post office banks 11 870 837 9 854 817 Net Balance of demand loans and deposits- credit institutions 3 673 632 6 244 094 Ending Balance of Cash and Equivalents 11 215 740 15 544 470 Net Balance of cash accounts and accounts with central banks and post office banks 9 966 853 11 870 837 Net Balance of demand loans and deposits- credit institutions 1 248 887 3 673 632 Net increase in cash and equivalents -4 328 731 -554 441
(In thousand MAD)
1.1.1.2. Cash Flow Statement by geographical Region
MOROCCO EUROPE AFRICAPre-tax net income 1 875 254 134 484 1 314 231+/- Net depreciation/amortization expense on property, plant, and equipment and intangible assets 3 139 759 7 375 316 770+/- Impairment of goodwill and other non- current assets 0+/- Impairment of financial assets 173 473 0 0+/- Net allowances for provisions 504 619 40 852 560 848+/- Share of earnings in subsidiaries accounted for by equity method -26 253 0 -39 555+/- Net loss (income) from investing activities -1 209 689 3 485 -139 854+/- Net loss (income) from financing activities 0 0 0+/- Other movements 31 838 2 505 24 200Non monetary items included in pre-tax net income and other adjustments 2 613 747 54 217 722 409+/- Cash flows related to transactions with credit institutions -9 230 045 297 937 6 858 236+/- Cash flows related to transactions with customers 6 057 816 -1 675 989 -1 120 992+/- Cash flows related to transactions involving other financial assets and liabilities 69 075 -594 368 -5 511 350+/- Cash flows related to transactions involving non financial assets and liabilities -4 418 445 46 024 -116 060+/- Taxes paid -581 624 -8 463 -215 965Net Increase (Decrease) in cash related to assets and liabilities generated by operating activities -8 103 223 -1 934 858 -106 131Net Cash Flows from Operating Activities -3 614 222 -1 746 157 1 930 509+/- Cash Flows related to financial assets and equity investments -185 279 3 064 -550 141+/- Cash flows related to investment property -187 0 0+/- Cash flows related to PP&E and intangible assets -195 039 -20 669 -633 961Net Cash Flows from Investing Activities -380 505 -17 604 -1 184 102+/- Cash flows related to transactions with shareholders -621 039 0 -288 265+/- Cash flows generated by other financing activities -286 679 2 007 651 123 802Net Cash Flows from Financing Activities -907 718 2 007 651 -164 463Effect of movements in exchange rates on cash and equivalents -458 -47 681 -203 979Net Increase in Cash and equivalents -4 902 903 196 209 377 965 Beginning Balance of Cash and Equivalents 6 835 275 372 857 8 336 338Net Balance of cash accounts and accounts with central banks and post office banks 4 912 087 1 807 6 956 943Net Balance of demand loans and deposits- credit institutions 1 923 187 371 050 1 379 395Ending Balance of Cash and Equivalents 1 841 900 569 066 8 804 773Net Balance of cash accounts and accounts with central banks and post office banks 1 624 493 117 664 8 224 695Net Balance of demand loans and deposits- credit institutions 217 407 451 402 580 078Net increase in cash and equivalents -4 993 375 196 209 468 435
(In thousand MAD)

8
1.6. SUMMARy OF ACCOUNTINg POLICIES APPLIED By THE gROUP
1.6.1. Applicable accounting standards
The first consolidated financial statements to be prepared by BMCE Bank
Group in accordance with international accounting standards (IFRS) were
those for the period ended 30 June 2008 with an opening balance on 1
January 2007.
The consolidated financial statements of BMCE Bank Group have
been prepared in accordance with international accounting standards
(International Financial Reporting Standards – IFRS), as approved by the
IASB.
The Group did not choose to early-adopt the new standards,
amendments, and interpretations adopted by the IASB which may be
applied retrospectively. For the IASB these standards are effective for the
periods starting on or after 1 January 2014.
Following the retrospectively application of amendments IAS 19R, the
Group has decided to publish comparative information about a single
year under the annual improvements - 2009-2011 period published by the
IASB.
1.6.2. Consolidation principles
a. Scope of consolidation
The scope of consolidation includes all Moroccan and foreign entities in
which the Group directly or indirectly holds a stake.
BMCE Bank Group includes within its scope of consolidation all entities,
whatever their activity, in which it directly or indirectly holds 20% or more
of existing or potential voting rights. In addition, it consolidates entities if
they meet the following criteria:
• The subsidiary’s total assets exceed 0.5% of the parent company’s;
• The subsidiary’s net assets exceed 0.5% of the parent company’s;
• The subsidiary’s banking income exceeds 0.5% of the parent company’s ;
• “Cumulative” thresholds which ensure that the combined total of entities
excluded from the scope of consolidation does not exceed 5% of the
consolidated total.
b. Consolidation methods
The method of consolidation adopted (fully consolidated or accounted
for under the equity method) will depend on whether the Group has full
control, joint control or exercises significant influence.
At 31 December 2013, no Group subsidiary was jointly controlled.
c. Consolidation rules
The consolidated financial statements are prepared using uniform
accounting policies for reporting like transactions and other events in
similar circumstances.
Elimination of intragroup balances and transactions
Intragroup balances arising from transactions between consolidated
companies, and the transactions themselves, including income, expenses
and dividends, are eliminated. Profits and losses arising from intragroup
sales of assets are eliminated, except where there is an indication that the
asset sold is impaired.
Translation of financial statements prepared in foreign currencies
BMCE Bank Group’s consolidated financial statements are prepared in
dirhams. The financial statements of companies whose functional currency
is not the dirham are translated using the closing rate method. Under
this method, all assets and liabilities, both monetary and non-monetary,
are translated using the spot exchange rate at the balance sheet date.
Income and expenditures are translated at the average rate for the period.
d. Business combinations and measurement of goodwill
Cost of a business combination
The cost of a business combination is measured as the aggregate fair
value of assets acquired, liabilities incurred or assumed and equity
instruments issued by the acquirer in consideration for control of the
acquired company. Costs attributable to the acquisition are recognised
through income.
Allocating the cost of a business combination to the assets acquired and
liabilities incurred or assumed
The Group allocates, at the date of acquisition, the cost of a business
combination by recognising those identifiable assets, liabilities and
contingent liabilities of the acquired company which meet the criteria for
fair value recognition at that date.
Any difference between the cost of the business combination and the
Group’s share of the net fair value of the identifiable assets, liabilities and
contingent liabilities is recognised under goodwill.
goodwill
At the date of acquisition, goodwill is recognised as an asset. It is initially
measured at cost, that is, the difference between the cost of the business
combination over the Group’s share of the net fair value of the identifiable
assets, liabilities and contingent liabilities.
The Group has adopted from 2012 the “full goodwill” method for new
acquisitions. This method consists of measuring goodwill based on the
difference between the cost of the business combination and minority
interests over the fair value of the identifiable assets, liabilities and
contingent liabilities.
It is worth noting that the Group has not restated business combinations
occurring before 1 January 2008, the date of first-time adoption of IFRS,
in accordance with IFRS 3 and as permitted under IFRS 1.

9
Measurement of goodwill
Following initial recognition, goodwill is measured at cost less cumulative
impairment.
In accordance with IAS 36, impairment tests must be conducted whenever
there is any indication of impairment that a unit may be impaired and at
least once a year to ensure that the goodwill recognised for each CGU
does not need to be written down.
At 31 December 2014, the Group conducted impairment test to ensure
that the carrying amount of cash-generating units was still lower than the
recoverable amount.
The recoverable amount of a cash-generating unit is the higher of the net
fair value of the unit and its value in use.
Fair value is the price that is likely to be obtained from selling the CGU in
normal market conditions.
Value in use is based on an estimate of the current value of future cash
flows generated by the unit’s activities as part of the Bank’s market
activities:
• If the subsidiary’s recoverable amount is more than the carrying amount,
then there is no reason to book an impairment charge;
• If the subsidiary’s recoverable amount is less than the carrying amount,
the difference is recognised as an impairment charge. It will be allocated to
goodwill as a priority and subsequently to other assets on a pro-rata basis.
The Bank has employed a variety of methods for measuring CGU
value in use depending on the subsidiary. These methods are based on
assumptions and estimates:
• A revenue-based approach, commonly known as the “dividend discount
model”, is a standard method used by the banking industry. The use of
this method depends on the subsidiary’s business plan and will value the
subsidiary based on the net present value of future dividend payments.
These flows are discounted at the cost of equity.
• The “discounted cash flow method” is a standard method for measuring
firms in the services sector. It is based on discounting available cash flows
at the weighted average cost of capital.
Step acquisitions
In accordance with revised IFRS 3, the Group does not calculate additional
goodwill on step acquisitions once control has been obtained.
In particular, in the event that the Group increases its percentage interest
in an entity which is already fully consolidated, the difference at acquisition
date between the cost of acquiring the additional share and share already
acquired in the entity is recognised in the Group’s consolidated reserves.
1.6.3. Financial assets and liabilities
a. Loans and receivables
Loans and receivables include credit provided by the Group.
Loans and receivables are initially measured at fair value or equivalent,
which, as a general rule, is the net amount disbursed at inception
including directly attributable origination costs and certain types of fees
or commission (syndication commission, commitment fees and handling
charges) that are regarded as an adjustment to the effective interest rate
on the loan.
Loans and receivables are subsequently measured at amortised cost. The
income from the loan, representing interest plus transaction costs and
fees and commission included in the initial value of the loan, is calculated
using the effective interest method and taken to income over the life of
the loan.
b. Securities
Classification of securities
Securities held by the Group are classified under one of three categories.
Financial assets at fair value through P&L
This category includes financial assets and liabilities held for trading
purposes. They are measured at fair value at the balance sheet date
under “financial assets at fair value through P&L”. Changes in fair value
are recognised in the income statement under “Net gains or losses on
financial instruments at fair value through P&L”.
It is worth noting that the Group has not designated, on initial recognition,
non-derivative financial assets and liabilities at fair value through income
using option available under IAS 39.
Held-to-maturity financial assets
Held-to-maturity financial assets include securities with fixed or
determinable payments and fixed maturity securities that the Group has
the intention and ability to hold until maturity.
Assets in this category are accounted for at amortised cost using the
effective interest method, which builds in amortisation of premium and
discount, corresponding to the difference between the asset’s purchase
price and redemption value and acquisition costs, if material. They may
be written down, if applicable, in the event of issuer default. Income earned
from this category of assets is included in “Interest and similar income” in
the income statement.
Available-for-sale financial assets
Available-for-sale financial assets are fixed income and floating rate
securities other than those classified under the two previous categories.
Assets included in the available-for-sale category are initially recognised
at fair value plus transaction costs, if material. At the balance sheet date,
they are re-measured at fair value, with changes in fair value shown on
a separate line in shareholders’ equity. Upon disposal, these unrealised
gains and losses are transferred from shareholders’ equity to the income
statement, where they are shown on the line “Net gains or losses on
available-for-sale financial assets”. The same applies in the event of
impairment.
Income recognised using the effective interest method for fixed income
available-for-sale securities is recorded under “Interest and similar
income” in the income statement.
Dividend income from floating rate securities is recognised under “Net

10
gains or losses on available-for-sale financial assets” when the Group’s
right to receive payment is established.
Temporary acquisitions and sales
Repurchase agreements
Securities subject to repurchase agreements are recorded in the Group’s
balance sheet in their original category.
The corresponding liability is recognised in the under “Borrowings” as a
liability on the balance sheet.
Securities temporarily acquired under reverse repurchase agreements are
not recognised in the Group’s balance sheet. The corresponding receivable
is recognised under “Loans and receivables”.
Securities lending and borrowing transactions
Securities lending transactions do not result in de-recognition of the lent
securities while securities borrowing transactions result in recognition of a
debt on the liabilities side of the Group’s balance sheet.
Date of recognition of securities transactions
Securities recognised at fair value through income or classified under
held-to-maturity or available-for-sale financial assets are recognised at
the trade date.
Regardless of their classification (recognised as loans and receivables or
debt), temporary sales of securities as well as sales of borrowed securities
are initially recognised at the settlement date.
These transactions are carried on the balance sheet until the Group’s
rights to receive the related cash flows expire or until the Group has
substantially transferred all the risks and rewards related to ownership of
the securities.
c. Foreign currency transactions
Monetary assets and liabilities denominated in foreign currencies
Monetary assets and liabilities denominated in foreign currencies are
translated into the functional currency of the relevant Group entity at
the closing rate. Translation differences are recognised in the income
statement, except for those arising from financial instruments earmarked
as a cash flow hedge or a net foreign currency investment hedge, which
are recognised in shareholders’ equity.
d. Impairment and restructuring of financial assets
Impairment of loans and receivables and held-to-maturity financial assets, provisions for financing and guarantee commitments
At each balance sheet date, the Group determines whether there is
objective evidence of impairment to a financial asset or group of financial
assets as a result of an event or several events occurring after initial
recognition, whether this event affects the amount or timing of future
cash flows and whether the consequences of the event can be reliably
measured.
The Group assesses, in the first instance, whether there is objective
evidence of impairment on an individual basis for individually material
assets or on a collective basis for financial assets which are not individually
material.
If the Group determines that there is no objective evidence of impairment
to a financial asset, whether considered individually material or not, it
includes this asset within a group of financial assets with a similar credit
risk profile and subjects them to an impairment test on a collective basis.
At an individual level, objective evidence that a financial asset is impaired
includes observable data relating to the following events:
• The existence of accounts which are past the due date;
• Any knowledge or evidence that the borrower is experiencing significant
financial difficulty, such that a risk can be considered to have arisen,
regardless of whether the borrower has missed any payments;
• Concessions in respect of the credit terms granted to the borrower
that the lender would not have considered had the borrower not been
experiencing financial difficulty.
Impairment is measured as the difference between the carrying amount
and the present value, discounted at the asset’s original effective interest
rate, of those components (principal, interest, collateral, etc.) regarded as
recoverable.
The Group’s portfolio doubtful loan portfolio is categorised as follows :
Individually material loans : Each of these loans is reviewed individually in
order to estimate recovery payments and determine recovery schedules.
Impairment under IFRS relates to the difference between amounts owing
and the net present value of expected recovered payments.
Non-individually material loans : Loans not reviewed on an individual basis
are segmented into different risk categories having similar characteristics
and are assessed using a statistical model, based on historical data, of
annual recovery payments by each risk category.
Counterparties not showing any evidence of impairment
These loans are risk-assessed on a portfolio basis with similar
characteristics. This assessment draws upon historical data, adjusted if
necessary to reflect circumstances prevailing at the balance sheet date.
This analysis enables the Group to identify counterparty groups which, as
a result of events occurring since inception of the loans, have collectively
acquired a probability of default at maturity that provides objective
evidence of impairment of the entire portfolio but without it being possible
at that stage to allocate the impairment to individual counterparties.
This analysis also estimates the loss relating to the portfolios in question,
taking account of trends in the economic cycle during the assessment
period.
Based on the experienced judgement of the Bank’s divisions or Risk Division,
the Group may recognise additional collective impairment provisions
in respect of an economic sector or geographical region affected by
exceptional economic events. In this regard the Group established watch
lists of the accounts at risk.
Provisions and provision write-backs are recognised in the income
statement under “Cost of risk” while the theoretical income earned on

11
the carrying amount of impaired loans is recognised under “Interest and
similar income” in the income statement.
Impairment of available-for-sale financial assets
Impairment of “available-for-sale financial assets”, which mainly comprise
equity instruments, is recognised through income if there is objective
evidence of impairment as a result of one or more events occurring since
acquisition.
The Group has determined two types of non-cumulative impairment for
equity instruments recorded under “available-for-sale financial assets”.
The first one is a significant decline in the security’s price. By “significant” is
implied a fall of more than 40% from the acquisition price. The second is
a prolonged decline, defined as an unrealised loss over a one-year period.
For financial instruments quoted on a liquid market, impairment is
determined using quoted prices and, for unquoted financial instruments,
is based on valuation models.
Impairment losses taken against equity securities are recognised as a
component of net banking income under “Net gains or losses on available-
for-sale financial assets” and may only be reversed through income after
these securities are sold. Any subsequent decline in fair value constitutes
an additional impairment loss, recognised in through income.
In the case of debt instruments, impairment is assessed on the basis of
the same criteria applied to loans and receivables, that is, on an individual
basis if there is objective evidence of impairment or on a collective basis if
there is no evidence of impairment.
Given the characteristics of its portfolio, the Group is not concerned by
debt instruments.
Restructuring of assets classed as “Loans and receivables”
An asset classified in “Loans and receivables” is considered to be restructured
due to the borrower’s financial difficulty when the Group, for economic or
legal reasons related to the borrower’s financial difficulty, agrees to modify
the terms of the original transaction that it would not otherwise consider,
resulting in the borrower’s contractual obligation to the Group, measured at
present value, being reduced compared with the original terms.
At the time of restructuring, a discount is applied to the loan to reduce
its carrying amount to the present value of the new expected future cash
flows discounted at the original effective interest rate.
The decrease in the asset value is recognised through income under “Cost
of risk”.
For each loan, the discount is recalculated at the renegotiation date using
original repayment schedules and renegotiation terms.
The discount is calculated as the difference between:
• The sum, at the renegotiation date, of the original contractual repayments
discounted at the effective interest rate; and
• The sum, at the renegotiation date, of the renegotiated contractual
repayments discounted at the effective interest rate. The discount, net
of amortisation, is recognised by reducing loan outstandings through
income. Amortisation will be recognised under net banking income.
e. Issues of debt securities
Financial instruments issued by the Group are qualified as debt instruments
if the Group company issuing the instruments has a contractual obligation
to deliver cash or another financial asset to the holder of the instrument.
The same applies if the Group is required to exchange financial assets or
liabilities with another entity on terms that are potentially unfavourable to
the Group, or to deliver a variable number of the Group’s treasury shares.
In the Group’s case, this concerns certificates of deposit issued by Group
banks such as BMCE BANK and BANK OF AFRICA as well as notes issued
by finance companies MAGHREBAIL and SALAFIN.
f. Treasury shares
“Treasury shares” refer to shares issued by the parent company, BMCE
Bank SA, or by its fully consolidated subsidiaries. Treasury shares held by
the Group are deducted from consolidated shareholders’ equity regardless
of the purpose for which they are held. Gains and losses arising on such
instruments are eliminated from the consolidated income statement.
As of December 31, 2013, shares held by the subsidiary Salafin were
eliminated in the consolidated equity.
g. Derivative instruments
All derivative instruments are recognised in the balance sheet on the
trade date at the trade price and are re-measured to fair value on the
balance sheet date.
Derivatives held for trading purposes are recognised “Financial assets at
fair value through income” when their fair value is positive and in “Financial
liabilities at fair value through income” when their fair value is negative.
Realised and unrealised gains and losses are recognised in the income
statement under “Net gains or losses on financial instruments at fair value
through income”.
h. Determining the fair value of financial instruments
Fair value is defined as the amount for which an asset could be exchanged,
or a liability settled, between knowledgeable, willing parties in an arm’s
length transaction.
Financial assets classified under “Financial assets at fair value through
income” and “Available-for-sale financial assets” are measured at fair
value.
Fair value in the first instance relates to the quoted price if the financial
instrument is traded on a liquid market.
If no liquid market exists, fair value is determined by using valuation
techniques (internal valuation models as outlined in Note 4.15 on fair
value).
Depending on the financial instrument, these involve the use of data
taken from recent arm’s length transactions, the fair value of substantially
similar instruments, discounted cash flow models or adjusted book values.
Characteristics of a liquid market include regularly available prices for
financial instruments and the existence of real arm’s length transactions.
Characteristics of an illiquid market include factors such as a significant

12
decline in the volume and level of market activity, a significant variation in
available prices between market participants or a lack of recent observed
transaction prices.
i. Income and expenses arising from financial assets and liabilities
The effective interest rate method is used to recognise income and
expenses arising from financial instruments, which are measured at
amortised cost.
The effective interest rate is the rate that exactly discounts estimated
future cash flows through the expected life of the financial instrument
or, when appropriate, a shorter period, to the net carrying amount of the
asset or liability in the balance sheet. The effective interest rate calculation
takes into account all fees received or paid that are an integral part of the
effective interest rate of the contract, transaction costs, and premiums
and discounts.
j. Cost of risk
“Cost of risk” includes impairment provisions net of write-backs and
provisions for credit risk, losses on irrecoverable loans and amounts
recovered on amortised loans as well as provisions and provision write-
backs for other risks such as operating risks.
k. Offsetting financial assets and liabilities
A financial asset and a financial liability are offset and the net amount
presented in the balance sheet if, and only if, the Group has a legally
enforceable right to offset the recognised amounts and intends either
to settle on a net basis or to realise the asset and settle the liability
simultaneously.
1.6.4. Property plant and equipment and intangible assets
a. Property, plant and equipment
The Group has opted for the cost model to measure property, plant and
equipment and intangible assets.
It is worth noting that, in application of the option provided under IFRS 1,
the Group has chosen to measure certain items of property, plant and
equipment at the transition date at their fair value and use this fair value
as deemed cost at this date.
In accordance with IAS 23, borrowing costs directly attributable to the
acquisition are included in the acquisition cost of items of property, plant
and equipment.
As soon as they are available for use, items of property, plant and
equipment are amortised over the asset’s estimated useful life.
Given the character of BMCE Bank Group’s property, plant and equipment,
it has not adopted any residual value except for transport equipment
owned by LOCASOM, a subsidiary.
In respect of the Group’s other assets, there is neither a sufficiently liquid
market nor a replacement policy over a period that is considerably shorter
than the estimated useful life for any residual value to be adopted.
This residual value is the amount remaining after deducting from the
acquisition cost all allowable depreciable charges.
Given the Group’s activity, it has adopted a component-based approach
for property. The option adopted by the Group is a component-based
amortised cost method by applying using a component-based matrix
established as a function of the specific characteristics of each of BMCE
Bank Group’s buildings.
Component-based matrix adopted by BMCE BANK
Head office property Other property
Period Share Period Share
Structural works 80 55% 80 65%
Fasade 30 15%
General & technical
installations20 20% 20 15%
Fixtures and fittings 10 10% 10 20%
Impairment
The Group has deemed that impairment is only applicable to buildings
and, as a result, the market price (independently-assessed valuation) will
be used as evidence of impairment.
b. Investment property
IAS 40 defines investment property as property held to earn rentals or
for capital appreciation or both. An investment property generates cash
flows that are largely independent from the company’s other assets in
contrast to property primarily held for use in the production or supply of
goods or services.
The Group qualifies investment property as any non-operating property.
BMCE Bank Group has opted for the cost method to value its investment
property. The method used to value investment property is identical to
that for valuing operating property.
c. Intangible assets
Intangible assets are initially measured at cost which is equal to the
amount of cash or cash equivalent paid or any other consideration
given at fair value to acquire the asset at the time of its acquisition or
construction.
Subsequent to initial recognition, intangible assets are measured at cost
less cumulative amortisation and impairment losses.
The amortisation method adopted reflects the rate at which future
economic benefits are consumed.
Impairment is recognised when evidence (internal or external) of
impairment exists. Evidence of impairment is assesses at each balance
sheet date.
Given the character of the intangible assets held, the Group considers
that the concept of residual value is not relevant in respect of its intangible
assets. As a result, residual value has not been adopted.
1.6.5. Leases
Group companies may either be the lessee or the lessor in a lease
agreement.

13
Leases contracted by the Group as lessor are categorised as either
finance leases or operating leases.
a. Lessor accounting
Finance leases
In a finance lease, the lessor transfers the substantial portion of the risks
and rewards of ownership of an asset to the lessee. It is treated as a loan
made to the lessee to finance the purchase of the asset.
The present value of the lease payments, plus any residual value, is
recognised as a receivable.
The net income earned from the lease by the lessor is equal to the amount
of interest on the loan and is taken to the income statement under “Interest
and other income”. The lease payments are spread over the lease term
and are allocated to reducing the principal and to interest such that the
net income reflects a constant rate of return on the outstanding balance.
The rate of interest used is the rate implicit in the lease.
Individual and portfolio impairments of lease receivables are determined
using the same principles as applied to other loans and receivables.
Operating leases
An operating lease is a lease under which the substantial portion of the
risks and rewards of ownership of an asset are not transferred to the
lessee.
The asset is recognised under property, plant and equipment in the
lessor’s balance sheet and depreciated on a straight-line basis over the
lease term. The depreciable amount excludes the asset’s residual value.
The lease payments are taken to the income statement in full on a
straight-line basis over the lease term.
Lease payments and depreciation expenses are taken to the income
statement under “Income from other activities” and “Expenses from other
activities”.
b. Lessee accounting
Leases contracted by the Group as lessee are categorised as either
finance leases or operating leases.
Finance leases
A finance lease is treated as an acquisition of an asset by the lessee,
financed by a loan. The leased asset is recognised in the balance sheet of
the lessee at the lower of fair value or the present value of the minimum
lease payments calculated at the interest rate implicit in the lease.
A matching liability, equal to the fair value of the leased asset or the
present value of the minimum lease payments, is also recognised in the
balance sheet of the lessee. The asset is depreciated using the same
method as that applied to owned assets after deducting the residual value
from the amount initially recognised over the useful life of the asset. The
lease obligation is accounted for at amortised cost.
Operating leases
The asset is not recognised in the balance sheet of the lessee. Lease
payments made under operating leases are taken to the lessee’s income
statement on a straight-line basis over the lease term.
1.6.6. Non-current assets held for sale and discontinued activities
An asset is classified as held for sale if its carrying amount is obtained
through the asset’s sale rather than through its continuous use in the
business.
At 31 December 2014, the Group did not recognise any assets as held for
sale or discontinued activities.
1.6.7. Employee benefits
Classification of employee benefits
a. Short-term benefits
Short-term benefits are due within twelve months of the close of the
financial year in which employees provided the corresponding services.
They are recognised as expenses in the year in which they are earned.
b. Defined-contribution post-employment benefits
The employer pays a fixed amount in respect of contributions into an
external fund and has no other liability. Benefits received are determined
on the basis of cumulative contributions paid plus any interest and are
recognised as expenses in the year in which they are earned.
c. Defined-benefit post-employment benefits
Defined-benefit post-employment benefits are those other than defined-
contribution schemes. The employer undertakes to pay a certain level of
benefits to former employees, whatever the liability’s cover. This liability is
recognised as a provision.
The Group accounts for end-of-career bonuses as defined-benefit post-
employment benefits: these are bonuses paid on retirement and depend
on employees’ length of service.
d. Long-term benefits
These are benefits which are not settled in full within twelve after the
employee rendering the related service. Provisions are recognised if the
benefit depends on employees’ length of service.
The Group accounts for long-service awards as long-term benefits: these
are payments made to employees when they reach 6 different thresholds
of length of service ranging from 15 to 40 years.
e. Termination benefits
Termination benefits are made as a result of a decision by the Group to
terminate a contract of employment or a decision by an employee to
accept voluntary redundancy. The company may set aside provisions if it is
clearly committed to terminating an employee’s contract of employment.
Principles for calculating and accounting for defined-benefit post-employment benefits and other long-term benefits
a. Calculation method
The recommended method for calculating the liability under IAS 19 is the
“projected unit credit” method. The calculation is made on an individual
basis. The employer’s liability is equal to the sum of individual liabilities.

14
Under this method, the actuarial value of future benefits is determined by
calculating the amount of benefits due on retirement based on salary projections
and length of service at the retirement date. It takes into consideration variables
such as discount rates, the probability of the employee remaining in service up
until retirement as well as the likelihood of mortality.
The liability is equal to the actuarial value of future benefits in respect of
past service within the company prior to the calculation date. This liability
is determined by applying to the actuarial value of future benefits the
ratio of length of service at the calculation date to length of service at the
retirement date.
The annual cost of the scheme, attributable to the cost of an additional year
of service for each participant, is determined by the ratio of the actuarial
value of future benefits to the anticipated length of service on retirement.
b. Accounting principles
A provision is recognised under liabilities on the balance sheet to cover for
all obligations.
Actuarial gains or losses arise on differences related to changes in
assumptions underlying calculations (early retirement, discount rates
etc.) or between actuarial assumptions and what actually occurs (rate of
return on pension fund assets etc.) constitute.
They are amortised through income over the average anticipated
remaining service lives of employees using the corridor method.
The past service cost is spread over the remaining period for acquiring
rights.
The annual expense recognised in the income statement under “Salaries
and employee benefits” in respect of defined-benefit schemes comprises:
• The rights vested by each employee during the period (the cost of service
rendered);
• The interest cost relating to the effect of discounting the obligation ;
• The expected income from the pension fund’s investments (gross rate
of return);
• The amortisation of actuarial gains and losses and past service costs;
• The effect of any plan curtailments or settlements.
1.6.8. Share-based payments
The Group offers its employees the possibility of participating in share
issues in the form of share purchase plans.
New shares are offered at a discount on the condition that they retain the
shares for a specified period.
The expense related to share purchase plans is spread over the vesting
period if the benefit is conditional upon the beneficiary’s continued
employment.
This expense, booked under “Salaries and employee benefits”, with a
corresponding adjustment to shareholders’ equity, is calculated on the
basis of the plan’s total value, determined at the allotment date by the
Board of Directors.
In the absence of any market for these instruments, financial valuation
models are used that take into account performance-based criteria
relating to the BMCE Bank share price. The plan’s total expense is
determined by multiplying the unit value per option or bonus share
awarded by the estimated number of options or bonus shares acquired at
the end of the vesting period, taking into account the conditions regarding
the beneficiary’s continued employment.
1.6.9. Provisions recorded under liabilities
Provisions recorded under liabilities on the Group’s balance sheet, other
than those relating to financial instruments and employee benefits mainly
relate to restructuring, litigation, fines, penalties and tax risks.
A provision is recognised when it is probable that an outflow of resources
providing economic benefits will be required to settle an obligation
arising from a past event and a reliable estimate can be made about the
obligation’s amount. The amount of such obligations is discounted in order
to determine the amount of the provision if the impact of discounting is
material.
A provision for risks and charges is a liability of uncertain timing or amount.
The accounting standard provides for three conditions when an entity
must recognise a provision for risks and charges:
• A present obligation towards a third party ;
• An outflow of resources is probable in order to settle the obligation;
• The amount can be estimated reliably.
1.6.10. Current and deferred taxes
The current income tax charge is calculated on the basis of the tax laws
and tax rates in force in each country in which the Group has operations.
Deferred taxes are recognised when temporary differences arise between
the carrying amount of an asset or liability in the balance sheet and its
tax base.
A deferred tax liability is a tax which is payable at a future date. Deferred
tax liabilities are recognised for all taxable temporary differences other
than those arising on initial recognition of goodwill or on initial recognition
of an asset or liability for a transaction which is not a business combination
and which, at the time of the transaction, has not impact on profit either
for accounting or tax purposes.
A deferred tax asset is a tax which is recoverable at a future date. Deferred
tax assets are recognised for all deductible temporary differences and
unused carry-forwards of tax losses only to the extent that it is probable
that the entity in question will generate future taxable profits against
which these temporary differences and tax losses can be offset.
The Group has opted to assess the probability of recovering deferred tax
assets.
Deferred taxes assets are not recognised if the probability of recovery
is uncertain. Probability of recovery is ascertained by the business
projections of the companies concerned.

15
1.6.11. Cash flow statement
The cash and cash equivalents balance is composed of the net balance of
cash accounts and accounts with central banks and the net balances of
sight loans and deposits with credit institutions.
Changes in cash and cash equivalents related to operating activities
reflect cash flows generated by the Group’s operations, including cash
flows related to investment property, held-to-maturity financial assets
and negotiable debt instruments.
Changes in cash and cash equivalents related to investing activities
reflect cash flows resulting from acquisitions and disposals of subsidiaries,
associates or joint ventures included in the consolidated group, as well
as acquisitions and disposals of property, plant and equipment excluding
investment property and property held under operating leases.
Changes in cash and cash equivalents related to financing activities
reflect the cash inflows and outflows resulting from transactions with
shareholders, cash flows related to subordinated debt, bonds and debt
securities (excluding negotiable debt instruments).
1.6.12. Use of estimates in the preparation of the financial statements
Preparation of the financial statements requires managers of business
lines and corporate functions to make assumptions and estimates that
are reflected in the measurement of income and expense in the income
statement and of assets and liabilities in the balance sheet and in the
disclosure of information in the notes to the financial statements.
This requires the managers in question to exercise their judgement and
to make use of information available at the time of preparation of the
financial statements when making their estimates.
The actual future results from operations where managers have made
use of estimates may in reality differ significantly from those estimates
depending on market conditions. This may have a material impact on the
financial statements.
Those estimates which have a material impact on the financial statements
primarily relate to:
• Impairment (on an individual or collective basis) recognised to cover
credit risks inherent in banking intermediation activities ;
Other estimates made by the Group’s management primarily relate to :
• Goodwill impairment tests ;
• Provisions for employee benefits;
• The measurement of provisions for risks and charges.
16
II. NOTES TO THE INCOME STATEMENT FOR THE yEAR ENDED 31 DECEMBER 2014
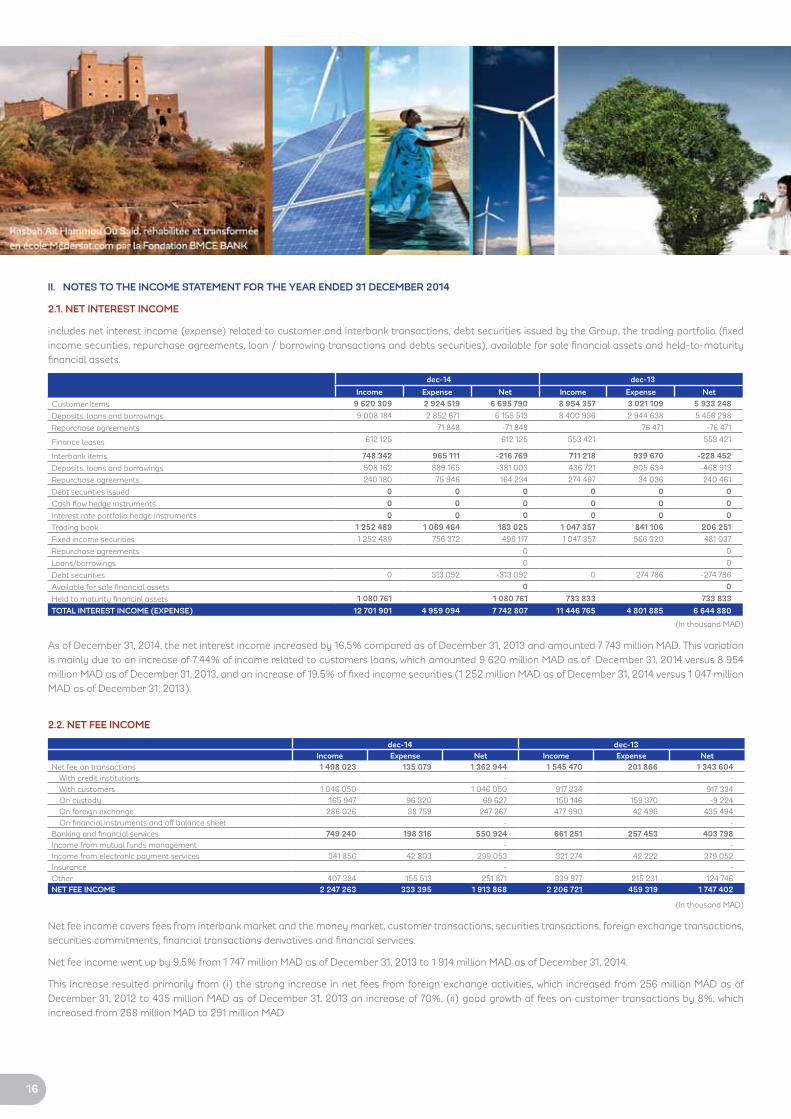
2.1. NET INTEREST INCOME
includes net interest income (expense) related to customer and interbank transactions, debt securities issued by the Group, the trading portfolio (fixed
income securities, repurchase agreements, loan / borrowing transactions and debts securities), available for sale financial assets and held-to-maturity
financial assets.
dec-14 dec-13
Income Expense Net Income Expense Net
Customer Items 9 620 309 2 924 519 6 695 790 8 954 357 3 021 109 5 933 248
Deposits, loans and borrowings 9 008 184 2 852 671 6 155 513 8 400 936 2 944 638 5 456 298
Repurchase agreements 71 848 -71 848 76 471 -76 471
Finance leases 612 125 612 125 553 421 553 421
Interbank items 748 342 965 111 -216 769 711 218 939 670 -228 452
Deposits, loans and borrowings 508 162 889 165 -381 003 436 721 905 634 -468 913
Repurchase agreements 240 180 75 946 164 234 274 497 34 036 240 461
Debt securities issued 0 0 0 0 0 0
Cash flow hedge instruments 0 0 0 0 0 0
Interest rate portfolio hedge instruments 0 0 0 0 0 0
Trading book 1 252 489 1 069 464 183 025 1 047 357 841 106 206 251
Fixed income securities 1 252 489 756 372 496 117 1 047 357 566 320 481 037
Repurchase agreements 0 0
Loans/borrowings 0 0
Debt securities 0 313 092 -313 092 0 274 786 -274 786
Available for sale financial assets 0 0
Held to maturity financial assets 1 080 761 1 080 761 733 833 733 833
TOTAL INTEREST INCOME (ExPENSE) 12 701 901 4 959 094 7 742 807 11 446 765 4 801 885 6 644 880
(In thousand MAD)
As of December 31, 2014, the net interest income increased by 16.5% compared as of December 31, 2013 and amounted 7 743 million MAD. This variation
is mainly due to an increase of 7.44% of income related to customers loans, which amounted 9 620 million MAD as of December 31, 2014 versus 8 954
million MAD as of December 31, 2013, and an increase of 19.5% of fixed income securities (1 252 million MAD as of December 31, 2014 versus 1 047 million
MAD as of December 31, 2013).
2.2. NET FEE INCOME
dec-14 dec-13Income Expense Net Income Expense Net
Net fee on transactions 1 498 023 135 079 1 362 944 1 545 470 201 866 1 343 604 With credit institutions - -
With customers 1 046 050 1 046 050 917 334 917 334
On custody 165 947 96 320 69 627 150 146 159 370 -9 224
On foreign exchange 286 026 38 759 247 267 477 990 42 496 435 494
On financial instruments and off balance sheet - -
Banking and financial services 749 240 198 316 550 924 661 251 257 453 403 798 Income from mutual funds management - -
Income from electronic payment services 341 856 42 803 299 053 321 274 42 222 279 052
Insurance - -
Other 407 384 155 513 251 871 339 977 215 231 124 746
NET FEE INCOME 2 247 263 333 395 1 913 868 2 206 721 459 319 1 747 402
(In thousand MAD)
Net fee income covers fees from interbank market and the money market, customer transactions, securities transactions, foreign exchange transactions,
securities commitments, financial transactions derivatives and financial services.
Net fee income went up by 9,5% from 1 747 million MAD as of December 31, 2013 to 1 914 million MAD as of December 31, 2014.
This increase resulted primarily from (i) the strong increase in net fees from foreign exchange activities, which increased from 256 million MAD as of
December 31, 2012 to 435 million MAD as of December 31, 2013 an increase of 70%, (ii) good growth of fees on customer transactions by 8%, which
increased from 268 million MAD to 291 million MAD

17
2.3. NET gAINS ON FINANCIAL INSTRUMENTS AT FAIR vALUE THROUgH PROFIT OR LOSS
This entry includes all items of income (excluding interest income and expenses, classified under «Net interest income» as described above) relating to
financial instruments managed within the trading book.
This covers gains and losses on disposals, gains and losses related to mark-to-market, as well as dividends from variable-income securities.
dec-14 dec-13
Trading BookAssets measured
under the fair value option
Total Trading BookAssets measured
under the fair value option
Total
Fixed income and variable income securities 1 092 286 1 092 286 736 732 736 732
Derivative instruments 1 055 0 1 055 59 512 2 120 61 632
Repurchase agreements
Loans
Borrowings
Remeasurement of interest rate risk hedged portfolios
Remeasurement of currency positions
TOTAL 1 093 341 0 1 093 341 796 244 2 120 798 364
(In thousand MAD)
As of December 31, 2014, net gains on financial instruments at fair value through profit rose by 37% compared to December 31, 2013 and amounted
1 093 million MAD.
This variation is mainly due to an increase of yield of fixed and variable income of 48% from 737 million MAD in 2013 to 1 092 million MAD in 2014.
2.4. NET gAINS ON AvAILABLE-FOR-SALE FINANCIAL ASSETS
This section includes :
- Dividends and other income from equities and other floating rate securities classified as financial assets available for sale ;
- Gains and losses on disposals of fixed and floating rate securities classified as available for sale financial assets ;
- Impairment provisions on floanting rate securities, classified as available for sale financial assets.
dec-14 dec-13Fixed income securities 0 0Disposal gains and losses
Equity and other variable-income securities 100 886 162 635Dividend income 229 525 174 116
Impairment provisions -122 065 34 775
Net disposal gains -6 574 -46 256
TOTAL 100 886 162 635
(In thousand MAD)
As of December 31, 2014, net gains on available for sale financial assets rose by -38% compared to December 31, 2013 and amounted 101 million MAD.
This variation is mainly due to an increase of 3.6% of dividends income amounting 122 million MAD in 2014.
2.5. NET INCOME FROM OTHER ACTIvITIES
dec-14 dec-13
Income Expense Net Income Expense Net
Net income from insurance activities - -
Net income from investment property - - - - - -
Net income from assets held under operating leases 274 345 98 551 175 794 276 229 96 787 179 442
Net income from property development activities - - - - - -
Other banking income & expenses 357 964 222 374 135 590 297 070 206 631 90 439
Other operating income 390 359 55 418 334 941 322 780 54 916 267 864
Total net income from other activities 1 022 668 376 343 646 325 896 079 358 334 537 745
(In thousand MAD)

18
2.6. COST OF RISK
Includes expenses arising from the manifestation of credit risk and counterparty disputes inherent in the banking business conducted with stakeholders.
Net impairment non covered by such risk allocations are classified in the income statement according to their type.
Cost of risk for the period
dec-14 dec-13Impairment provisions -1 934 231 -1 517 753Impairment provisions on loans and advances -1 806 846 -1 501 320
Impairment provisions on held to maturity financial assets (excluding interest rate risks)
Provisions on off balance sheet commitments -433 -3 485
Other provisions for contingencies and charges -126 952 -12 948
write back of provisions 627 707 395 502Write back of impairment provisions on loans and advances 570 908 353 165
Write back of impairment provisions on held to maturity financial assets (excluding interest rate risks)
Write back of provisions on off balance sheet commitments 58 9 315
Write back of other provisions for contingencies and charges 56 741 33 022
Changes in provisions -471 798 -173 017Losses on counterparty risk on available for sale financial assets (fixed income securities)
Losses on counterparty risk held to maturity financial assets
Loss on irrecoverable loans and advances not covered by impairment provisions
Loss on irrecoverable loans and advances covered by impairment provisions -493 375 -176 691
Discount on restructured products
Recoveries on amortized loans and advances 21 577 3 674
Losses on off balance sheet commitments
Other losses
COST OF RISK -1 778 322 -1 295 268
(In thousand MAD)
Cost of risk for the period
dec-14 dec-13
Net allowances to impairment -1 306 523 -1 122 250
Recoveries on loans and receivables previously written off 21 577 3 674
Irrecoverable loans and receivables not covered by impairment provisions -493 376 -176 692
TOTAL COST OF RISK FOR THE PERIOD -1 778 322 -1 295 268
(In thousand MAD)
2.7. NET gAINS ON OTHER ASSETS
dec-14 dec-13PP&E and intangible assets used in operations 0 0Capital gains on disposals
Capital losses on disposals
Equity interests 0 0Capital gains on disposals 0 0
Capital losses on disposals 0 0
Others* 17 306 12 207
Net gain/Loss on Other Assets 17 306 12 207
(In thousand MAD)
Net gains or losses on other assets increased by +41% from 12,2 million MAD at the end of 2013 to more than 17,3 million MAD at the end of 2014.
Indeed, the exceptional expense of 387 million MAD on tax relief that was paid in the fiscal year 2012, which of course is no longer in 2013, explains this
important variation.

19
2.8. INCOME TAx
2.8.1. CURRENT AND DEFERRED TAx
dec-14 dec-13Current tax 199 008 92 432
Deferred tax 445 733 257 635
Current and deferred tax assets 644 742 350 067Current tax 55 341 94 368
Deferred tax 1 099 810 989 759
Current and deferred tax liabilities 1 155 151 1 084 127
(In thousand MAD)
2.8.2. NET INCOME TAx ExPENSE
dec-14 dec-13Current tax expense -660 267 -765 802
Net deferred tax expense 28 476 -75 617
Net Corporate income tax expense -631 791 -841 419
(In thousand MAD)
2.8.3. EFFECTIvE TAx RATE
dec-14 dec-13Net income 2 692 179 1 880 603
Net corporate income tax expense -631 791 -841 419
Average effective tax rate 23,5% 44,7%
(In thousand MAD)
Analysis of effective tax rate
dec-14 dec-13 Standard tax rate 37,0% 37,0%
Differential in tax rates applicable to foreign entities
Reduced tax rate
Permanent differences
Change in tax rate
Deficit carry over
Other items -13,5% 7,7%
Average effective tax rate 23,5% 44,7%
(In thousand MAD)
2.9 - gENERAL OPERATINg ExPENSES
dec-14 dec-13Staff expenses 3 030 005 2 786 616
Taxes 83 586 82 334
External expenses 1 383 487 1 373 607
Other general operating expenses 1 330 685 1 057 818
Allowances for depreciation and provisions of tangible and intangible assets 666 100 654 657
general operating expenses 6 493 863 5 955 032
(In thousand MAD)
General operating expenses increased by 9% between 2013 and 2014 from 5 955 million MAD as of December 31, 2013 to 6 494 million MAD as of
December 31, 2013.
This variation is explained by an increase in staff expenses of 8.7% from 2 787 million MAD in 2013 to 3 030 million MAD in 2014, and by the increase in
other operating expenses (including taxes and expenses, depreciation and other external expenses) by 9.3% from 3 168 million MAD in 2013 to 3 464
million MAD in 2014.

20
III. SEgMENT INFORMATION
BMCE Bank Group is composed of four core business activities for accounting and financial information purposes:
- Banking in Morocco: includes BMCE Bank’s Moroccan business;
- Asset management and Investment banking: includes investment banking (BMCE Capital), securities brokerage (BMCE Capital Bourse) and asset
management (BMCE Capital Gestion);
- Specialised financial services: includes consumer credit (Salafin), leasing (Maghrébail), factoring (Maroc Factoring), recovery (RM Experts) and credit
insurance (Acmar);
- International activities: includes BMCE International (Madrid), Banque de Développement du Mali, La Congolaise de Banque, BMCE Bank International
and Bank Of Africa.
3.1. INCOME By BUSINESS ACTIvITy
dec-14
ACTIvITy IN MOROCCO
ASSET MANAgEMENT
SPECIALISED FINANCIAL SERvICES
OTHERSINTERNATIONAL
ACTIvITIESTOTAL
Net interest Income 3 163 049 49 612 719 859 -18 399 3 828 686 7 742 807
Net Fee income 827 661 126 444 14 292 0 945 471 1 913 868
Net Banking Income 4 939 564 351 681 743 701 158 698 5 303 583 11 497 227
General Operating Expenses & allowances for depreciation
and amortization-2 731 382 -245 162 -192 747 -87 142 -3 237 430 (6 493 863)
Operating Income 2 208 182 106 519 550 954 71 556 2 066 153 5 003 364
Corporate income tax -229 409 -47 704 -124 596 -11 943 -218 138 ( 631 790)
Net Earnings group Share 992 887 106 593 145 484 51 426 647 474 1 943 864
(In thousand MAD)
dec-13
ACTIvITy IN MOROCCO
ASSET MANAgEMENT
SPECIALISED FINANCIAL SERvICES
OTHERSINTERNATIONAL
ACTIvITIESTOTAL
Net interest Income 2 932 463 24 633 590 258 -20 676 3 118 202 6 644 880
Net Fee income 739 946 112 448 12 134 0 882 874 1 747 402
Net Banking Income 4 347 720 217 269 611 901 158 965 4 555 171 9 891 026
General Operating Expenses & allowances for depreciation
and amortization-2 689 721 -195 077 -185 616 -99 329 -2 785 289 (5 955 032)
Operating Income 1 658 000 22 192 426 284 59 637 1 769 881 3 935 994
Corporate income tax -359 011 -22 977 -104 947 -7 388 -347 096 ( 841 419)
Net Earnings group Share 441 056 66 429 119 847 29 470 573 994 1 230 796
(In thousand MAD)
3.2. ASSETS AND LIABILITIES By BUSINESS ACTIvITy
dec-14
ACTIvITy IN MOROCCO
ASSET MANAgEMENT
SPECIALISED FINANCIAL SERvICES
OTHERSINTERNATIONAL
ACTIvITIESTOTAL
TOTAL ASSETS 164 934 033 763 527 8 090 081 178 767 73 276 669 247 243 077
ASSETS ITEMS
Available for sale assets 1 569 636 132 554 17 166 21 026 3 151 045 4 891 427
Customer loans 99 370 301 179 14 867 010 0 40 915 453 155 152 943
Held to maturity assets 28 476 818 80 444 2 368 0 50 160 28 609 790
LIABILITIES & SHAREHOLDERS EqUITy ITEMS 2 317 968 0 0 0 15 835 369 18 153 337
Customer deposits 109 986 007 0 1 225 018 0 50 057 851 161 268 876
Shareholders equity 14 527 416 216 015 1 252 591 ( 41 433) 4 848 580 20 803 169(In thousand MAD)

21
dec-13
ACTIvITy IN MOROCCO
ASSET MANAgEMENT
SPECIALISED FINANCIAL SERvICES
OTHERSINTERNATIONAL
ACTIvITIESTOTAL
TOTAL ASSETS 161 135 143 362 570 14 602 647 192 495 60 403 901 236 696 756ASSETS ITEMSAvailable for sale assets 1 417 723 109 504 14 713 22 763 1 755 101 3 319 804
Customer loans 102 077 895 273 13 781 855 0 33 514 934 149 374 957
Held to maturity assets 27 649 487 47 963 48 526 450 28 223 948
LIABILITIES & SHAREHOLDERS EqUITy ITEMS 2 523 427 0 27 0 10 013 288 12 536 742
Customer deposits 102 358 798 6 204 1 240 940 0 45 184 395 148 790 337
Shareholders equity 13 839 405 137 808 1 188 659 ( 82 799) 4 060 385 19 143 458
(In thousand MAD)
3.3. BREAKDOwN OF LOANS AND RECEIvABLES
Breakdown of loans and receivables to credit institutions by geographical region
dec-14 dec-13
Performing loans NPL(*) Provisions Performing loans NPLS Provisions
Morocco 10 437 608 58 669 58 669 11 901 101 58 672 36 797
Europe 2 371 474 0 0 1 783 526 0 0
Subsaharian Africa 3 243 617 29 595 9 684 4 439 225 3 408 3 408
Total 16 052 699 88 264 68 353 18 123 852 62 080 40 205
Allocated debts
Provisions
Net Value 16 052 699 88 264 68 353 18 123 852 62 080 40 205
(In thousand MAD)
Breakdown of loans and receivables to customers by geographical region
dec-14 dec-13
Performing loans NPL(*) Provisions Performing loans NPLS Provisions
Morocco 112 108 604 7 238 376 5 109 489 114 252 061 6 267 412 4 659 448
Europe 3 323 611 173 250 117 524 1 753 262 126 165 72 824
Subsaharian Africa 36 226 993 2 959 669 1 650 547 29 660 369 3 621 749 1 573 789
Total 151 659 208 10 371 295 6 877 560 145 665 692 10 015 326 6 306 061
Allocated debts
Provisions
Net Value 151 659 208 10 371 295 6 877 560 145 665 692 10 015 326 6 306 061
(In thousand MAD)
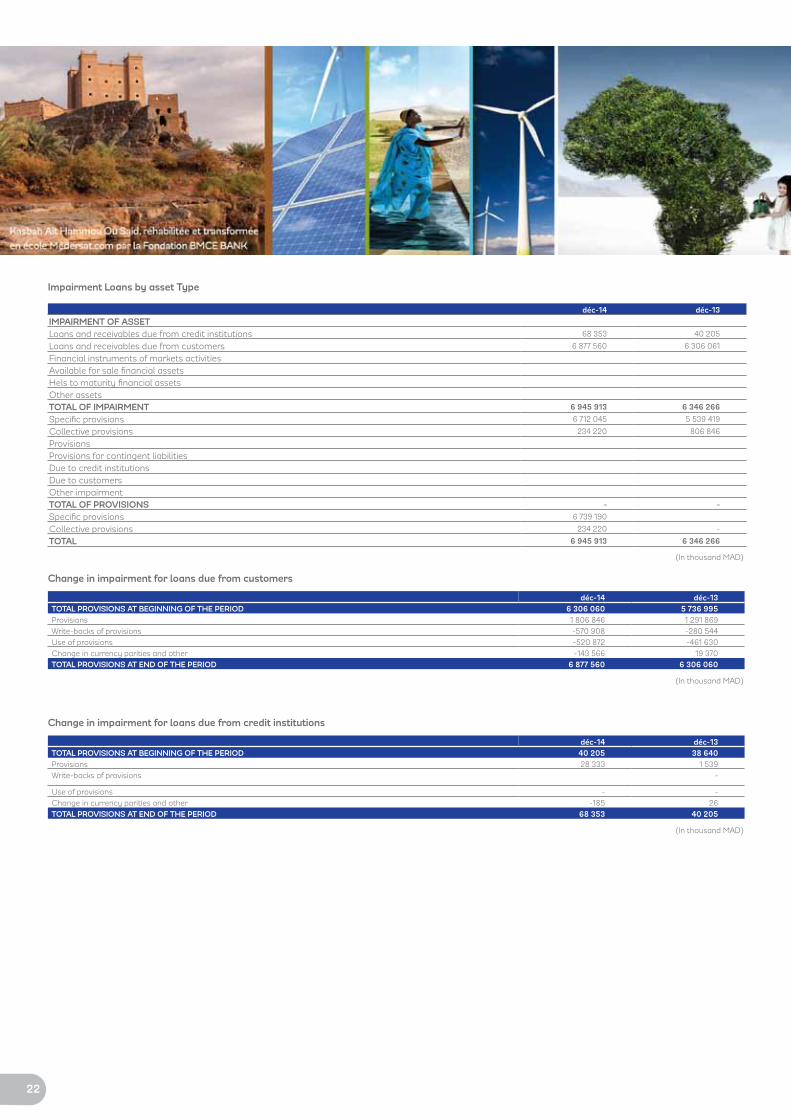
22
Impairment Loans by asset Type
déc-14 déc-13
IMPAIRMENT OF ASSETLoans and receivables due from credit institutions 68 353 40 205
Loans and receivables due from customers 6 877 560 6 306 061
Financial instruments of markets activitiesAvailable for sale financial assetsHels to maturity financial assetsOther assetsTOTAL OF IMPAIRMENT 6 945 913 6 346 266
Specific provisions 6 712 045 5 539 419
Collective provisions 234 220 806 846
ProvisionsProvisions for contingent liabilitiesDue to credit institutionsDue to customersOther impairmentTOTAL OF PROvISIONS - -
Specific provisions 6 739 190
Collective provisions 234 220 -
TOTAL 6 945 913 6 346 266
(In thousand MAD)
Change in impairment for loans due from customers
déc-14 déc-13TOTAL PROvISIONS AT BEgINNINg OF THE PERIOD 6 306 060 5 736 995Provisions 1 806 846 1 291 869
Write-backs of provisions -570 908 -280 544
Use of provisions -520 872 -461 630
Change in currency parities and other -143 566 19 370
TOTAL PROvISIONS AT END OF THE PERIOD 6 877 560 6 306 060
(In thousand MAD)
Change in impairment for loans due from credit institutions
déc-14 déc-13TOTAL PROvISIONS AT BEgINNINg OF THE PERIOD 40 205 38 640 Provisions 28 333 1 539
Write-backs of provisions -
Use of provisions - -
Change in currency parities and other -185 26
TOTAL PROvISIONS AT END OF THE PERIOD 68 353 40 205
(In thousand MAD)

23
Iv. NOTES TO THE BALANCE SHEET FOR THE yEAR ENDED 31 DECEMBER 2012
4.1. CASH, AMOUNTS DUE FROM CENTRAL BANKS, THE BANKS AND THE POST OFFICE
déc-14 déc-13Cash 3 356 387 2 887 750
CENTRAL BANKS 6 083 895 8 151 588
TREASURY 521 727 895 022
GIRO 4 738 4 731
CENTRAL BANKS, TREASURY, GIRO 6 610 360 9 051 341
Cash, Central Banks, Treasury, giro 9 966 747 11 939 091
(In thousand MAD)
4.2. ASSETS AND LIABILITIES AT FAIR vALUE THROUgH PROFIT OR LOSS
Financial assets and liabilities recognised at fair value through income consist of negotiated transactions for trading purposes.
déc-14 déc-13
Trading bookAssets designated
at fair value through profit or loss
Total Trading bookAssets designated
at fair value through profit or loss
Total
FINANCIAL ASSETS AT FAIR VALUE THROUGH PROFIT OR LOSS
Negotiable certificates of deposits 6 716 504 0 6 716 504 9 112 323 0 9 112 323
Treasury bills and other eligible for central bank refinancing 3 916 944 3 916 944 6 508 218 6 508 218
Other negotiable certificates of deposits 2 799 560 2 799 560 2 604 105 2 604 105
Bonds 190 047 0 190 047 459 108 0 459 108
Government bonds 0 0
Other bonds 190 047 190 047 459 108 459 108
Equities and other variable income securities 21 722 365 0 21 722 365 18 649 052 0 18 649 052
Repurchase agreements 0 0 0 0 0 0
Loans 0 0 0 0 0 0
To credit institutions
To corporate customers
To private individual customers
Trading Book Derivatives -19 126 0 -19 126 3 465 0 3 465
Currency derivatives -19 703 -19 703 2 888 2 888
Interest rate derivatives 577 577 577 577
Equity derivatives
Credit derivatives
Other derivatives
TOTAL FINANCIAL ASSETS AT FAIR vALUE THROUgH PROFIT OR LOSS
28 609 790 0 28 609 790 28 223 948 0 28 223 948
Of which loaned securities
Excluding equities and other variable-income securities
FINANCIAL LIABILITIES AT FAIR VALUE THROUGH PROFIT OR
LOSS
Borrowed securities and short selling
Repurchase agreements
Borrowings 0 2 696 352 2 696 352 0 2 430 244 2 430 244
Credit institutions 2 696 352 2 696 352 2 430 244 2 430 244
Corporate customers
Debt securities
Trading Book Derivatives 49 296 0 49 296 7 250 0 7 250
Currency derivatives 49 296 49 296 7 250 7 250
Interest rate derivatives 0 0
Equity derivatives 0 0
Credit derivatives
Other derivatives
TOTAL FINANCIAL LIABILITIES AT FAIR vALUE THROUgH PROFIT OR LOSS
49 296 2 696 352 2 745 648 7 250 2 430 244 2 437 494
(In thousand MAD)

24
4.3. AvAILABLE-FOR-SALE FINANCIAL ASSETS
Available-for-sale financial assets are non-derivative financial assets other than those classified as:
a) Loans and receivables;
b) Held-to-maturity financial assets;
c) Financial assets at fair value through profit or loss.
déc-14 déc-13Negotiable certificates of deposit 0 0Treasury bills and other bills eligible for central bank refinancing
Other negotiable certificates of deposit
Bonds 0 0Government bonds
Other bonds
Equities and other variable-income securities 5 299 792 3 618 023Of which listed securities 325 463 125 195
Of which unlisted securities 4 974 329 3 492 828
Total available-for-sale financial assets, before impairment provisions 5 299 792 3 618 023Of which unrealized gains and losses -408 365 -298 219Of which fixed-income securities
Of which loaned securities -408 365 -298 219
Total available-for-sale financial assets, net of impairment provisions 4 891 427 3 319 804Of which fixed-income securities, net of impairment provisions
(In thousand MAD)
4.4. INTERBANK TRANSACTIONS, RECEIvABLES AND AMOUNTS DUE FROM CREDIT INSTITUTIONS
Loans and receivables due from credit institutions
déc-14 déc-13Demand accounts 3 923 290 4 630 305
Loans 12 169 796 13 362 300
Repurchase agreements 47 877 193 327
Total loans and receivables due from credit institutions, before impairment provisions 16 140 963 18 185 932Provisions for impairment of loans and receivables due from credit institutions -68 353 -40 205
Total loans and receivables due from credit institutions, net of impairment provisions 16 072 610 18 145 727
(In thousand MAD)
Amounts due to credit institutions
déc-14 déc-13Demand accounts 2 254 051 1 723 359
Borrowings 26 604 762 18 429 985
Repurchase agreements 4 284 165 14 915 371
Total Due to Credit Institutions 33 142 978 35 068 715
(In thousand MAD)

25
4.5. LOANS, RECEIvABLES AND AMOUNTS DUE FROM CUSTOMERS
Loans and receivables due from customers
déc-14 déc-13Demand accounts 24 271 477 21 263 162
Loans to customers 116 381 173 107 613 766
Repurchase agreements 9 467 823 15 707 669
Finance leases 11 910 030 11 096 420
Total loans and receivables due from customers, before impairment provisions 162 030 503 155 681 017Impairment of loans and receivables due from customers -6 877 560 -6 306 060
Total loans and receivables due from customers, net of impairment provisions 155 152 943 149 374 957
(In thousand MAD)
Breakdown of amounts due from customers by business activity
déc-14 déc-13Activity in Morocco 99 346 209 102 077 889
Specialized Financial Services 14 867 010 13 781 855
International Activities 40 939 545 33 514 940
Asset Management 179 273
Other Activities 0 0
Total 155 152 943 149 374 957Allocated Debts
Value at Balance sheet 155 152 943 149 374 957
(In thousand MAD)
Breakdown of amounts due from customers by geographical region
déc-14 déc-13Morocco 114 213 398 115 860 017
Sub saharan Africa 37 560 208 31 708 337
Europe 3 379 337 1 806 603
Total 155 152 943 149 374 957Allocated Debts
value at Balance sheet 155 152 943 149 374 957
(In thousand MAD)
Amounts due to customers
déc-14 déc-13On demand deposits 89 254 190 83 808 102
Term accounts 35 948 532 32 738 282
Savings accounts 19 993 183 18 930 245
Cash certificates 4 488 643 4 144 400
Repurchase agreements 3 246 264 1 166 600
Other items 8 338 064 8 002 708
TOTAL LOANS AND RECEIvABLES DUE TO CUSTOMERS 161 268 876 148 790 337
(In thousand MAD)
Breakdown of amounts due to customers by business activity
déc-14 déc-13Activity in Morocco 109 986 007 102 358 798
Specialized Financial Services 1 225 018 1 240 940
International Activities 50 057 851 45 184 395
Asset Management 0 6 204
Other Activities 0 0
Total 161 268 876 148 790 337Allocated Debts
value at Balance sheet 161 268 876 148 790 337
(In thousand MAD)

26
Breakdown of amounts due to customers by geographical region
déc-14 déc-13Morocco 111 211 025 103 605 942
Sub saharan Africa 48 544 736 43 577 634
Europe 1 513 115 1 606 761
Total 161 268 876 148 790 337Allocated Debts
value at Balance sheet 161 268 876 148 790 337
(In thousand MAD)
4.6. DEBT SECURITIES, SUBORDINATED DEBT AND SPECIAL gUARANTEE FUNDS
déc-14 déc-13Other debt securities 13 170 353 12 451 775 Negotiable certificates of deposit 13 170 353 12 451 775
Bond issues
Subordinated debts 6 568 309 5 574 256Subordinated debt 6 568 309 5 574 256
Redeemable subordinated debt 4 568 309 2 788 120
Undated subordinated debt 2 000 000 2 786 135
Subordinated Notes 0 0 Redeemable subordinated notes
Undated subordinated notes 0 0
Public Funds and special guarantee funds 226 995 241 405Total 19 965 657 18 267 436
(In thousand MAD)
Special purpose public funds and special guarantee funds only relate to BOA Group.
They are non-repayable funds aimed at subsidising lending rates and provisioning for credit losses in specific sectors and business activities.
4.7. HELD-UNTIL-MATURITy FINANCIAL ASSETS
déc-14 déc-13Negotiable certificates of deposit 17 494 319 11 542 243Treasury bills and other bills eligible for central bank refinancing 16 991 008 11 523 934
Other negotiable certificates of deposit 503 311 18 309
Bonds 659 018 994 499Government bonds
Other bonds 659 018 994 499
Total held-to-maturity financial assets 18 153 337 12 536 742
(In thousand MAD)
4.8. CURRENT AND DEFERRED TAxES
déc-14 déc-13Current taxes 199 008 92 432
Deferred taxes 445 733 257 635
Current and deferred tax assets 644 741 350 067Current taxes 55 341 94 368
Deferred taxes 1 099 810 989 759
Current and deferred tax liabilities 1 155 151 1 084 127
(In thousand MAD)

27
4.9. ACCRUED INCOME AND ExPENSES, OTHER ASSETS AND LIABILITIES
déc-14 déc-13Guarantee deposits and bank guarantees paid 117 027 96 643
Settlement accounts related to securities transactions 46 853 12 402
Collection accounts 426 519 383 861
Reinsurers' share of technical reserves
Accrued income and prepaid expenses 388 464 473 081
Other debtors and miscellaneous assets 3 532 614 3 115 401
Inter-related Accounts 467 374 236 045
TOTAL ACCRUED INCOME AND OTHER ASSETS 4 978 851 4 317 433 Guarantee deposits received 29 033 57 478
Settlement accounts related to securities transactions 2 017 148 6 310 266
Collection accounts 1 209 401 869 224
Accrued expenses and deferred income 621 937 617 785
Other creditors and miscellaneous assets 3 759 050 3 525 610
TOTAL ACCRUED ExPENSES AND OTHER LIABILITIES 7 636 569 11 380 363
(In thousand MAD)
4.10. INvESTMENTS IN COMPANIES ACCOUNTED FOR UNDER THE EqUITy METHOD
déc-14 déc-13Euler Hermes Acmar 19 577 27 374
Banque de Développement du Mali 275 226 248 290
Eurafric Information -7 954 -6 692
Société Conseil Ingénierie et Développement 150 475 132 485
Inverstments in equity methods companies belonging to subsidiaries 76 442 64 469
Investments in associates 513 766 472 623
(In thousand MAD)
Financial data of the main companies accounted for under the equity method
Total Assets Net Banking Income or Net
Revenues Company Income Net income
Euler Hermes Acmar 553 139 144 171 12 481 2 496
Banque de Développement du Mali 7 685 083 523 743 183 652 51 096
Eurafric Information 173 166 191 348 900 -1 145
Société Conseil Ingenierie et Développement 607 503 279 118 64 116 24 902
(In thousand MAD)

28
4.11. PROPERTy, PLANT AND EqUIPMENT AND INTANgIBLE ASSETS USED IN OPERATIONS AND INvESTMENT PROPERTy
déc-14 déc-13
gross value
Accumulated depreciation
amortization and impairment
Carrying Amount gross value
Accumulated depreciation
amortization and impairment
Carrying Amount
PP&E 10 437 505 4 590 430 5 847 075 9 674 496 4 208 727 5 465 769Land and buildings 2 036 095 454 328 1 581 767 1 751 061 521 905 1 229 154
Equipment, furniture and fixtures 3 871 866 1 687 683 2 184 183 3 702 800 1 547 661 2 155 139
Plant and equipment leased as lessor under operating leases 0 0 0 0 0 0
Other PP&E 4 529 544 2 448 419 2 081 475 4 220 635 2 139 161 2 081 475
Intangible Assets 1 711 352 967 079 744 273 1 536 277 765 755 770 522Purchased software 1 045 026 563 703 514 944 935 657 420 712 514 944
Internally-developed software 0 0 0 0 0 0
Other intangible assets 666 326 403 376 255 577 600 620 345 043 255 577
Investment Property 941 187 106 140 835 047 1 037 034 89 432 947 602
(In thousand MAD)
Change in property, plant and equipment
déc-14 déc-13Net value as of January, 1st 5 465 769 5 131 528Acquisition of the year 897 659 832 766
- -
Depreciation, Amortization of impaiment (471 483) (479 097)
Disposal of the year (85 430) (66 192)
Reclassifications 40 560 46 764Net Value at end of periode 5 847 075 5 465 769
(In thousand MAD)
Change in intangible assets
déc-14 déc-13Net value as of January, 1st 770 522 751 455Acquisition of the year 165 550 250 098
- -
Depreciation, Amortization of impaiment (173 581) (175 559)
Disposal of the year (79 465) (18 394)
Reclassifications 61 247 (37 078)
Net Value at end of periode 744 273 770 522
(In thousand MAD)
4.12. gOODwILL
déc-14 déc-13Gross value at start of period 832 470 832 470Accumulated impairment at start of period
Carrying amount at start of period 832 470 832 470Acquisitions
Cessions
Impairment losses recognized during the period
Translation adjustments
Subsidiaries previously accounted for by the equity method
Other movements 0 0
Gross value at end of period 832 470 832 470Accumulated impairment at end of period
Carrying amount at end of period 832 470 832 470(In thousand MAD)

29
The following table provides a breakdown of goodwill:
2014 book value
2013 book value
Maghrébail 10 617 10 617
Banque de Développement du
Mali
3 588 3 588
Salafin 5 174 5 174
Maroc Factoring 1 703 1 703
BMCE Capital Bourse 2 618 2 618
BMCE International (Madrid) 3 354 3 354
Bank Of Africa 692 136 692 136
Locasom 98 725 98 725
CID 14 555 14 555
TOTAL 832 470 832 470
goodwill impairment tests
The recoverable amount of a cash-generating unit has been determined on the basis of value in use.
An intrinsic value approach has been adopted to determine value in use at BOA and Locasom as follows:
- At BOA, the “dividend discount model” (hereafter, the “DDM”) has been adopted. This is a standard method used by the banking industry to deter-mine an activity’s value by reference to the net present value of dividends that the activity is likely to generate in the future. The value thus calcu-lated corresponds to the value in shareholders’ equity;
- At Locasom, the “discounted cash flow method” (hereafter, the “DCF” method) has been adopted. This is a standard method used by the ser-vices sector to determine an activity’s value by reference to the net pres-ent value of available cash flows that the activity is likely to generate in the future. The value thus calculated corresponds to enterprise value.
Cash-flow projections are based on financial estimates over a three-year period approved by management.
Bank Of Africa Locasom% %
Discount rate 18% 8.5%Growth rate 2% 3%
A certain number of assumptions of estimated net banking income, the cost-to-income ratio, the costs of risk and risk-weighted assets (hereafter, “RWA”) underpin the DDM, which is used to determine recoverable value. These are taken from medium-term (3-year) business plans for the first three years, representing the duration of the economic cycle to which the banking industry is sensitive and then in perpetuity, based on sustainable growth rates to calculate terminal value.
Key cash flow variables are EBITDA and the operating margin which underpin the DCF method. This is a standard method used by the services sector to determine an activity’s value by reference to the net present value of available cash flows that the activity is likely to generate in the future. The value thus calculated corresponds to enterprise value.
Discount rate
The indirect approach has been used to determine the cost of capital. The indirect approach consists of adjusting the cost of capital of a reference country (France) by a country risk factor, reflecting the specific risks
relating to the economic, political, institutional and financial conditions of the country in which the company has its operations.
BOA’s cost of capital has been determined on the basis of the observed average discount rate, calculated by weighting the discount rate of each bank by net banking income, in each of the countries in which BOA has operations. The discount rate ranges from 16% to 18% for BOA and from 7% to 8.5% for Locasom.
growth rate
BOA’s business forecasts have been prepared using the CFA Franc. The CFA Franc is guaranteed by the French Treasury and has a fixed exchange rate against the euro. As a result, the long-term growth rate adopted by BOA is 2%, in line with estimates of inflation in France.
Locasom’s growth rate has been set at 3%, in line with assumptions for the rate of growth of its sector in Morocco.
Regulatory capital requirements
BOA’s risk weighted assets must satisfy Core Tier One regulatory capital requirements over the entire period for which BOA has made estimates.
Net banking income
Estimates of net banking income have been made on the basis on the currently low level of bank penetration in Africa and, as a result, the strong growth potential.
EBITDA
Estimates of EBITDA and operating margins have been made on the basis of historical data.
Cost-to-income ratio
Estimates of the cost-to-income ratio are highly correlated with growth in expenses, particularly those relating to the opening of branches, which are required in order to attract new customers.
Sensitivity to changes in assumptions
BANK OF AFRICA
Cost of Capital 18%
Unfavorable change of 200 basis points
-1 191 520
Favorable change of 200 basis points 1 544 765
LOCASOM
Cost of Capital 8.50%
Unfavorable change of 150 basis points
-163 645
Favorable change of 150 basis points 350 072
For the cash-generating units in question, there is no reason to amortise goodwill, even after factoring in, for impairment tests, the most adverse change in the cost of capital, considered by management to be the assumption most sensitive to any reasonable change.
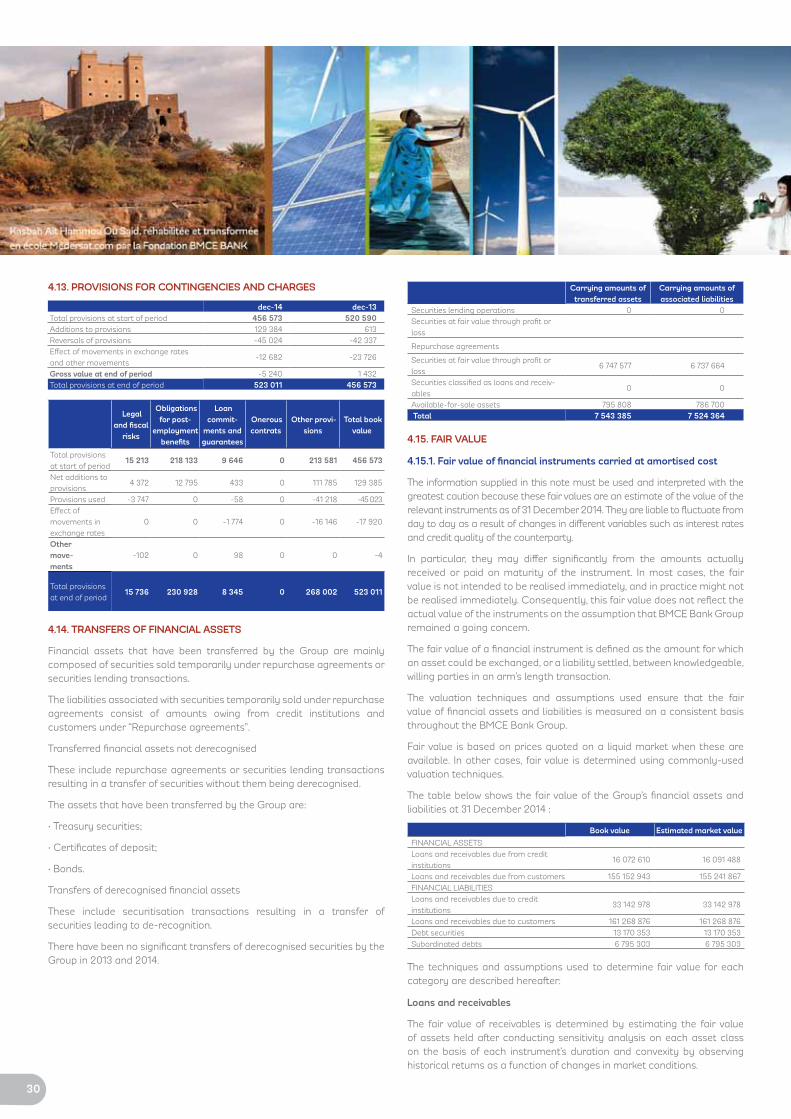
30
4.13. PROvISIONS FOR CONTINgENCIES AND CHARgES
dec-14 dec-13Total provisions at start of period 456 573 520 590Additions to provisions 129 384 613
Reversals of provisions -45 024 -42 337
Effect of movements in exchange rates
and other movements-12 682 -23 726
gross value at end of period -5 240 1 432
Total provisions at end of period 523 011 456 573
Legal and fiscal
risks
Obligations for post-
employment benefits
Loan commit-
ments and guarantees
Onerous contrats
Other provi-sions
Total book value
Total provisions
at start of period15 213 218 133 9 646 0 213 581 456 573
Net additions to
provisions4 372 12 795 433 0 111 785 129 385
Provisions used -3 747 0 -58 0 -41 218 -45 023
Effect of
movements in
exchange rates
0 0 -1 774 0 -16 146 -17 920
Other move-ments
-102 0 98 0 0 -4
Total provisions
at end of period15 736 230 928 8 345 0 268 002 523 011
4.14. TRANSFERS OF FINANCIAL ASSETS
Financial assets that have been transferred by the Group are mainly composed of securities sold temporarily under repurchase agreements or securities lending transactions.
The liabilities associated with securities temporarily sold under repurchase agreements consist of amounts owing from credit institutions and customers under “Repurchase agreements”.
Transferred financial assets not derecognised
These include repurchase agreements or securities lending transactions resulting in a transfer of securities without them being derecognised.
The assets that have been transferred by the Group are:
• Treasury securities;
• Certificates of deposit;
• Bonds.
Transfers of derecognised financial assets
These include securitisation transactions resulting in a transfer of securities leading to de-recognition.
There have been no significant transfers of derecognised securities by the Group in 2013 and 2014.
Carrying amounts of transferred assets
Carrying amounts of associated liabilities
Securities lending operations 0 0
Securities at fair value through profit or
loss
Repurchase agreements
Securities at fair value through profit or
loss6 747 577 6 737 664
Securities classified as loans and receiv-
ables0 0
Available-for-sale assets 795 808 786 700
Total 7 543 385 7 524 364
4.15. FAIR vALUE
4.15.1. Fair value of financial instruments carried at amortised cost
The information supplied in this note must be used and interpreted with the greatest caution because these fair values are an estimate of the value of the relevant instruments as of 31 December 2014. They are liable to fluctuate from day to day as a result of changes in different variables such as interest rates and credit quality of the counterparty.
In particular, they may differ significantly from the amounts actually received or paid on maturity of the instrument. In most cases, the fair value is not intended to be realised immediately, and in practice might not be realised immediately. Consequently, this fair value does not reflect the actual value of the instruments on the assumption that BMCE Bank Group remained a going concern.
The fair value of a financial instrument is defined as the amount for which an asset could be exchanged, or a liability settled, between knowledgeable, willing parties in an arm’s length transaction.
The valuation techniques and assumptions used ensure that the fair value of financial assets and liabilities is measured on a consistent basis throughout the BMCE Bank Group.
Fair value is based on prices quoted on a liquid market when these are available. In other cases, fair value is determined using commonly-used valuation techniques.
The table below shows the fair value of the Group’s financial assets and liabilities at 31 December 2014 :
Book value Estimated market value
FINANCIAL ASSETS
Loans and receivables due from credit
institutions16 072 610 16 091 488
Loans and receivables due from customers 155 152 943 155 241 867
FINANCIAL LIABILITIES
Loans and receivables due to credit
institutions33 142 978 33 142 978
Loans and receivables due to customers 161 268 876 161 268 876
Debt securities 13 170 353 13 170 353
Subordinated debts 6 795 303 6 795 303
The techniques and assumptions used to determine fair value for each category are described hereafter:
Loans and receivables
The fair value of receivables is determined by estimating the fair value of assets held after conducting sensitivity analysis on each asset class on the basis of each instrument’s duration and convexity by observing historical returns as a function of changes in market conditions.

31
In the absence of a market yield curve reflecting actual rates along the different segments of the curve, average yields on origination for the financial year in question have been used as indicative of actual market rates.
In the case of loans and receivables that have a maturity of less than one year (demand liabilities) or are granted on floating-rate terms, fair value equates to the carrying amount due to their limited sensitivity to changes in rates or by the simple fact that they are granted on the basis of actual market conditions.
Loans and receivables due from credit institutions
Loans and receivables due from credit institutions totalled MAD 18.1 billion with a fair value close to the carrying amount. This is due to the predominance of short-term money market transactions (in the form of cash loans, interbank loans and repurchase agreements).
Outstandings of loans to finance companies totalled MAD 8.1 billion, amortisable over a short period, with a fair value that is MAD 3.6 million higher than the carrying amount.
Loans and receivables due from customers
Outstandings of loans and receivable due from customers totalled MAD 149 billion at 31 December 2013, consisting primarily of cash loans, overdraft facilities and floating rate loans.
Outstandings of fixed-rate loans primarily consist of consumer loans amortisable over a short period (average maturity 2.3 years) and fixed-rate mortgage loans amortisable over an average period of almost 7 years.
The sensitivity analysis of the Bank’s fixed rate loan book (with outstandings of nearly 30.2 billion MAD) shows a faire value that is 180 million MAD higher than the carrying amount.
Financial liabilities
In the case of financial liabilities that have a maturity of less than one year (demand liabilities) or are granted on floating-rate terms, or for an indefinite period (as is the case for perpetual subordinated debt) as well as most regulated savings products, fair value equates to the carrying amount.
Amounts due to credit institutions
Amounts due to credit institutions totalled MAD 35 billion and are recognised at their carrying amount. They consist primarily of short-term cash borrowing transactions in the form of 7-day advances from the Central Bank amounting to almost MAD 14 billion in outstandings, interbank borrowings and borrowings from local banks or foreign correspondent banks in addition to repurchase agreements.
Amounts due to customers
Amounts due to customers totalled MAD 149 million, consisting primarily of non-interest-bearing sight deposits in the form of cheque accounts, current accounts in credit and immediate-access regulated savings account.
Repurchase agreements with customers, particularly in respect of mutual funds, are also recognised under “Amounts due to customers”.
Outstandings of term deposits totalled MAD 26 billion, with an average maturity of less than one year consisting due to the predominance of
3-month, 6-month and 12-month maturities.
In the case of customer term deposits, fair value equates to the carrying amount.
Debt securities
Outstandings of debt securities totalled MAD 12,4 billion, consisting primarily of certificates of deposit issued by the Bank with predominantly 3-month, 6-month and 12-month maturities.
In the case of debt securities, fair value equates to the carrying amount.
Subordinated debt
Outstandings of subordinated debt, which totalled MAD 5.8 billion, are recognised at the carrying amount due to the predominance of floating-rate issues and perpetual subordinated debt outstandings.
4.15.2. Breakdown by measurement method of financial instruments re-cognised at fair value presented in accordance with IFRS 7 recommen-dations
Fair value measurement of financial instruments
Financial instruments measured at fair value are classified at three levels
in accordance with IFRS 7 :
2014Level 1 Level 2 Level 3 Total
FINANCIAL ASSETS
Financial instruments at-
fair-value through profit
or loss held for trading
28 609 790 - - 28 609 790
of which financial assets
at-fair-value through
profit or loss
28 609 790 28 609 790
of which derivative finan-
cial instruments -
Financial instruments designated as at-fair-value through profit or loss
-
Derivatives used for
hedging purposes -
Available for sale finan-
cial assets 325 463 4 565 963 4 891 427
FINANCIAL LIABILITIES
Financial instruments at-
fair-value through profit
or loss held for trading
2 745 648 - - 2 745 648
of which financial assets
at-fair-value through
profit or loss
2 696 352 2 696 352
of which derivative finan-
cial instruments 49 295 49 295
Financial instruments
designated as at-fair-
value through profit
or loss
Derivatives used for
hedging purposes
• Level 1
Quoted prices on liquid markets for identical assets or liabilities :

32
This level includes financial instruments with quoted prices in a liquid market that can be used directly.
For BMCE Bank Group, it includes listed equities, mutual funds, bonds and Treasury bonds.
• Level 2
Observable inputs other than Level 1 quoted prices for the asset or liability in question either directly (prices) or indirectly (price-derived inputs):
This level includes financial instruments quoted on markets considered insufficiently liquid as well as those traded on over-the-counter markets. Prices published by an external source, derived from the measurement of similar instruments, are considered to be price-derived inputs.
The Group does not have any financial instruments measured at Level 2.
• Level 3
Inputs relating to the asset or liability that are not based on observable market data (non-observable inputs:
Given the diversity of instruments and the reasons for including them in this category, calculating the sensitivity of fair value to changes in variables would appear to be of little relevance.
This level includes unlisted equities valued by various methods including the net carrying amount, net adjusted asset value, net asset value, stock market multiples and equity issue pricing.
v / FINANCINg AND gUARANTEE COMMITMENTS
5.1. FINANCINg COMMITMENTS
dec-14 dec-13Financing commitments given 10 122 682 15 467 096 - To credit institutions 1 257 036 1 356 425
- To customers: 8 865 646 14 110 671
Confirmed letters of credit
Other commitments given to
customers
Financing commitments received 2 347 719 2 897 232 From credit institutions 2 347 719 2 897 232
From customers - -
- Financing commitments given to credit and similar institutions
This entry relates to commitments to make liquidity facilities available to other credit institutions such as refinancing agreements and back-up commitments on securities issuance.
- Financing commitments given to customers
This entry relates to commitments to make liquidity facilities available to customers such as confirmed credit lines and commitments on securities issuance.
- Financing commitments received from credit and similar institutions
This entry relates to financing commitments received from credit and similar institutions such as refinancing agreements and back-up commitments on securities issuance.
Financing commitments rose by -34.5% from MAD 15,467 million at 31 December 2013 to MAD 10 123 million at 31 December 2014. Similarly, financing commitments almost doubled from 2,897 million to MAD 2,348 million.
5.2. gUARANTEE COMMITMENTS
31-dec-14 31-dec-13
guarantee commitments given 21 930 665 21 576 455
To credit institutions 5 885 648 6 646 676
To customers : 16 045 017 14 929 778
Sureties provided to tax and other authori-
ties, other sureties
Other guarantees
guarantee commitments received 52 736 107 44 459 136
From credit institutions 51 735 698 43 550 070
From the State and guarantee institutions 1 000 409 909 066
- Guarantee commitments given to credit and similar institutions
This entry relates to commitments to assume responsibility for an obligation entered into by a credit institution if the latter is not satisfied with it. This includes guarantees, warranties and other guarantees given to credit and similar institutions.
- Guarantee commitments given to customers
This entry relates to commitments to assume responsibility for an obligation entered into by a customer if the latter is not satisfied with it. This includes guarantees given to government institutions and real estate guarantees, among others.
- Guarantee commitments received from credit and similar institutions
This entry includes guarantees, warranties and other guarantees received from credit and similar institutions.
- Guarantee commitments received from the State and other organisa-tions
This entry relates to guarantees received from the State and other organisations.
Guarantee commitments rose by 2% from MAD 21,576 million at 31 December 2013 to MAD 21,931 million at 31 December 2014, while guarantee commitments received rose by 18.62% from MAD 44,459 million to MAD 52,736 million.
vI / SALARy AND EMPLOyEE BENEFITS
6.1. DESCRIPTION OF CALCULATION METHOD
Employee benefits relate to long-service awards and end-of-career bonuses.
The method used for calculating the liability relating to both these benefits is the “projected unit credit” method as recommended by IAS 19.
- Caisse Mutualiste Interprofessionnelle Marocaine (CMIM) scheme
The Caisse Mutualiste Interprofessionnelle Marocaine (CMIM) is a private mutual insurance company. The company reimburses employees for a portion of their medical, pharmaceutical, hospital and surgical expenses. It is a post-employment scheme providing medical cover for retired employees.
The CMIM is a multi-employer scheme. As BMCE Bank is unable to determine its share of the overall liability (as is the case for all other CMIM members), under IFRS, expenses are recognised in the year in which they are incurred. No provision is recognised in respect of this scheme.

33
6.2. SUMMARy OF PROvISIONS AND DESCRIPTION OF ExISTINg SCHEMES
6.2.1. Provisions in respect of post-employment and other long-term benefits provided to employees
dec-14 dec-13
Retirement allowances and equivalents 230 928 218 134
Special seniority premiums allowances
Other
TOTAL 230 928 218 134
NB: The provision for employee benefits calculated in accordance with IAS 19 is recognised in “Provisions for risks and charges” under liabilities.
6.2.2. Basic assumptions underlying calculations
dec-14 dec-13
Discount rate 5,60% 5,60%
Rate of increase in salaries 3% 3%
Expected return on assets N/A N/A
Other 11% 11%
6.2.3. Cost of post-employment schemes
dec-14 dec-13Normal cost 16 644 17 558
Interest cost 11 689 10 045
Expected returns of funds
Amortization of actuarial gains/ losses
Amortization of net gains/ losses
Additional allowances 28 334 27 603
Other
Net cost of the period
6.2.4. Changes in the provision recognised on the balance sheet
dec-14 dec-13
Actuarial liability, beginning of the period 218 134 232 869
Normal cost 16 644 17 558
Interest cost 11 689 10 045
Experience gains/ losses - -23 518
Other actuarial gains/ losses
Depreciation of net gains/losses -
Paid benefits -15 539 -18 820
Additional benefits
Other
Actuarial liability, end of the period 230 928 218 134
6.3. SHARE-BASED PAyMENTS
6.3.1. Share purchase plan
BMCE Bank has established a share-based payment scheme for its em-ployees in the form of a share purchase plan.
Approved by an Extraordinary General Meeting of 10 November 2010 and the regulatory authorities, an increase in the Bank’s share capital in De-cember 2010 resulted in the issue of 2,500,000 new shares, representing almost 1.5% of its share capital, at a share price of 200 dirhams, inclusive of share premium.
This offering follows two public offers, exclusively for employees, in 2003 and 2005, aimed at enabling employees to participate in the success and growth of BMCE Bank Group.
There was no allotment of shares under the share purchase plan in 2013 and 2014.
6.3.2. Cost of share-based payments
2014 2013
Overall expense of the equity incentive plan 18 211 43 456
Principles for valuing share purchase plans
As required under IFRS 2, BMCE Bank values the fair value of shares granted to employees at adjusted market value in order to take into consideration the characteristics and conditions in respect of share allotment. This measurement gives rise to recognition of a general expense which is spread over the vesting period.
2010BMCE BANK share price on the grant date 234Option exercise price 200Implied volatility of BMCE BANK shares 18%Risk-free interest rate 4,00%
Maturity3 years for the first half and four years for the
remaining
vII / ADDITIONAL INFORMATION
7.1. CHANgES IN SHARE CAPITAL AND EARNINgS PER SHARE
7.1.1. Share capital transactions
TRANSACTIONS ON CAPITAL In numberUnit
valueIn MAD
Number of shares outstanding
at 31 December 2011 171 963 390 10 1 719 633 900
Number of shares outstanding
at 31 December 2012 171 963 390 10 1 719 633 900
Number of shares outstanding
at 31 December 2013 179 463 390 10 1 794 633 900
Number of shares outstanding
at 31 December 2014 179 463 390 10 1 794 633 900
7.1.2. Earnings per share
Basic earnings per share is calculated by dividing the net income for the
period attributable to holders of ordinary share s by the weighted average
number of ordinary shares outstanding during the period.
dec-14 dec-13SHARE CAPITAL (IN MAD) 1 794 633 900 1 794 633 900
Number of common shares
outstanding during the year
179 463 390 179 463 390
NET INCOME ATTRIBUTABLE TO THE
SHARHOLDER’S OF THE PARENT (IN MAD)
1 943 864 261 1 230 795 682
BASIC ERNINGS PER SHARE (IN MAD) 10,83 6,9
DILUTED EARNING PER SHARE (IN MAD) 10,83 6,9
The Bank does not have any dilutive instruments for conversion into
ordinary shares. As a result, diluted earnings per share equates to basic
earnings per share.

34
7.2. SCOPE OF CONSOLIDATION
Company Activity% of
voting interests
% of ownership interests
Method
BMCE BANK Banque Parent Company
BMCE CAPITAL Banque d'Affaires 100,00% 100,00% Full Consolidation
BMCE CAPITAL GESTION Gestion d'actifs 100,00% 100,00% Full Consolidation
BMCE CAPITAL BOURSE Intermédiation
boursière 100,00% 100,00% Full Consolidation
MAROC FACTORING Factoring 100,00% 100,00% Full Consolidation
MAGHREBAIL Crédit-Bail 51,00% 51,00% Full Consolidation
SALAFIN Crédit à la
consommation 74,76% 74,76% Full Consolidation
BMCE EUROSERVICES Ets financier 100,00% 100,00% Full Consolidation
LA CONGOLAISE DES
BANQUES Banque 25,00% 25,00% Full Consolidation
BMCE BANK
INTERNATIONAL
HOLDING
Banque 100,00% 100,00% Full Consolidation
BANK OF AFRICA Banque 72,70% 72,70% Full Consolidation
LOCASOM Location de
voiture 100,00% 97,30% Full Consolidation
RM EXPERTS Recouvrement 100,00% 100,00% Full Consolidation
BANQUE DE
DEVELOPPEMENT DU
MALI
Banque 27,38% 27,38% Equity Method
EULER HERMES ACMAR Assurance 20,00% 20,00% Equity Method
EURAFRIC INFORMATION Informatique 41,00% 41,00% Equity Method
CONSEIL INGENIERIE ET
DEVELOPPEMENT Bureau d'études 38,90% 38,90% Equity Method
7.3. COMPENSATION PAID TO THE MAIN ExECUTIvE CORPORATE OF-FICERS
Remuneration paid to the main directors
By “main directors” is meant the members of the bank’s general management team.
dec-14 dec-13Short-term benefits 18 975 21 288
Post-employment benefits 302 581
Other long-term benefits 4 264 5 536
Short-term benefits relate to the fixed remuneration inclusive of social
security contributions received by the main Executive Corporate Officers
in respect of the 2013 financial year.
Post-employment benefits relate to end-of-career bonuses and other
long-term benefits relate to long-service awards.
Directors’ fees paid to members of the board of directors
31/12/14 31/12/13
gross Amount
with holding
tax
Net amount
paid
gross amout
Tax with holding
Net amount
paidNatural and legal persons
Resident in Morocco 1 291 318 973 1 212 312 900
Physical and legal persons
non Resident in Morocco 254 38 216 333 33 300
TOTAL 1 545 356 1 190 1 546 346 1 200
Loans granted to the main Executive Corporate Officers
dec-14 dec-13Consumer loans 2 141 1 759 Mortgage loans 16 791 16 001 Total 18 931 17 759
7.4. RELATIONS wITH RELATED PARTIES
Relations between BMCE Bank and fully-consolidated companies and the parent company
Transactions and period-end balances between fully-consolidated entities are of course eliminated. Period-end balances resulting from transactions between companies accounted for under the equity method and the parent company are maintained in the consolidated financial statements.
Related-party balance sheet items
Parent com-
pany (FI-NANCE COM)
Sister Compa-
nies
Con-solidated entities
under the propor-tionale method
Con-solidated entities under
the equity
method
Fully con-
solidated entities
Assets
Loans, advances and securities 777 740 4 138 263 50 133 12 185 482 8 960 910 Demand accounts 777 740 1 565 498 29 791 9 669 763 3 526 878
Loans 582 474 20 342 324 427 1 892 863
Securities 1 990 291 2 191 292 3 541 169
Finance Leases
Other Assets 11 107 444 311 Total 777 740 4 138 263 50 133 12 196 589 9 405 221 Liabilities
Deposits - 1 060 186 - 9 795 037 5 036 253 Demand accounts 675 186 9 678 607 4 785 499
Other borrowings 385 000 116 430 250 754
Debt securities 2 254 822 3 508 809 Other liabilities 146 730 860 159 Total - 1 060 186 - 12 196 589 9 405 221 Financing Commitments &
Guarantee CommitmentsFinancing commitments given 1 067 554 879 154
Guarantee commitments given 1 067 581 879 154
Related-party income statement items
Consoli-dated entities
under the proportionate
method
Consolidated entities under
the equity method
Consoli-dated entities under the full consolidation
method
Entreprises consolidées par mise en équivalence
Entreprises consolidées
par intégration gobale
Interest
income-55 761 -45 363 -6 588 -354 827 -258 736
Interest
expense 424 084 272 127
Commission
income-49 826 -257 489 -75 928
Commission
expense 34 151 35 405
Services
providedServices
receivedLease income -52 874 -150 154 -139 920
Other 64 329 304 235 167 057

35
7.5. LEASES
Information concerning finance leases
gross Investissement
Present value of minimum lease
payments under the lease
Unguaranteed residual value
accruing to the lessor
≤ 1 year 2 866 828 491 174 73 134
> 1 year ≤ 5 years 8 118 832 4 809 422 276 146
> 5 years 3 685 873 3 086 283 346 039
TOTAL 14 671 533 8 386 879 695 319
Information concerning operating leases
Present value of minimum lease payments under the
lease
Total contingent rents recognized as income in the
period≤ 1 year 240 000
> 1 year ≤ 5 years 1 000 000
> 5 years
TOTAL 1 240 000 -
vIII / NOTE CONCERNINg RISKS
8.1. RISK MANAgEMENT POLICy
8.1.1. Risk categories
8.1.1.1. Credit risk
Credit risk, inherent in banking activity, is the risk of customers not repay-
ing their financial obligations toward the Bank in full or within the allotted
time, resulting in potential losses for the Bank. It is the broadest risk cat-
egory and may be correlated with other risk categories.
8.1.1.2. Market risk
Market risk is the risk of loss in value of financial instruments resulting
from changes in market parameters, volatility and correlations between
them. Concerned parameters include exchange rates, interest rates and
the prices of securities (stocks, bonds) and commodities, derivatives and
all other assets.
8.1.1.3. global liquidity and interest rate risk
Interest rate risk is the vulnerability of the financial situation of an institu-
tion to adverse changes in interest rates.
Liquidity risk is defined as the risk for the development of not being able
to meet its cash flow or collateral requirements when they fall due and at
a reasonable cost.
8.1.1.4. Operational risk
Operational risk is defined as the risk of loss resulting from inadequate
or failed internal processes, personnel error and systems failure or from
external events. This definition includes legal risk, but excludes strategic
and reputational risks.
8.1.1.5. Other risks
Equity investment risk
This risk arises when BMCE Bank invests in, holds in its portfolio, or ac-
quires equity or quasi-equity investments in entities other than its sub-
sidiaries. These investments may comprise ordinary shares, preferential
shares, derivative instruments, warrants, equity options or futures.
Country risk
Country risk comprises political risk as well as transfer risk. Political risk
generally arises from action taken by the government of a country such
as nationalisation or expropriation or an independent event such as war or
revolution, which may affect a customer’s ability to honour its obligations.
Transfer risk can be defined as the risk of a resident customer being un-
able to acquire foreign currency in its country so as to honour its overseas
commitments.
8.1.2. Risk management organization
8.1.2.1. Risk control bodies
BMCE Bank’s Group General Control is responsible for conducting inspec-
tions and audits across the Group’s various operational entities both in
Morocco and overseas.
group Risk Division
The Group Risk Division’s task is to correctly manage credit, market and
operational risks while actively contributing to:
• Defining BMCE Bank Group’s risk policy ;
• Definition and management taking and monitoring of commitments.
• Implementing of a credit risks control system, market transactions and
operational risks;
• Coordination of internal control projects and risk control across the
group.
The Risks Division and Coordination Group is composed of four entities :
• The Group Risk Management Division
• The Commitments Analysis Division
• The Commitments Monitoring Division
• The Group Coordination Division.
Risks and CoordinationGroup
Risk Managementgroup
CommitmentsMonitoring Division
CommitmentsAnalysis Division
group Coordination Division

36
8.1.2.2. governance bodies
8.1.2.2.1. group Audit and Internal Control committee
BMCE Bank Group’s Audit and Internal Control Committee is an instance
from the Board of Directors of BMCE Bank, whose prerogatives are ex-
tended to subsidiaries and other entities included in the scope of consoli-
dation.
Group Audit and Internal Control Committee assists the Board of Direc-
tors on internal control, including by ensuring that:
• The internal control system and the means implemented are::
- Coherent and compatible to allow monitoring and risk management at
the bank and its subsidiaries and the production of information required
by the regulator as part of the Group’s consolidated supervision;
- Adapted to the Group’s organization and the activities of controlled
entities;
• The financial information intended for the Board of Directors and third
parties is reliable and accurate, such that the legitimate interests of
shareholders, depositors and other stakeholders are preserved;
• A review of company and consolidated accounts is carried out before
submission to the Board of Directors.
8.1.2.2.2. Major Risks Monitoring Committee
The Major Risks Monitoring Committee is a sub-committee of the Audit and
Internal Control Committee. It includes non-executive directors (members
of the AICC). The committee meets on a quarterly basis. Its responsibili-
ties include assessing risk quality and ensuring that management standards
and internal procedures are complied with in respect of credit risk.
8.1.2.2.3. general Management Committee
The Group Management Committee is responsible for the declination in
equity and operational measures of the Group’s strategy and monitoring.
This Committee, whose periodicity is weekly, has main tasks the manage-
ment of the business of the bank, the conduct of internal control and risk
management, monitoring the HR component, commercial communica-
tion policy, institutional and financial.
The Steering Committee and group Risk Management
After the General Management Committee of BMCE BANK, the Steering
Committee and Risk Management BMCE Bank assists in the manage-
ment and monitoring of effective and operational of:
• Piloting device Group risks,
• Consistency of group activities with the policies fixed of risks and limita-
tions.
This Committee ensures the efficiency of the piloting device of the risks
of BMCE Bank Group and its adequacy with the risk management policy
defined on shutters risk of Credit, Market and Operational.
8.1.2.2.4. Credit Committees
Senior Credit Committee
This committee is chaired by the Bank’s Chairman and Chief Executive
Officer with the Deputy Chief Executive Office reporting to the Chairman
in the role of Vice-Chairman. It is sub-divided by market segment into two
committees, one specialising in Corporate Banking, the other in Personal
and Professional Banking. These committees meet twice-weekly and in-
clude senior managers of the Bank.
Regional Credit Committee
The Regional Credit Committee (RCC) meets on a weekly basis. Regional
Directors decide on meeting dates and inform committee members.
8.1.2.2.5. Downgrading Committee
As part of the portfolio monitoring process, the Downgrading Committee (full-
or mini-committee) meets on a monthly basis to examine accounts which are
showing anomalies. A recovery committee and an accounts showing anomalies
committee were also established at regional level and meet monthly.
8.1.2.2.6. group Risk Committee
The Group Risk Committee BMCE Bank is an instance from the Board of
Directors of BMCE Bank, whose prerogatives are extended to direct and
indirect subsidiaries included in the scope of consolidation of the Group.
This Committee assists the Board on strategy and risk management,
including ensuring that the global risk strategy is adapted to the risk profile
of the bank and the Group, to the degree of risk aversion, its systemic
importance, its size and its financial basis.
8.2. CREDIT RISK
The Bank’s credit activity is part of the general credit policy approved by
the Bank’s senior management. Among the guiding principles include the
Group’s requirement related to ethics, attribution of responsibilities, the
existence and adherence to procedures and rigour in risk analysis. This
policy is available in specific policies and procedures appropriate to the
nature of activities and counterparties.
8.2.1. Credit decision cycle
8.2.1.1. general principles
The approval process at BMCE Bank Group level respects the “Troïka” principle
and is based on the following principles:
• All credit requests adhere to the same approval process which ensures that
the Troïka principle is respected (minimum requirement). Therefore, at least
3 people, one of which is from the Risk Division, should approve all credit
requests except for some predefined specific cases;
• The decision, jointly taken by the Risk and Commercial Divisions – which
includes at least one preliminary counterfactual analysis – applies to the
applications assigned to the local decision committees as well as to the central
decision committees. This involves a multi-level pyramid structure, where the
higher level acts as an arbitrator in the event that consensus is not reached;
• The Risk Division can use the escalation procedure (n+1) if there is a
disagreement with the Commercial Division.

37
8.2.1.2. Credit approval process
The following diagram provides an overview of the credit approval process :
• The Commercial Division in charge of customer relations is responsible for
preparing the credit application;
• Counterfactual analysis of the credit application is performed by credit
analysts from the entity’s Risk Division;
• The decision is jointly taken by the Risk and Commercial Divisions, based on
their respective levels of delegation;
• The loan is actually implemented by the back-office, which is a unit
independent from the Risk and Commercial Divisions.
8.2.1.3. Decision making and choice of circuits
In order to facilitate the reporting exercise, the principle of a single decision for each
credit proposal should be respected.
Credit decisions are made either by circulation file, or by holding a Credit
Committee, via a manual or electronic process.
8.2.1.4. Delegation
The credit decision process is based on a delegation system whereby an
entity’s Board of Directors delegates powers to its employees or a group of
employees by setting limits, as it sees fit.
The delegation may in turn involve a sub-delegation depending on the
organisation, volume, products and risks.
The delegation of authority to employees is assigned intuitu personae on the
basis of their decision-making ability, experience, personal skills, professional
skills and training.
8.2.1.5. Approval rules
The credit approval decision is sent for consideration to the Troïka or to Credit
Committees depending on the approval levels required.
The present delegation system defines the following decision levels:
• At local branch level;
• At “hub” level (BOA Group and Europe);
• At central BMCE Bank level.
The local branch level may involve a sub-delegation depending on the entity’s
organisation, volume, products and risks.
8.2.1.6. Credit application contents
All requests for obtaining credit should meet the product’s eligibility criteria as
defined in the product factsheets. All credit decisions are taken on the basis of
a standard credit application whose format is defined in consultation with the
Commercial Division and Risk concerned and in coordination with the Group
Risk Division.
A credit application is prepared for each counterparty or transaction to
which the entity wishes to make a commitment or for which the entity has
already made a commitment in the case of an annual review or renewal. This
is done on the basis of the documents mentioned in the product checklist and
provided by the client.
The document checklist to be sent by the client and the analysis form should
be identical to the one at Group level and these will be modified based on
the type of credit. The contents of the credit application should provide the
decision-makers with the necessary information as well as the quantitative
and qualitative analysis required for taking the credit decision.
The Commercial Division is responsible for preparing the credit application
and its contents. The credit application shall remain the single point of
reference for any credit decision; it should contain all the signatures or stamps
that guarantee the accuracy of the information provided therein.
8.3. RATINg MODEL
BMCE Bank has an internal rating tool covering several customer segments.
8.3.1. Rating objective
The implementation of internal rating models concerns both of that
business risk issues.
The following five guiding principles structure the macro-processes
counterparty rating irrespective of segment concerned:
1) The set of BMCE Bank Group’s counterparties and transactions must
have a unique internal memo within the Group BMCE Bank;
2) The assignment of the rating results from a validation workflow involving
“raters” (within the Trades Lines) and “reviewers / approvers” (independent
entities within the credit process);
3) Valid Commitments Analysis Division in the last resort, the calculated
ratings;
4) The ratings must be validated to be disseminated within the information
system and then be used;
5) Counterparty ratings assigned to each counterparty in the approval of
any new operation. They are revised every time the change of risk warrants
and reviewed during each renewal record and at least once a year.
8.3.2. Key rating rules
8.3.2.1. Rating’s uniqueness
The rating is established for each client, provided as a third code group. The
rating process is thus carried out for each third code group so that a third
party has one and only one ratings. Thus, BMCE ensures the uniqueness of
the rating attributed to each assessed counterparty.
8.3.2.2. Rating’s integrity
As per the regulatory principles, the attribution of the rating and its
periodic review should be carried out or approved by a party that does
not benefit directly from the credit approval. It is for this reason that

38
the rating is validated in the back office by the Group Risk Management
Division following initial attribution by front-office commercial operations.
The rating’s integrity is a key component in the credit risk management
process and should reinforce and encourage independence in the rating
process.
From this perspective, BMCE Bank has an efficient process for acquiring
and updating relevant and significant information concerning the
borrower’s financial situation and the characteristics of the facility likely
to impact exposure at default (EAD) and loss given default (LGD) (e.g.
information about collateral). As soon as this information is received, the
rating is quickly updated.
8.3.2.3. Rating’s singularity
A counterparty code is assigned to each of the Bank’s counterparties. The rating
of each third party is carried out using the counterparty reference code in such
a manner that, for all third parties (the counterparty type is single and unique),
the assessment will be carried out by using a single rating model but with data
specific to each counterparty. BMCE Bank thus ensures the rating’s singularity
for each counterparty.
8.3.3. Rating process
8.3.3.1. Methodology approval entities
The methodology underlying the internal rating process has been defined
by two entities within the BMCE Bank: Group Risk Management (GRM)
and Project Management and Technological Synergies Division (PMTSD).
After process implementation, these same entities will be responsible for
any changes made to the system.
8.3.3.2. Rating scope
This project involves a multi-entity process whose remit encompasses all
“non-retail” counterparty segments in respect of Basel regulations. The
following counterparty segments are involved:
State and public
sector
StateCentral banksPublic administration bodiesGovernment organisationsLocal government authorities
Institutional
BMDInternational financial institutionsCredit and similar institutionsInsurance companiesFinancial companies
Corporates
Large companiesSMEsCorporate professionalsSpecialised financing agencies
8.3.3.3. Rating responsibility
The rating process involves three categories of person:
Profile Description
Rating officer (Account rep)
The rating officer is responsible for initiating the counterparty rating process. He is responsible for ensuring the quality and the completeness of the data entered into the rating model
“Local” Approver / Reviewer (Branch Manager / Account rep)
The “local” approver/reviewer checks that the information used by the rating officer is relevant (consistency in the financial statements and in the answers to the qualitative questionnaire). This action leads to first level validation of the data provided as well as a rating calculated prior to final approval/review by the “central” validation entity
“Central” Approver / Reviewer (DASE / RMG)
The “central” approver/reviewer checks that the information used by the rating officer is relevant and confirms the counterparty’s final rating, which can then be entered in the Bank’s MIS.He also has the option to modify the quantitative and qualitative information entered by the rating officer after first consulting the latter.Within certain guidelines, he can opt to manually adjust the rating in order to manage any possible limitations to the rating model.
8.3.3.4. Rating review and update
Rating procedures provide a detailed description of the rating review and
update process in the FACT tool at different stages of the rating process.

39
8.3.4. Rating’s model frame of reference
8.3.4.1. Characteristics
Determining the final counterparty rating involves several factors: the rating
models (excluding sovereign & specialised financing) are built upon four
successive ratings attributed to the counterparty and include different levels
of information:
1. Intrinsic rating
2. Rating including supporting information
3. Counterparty rating
4. Debtor rating
Intrinsic rating • The intrinsic rating measures a counterparty’s
ability to fulfil its financial commitments without
requiring any, support or specific constraint
• This rating is determined by taking into account
only a certain number of criteria specific to the
counterparty:
o Financial information from the latest balance sheet
and income statement provided to the bank or offi-
cially available
o Qualitative information (management, com-
petitiveness)
o Behavioural information (for very small enter-
prises)
Rating including
supporting
information
• Based on the intrinsic rating, this rating takes into
account all the important subordinate items
• This rating is determined after considering all infor-
mation supporting the counterparty’s application
(when this rating is better than the counterparty
rating) or to show the extent to which the counter-
party is dependent on its supporting documents
(when the counterparty rating is better than this
rating)
Counterparty rating • This rating is determined by taking into account
the risk relating to the counterparty’s country of
origin
Debtor rating • This is the final rating attributed to a counter-
party and it represents the Bank’s actual risk
level of the bank in respect a counterparty
• This rating is determined after considering infor-
mation
8.3.4.2. Rating scale
In accordance with the Basel regulations, Bank Al-Maghrib has set a
minimum number of categories that a rating model should contain for it to
qualify as being able to calculate the Bank’s risk-weighted assets (RWA)
under the “internal rating” approach. The following are the minimum
requirements:
- 7 categories for healthy counterparties
- 1 category for defaulting counterparties
BMCE Bank Group has adopted an 11-level rating scale to attribute a final
counterparty rating :
Increasing probability
of default (PD)“Healthy”
ratings
“In default”
ratings
1
2
3
4
5
6
7
8
9
10
11
Pre-doubtful
Doubtful
Irrecoverable
As of 31 December 2014, the breakdown of the portfolio by asset class
was as follows :
2,73%
18,16%
6,53%11,49%
17,07%14,43%12,59%
7,92%
0,14%2,30% 3,48%
96,83%
3,17%
work Risk Medium Risk High Risk very High Risk
Sub
-To
tal
No rating (TPE non
retail)
1 5 8 102 6 9 113 74
The Group is currently using the standardised approach which does not
require the rating scale to be mapped to those of external rating agencies.
Furthermore, this mapping is not applicable in Africa since external rating
agencies do not rate companies on this continent with the exception of a
few large banks with unsolicited ratings.
Since BOA accounts for the majority of the Group’s international commitments,
it has a different rating model based on expert opinion. In order to improve
this system, BMCE Bank has decided to implement its own rating model in all
international subsidiaries within a 2-year framework as part of its project to
implement a Group risk control policy.
In 2012, the Bank undertook a detailed review of its risk management
procedures at Group level in order to streamline and implement its risk
management and control procedures in all international subsidiaries.

40
The Bank also established the International Risk Division and hired a
consulting firm to oversee implementation of internal control and risk
management procedures for the entire Group.
The results of this project to date include, in terms of Risk Management, a
target model being defined for the Group Risk Division and the drawing up
of an implementation plan.
Backtesting and validation tasks of Large Entreprises and SMEs models
were launched during the second half of 2013.
All variables in the models were reviewed and the discriminatory nature
was tested. A proposal for a redefinition of models is being developed to
adapt the rating to BMCE portfolio.
Some projects are ongoing, namely the development of a recovery tool
for monitoring purposes calculating the LGD (Loss Given Default), but
especially improving the management of the decommissioning process.
Indeed, this tool will allow to extract accounts anomalies, processing
under specific committees and draw in fine recoveries failover towards
compromise.
An approval file of internal project rating is being prepared, its finalization
will concomitantly the finalization of projects (deployment FACT at the
subsidiary level, completion of the warehouse data ...). The first batches
were delivered to the audit.
8.3.5. Scoring of retail customers
In accordance with the Basel Accords, BMCE Bank Group has opted for the
IRBF Approach for Credit Risk. For this purpose, the scoring project, initiated
in 2012, is consistent with this approach and involves statistical modelling of
customers in default and the risk behaviour of retail customers.
Two types of score have been developed :
• APPROVAL SCORE: one-off score when the credit line is opened. New
and existing customers will be rated using this score.
• BEHAVIOURAL SCORE (Basel II rating model): real-time assessment of
risk based on a client’s behaviour for an existing account. Only existing
customers can be rated using the behavioural score.
• To obtain a FINAL APPROVAL SCORE, the final score will be issued by combin-
ing the approval and behavioural scores. New customers will be rated only on the
basis of the approval score.
A decision-making system for approval credit for consumption was devel-
oped and assessed by the bank; the implementation at the credit instruc-
tion tool was completed in 2014.
A grid score for MLA was also modeled and validated. Finally, a grid score
for professionals was modeled and validated during the year 2014.
8.4. ExPOSURE TO CREDIT RISK
The following table shows all of BMCE Bank Group’s financial assets, in-
cluding securities which are exposed to credit risk from a prudential
standpoint. Credit risk exposure does not include guarantees and other
collateral obtained by the Group for its credit operations nor purchases
of credit protection.
In the prudential balance sheet dated 31 December 2013, exposure to
credit risk relates to outstandings of sovereign borrower deposits net of
depreciation (MAD 18.5 billion), loans to credit institutions (MAD 18.5 bil-
lion), public institutions (MAD 7.6 billion dirhams). Receivables from large
enterprises accounted for 45% of total assets, while SMEs and very small
enterprises accounted for 29%.
35,95%
20,61
21,40
8,74
13,27
Receivable due from sovereign
states
Receivable due from credit
institutions
Corporate receivable
SME receivable
Retail receivable
The group’s gross exposure to credit risk rose by MAD 8 billion between
December 2012 and December 2013. This increase is the combined
effect of the increase in the Entreprise clientele (13 billion MAD) and the
decrease in other components : Public institutions (-2.3 billion MAD) and
credit institutions (-4 billion MAD).
Furthermore, off-balance sheet items totalled MAD 37 billion, accounting
for 17% of total exposure, of which large enterprises represented the largest
part. These commitments are sub-divided into financial commitments and
guarantee commitments.
8.5. CREDIT RISK CONTROL AND MONITORINg PROCEDURE
Credit risk control and monitoring ensures the second-level checking,
separate from daily monitoring by the Commercial Division.
This procedure may be adapted depending on how each subsidiary is organised in
consultation with the Group Risk Division.
Commercial Division is responsible for risk monitoring. Indeed, the credit
manager in the Commercial Division is responsible to the daily monitoring of
transaction risks. To fulfill this mission, the Commercial Division is helped by
the risks which play an alert role.
The risk Division’s main objective is to ensure the efficiency running of a
forward-looking alert system that allows the Commercial Division to optimize
risk management as well as anticipating potential risks so that the bank’s
portfolio may be properly managed. The risk Division also ensures that the
Commercial Division is monitoring properly and provides alerts for accounts
in default.
The implementation of a new entity within the Group Risks Division namely the
Monitoring of commitments Division to the last quarter of 2014. The objective
is strengthening the monitoring of the credit portfolio.
The Risk Division is not responsible for checking and approving every
transaction executed for an approved and validated facility. This task is

41
performed by an independent back-office which implements the transaction
when instructed by the Commercial Division. The Risk Division’s main
operational tasks, which relate to credit risk control and monitoring, can be
summarised as follows:
• Performs pre-checks;
• Performs post-checks;
- Identifies and monitors the portfolio of commitments based on several
factors: products, maturities, beneficiaries, business sectors, branches,
geographical regions etc.;
- Fixes and monitors concentration limits;
- Detects and monitors accounts showing anomalies and high-risk accounts;
• Categorised the portfolio based on regulatory criteria and proposes
provisioning;
• Performs stress tests;
• Produces regulatory reports and internal steering reports.
8.5.1. Pre-checks
Pre-checks include all compliance checks carried out prior to a credit mine’s
initial authorisation and use. These checks are performed in addition to
automatic checks and checks carried out by the Commercial Division, Back-
office and Legal Department etc.
These checks are implemented by the Risk Division. They mainly relate to:
- Credit proposal data:
- Compliance with the appropriate delegation level;
- Legal documentation compliance;
- Conditions and reservations expressed before initial use of funds or the
facility;
- Data entered in the information systems.
8.5.2. Post-checks
Like pre-checks, post-checks are also performed by the Risk Division.
These checks are aimed at ensuring measurement, control and monitoring
of credit risks in terms of the entire portfolio and not just the counterparty.
Special attention is therefore paid to credit quality, anticipating and preventing
irregularities and risks as well as controlling and monitoring risks by the
Commercial Division.
8.5.2.1. Portfolio monitoring
Group’s portfolio Monitoring commitments and its entities is performed
through several indicators, both on the risks to the granting and during the life
of the credit records.
The first post-check consists of identifying and monitoring the entity’s total
commitments based on several factors including products, maturities,
customers, business groups, customer segments, counterparty ratings, loan
categories (healthy loans and non-performing loans), industries, branches,
geographical regions, type of collateral etc. The multi-criteria analysis is a
credit risk management tool.
The production of multi-criteria analysis commitments portfolio is the
responsibility of the Credit Risk die which also ensures the reporting of credit
risks, both internally and vis-à-vis the Risk Committees and management,
that external, vis-à-vis the regulators.
The Risk Division’s information systems’ enable it to list and centralise all
credit risks for the same individual counterparty or interest group on a daily
basis. Risks incurred by economic sector, geographical region, country, type of
guarantee or collateral are identified and centralised at least once a month.
The Risk Division uses its information systems to generate reports that
include items at each balance sheet date as well as changes compared to the
previous balance sheet date. One of the main objectives of this analysis is to
explain changes, particularly the most obvious ones, over the financial year.
8.5.2.2. Concentration limits
Credit Risk Management has adopted a policy of analysing business line
strategies from a risk perspective, especially in respect of new activities or
product launches, by setting formal limits on these risks. Credit concentration
risk incurred by BMCE Bank Group can arise from exposure to:
• Individual counterparties ;
• Interest groups ;
• Counterparties belonging to the same industry or country.
8.5.2.2.1. Individual counterparties
The Group proceeds monthly monitoring of individual concentrations, on social
and consolidated basis, and ensures close monitoring of the commitments of
its 10, 20 and first 100 customers with the greatest commitments.
The following table shows commitments to the bank’s main debtors at the end
of December 2014 :
Dec-14 Dec-13
Balance sheet outstandings
% of total
Balance sheet outstandings
% of total
Commitments to 10
largest customers14 023 8,65% 13 057 8,74%
Commitments
to 20 largest
customers
20 765 12,82% 20 285 13,58%
Commitments
to 100 largest
customers
40 698 25,12% 41 557 27,82%
Total commitments 162 030 - 149 374 -
The level of concentration of its 10, 20, 100 largest customers accounted
for 58%, 90% and 185% respectively of prudential shareholders’ equity at
31 December 2013.
8.5.2.2.2. Interest groups
Diversification of the portfolio by counterparty is monitored on a regular
basis, notably under the Group’s individual risk concentration policies.
Credit risks that result from concentration on a single counterparty or
group of counterparties with a relative high level of outstandings (more than

42
5% of shareholders’ equity) are specifically monitored from an individual as
well as consolidated perspective.
In addition, monitoring of major risks also ensures that the aggregate
exposure to each beneficiary does not exceed 20 % of the Group’s net
consolidated shareholders’ equity capital as recommended by the
Moroccan banking regulations. BMCE Bank remains well below the
concentration limits defined by the Bank Al Maghrib directive.
8.5.2.2.3. Counterparties belonging to the same company
In 2011, BMCE Bank implemented a new methodology to determine and
manage industry-specific limits. This procedure uses a statistical data-
based model which includes historical default rates and the number of
counterparties by industry and by risk category (rating).
The objective is to model the probability of default by using appropriate
econometric techniques and a dependent random variable whose value is
derived from the number of occurrences of defaulting events.
This procedure is based on the assumption that the counterparties are
independent and the defaulting events are not correlated. Thus, the key
concept of this methodological approach is the probability of default for
a given counterparty. This probability is measured by using the rate of
default of the rating-industry pair.
For every rating-industry pair, this top-down approach counts the number
of customers that have defaulted in order to calculate the average
historical rate of default.
The model therefore enables the Bank to identify those industries from
which it needs to withdraw or reduce its commitments as well as those
industries to which is needs to increase its exposure.
The model also enables the Bank to identify priority industries for credit
expansion in the context of the Bank’s development plan as well as bad
loan experience by industry. This approach, adopted by the Group Risk
Division, is complemented by back-testing the model every six months.
Industry-specific limits are reviewed every six months in consultation with
the Commercial Division and the Bank’s Economic Intelligence Centre,
which provide both business line experience as well as estimation of
macroeconomic and industry growth. Advice provided by these entities
therefore helps to challenge and confirm the suitability of the model in
respect of the economic context.
The following table shows the Group’s commitments to customers by
industry at 31 December 2012 and 2013 :
Financial industries Real Estate development Commerce, Car repair and Domestic items Production and distribution of electricity, gas and water Communications and transportation Foods and T obacco industries Buildings and Public Works Metallurgical, mechanical, electrical and electronic industries
Hotels and restau rants
Textille, clothing and leather industries
Chemical and parachemical industries Various manufacturing Industries Extractive industries Agriculture, hunting and foresty Public Administrations Fisheries, Aquaculture Other sections Retail
12,52%
9,83%
10,56%
4,84%
3,00%2,32%
3,17%4,62%1,93%
1,35%1,31%
5,72%0,53%
1,42%0,70%
0,10%
6,05%
30,05%
8.5.2.2.4. Counterparties belonging to the same country
Country risk refers to the possibility that a sovereign counterparty in a given
country, as well as other counterparties in this country, is unable or refuses
to fulfil its foreign obligations due to socio-political, economic or financial
reasons.
Country risk can also result from limits on the free movement of capital
or due to other political or economic factors, in which case it is qualified as
transfer risk. It can also result from other risks related to the occurrence
of events impacting the value of commitments for a given country (natural
disasters, external shocks).
The Group reviewed its country risk policy in detail. It set itself the primary
objective of implementing a system for assessing, limiting, reducing and,
if necessary, prudently suspending its commitments to high-risk countries
across the Group.
The proposed policy, in addition to outlining a strategy for managing Country Risk,
includes rules for identifying, managing and controlling these risks as well as the
Group entities responsible. The main feature of this risk prevention policy is the
system of delegation and limitation of commitments.
This system has been designed in such a way that limits rise in proportion
to the increase in country risk. The level of commitments is determined on
the basis of the country risk level, reflected in the rating attributed to each
country and the percentage of shareholders’ equity of each Group entity.
BMCE Bank’s commitments are primarily within Morocco. The Bank’s
commitments to foreign counterparties relate to foreign credit institutions.
These commitments require:
• Post-rating authorisation and fundamental analysis of each counterparty;
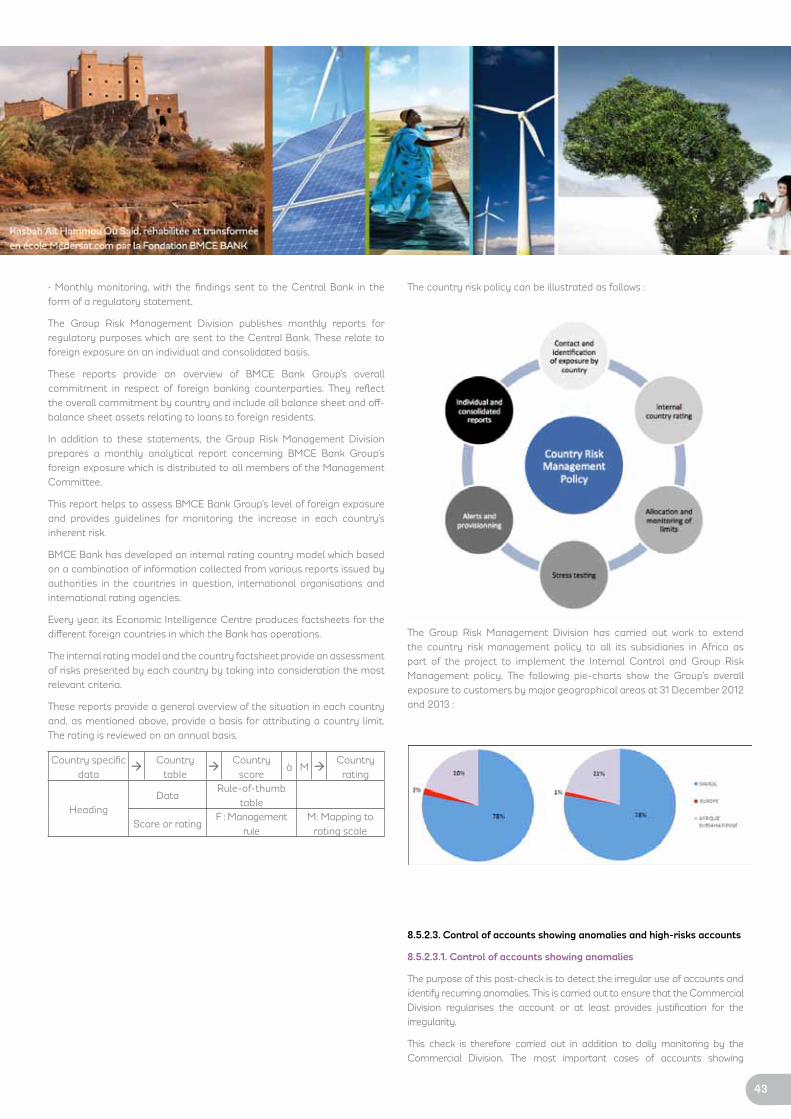
43
• Monthly monitoring, with the findings sent to the Central Bank in the
form of a regulatory statement.
The Group Risk Management Division publishes monthly reports for
regulatory purposes which are sent to the Central Bank. These relate to
foreign exposure on an individual and consolidated basis.
These reports provide an overview of BMCE Bank Group’s overall
commitment in respect of foreign banking counterparties. They reflect
the overall commitment by country and include all balance sheet and off-
balance sheet assets relating to loans to foreign residents.
In addition to these statements, the Group Risk Management Division
prepares a monthly analytical report concerning BMCE Bank Group’s
foreign exposure which is distributed to all members of the Management
Committee.
This report helps to assess BMCE Bank Group’s level of foreign exposure
and provides guidelines for monitoring the increase in each country’s
inherent risk.
BMCE Bank has developed an internal rating country model which based
on a combination of information collected from various reports issued by
authorities in the countries in question, international organisations and
international rating agencies.
Every year, its Economic Intelligence Centre produces factsheets for the
different foreign countries in which the Bank has operations.
The internal rating model and the country factsheet provide an assessment
of risks presented by each country by taking into consideration the most
relevant criteria.
These reports provide a general overview of the situation in each country
and, as mentioned above, provide a basis for attributing a country limit.
The rating is reviewed on an annual basis.
Country specific
dataà
Country
tableà
Country
scoreà M à
Country
rating
HeadingData
Rule-of-thumb
table
Score or ratingF : Management
rule
M: Mapping to
rating scale
The country risk policy can be illustrated as follows :
The Group Risk Management Division has carried out work to extend
the country risk management policy to all its subsidiaries in Africa as
part of the project to implement the Internal Control and Group Risk
Management policy. The following pie-charts show the Group’s overall
exposure to customers by major geographical areas at 31 December 2012
and 2013 :
8.5.2.3. Control of accounts showing anomalies and high-risks accounts
8.5.2.3.1. Control of accounts showing anomalies
The purpose of this post-check is to detect the irregular use of accounts and
identify recurring anomalies. This is carried out to ensure that the Commercial
Division regularises the account or at least provides justification for the
irregularity.
This check is therefore carried out in addition to daily monitoring by the
Commercial Division. The most important cases of accounts showing

44
anomalies relate to credit applications where:
• Credit authorisations have expired;
• Guarantees have not been provided;
• Credit lines have not been used for more than 6 months.
These criteria constitute the minimum conditions for accounts showing
anomalies that are detected automatically and monitored jointly with the
Commercial Division.
8.5.2.3.2. Monitoring high-risk accounts
High-risk accounts relate to those for which the risk is likely to subsequently
increase, thereby resulting in a cost to the Bank. They consist of commitments
which show either a visible deterioration in risk quality as measured against
quantitative criteria or a potential deterioration in risk quality as measured
against qualitative criteria.
• Are frozen: meaning sight deposit accounts for which there have not been
any actual credit entries over 60 days (excluding the release of loan funds)
to at least cover the account fees as well as a significant portion (10%) of the
said outstanding debit balance;
• Are in arrears, such as:
- Amortisable loan outstandings for which a repayment instalment has still
not been paid 30 days after the due date;
- Loan outstandings repayable in a single instalment which has still not been
honoured 30 days after the due date;
- Trade receivables discounted by the Banks and returned unpaid;
• Have exceeded limits, beyond one month, in respect of authorisations
granted. To avoid any potential operational risks, however, entities carry
out a weekly check to ascertain to what extent authorised limits have been
exceeded (at the discretion of each entity);
• Have exposures for which recovery is doubtful due to other negative
quantitative or qualitative information about the customer such as: a high risk
rating, special events or litigation surrounding the main shareholders (death,
bankruptcy etc.).
These are the minimum criteria for detecting high-risk accounts.
The Commercial Division, given the information at its disposal and through its
daily contacts, together with the Risk Division are responsible for identifying
and indicating any other account which may be considered a high-risk account,
if they deem it necessary. Assessment, intervention and the complementary
nature of the Commercial and Risk Divisions remain the determining factors
for identifying high-risk accounts.
Responsibility for the daily monitoring of these risks lies with the Commercial
Division. However, it is the Risk Division’s responsibility to detection high-risk
accounts. This is done using quantitative criteria extracted from the Bank’s
appropriate applications and IT systems.
When these risks are considered certain, the Risk Division requests the
Commercial Division to provide explanations. The latter uses all the means at
its disposal to ensure that the arrears are recovered.
8.5.2.3.3. Annual account review
All retail customers with a revolving credit or corporate customers with a
commitment to any of the Group’s entities must undergo an annual review
process carried out by the relevant Credit Committee, irrespective of whether
a facility needs to be approved or renewed.
The Risk Division is responsible for continuously updating the planned annual
review schedule provisional, in conjunction with the Commercial Division.
8.5.2.3.4. Theme-based checks
Unlike the checks mentioned above, theme-based checks are not performed
on a regular basis and are related to a specific point or risk. These checks are
carried out by the Risk Division on the request of senior management or other
bodies.
8.5.3. Loan classification
After the monthly review of the Bank’s portfolio and analysis of high-risk
accounts, each subsidiary reviews its regulatory loan classification as required
by local regulatory requirements.
This review is finalised by the committees for monitoring high-risk accounts on the
recommendation of each entity’s Risk Division. The latter is also responsible for
implementing these decisions by monitoring and transferring these accounts from the
“healthy” to the “non-performing, requires provisioning” category.
The following table shows the net carrying amount of non-amortised loan
outstandings in arrears and amortised doubtful loans in the Moroccan
business activity :
ln MAD
millions
2014 2013
Maturities of non provisioned
havlng outstanding unpaldImpaired
Assets
(CES)
Maturitles of non provlsloned
havlng outstandlng unpaldImpaired
Assets
(CES)< 90
days
>90
days
>180
daysTotal
< 90
days
>90
days
>180
daysTotal
< 180
days< 1 year
< 180
days< 1 year
Corporate 214 235 1 450 1 268 11 0 0 11 1 143
Corporate
Network301 0 188 489 2 756 200 27 27 254 2 159
Retail and
Professionnels
network
1 395 16 1 1 412 2 024 1 810 236 18 2 064 1 829
Total 1 910 251 189 2 350 6 048 2 022 263 44 2 330 5 131
8.5.4. guarantees
The Group receives different types of guarantee in consideration for loan
outstandings. As a general rule, the guarantees required are based on the
following two factors: the loan type and the counterparty quality.
Thus, for all property loans (home purchase loans and real estate development
loans), the Group systematically possesses mortgages on the financed
property as well as insurance cover.
Mortgage guarantees are systematically assessed, prior to acceptance, by
a specialised independent body or by the relevant departments within the
Group in all cases where the value declared by the customer exceeds one
million dirhams.
Similarly, the financing of public contracts, merchandise, equipment and trade

45
premises is systematically guaranteed by collateral in respect of the financed
items as well as through insurance cover.
In addition to these guarantees, the Group generally secures its position
by requesting personal guarantees from counterparties whenever deemed
necessary, depending on the quality of such counterparties.
It is also worth noting that 35% of the Group’s exposure to customers is guaranteed
by mortgages, 3% by bank guarantees or cash collateral and 10% by sovereign
guarantees.
Finally, almost one half of the Group’s exposure qualifies for credit risk
mitigation techniques under the Basel II Accord.
Thus, it should be noted that 35% of the group’s exposure to customers are
secured by mortgages, 1% of these exposures have bank guarantees or cash
collateral. Finally, 5% of exposures have sovereign guarantees.
Transferable guarantees
The Group does not hold any assets held as collateral which it is authorised
to sell or return in the absence of default on the part of the guarantee’s owner.
The guarantees that are usually taken by the Group are for the purpose of
hedging customers’ commitments in the event of failure to comply with the
legal provisions governing all credit agreements.
Loan guarantees obtained
In 2013, the Group took possession of assets held as collateral valued at MAD
55 million.
8.5.5. Stress-tests Conduct
Every six months, BMCE Bank conducts crisis simulations (stress tests)
to assess the vulnerability of its credit portfolio in the event of an adverse
event or deterioration of the quality of its counterparties.
The stress tests are conducted in order to assess the Bank’s resilience
in the face of unexpected, extreme events. Operationally, they consist
of simulating scenarios relating to the default of a certain percentage
of the Group’s counterparties. The ultimate objective is to measure the
impact on provisions and, as a result, on profitability and the prudential
shareholders’ equity.
The various scenarios are reviewed regularly and at least twice per year
to ensure that they are relevant. This assessment is carried out on the
basis of the objectives set for conducting stress tests and whenever the
market conditions suggest any potentially adverse changes that are likely
to seriously impact the Group’s ability to withstand them.
The Group Risk Division will endeavour, as a part of the Group Convergence
project, to transfer its expertise to all subsidiaries to enable them to
conduct their own stress tests, on a half-yearly basis, and communicate
the result to the Hub Risk and Group Risk Divisions so that they may be
consolidated and communicated to the Central Bank and to the Group’s
management.
8.5.6. Credit risk reporting
In order to monitor credit risks, the Group Risk Division has established
a specific procedure for producing credit risk reports in order to improve
and streamline credit risk control across the entire Group. These reports
are aimed at satisfying the requirements of all concerned parties for
monitoring, steering or regulatory purposes. They are also used by BMCE
Bank Group’s financial communications department.
These reports are in addition to the various regulatory reports that
have to be prepared by the Risk Division in order to satisfy regulatory
requirements at the Group and local levels. These also include reports
relating to the financial statements as well as other risk-related reports
prepared by other departments of the entity. These reports are designed
to present and overview of risk management carried out by the various
entities.
Credit risk reporting relates to all credit risks resulting from the activities
of all entities of the entire BMCE Bank Group. Each entity organises itself
as a function of local particularities in order to satisfy the requirements of
the reporting process.
8.5.7. Implementation of the risk control policy at international sub-sidiaries
As part the enhanced monitoring of offices abroad, a project “Convergence”
control and mastery of risk has been launched with a view to:
(i) Strengthen its executive governance of the group through the
deployment of its risks management procedures and internal control
at all subsidiaries
(ii) Support its international development strategy
Thus, harmonization of risk management across the Group was initiated
through a Credit Risk Policy Group (CRMP), but also by establishment a
group commitment basis (BEG) to be delivered during fiscal 2015.
Thus, on the credit risk, the following themes have been covered in the
various subsidiaries:
• Organizational structure and delegate schema adopted
• The grid Internal Rating “Large Corporate” deployed
• Automation tools and production process of regulatory reporting and
dashboards meet being finalized management needs
• Implementation of controls and management of anomalous accounts.
In parallel, the Risks Division and Coordination Group has established a
quarterly report describing the risk situation of each subsidiary through
a scrim and procedure detailing the information back, and pending the
implementation of the (BEG ).
On shutters Operational risks and permanent control, deployment work is
underway at the subsidiaries BOA Group. The objective is better control of
operations and improved performance via the implementation of target
processes.
8.6. DESCRIPTION OF THE POLICy FOR MANAgINg LIqUIDITy AND IN-TEREST RATE RISKS
BMCE Bank has established a policy for controlling balance sheet risks such
as liquidity and interest rate risks so that it is able to as to continuously monitor
changes in financial market trends and their impact on the Bank’s operations.
In order to maintain balance sheet stability from a medium- to long-term
perspective, the Bank’s liquidity and interest rate risk management policy aims
to:
• Ensure income stability when interest rates change, thereby maintaining net
interest income and optimising the economic value of equity;
• Ensure an adequate level of liquidity, thereby enabling the Bank to meet its
obligations at any given time and protecting it from any eventual crisis;
• Ensure that the risk inherent in its foreign exchange positions does not have a

46
negative impact on the Bank’s profit margins;
• Steer the bank’s strategy so as to take full advantage of growth opportunities
available in the market.
The Bank has established an ALCO committee to ensure that these
targets are met. The main tasks of this committee are as follows:
• Set asset-liability policy ;
• Organise and direct asset-liability sub-committees;
• Possess in-depth knowledge of types of risk inherent in the Bank’s operations
and keep abreast of any changes in these risks based on financial market
trends, risk management practices and the Bank’s operations ;
• Review and approve procedures aimed at limiting the risks inherent in the Bank’s
operations in terms of credit approval, investments, trading and other significant
activities and products;
• Master the reporting systems that measure and control the main sources of
risk on a daily basis ;
• Review and approve risk limits periodically given changes to the institutional
strategy, approve new products and respond to important changes in market
conditions;
• Ensure that the different business lines are properly managed by HR, the lat-
ter possessing a high level of competence, experience and expertise in relation
to supervised activities.
Responsibilities of the different parties involved in interest rate and liquidity risk management
Maintaining short- and medium-term balance sheet stability entails the
involvement of all parties within the Bank and requires that each party’s
responsibilities are clearly defined in respect of interest rate and liquidity risk
management.
In this regard, each of the Bank’s entities will have its own budget and objectives,
validated by the general management team on a medium-term basis. This
enables the relevant bodies to ensure orderly monitoring and control of the
three-year plan while balance sheet stability and compliance with regulatory
capital requirements.
The ALM department regularly tracks changes in the Bank’s balance
sheet structure by comparison with the plan’s objectives and indicates any
divergence during ALCO committee meetings, attended by representative of
all entities, and any required corrective measures.
Liquidity Risk
The Bank’s strategy in terms of liquidity risk management aims to ensure that
its financing mix is adapted to its growth ambitions to enable it successfully
expand its operations in a stable manner.
Liquidity risk is the risk of the Bank being unable to fulfil its commitments in the
event of unforeseen cash or collateral requirements by using its liquid assets.
Such an event may be due to reasons other than liquidity, for example,
significant losses that result from counterparties in default or due to adverse
changes in market conditions.
The following two major sources may generate liquidity risk :
• Inability of the institution to raise the required funds to deal with unexpected
situations in the short term, such as a massive withdrawal from deposits or a
maximum drawdown of off- balance sheet commitments;
• A mismatch of assets and liabilities or the financing of medium- or long-
term assets by short-term liabilities.
An acceptable liquidity level is a level that enables the bank to finance asset
growth and to fulfil its commitments when they are due, thereby protecting
the bank from any eventual crisis.
Two indicators are used to evaluate the Bank’s liquidity profile:
• The liquidity ratio must be greater than %100 (as defined by the Central
Bank). This indicator helps to measure the one-month asset coverage ratio.
The liquidity ratio stood at 104.2% on 31 December 2013, above the regulatory
limit.
• Profile of cumulative liquidity gaps: the method of periodic or cumulative
gaps in dirhams and in foreign currencies helps measure the level of liquidity
risk incurred by the Bank over the short, medium and long term.
This method is used to estimate the net refinancing requirements over differ-
ent time periods and determine an appropriate hedging strategy.
Balance sheet by maturity
• The following table gives a breakdown of the balance sheet by contrac-
tual maturity :
ln MAD millions As of December 31st, 2014
Due date not determined
From D/D to 3
month
3 months
to 1 years
1 year to 5 years
More than 5 years
Demand Total
Cash, Central Banks, Treasury, Post Office
9 967 9 967
Financial assets at fair value through income
28 610 28 610
Available-for-sale financial assets 4 891 4 891
Loans and receivables due from credit and similar institutions
6 400 2 489 1 909 3 283 1 600 392 16 073
Loans and receivables due from customers
26 167 34 358 30 332 25 433 25 794 13 068 155 152
Held-to-maturity financial assets 1 845 1 362 8 331 6 616 18 154
Current tax assets 199 199
Diferred tax assets 446 446
Accrued income and other assets 4 979 4 979
Investment associates 514 514
Investment property 835 835
Property, plant and equipment 5 847 5 847
Intangible assets 744 744
Goodwill 832 832
TOTAL FINANCIAL ASSETS 42 534 38 692 33 603 37 047 34 010 61 357 247 243Central banks, Treasury, Post Office 0 0
Financial liabilities at fair value through income
2 746 2 746
Amounts due to credit and similar institutions
5 146 15 911 6 517 4 953 217 399 33 143
Amounts due to customers 133 580 11 105 13 696 2 638 251 161 270
Debt securities issued 2 639 5 023 5 485 23 13 170
Current tax liabilities 55 55
Deferred tax liabilities 1 100 1 100
Accrued expenses and other liabilities
7 636 7 636
Provisions 523 523
Subordinated debt and special guarantee funds
5 261 2 307 4 194 28 6 795
Shareholder's Equity 20 803 20 803
TOTAL LIABILITIES 138 726 29 660 25 497 18 129 4 411 30 818 247 241

47
• The maturities of financial assets and liabilities at fair value in the trad-
ing portfolio and the portfolio of available-for-sale financial assets are
deemed to be “undetermined” given that these instruments are liquid and
earmarked for sale, repaid or temporarily sold under repurchase agree-
ment prior to their contractual maturity.
Interest Rate Risk
Interest rate risk is the risk that future changes in interest rates have a
negative impact on the Bank’s profit margins.
Changes in interest rates also impact the net present value of expected
cash flows. The extent to which the economic value of assets and liabilities
is impacted will depend on the sensitivity of the various components of the
balance sheet to changes in interest rates.
Interest rate risk is measured by conducting simulation-based stress tests
under a scenario in which interest rates are raised by 200 basis points as
recommended by the Basel Committee.
The Bank’s strategy in terms of interest rate risk management aims to
ensure the stability of results against changes in interest rates, thereby
maintaining net interest income and optimising the economic value of
equity.
Changes in interest rates may negatively impact net interest income and
result in the Bank significantly undershooting its initial projections.
In order to counter such risks, the ALM department regularly steers the
Bank’s strategy by establishing rules for matching assets and liabilities by
maturity and by defining a maximum tolerance departure threshold for
net interest income by comparison with projected net banking income.
The method of periodic or cumulative gaps in dirhams and in foreign
currencies helps measure the level of interest rate risk incurred by the
Bank over the short, medium and long term.
This method is used to estimate asset-liability mismatches over different
time periods and determine an appropriate hedging strategy
Sensitivity of the value of the banking portfolio
Simulation-based stress-tests are conducted to measure the impact of
changes in interest rates on net interest income and on economic value
of equity.
At 31 December 2013, the impact of a 200 basis point change in interest
rates on net banking income was estimated to MAD -11 million. The change
in the economic value of equity in the event of a 200 basis point shock was
estimated to be MAD 326 million or 2.39% of regulatory capital.
8.7. MARKET RISK
The majority of the Group’s market activity is focused at BMCE Bank level
which accounts for 99% of total activity. The remainder is undertaken by
the Group’s London subsidiary.
Market risk management at BMCE Bank Group adheres to regulatory
standards as defined by supervisory authorities and in application of best
international management practices as defined by the Basel Accords.
Market risk is defined as the risk of loss on balance sheet and off-balance
sheet positions due to changes in market prices. For BMCE Bank, these
risks encompass the following:
• Interest rate risk;
• Foreign currency risk;
• Credit risk on market transactions.
Mapping of financial instruments
The following table shows products traded as part of BMCE Bank Group’s
trading portfolio, mapped by risk factor :
Foreign Exchange Instruments Cash instruments
Spot Foreign Exchange
Forward Foreign Exchange
Foreign exchange Derivatives
Foreign exchange Swaps
Equity Instruments Equity shares
Derivatives on equity or and Indices
Mutual funds on equities
Fixed income Instruments I- Corporate and Interbank loans and borrowing
Fixed rate (in MAD and Foreign Currency)
Floating Rate (in MAD and Foreign Currency)
II- Negotiable Debt Securities and bonds
II-1 Sovereign Debt (Including bonds issued by the
Kingdom of Morocco)
Fixed rate (in MAD)
Floating Rate (in MAD and Foreign Currency)
II-2 Securities issued by Credit institutions and Companies
Fixed rate (in MAD and Foreign Currency)
Floating Rate (in MAD and Foreign Currency)
III- Loans / borrowing of Securities
Loans / borrowing of securities
Repo / Reverse repo
IV- Rate Derivatives
Rate Swaps
Rate Futures
Forward Rate Agreement
V- Fixed income mutual funds
Money market mutual funds
Debt mutual funds
Commodity Products Commodity futures
Commodity futures options
Credit Default Swap (CDS)
Credit Linked Note (CLN)
8.7.1. Market risk management policy
8.7.1.1. governance
The main contributors to BMCE Bank Group’s market risk management
policy are as follows:
• General Management, which implements market risk management strategies
and policies approved by the Board of Directors;
• Group Market Risk Committee, which defines Group market risk manage-
ment policy and validates any amendment to the steering of market risk
across the entire Group;
• Group Market Risk Department, which centralises market risk manage-
ment for BMCE Bank Group as a department which is independent from

48
the Group’s front-offices. This gives it maximum objectivity in steering
market risks and arbitrating between the Group’s various market activities;
• Risk Management Units of BMCE Bank Group entities, which provide a first
level check on market activities within their entity and send regular reports to
Group Risk Management;
• Internal Audit, which ensures implementation of the market risk manage-
ment policy and rigorous compliance with procedures.
8.7.1.2. Description of the Market Risk Management Policy
BMCE Bank Group’s market risk management policy is based on four main
factors:
• Limits;
• Risk indicators;
• Capital requirements;
• Counterparty risk related to derivatives transactions.
8.7.1.2.1. Limits
• Counterparty limits in market transactions
The process for approving limits for counterparties and applications
to exceed those limits in market transactions is governed within BMCE
Bank Group by a system of delegation of powers within a framework of
procedures specific to each counterparty type.
• Market limits
In order to control market risk within BMCE Bank Group and to diversify
the trading portfolio, a set of market limits has been adopted. These limits
reflect the Group’s risk profile and help to steer market risk management
by arbitrating between the Group’s various market activities.
BMCE Bank Group’s set of market limits are as follows :
• Stop-loss limits by activity over different time horizons;
• Position limits by activity;
• Open position limits by duration for the dirham foreign exchange
business;
• Open position limits by foreign currency and duration for the foreign
currency cash business;
• “Greek” limits for the derivatives business;
• Open position limits by foreign currency for the foreign exchange rate
business;
• Transaction limits.
Market limits are monitored using MLS software which enables real-time
monitoring of limits and overruns.
VaR limits are in the process of being defined and will be included in the
project relating to adoption of the advance approach in respect of market
risks. This is a dynamic limit management policy that takes into account
fluctuations in different risk factors as well as existing correlations in order
to assess more accurately the diversification of the portfolio.
• Regulatory limits
In addition to the limits adopted for internal purposes, BMCE Bank Group
also complies with regulatory limits defined by Bank Al-Maghrib such as:
• Limits on Tier 1 solvency ratios;
• Limits on foreign currency positions which should not exceed 10% of
shareholders’ equity ;
• Limit on the overall foreign exchange position which should not exceed
20% of shareholders’ equity.
8.7.1.2.2. Risk indicators
Different risk indicators reflecting the level of exposure to market risks are
used within BMCE Bank Group as follows:
• Overall value-at-Risk (vaR) and vaR by asset class
Value-at-Risk is a probability-based technique used to measure overall
market risk. It helps to measure the risk incurred by calculating the
potential loss a given time horizon and degree of probability.
Unlike traditional risk indicators, Value-at-Risk combines several risk
factors and measures their interaction, thereby taking into consideration
the diversification of portfolios.
BMCE Bank Group uses KVar software to calculate overall Value-at-Risk
and VaR by asset class as well as back-testing by using different methods.
CHANgES IN vAR (1 DAy, 99 %) IN DIRHAMS IN 2013
31/12/2014 31/12/2013VaR (10 days; 99%) 100 828 87 016
The historical VaR (10 days) with a confidence level of 99% at 31 December
2013 was MAD 87,016 thousands.
Stressed vaR
The Group has established different scenarios for calculating stressed VaR.
The Group opted for the period from 1 September 2008 to 1 September
2009. In fact, there were a number of events during this period generating
a high level of volatility in financial markets. These events were:
• The bankruptcy of Lehman Brothers, which was unable to withstand the
sub-prime crisis;
• USD 1,000 billion widening in the US budget deficit to support financial
markets;
• The Greek crisis and the threat of contagion spreading to the

49
“PIIGS” countries.
The reaction by Morocco’s financial markets to these events was limited
however. A number of scenarios were applied to simulate global market
conditions:
• Fluctuation in the Casablanca stock market identical to that of the
United States;
• Fluctuation in the dirham rate identical to that of USD;
• Repercussion of EURUSD volatility on EURMAD and USDMAD;
• Repercussion of EURUSD volatility on EURMAD volatility and USDMAD
volatility.
• Stress-testing by risk factor
BMCE Bank Group conducts stress tests to assess the vulnerability of
the Group’s trading portfolio to extreme scenarios. Stress tests cover all
components of the trading portfolio by simulating all risk factors which
have an impact on the portfolio. The results of stress tests for interest rate
risks and exchange rate risks on the trade portfolio are described below :
a. STRESS TESTS RESULTS: INTEREST RATE RISK
1. Portfolio of Treasury securities
1st scenario: 50 basis point increase in the yield curve on a constant
basis. This scenario resulted in an impact of MAD 1.53 million on income
at 31 December 2013.
2nd scenario: 100 basis point increase in the yield curve on a constant
basis. This scenario resulted in an impact of MAD 2.61 million on income
at 31 December 2013.
2. Portfolio of corporate debt
Corporate financial issuers.
1st scenario: 50 basis point increase in the yield curve on a constant basis
together with a 50 basis point increase in the risk premium. This scenario
resulted in an impact of MAD 1.5 million on income at 31 December 2013.
2nd scenario: 100 basis point increase in the yield curve on a constant basis
together with a 75 basis point increase in the risk premium. This scenario
resulted in an impact of MAD 2.7 million on income at 31 December 2013.
Corporate non-financial issuers
1st scenario: 100 basis point increase in the yield curve on a constant basis
together with a 100 basis point increase in the risk premium. This scenario
resulted in an impact of MAD 25.3 million on income at 31 December 2013.
2nd scenario: 200 basis point increase in the yield curve on a constant basis
together with a 200 basis point increase in the risk premium. This scenario
resulted in an impact of MAD 52.6 million on income at 31 December 2013.
b. STRESS TESTS FOR FOREIgN ExCHANgE RISK
Euro
1st scenario : 10% rise in the value of the dirham against the Euro. This
scenario resulted in an impact of MAD 36.8 million on income at 31
December 2013.
2nd scenario : 10% rise in the value of the dirham against the Euro. This
scenario resulted in an impact of MAD 55.3 million on income at 31
December 2013.
Dollar
1st scenario: 10% rise in the value of the dirham against the US dollar.
This scenario resulted in an impact of MAD 9.6 million on income at 31
December 2013.
2nd scenario: 10% rise in the value of the dirham against the US dollar.
This scenario resulted in an impact of MAD 14.4 million on income at 31
December 2013.
The results of the stress test conducted shows that the Group has a
sufficient level of shareholders’ equity to withstand adverse scenarios and
to comply with regulatory standards even in the event of a crisis.
It is also worth noting that the project for adoption of the advance approach in
respect of market risk is being finalised with the implementation of an internal
model based on the VaR approach.
8.8. OPERATIONAL RISK
Operational risk is defined as the risk of loss due to inadequate or failed
internal procedures, employee error, systems failure or external events,
liable to impact the smooth running of the business.
8.8.1. Operational risk management policy
8.8.1.1. Operational risk management objective
The operational risk management policy has the following objectives:
• Assess and prevent operational risks;
• Assess controls;
• Implement preventive and/or corrective action for major risks.
8.8.1.2. Classification
Operational risks or losses can be analysed and categorised on the basis
of two factors and it is important to differentiate between them: cause and
effect, in terms of their financial or other impact. They are classified under
Basel by event type.
8.8.1.2.1. Links to other risk types (market/credit risks)
The management of operational risks is potentially linked to the
management of other risks (market/credit risks) at two levels:
• Overall level, analysis of the Bank’s overall level of risk aversion (and in
terms of allocation of capital) must be carried and monitoring of “trans-
risks”;
• Detailed level, some operational risks can be directly linked to market
and credit risk management.
8.8.1.2.2. Operational risk management organisation
The framework governing operational risk management within BMCE
Group is based on three main objectives:
• Define a target policy consistent with BMCE Bank Group’s business
organisation and inspired by best practice;

50
• Involve and empower business lines and subsidiaries in the day-to-day
management of operational risk management;
• Ensure that Audit/Control function is separate from the Operational Risk
Management function.
Operational risk management at BMCE Bank Group involves four major
entities :
- BMCE Bank’s Group Operational Risk Department;
- BMCE Bank network;
- BMCE Bank business divisions;
- Subsidiaries.
Operational risks coordinators have been appointed by the aforementioned
entities. These include:
- Operational Risk Correspondents (CRO);
- Operational Risk Coordinators (CORO);
- Operational Risk Liaison Officers (RRO).
The operational risk management’s remit includes 8 Group subsidiaries.
8.8.1.2.3. governance of operational risk management
Governance of operational risks within BMCE Bank Group is organised by
three Operational Risk Committees:
• Group Operational Risks Committee;
• Operational Risk Monitoring (Business Lines) Committee;
• Operational Risk (Subsidiaries) Committee.
These committees are tasked with periodically:
• Reviewing changes in the exposure to operational risks and in the
environment for controlling such risks;
• Identifying the main areas of risk, in terms of activities
• and risk types;
•Defining preventive and corrective action required to reduce the level of
risk;
• Reviewing the amount of capital to be allocated to operational risks, the
cost of preventive action required and the costs of insurance.
8.8.1.3. Fundamental methodology principles
BMCE Bank Group’s operational risk management policy has two strate-
gic objectives:
• Reduce exposure to operational risks;
• Optimise capital requirements relating to operational risks.
The internal system for measuring operational risks is closely linked to the
Group’s day-to-day risk management process via:
• Collecting risk events;
• Mapping operational risks,
• Key risk indicators.
The management of the entity in question, general management and the
board of directors are regularly notified of operational risk exposure and
losses incurred. Management systems are properly documented, ensur-
ing compliance with a formalised set of controls, internal procedures and
corrective measures in the event of non-compliance.
Internal and/or external auditors are invited to periodically review man-
agement processes and systems for measuring operational risk. These
audits relate to units’ activities and the independent operational risk man-
agement function.
Management of operational risks at BMCE Bank Group is entirely auto-
mated by means of a dedicated system, “MEGA GRC”. The collection of
risk events, the mapping of operational risks and the key risk indicators
are currently managed by this system which is used at Bank level as well
as by Moroccan and European subsidiaries.
8.8.1.4. Operational risk control and mitigation
Several types of action may be taken to manage operational risks:
• Reinforce checks;
• Hedge risks, especially through insurance contracts;
• Avoid risks, in particular, by redeploying activities;
• Draw up business continuity plans.
BMCE Group has a very strong control policy, resulting in a significant
reduction in operational risks. However, in terms of operational risk
management and via its dedicated policy, the Group is at liberty to identify
optimal behaviour, on a case by case basis, depending on the different
types of risks described above.
Additionally, the Group has insurance policies to mitigate risks such as
damage to office buildings, fraud, theft of valuable items and third-party
liability cover etc.
8.8.2. Business continuity plan
Under a changing regulatory environment, the Business Continuity plan is a
response to the rising demand to minimise the impact in the event of any
interruption to the Bank’s activities. This is due to the increasing reliance on
the resources underpinning those activities including human, IT or logistics
resources.
The business continuity plan is a set of measures and procedures aimed at
ensuring that the Bank, under different crisis scenarios such as major shock,
maintains essential services in fail-soft mode on a temporary basis, prior to a
planned resumption of normal operations.
The strategic principles underpinning the business continuity plan are as
follows:
• BMCE Bank has a moral responsibility to allow its customers access to the
cash which they have entrusted to it. Any breach of this obligation in times of
crisis may have an impact on public order. This principle prevails above any
other;
• BMCE Bank must guarantee its commitments towards Morocco’s interbank
clearing system;

51
• BMCE Bank intends to first and foremost comply with all existing legal
and contractual commitments entered into (relating to loans and other
commitments), prior to entering into any other commitment;
• BMCE Bank intends to maintain its international credibility by guaranteeing
first and foremost its commitments vis-à-vis foreign correspondents;
• BMCE Bank Group’s existing customers take priority over others;
• Services are executed in their entirety, beginning in the front-office and
culminating in the back-office (e.g. from branch level up until accounting
recognition).
The Business Continuity Plan was introduced in 2009. Several test simulations
have since been carried out across the Kingdom.
8.8.3. Measurement of capital adequacy
The BMCE Bank Group has opted for the standardised approach as outlined
in Bank Al Maghrib circulars (BAM).
The latter require banks to have a Tier 1 capital ratio of 9% and a solvency ratio
of 12% at both the parent company and consolidated levels.
BMCE Bank Group already satisfies these new requirements.
Capital Adequacy ratio
Capital Adequacy ratio AmountTier 1 Capital 19 301Total Capital ratio 23 823Total risk-weighted assets 197 277Tier 1 Capital ratio 9,8%Capital Adequacy ratio 12,1%

52
Financial CommunicationTél. : +212 522 49 80 03/04 - Fax : +212 522 26 49 65E-mail : [email protected] Web site : www.bmcebank.ma
Kasbah Ait Hammou Ou Said, rehabilitated and transformed 2014 Results into Mederset.com School by the BMCE Bank Foundation
BMCE BANK
PO. BOX 20 039 Casa Principale
Phone : 05 22 20 04 92 / 96
Fax : 05 22 20 05 12
Capital : 1 794 633 900 dirhams
Swift : bmce ma mc
Telex : 21.931 - 24.004
Trade Register : casa 27.129
CCP : Rabat 1030
CNSS : 10.2808.5
Tax Identification Number : 01085112
Trading tax : 35502790
GovERNANCE & DEvElopMENt GRoup-fiNANCiAl CoMMuNiCAtioN
Tél : 05 22 49 80 03 / 05 22 49 80 04
Fax : 05 22 26 49 65
E-mail : [email protected]
BMCE BANK poRtAil : www.bmcebank.ma
iNtERNAtioNAl tRADE wEB sitE : www.bmcetrade.com
BMCE CApitAl poRtAil : www.bmcecapital.com