BAMBARA MARKETING MARGINS ANALYSIS
41
BAMBARA MARKETING MARGINS ANALYSIS By: WILHEMINA QUAYE and IVY JOHNSON KANDA Food Research Institute, P.O. Box M.20, Accra February, 2004
Transcript of BAMBARA MARKETING MARGINS ANALYSIS

BAMBARA MARKETING MARGINS ANALYSIS
By:
WILHEMINA QUAYE and IVY JOHNSON KANDA Food Research Institute, P.O. Box M.20, Accra
February, 2004

1
ABSTRACT Bambara Marketing Margins study was conducted in selected production and
consumption centers in the Northern, Upper East and Brong Ahafo regions using a
commodity subsystems approach. The study identifies the distribution channels for
bambara by tracing the movement of raw bambara grain from the producing centers to
the consuming centers, examines the socioeconomic background of the various actors in
the marketing system and gathers data on prices at the various bambara distribution
channel for marketing margins analysis. Results indicate that bambara is a low volume
traded product at both wholesale and retail levels as compared to other legumes and has
limited distribution outlets. Approximately 35% of volumes of bambara produced is
utilized by the producer-households either as food and/or seed and about 92% of the
bambara producers sell their produce at their homes or local markets. Sales are usually
effected five months after harvesting (May-June), when food is scarce and demand is
high. However, high demand in the South coincides with the plantain season, which
occurs in January-February. A few (13%) bambara producers sell their produce to
processors directly on the local markets and about 51% of producers interviewed depend
solely on the activities of visiting itinerant traders. Producers who sell directly to local
itenerant traders only constitute about 12% of the sample interviewed while 6% sell to
retailers. The bambara marketing structure could be classified as an oligopsonistic one,
having few buyers and consumers have little knowledge of bambara-based products.
Pricing is based largely on negotiation/bargaining power, than with the true value of the
product and the position of the producer in price formation is weak. The Total Gross
Marketing Margin for bambara is estimated at 41.66% with Producer Participation
Margin of 58.34%. Total Marketing Charges is approximately 11%. Recommendations
made include development of consumer educational programs focusing on the
contribution of bambara to health and nutritional requirements as well as its unique
flavour, establishment of a viable bambara market information system, market expansion
effort to be focused on both bambara consumers and non bambara consumers using value
based marketing strategy as well as a further investigation into post storage volume
traded at various stages of the distribution chain.

2
INTRODUCTION Comparatively, very little research has been done on bambara groundnut (Vigna
subterranea L. Verdc) in Ghana in the past and the crop is thus considered as a forgotten
crop though its nutritional and food security importance cannot be overemphasized. It is a
well-balanced food in terms of protein, carbohydrate and lipid content with low levels of
anti-nutritional factors and has high processing potential, which needs to be explored. A
recent research on bambara by Azam-Ali and Squire (2001) and Azam-Ali et al. (2002)
with special interest in utilization and marketing prospects is a typical example of how
the potential of any underutilized crop can be assessed and utilized through
multidisciplinary research effort. Since 1988, scientists in four European countries,
United Kingdom, the Netherlands, Germany and Italy, have joined forces with scientists,
growers, traders and consumers in Botswana, Tanzania, Sierra Leone, Swaziland,
Namibia and Zimbabwe to work on this indigenous African legume. Together, their
efforts provide a comprehensive assessment of the ecophysiology, agronomy, nutritional
biochemistry, agroprocessing, genetics, and marketing potential of bambara groundnut in
the region.
Currently, a high quality bambara flour (HQBF) technology transfer research programme
funded by the Crop Post Harvest Programme (CPHP) of the UK Department for
International Development (DFID) is being implemented in Ghana using a multi-
institutional approach led by Food Research Institute (FRI) of Council for Scientific and
Industrial Research (CSIR). This programme is an extension of a previous demand-driven
preliminary research that sought to address the issue of long cooking processes limiting
the utilization of bambara in Ghana. The current project aims at establishment of a value
added-chain through HQBF based recipe development, training of small-scale processors,
and involvement of commercial processors as well as sale of well-packaged HQBF
through identified market outlets.
Bambara Marketing Margins Research (BMMR) is one of the activities under the HQBF
technology transfer programme. The BMMR study identifies the distribution channels for
bambara by tracing the movement of raw bambara grain from the producing centers to

3
the consuming centers. The general socioeconomic background of the various actors in
the marketing system is examined to gain detailed understanding of the roles of the
participants, and finally data on prices at the various bambara distribution channel are
collected, analyzed and gross marketing margins established.
Components of marketing costs and margins are of interest to decision makers and
stakeholders because such knowledge can serve as the basis for reducing inefficiencies in
the marketing system through innovative interventions at the appropriate levels of the
distribution chain. Marketing has an intrinsic productive value because it adds time,
form, place and possession utilities to products and commodities. Through the technical
functions of storage, processing and transportation as well as exchange, marketing
increases consumer satisfaction (Smith et al, 1999). As incomes and populations grow
and agricultural specialization increases and non-agricultural sector develops, there is an
increased demand for marketing services. The role of markets in encouraging increased
production through price incentives is therefore crucial.
METHODOLOGY A commodity subsystems approach, which combines marketing functions approach and
the organizational approach is the main methodological framework used in this study.
Institutional analysis is based on the identification of the major distribution channels,
determination of the channel participants, including procedures needed to determine
sample size while the marketing functions approach concentrates more on the relative
contributions of the channel participants as it relates to marketing as an economic
activity.
Sampling
Using background information obtained from a baseline study conducted earlier under
the technology transfer programme in the project area and previous research findings on
production and marketing of bambara, two main seasons which adequately reflect the
relevant bambara market cycles were identified. These include the period before storage

4
characterizing the main harvesting season and after storage when a lot of farmers are
willing to sell off their produce; supply and demand conditions normalized and marketing
activities are seen to be relatively competitive. The current survey was conducted in the
pre storage or harvesting season in the month of November 2003. Considering space
(spread of players involved in bambara marketing), time and availability of resources a
total of 100 traders and producers were selected purposively for structured interview to
capture the price changes along the distribution chain; from production points to the
consumption centres. The post storage survey would be conducted in May/June 2004
with much emphasis on proportions of bambara grain traded at various stages of the
distribution chain.
Survey Areas
The survey was conducted in selected production and marketing centers. In the
production centres, producers were interviewed at Zinindo and Zamashiegu in
Gushiegu\Karaga district, Nyamkpala in Tolon Kumbugu district and Savelugu and
Tampiong in Savelugu-Nanton district all in the Northern Region of Ghana.
Map of Ghana with regions where survey was conducted marked red.

5
In the marketing centres, traders were interviewed in Bolga in Upper East region,
Tamale, Nyampkala and Savelugu in the Northern region and Techiman in Brong Ahafo
region.
Questionnaire Design and Data Collection
Primary data was collected using a structured questionnaire. An informal insitu
interviews noting responses and observing the marketing process was conducted
simultaneously with the formal survey. This allowed for generation of qualitative
information which could not be captured in the structured questionnaire. The structured
questionnaire modules consisted coded questions covering information on producers and
traders socio-economic profile, production levels, quantities sold, description of sale,
marketing services and costs , selling prices and seasonal variations in supply and
demand. Others are destination of major customers of producers and traders, major
sources of supply, factors affecting volumes traded and mode of price determination.
In addition to coded questions, there where open-ended questions to allow respondents
discuss freely the particular marketing issues of concern to them.
Analysis of Data and Estimation Procedure
Responses were coded and the Statistical Package for Social Science (SPSS) and
Microsoft Excel used to process the data for descriptive analysis. The marketing margin
analysis is based on gross figures since return on capital and imputed salaries earned by
the middlemen in the distribution of many agricultural commodity chains is often
difficult to determine.
The estimation procedure for marketing margins analysis is presented below;
TGMM = Retailing Price – Farm gate Price Retailing/Consumer Price

6
TGMMRA = Rural Assembler Price- Farm gate Price * 100 Retailing /Consumer Price GMMW = Wholesale Price - Rural Assembler Price * 100 Retailing /Consumer Price GMMr = Retailing Price – Wholesale Price * 100 Retailing /Consumer Price GMMp = 100% - TGMM NNM= TGMM-TMC Where TGMM denotes Total Gross Marketing Margin TGMMRA - The percentage of the total gross marketing margin received
by the rural assembler GMMW - The percentage of the total gross marketing margin received by the
wholesaler GMMr - The percentage of the total gross marketing margin received by the
retailer GMMp - The producer participation margin
TMC - The total marketing charges expressed as a percentage of retail price
NMM - The Net Marketing Margin

7
RESULTS AND DISCUSSIONS
A. SOCIO-ECONOMIC PROFILE OF RESPONDENTS AND GENDER ISSUES
It is important to characterize the socio-economic profile of the key actors identified in
bambara marketing system as a first step towards gaining understanding of their
behaviour and contributory roles in market development. Basically the social aspect of
marketing of Agricultural commodities is quite strong and bambara marketing is no
exception. Because of long term involvement in trading activities, farmers have a strong
trust-built relationship with itinerary traders and to some extent with the market-based
traders. Unfortunately, in the case of bambara, the relationship between producers and
traders did not reflect in informal understanding with respect to provision of credit,
market assurance, process of buying and assistance in case of other social needs as seen
in the marketing of other Agricultural commodities. As shared among many Agricultural
marketing researchers, such relationships develop when volumes traded are high (See
Heide and John 1990; Han et al, 1993; Morgan and Hunt, 1994). Descriptive statistics on
bambara producers with respect to production levels, yields and volumes traded attest to
the above assertion (See table1).
Producers
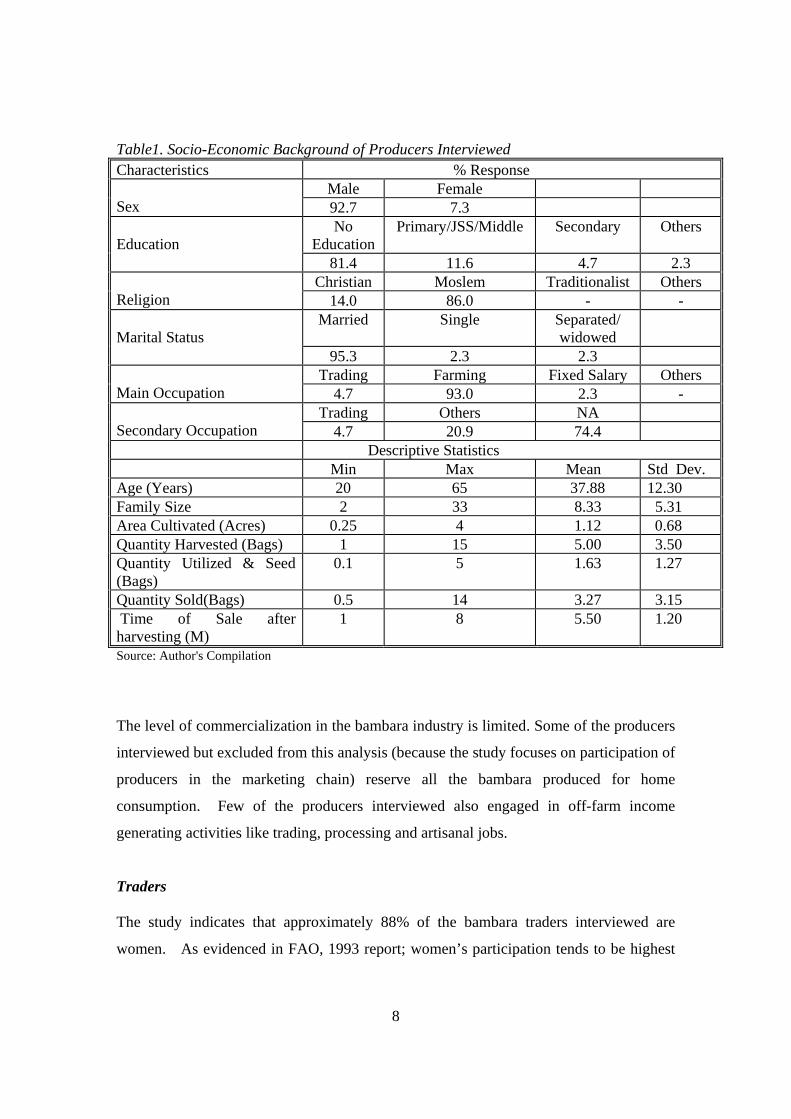
Table1 presents an informative summary of socio-economic profile of bambara producers
interviewed. Primarily, bambara cultivation is dominated by men but generally marketed
by women. Men formed about 93% of respondents interviewed. They are married and
mostly Moslems by religion with no formal educational background. The study revealed
that the main occupation of the bambara producers is farming. Other cereals and legumes
cultivated include maize, sorghum, millet, cowpea, groundnut etc,etc. Bambara was a
minor crop in terms of acreage of cultivation but a very important food security crop to
farmer households.
8
Table1. Socio-Economic Background of Producers Interviewed Characteristics % Response
Male Female Sex 92.7 7.3
No Education
Primary/JSS/Middle Secondary Others Education
81.4 11.6 4.7 2.3 Christian Moslem Traditionalist Others
Religion 14.0 86.0 - - Married Single Separated/
widowed
Marital Status 95.3 2.3 2.3
Trading Farming Fixed Salary Others Main Occupation 4.7 93.0 2.3 -
Trading Others NA Secondary Occupation 4.7 20.9 74.4 Descriptive Statistics Min Max Mean Std Dev. Age (Years) 20 65 37.88 12.30 Family Size 2 33 8.33 5.31 Area Cultivated (Acres) 0.25 4 1.12 0.68 Quantity Harvested (Bags) 1 15 5.00 3.50 Quantity Utilized & Seed (Bags)
0.1 5 1.63 1.27
Quantity Sold(Bags) 0.5 14 3.27 3.15 Time of Sale after harvesting (M)
1 8 5.50 1.20
Source: Author's Compilation
The level of commercialization in the bambara industry is limited. Some of the producers
interviewed but excluded from this analysis (because the study focuses on participation of
producers in the marketing chain) reserve all the bambara produced for home
consumption. Few of the producers interviewed also engaged in off-farm income
generating activities like trading, processing and artisanal jobs.
Traders
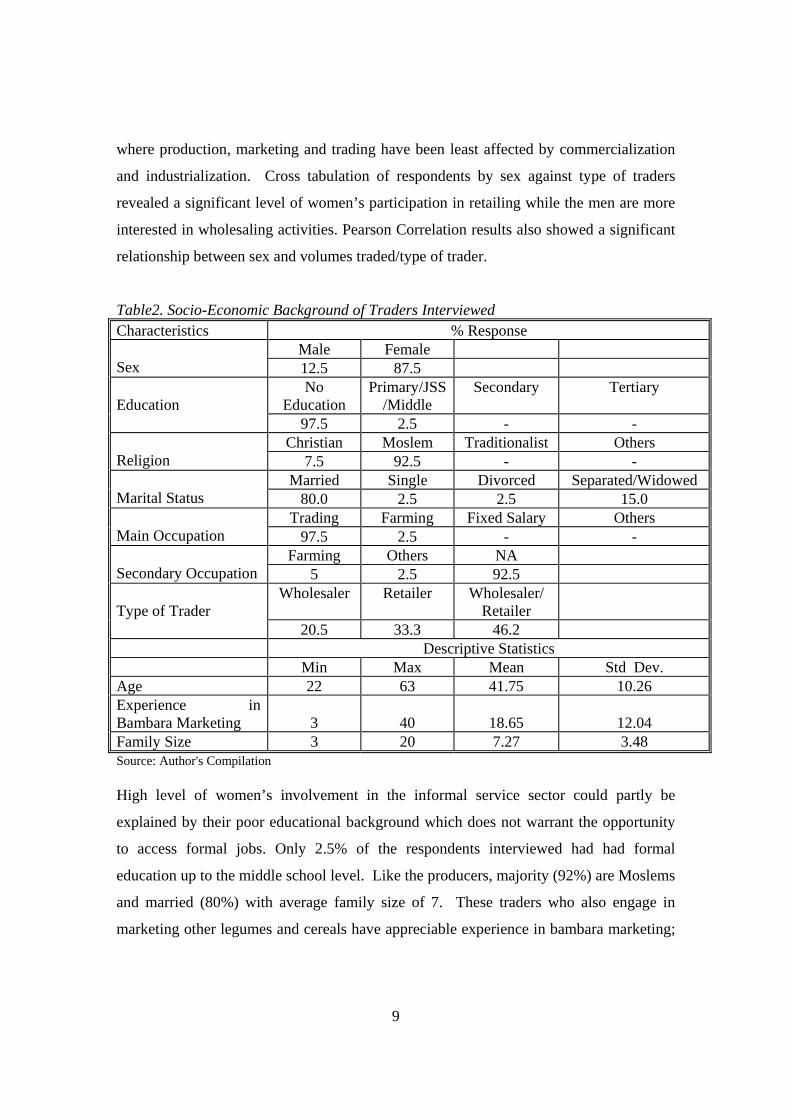
The study indicates that approximately 88% of the bambara traders interviewed are
women. As evidenced in FAO, 1993 report; women’s participation tends to be highest
9
where production, marketing and trading have been least affected by commercialization
and industrialization. Cross tabulation of respondents by sex against type of traders
revealed a significant level of women’s participation in retailing while the men are more
interested in wholesaling activities. Pearson Correlation results also showed a significant
relationship between sex and volumes traded/type of trader.
Table2. Socio-Economic Background of Traders Interviewed Characteristics % Response
Male Female Sex 12.5 87.5
No Education
Primary/JSS/Middle
Secondary Tertiary Education
97.5 2.5 - - Christian Moslem Traditionalist Others
Religion 7.5 92.5 - - Married Single Divorced Separated/Widowed
Marital Status 80.0 2.5 2.5 15.0 Trading Farming Fixed Salary Others
Main Occupation 97.5 2.5 - - Farming Others NA
Secondary Occupation 5 2.5 92.5 Wholesaler Retailer Wholesaler/
Retailer
Type of Trader 20.5 33.3 46.2
Descriptive Statistics Min Max Mean Std Dev. Age 22 63 41.75 10.26 Experience in Bambara Marketing
3
40
18.65
12.04
Family Size 3 20 7.27 3.48 Source: Author's Compilation High level of women’s involvement in the informal service sector could partly be
explained by their poor educational background which does not warrant the opportunity
to access formal jobs. Only 2.5% of the respondents interviewed had had formal
education up to the middle school level. Like the producers, majority (92%) are Moslems
and married (80%) with average family size of 7. These traders who also engage in
marketing other legumes and cereals have appreciable experience in bambara marketing;

10
ranging from a minimum of 3 years to a maximum of 40 years, either as all year round
traders or as seasonal participants (See table 2).
Table3. Description of Markets visited Market Location Description Nyamkpala Northern region/
Tolon Kumbugu district Semi-Rural market organized on a 3-day cycle.
Bolga Upper East region/ Bolga district
Urban periodic market organized on a 3-day cycle. A new structured market
Tamale
Northern region/ Tamale district
Urban wholesale periodic market organized on a 6-day cycle. A relatively developed market with marketing facilities.
Techiman Savelugu
Brong Ahafo region/ Techiman district Northern region/ Savelugu Nanton district
Urban wholesale market organized from Wednesday-Friday weekly. A relatively developed market with marketing facilities Semi-Rural market organized on a 3-day cycle.
Source: Author’s Compilation1 B. ACTORS INVOLVED IN BAMBARA GRAIN MARKETING
Marketing of bambara grain like many other grains in Ghana is organized by several
individual private traders, who take the responsibility of transporting raw grain from the
production centers to the consumption centers. Co-ordination of their activities is rather
informal; each actor usually making the necessary arrangements for an efficient
execution of his or her business to derive maximum satisfaction and fulfill a societal
need. Categories of actors identified in the various segments along the distribution chain
for bambara include the following;
Production Segment
• Producers – These are small scale farmers who usually grow bambara in a mixed
rather than sole cropping farming system purposely for home consumption and
the surplus for sale. Approximately 35% of volumes of bambara produced is
utilized by the producer-households either as food and/or seed. Very few
producers engage in bambara cultivation for sale only. Sales are usually effected
1 The markets are not exclusive bambara markets, but bambara forms only a small part

11
5months after harvesting (May-June), when food is scarce and demand is at its
peak.
Unshelled bambara packaged in sacks for storage at the producer level
As indicated in the respondents’ profile, average area cultivated per farmer is about
1acre and some may cultivate as low as a quarter of an acre. This makes bulking of
bamabara grain more labour intensive and the role of middlemen very crucial.
Observations made during participatory interviews also revealed that most producers
do not visit the major markets. Though there are limited barriers of entry into these
markets, farmers prefer selling either in their homes or on the local markets to safe
time for other jobs and to avoid any inconveniences as well as risks in the marketing
process which traders are better placed to take.
Rural Assembly Segment
• Local Agents- These do not take title to the goods and therefore do not bear any
marketing risks, but buy on behalf of visiting itinerant traders who do not have
adequate knowledge about the local supply conditions for a fee. The local agent
has a very important role to play with primary responsibility of concentrating
relatively large volumes of grains at the village level. He/she sometimes has to

12
move from one village to the other in search of grains to buy using the visiting
traders’ capital.
• Visiting itinerant traders- This group provides the most permanently available
outlet for marketable surplus at the rural level. As indicated earlier, they employ
the services of buying agents for a fee. Some credible agents are also given cash
advances to facilitate purchasing.
• Local itinerant traders – These are residents who buy predominantly at the
farmer’s house or local markets with their own capital. They have adequate
knowledge of the local supply situation and most times have relatives or trusted
customers at the major marketing center.
• Truck pushers- These are used to transport grains from the farm gate to the
assembling point for on-ward transportation by big trucks to urban markets. Other
means of transportation employed at the assembling level include head load,
donkey carts and bicycles.

13
Truck pushers loading grains at Savelugu market
Wholesale Segment
• Agents- The market level commission agents sell/buy on behalf of visiting
traders. They sometimes make extra money when bambara is bought or sold
above the price agreed upon with owners. At Techiman market, the agents own
stores and therefore take custody of grains form assemblers and sell. They may
also run a small trade of their own and may use their experience gained as agents
to set up as independent wholesalers. Majority of the commission agents are men.
• Transporters - Transport is an important marketing facility linking production
centres to consumption centres. It was observed that traders make prior
transportation arrangements with transporters for commodity movements between
markets. The relationship between traders and transporters could be described as
healthy. Traders do not always accompany their good. In that case, packaging
materials are marked for identification purposes. Sometimes transportation costs
are borne by truck owners and payment made after sales. The drivers’ mates do
loading and unloading for a fee. The common type of transportation used in
transporting bambara and other grains and cereals is the mummy truck.

14
• Handlers – These are commonly seen in the wholesale segment and to a lesser
extent at the retail level. They are usually in charge of packaging or bagging.
After filling grains in jute sacks, the open end is sealed by sewing with tread and
needle. Bagging charges range between c1000 and c5000 per bag depending on
the market.
Packaging of grains at Savalegu Market in the Northern Region
• Wholesalers - These sell in bulk to other visiting wholesalers or to retailers. They
do not rush in selling because they hold large stocks using their own storage
facilities to ensure availability throughout the year and most importantly to get
attractive prices. Sometimes grains are treated and stored for a maximum of 1
year. Some of the wholesalers are men especially at the urban markets. At the
Tamale and Techiman markets for instance, majority (70%) of the grain
wholesalers are men.

15
Debulking/Retail Segment
• Retailers - These are permanent traders whose activities are restricted to local
markets. They sell in small quantities to consumers in bowls (a bowl of bambara
is about 2kg). They may sell up to 5bags per week depending on the location,
season and demand conditions. They usually visit the market with just enough
quantity to sell for a day and on few occasions hire a store for keeping unsold
grains at the end of each marketing activity. On the urban markets retailers could
sell on ‘sale or return’ basis and might not need to arrange for storage facility.
Wholesaler/Retailer measuring bambara with a koko bowl at Bolga wholesale market
Consumption Segment
• Processors/Food Vendors- Bambara processing is exclusively a female activity,
done individually but on specialized lines as detailed in the baseline report
conducted earlier. Bambara is commonly processed into koose, tubani and
gablee. It could also be sold roasted, freshly or dried boiled. A processor may
engage the services of hired female labour or assisted by female family members.
Processing levels are low, ranging between 1-10bowls of Bambara per day.
Usually more is processed on market days, which occur every 6days (6-day
cycle).

16
• Final Consumers - Consumption of bambara based products is popular among
people of Northern decent. It has a cultural significance and highly consume
during hanger periods. Though people in the southern Ghana usually consume
bambara sauce with fried plantain, there seems to be a general lack of knowledge
on the nutritive value of bambara in the south.
Other players
• District Assemblies- All the markets visited are managed by the market
management committees of the District Assemblies who are responsible for
infrastructural development. Market tolls/fees are charged for the use of covered
and open space or on the value of the produce sold.
• PPMED (MOFA) - Government of Ghana is committed to the provision of
comprehensive and timely market information services through the activities of
PPMED (MOFA). MOFA is responsible for market information on wholesale
and retail prices, and commodity movements; co-ordinating the collection,
compilation and dissemination of adequate, complete and reliable market
information. Unfortunately this information service facility covers only major
crops and legumes like cowpea, groundnut, and soyabean but not bambara.
• Creditor/Money lenders - Creditor or Money lenders generally help market
participants with financing. However it must be noted that all the respondents
interviewed claimed to have financed their trading activities through own
resources or with the help of retailers with the exception of retailers who some
times sell bambara on ‘sale or return’ basis and a few wholesalers at the major
market centres selling on behalf of farmer-relatives.
• Store/Stall Owners – These provide space for storage to both visiting traders and
permanent traders especially retailers who do not have storage facilities.

17
Store/Stall owners may charge permanent traders flat monthly rate but visiting
traders are charged daily or weekly.
C. DISTRIBUTION CHANNELS
Distribution channels present a systematic knowledge of the flow of goods and services
from the production center to the consumption center which forms major components of
the marketing margins analysis. A typical food commodity marketing system in Ghana
can be characterized by a flow chart representing product movements from producers to
consumers passing through subsequent stages of various distribution channels. At each
level of the distribution channel, spatially separated market, defined in this study as a
physical area where transactions are concluded, may be linked with each other through
arbitrage (Lutz and Tilburg, 1997). Unlike commodities with high level of utilization and
commercialization and therefore several distribution outlets, bambara has relatively
limited use with less distribution outlets. It is mostly produced in Northern Ghana and
some parts of Brong Ahafo and Volta regions but its level of consumption is variable,
highly location specific and largely influenced by tribe. Except for places where people
of the Northern decent are dominated, consumption of bambara is significantly tied to the
plantain harvesting season since people in the south especially consume fried plantain
with bambara sauce.
The study revealed that generally farmers produce bambara purposely for subsistence and
to a limited extent for sale. Although bambara farmers were engaged in the production of
cash crops, they did not abandon the production of household food requirements partly
because the farmers did not have confidence that the market would supply food products
when needed at affordable prices. The study also revealed that while transporting
bambara to the major market centers were decisively more profitable than selling in the
farming communities, farmers preferred selling through the latter channel. This could be
explained by lack of time on the part of the farmers and/or limited accessibility to the
major markets.
18
Place of Sale by Bambara Producers
92%
6% 2%
Locality
Rural Markets
Semi-UrbanMarkets
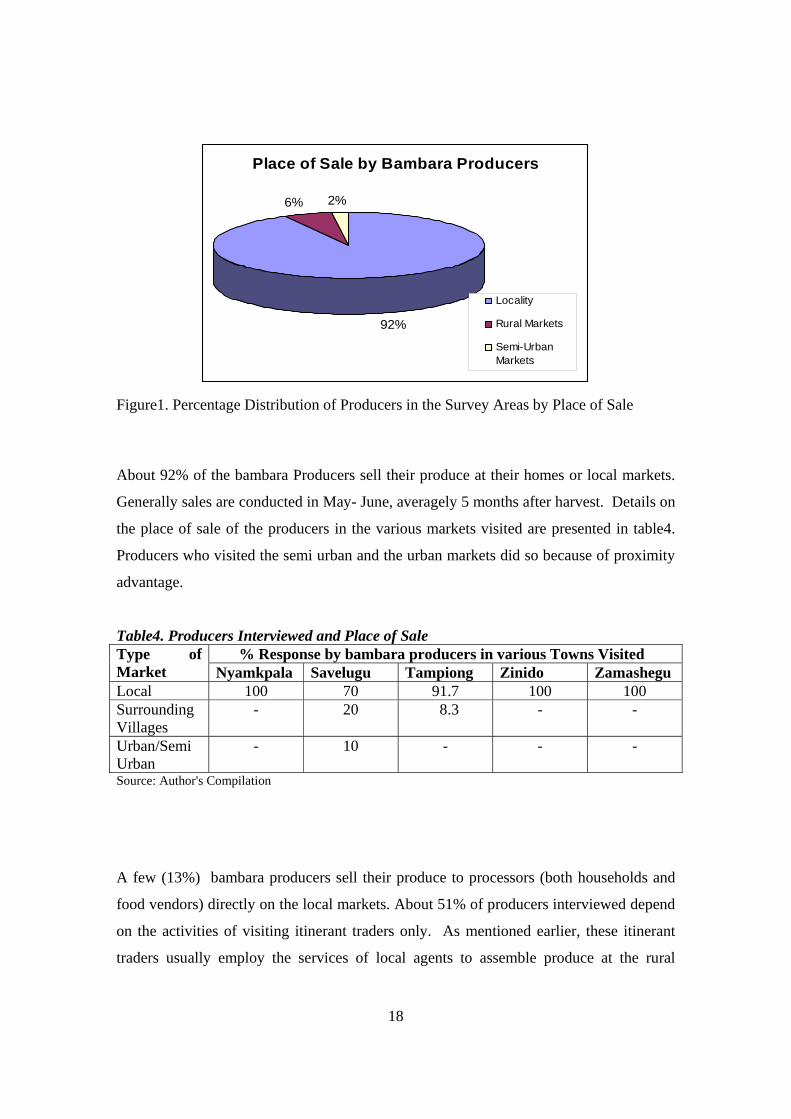
Figure1. Percentage Distribution of Producers in the Survey Areas by Place of Sale
About 92% of the bambara Producers sell their produce at their homes or local markets.
Generally sales are conducted in May- June, averagely 5 months after harvest. Details on
the place of sale of the producers in the various markets visited are presented in table4.
Producers who visited the semi urban and the urban markets did so because of proximity
advantage.
Table4. Producers Interviewed and Place of Sale % Response by bambara producers in various Towns Visited Type of
Market Nyamkpala Savelugu Tampiong Zinido Zamashegu Local 100 70 91.7 100 100 Surrounding Villages
- 20 8.3 - -
Urban/Semi Urban
- 10 - - -
Source: Author's Compilation
A few (13%) bambara producers sell their produce to processors (both households and
food vendors) directly on the local markets. About 51% of producers interviewed depend
on the activities of visiting itinerant traders only. As mentioned earlier, these itinerant
traders usually employ the services of local agents to assemble produce at the rural

19
periodic markets, which are organized on a 6-day cycle. Producers who sell directly to
local iterant traders only constitute about 12% of the sample interviewed while 6% sell to
retailers. It was also realized that few farmers had to buy bmbara seeds during planting
time. Table5 presents details on customers or type of buyers of bambara producers
interviewed.
Customers of Producers
12%
51%6%
13%8%
10%
Local itineranttradersOutside itineranttradersRetailers
Other farmers
Processors
Combination tick
Figure2. Percentage Distribution of Producers in Survey Areas by Type of Customers
Table5. Producers and Type of Buyers at the Various Survey Areas % Response by Bambara producers in various Towns Visited Type of
Buyer Nyamkpala Savelugu Tampiong Zinido Zamashegu Local Itinerant
40.0
22.2
-
-
-
Itinerant from outside
20.0
44.4
-
91.7
100.0
Retailer - 22.2 9.1 - - Other Farmers
40.0
-
-
8.3
-
Processors - - 63.6 - - Combination Tick
-
11.1
27.3
-
-
Source: Author's Compilation
Figure3 presents the distribution outlets for bambara. The study observed that significant
proportion of bambara is consumed in the North through three (3) main distribution
outlets outlined below:

20
Producer Processor Consumer
Producer Retailer/Wholesaler Processor Consumer
Producer Local itinerant trader Retailer/Wholesaler Processor Consumer
Again as depicted in figure3, there are relatively more bambara distribution outlets in the
South with at least two levels of wholesalers. Usually after assembling or bulking at the
rural and semi-rural markets in the North, the first level wholesaler (who could also be
described as assembler depending on the location) sells to the second level wholesaler
who usually links different markets especially, sub-urban markets to urban wholesale
markets in the South. Examining the commodity flow summary table gives indication on
where bambara from markets in the production centers are transported to. For instance,
there were wholesalers from the south who operated between Zamashegu – Kumasi and
Accra markets while others linked Techiman/Tamale markets to wholesale markets in
southern Ghana (Accra, Cape Coast, Sekondi Takoradi, Tarkwa, Obuasi, Axim, etc, see
table 6). Unlike other cereals and legumes, movements of bambara wholesalers are less
guided by price signals and supply availability.
There was high degree of variations in the marketing seasons; while peak bambara
trading period occurs in the month of January-February in the South, coinciding with the
plantain season that of the North occurs in the month of May-June when other food crops
are scarce. This suggests some level of collusive price-setting behaviour on the part of
traders who have the capital and storage facility to store bambara (since bambara has high
storage ability and therefore could be kept for long periods at any stage of the
distribution channel before selling) when farmers are willing to buy and resell within the
southern peak trading period. It was also gathered from this study that some amount of
bambara grain is imported from Niger.

21
Figure3. Flow Chart Depicting Distribution Channels for Bambara
Volumes Traded Generally volume of bambara traded is low and highly seasonal as confirmed by traders
and transporters interviewed. During the off-season bambara is rarely seen on the rural
market. During the peak trading season when farmers are willing to sell of their produce,
a wholesaling volumes range between 5-20bags per trader per market day while retailing
Volumes range between 2-5 bags per trader. A retailer/wholesaler sells between 3-12bags
per market day.
Factors Affecting Volumes Traded
Pooled responses on factors affecting volumes of bambara traded are presented in table 7.
The key factor affecting volumes traded at the market visited is limited demand. As
expected over time, this has affected supply response as farmers do not have confidence
in the demand and therefore play it safe by usually producing according to the dictates of
Local itinerant Traders
Outside Itinerant Traders/Trucker
First level Wholesaler
Second Level Wholesaler
Retailer/Wholesaler
Retailers
Several small scale Producers (consume approx. 35% of quantity produced)
Local Assembler
Consumers
Processors/Food Vendors

22
market forces.
Table6. Summary of Bambara Commodity Flow Town Source of Supply Destination of Product Production Center Zinindo Zamashiegu Nyankpala Savelugu Tampiong
-do- -do- -do- -do- -do-
Savelugu, Tamale, Kumasi, Accra, Gushiegu, Tamale - Tamale, Kumasi, Techiman, Accra, Tarkwa, Takoradi Tamale, Savelugu
Market Center Bolga Tamale (Aboabo) Nyankpala Savelugu Techiman
Limbensi, Nerigu, Walewale, Bimsi Yendi, Kambaga Nyamkpala and surrounding villages Gushiegu, Bakurugu, Pashigu, Tamaleku, Sung Yendi, Tamale, Bole, Bupei, Hamile, Salaga, Bimbila, Wa, Walewale, Brong Ahafo, Niger and Burkina
Kumasi, Techiman, Tamale Kintampo, Techiman, Accra, Kumasi Tamale, Kumasi, Techiman, Accra, Tarkwa, Takoradi Takoradi, Axim, Kumasi, Obuasi, Akasti, Tarkwa, Cape Coast, Ada
Source: Author's Compilation

23
Table7. Pooled Responses on Factors Affecting Volumes of Bambara traded % Response
Factors Yes No No Response Rank
Transportation Difficulties 15.0 77.5 7.5 5 Limited Supply 52.5 40.0 5.5 2 Many Traders/Sellers 7.5 85.0 7.5 7 Lack of Finance/Credit 37.5 55.0 7.5 4 Limited Demand 55.0 37.5 7.5 1 Risk of quality Changes 0 95.0 5.0 8 Risk of Price Changes 10.0 82.5 7.5 6 Inadequate Capital 45.0 47.5 7.5 3 Source: Author's Compilation
Thus there was a high relationship between limited supply and limited demand using the
Pearson Correlation method at 0.01 level of significance. The low, stagnant demand for
bambara does not suggest low profit opportunities for traders. Also the fact that there
were not too many traders in the distribution chain (since traders indicated that this does
not significantly affect volumes of bambara traded) does not suggest any form of barrier
to market entry.
Table8. Market Specific Ranking of Factors Affecting Volumes of Bambara Traded
Ranking at Various Markets Visited Factors Affecting
Volumes traded Bolga Savelugu Tamale Nyamkpala Techiman
Transportation Difficulties - - - 3 -
Limited Supply 2 1 4 4 -
Many Traders/Sellers 2 - 4 - 2
Lack of Finance/Credit 2 - 2 1 -
Limited Demand 1 2 3 - 1
Risk of quality Changes - - - - -
Risk of Price Changes - - 4 - 3
Inadequate Capital - - 1 1 4 Source: Author's Compilation
Other factors that affected volumes traded at the markets visited are adequate capital, lack

24
of credit, transportation difficulties, risk of price changes, too many traders and risk of
quality deterioration in decreasing order of importance. Location specific ranking of
factors affecting volumes traded is presented in table 8.
D. PRICES AND MARKETING MARGINS
Prices
Prices, whether those received by farmers or charged to wholesalers, processors, and final
consumers are the most important elements in the marketing system in influencing the
contribution of agriculture to economic development. Major investments in the
improvements of marketing infrastructure will be ineffective if the prices generated
within the system are inefficient (Feldman and Ohene-Yankyerah, 1984). Data on prices
at the various levels of the distribution chain is used in calculating the marketing margins.
Table 9 presents prices of bambara at the farmgate or the farmer’s houses level. For the
purposes of this study, the ‘index farmgate price’ which forms the basis of comparisons
of prices for the marketing margin analysis is generated from taking the average of all the
prices at the various production centers visited as shown below. It must be noted that in
Ghana, most traders who handle cereals and legumes use the koko bowl measure. It is
not uncommon for a trader to sell at the original purchase price, but because of the use of
the measure as a unit still makes quite a handsome profit from changes in the weight of
different bowl sizes. The rural assembler, wholesale and retail prices of bambara are also
generated from the origin and destination price analysis for both peak and lean seasons
presented in table 10. The origin market prices are the prices pertaining at the sources of
supply while the destination market prices refer to prices at the demand side markets (See
commodity flow table). Unfortunately, there were variations in the seasonality of prices
in the southern and northern markets as indicated elsewhere in this report. Peak bambara
trading period occurs in the month of January-February in the South, coinciding with the
plantain season that of the North occurs in the month of May-June when other food crops
are scarce. Differences in harvesting and trading seasons create misinterpretation of peak
and lean periods. In the case of bambara, peak trading period is not the harvesting period

25
but rather the time when farmers are willing to sell. At the time of harvesting bambara is
rarely seen on the rural markets and therefore signifies the lean trading season.
Table9. Analysis of Farm gate Price Descriptive Statistics of Farmgate Prices / bowl Areas Visited
Min Max Mean Std. Dev Nyamkpala 5000 6000 5500 840 Savelugu 5000 7000 5300 973 Tampiong 4500 6000 5000 820 Zinindo 4500 6000 4600 930 Zamashiegu 4500 6000 4670 580 Total Average - - 5014 - Source: Author's Compilation
Table10. Price Analysis at Traders Level Price/Bowl at Origin Markets (GHC) Peak Season Lean Season Min Max Mean Std. Dev Min Max Mean Std. Dev Bolga 5000 5500 5259 353 6000 8000 7333 1154 Savelugu 5000 5000 5000 - 7000 8500 7750 1060 Tamale 4000 6000 5000 634 6000 10000 7350 1055 Nyamkpala 4500 6000 5285 487 7000 9500 7785 1074 Techiman 5000 6500 5571 583 9000 10000 9250 452 Price/Bowl at Destination Markets (GHC) Peak Season Lean Season Min Max Mean Std. Dev Min Max Mean Std. Dev Bolga 6000 6000 6000 - 9000 10000 9500 701 Savelugu 6000 6500 6250 707 9500 9500 9500 - Tamale 5000 7000 5600 658 7000 12000 8300 1398 Nyamkpala 5000 7000 6071 607 8000 10000 8714 951 Techiman 5500 10000 6428 1141 10000 11000 10208 396 Source: Author's Compilation
Varietal Preference and Pricing Bambara varieties found on the markets are white/cream, red, dark and a mixture of all
colours. There were price differentials with respect to varieties on the market. The study
revealed that the cream/white variety attracts the premium price; a difference of

26
c1000/bowl above the selling price of the other varieties. It was however, indicated by
some of the traders that the red variety from Niger was preferred mostly by consumers
who use bambara for sauce.
Price Determination
Pricing of bambara like many agricultural commodity is not controlled by any external
force; usually the price of a commodity on the previous market day becomes the basis for
negotiation. At the producer level, price determination is highly influenced by
negotiation with a buyer initially but once price settles at some point the going or current
price for a particular market day is taken by all.
Table11. Pooled Responses on Mode of Price Determination % Response at Producer Level
% Response at Trader Level
Mode
No Yes No Yes Negotiation with a broker 97.7 2.3 91.9 8.1 Negotiation with a buyer 11.9 88.1 35.1 64.9 A Certain mark-up on a buying price
88.4 9.3 73 27
Current Price 26.2 73.8 16.2 83.8 A price set by trader Association
74.4 23.3 81.1 18.0
A price fixed by the owner 55.8 44,2 62.2 37.8 Source: Author's Compilation
Usually, producers who visit trading centers or urban and semi urban markets who are
supposed to be agents of price transmission to other producers, are deceived by the false
weights of the bowl measure used. Supposedly unattractive margins could therefore
become disincentive for some farmers to transport their produce to such markets for sale.
Some producers also expressed a significant influence of urgent cash needs on price
determination. Table 11 presents pooled responses on factors affecting mode of price
determination at producer and trader levels. Mode of payment at farm gate is purely cash
and carry. However an appreciable level of retailing is on ‘sale or return’ basis.

27
Marketing Margin Analysis
The term marketing margin is commonly used to refer to the difference between producer
and consumer prices of an equivalent quantity and quality of a commodity (Tomek and
Robinson, 1990). However, it may also describe price differences between other points
in the marketing chain. It is a price charged for providing a mix of marketing services-
assembling, Transportation, Handling, Packaging, Storage, etc, etc.- plus profit.
Under competitive conditions, the size of marketing margins would be the outcome of the
supply and demand for marketing services, and they would equal the minimum costs of
service provision plus ‘normal’ profit, where normal profit refers to the least payment the
owner of an enterprise would be willing to accept for performing the entrepreneurial
function including risk-taking, management etc,etc. However, under oligopsonistic
conditions, collusive price-setting behaviour that weakens the position of the farmer
exists. This causal relationship implies that equity issues can be resolved by improving
market structures. Thus marketing margins are major determinants of the efficiency of
resource allocation in production, distribution and consumption. It is an important means
of assessing the efficiency of price formation and transmission through the distribution
system. Some researchers argue that lowering of marketing margins is the most efficient
and sustainable short-run means of solving the dilemma between producer’s desire for
higher prices and consumer for lower food prices. It should be noted that unless
marketing is competitive, lowering the cost of marketing would not necessarily benefit
producers or consumers. Similarly unless consumers’ preferences are responded to
lowering the gross margin will not benefit them. Thus improving technical or operational
efficiency without simultaneously addressing exchange or economic efficiency prevents
such potential from being realized.
The village and urban markets constitute the most important market levels in the
Ghanaian food industry. Each one of these serves as a link in a chain of institutions
affecting the marketing process. Marketing charges link prices at each of these levels and
consumers serve as the prime movers of the whole process. Farmers are naturally
inclined to think that any current system of marketing is costly in relation to the services

28
given, and that all traders absorb too high a proportion of the final prices paid by
consumers. Though this assertion could be true, farmers either have no choice or are
reluctant to take the risk involved in marketing services and thereby increasing the level
of producer participation margin.
Using the Estimation procedure below, the gross marketing margins at the various levels
of the distribution chains are calculated and results presented in table 12. The key trader
levels in the distribution chain identified include farmgate, rural assembly level,
wholesale level 1, wholesale level 2 and retail level. Average prices at these levels are
generated from trader responses. The producer participation contribution is then
calculated by deducting the total gross margin from 100% as indicated in the estimation
procedure. As revealed in the analysis, bambara producers interviewed did not indicate
any marketing charges since sale of produce was mostly effected at their homes.
Although bambara is stored for sometime before selling farmers could not provide
information on storage charges.
It must be noted that the differences in the number of bowl measures constituting a bag
at the various distribution levels were considered in the gross margin analysis. A bag of
bambara contains average of 35 bowls and 40 bowls at the farm gate and retail level
respectively, suggesting the need to standardize units of measurement for most
Agricultural commodities for efficient pricing system.
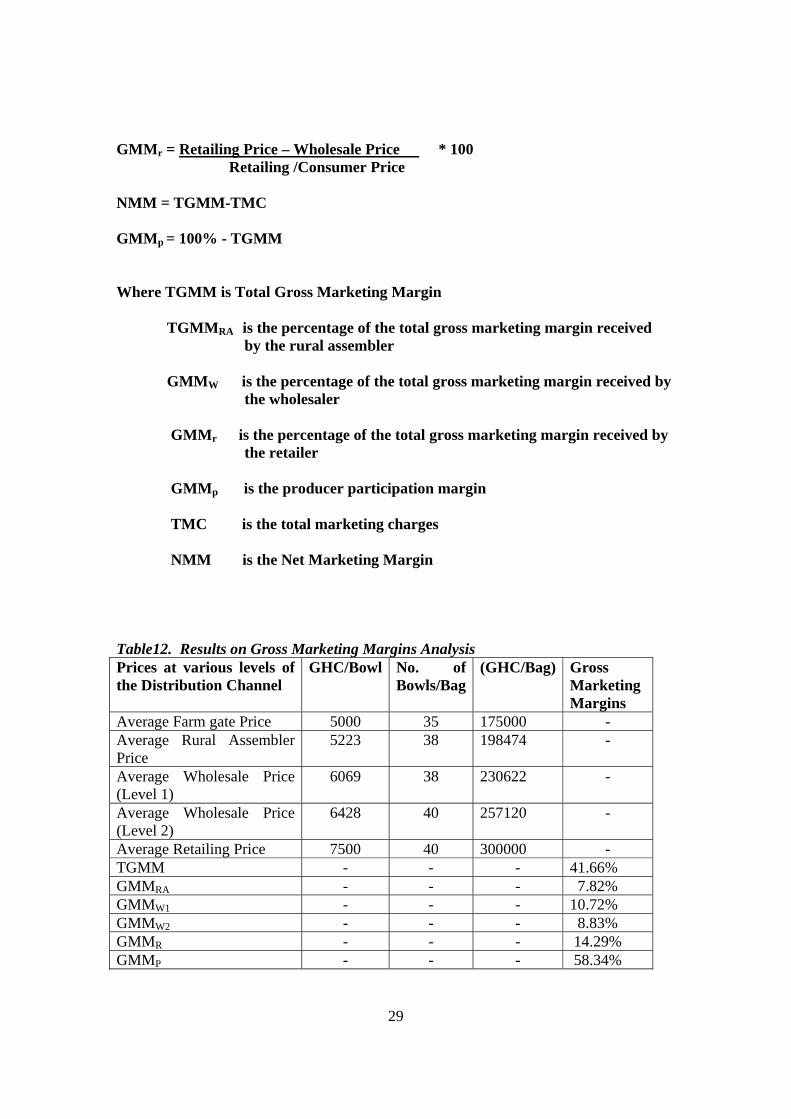
TGMM = Retailing Price – Farm gate Price Retailing/Consumer Price
TGMMRA = Rural Assembler Price- Farm gate Price * 100 Retailing /Consumer Price GMMW = Wholesale Price - Rural Assembler Price * 100 Retailing /Consumer Price
29
GMMr = Retailing Price – Wholesale Price * 100 Retailing /Consumer Price NMM = TGMM-TMC GMMp = 100% - TGMM Where TGMM is Total Gross Marketing Margin TGMMRA is the percentage of the total gross marketing margin received
by the rural assembler GMMW is the percentage of the total gross marketing margin received by
the wholesaler GMMr is the percentage of the total gross marketing margin received by
the retailer GMMp is the producer participation margin
TMC is the total marketing charges
NMM is the Net Marketing Margin Table12. Results on Gross Marketing Margins Analysis Prices at various levels of the Distribution Channel
GHC/Bowl No. of Bowls/Bag
(GHC/Bag) Gross Marketing Margins
Average Farm gate Price 5000 35 175000 - Average Rural Assembler Price
5223 38 198474 -
Average Wholesale Price (Level 1)
6069 38 230622 -
Average Wholesale Price (Level 2)
6428 40 257120 -
Average Retailing Price 7500 40 300000 - TGMM - - - 41.66% GMMRA - - - 7.82% GMMW1 - - - 10.72% GMMW2 - - - 8.83% GMMR - - - 14.29% GMMP - - - 58.34%

30
Table13. Marketing Charges at Various Levels of the Distribution Chain
Marketing Charges (GHC) Cost Item Rural
Assembly Wholesale Level 1
Wholesale Level 2
Retail Level
Transportation 4000 6000 4000 - Storage - 5000 2000 - Market Toll - 1000 1000 500 Handling & Packaging
2000 4000 2000 1000
Total 6000 16000 9000 1500 Total as % of Retail price
2.00 5.30 3.00 0.50
GMM (%) 7.82 10.72 8.83 14.29 NMM (%) 5.82 5.42 5.83 13.79 Results of the marketing margins analysis showed a total gross marketing margin of
41.66% with producer participation margin of 58.34%. The gross marketing margin for
bambara is rather on the high side as compared to that of sorghum which is about 30%.
Approximately 11% out of a total gross marketing margin of 41.66% constitutes the total
marketing charges, giving a net marketing margin of 30.66%. Although this suggests an
appreciable level of abnormal profits reaped by traders, volumes traded are relatively low
as compared to other cereals and legumes. Again disaggregating total net marketing
margins by the key traders along the distribution chain indicate that retailers absorb a
higher proportion of the total which compensates for the low volumes traded. However,
there is a fair representation of profit allocation among assemblers and wholesalers.
E. CONCLUSIONS AND RECOMMENDATIONS
Conclusions
• Generally, bambara is a low volume traded product at both wholesale and retail
levels as compared to other legumes and has limited distribution outlets.

31
• Approximately 35% of volumes of bambara produced is utilized by the producer-
households either as food and/or seed.
• About 92% of the bambara Producers sell their produce at their homes or local
markets probably because of convenience and the perception that traders are
better placed to take marketing responsibilities.
• Sales are usually effected 5months after harvesting (May-June), when food is
scarce and demand is high. However, high demand in the South coincides with
the plantain season which occurs in January-February.
• A few (13%) bambara producers sell their produce to processors (both households
and food vendors) directly on the local markets. About 51% of producers
interviewed depend on the activities of visiting itinerant traders only. Producers
who sell directly to local iterant traders only constitute about 12% of the sample
interviewed while 6% sell to retailers.
• The bambara marketing structure could be classified as an oligopsonistic one,
having few buyers. Pricing is based largely on negotiation/bargaining power, than
with the true value of the product and the position of the producer in price
formation is weak.
• Consumers have little knowledge of bambara based products
• The Total Gross Marketing Margin for bambara is estimated at 41.66% with
Producer Participation Margin of 58.34%. Total Marketing Charges is
approximately 11%; giving a Total Net Marketing Margin of 30.66%.
Recommendations
• Develop consumer educational programs focusing on the contribution of bambara
to health and nutritional requirements as well as its unique flavour
• Focus market expansion effort on both bambara consumers and non bambara
consumers using value based marketing strategy since attracting new consumers
to the bambara industry is the key to improving the level of price competition and
extent to which the forces of supply and demand determine price

32
• Develop a viable bambara market information system to improve on price
formation and transmission through the distribution system as well as the
efficiency of resource allocation among farmers and traders
• Consumer preference for bambara variety from Niger in the South should be
further investigated into
• A post storage survey would have to be conducted in May/June 2004 with much
emphasis on proportions of bambara grain traded at various stages of the
distribution chain to support data gathered for the current study.

33
APPENDIX 1
QUESTIONNAIRE ON BAMBARA - PRODUCERS
A. SOCIO-ECONOMIC PROFILE OF RESPONDENTS
i. Respondent code Number……….. iii. Name of market………………………. ii. District…………………………… iv. Date of interview ………………. v. Region…………………………….. vi. Name of respondent ………………………… 1. Sex Male =1 female =2 2. Age 3. Educational level No formal education =1 Primary/JSS/Middle =2 Secondary/SSS =3 others (specify) =4…………………….. 4. Religion Christian =1 Moslem =2 Traditionalist=3 others (specify) =4……………………………. 5. Marital status Married =1 Single =2 Divorced =3 Separated =4 Widowed =5 6. Family size 7. Main occupation Trading =1 farming =2 fixed-salary based job =3 Others (specify) =4 ……………………………… B. Production 8. Indicate how your last harvest was distributed

34
Last harvest Response
Area of cultivation
Quantity harvested
Quantity utilized
Quantity sold
Gifts if any
9. Type of variety cultivated
Variety* Proportion sold ** Price sold
** proportion out of 10 10. Description of sale
Quantity
Time of sale (months after harvest)
Price
Place of sale
Type of buyer
Source of buyer Method of payment 11. Indicate any change in buyers from one marketing season to another
35
C. Price determination
12.. How do you determine price? Mode Response (1=yes 2 =no) Rank (1=most important)
Negotiation with a broker/commission agent
Negotiation with a buyer A certain mark –up on a buying price
The current market price A price set by trader association/union
A price fixed by the owner Other (specify) 13. What factors influence price determination? 1Road conditions 2.Transportation mode 3.Distance 4.Supply and demand condition 5. Traders margin 6.Others (specify)
D. Mode of transportation 22. What mode of transport do you use?
Stage of movement Mode of transport Farm-gate to assembly point Assembly point to local market Local market to urban/sub urban market
1.headload 2.Vehicle (indicate……………….) 3. Draught animal 4.other (specify)……. 23. Transaction cost: Transportation Type of vehicle Distance involved Cost/unit volume Storage Type of storage Duration of storage Cost/unit Taxation Type Tax/unit
Handling & Packaging
Loading Unloading Cost/unit
Constrains (rank in decreasing order of importance)

36
APPENDIX 2
QUESTIONNAIRE ON BAMBARA - TRADER
A. SOCIO-ECONOMIC PROFILE OF RESPONDENTS
i. Respondent code Number……….. iii. Name of market……………………….
ii. District…………………………… iv. Date of interview ……………….
v. Region…………………………….. vi. Name of respondent …………………………
1. Sex
Male =1 female =2 2. Age 3. Educational level No formal education =1 Primary/JSS/Middle =2 Secondary/SSS =3 others (specify) =4…………………….. 4. Religion Christian =1 Moslem =2 Traditionalist=3 others (specify) =4……………………………. 5. Marital status Married =1 Single =2 Divorced =3 Separated =4 Widowed =5 6. Family size 7. Main occupation Trading =1 farming =2 fixed-salary based job =3 Others (specify) =4 ……………………………… 8. Secondary occupation 9. Type of trader Wholesaler =1 retailer =2 wholesaler/retailer =3 Commission agent =4 others (specify) =5 …………………… 10. Number of years of trading in Bambara
B. MAJOR SOURCES OF SUPPLY 11. What type of producer or trader sells to you? (Rank in order of importance)
37
Source of product (town/village)
Response (Yes =1, No =2) Price/bag
Rank (1=most important)
Own farm product
Individual farmer
Farmer groups
Other farmers
Other (specify) 12. Do you belong to any association? Yes =1 No =2 13. If yes, what services do these associations provide to their members? Services Response (1=yes, No =2 ) Loans or Credit Information on prices Co-operative buying Transport Rules on weight and measures Agreement on selling prices Other specify
C. SEASONAL VARIATIONS IN SUPPLY AND PRICES 14. For bambara traded in this market in which month(s) are the prices highest or lowest? Product Purchasin
g price Selling price
Highest price/month Lowest price month
Origin market
Destination market
Origin market
Destination market
15. In which month(s) are volumes traded highest ………… bags sold/day…………… 16. In which month(s) are volumes traded lowest………….. bags sold/day/week…….

38
D. FACTORS AFFECTING VOLUMES TRADED 17. What are some of the factors that affect the volumes traded?
Factors affecting Response (1 =yes 2 = No) Rank (1=most important) Transport difficulties Limited supply Too many other traders Lack of finance or credit Not enough customers Risk of quality deterioration Risk of price changes Not enough capital Other (specify)
E. DESTINATION OF MAJOR CUSTOMERS OF TRADER
18. Who buys your product in this market? Name of buyer (place) Response (1=yes 2 =no) Rank ( 1 =most important ) Final consumer Local retailer Processor Trader who sells in another market
Commission agent Other (specify) 19. If more than one type of buyer, how many parts out of 10 of your total sales are sold to the most usual buyer?………………………..
F. MODE OF PRICE DETERMINATION
20. How do you determine price? Mode Response (1=yes 2 =no) Rank (1=most important)
Negotiation with a broker/commission agent
Negotiation with a buyer A certain mark –up on a buying price
The current market price A price set by trader association/union
A price fixed by the owner Other (specify) 21. What factors influence price determination?

39
1Road conditions 2.Transportation mode 3.Distance 4.Supply and demand condition 5. Traders margin 6.Others (specify)
G. TYPE OF VARIETY SOLD, SOURCE, PROPORTIONS AND PRICE SOLD
Variety* Proportion sold ** Source Price sold
** Proportion out of 10
H. MODE OF TRANSPORTATION 22. What mode of transport do you use?
Stage of movement Mode of transport Farm-gate to assembly point Assembly point to local market Local market to urban/sub urban market
1.headload 2.Vehicle (indicate……………….) 3. Draught animal 4.other (specify)……. 23. Transaction cost: Transportation Type of vehicle Distance involved Cost/unit volume
Storage Type of storage Duration of storage Cost/unit Taxation Type Tax/unit
Handling Loading Unloading Packaging Type Cost/unit Other (specify)
I FINANCING 24. How do you finance your marketing activities?………………………. 25. If borrowed funds state interest charges…………

40
REFERENCES
Azam-Ali, S.N. and Squire, G.R. (2001). Principles of Tropical Agronomy. CAB International, Wallingford, UK. (In press).
Azam-Ali, S.N., Sesay, A., Karikari, S., Massawe, F.J., Aguilar-Manjarrez, J., Bannayan, M. and Hampson, K.J. (2002) Assessing the potential of an underutilised crop - A case study using bambara groundnut. Experimental Agriculture (submitted).
FAO (1993): World Food Report. Food & Agricultural Organization, Rome Italy.
Han, S. L., D. T. Wilson and S. P. Dent (1993). Buyer- Supplier Relationship Today. Industrial Marketing Management. Vol. 22. pp. 331-38.
Heide, J. B. and G. John (1990). Alliances in Industrial Purchasing: The Determinants of Joint
Action in Buyer-Seller Relationships. Journal of Marketing Research. February. pp. 24-36.
Lutz, C., and A. van Tilburg (1997). “Framework to Assess the Performance of Food Commodity
Marketing Systems in Developing Countries with Application to the Maize Market in Benin”, in Sustainable Food Security in West Africa, edited by W. K. Asenso-Okyere, George Benneh and Wouter Tims. Kluwer Academy Publishers. London, U. K.
Morgan, R. M. and S.D. Hunt (1994). The Commitment-Trust Theory of Relationship Marketing.
Journal of Marketing,. pp. 20-38 No. 10 Cornell Food and Nutrition Policy Program. Smith, L. E. D., A. M. Khushk and M. Stockbridge (1999). Case Studies of Corruption in
Agricultural Markets in Sindh Province, Pakistan, and Implications for Market Liberalization. Journal of International Food and Agribusiness Marketing. Vol. 11, No. 1, pp. 19-41.
Tomek, W.G. and K.L. Robinson, (1990). Agricultural product prices. 3 Ed. Cornell University
Press.