Azbil Corporation RIC: 6845.T, Sedol: 6985543 …2015/05/10 · Human-centered Automation Azbil...
25
Human-centered Automation Azbil Corporation RIC: 6845.T, Sedol: 6985543 Analyst Meeting Materials For the Q3 Ended Dec. 31, 2014 (Japan GAAP) 1. Financial Results for the Q3 Ended Dec. 31, 2014 (Apr. 1, 2014 to Dec. 31, 2014) 2. Financial Plan for the Fiscal Year Ending Mar. 31, 2015 →No revision from the recent announcement 3. Return to Shareholders →No revision from the recent announcement <Contents> Investor Relations, Group Management Headquarters Email: [email protected] URL: http://www.azbil.com/ir/
Transcript of Azbil Corporation RIC: 6845.T, Sedol: 6985543 …2015/05/10 · Human-centered Automation Azbil...

Human-centered Automation
Azbil Corporation RIC: 6845.T, Sedol: 6985543
Analyst Meeting MaterialsFor the Q3 Ended Dec. 31, 2014 (Japan GAAP)
1. Financial Results for the Q3 Ended Dec. 31, 2014(Apr. 1, 2014 to Dec. 31, 2014)
2. Financial Plan for the Fiscal Year Ending Mar. 31, 2015→No revision from the recent announcement
3. Return to Shareholders→No revision from the recent announcement
<Contents>
Investor Relations, Group Management HeadquartersEmail: [email protected]: http://www.azbil.com/ir/

2
2014/3 2015/3Q4 Q1 Q2 Q3 Q4
① Azbil Production (Thailand) Co., Ltd. ● ● ● ● Increased significance
② Azbil Saudi Limited ● ● ● ● Increased significance
●: B/S consolidation
Newly consolidated companiesReason forconsolidation
Notes:
1. Financial data and financial statements have been prepared based on Japan GAAP and the amounts have been rounded down.
2. Segment names are abbreviated as follows.B A: Building AutomationA A: Advanced AutomationL A: Life Automation
3. Each segment amounts include internal transactions between business segments.
4. The financial plan is based on management’s assumptions, intent and expectations in light of the information currently available to it, and therefore this plan is not a guarantee of future performance. Due to various factors, actual results may differ from those discussed in this material.
5. The current status regarding newly consolidated companies is as follows.
* Simultaneously, order backlog at the time of consolidation is recorded under orders.
*

3
1. Financial Results for the Q3 Ended Dec. 31, 2014 (Apr. 1, 2014 to Dec. 31, 2014)

4
[Billions of yen]
(A) (B) (A) - (B) % Change
Orders received 208.2 195.8 12.3 6.3
Net sales 176.5 169.6 6.9 4.1
Japan 144.1 136.9 7.1 5.2
Overseas 32.4 32.6 (0.2) (0.7)
Gross profit 61.2 57.4 3.8 6.7
% 34.7 33.9 0.9P
SG & A 54.7 53.3 1.3 2.5
[include amortization of goodwill] [1.4] [1.4] [0.0]
Operating income 6.5 4.0 2.5 62.8
% 3.7 2.4 1.3P
Ordinary income 8.6 5.0 3.6 72.2
Net income 4.0 2.6 1.4 53.4
% 2.3 1.6 0.7P
12.90.65.36.0
DifferenceThis period Same periodlast year
Income before income taxes andminority interests
■ Both orders received and net sales increased mainly due to the growth of the BA* and AA businesses. Orders received and net sales for the LA business decreased because of the worsening business conditions abroad, etc.
■ Despite increased R&D expenses and the expenses incurred for updating core information systems, operating income increased significantly due to the growth in net sales and the initiatives aimed at cost improvement.
1. Financial Results for the Q3 Ended Dec. 31, 2014(Apr. 1, 2014 to Dec. 31, 2014)
Consolidated Financial Results[Compared to the same period last year]
* In the BA business, orders resulting from the renewal of a number of large-scale service contracts that span several years (totaling about 7.6 billion yen) have been included in the period’s orders received.
* *

5
[Billions of yen]
(A) (B) (A) - (B) % Change
■ B A Orders received 100.6 86.8 13.7 15.8
Sales 75.0 70.5 4.5 6.4
Segment profit 5.3 3.3 1.9 58.1
% 7.1 4.8 2.3P
0.1 0.1 0.0(Ref erence) Amortization of goodw ill
Same periodlast year DifferenceThis period
1. Financial Results for the Q3 Ended Dec. 31, 2014(Apr. 1, 2014 to Dec. 31, 2014)
Segment Information - ■ B A Business[Compared to the same period last year]
■ Economic recovery and growing power/energy-saving needs following a rise in electricity charges meant that the Japanese market continued to be robust. In addition, large-scale service contracts spanning several years (orders received through “market testing”) were renewed, * and as a result there was strong growth in orders received. Sales too grew thanks to favorable conditions in the Japanese market.
■ Segment profit increased significantly. This can be attributed to increased sales in the Japanese market resulting from growth in the new buildings field, as well as in more profitable fields as existing buildings and service, and also the success of efforts to improve construction profitability.
* In the BA business, orders resulting from the renewal of a number of large-scale service contracts that span several years (totaling about 7.6 billion yen) have been included in the period’s orders received.
* *

6
1. Financial Results for the Q3 Ended Dec. 31, 2014(Apr. 1, 2014 to Dec. 31, 2014)
Segment Information - ■ A A Business
■ In addition to an improvement in the market of control products for equipment manufacturers, orders were received for large-scale projects in the Japanese market. Also, steady business expansion was achieved overseas and, with the addition of a new subsidiary, overall orders received grew steadily. Primarily due to increased sales of control products to equipment manufacturers in Japan and abroad, overall sales also grew.
■ Segment profit increased significantly, mainly as a result of sales growth.
[Compared to the same period last year]
[Billions of yen]
(A) (B) (A) - (B) % Change
■ A A Orders received 72.9 70.3 2.6 3.8
Sales 66.8 63.7 3.0 4.8
Segment profit 2.9 1.4 1.4 99.0
% 4.4 2.3 2.1P
0.2 0.2 0.0
DifferenceThis period Same periodlast year
(Ref erence) Amortization of goodw ill

7
[Billions of yen]
(A) (B) (A) - (B) % Change
■ L A Orders received 35.9 39.9 (4.0) (10.2)
Sales 35.6 36.1 (0.4) (1.3)
Segment profit (loss) (1.7) (0.8) (0.8) -
% (4.8) (2.3) -
1.0 1.0 (0.0)
This period DifferenceSame periodlast year
(Ref erence) Amortization of goodw ill
■ With the economic slowdown in emerging countries and increasing competition, the business environment of the Life Science Engineering (LSE) field continued to be challenging. Owing mainly to the decline in the LSE field’s performance, overall orders received and sales for this segment were down, although recently there have been signs of recovery brought about by the ongoing, radical reforms of the business structure*.
■ Segment loss increased owing mainly to a fall in profits caused by lower sales and projects for which profit margins were slim in the LSE field.
1. Financial Results for the Q3 Ended Dec. 31, 2014(Apr. 1, 2014 to Dec. 31, 2014)
Segment Information - ■ L A Business[Compared to the same period last year]
* For more detailed information, go on to the next page (P.8).

8
1. Financial Results for the Q3 Ended Dec. 31, 2014(Apr. 1, 2014 to Dec. 31, 2014)Progress of the Business Structure Reforms in the LSE field
Life Science Engineering
The LSE fieldAims
&Progress
Within this fiscal year, steps will be taken to strengthen the business structure of Azbil Telstar –the core of the LSE field – to ensure a recovery in performance in the year ending Mar. 2016.
2015/3 Q3Implementation
measures
■ Now we are actively implementing sweeping measures to reinforce the business structure. These include radical business structure reforms and the reorganization of Azbil Telstar, S. L., the core of the LSE field.
For global expansion, targeting pharmaceutical formulation, research and the production of functional foods markets, a new business field was established within the LA business that combines manufacturing processes and automation.
The company now known as Azbil Telstar already possessed expertise in pharmaceutical manufacturing processes as well business contacts within this sector when it was purchased to form the core of the LSE business field.
In the year ending Mar. 2015, because of the economic slowdown in emerging countries, orders decreased and increasing competition intensified, led to a worsening of profitability. Also, a result of actively expanding the business and scope, problems in the organizational structure were revealed, and loss was recorded. This led to the implementation of sweeping measures aimed at recovery in the business performance.
Structural reforms through business restructuring and regional integration. EPC (engineering, procurement, and construction) business structure reforms (Europe, South America) Liquidation of unprofitable subsidiaries (Europe, South America) Staff cutbacks and drastic reductions in administrative cost through business consolidation and
operational base consolidation (Europe, South America, North America, China) Strengthening the core business of providing manufacturing equipment to pharmaceutical manufacturers
Strengthen the products and related technology for the manufacturing equipment business in cooperation with the R&D department of Azbil Corporation.
Ensuring profitability through the thoroughgoing job management Dispatch staff from Azbil; create an integrated business structure – spanning proposal, design,
production, delivery and maintenance – and raise the total level of business administration.
As extraordinary losses, a restructuring loss (approx. 0.4 billion yen) and a goodwill impairment loss (approx. 1.7 billion yen) were recorded through the measures in this Q3. An additional 20% of Azbil Telstar’s investments in capital was acquired. Taking into account the current situation, plans are being reviewed; while, there is no change in management expectations regarding the medium-to long-term viability and growth potential of a business centered on the pharmaceutical manufacturing market.

9
[Billons of yen]
(A) (B) (A) - (B) % Change
Operating income 6.5 4.0 2.5 62.8Non-operating income 2.5 1.4 1.1 75.5Non-operating expenses 0.5 0.4 0.0 3.7
Ordinary income 8.6 5.0 3.6 72.2Extraordinary income 0.1 0.5 (0.4) (77.4)Extraordinary losses 2.7 0.2 2.5 1,141.7
Income before income taxes andminority interests 6.0 5.3 0.6 12.9
Income taxes 1.8 2.7 (0.9) (33.2)Minority interests in income (loss) 0.1 (0.0) 0.2 -
Net income 4.0 2.6 1.4 53.4
Same periodlast year
DifferenceThis period
1. Financial Results for the Q3 Ended Dec. 31, 2014(Apr. 1, 2014 to Dec. 31, 2014)Non-operating Income & Expenses, Extraordinary Income & Losses and Income Taxes
[Compared to the same period last year]
■ Non-operating income increased due to foreign exchange gains (about 1.0 billion yen) resulting from the lower value of Japanese yen.
■ Recorded extraordinary losses and reduced tax expenses as a result of the process of business reevaluation and restructuring under our medium-term plan*. * For more detailed information, go on to the next page (P.10).

10
< Notes >
1) LSE field: Business structure reformsAs mentioned previously (page 8), we are actively implementing sweeping measures to reinforce the business structure in the field. Through the radical business structure reforms of Azbil Telstar, S. L. - the core of the LSE field – , extraordinary losses, a restructuring loss (approx. 0.4 billion yen) and a goodwill impairment (approx. 1.7 billion yen), were recorded in this Q3.
2) Real-time microbial sensing field: Review and restructure the businessWe transferred the real-time microbial sensing technology that has been advanced by the US subsidiary Azbil BioVigilant Inc. to Azbil Corporation, and we will seek to expand the target market and develop new business opportunities directly. Azbil BioVigilant is to be liquidated. This will have a negligible impact on our consolidated financial results, orders received, sales and profits. This transaction including liquidation has brought about the reduction of tax expenses in this Q3.
(Subsequent event for this Q3)Health, welfare, and nursing care field: Transfer the business
As of Feb. 4, 2015, We are withdrawing from the health, welfare, and nursing care field; all shares in Azbil Care & Support, the company that has provided services in the field, were being transferred to SOHGO SECURITIY SERVICES CO., LTD. As a result of this transfer, extraordinary income (including some related expenses) will be recorded in the Q4 (the amount is currently under review).
1. Financial Results for the Q3 Ended Dec. 31, 2014(Apr. 1, 2014 to Dec. 31, 2014)Non-operating Income & Expenses, Extraordinary Income & Losses and Income Taxes

11
2012/3 2013/3 2014/3 2015/3 2014/3 2015/3Q3 Q3 Q3 Q3 Q1 Q2 Q3 Q4 Q1 Q2 Q3
■ B A 93.9 83.9 86.8 100.6 ■ B A 38.0 26.4 22.4 21.5 48.6 27.5 24.3 ■ A A 68.1 65.3 70.3 72.9 ■ A A 21.9 24.6 23.7 22.7 25.2 24.2 23.4 ■ L A 24.1 26.1 39.9 35.9 ■ L A 13.4 14.1 12.3 12.6 12.4 11.3 12.0
Consolidated 184.8 174.4 195.8 208.2 Consolidated 73.0 64.6 58.2 56.5 86.0 62.6 59.4
0.0
50.0
100.0
150.0
200.0
250.0
0.0
50.0
100.0
150.0
200.0
250.0
[Billions of yen]
1. Financial Results for the Q3 Ended Dec. 31, 2014(Apr. 1, 2014 to Dec. 31, 2014)
[Reference] Orders Received by Segment
<Cumulative period (9 months)> <Quarterly (3 months)>

12
2012/3 2013/3 2014/3 2015/3 2014/3 2015/3Q3 Q3 Q3 Q3 Q1 Q2 Q3 Q4 Q1 Q2 Q3
■ B A 67.9 69.8 70.5 75.0 ■ B A 19.1 25.9 25.4 39.0 19.7 26.9 28.3 ■ A A 63.9 62.3 63.7 66.8 ■ A A 18.6 23.7 21.3 27.0 19.8 24.9 21.9 ■ L A 24.0 25.8 36.1 35.6 ■ L A 10.9 13.2 11.9 13.4 11.7 13.0 10.9
Consolidated 154.8 157.0 169.6 176.5 Consolidated 48.5 62.7 58.3 78.7 51.0 64.6 60.8
0.0
50.0
100.0
150.0
200.0
0.0
50.0
100.0
150.0
200.0
1. Financial Results for the Q3 Ended Dec. 31, 2014(Apr. 1, 2014 to Dec. 31, 2014)
[Reference] Sales by Segment[Billions of yen]
* Sales for the azbil Group tend to be concentrated in the Q2 and Q4 consolidated accounting periods, while fixed costs are generated constantly. This means that profits in the Q1 and Q3 consolidated accounting periods are typically lower than those in the other two quarters.
<Cumulative period (9 months)> <Quarterly (3 months)>

13
2012/3 2013/3 2014/3 2015/3 2014/3 2015/3Q3 Q3 Q3 Q3 Q1 Q2 Q3 Q4 Q1 Q2 Q3
■ B A 3.8 3.3 3.3 5.3 ■ B A (0.6) 2.1 1.8 7.2 (0.8) 3.2 2.9 ■ A A 2.7 2.1 1.4 2.9 ■ A A (0.2) 1.5 0.2 2.4 0.0 1.9 0.9 ■ L A (0.1) (0.2) (0.8) (1.7) ■ L A (0.5) 0.2 (0.5) 0.1 (0.7) (0.0) (0.8)
Consolidated 6.5 5.3 4.0 6.5 Consolidated (1.5) 3.9 1.5 9.8 (1.5) 5.1 2.9
-2.5
0.0
2.5
5.0
7.5
10.0
-2.5
0.0
2.5
5.0
7.5
10.0
1. Financial Results for the Q3 Ended Dec. 31, 2014(Apr. 1, 2014 to Dec. 31, 2014)
[Reference] Segment Profit (Operating Income)[Billions of yen]
* Sales for the azbil Group tend to be concentrated in the Q2 and Q4 consolidated accounting periods, while fixed costs are generated constantly. This means that profits in the Q1 and Q3 consolidated accounting periods are typically lower than those in the other two quarters.
<Cumulative period (9 months)> <Quarterly (3 months)>

14
2012/3 2013/3 2014/3 2015/3Q3 Q3 Q3 Q3
■ Asia 6.7 7.3 11.1 12.1 ■ China 4.8 5.1 8.3 6.7 ■ North America 1.3 1.1 2.4 2.8 ■ Europe 0.6 0.5 7.8 7.5 ■ Others 0.4 0.5 2.8 3.1
Consolidated 13.9 14.7 32.6 32.4
[Reference information]
9.0% Overseas sales/ Net sales
102.9496.8479.4080.59Average exchange rate -USD/JPY
18.4%19.3%9.4%
139.50Average exchange rate -EUR/JPY 113.38 101.73 127.48
0.0%
7.5%
15.0%
22.5%
30.0%
0.0
10.0
20.0
30.0
40.0
1. Financial Results for the Q3 Ended Dec. 31, 2014(Apr. 1, 2014 to Dec. 31, 2014)
Overseas Sales by Region[Billions of yen]
Regarding overseas sales, although there are a segment, regions and countries in which the business environment has worsened, elsewhere there has been steady business growth. Overall, sales became parallel with the same period last year.
■ In the Asian region, as a result of political unrest, etc. in certain countries, such as Thailand, sales fell, but overall steady growth in sales was achieved.
■ In China, owing to such factors as a slowdown in the property market, BA business sales fell. The LA business also saw a drop in the sales. Overall, sales in China decreased.
■ In North America, growth was achieved, mainly driven by solutions to equipment manufacturers offered by the AA business.
■ In Europe, the AA business demonstrated robust performance; however, LA business sales fell, and overall there was a decrease in sales.
* Overseas sales figures include only the sales of overseas affiliates and direct exports; indirect exports are excluded.* The accounting year used by overseas affiliates mainly ends on December 31.
<Cumulative period (9 months)>

15
Net assets increased 6.2 billion yen from the previous fiscal year-end. Although a dividend was paid, there was an increase in retained earnings as a result of net income being recorded in the third quarter of the current consolidated cumulative period and from changes in the Retirement Benefits Accounting Standard. Additionally, there was in an increase in the valuation difference on available-for-sale securities. [Billions of yen]
As of Dec.31, 2014
As of Mar.31, 2014
Difference As of Dec.31, 2014
As of Mar.31, 2014
Difference
(A) (B) (A) - (B) (A) (B) (A) - (B)
Current assets 181.2 189.3 (8.1) Liabilities 95.8 108.4 (12.5)Cash and deposits 46.4 52.4 (5.9) Current liabilities 82.0 87.3 (5.2)
82.7 88.2 (5.4) Notes andaccounts payable-trade 38.8 41.4 (2.5)
Inventories 24.4 18.1 6.2 Short-term loans and bonds 16.2 15.4 0.8
Others 27.4 30.5 (3.1) Others 26.9 30.4 (3.4)Noncurrent assets 65.8 64.0 1.8 Noncurrent liabilities 13.7 21.1 (7.3)
25.2 24.5 0.7 Long-term loans and bonds 1.6 2.2 (0.6)
Intangible assets 12.5 12.9 (0.3) Others 12.1 18.8 (6.6)
28.0 26.6 1.4 Net assets 151.2 144.9 6.2Shareholders' equity 143.5 139.3 4.1
Capital stock 10.5 10.5 -
Capital surplus 17.1 17.1 0.0
Retained earnings 118.4 114.2 4.1
Treasury stock (2.6) (2.6) (0.0)
5.8 3.9 1.81.8 1.6 0.2
247.0 253.4 (6.3) 247.0 253.4 (6.3)
Accumulated othercomprehensive incomeSubscription rights to sharesand Minority interests
Total assets Tota l l ia b i l i t ies a n d n e t a ssets
Notes andaccounts receivable-trade
Property, plant and equipment
Investments and other assets
1. Financial Results for the Q3 Ended Dec. 31, 2014
Consolidated Financial Position
(Reference) Shareholders’ equity ratio: 60.4%(as of Dec. 31, 2014), 56.5%(as of Mar. 31, 2014)
■ Assets
■ Liabilities
■ Net assets
Total assets decreased 6.3billion yen from the previous fiscal year-end (As of Mar. 31, 2014). This was mainly due to a decrease in cash and deposits owing to the payment of income taxes and bonuses, and a decrease in accounts receivable – trade. At the same time, inventories increased as a result of an increase in orders received.
Total liabilities decreased 12.5 billion yen from the previous fiscal year-end. This was mainly owing to a decrease in net defined benefit liability resulting from changes in the Retirement Benefits Accounting Standard, etc., as well as a decrease in income taxes payable following payment of income taxes and a decrease in provision for bonuses following the payment of bonuses.

16
2. Financial Plan for the Fiscal Year Ending Mar. 31, 2015→No revision from the recent announcement

17
[Billions of yen]Difference
Full yearplan
(Oct. 30, 2014)
(A) (B)
Net sales 176.5 255.0 248.4 6.5 2.7Operating income 6.5 15.0 13.9 1.0 7.9
% 3.7 5.9 5.6 0.3POrdinary income 8.6 15.3 14.5 0.7 4.8
Net income 4.0 8.5 7.6 0.8 10.8% 2.3 3.3 3.1 0.2P
Q3(Cumulative)
(A) - (B) % Change
This year Previousfiscal year
2. Financial Plan for the Fiscal Year Ending Mar. 31, 2015
Consolidated Financial Plan
■ While there is a disparity in the degree to which the different businesses have improved their profits, consolidated results for this period have remained, overall, within the range of the plan. Consequently, no changes will be made to the financial plan previously published on Oct. 30, 2014.
* Sales for the azbil Group tend to be concentrated in the Q2 and Q4 consolidated accounting periods, while fixed costs are generated constantly. This means that profits in the Q1 and Q3 consolidated accounting periods are typically lower than those in the other two quarters.

18
[Billions of yen]Difference
Full yearplan
(Oct. 30, 2014)
(A) (B)
■ B A Sales 75.0 115.0 109.5 5.4 5.0 Segment profit 5.3 11.8 10.5 1.2 11.4
% 7.1 10.3 9.7 0.6P■ A A Sales 66.8 94.0 90.8 3.1 3.5
Segment profit 2.9 4.7 3.9 0.7 18.5% 4.4 5.0 4.4 0.6P
■ L A Sales 35.6 48.0 49.5 (1.5) (3.2) Segment profit (loss) (1.7) (1.5) (0.6) (0.8) -
% (4.8) (3.1) (1.4) - Consolidated Net sales 176.5 255.0 248.4 6.5 2.7
Operating income 6.5 15.0 13.9 1.0 7.9% 3.7 5.9 5.6 0.3P
% Change
Q3(Cumulative)
This yearPrevious
fiscal year(A) - (B)
2. Financial Plan for the Fiscal Year Ending Mar. 31, 2015
Segment Information
* Sales for the azbil Group tend to be concentrated in the Q2 and Q4 consolidated accounting periods, while fixed costs are generated constantly. This means that profits in the Q1 and Q3 consolidated accounting periods are typically lower than those in the other two quarters.

19
2. Financial Plan for the Fiscal Year Ending March 31, 2015
[Reference] Sales by Segment[Billions of yen]
2012/3 2013/3 2014/3 2015/3(Plan)
■ B A 103.8 107.4 109.5 115.0 ■ A A 88.8 87.6 90.8 94.0 ■ L A 32.5 33.9 49.5 48.0 Consolidated 223.4 227.5 248.4 255.0
0.0
50.0
100.0
150.0
200.0
250.0
300.0

20
2. Financial Plan for the Fiscal Year Ending March 31, 2015
[Reference] Segment Profit (Operating Income)[Billions of yen]
2012/3 2013/3 2014/3 2015/3(Plan)
■ B A 10.3 10.1 10.5 11.8 ■ A A 4.1 3.6 3.9 4.7 ■ L A (0.1) (0.3) (0.6) (1.5) Consolidated 14.3 13.4 13.9 15.0
(4.0)
0.0
4.0
8.0
12.0
16.0
20.0
0.0
10.0
20.0

21
3. Return to Shareholders→No revision from the recent announcement

22
(Reference) Dividends yield: 2.3% (as the end of Dec., 2014)
3. Return to Shareholders
Dividends Plan
Interim Year-end Interim Year-end Dividend per share [ Yen ] 31.5 31.5 31.5 31.5 (Plan)
Payout ratio
Dividend on equity (DOE)
3.3% 3.2%
2014/3 2015/3
60.7% 54.7%
Putting priority on the interests of our shareholders, we will maintain stable dividends while striving to increase the dividend payout, comprehensively taking into account consolidated performance, level of Return On Equity (ROE), Dividends On Equity (DOE), as well as retained earnings for strengthening our business base and developing future business.
The year-end dividend for the year ended Mar. 2015 is planned as follows. There is no change from the last announcement on May 12, 2014.

23
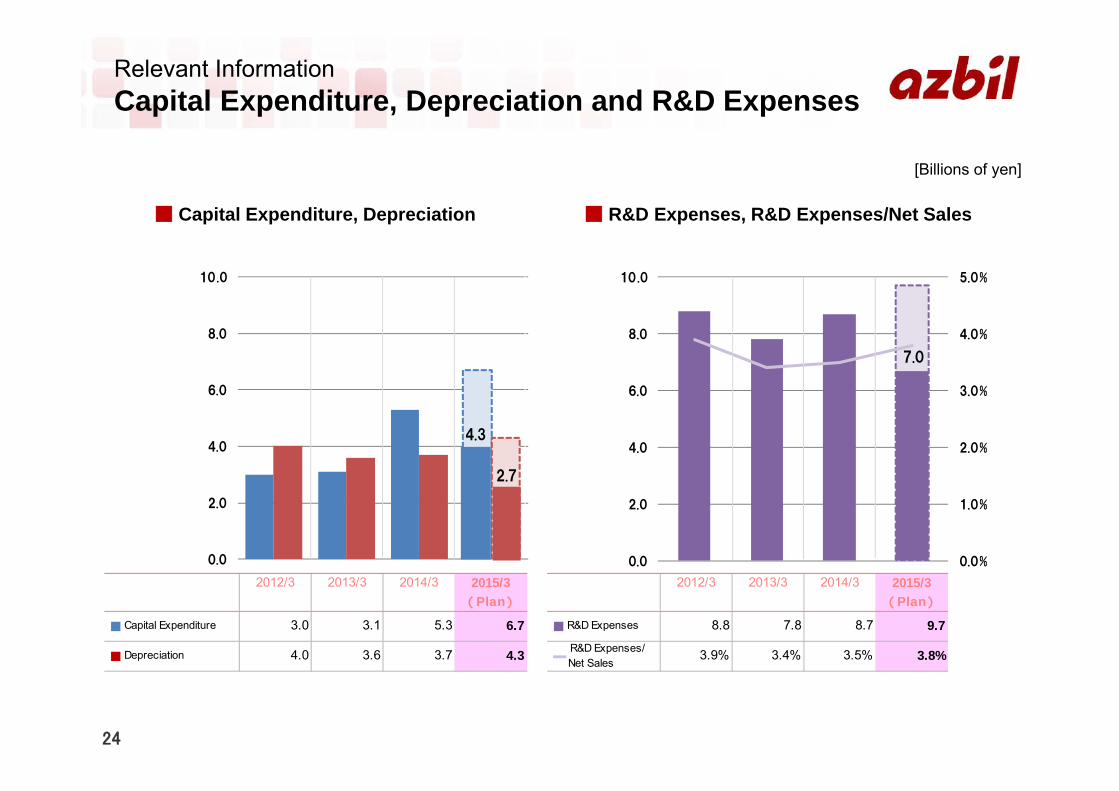
Relevant Information
24
Relevant InformationCapital Expenditure, Depreciation and R&D Expenses
■ Capital Expenditure, Depreciation ■ R&D Expenses, R&D Expenses/Net Sales
[Billions of yen]
2012/3 2013/3 2014/3 2015/3 2012/3 2013/3 2014/3 2015/3(Plan) (Plan)
■ Capital Expenditure 3.0 3.1 5.3 6.7 ■ R&D Expenses 8.8 7.8 8.7 9.7
■ Depreciation 4.0 3.6 3.7 4.3 R&D Expenses/ Net Sales
3.9% 3.4% 3.5% 3.8%
0.0
2.0
4.0
6.0
8.0
10.0
0.0%
1.0%
2.0%
3.0%
4.0%
5.0%
0.0
2.0
4.0
6.0
8.0
10.0
4.3
2.7
7.0

25
azbil Group PhilosophyTo realize safety, comfort, and fulfillment in people’s lives and contribute to global environmental preservation through “human-centered automation”