
Azbil Corporation RIC: 6845.T, Sedol: 6985543 … 6.1 5.1 0.9P FY2017 1-3Q Income (loss) before...
25
Human-centered Automation Azbil Corporation RIC: 6845.T, Sedol: 6985543 Presentation Materials For the Third Quarter of the Fiscal Year Ending March 31, 2019 (Based on Japanese GAAP) 1. Financial Results for the Third Quarter of the Fiscal Year Ending March 31, 2019 2. Financial Plan for the Fiscal Year Ending March 31, 2019 →No revision to the announcement published on November 2, 2018 3. Returning Profits to Shareholders →No revision to the announcement published on November 2, 2018 Contents February 6, 2019
Transcript of Azbil Corporation RIC: 6845.T, Sedol: 6985543 … 6.1 5.1 0.9P FY2017 1-3Q Income (loss) before...

Human-centered Automation
Azbil Corporation RIC: 6845.T, Sedol: 6985543
Presentation Materials For the Third Quarter of the Fiscal Year Ending March 31, 2019 (Based on Japanese GAAP)
1. Financial Results for the Third Quarter of the Fiscal Year Ending March 31, 2019
2. Financial Plan for the Fiscal Year Ending March 31, 2019 →No revision to the announcement published on November 2, 2018
3. Returning Profits to Shareholders →No revision to the announcement published on November 2, 2018
Contents
February 6, 2019

2
Notes
1. Financial data and financial statements have been prepared based on Japanese GAAP and the amounts have been rounded down.
2. The following are the Group’s segments (each identified by abbreviation) together with the various sub-segments and their
principal business focus.
B A : Building Automation A A : Advanced Automation
CP (Control Product) business: Supplying factory automation products such as controllers, sensors, etc. IAP (Industrial Automation Product) business: Supplying process automation products such as differential
pressure & pressure transmitters, control valves, etc. SS (Solution & Service) business: Offering control systems, engineering service, maintenance service, energy-
saving solution service, etc. L A : Life Automation
Lifeline field: Provision of gas meters and water meters, safety equipment such as alarms and automatic shut-off valves, regulators and other products for industry.
Life Science Engineering (LSE) field: Provision of an integrated solution from the development, engineering, installation, and sale of lyophilizers, sterilizers, and clean environment equipment to after-sales services for pharmaceutical companies and research laboratories.
Lifestyle-related field: Provision of residential central air-conditioning systems for houses. 3. Net sales for the azbil Group tend to be low in the first quarter of the consolidated accounting period and highest in the
fourth quarter. However, fixed costs are generated constantly. This means that profits are typically lower in the first quarter and higher in the fourth quarter.
4. The financial plan is based on management’s assumptions, intent and expectations in light of the information currently available to it, and therefore is not a guarantee of future performance. Due to various factors, actual results may differ from those discussed in this material.
5. Revision in how orders received are calculated Previously, figures for orders received included the translation gains and losses associated with currency conversions for contracts denominated in foreign currencies incorporated within the order backlog at the beginning of the fiscal year. However, from the previous consolidated fiscal year these translation gains and losses are no longer included in orders received. With the expansion of the azbil Group’s overseas business, this revision has been made to provide investors with useful information for their investment judgement by reporting the Group's performance in line with our overseas business activities.
3
1. Financial Results for the Third Quarter of the Fiscal Year Ending March 31, 2019

4
(Billions of yen) Difference
(A) (B) (A) - (B) % ChangeOrders received 204.1 208.9 (4.7) (2.3)(See: previous calculation method) 203.6 209.9 (6.2) (3.0)Net sales 185.3 183.1 2.2 1.2
Japan 150.6 150.5 0.1 0.1Overseas 34.6 32.5 2.0 6.4
Gross profit 70.8 67.2 3.5 5.3% 38.2 36.8 1.5P
SG&A 55.6 53.4 2.1 4.0Operating income (loss) 15.2 13.8 1.4 10.4
% 8.2 7.6 0.7POrdinary income (loss) 16.0 14.4 1.5 10.8
11.2 9.4 1.8 19.5% 6.1 5.1 0.9P
FY20171-3Q
13.816.0Income (loss) before income taxes 14.0 1.9Net income (loss) attributable toowners of parent
FY20181-3Q
1. Financial Results for the Third Quarter of the Fiscal Year Ending March 31, 2019
Consolidated Financial Results Compared to the same period last year
* From the previous fiscal year, orders received figures do not include translation gains and losses associated with currency conversions following order backlog reevaluation. For details, refer to page 2 of this material.
*
Orders received decreased owing mainly to the fact that there were large-scale projects in the same period last year. Sales for the AA business and the LA business grew steadily, and overall net sales increased. Operating income increased thanks to sales growth and to measures implemented to strengthen business profitability. With the increase in operating income, there were also increases in ordinary income and net income attributable to owners
of parent.

5
(Billions of yen) Difference
(A) (B) (A) - (B) % ChangeOrders received 101.0 97.9 3.0 3.1(See: previous calculation method) 100.9 97.8 3.0 3.1Sales 79.8 81.7 (1.9) (2.3)Segment profit (loss) 4.9 5.9 (1.0) (18.3)
% 6.1 7.3 (1.2P)
FY20181-3Q
FY20171-3Q
1. Financial Results for the Third Quarter of the Fiscal Year Ending March 31, 2019
Segment Information - BA Business
Compared to the same period last year
Benefitting from a robust business environment in Japan and abroad, we have made efforts to secure orders with a view to enhanced profitability. At the same time, we have striven to enhance the capabilities and efficiencies of accomplishing work-related tasks, particularly on site.
*
* From the previous fiscal year, orders received figures do not include translation gains and losses associated with currency conversions following order backlog reevaluation. For details, refer to page 2 of this material.
Orders received increased steadily in the domestic market, thanks to the robust business environment. There was also growth overseas, so overall there was an increase in orders received.
Sales decreased because the previous year's sales were high, owing partly to the recording of large-scale projects. Segment profit decreased owing to the fall in sales and to the recording of temporary expenses for provision incurred in the
first half.

6
1. Financial Results for the Third Quarter of the Fiscal Year Ending March 31, 2019
Segment Information - AA Business
Compared to the same period last year
*2
Operations for the three AA business sub-segments*1 have been streamlined, and measures to achieve business growth and strengthen business profitability have been implemented. We are also developing a new automation field by launching new products for it. Although business conditions have changed in some markets – such as those related to semiconductor manufacturing equipment, which has leveled off for the time being – the demand for automation aimed at rationalization and labor-saving has continued at a high level, reflecting labor shortages and other factors.
Orders received decreased; this was mainly because large-scale projects in energy-related markets had been recorded in the same period last year.
Sales in Japan and abroad grew steadily, resulting in overall growth. Segment profit grew, thanks to sales growth plus the expanded success of initiatives designed to strengthen business
profitability.
*2 From the previous fiscal year, orders received figures do not include translation gains and losses associated with currency conversions following order backlog reevaluation. For details, refer to page 2 of this material.
*1 Three AA business sub-segments: CP (Control Product) business, IAP (Industrial Automation Product) business, and SS (Solution & Service) business
(Billions of yen) Difference
(A) (B) (A) - (B) % ChangeOrders received 74.7 76.8 (2.0) (2.6)(See: previous calculation method) 74.7 77.1 (2.3) (3.1)Sales 73.0 70.2 2.8 4.1Segment profit (loss) 8.8 6.8 2.0 29.6
% 12.1 9.7 2.4P
FY20181-3Q
FY20171-3Q
7
1. Financial Results for the Third Quarter of the Fiscal Year Ending March 31, 2019
Segment Information - LA Business
Compared to the same period last year
*
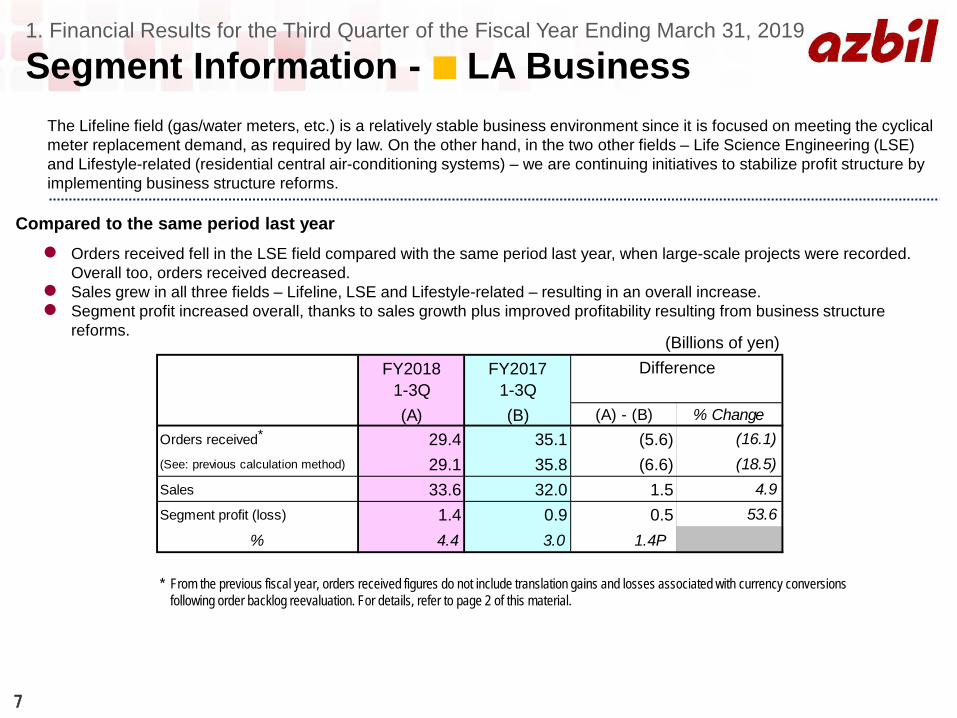
Orders received fell in the LSE field compared with the same period last year, when large-scale projects were recorded. Overall too, orders received decreased.
Sales grew in all three fields – Lifeline, LSE and Lifestyle-related – resulting in an overall increase. Segment profit increased overall, thanks to sales growth plus improved profitability resulting from business structure
reforms.
The Lifeline field (gas/water meters, etc.) is a relatively stable business environment since it is focused on meeting the cyclical meter replacement demand, as required by law. On the other hand, in the two other fields – Life Science Engineering (LSE) and Lifestyle-related (residential central air-conditioning systems) – we are continuing initiatives to stabilize profit structure by implementing business structure reforms.
* From the previous fiscal year, orders received figures do not include translation gains and losses associated with currency conversions following order backlog reevaluation. For details, refer to page 2 of this material.
(Billions of yen) Difference
(A) (B) (A) - (B) % ChangeOrders received 29.4 35.1 (5.6) (16.1)(See: previous calculation method) 29.1 35.8 (6.6) (18.5)Sales 33.6 32.0 1.5 4.9Segment profit (loss) 1.4 0.9 0.5 53.6
% 4.4 3.0 1.4P
FY20181-3Q
FY20171-3Q
8
FY2015 FY2016 FY2017 FY2018 FY2017 FY20181-3Q 1-3Q 1-3Q 1-3Q 1Q 2Q 3Q 4Q 1Q 2Q 3Q
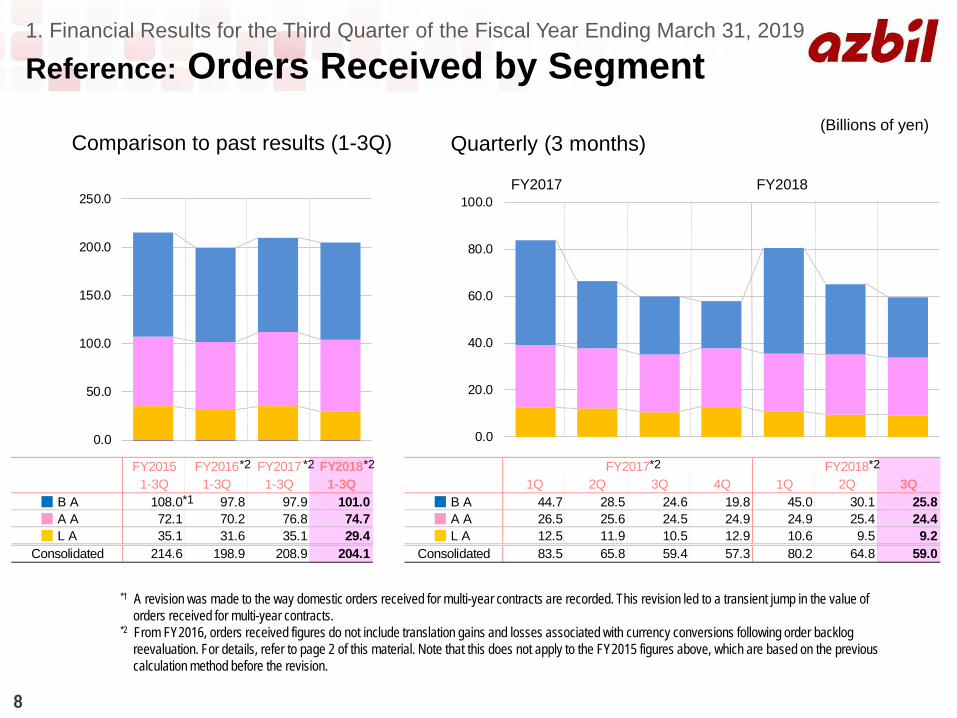
■ B A 108.0 97.8 97.9 101.0 ■ B A 44.7 28.5 24.6 19.8 45.0 30.1 25.8 ■ A A 72.1 70.2 76.8 74.7 ■ A A 26.5 25.6 24.5 24.9 24.9 25.4 24.4 ■ L A 35.1 31.6 35.1 29.4 ■ L A 12.5 11.9 10.5 12.9 10.6 9.5 9.2
Consolidated 214.6 198.9 208.9 204.1 Consolidated 83.5 65.8 59.4 57.3 80.2 64.8 59.0
0.0
50.0
100.0
150.0
200.0
250.0
0.0
20.0
40.0
60.0
80.0
100.0
(Billions of yen)
1. Financial Results for the Third Quarter of the Fiscal Year Ending March 31, 2019
Reference: Orders Received by Segment
Comparison to past results (1-3Q) Quarterly (3 months)
FY2017 FY2018
*1
*2
*1 A revision was made to the way domestic orders received for multi-year contracts are recorded. This revision led to a transient jump in the value of orders received for multi-year contracts.
*2 From FY2016, orders received figures do not include translation gains and losses associated with currency conversions following order backlog reevaluation. For details, refer to page 2 of this material. Note that this does not apply to the FY2015 figures above, which are based on the previous calculation method before the revision.
*2 *2 *2 *2

9
FY2015 FY2016 FY2017 FY2018 FY2017 FY20181-3Q 1-3Q 1-3Q 1-3Q 1Q 2Q 3Q 4Q 1Q 2Q 3Q
■ B A 77.6 78.7 81.7 79.8 ■ B A 23.3 27.5 30.8 38.4 21.8 27.7 30.2 ■ A A 66.0 68.5 70.2 73.0 ■ A A 21.5 24.7 23.9 27.0 22.3 25.4 25.2 ■ L A 33.5 32.5 32.0 33.6 ■ L A 10.1 11.2 10.6 12.1 10.8 12.2 10.5
Consolidated 176.4 178.9 183.1 185.3 Consolidated 54.7 63.0 65.2 77.2 54.8 64.9 65.6
0.0
50.0
100.0
150.0
200.0
250.0
0.0
20.0
40.0
60.0
80.0
100.0
1. Financial Results for the Third Quarter of the Fiscal Year Ending March 31, 2019
Reference: Sales by Segment
FY2017 FY2018
*
(Billions of yen) Quarterly (3 months)
* In December 2016, the Chinese subsidiary Beijing YTYH Intelli-Technology Co., Ltd. was removed from consolidation. The consolidated figures included the subsidiary until the third quarter of FY2016.
Comparison to past results (1-3Q)
10
FY2015 FY2016 FY2017 FY2018 FY2017 FY20181-3Q 1-3Q 1-3Q 1-3Q 1Q 2Q 3Q 4Q 1Q 2Q 3Q
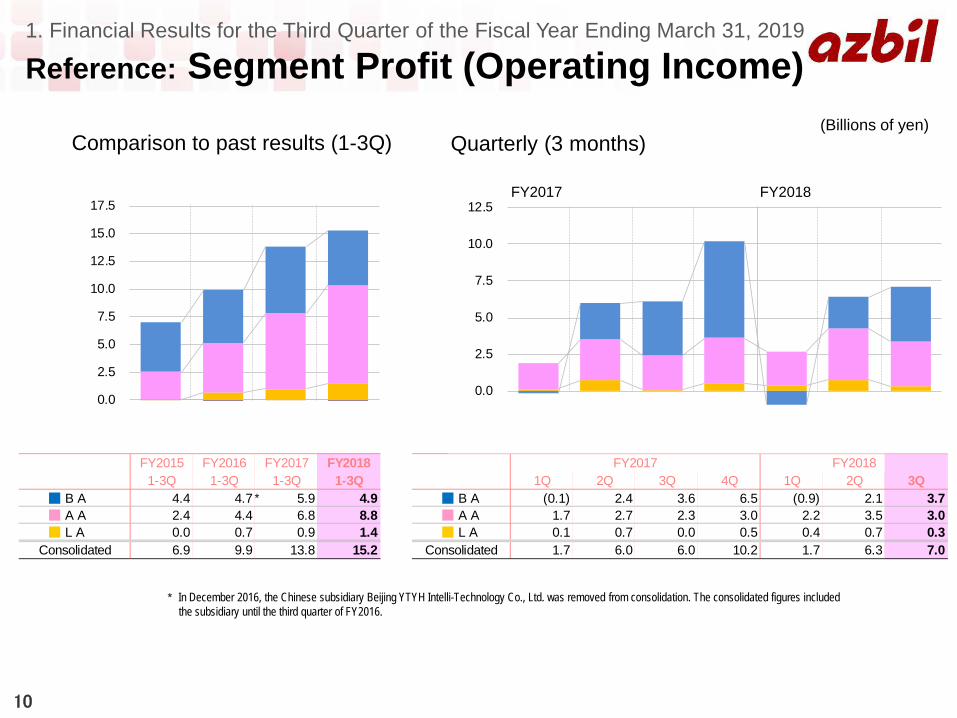
■ B A 4.4 4.7 5.9 4.9 ■ B A (0.1) 2.4 3.6 6.5 (0.9) 2.1 3.7 ■ A A 2.4 4.4 6.8 8.8 ■ A A 1.7 2.7 2.3 3.0 2.2 3.5 3.0 ■ L A 0.0 0.7 0.9 1.4 ■ L A 0.1 0.7 0.0 0.5 0.4 0.7 0.3
Consolidated 6.9 9.9 13.8 15.2 Consolidated 1.7 6.0 6.0 10.2 1.7 6.3 7.0
(2.5)
0.0
2.5
5.0
7.5
10.0
12.5
15.0
17.5
(2.5)
0.0
2.5
5.0
7.5
10.0
12.5
1. Financial Results for the Third Quarter of the Fiscal Year Ending March 31, 2019
Reference: Segment Profit (Operating Income)
FY2017 FY2018
*
(Billions of yen) Quarterly (3 months) Comparison to past results (1-3Q)
* In December 2016, the Chinese subsidiary Beijing YTYH Intelli-Technology Co., Ltd. was removed from consolidation. The consolidated figures included the subsidiary until the third quarter of FY2016.
11
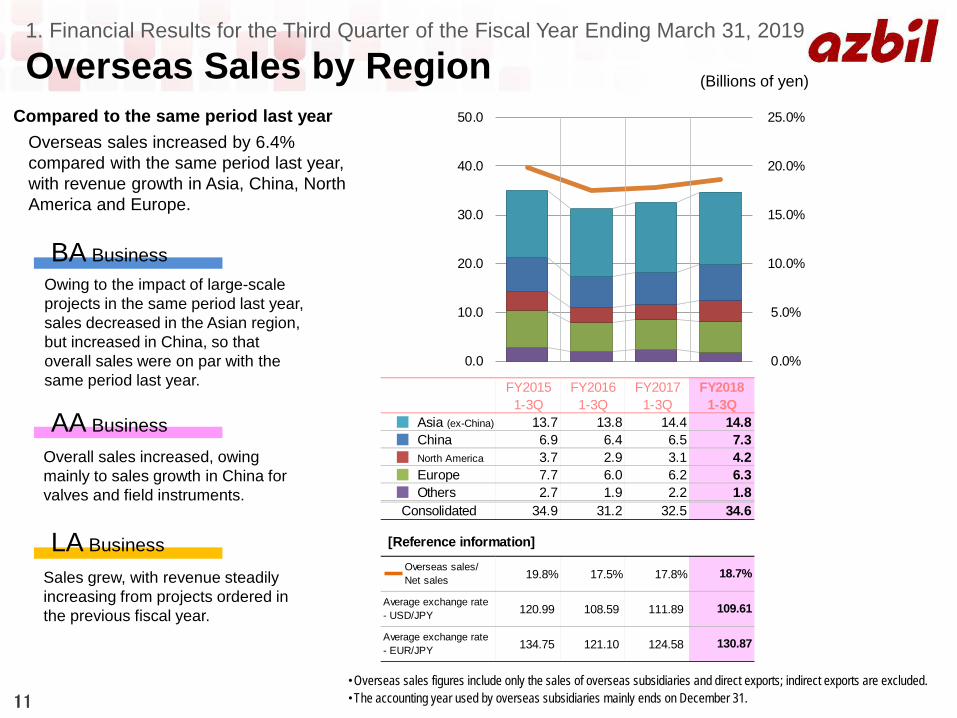
FY2015 FY2016 FY2017 FY20181-3Q 1-3Q 1-3Q 1-3Q
■ Asia (ex-China) 13.7 13.8 14.4 14.8 ■ China 6.9 6.4 6.5 7.3 ■ North America 3.7 2.9 3.1 4.2 ■ Europe 7.7 6.0 6.2 6.3 ■ Others 2.7 1.9 2.2 1.8
Consolidated 34.9 31.2 32.5 34.6
[Reference information]
Average exchange rate- EUR/JPY 134.75 121.10 124.58 130.87
Overseas sales/ Net sales 19.8% 17.5% 17.8% 18.7%
Average exchange rate- USD/JPY 120.99 108.59 111.89 109.61
0.0%
5.0%
10.0%
15.0%
20.0%
25.0%
0.0
10.0
20.0
30.0
40.0
50.0
1. Financial Results for the Third Quarter of the Fiscal Year Ending March 31, 2019
Overseas Sales by Region (Billions of yen)
Overseas sales increased by 6.4% compared with the same period last year, with revenue growth in Asia, China, North America and Europe.
Compared to the same period last year
BA Business
AA Business
LA Business
Owing to the impact of large-scale projects in the same period last year, sales decreased in the Asian region, but increased in China, so that overall sales were on par with the same period last year.
Overall sales increased, owing mainly to sales growth in China for valves and field instruments.
Sales grew, with revenue steadily increasing from projects ordered in the previous fiscal year.
・Overseas sales figures include only the sales of overseas subsidiaries and direct exports; indirect exports are excluded. ・The accounting year used by overseas subsidiaries mainly ends on December 31.
12
1. Financial Results for the Third Quarter of the Fiscal Year Ending March 31, 2019
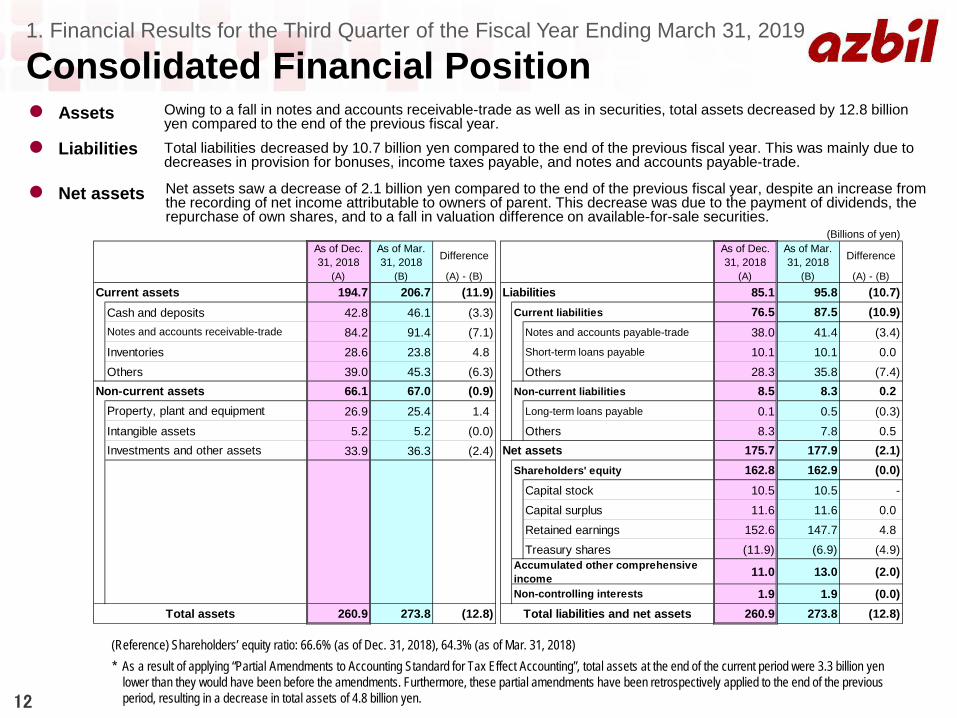
Consolidated Financial Position
(Reference) Shareholders’ equity ratio: 66.6% (as of Dec. 31, 2018), 64.3% (as of Mar. 31, 2018)
Assets Owing to a fall in notes and accounts receivable-trade as well as in securities, total assets decreased by 12.8 billion yen compared to the end of the previous fiscal year. Total liabilities decreased by 10.7 billion yen compared to the end of the previous fiscal year. This was mainly due to decreases in provision for bonuses, income taxes payable, and notes and accounts payable-trade.
Net assets saw a decrease of 2.1 billion yen compared to the end of the previous fiscal year, despite an increase from the recording of net income attributable to owners of parent. This decrease was due to the payment of dividends, the repurchase of own shares, and to a fall in valuation difference on available-for-sale securities.
* As a result of applying “Partial Amendments to Accounting Standard for Tax Effect Accounting”, total assets at the end of the current period were 3.3 billion yen lower than they would have been before the amendments. Furthermore, these partial amendments have been retrospectively applied to the end of the previous period, resulting in a decrease in total assets of 4.8 billion yen.
(Billions of yen)As of Dec.31, 2018
As of Mar.31, 2018 Difference
As of Dec.31, 2018
As of Mar.31, 2018 Difference
(A) (B) (A) - (B) (A) (B) (A) - (B)Current assets 194.7 206.7 (11.9) Liabilities 85.1 95.8 (10.7)
Cash and deposits 42.8 46.1 (3.3) Current liabilities 76.5 87.5 (10.9)84.2 91.4 (7.1) Notes and accounts payable-trade 38.0 41.4 (3.4)
Inventories 28.6 23.8 4.8 Short-term loans payable 10.1 10.1 0.0Others 39.0 45.3 (6.3) Others 28.3 35.8 (7.4)
Non-current assets 66.1 67.0 (0.9) Non-current liabilities 8.5 8.3 0.226.9 25.4 1.4 Long-term loans payable 0.1 0.5 (0.3)
Intangible assets 5.2 5.2 (0.0) Others 8.3 7.8 0.533.9 36.3 (2.4) Net assets 175.7 177.9 (2.1)
Shareholders' equity 162.8 162.9 (0.0)Capital stock 10.5 10.5 -Capital surplus 11.6 11.6 0.0Retained earnings 152.6 147.7 4.8Treasury shares (11.9) (6.9) (4.9)
11.0 13.0 (2.0)
1.9 1.9 (0.0)260.9 273.8 (12.8) 260.9 273.8 (12.8)
Accumulated other comprehensiveincomeNon-controlling interests
Total assets Total liabilities and net assets
Notes and accounts receivable-trade
Property, plant and equipment
Investments and other assets
Liabilities
Net assets

13
→No revision to the announcement published on November 2, 2018
2. Financial Plan for the Fiscal Year Ending March 31, 2019

14
(Billions of yen)Difference
(A) (B)Net sales 185.3 267.0 260.3 6.6 2.5Operating income 15.2 26.0 24.0 1.9 8.2
% 8.2 9.7 9.2 0.5POrdinary income 16.0 26.5 24.3 2.1 9.0
11.2 18.5 17.8 0.6 3.4
% 6.1 6.9 6.9 0.1P
Net income attributable toowners of parent
% Change
FY2017
(A) - (B)1-3Q
(results)
Full-yearplan
(Nov. 2, 2018)
FY2018
2. Financial Plan for the Fiscal Year Ending March 31, 2019
Consolidated Financial Plan
*
* The figures for the previous fiscal year net income attributable to owners of parent include the effect of a reduction in tax expenses following a reappraisal of the recoverability of a subsidiary's deferred tax assets (Azbil Kimmon's deferred tax assets increased by 1.2 billion yen).
There are no changes to the full-year financial plan for FY2018 published on November 2, 2018.
We will progressively implement our business plan to achieve the full-year financial plan. At the same time, to realize sustained growth from FY2019 onwards, we will continue to make steady progress with various measures and investments aimed at strengthening and upgrading the business foundation including technology development, production systems, etc.

15
2. Financial Plan for the Fiscal Year Ending March 31, 2019
Plan by Segment
There are no changes to the plan by segment published on November 2, 2018.
(Billions of yen)Difference
(A) (B)■ B A Sales 79.8 122.0 120.2 1.7 1.5
Segment profit 4.9 13.0 12.5 0.4 3.3% 6.1 10.7 10.5 0.2P
■ A A Sales 73.0 100.0 97.2 2.7 2.8Segment profit 8.8 11.0 9.9 1.0 10.8% 12.1 11.0 10.2 0.8P
■ L A Sales 33.6 46.5 44.2 2.2 5.2Segment profit 1.4 2.0 1.5 0.4 33.2% 4.4 4.3 3.4 0.9P
Consolidated Net sales 185.3 267.0 260.3 6.6 2.5Operating income 15.2 26.0 24.0 1.9 8.2% 8.2 9.7 9.2 0.5P
FY2018
(A) - (B) % ChangeFY20171-3Q
(results)
Full-yearplan
(Nov. 2, 2018)

16
FY2015 FY2016 FY2017 FY2018(Plan)
■ B A 118.8 116.4 120.2 122.0 ■ A A 93.5 95.4 97.2 100.0 ■ L A 45.6 44.1 44.2 46.5 Consolidated 256.8 254.8 260.3 267.0
0.0
100.0
200.0
300.0
2. Financial Plan for the Fiscal Year Ending March 31, 2019
Reference: Sales by Segment (Billions of yen)
*
* In December 2016, the Chinese subsidiary Beijing YTYH Intelli-Technology Co., Ltd. was removed from consolidation. The consolidated figures included the subsidiary until the third quarter of FY2016.

17
FY2015 FY2016 FY2017 FY2018(Plan)
■ B A 12.0 11.5 12.5 13.0 ■ A A 5.0 7.2 9.9 11.0 ■ L A 0.0 1.4 1.5 2.0 Consolidated 17.1 20.1 24.0 26.0
0.0
10.0
20.0
30.0
2. Financial Plan for the Fiscal Year Ending March 31, 2019
Reference: Segment Profit (Operating Income)
(Billions of yen)
*
* In December 2016, the Chinese subsidiary Beijing YTYH Intelli-Technology Co., Ltd. was removed from consolidation. The consolidated figures included the subsidiary until the third quarter of FY2016.
18
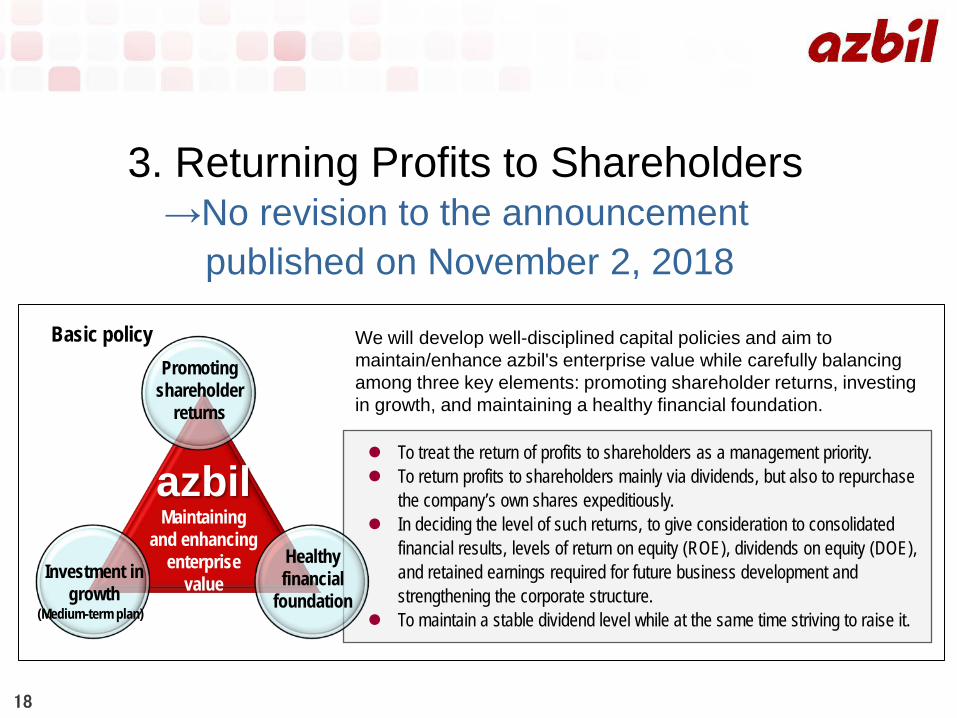
To treat the return of profits to shareholders as a management priority. To return profits to shareholders mainly via dividends, but also to repurchase
the company’s own shares expeditiously. In deciding the level of such returns, to give consideration to consolidated
financial results, levels of return on equity (ROE), dividends on equity (DOE), and retained earnings required for future business development and strengthening the corporate structure.
To maintain a stable dividend level while at the same time striving to raise it.
azbil Maintaining
and enhancing enterprise
value
Basic policy
Healthy financial
foundation Investment in
growth
Promoting shareholder
returns
(Medium-term plan)
We will develop well-disciplined capital policies and aim to maintain/enhance azbil's enterprise value while carefully balancing among three key elements: promoting shareholder returns, investing in growth, and maintaining a healthy financial foundation.
3. Returning Profits to Shareholders →No revision to the announcement published on November 2, 2018

19
3. Returning Profits to Shareholders
FY2018 Capital Policy
Reflecting the business environment and the success of our business structure reforms as well as initiatives to strengthen the profit structure, continued profit growth is planned. Also, since sustained growth is anticipated with the medium-term plan, dividends increase is planned so as to further raise the dividend level. ● Ordinary dividends raised by 10 yen per share (annual dividends: 92 yen) * Pre-split conversion
Dividends increase
By lowering the unit price of the company’s shares, we are providing an environment that makes it easier for investors to purchase our shares, and also raising share liquidity. We therefore implemented a 2-for-1 common stock split. The date of stock split: October 1, 2018
Along with improving capital efficiency, we are committed to further enhancing shareholder return and implementing flexible capital policies according to changes in the corporate environment in a manner that reflects our performance situation and outlook. With this in mind, the Company repurchased its own shares (May 14 to June 19, 2018). ● Total value of shares repurchased: 4,999 million yen ● Total number of shares repurchased: 936,200 shares* * The number of shares at the time of repurchase (pre-split conversion) * The number after the stock split is 1,872,400 shares
While striving to make further progress in promoting shareholder returns, we implemented a stock split for the purpose of increasing share liquidity.
May 11, 2018: Dividends increase and repurchase of own shares announced
August 30, 2018: Stock split (2-for-1) announced
Repurchase of own shares
Stock split

20
Interim Year-end Annual
Results for the previous fiscal year 41.0 41.0 82.0 33.3% 3.5%Announcement on May 11, 2018(Initial plan) 46.0 46.0 92.0 38.1% 3.7%
Announcement on November 2, 2018 46.0 23.0 -
(Pre-split conversion) (46.0) (46.0) (92.0)
Dividends per share (Yen) Payout ratio
Dividends onequity (DOE)
35.6% 3.7%
3. Returning Profits to Shareholders
Dividends
*2
FY2018 Dividends Plan
Interim dividends: 46 yen per share
Year-end dividends (plan): 23 yen per share
(Pre-split conversion 46 yen) *1 The interim dividends per share are issued based on the number of shares held prior to the stock split, while the year-end dividends
(planned) are issued based on the number of shares held after the stock split. If the stock split were not taken into account, the year-end dividends would be 46 yen (pre-split conversion), and the annual dividends (ditto) including the interim dividends would be 92 yen. Therefore, this effectively represents no change to the dividend level in the initial plan announced on May 11, 2018.
*2 In the first quarter of the current consolidated accounting period, we implemented the repurchase of own shares (see page 19). We are taking into account the effect of this repurchase in deciding the payout ratio.
*3 The following factors have been taken into account for the trial calculation, which is based on shareholders’ equity on March 31, 2018: the above-mentioned share repurchases already completed in FY2018, year-end dividends for FY2017, interim dividends for FY2018, and net income attributable to owners of parent in consolidated financial plan for FY2018.
(No change) *1
*3
(published on November 2, 2018)
21
0.0
0.5
1.0
1.5
2.0
2.5
3.0
3.5
4.0
4.5
5.0
20
25
30
35
40
45
50
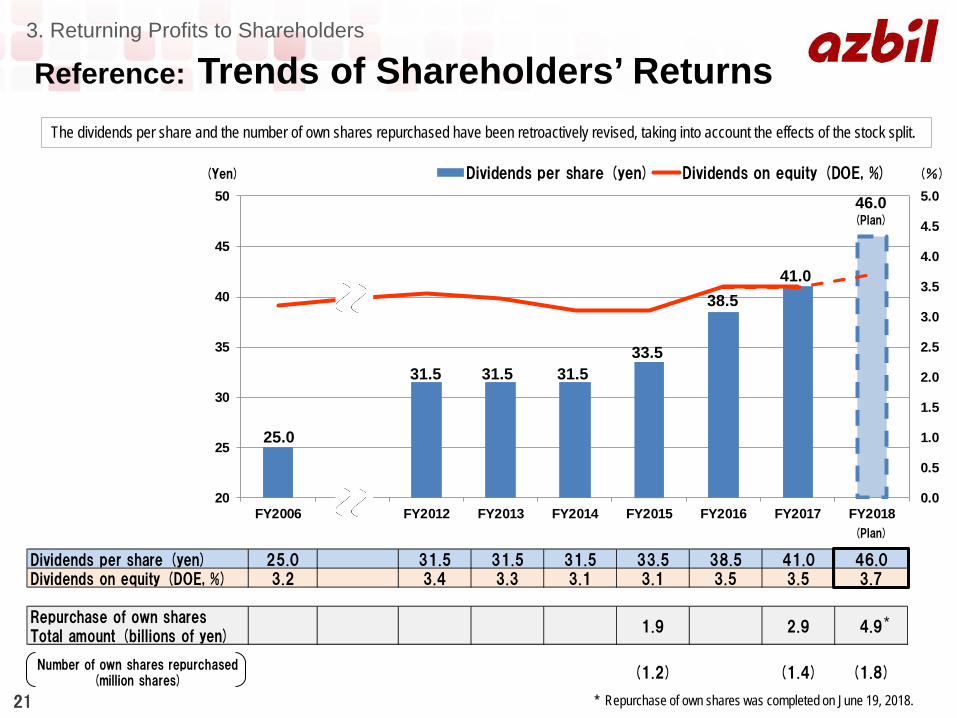
FY2006 FY2012 FY2013 FY2014 FY2015 FY2016 FY2017 FY2018
Dividends per share (yen) Dividends on equity (DOE, %)
Dividends per share (yen) 25.0 31.5 31.5 31.5 33.5 38.5 41.0 46.0Dividends on equity (DOE, %) 3.2 3.4 3.3 3.1 3.1 3.5 3.5 3.7
Repurchase of own sharesTotal amount (billions of yen)
1.9 2.9 4.9
Number of own shares repurchased(million shares)
(1.2) (1.4) (1.8)
3. Returning Profits to Shareholders
Reference: Trends of Shareholders’ Returns
31.5
(Yen) (%)
25.0
31.5 31.5
33.5
46.0 (Plan)
(Plan)
38.5
41.0
*
* Repurchase of own shares was completed on June 19, 2018.
The dividends per share and the number of own shares repurchased have been retroactively revised, taking into account the effects of the stock split.

22
Appendix

23
FY2015 FY2016 FY2017 FY2018 FY2015 FY2016 FY2017 FY2018
(Plan) (Plan)
■ Capital Expenditure 3.4 4.1 7.0 8.0 ■ R&D Expenses 11.0 10.4 11.2 12.0
■ Depreciation 4.1 4.0 4.1 4.6 R&D Expenses/ Net Sales 4.3 4.1 4.3 4.5
0.0
1.0
2.0
3.0
4.0
5.0
6.0
7.0
8.0
9.0
0.0
1.0
2.0
3.0
4.0
5.0
0.0
2.5
5.0
7.5
10.0
12.5
8.7
5.1
3.0
8.0(Plan)
4.6(Plan)
12.0(Plan)
Appendix Capital Expenditure, Depreciation and R&D Expenses
■ Capital Expenditure, Depreciation ■ R&D Expenses, R&D Expenses/Net Sales
(Billions of yen)
*1 Investments earmarked for the integration of the Shonan and Isehara factories, and for upgrading R&D facilities at the Fujisawa Technology Center have been incurred from FY2017.
*2 Most of the increase in R&D expenses was accounted for by development of next-generation BA system products. *3 Product development expenses related to new technological innovations (IoT, big data, AI, etc.) have been increasing from FY2017.
(Billions of yen)
Full-year plan for FY2018 Full-year results/3Q cumulative results for FY2018
*3 *1 *1 *3 *2
(%)

24
Appendix Sustainable Development Goals and the azbil Group
The founder's vision formed the basis for the azbil Group's philosophy “human-centered automation.” By conducting business that draws on this philosophy, we are continuously pursuing sustainable development goals.
Our founder believed in “freeing people from drudgery using advanced technology” – and that spirit lives on, evolving over the years.
< Group Philosophy > To realize safety, comfort, and fulfillment in people’s lives and contribute to global environmental preservation through “human-centered automation.”
From 2006

25
azbil Group Philosophy To realize safety, comfort, and fulfillment in people’s lives and contribute to global environmental preservation through “human-centered automation”
Investor Relations, Group Management Headquarters
Email: [email protected] URL: https://www.azbil.com/ir/


![BALANCE OF PAYMENTS. National Income vs. Domestic Income Net Factor Income [NFI] is income earned on overseas work or investments minus income generated.](https://static.fdocuments.net/doc/165x107/56649ca55503460f94966c6c/balance-of-payments-national-income-vs-domestic-income-net-factor-income.jpg)