Australian Journal of Basic and Applied Sciencesajbasweb.com/old/ajbas/2014/August/326-338.pdf ·...
13
Australian Journal of Basic and Applied Sciences, 8(13) August 2014, Pages: 326-338 AENSI Journals Australian Journal of Basic and Applied Sciences ISSN:1991-8178 Journal home page: www.ajbasweb.com Corresponding Author: Ramesh Kumar Selvaraju, Assistant Professor, Department of Electrical Engineering, Annamalai University, Annamalainagar - 608002, Tamil Nadu, India. Tel: 91-9842597594; E-mail: [email protected]. Design of Artificial Cooperative Search algorithm based Load Frequency Controller for Interconnected Deregulated Power Systems with AC-DC Parallel Tie-lines 1 Ramesh Kumar Selvaraju and 2 Ganapathy Somaskandan 1 Assistant professor, Department of Electrical Engineering, Annamalai University, Annamalainagar- 608002, Tamil Nadu, India. 2 Professor, Department of Electrical Engineering, Annamalai University, Annamalainagar- 608002, Tamil Nadu, India. ARTICLE INFO ABSTRACT Article history: Received 25 June 2014 Received in revised form 8 July 2014 Accepted 25 July 2014 Available online 20 August 2014 Keywords: Artificial Cooperative Search algorithm, AC-DC parallel tie- lines, Deregulated Power System, Load Frequency Control. This paper addresses the design of load frequency controller for an electric power system in deregulated environment using Artificial Cooperative Search (ACS) algorithm. Artificial cooperative search algorithm is a new two-population based global search optimization algorithm, formulated to solve complex numerical optimization problems. The Load Frequency Control (LFC) has been a major aspect in electric power system operation and control throughout the years, to provide reliable and efficient power supply. Because of ever-changing load demand and wide range of operating scenarios existing in multi-area deregulated environment, conventional methods for designing load frequency controllers are incapable of performing good dynamic performance. In this paper, artificial cooperative search optimization algorithm has been proposed for the optimal design of load frequency controllers in deregulated environment. To validate the effectiveness of the proposed ACS algorithm, it is tested on a two area thermal deregulated power system with AC-DC parallel tie lines. The HVDC link is an interconnection between the systems, in parallel with the AC tie-line to damp the system frequency deviation effectively. Results indicate that the controllers designed using proposed ACS algorithm improves the system performances during varying load demands and different operating scenarios of deregulated power system. © 2014 AENSI Publisher All rights reserved. To Cite This Article: Ramesh Kumar Selvaraju and Ganapathy Somaskandan., Design of Artificial Cooperative Search algorithm based Load Frequency Controller for Interconnected Deregulated Power Systems with AC-DC Parallel Tie-lines. Aust. J. Basic & Appl. Sci., 8(13): 326-338, 2014 INTRODUCTION In the last decade, the existing electrical power systems are in a shifting phase from conventional integrated utility environment to deregulated environment. Power system operation and control in a deregulated scenario, such as Load Frequency Control (LFC) is an ancillary service that came into a possession of a principal role to keep the reliability of electrical power system at a satisfactory level, and is going to be more useful nowadays in view of complexity of the interconnected power systems (Singh et al., 2013). The main goal of the LFC is to maintain zero steady state errors for frequency deviation and minimize unscheduled tie-line power flow oscillations between the neighbouring interconnected control areas (Rezvantalab et al., 2009). A brief review on different control methodologies on design of LFC controllers in deregulated environment has been done by Anil Kumar and Venkata Ramana (2013). The modern interconnected power systems are large, complex and exhibit different kinds of uncertainties and disturbances due to system parameter changes. The conventional control method for the design of LFC controllers provides zero steady state deviation, but it exhibits poor dynamic performance. To improve this, there have been continuing efforts in the design of LFC controller with better dynamic response using artificial intelligence algorithms. In this paper, a new two-population based global search optimization algorithm, Artificial Cooperative Search Algorithm (ACS) has been used for optimal tuning of controller parameters in deregulated power systems. The proposed ACS algorithm is implemented on a two area interconnected deregulated power system with AC-DC parallel tie-lines. The main interest in HVDC transmission system is because it has economic, environmental and performance advantages over other alternatives. Because of the unique advantages of HVDC transmission system, it has been applied widely in operating a DC link in parallel with an AC link interconnecting control areas to get an improved system dynamic performance (Ganapathy and Velusami, 2010, Kumar and Ibraheem, 2004). Simulation results show that the proposed ACS algorithm tuned controller
Transcript of Australian Journal of Basic and Applied Sciencesajbasweb.com/old/ajbas/2014/August/326-338.pdf ·...

Australian Journal of Basic and Applied Sciences, 8(13) August 2014, Pages: 326-338
AENSI Journals
Australian Journal of Basic and Applied Sciences
ISSN:1991-8178
Journal home page: www.ajbasweb.com
Corresponding Author: Ramesh Kumar Selvaraju, Assistant Professor, Department of Electrical Engineering, Annamalai
University, Annamalainagar - 608002, Tamil Nadu, India.
Tel: 91-9842597594; E-mail: [email protected].
Design of Artificial Cooperative Search algorithm based Load Frequency Controller for
Interconnected Deregulated Power Systems with AC-DC Parallel Tie-lines 1Ramesh Kumar Selvaraju and 2Ganapathy Somaskandan
1 Assistant professor, Department of Electrical Engineering, Annamalai University, Annamalainagar- 608002, Tamil Nadu, India. 2 Professor, Department of Electrical Engineering, Annamalai University, Annamalainagar- 608002, Tamil Nadu, India.
A R T I C L E I N F O A B S T R A C T
Article history:
Received 25 June 2014
Received in revised form
8 July 2014
Accepted 25 July 2014 Available online 20 August 2014
Keywords: Artificial Cooperative Search
algorithm, AC-DC parallel tie- lines,
Deregulated Power System, Load Frequency Control.
This paper addresses the design of load frequency controller for an electric power
system in deregulated environment using Artificial Cooperative Search (ACS)
algorithm. Artificial cooperative search algorithm is a new two-population based global
search optimization algorithm, formulated to solve complex numerical optimization
problems. The Load Frequency Control (LFC) has been a major aspect in electric power system operation and control throughout the years, to provide reliable and
efficient power supply. Because of ever-changing load demand and wide range of
operating scenarios existing in multi-area deregulated environment, conventional methods for designing load frequency controllers are incapable of performing good
dynamic performance. In this paper, artificial cooperative search optimization
algorithm has been proposed for the optimal design of load frequency controllers in deregulated environment. To validate the effectiveness of the proposed ACS algorithm,
it is tested on a two area thermal deregulated power system with AC-DC parallel tie lines. The HVDC link is an interconnection between the systems, in parallel with the
AC tie-line to damp the system frequency deviation effectively. Results indicate that
the controllers designed using proposed ACS algorithm improves the system performances during varying load demands and different operating scenarios of
deregulated power system.
© 2014 AENSI Publisher All rights reserved.
To Cite This Article: Ramesh Kumar Selvaraju and Ganapathy Somaskandan., Design of Artificial Cooperative Search algorithm based
Load Frequency Controller for Interconnected Deregulated Power Systems with AC-DC Parallel Tie-lines. Aust. J. Basic & Appl. Sci.,
8(13): 326-338, 2014
INTRODUCTION
In the last decade, the existing electrical power systems are in a shifting phase from conventional integrated
utility environment to deregulated environment. Power system operation and control in a deregulated scenario,
such as Load Frequency Control (LFC) is an ancillary service that came into a possession of a principal role to
keep the reliability of electrical power system at a satisfactory level, and is going to be more useful nowadays in
view of complexity of the interconnected power systems (Singh et al., 2013). The main goal of the LFC is to
maintain zero steady state errors for frequency deviation and minimize unscheduled tie-line power flow
oscillations between the neighbouring interconnected control areas (Rezvantalab et al., 2009). A brief review on
different control methodologies on design of LFC controllers in deregulated environment has been done by Anil
Kumar and Venkata Ramana (2013). The modern interconnected power systems are large, complex and exhibit
different kinds of uncertainties and disturbances due to system parameter changes. The conventional control
method for the design of LFC controllers provides zero steady state deviation, but it exhibits poor dynamic
performance. To improve this, there have been continuing efforts in the design of LFC controller with better
dynamic response using artificial intelligence algorithms.
In this paper, a new two-population based global search optimization algorithm, Artificial Cooperative
Search Algorithm (ACS) has been used for optimal tuning of controller parameters in deregulated power
systems. The proposed ACS algorithm is implemented on a two area interconnected deregulated power system
with AC-DC parallel tie-lines. The main interest in HVDC transmission system is because it has economic,
environmental and performance advantages over other alternatives. Because of the unique advantages of HVDC
transmission system, it has been applied widely in operating a DC link in parallel with an AC link
interconnecting control areas to get an improved system dynamic performance (Ganapathy and Velusami, 2010,
Kumar and Ibraheem, 2004). Simulation results show that the proposed ACS algorithm tuned controller

327 Ramesh Kumar Selvaraju and Ganapathy Somaskandan, 2014
Australian Journal of Basic and Applied Sciences, 8(13) August 2014, Pages: 326-338
improves the dynamic response of the deregulated power system and provides a control system that satisfies the
LFC requirements.
Multi-Area Lfc Model In Deregulated Environment:
The structure of electrical utilities has changed dramatically after the induction of deregulation principles.
Before deregulation the ancillary services such as scheduling, system control and dispatch, reactive supply and
voltage control from generation sources, regulation and frequency response, energy imbalance and operating
reserve – spinning were provided by a single utility called as control area. Each control area has its own
generating resources, transmission and distribution capacities located within its boundary. After deregulation,
the new deregulation framework permits new companies to emerge namely, generation companies (GENCO’s),
transmission companies (TRANSCO’s), distribution companies (DISCO’s), and independent contract
administrator (ICA). To resolve any difference between different companies, an independent contract
administrator is preferred (Bekhouche, 2002).
To improve the efficiency of operation of the existing power system scenario, deregulation principle has
been introduced into the power system structure. In deregulated environment, the GENCOs and DISCOs can
have various combinations of bilateral contracts in-between themselves. The DISCO Participation Matrix
(DPM) can be used to realize the bilateral contracts among various GENCOs and DISCOs. The details of the
contracts between the GENCO and DISCO are provided by DPM. The number of rows in DPM is equal to the
number of GENCOs and the number of columns in DPM is equal to the number of DISCOs in the deregulated
scenario. Each entry of DPM is a fraction of a total load power contract between a DISCO and GENCO in the
system. The total sum of all the entries of DPM column is unity (Donde et al., 2001).
1cpfiji (1)
The proposed deregulated power system is a two-area thermal power system with AC-DC parallel ties-lines
in deregulated scenario as shown in Fig.1. The HVDC link is used as system interconnection in parallel with AC
tie-line to effectively damp the frequency oscillation of AC system. The corresponding DPM matrix is as given
below, where cpf represents the contract participation factor.
DPM=
44cpf43cpf
34cpf33cpf
42cpf41cpf
32cpf31cpf24cpf23cpf
14cpf13cpf
22cpf21cpf
12cpf11cpf
The off diagonal entries in the DPM represent the demand of DISCO in one area with the GENCO in
another area.
Statement of the Problem:
The state space representation of the LFC model in deregulated environment under consideration is given
by;
ΓDBUAX.X (2)
Where X represents system state vector matrix, U represents system control vector matrix, D represents
system disturbance vectors, A represents system state matrix, B represents system control input matrix and Ґ
represents disturbance input matrix of appropriate dimensions.
XT
22e22g22g21e21g
2dc21tie12e12g12g
11e11g121
XPPXP
FPPXPP
XPFACEACE
(3)
U T
2C1C PP
(4)
DT
2uC1uC4L3L2L1L PPPPPP
(5)
The corresponding values of co-efficient matrices A, B and Ґ are determined using the values of the system
parameters given by Donde et al., (2001) and Ganapathy and Velusami (2010). For reducing the frequency
deviations and area inter tie-line power deviations to be zero during steady state, the Area Control Error (ACE)
should be reduced to zero. To obtain the desired value of ACE, the ACEs are expressed as
ACE1= β1∆F1 + ∆Ptie1-2,error (6)
ACE2= β2∆F2 - ∆Ptie1-2,error (7)
328 Ramesh Kumar Selvaraju and Ganapathy Somaskandan, 2014
Australian Journal of Basic and Applied Sciences, 8(13) August 2014, Pages: 326-338
g11sT1
1
r12
r12r12
sT1
TsK1
t11sT1
1
t12sT1
1
g12sT1
1
ps1
ps1
sT1
K
)s(1F
g21sT1
1
r22
r22r22
sT1
TsK1
t21sT1
1
t22sT1
1
g22sT1
1
ps2
ps2
sT1
K
)s(2F
s
12T2
)s(1dP
)s(2dP
DC
C
sT1K
D
)s(11eX )s(11gP
)s(12eX )s(12g'P
)s(12gP
)s(21eX
)s(P 1c
)s(P 2c )s(X 22e
)s(P 21g
)s(P 22g)s('P 22g
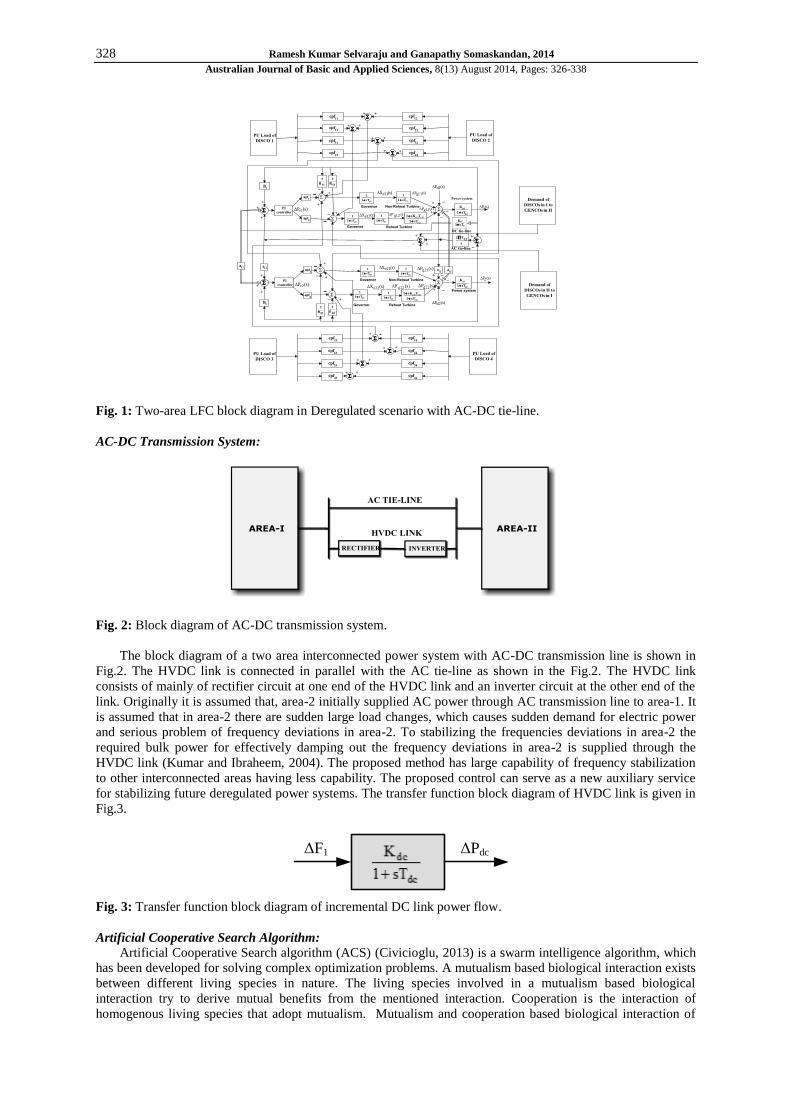
Fig. 1: Two-area LFC block diagram in Deregulated scenario with AC-DC tie-line.
AC-DC Transmission System:
Fig. 2: Block diagram of AC-DC transmission system.
The block diagram of a two area interconnected power system with AC-DC transmission line is shown in
Fig.2. The HVDC link is connected in parallel with the AC tie-line as shown in the Fig.2. The HVDC link
consists of mainly of rectifier circuit at one end of the HVDC link and an inverter circuit at the other end of the
link. Originally it is assumed that, area-2 initially supplied AC power through AC transmission line to area-1. It
is assumed that in area-2 there are sudden large load changes, which causes sudden demand for electric power
and serious problem of frequency deviations in area-2. To stabilizing the frequencies deviations in area-2 the
required bulk power for effectively damping out the frequency deviations in area-2 is supplied through the
HVDC link (Kumar and Ibraheem, 2004). The proposed method has large capability of frequency stabilization
to other interconnected areas having less capability. The proposed control can serve as a new auxiliary service
for stabilizing future deregulated power systems. The transfer function block diagram of HVDC link is given in
Fig.3.
ΔF1 ΔPdc
Fig. 3: Transfer function block diagram of incremental DC link power flow.
Artificial Cooperative Search Algorithm:
Artificial Cooperative Search algorithm (ACS) (Civicioglu, 2013) is a swarm intelligence algorithm, which
has been developed for solving complex optimization problems. A mutualism based biological interaction exists
between different living species in nature. The living species involved in a mutualism based biological
interaction try to derive mutual benefits from the mentioned interaction. Cooperation is the interaction of
homogenous living species that adopt mutualism. Mutualism and cooperation based biological interaction of

329 Ramesh Kumar Selvaraju and Ganapathy Somaskandan, 2014
Australian Journal of Basic and Applied Sciences, 8(13) August 2014, Pages: 326-338
two eusocial superorganisms living in the same environment inspired the ACS algorithm. The habitat concept in
ACS algorithm matches the search space concept that belongs to the related problem.
In ACS algorithm, a superorganism consisting of random solutions of the related problem corresponds to an
artificial superorganism migrating to more productive feeding areas. ACS algorithm contains two
superorganisms; α and β that have artificial sub-superorganisms equal to the dimension of the population (N).
The dimension of the problem (D) is equal to the number of individuals within the related sub-superorganisms.
In ACS algorithm, α and β superorganisms are used for the detection of artificial Predator and Prey sub-
superorganisms. The Predator sub-superorganisms in ACS algorithm can pursue the Prey sub-superorganisms
for a period of time while they migrate towards global minimum of the problem. When the iterative calculation
process of ACS algorithm that is named as co evolution process is considered, it can be seen that the two
superorganisms looking for the global minimum of the related problem, establish cooperation based biological
interaction between each other. In ACS algorithm, the initial values of the individuals of ith sub-superorganism
of α (i.e., α_ (i,j)) and β (i.e., β_(i,j)) are defined by using (8) and (9)
jlow)jlowjup.(rand0g,j,i (8)
jlow)jlowjup.(rand0g,j,i (9)
where i = 1, 2, 3, ... , N, j = 1, 2, 3, ... , D and g = 0, 1, 2, 3, ... , max cycle. The ‘g’ value here denotes the
generation number expressing the co evolution level containing the related superorganisms. The rand shows a
random number chosen from the uniform distribution with U[0 1]. The upj and lowj are the upper and lower
limits of search space for jth dimension of the related problem. The fitness values are obtained by the related
sub-super organisms computed by using (10) and (11);
i;i fy (10)
if;iy (11)
The biological interaction location, X, between Predator and Prey sub-superorganisms is modeled using the
equation (12);
)edatorPrey(PrRedatorPrX (12)
Where, R is the Scale factor that controls the speed of biological interaction. The probabilistic nature of
ACS algorithm causes the super-organism that is determined as the predator to be changed in each generation.
Therefore, ACS algorithm provides a cooperative/co-evolution process for both of the superorganisms. The
pseudo code of ACS algorithm is provided in (Civicioglu P, 2013). The proposed algorithm can be implemented
with convergence, iteration or tolerance as the stopping criteria. In this proposed study, iteration count has been
taken as the stopping criteria
Optimal gain tuning:
The proposed deregulated system is a two-area thermal power system with AC-DC tie-lines in deregulated
scenario as shown in Fig.1. ACS algorithm is applied for optimizing the proportional plus integral controller
gains for a two area interconnected thermal power system in deregulated environment. The LFC model is a two
area interconnected power system with each area having one reheat unit and one non-reheat unit. The objective
is to obtain the optimum values of the controller parameters which will minimize the performance index, J
(Ganapathy and Velusami, 2010).
dt2dc
P221tie
P21
FJ
(13)
For LFC in deregulated environment using ACS algorithm, initially the random generated biological
interaction location X is used to calculate fitness value. For each iteration the sub-superorganism (α and β)
values are obtained using (10) and (11). The predator and prey sub-superorganisms are determined in each
generation by using α and β superorganisms. The biological interaction location, X, between predator and prey
is updated using (12). The objective function J is calculated for each set of X using (13). ACS algorithm
provides a cooperative / co evolution process for both the superorganisms. The process is repeated until
optimum gains corresponding to global minimum objective function value are obtained.
Simulation results and discussion:
An interconnected two-area system thermal power system having one reheat turbine and one non-reheat
turbine in each area with AC-DC parallel tie-lines in the deregulated environment is used to demonstrate the
effectiveness of the proposed artificial cooperative search algorithm. Table 1 shows the optimal controller gain
values obtained using ACS algorithm and the corresponding cost functions. The simulations are performed for
different contract scenarios of the deregulated environment. The data required for the simulations are taken from
(Donde et al., 2001and Ganapathy and Velusami, 2010).

330 Ramesh Kumar Selvaraju and Ganapathy Somaskandan, 2014
Australian Journal of Basic and Applied Sciences, 8(13) August 2014, Pages: 326-338
Table I: Optimal Proportional plus Integral Gain Values.
Type of PI controller Feedback gains Cost function value
Controller designed using ISE criteria KP = 0.5250 Ki = 0.4200
132.4831
Controller designed using ACS Algorithm KP = 0.0027
Ki = 1.0925
79.8201
Poolco Scenario:
In the poolco scenario of case study, all the GENCOs present in each area participate equally in LFC
operation. The area participation factors are assumed equally as given apf1 = apf2 = apf3 = apf4 = 0.5. In this
scenario the load change is assumed to occur only in area-1, so the load is demanded by DISCO-1 and DISCO-
2. The PU load of DISCO-1 and DISCO-2 are assumed as 0.1pu MW. Therefore the entries in Disco
Participation Matrix becomes modified as given below
DPM=
00
00
00
00
00
00
5.05.0
5.05.0
The generation of GENCO (PMi) is expressed in terms of Contract Participation Factor (cpf) and load
demand of DISCOs (PLj) as given below
PMi = j
ijcpf PLj (14)
PMi = cpfi1PL1+ cpfi2PL2+ cpfi3PL3+ cpfi4PL4
For the Poolco scenario,
PM1 = (0.5x 0.1) + (0.5x 0.1) + 0 + 0 = 0.1p.u MW
PM2 = (0.5x 0.1) + (0.5x 0.1) + 0 + 0 = 0.1p.u MW
PM3 = 0 + 0 + 0 + 0 = 0 p.u MW
PM4 = 0 + 0 + 0 + 0 = 0 p.u MW
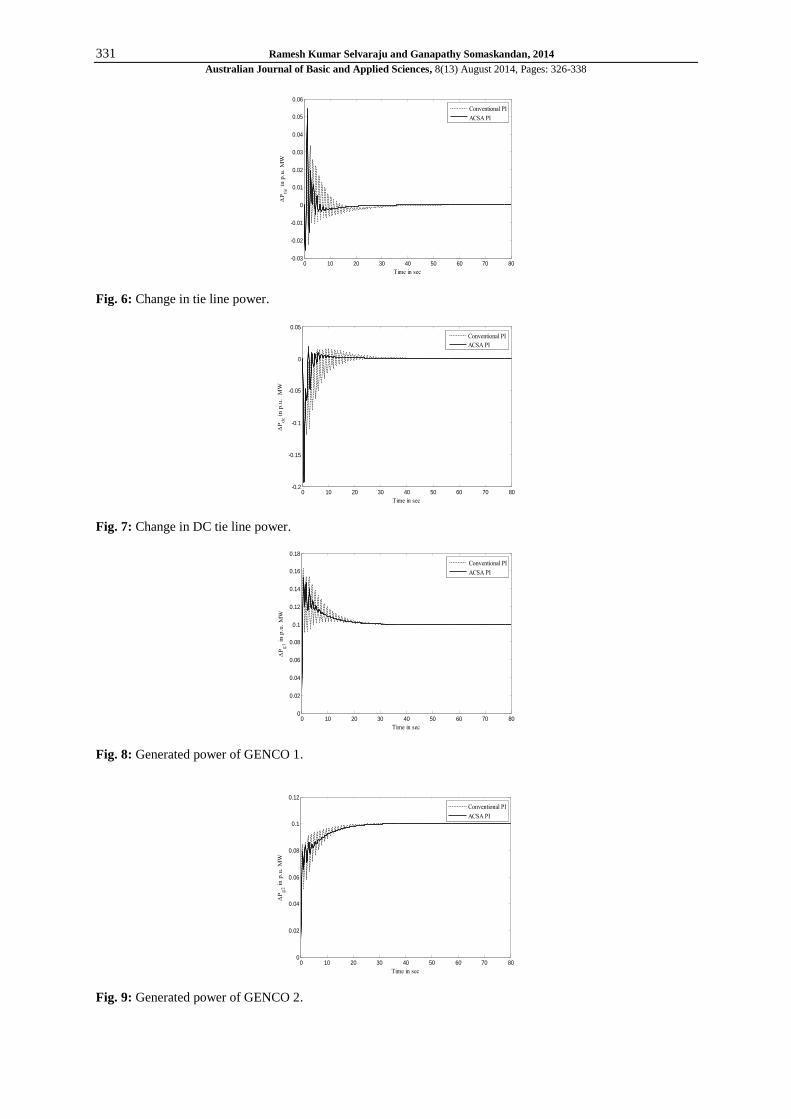
Fig.4 and Fig.5 show the simulation results of area frequency deviation, Fig.6 shows the actual power flow
from area-1 to area-2, Fig.7 shows the dc power flow and Fig.8, Fig.9, Fig10, Fig.11 show the actual generated
powers of the GENCOs
0 10 20 30 40 50 60 70 80-0.25
-0.2
-0.15
-0.1
-0.05
0
0.05
0.1
0.15
Time in sec
F
1 i
n H
z
Conventional PI
ACSA PI
Fig. 4: Frequency deviation of area 1.
0 10 20 30 40 50 60 70 80-0.4
-0.3
-0.2
-0.1
0
0.1
0.2
0.3
Time in sec
F
2 i
n H
z
Conventional PI
ACSA PI
Fig. 5: Frequency deviation of area 2.
331 Ramesh Kumar Selvaraju and Ganapathy Somaskandan, 2014
Australian Journal of Basic and Applied Sciences, 8(13) August 2014, Pages: 326-338
0 10 20 30 40 50 60 70 80-0.03
-0.02
-0.01
0
0.01
0.02
0.03
0.04
0.05
0.06
Time in sec
P
tie i
n p
.u.
MW
Conventional PI
ACSA PI
Fig. 6: Change in tie line power.
0 10 20 30 40 50 60 70 80-0.2
-0.15
-0.1
-0.05
0
0.05
Time in sec
P
dc i
n p
.u.
MW
Conventional PI
ACSA PI
Fig. 7: Change in DC tie line power.
0 10 20 30 40 50 60 70 800
0.02
0.04
0.06
0.08
0.1
0.12
0.14
0.16
0.18
Time in sec
P
g1 i
n p
.u.
MW
Conventional PI
ACSA PI
Fig. 8: Generated power of GENCO 1.
0 10 20 30 40 50 60 70 800
0.02
0.04
0.06
0.08
0.1
0.12
Time in sec
P
g2 i
n p
.u.
MW
Conventional PI
ACSA PI
Fig. 9: Generated power of GENCO 2.

332 Ramesh Kumar Selvaraju and Ganapathy Somaskandan, 2014
Australian Journal of Basic and Applied Sciences, 8(13) August 2014, Pages: 326-338
0 10 20 30 40 50 60 70 80-0.06
-0.04
-0.02
0
0.02
0.04
0.06
0.08
Time in sec
Pg
3 i
n p
.u.
MW
Conventional PI
ACSA PI
Fig. 10: Generated power of GENCO 3.
0 10 20 30 40 50 60 70 80-0.03
-0.02
-0.01
0
0.01
0.02
0.03
0.04
0.05
Time in sec
P
g4 i
n p
.u.
MW
Conventional PI
ACSA PI
Fig. 11: Generated power of GENCO 4.
It has been observed that the frequency deviation in each area goes to zero in the steady state and also the
power flow during the steady state over the tie-line is zero. The generation of GENCOs reaches the desired
value of generation during the steady state.
Bilateral contract:
In this scenario of case study, all the DISCOs have a contract with any GENCO in any other area as per the
DPM. Each DISCO is assumed to demand 0.1 p.u MW power from the GENCOs. The area participation factors
are apf1 = 0.75, apf2 = 0.25, apf3 = 0.5, apf4 = 0.5. Therefore the entries in DPM becomes as given below
DPM=
00
7.01
25.03.0
25.00
00
3.00
25.02.0
25.05.0
The scheduled tie-line power from area 1 to area 2 is calculated from the values of the off diagonal
elements of the DPM using the following expression,
Ptie scheduled = LjP
4
3i
2
1jijcpfLjP
2
1i
4
3jijcpf
(15)
= (cpf13+cpf23)PL3 + (cpf14+cpf24) PL4 – (cpf31+cpf41) PL1 – (cpf32+cpf42) PL2
= (0+0)0.1 + (0.3+0)0.1–(0+0.3)0.1–(0.25+0.25)0.1 = - 0.05 p.u MW
The desired generation of GENCO (PMi) during steady state is calculated using (14) as follows,
PM1 = (0.5x 0.1) + (0.25x 0.1) +0+ (0.3x0.1) = 0.105 p.u MW
PM2 = (0.2x 0.1) + (0.25x 0.1) +0+0 = 0.045 p.u MW
PM3 = (0x0.1) + (0.25x0.1)+(1x0.1)+(0.7x0.1) = 0.195 p.u MW
PM4 = (0.3x0.1) + (0.25x0.1) + 0 + 0 = 0.055 p.u MW
Fig.12 and Fig.13 show the area frequency deviation during the bilateral scenario, Fig.14 shows the actual
power flow from area-1 to area-2 during the bilateral scenario , Fig.15 shows the scheduled tie-line power flow
from area-1 to area-2, Fig.16 shows the dc power flow and Fig.17, Fig.18, Fig19, Fig.20 show the actual
generated powers of the GENCOs.

333 Ramesh Kumar Selvaraju and Ganapathy Somaskandan, 2014
Australian Journal of Basic and Applied Sciences, 8(13) August 2014, Pages: 326-338
0 10 20 30 40 50 60 70 80-0.25
-0.2
-0.15
-0.1
-0.05
0
0.05
0.1
Time in sec
F
1 i
n H
z
Conventional PI
ACSA PI
Fig.12: Frequency deviation of area 1.
0 10 20 30 40 50 60 70 80-0.4
-0.3
-0.2
-0.1
0
0.1
0.2
0.3
0.4
Time in sec
F
2 i
n H
z
Conventional PI
ACSA PI
Fig. 13: Frequency deviation of area 2.
0 10 20 30 40 50 60 70 80-0.02
0
0.02
0.04
0.06
0.08
0.1
0.12
Time in sec
P
tie i
n p
.u.
MW
Conventional PI
ACSA PI
Fig. 14: Change in tie line power.
0 10 20 30 40 50 60 70 80-0.08
-0.06
-0.04
-0.02
0
0.02
0.04
0.06
0.08
Time in sec
P
tic s
ch
ed
ule
i
n p
.u M
W
Conventional PI
ACSA PI
Fig. 15: Scheduled tie line power.

334 Ramesh Kumar Selvaraju and Ganapathy Somaskandan, 2014
Australian Journal of Basic and Applied Sciences, 8(13) August 2014, Pages: 326-338
0 10 20 30 40 50 60 70 80-0.14
-0.12
-0.1
-0.08
-0.06
-0.04
-0.02
0
0.02
0.04
Time in sec
Pd
c in
p.u
. M
W
Conventional PI
ACSA PI
Fig. 16: Change in DC tie line power .
0 10 20 30 40 50 60 70 800
0.02
0.04
0.06
0.08
0.1
0.12
0.14
0.16
0.18
0.2
Time in sec
P
g1 i
n p
.u.
MW
Conventional PI
ACSA PI
Fig. 17: Generated power of GENCO 1.
0 10 20 30 40 50 60 70 800
0.02
0.04
0.06
0.08
0.1
0.12
Time in sec
P
g2 i
n p
.u.
MW
Conventional PI
ACSA PI
Fig. 18: Generated power of GENCO 2.
0 10 20 30 40 50 60 70 800
0.05
0.1
0.15
0.2
0.25
0.3
0.35
Time in sec
P
g3 i
n p
.u.
MW
Conventional PI
ACSA PI
Fig. 19: Generated power of GENCO 3.

335 Ramesh Kumar Selvaraju and Ganapathy Somaskandan, 2014
Australian Journal of Basic and Applied Sciences, 8(13) August 2014, Pages: 326-338
0 10 20 30 40 50 60 70 80-0.02
0
0.02
0.04
0.06
0.08
0.1
Time in sec
Pg
4 i
n p
.u.
MW
Conventional PI
ACSA PI
Fig. 20: Generated power of GENCO 4.
From the simulation, it has been noted that by implementing the proposed ACS algorithm designed
controller, the frequency deviations and tie-line power deviations are quickly driven back to zero and have better
response. It is also observed that the generations of all the GENCOs and the scheduled tie-line power flows are
at their desired levels during the steady state.
Contract violation:
In this case, the DISCO 1 violates the contract by demanding 0.1 pu MW excess power than its contracted
power. The uncontracted power will be supplied by the GENCOs present in the same area of the DISCO which
violates the contract that is GENCO1 and GENCO2. The total load in area 1 is equal to the load of DISCO 1,
load of DISCO 2 and the uncontracted load, which is equal to 0.3 pu MW. Similarly the load in area 2 is equal
to the sum of the loads of DISCO 3 and DISCO 4 which is 0.2 pu MW. The DPM is same as in scenario 2. The
distribution of uncontracted load among the GENCOs is decided by the area participation factor.
0 10 20 30 40 50 60 70 80-0.4
-0.3
-0.2
-0.1
0
0.1
0.2
0.3
Time in sec
F
1 i
n H
z
Conventional PI
ACSA PI
Fig. 21: Frequency deviation of area 1.
0 10 20 30 40 50 60 70 80-0.5
-0.4
-0.3
-0.2
-0.1
0
0.1
0.2
0.3
0.4
0.5
Time in sec
F
2 i
n H
z
Conventional PI
ACSA PI
Fig. 22: Frequency deviation of area 2.

336 Ramesh Kumar Selvaraju and Ganapathy Somaskandan, 2014
Australian Journal of Basic and Applied Sciences, 8(13) August 2014, Pages: 326-338
0 10 20 30 40 50 60 70 80-0.02
0
0.02
0.04
0.06
0.08
0.1
0.12
0.14
0.16
Time in sec
Pti
e i
n p
.u.
MW
Conventional PI
ACSA PI
Fig. 23: Change in tie line power.
0 10 20 30 40 50 60 70 80-0.08
-0.06
-0.04
-0.02
0
0.02
0.04
0.06
0.08
0.1
Time in sec
P
tic s
chedule
i
n p
.u M
W
Conventional PI
ACSA PI
Fig. 24: Scheduled tie line power.
0 10 20 30 40 50 60 70 80-0.2
-0.15
-0.1
-0.05
0
0.05
Time in sec
P
dc i
n p
.u.
MW
Conventional PI
ACSA PI
Fig.25: Change in DC tie line power.
0 10 20 30 40 50 60 70 800
0.05
0.1
0.15
0.2
0.25
0.3
0.35
Time in sec
P
g1 i
n p
.u.
MW
Conventional PI
ACSA PI
Fig. 26: Generated power of GENCO 1.

337 Ramesh Kumar Selvaraju and Ganapathy Somaskandan, 2014
Australian Journal of Basic and Applied Sciences, 8(13) August 2014, Pages: 326-338
0 10 20 30 40 50 60 70 800
0.02
0.04
0.06
0.08
0.1
0.12
Time in sec
Pg
2 i
n p
.u.
MW
Conventional PI
ACSA PI
Fig. 27: Generated power of GENCO 2.
0 10 20 30 40 50 60 70 800
0.05
0.1
0.15
0.2
0.25
0.3
0.35
0.4
Time in sec
P
g3 i
n p
.u.
MW
Conventional PI
ACSA PI
Fig. 28: Generated power of GENCO 3.
0 10 20 30 40 50 60 70 80-0.02
0
0.02
0.04
0.06
0.08
0.1
0.12
0.14
Time in sec
P
g4 i
n p
.u.
MW
Conventional PI
ACSA PI
Fig. 29: Generated power of GENCO 4.
Fig. 26 and Fig.27 show that Generation of GENCO 1 and GENCO 2 are affected by the uncontracted load
of DISCO 1, whereas Fig.28 and Fig.29 show that the generation of GENCO 3 and GENCO 4 remain unaltered
due to the uncontracted load. The uncontracted load of DISCO 1 is met by the GENCO 1 and GENCO 2 in area
1. The simulation results reveal that frequency deviations and tie line power deviations are reduced effectively
during the presence of DC tie –line in parallel with AC tie-line.
Conclusion:
In this work, a new a new global search optimization algorithm, the Artificial Cooperative Search
Algorithm (ACS) has been introduced for the solution of LFC problem in deregulated power environment. The
proposed algorithm has been applied to tune the controller gains for a two area deregulated power system with
AC-DC parallel tie-lines and has been tested under various possible bilateral contracts. The simulation results
reveal that the controller designed using ACS algorithm suppresses the frequency deviations and tie-line power
deviations effectively. The area frequency responses, tie-line power flow response and generation of GENCOs
exhibit less overshoot, less undershoot and minimum settling time in the presence of a DC tie-line in parallel
with an AC tie-line.

338 Ramesh Kumar Selvaraju and Ganapathy Somaskandan, 2014
Australian Journal of Basic and Applied Sciences, 8(13) August 2014, Pages: 326-338
ACKNOWLEDGEMENT
The authors wish to thank the authorities of Annamalai University, Annamalainagar, Tamilnadu, INDIA for
the facilities provided to prepare this paper.
REFERENCES
Anil Kumar, T., N. Venkata Ramana, 2013. A review on control strategies for LFC in deregulated scenario.
I manager's Journal on circuits and systems, 1: 31-40.
Bekhouche, N., 2002. Automatic Generation Control before and after deregulation. In: IEEE 2002,
34th southeastern symposium on system theory; Huntsville, Alabama, USA, pp: 321-323.
Civicioglu, P., 2013. Artificial cooperative search algorithm for numerical optimization problems.
Information Sciences, 229: 58-76.
Donde, V., M.A. Pai, I.A. Hiskens, 2001. Simulation and optimization in a LFC system after deregulation.
IEEE Transactions on Power Systems, 16: 481-489.
Ganapathy, S., S.S. Velusami, 2010. MOEA based design of decentralized controllers for LFC of
interconnected power systems with nonlinearities, AC-DC parallel tie-lines and SMES units. Energy Conversion
and Management, 51: 873-880.
Ganapathy, S, S.S. Velusami, 2010. Decentralized Load- Frequency Control for interconnected power
systems with AC-DC tie-lines. The ICFAI university journal of electrical and electronics engineering, 3(1): 54-
65.
Kumar, P., Ibraheem, 2004. Study of dynamic performance of power systems with asynchronous tie-lines
considering parameter uncertainties. J Inst Eng (India): Electr Eng Div, 85: 35-42.
Rezvantalab, J., M.H. Kazemi, A.K. Seddigh, 2009. Multi-area robust decentralized Load Frequency
Controller design in a restructured power system using quantitative feedback theory. In 2009 IEEE Electric
power and energy conversion systems conference; Sharjah, United Arab Emirates, pp: 1-6.
Singh, O,, P. Tiwari, Ibraheem, A.K. Singh, 2013. A survey of recent Automatic Generation Control
strategies in power systems. International journal of emerging trends in electrical and electronics, 7: 1-14.