Australian Journal of Basic and Applied Sciencesajbasweb.com/old/ajbas/2015/February/277-291.pdf278...
15
Australian Journal of Basic and Applied Sciences, 9(2) February 2015, Pages: 277-291 AENSI Journals Australian Journal of Basic and Applied Sciences (ISSN 1991-8178) Journal home page: www.ajbasweb.com Corresponding Author: A. Krishnaveni, Faculty of Mechanical Engineering, Government College of Engineering, Tirunelveli, India. Reliability Based Design of Pressure Vessels Containing Axial Through Crack Using Probabilistic Fracture Mechanics 1 A. Krishnaveni, 1 D. Jebakani, 2 K. Jeyakumar, T. Christopher 1 Faculty of Mechanical Engineering, Government College of Engineering, Tirunelveli-627 007, Tamil Nadu, India. 2 Professor and Principal, SCAD Engineering College, Cheranmahadevi-627414, Tamil Nadu, India. ARTICLE INFO ABSTRACT Article history: Received 25 October 2014 Received in revised form 26 November 2014 Accepted 29 December 2014 Available online 15 January 2015 Keywords: Probabilistic fracture mechanics; reliability, safety factor, axial through cracked pressure vessel; failure pressure; modified two parameter fracture criterion, operating pressure. Background: Deterministic Fracture Mechanics analysis does not address the uncertainties involved in material properties, loads, location and size of the flaws etc. However, in real-life situations such uncertainties can affect significantly the conclusions drawn out of a deterministic analysis. The principles of Probabilistic Fracture Mechanics (PFM) are used to ascertain the effects of such uncertainties. PFM is becoming increasingly popular for realistic evaluation of fracture response and predicting the reliability of cracked structures. Objective: A probabilistic failure assessment methodology has been proposed in this study to compute the reliability- based safety factor for the prediction of safe operating pressure for the pressure vessels. Modified two parameter fracture criterion has been used to predict the failure of cracked pressure vessels. In this study, the scatter in the crack geometry, fracture parameter, material properties and geometric parameters of the pressure vessel are considered. Monte- Carlo simulation method is used to perform the PFM analysis. Results: Based on the study carried out using PFM, the upper and lower limits of failure pressure of pressure vessel at various confidence levels are proposed. Using Stress-Strength interference theory, reliability based safety factor has also been proposed. Conclusion: The safe operating pressure for pressure vessels containing axial through crack is computed for the specified reliability levels. The proposed work will help the design engineer to decide the operating pressure of the cracked structure for the specified safety and reliability. © 2015 AENSI Publisher All rights reserved. To Cite This Article: A. Krishnaveni, D. Jebakani, K. Jeyakumar, T. Christopher, Reliability Based Design of Pressure Vessels Containing Axial Through Crack Using Probabilistic Fracture Mechanics.Aust. J. Basic & Appl. Sci., 9(2): 277-291, 2015 INTRODUCTION The mechanical integrity of pressure vessel is of great importance for both economical and safety reasons. In practice, this integrity is assured by careful attention to all aspects of design, manufacturing, installation and operation of the pressure vessel. Cracks are inherent in many components owing to the process by which they are manufactured or fabricated. The maximum pressure withstanding capacity of a cracked pressure vessel is determined by applying the principles of fracture mechanics. The crack under severe load can become unstable and thereby causing the failure of pressure vessel at cracked sections. Therefore the cracks are an important consideration for safety analysis (Rohit Rastogi et al., 2002). However many of the input parameters are statistically distributed. The traditional approach of safety assessment and design lies in a deterministic model. The probabilistic approach is obviously the best choice in practical applications when sufficient information on the distribution of the random variables is known (Lin et al., 2004). Probabilistic Fracture Mechanics (PFM) is a rapidly developing field with numerous applications in science and engineering which blends fracture mechanics and probability theory (Rahman and Kim, 2001). PFM provides a more rational way of describing the actual behavior and reliability of structures than the traditional deterministic models (Rahman and Kim, 2001). Now-a-days many researchers are exploring applicability of the PFM approach and few of them are listed here. Rahman (1997) developed a PFM model for analyzing circumferential through-walled-cracked pipes subject to bending loads. New equations were developed to represent the functions. Both analytical and simulation methods were formulated to determine the probabilistic characteristics of J integral. Jian Ping Zhao et al. (1997) introduced a new concept of probabilistic failure assessment diagram for defect assessment. Genki Yagawa et al. (1997) established standard PFM procedures for evaluating failure probabilities of nuclear pressure vessel and pipes. Sensitivity analyses are performed to
Transcript of Australian Journal of Basic and Applied Sciencesajbasweb.com/old/ajbas/2015/February/277-291.pdf278...
Australian Journal of Basic and Applied Sciences, 9(2) February 2015, Pages: 277-291
AENSI Journals
Australian Journal of Basic and Applied Sciences
(ISSN 1991-8178)
Journal home page: www.ajbasweb.com
Corresponding Author: A. Krishnaveni, Faculty of Mechanical Engineering, Government College of Engineering,
Tirunelveli, India.
Reliability Based Design of Pressure Vessels Containing Axial Through Crack Using
Probabilistic Fracture Mechanics 1A. Krishnaveni, 1D. Jebakani, 2K. Jeyakumar, T. Christopher
1Faculty of Mechanical Engineering, Government College of Engineering, Tirunelveli-627 007, Tamil Nadu, India. 2Professor and Principal, SCAD Engineering College, Cheranmahadevi-627414, Tamil Nadu, India.
A R T I C L E I N F O A B S T R A C T
Article history:
Received 25 October 2014 Received in revised form 26 November
2014
Accepted 29 December 2014 Available online 15 January 2015
Keywords: Probabilistic fracture mechanics;
reliability, safety factor, axial through
cracked pressure vessel; failure pressure; modified two parameter
fracture criterion, operating pressure.
Background: Deterministic Fracture Mechanics analysis does not address the
uncertainties involved in material properties, loads, location and size of the flaws etc. However, in real-life situations such uncertainties can affect significantly the
conclusions drawn out of a deterministic analysis. The principles of Probabilistic
Fracture Mechanics (PFM) are used to ascertain the effects of such uncertainties. PFM is becoming increasingly popular for realistic evaluation of fracture response and
predicting the reliability of cracked structures. Objective: A probabilistic failure
assessment methodology has been proposed in this study to compute the reliability-based safety factor for the prediction of safe operating pressure for the pressure vessels.
Modified two parameter fracture criterion has been used to predict the failure of
cracked pressure vessels. In this study, the scatter in the crack geometry, fracture parameter, material properties and geometric parameters of the pressure vessel are
considered. Monte- Carlo simulation method is used to perform the PFM analysis.
Results: Based on the study carried out using PFM, the upper and lower limits of failure pressure of pressure vessel at various confidence levels are proposed. Using
Stress-Strength interference theory, reliability based safety factor has also been
proposed. Conclusion: The safe operating pressure for pressure vessels containing axial through crack is computed for the specified reliability levels. The proposed work
will help the design engineer to decide the operating pressure of the cracked structure
for the specified safety and reliability.
© 2015 AENSI Publisher All rights reserved.
To Cite This Article: A. Krishnaveni, D. Jebakani, K. Jeyakumar, T. Christopher, Reliability Based Design of Pressure Vessels Containing
Axial Through Crack Using Probabilistic Fracture Mechanics.Aust. J. Basic & Appl. Sci., 9(2): 277-291, 2015
INTRODUCTION
The mechanical integrity of pressure vessel is of great importance for both economical and safety reasons.
In practice, this integrity is assured by careful attention to all aspects of design, manufacturing, installation and
operation of the pressure vessel. Cracks are inherent in many components owing to the process by which they
are manufactured or fabricated. The maximum pressure withstanding capacity of a cracked pressure vessel is
determined by applying the principles of fracture mechanics. The crack under severe load can become unstable
and thereby causing the failure of pressure vessel at cracked sections. Therefore the cracks are an important
consideration for safety analysis (Rohit Rastogi et al., 2002). However many of the input parameters are
statistically distributed. The traditional approach of safety assessment and design lies in a deterministic model.
The probabilistic approach is obviously the best choice in practical applications when sufficient information on
the distribution of the random variables is known (Lin et al., 2004).
Probabilistic Fracture Mechanics (PFM) is a rapidly developing field with numerous applications in science
and engineering which blends fracture mechanics and probability theory (Rahman and Kim, 2001). PFM
provides a more rational way of describing the actual behavior and reliability of structures than the traditional
deterministic models (Rahman and Kim, 2001). Now-a-days many researchers are exploring applicability of the
PFM approach and few of them are listed here. Rahman (1997) developed a PFM model for analyzing
circumferential through-walled-cracked pipes subject to bending loads. New equations were developed to
represent the functions. Both analytical and simulation methods were formulated to determine the probabilistic
characteristics of J integral. Jian Ping Zhao et al. (1997) introduced a new concept of probabilistic failure
assessment diagram for defect assessment. Genki Yagawa et al. (1997) established standard PFM procedures
for evaluating failure probabilities of nuclear pressure vessel and pipes. Sensitivity analyses are performed to
278 A. Krishnaveni et al, 2015
Australian Journal of Basic and Applied Sciences, 9(2) February 2015, Pages: 277-291
quantify the effects of uncertainty of flow stress, fracture toughness, fatigue crack growth rate and Copper
content on failure probabilities.
Lei and Xiamen (1997) presented a probabilistic analysis of fatigue crack growth, fatigue life and reliability
of elastic structural components on the basis of fracture mechanics and the theory of random process. Jin Xing
(1997) developed a PFM assessment method based on the R6 procedure for the integrity of the structures. Sharif
Rahman (2001) conducted studies on probabilistic analysis based on J integral estimation model that provides
accurate estimates of failure probability and also shown that the uncertainty in the crack with a large coefficient
of variation (COV) has a significant effect on the probability of failure. Rahman and Kim (2001) developed a
probabilistic methodology for Elasto-Plastic fracture mechanics analysis of non-linear cracked structures, which
is capable of predicting accurate deterministic and probabilistic characteristics of J integral. Xhou Xun and Yu
Xiao-li (2006) made a reliability evaluation for diesel engine crank shaft based on 2D stress strength
interference model, in which multi axial loading fatigue criteria has been employed. Rohit Rastogiet al. (2002)
presented the determination of failure probabilities of a straight pipe with a through wall crack, in the
circumferential direction subjected to in plane bending moment, using the R6 method. The probability of failure
is studied by constructing Failure Assessment Diagram (FAD) using all the three options of R6 method for the
variation in the applied loads.
Tronskar et al. (2003) studied the influence on the failure probability of modified R6 FAD and the
influence of constraint correction on the combined fatigue and fracture failure probability for the vessels
subjected to wave loading. The uncertainties in various internal operating loadings and external forces,
including earthquake and wind, flaw sizes, material fracture toughness and flow stress are considered. Linet al.
(2004) proposed a probabilistic assessment methodology for in-service nuclear piping containing defects and
also developed software for failure assessment based on R6 method. Albert Bagaviev and Artur Ulbrich (2004)
outlined the theoretical background of life assessment with the help of PFM and have demonstrated its
application for typically heavy loaded components of large steam turbines. Prem Navinand
Ramachandramoorthy (2005) carried out a probabilistic study on through wall circumferentially cracked pipe,
to obtain a reliableestimate of maximum moment capacity. Also, a reduction factor has been proposed for net
section plastic collapse moment to predict the maximum moment capacity. Cristina Gentiliniet al. (2005)
presented a simple and reliable method for the probabilistic characterization of the linear elastic response of
cracked truss and frame structures with uncertain damage.
Past literatures are focused the importance of PFM in the evaluation of the reliability of cracked structures.
The failure pressure estimation of cylindrical pressure vessel having axial through crack using PFM approach is
scarcely reported by the researchers. The objective of this paper is to predict reliability based safety factor for
various cylindrical pressure vessels containing axial through crack subjected to internal pressure. PFM analysis
is carried out using the experimental literature test data from the references (Anderson and Sullivan, 1966; Peter
and Kuhn, 1957; Calfo, 1968). The uncertainty with respect to material properties viz. ultimate tensile strength
and yield strength, geometric parameters viz. thickness and diameter and the crack geometry viz. crack length
and crack depth and fracture parameter (KF) has been considered. It is observed from the literature that in most
of the PFM study, failure of the cracked structure is assessed by J1c and K1c based failure criterion (Krishnaveni
and Christopher, 2011) and R6 method. In this work, the modified two parameter fracture criterion (Christopher
et al., 2005) is used to perform the probabilistic fracture mechanics analysis. The operating pressure for various
cylindrical pressure vessels is obtained using Stress-Strength interference theory for the specified reliability.
Nomenclatures:
Symbol - Item description
2c - Crack length (mm)
a - Crack depth (mm)
c - Half the crack length (mm)
k - Level of confidence (%)
K - Stress intensity factor
L - Strength random variable (MPa)
M ,φ - Correction factor
N - Safety factor
r - Inner radius of cylinder (mm)
R - Reliability of the component (%)
S - Stress random variable (MPa)
t - Thickness of the cylinder (mm)
V - Coefficient of variation of random variable (%)
X - Random vector
y - Margin of safety
Y - Random variable
279 A. Krishnaveni et al, 2015
Australian Journal of Basic and Applied Sciences, 9(2) February 2015, Pages: 277-291
Z - Standard normal random variable
Do - Outer diameter of cylinder (mm)
E(pbf) - Expected mean value of random variable
fxi - Density function of random variable
Kmax - Stress intensity factor at failure (MPa√m)
pb - Failure pressure of unflawed cylindrical vessel (MPa)
pf - Probability of failure (%)
pbf - Failure pressure of flawed cylindrical vessel (MPa)
Var(pbf ) - Variance of random variable
VL - Coefficient of variation of predicted operating pressure (%)
VS - Coefficient of variation of predicted failure pressure (%)
Z0 - Lower limit of integral Equation(5)
σ - Standard deviation
σf - Net section failure stress (MPa)
σu - Hoop stress at the burst level of the unflawed cylindrical shell (MPa)
σult - Ultimate tensile strength (MPa)
σys - Yield strength or 0.2 % proof stress (MPa)
μ - Mean of random variable
μS - Mean of predicted failure pressure (MPa)
μL - Mean of predicted operating pressure (MPa)
Ф - Cumulative distribution function
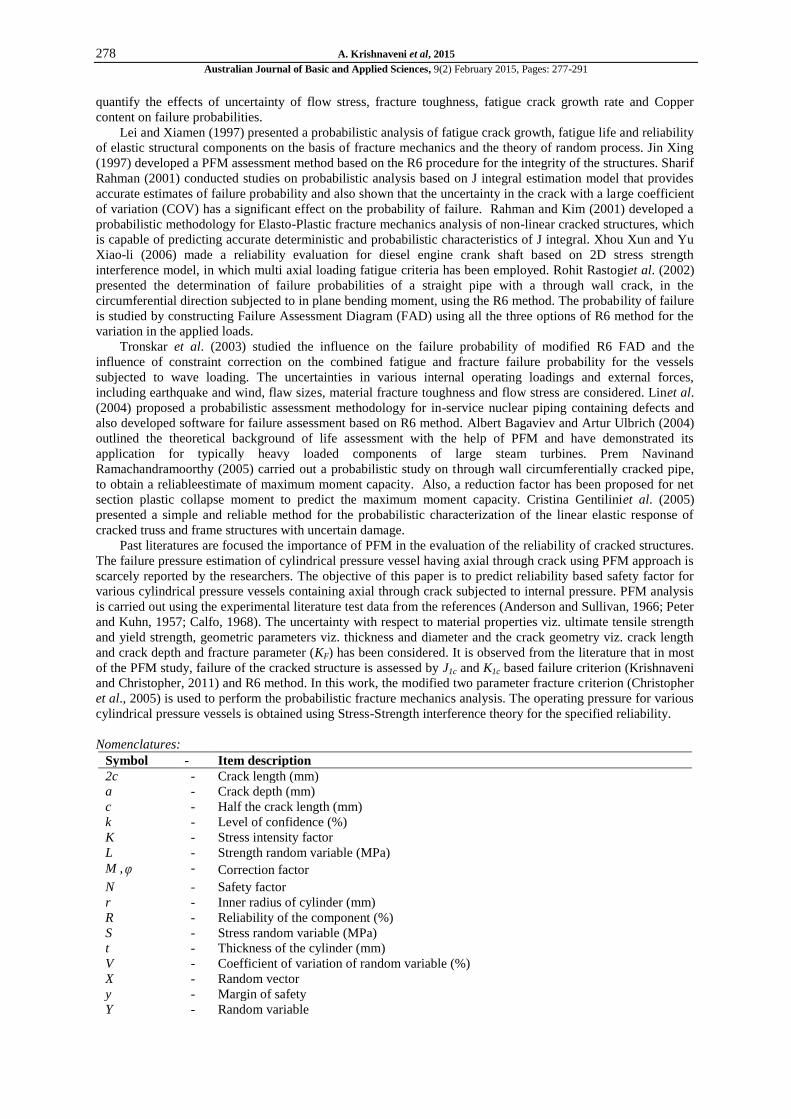
Probabilistic Failure Assessment Methodology:
In this study, a probabilistic failure assessment methodology (Krishnaveni et al., 2014) has been proposed
to compute the reliability based safety factor for the prediction of safe operating pressure of the pressure vessels
containing axial through cracks. The flow chart (See Figure 1) depicts the procedure of proposed probabilistic
failure assessment methodology. This methodology consists of three phases viz. goodness of fit test,
probabilistic fracture analysis and computation of safety and reliability.
Fig. 1: Proposed Probabilistic Failure Assessment Methodology.
Modified Two Parameter Fracture Criterion:
The significant parameters affecting the size of a critical crack in a structure are the applied stress levels,
the fracture toughness of the material, the location of the crack and its orientation. Because the stress intensity
factor (K)is a function of load, geometry and crack size. It will be more useful to have a relationship between
the stress intensity factor at failure (Kmax) and the net section failure stress (σf) from the fracture data of cracked
specimens for the estimation/prediction of the fracture strength/failure pressure to any cracked configuration.
The relationship between Kmax and σf can be of the form shown in Equation (1) See Refs. Christopher et al.
(2005a) and Potti et al. (2000) for more details.

280 A. Krishnaveni et al, 2015
Australian Journal of Basic and Applied Sciences, 9(2) February 2015, Pages: 277-291
p
uσ
fσ
m1
uσ
fσ
m1F
KmaxK (1)
where, σu is the nominal stress required to produce a fully plastic region (or hinge) on the net section. For
cylindrical pressure vessels, σu is the hoop stress at the burst pressure level of the unflawed thin cylindrical
shell. KF, mandpare the three fracture parameters to be determined from the fracture data. Figure 1 shows a
cylindrical vessel containing an axial through crack. Stress intensity factor expressions for these cracked
configurations are available based on finite element solutions (Newman, 1976; Newman and Raju, 1979). Using
the value of average net section failure stress (σf) in the stress intensity factor expression, the stress intensity
factor at failure (Kmax) for the cracked configuration can be obtained. For the cracked configurations in Figure 2,
expressions for Kmax and σf are shown in Equation (2) and Equation (3).
Fig. 2: Closed end cylindrical pressure vessel with an axial through crack under internal pressure.
φ
M1/2πa
fσmaxK
(2)
t
rbf
p
fσ
(3)
Where,
sfeMM (4)
q
t
a
1M
a
cφ
1MeM
(5)
caforc
a
1M
1.013.1 (6)
cafor
1/2
a
c
a
c0.031
1M
(7)
cafor
1.65
c
a1.4641
2φ
(8)
1.65c2
φ 1 1.464 for a ca
(9)
1
2 3 2f 1 0.52λ 1.29λ 0.074λ for 0 λ 10s s s s s (10)
t
a
Rt
csλ
(11)
t
Rb
p
uσ (12)
3
c
a82q
(13)
where M and φ are correction factors relevant to the geometry chosen, r is the radius of the cylindrical vessel, t
is the thickness, pb is the general failure or bursting pressure of an unflawed cylindrical vessel, pbfisthe failure
281 A. Krishnaveni et al, 2015
Australian Journal of Basic and Applied Sciences, 9(2) February 2015, Pages: 277-291
pressure of a cylindrical vessel with an axial surface crack. A comparative study Christopher et al. (2002) on
failure pressure estimation of unflawed cylindrical vessels indicates the validity of the Faupel’s formula for
steel vessels shown in Equation (14).
r
t1ln
ultσ
ysσ2ysσ
3
2
bp
(14)
where σys is the 0.2% proof stress or the yield stress of the material. The non-linear equation for determining the
net section failure stress (σf) for a specified crack size is obtained using Equation (1) and Equation (2) and
shown in Equation (15).
p1σ σMf f21 m m σ πa 1 0u
σ φK σu uF
(15)
Using the Newton–Raphson iterative method, the non-linear Equation (23) is solved for σfand failure
pressure of cylindrical vessel having an axial through-thickness crack is obtained from Equation (3). In this
present work, modified two parameter fracture criterion is used to predict the probabilistic failure pressure of
the cracked pressure vessel.
Statistical Parameters of Random Input Variables:
The pressure vessel containing axial through crack subjected to internal pressure as shown in Figure 2 is
considered for the study. The literature test data for the pressure vessel (Anderson and Sullivan 1966; Peter and
Kuhn 1957; Calfo, 1968) viz. ELI Titanium alloy, Aluminum alloy and AISI stainless steel cylinders as shown
in Tables (1-5) have been used to perform probabilistic fracture analysis with different materials under
cryogenic temperature. In this analysis uncertainty with respect to crack geometry, strength properties, fracture
parameter and geometric parameters are taken into account.
The failure pressure estimates values for various Cylindrical Pressure Vessels (CPV) are presented in
Tables (1-5) which are considered as mean and their coefficient of variations are taken from the literature
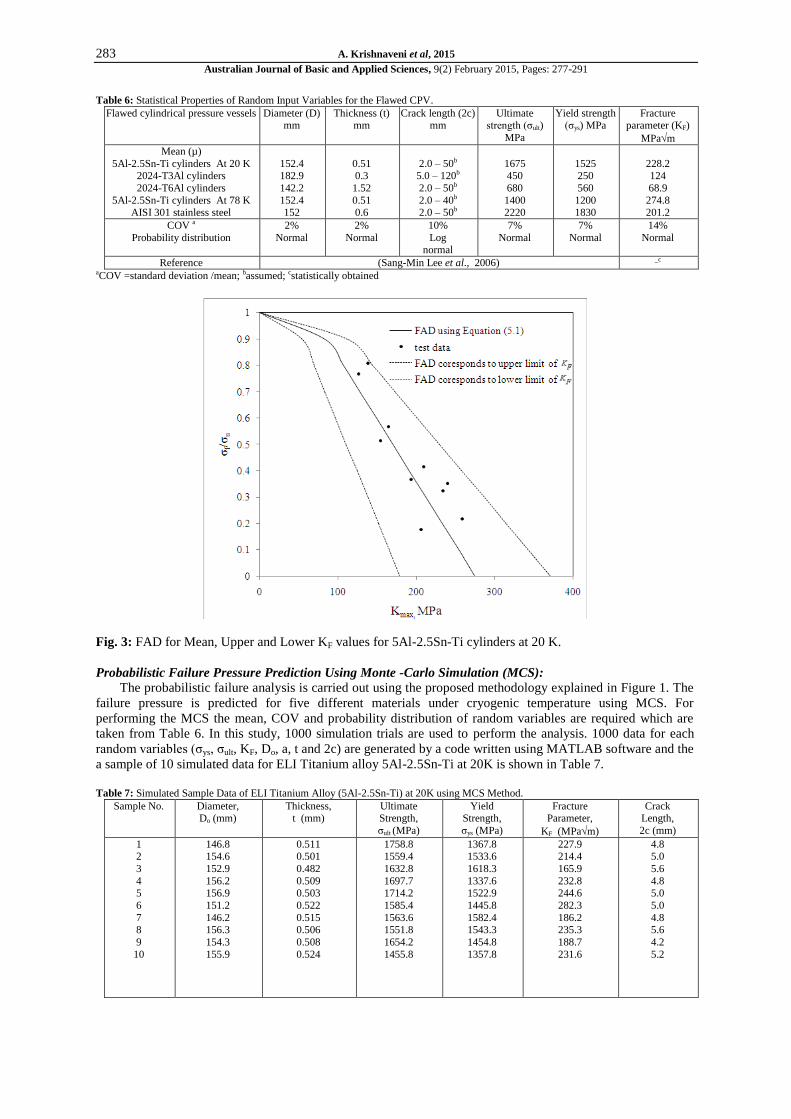
(Sang-Min Lee et al., 2006). In the fracture analysis, KF is one of the important and changeable fracture
parameters. The variation in KF is quantified by constructing FAD using Equation (1). In order to accommodate
all the literature test data, Failure Assessment Line (FAL) are constructed on either side of already drawn
FAD. The KF value available in Tables (1-5) is assumed as mean of KF. Figure 3 shows that the FAL
corresponds to mean, upper and lower KF values for 5Al-2.5Sn-Ti cylinders at 20 K along with literature test
data. The higher and lower KF values are equated to upper and lower limit of 3σ limits. The standard deviation
and COV for KF is computed and is represented in Table 6. The uncertainty (i.e. COV) in KF is obtained as
14%. The random variables are assumed to follow normal and log-normal distributions. The fracture
parameters m and q in the MTPFC (Equation (1)) are assumed to be deterministic. The statistical properties of
all random input variables are summarized in Table 6.
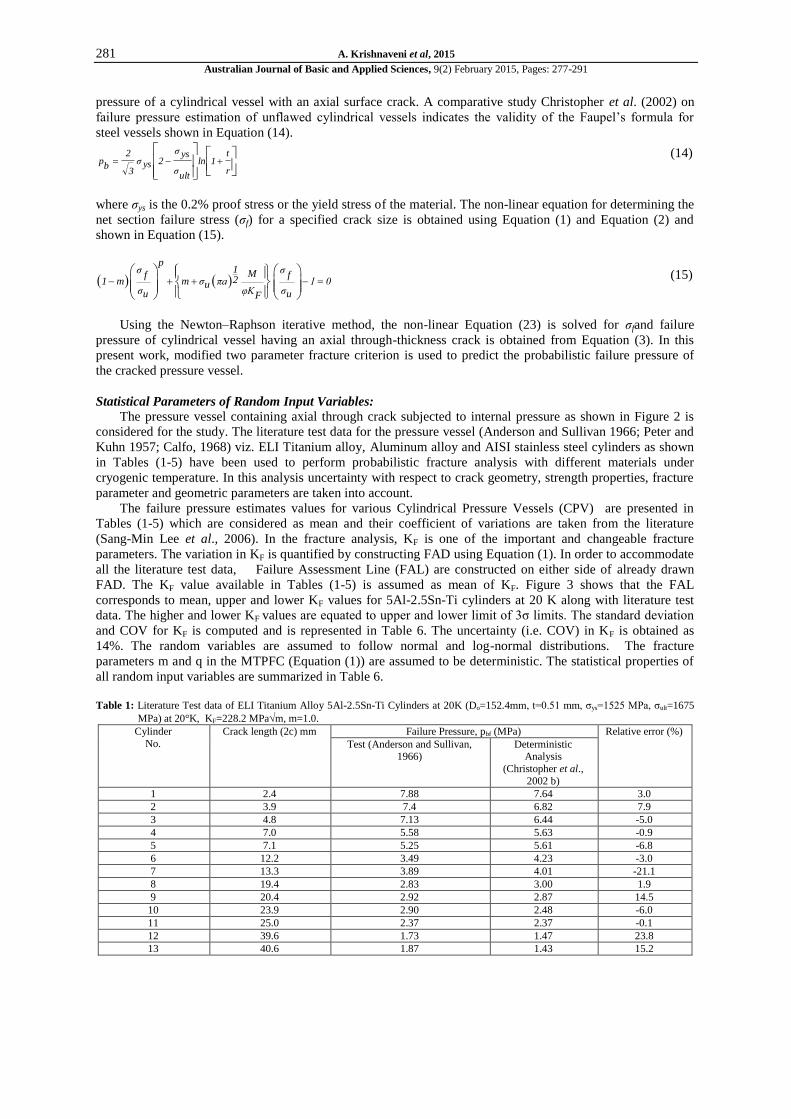
Table 1: Literature Test data of ELI Titanium Alloy 5Al-2.5Sn-Ti Cylinders at 20K (Do=152.4mm, t=0.51 mm, σys=1525 MPa, σult=1675
MPa) at 20°K, KF=228.2 MPam, m=1.0.
Cylinder
No.
Crack length (2c) mm Failure Pressure, pbf (MPa) Relative error (%)
Test (Anderson and Sullivan, 1966)
Deterministic Analysis
(Christopher et al.,
2002 b)
1 2.4 7.88 7.64 3.0
2 3.9 7.4 6.82 7.9
3 4.8 7.13 6.44 -5.0
4 7.0 5.58 5.63 -0.9
5 7.1 5.25 5.61 -6.8
6 12.2 3.49 4.23 -3.0
7 13.3 3.89 4.01 -21.1
8 19.4 2.83 3.00 1.9
9 20.4 2.92 2.87 14.5
10 23.9 2.90 2.48 -6.0
11 25.0 2.37 2.37 -0.1
12 39.6 1.73 1.47 23.8
13 40.6 1.87 1.43 15.2

282 A. Krishnaveni et al, 2015
Australian Journal of Basic and Applied Sciences, 9(2) February 2015, Pages: 277-291
Table 2: Literature Test data of Aluminium Alloy 2024-T3Al Cylinders (Do=182.9 mm, σys=250 MPa, σult=450 MPa) t=0.30 mm (KF=124
MPam, m=1.0).
Cylinder No. Crack length (2c) mm
Failure Pressure, pbf (MPa) Relative error (%)
Test (Peter and Kuhn, 1957) Deterministic Analysis
(Christopher et al., 2002
b)
1 6.1 0.92 1.010 -10.0
2 6.1 0.95 1.010 -6.5
3 12.7 0.70 0.763 -9.0
4 12.7 0.61 0.763 -25.1
5 24.4 0.46 0.488 -7.1
6 24.4 0.47 0.488 -3.8
7 24.4 0.48 0.488 -1.6
8 47.5 0.25 0.258 -3.2
9 97.0 0.11 0.126 -14.8
10 24.9 0.53 0.479 9.5
11 50.3 0.29 0.243 16.2
12 102.1 0.13 0.121 6.9
13 24.4 0.52 0.488 6.2
14 48.5 0.23 0.252 -9.8
15 97.3 0.12 0.126 -5.0
Table 3: Literature Test Data of Aluminium Alloy 2024-T6Al Cylinders (Do = 142.2 mm, σys = 560 MPa, σult = 680 MPa, t= 1.52 mm; at
20K (KF = 68.9 MPam, m = 0.601, p = 20.4).
Cylinder No. Crack length (2c)
mm
Failure Pressure, pbf (MPa) Relative error (%)
Literature test (Anderson and Sullivan,
1966)
Deterministic
Analysis (Christopher et al.,
2002 b)
1 2.6 12.15 11.72 3.6
2 6.4 9.37 8.65 7.7
3 12.7 5.85 6.02 -2.9
4 19.1 4.73 4.48 5.3
5 25.4 3.10 3.48 -12.1
6 31.8 2.93 2.79 4.9
7 44.5 1.95 1.93 1.0
8 50.8 1.76 1.65 7.1
Table 4: Literature Test Data of ELI Titanium Alloy 5Al-2.5Sn-Ti Cylinders at 78K (Do= 52.4 mm, t=0.51 mm, σys=1200 MPa, σult=1400
MPa) at 78 K: KF=274.8 MPam, m=0.763,p=29.5.
Cylinder No. Crack length (2c) mm Failure Pressure, pbf (MPa) Relative
error (%) Literature test (Anderson and
Sullivan, 1966)
Deterministic Analysis
(Christopher et al., 2002
b)
1 3.2 8.75 8.11 7.3
2 6.1 7.58 6.80 10.3
3 5.8 7.20 6.92 3.9
4 11.2 5.31 5.18 2.5
5 11.5 4.83 5.09 -5.4
6 18.6 3.90 3.63 6.8
7 19.4 3.43 3.51 -2.3
8 24.0 3.30 2.91 12.0
9 25.2 3.04 2.78 8.5
10 37.6 2.03 1.85 9.1
11 37.1 1.65 1.87 -13.5
Table 5: Literature Test Data of AISI 301 Stainless Steel cylinders, 152 mm Diameter Tanks (σys=1830 MPa, σult=2220 MPa, t=0.6
mm)(Non-stress relieved) at 20 K: KF=201.2 MPam, m=0.614, p=20.9.
Cylinder No. Crack length (2c) mm Failure Pressure, pbf (MPa) Relative Error (%) Test (Calfo, 1968) Deterministic Analysis
(Christopher et al., 2002 b)
1 4.3 10.32 9.95 3.6
2 4.8 9.79 9.52 2.8
3 10.6 6.33 6.06 4.3
4 10.8 6.52 6.35 2.6
5 17.9 3.90 4.02 -3.0
6 24.4 3.03 2.89 4.7
7 37.5 1.97 1.80 8.5
8 37.6 1.65 1.80 -9.4
283 A. Krishnaveni et al, 2015
Australian Journal of Basic and Applied Sciences, 9(2) February 2015, Pages: 277-291
Table 6: Statistical Properties of Random Input Variables for the Flawed CPV.
Flawed cylindrical pressure vessels
Diameter (D)
mm
Thickness (t)
mm
Crack length (2c)
mm
Ultimate
strength (σult)
MPa
Yield strength
(σys) MPa
Fracture
parameter (KF)
MPam
Mean (µ)
5Al-2.5Sn-Ti cylinders At 20 K 2024-T3Al cylinders
2024-T6Al cylinders
5Al-2.5Sn-Ti cylinders At 78 K AISI 301 stainless steel
152.4 182.9
142.2
152.4 152
0.51 0.3
1.52
0.51 0.6
2.0 – 50b 5.0 – 120b
2.0 – 50b
2.0 – 40b 2.0 – 50b
1675 450
680
1400 2220
1525 250
560
1200 1830
228.2 124
68.9
274.8 201.2
COV a
Probability distribution
2%
Normal
2%
Normal
10%
Log normal
7%
Normal
7%
Normal
14%
Normal
Reference (Sang-Min Lee et al., 2006) _c aCOV =standard deviation /mean; bassumed; cstatistically obtained
Fig. 3: FAD for Mean, Upper and Lower KF values for 5Al-2.5Sn-Ti cylinders at 20 K.
Probabilistic Failure Pressure Prediction Using Monte -Carlo Simulation (MCS):
The probabilistic failure analysis is carried out using the proposed methodology explained in Figure 1. The
failure pressure is predicted for five different materials under cryogenic temperature using MCS. For
performing the MCS the mean, COV and probability distribution of random variables are required which are
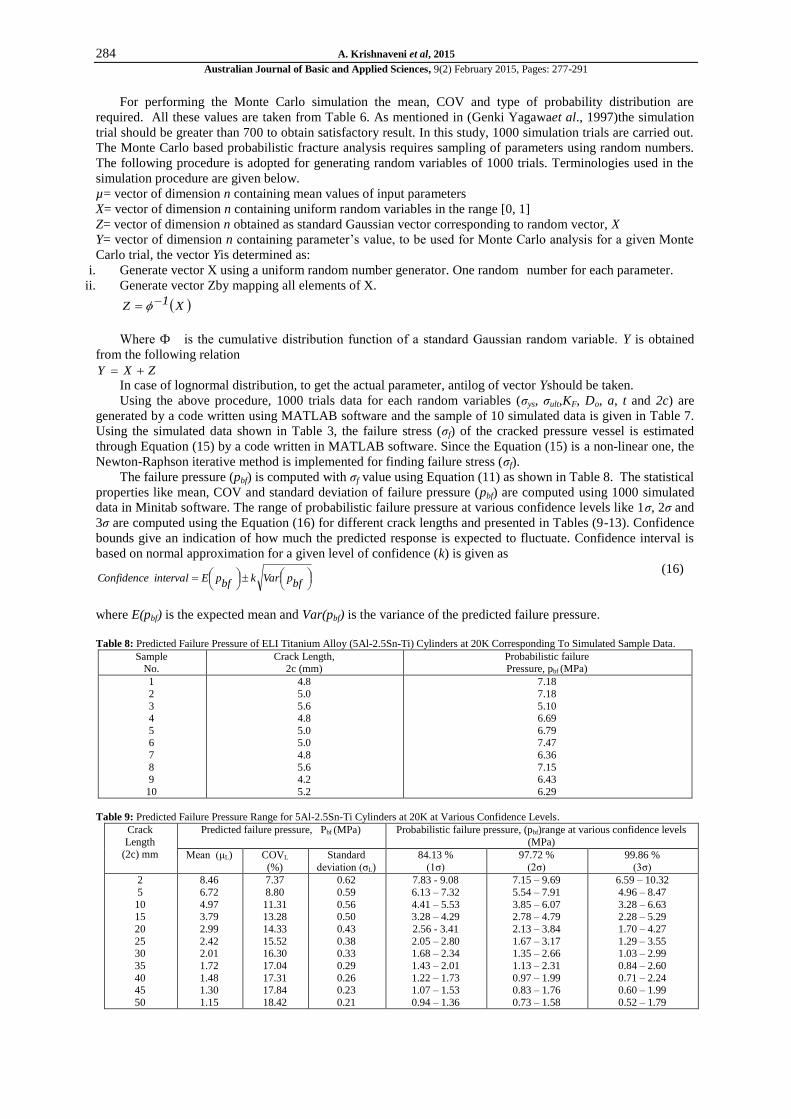
taken from Table 6. In this study, 1000 simulation trials are used to perform the analysis. 1000 data for each
random variables (σys, σult, KF, Do, a, t and 2c) are generated by a code written using MATLAB software and the
a sample of 10 simulated data for ELI Titanium alloy 5Al-2.5Sn-Ti at 20K is shown in Table 7.
Table 7: Simulated Sample Data of ELI Titanium Alloy (5Al-2.5Sn-Ti) at 20K using MCS Method.
Sample No. Diameter, Do (mm)
Thickness, t (mm)
Ultimate Strength,
σult (MPa)
Yield Strength,
σys (MPa)
Fracture Parameter,
KF (MPam)
Crack Length,
2c (mm)
1 2
3
4 5
6
7 8
9
10
146.8 154.6
152.9
156.2 156.9
151.2
146.2 156.3
154.3
155.9
0.511 0.501
0.482
0.509 0.503
0.522
0.515 0.506
0.508
0.524
1758.8 1559.4
1632.8
1697.7 1714.2
1585.4
1563.6 1551.8
1654.2
1455.8
1367.8 1533.6
1618.3
1337.6 1522.9
1445.8
1582.4 1543.3
1454.8
1357.8
227.9 214.4
165.9
232.8 244.6
282.3
186.2 235.3
188.7
231.6
4.8 5.0
5.6
4.8 5.0
5.0
4.8 5.6
4.2
5.2
284 A. Krishnaveni et al, 2015
Australian Journal of Basic and Applied Sciences, 9(2) February 2015, Pages: 277-291
For performing the Monte Carlo simulation the mean, COV and type of probability distribution are
required. All these values are taken from Table 6. As mentioned in (Genki Yagawaet al., 1997)the simulation
trial should be greater than 700 to obtain satisfactory result. In this study, 1000 simulation trials are carried out.
The Monte Carlo based probabilistic fracture analysis requires sampling of parameters using random numbers.
The following procedure is adopted for generating random variables of 1000 trials. Terminologies used in the
simulation procedure are given below.
µ= vector of dimension n containing mean values of input parameters
X= vector of dimension n containing uniform random variables in the range [0, 1]
Z= vector of dimension n obtained as standard Gaussian vector corresponding to random vector, X
Y= vector of dimension n containing parameter’s value, to be used for Monte Carlo analysis for a given Monte
Carlo trial, the vector Yis determined as:
i. Generate vector X using a uniform random number generator. One random number for each parameter.
ii. Generate vector Zby mapping all elements of X.
X1Z
Where Ф is the cumulative distribution function of a standard Gaussian random variable. Y is obtained
from the following relation
ZXY In case of lognormal distribution, to get the actual parameter, antilog of vector Yshould be taken.
Using the above procedure, 1000 trials data for each random variables (σys, σult,KF, Do, a, t and 2c) are
generated by a code written using MATLAB software and the sample of 10 simulated data is given in Table 7.
Using the simulated data shown in Table 3, the failure stress (σf) of the cracked pressure vessel is estimated
through Equation (15) by a code written in MATLAB software. Since the Equation (15) is a non-linear one, the
Newton-Raphson iterative method is implemented for finding failure stress (σf).
The failure pressure (pbf) is computed with σf value using Equation (11) as shown in Table 8. The statistical
properties like mean, COV and standard deviation of failure pressure (pbf) are computed using 1000 simulated
data in Minitab software. The range of probabilistic failure pressure at various confidence levels like 1σ, 2σ and
3σ are computed using the Equation (16) for different crack lengths and presented in Tables (9-13). Confidence
bounds give an indication of how much the predicted response is expected to fluctuate. Confidence interval is
based on normal approximation for a given level of confidence (k) is given as
(16)
where E(pbf) is the expected mean and Var(pbf) is the variance of the predicted failure pressure.
Table 8: Predicted Failure Pressure of ELI Titanium Alloy (5Al-2.5Sn-Ti) Cylinders at 20K Corresponding To Simulated Sample Data.
Sample No.
Crack Length, 2c (mm)
Probabilistic failure Pressure, pbf (MPa)
1
2
3 4
5 6
7
8 9
10
4.8
5.0
5.6 4.8
5.0 5.0
4.8
5.6 4.2
5.2
7.18
7.18
5.10 6.69
6.79 7.47
6.36
7.15 6.43
6.29
Table 9: Predicted Failure Pressure Range for 5Al-2.5Sn-Ti Cylinders at 20K at Various Confidence Levels.
Crack
Length
(2c) mm
Predicted failure pressure, Pbf (MPa) Probabilistic failure pressure, (pbf)range at various confidence levels
(MPa)
Mean (μL) COVL
(%)
Standard
deviation (σL)
84.13 %
(1σ)
97.72 %
(2σ)
99.86 %
(3σ)
2
5
10 15
20
25 30
35
40 45
50
8.46
6.72
4.97 3.79
2.99
2.42 2.01
1.72
1.48 1.30
1.15
7.37
8.80
11.31 13.28
14.33
15.52 16.30
17.04
17.31 17.84
18.42
0.62
0.59
0.56 0.50
0.43
0.38 0.33
0.29
0.26 0.23
0.21
7.83 - 9.08
6.13 – 7.32
4.41 – 5.53 3.28 – 4.29
2.56 - 3.41
2.05 – 2.80 1.68 – 2.34
1.43 – 2.01
1.22 – 1.73 1.07 – 1.53
0.94 – 1.36
7.15 – 9.69
5.54 – 7.91
3.85 – 6.07 2.78 – 4.79
2.13 – 3.84
1.67 – 3.17 1.35 – 2.66
1.13 – 2.31
0.97 – 1.99 0.83 – 1.76
0.73 – 1.58
6.59 – 10.32
4.96 – 8.47
3.28 – 6.63 2.28 – 5.29
1.70 – 4.27
1.29 – 3.55 1.03 – 2.99
0.84 – 2.60
0.71 – 2.24 0.60 – 1.99
0.52 – 1.79
bfpVark
bfpEintervalConfidence

285 A. Krishnaveni et al, 2015
Australian Journal of Basic and Applied Sciences, 9(2) February 2015, Pages: 277-291
Table 10: Predicted Failure Pressure Range for2024-T3Al Cylinders at Various Confidence Levels.
Crack
Length
(2c) mm
Predicted failure pressure, Pbf (MPa) Probabilistic failure pressure (pbf)range at various confidence levels
(MPa)
Mean (μ) COV
(%)
Standard
deviation (σ)
84.13 %
(1σ)
97.72 %
(2σ)
99.86 %
(3σ)
5 10
15
20 30
40
50 60
70
80 90
100
110 120
0.91 0.81
0.66
0.54 0.39
0.3
0.24 0.20
0.17
0.15 0.14
0.12
0.113 0.107
6.5 8.2
10.0
11.9 14
15.4
16.1 16.7
16.3
16.1 15.7
15.6
16.1 17.0
0.06 0.067
0.06
0.065 0.056
0.046
0.039 0.036
0.026
0.023 0.02
0.019
0.02 0.019
0.85-0.97 0.74-0.88
0.59-0.73
0.48-0.61 0.34-0.45
0.26-0.35
0.22-0.28 0.16-0.23
0.14-0.19
0.12-0.17 0.12-0.16
0.10-0.13
0.09-0.13 0.08-0.12
0.79- 1.03 0.68-0.94
0.53-0.79
0.42-0.68 0.29-0.51
0.21-0.40
0.16-0.32 0.12-0.27
0.11-0.22
0.10-0.19 0.10-0.18
0.08-0.15
0.07-0.15 0.06-0.14
0.73- 1.09 0.61-1.01
0.48-0.86
0.35-0.74 0.23-0.56
0.16-0.44
0.12-0.36 0.09-0.31
0.09-0.24
0.08-0.21 0.08-0.20
0.06-0.17
0.05-0.17 0.05-0.16
Table 11: Predicted Probabilistic Failure Pressure Range for 2024-T6Al Cylinders at Various Confidence Levels.
Crack
Length
(2c) mm
Predicted failure pressure, Pbf (MPa) Probabilistic failure pressure (pbf)range at various
confidence levels (MPa)
Mean (μ) COV
(%)
Standard
deviation (σ)
84.13 %
(1σ)
97.72 %
(2σ)
99.86 %
(3σ)
2 5
10
15 20
25
30 35
40
45 50
11.81 9.100
6.750
5.290 4.280
3.530
2.972 2.547
2.200
1.940 1.720
7.80 9.85
11.90
13.30 14.20
15.50
15.80 17.00
16.80
17.20 17.60
0.920 0.890
0.800
0.700 0.600
0.549
0.469 0.430
0.367
0.330 0.304
10.90-12.73 8.21-9.99
5.95-7.55
4.59-5.90 3.67-4.89
2.98-4.08
2.52-3.42 2.11-2.97
1.83-2.57
1.60-2.27 1.42-2.02
9.90-13.7 7.32-10.8
5.14-8.36
3.88-6.70 3.07-5. 50
2.43-4.63
2.03-3.91 1.68-3.41
1.46-2.94
1.27-2.61 1.11-2.33
9.05-14.6 6.43-11.7
4.34-9.16
3.18-7.40 2.43-6.11
1.82-5.18
1.56-4.38 1.25-3.84
1.11-3.31
0.92-2.94 0.81-2.63
Table 12: Predicted Probabilistic Failure Pressure Range for 2024-T3Al Cylinders at Various Confidence Levels.
Crack Length
(2c) mm
Predicted failure pressure, Pbf (MPa) Probabilistic failure pressure (pbf)range at various confidence levels (MPa)
Mean (μ) COV
(%)
Standard
deviation (σ)
84.13 %
(1σ)
97.72 %
(2σ)
99.86 %
(3σ)
2 5
10
15 20
25
30 35
40
9.35 7.64
5.72
4.41 3.5
2.86
2.38 2.04
1.76
6.5 8.2
10.7
12.7 14.46
14.92
16.44 16.62
17.91
0.612 0.628
0.61
0.56 0.50
0.43
0.38 0.33
0.32
8.73-9.96 7.01-8.277
5.11-6.33
3.85-4.97 3.01-4.02
2.42-3.27
2.00-2.71 1.70-2.37
1.46-2.05
8.12-10.57 6.38-8.90
4.49-6.95
3.29-5.53 2.50-4.53
1.99-3.74
1.62-3.15 1.35-2.71
1.62-2.35
7.5-11.18 5.76-9.53
3.88-7.56
2.73-6.09 2.00-5.09
1.57-4.18
1.23-3.53 1.03-3.04
0.86-2.70
Table 13: Predicted Probabilistic Failure Pressure Range for AISI 301 Stainless Steel Cylinders at Various Confidence Levels.
Crack
Length (2c) mm
Predicted failure pressure, Pbf (MPa) Probabilistic failure pressure (pbf)range at various confidence levels
(MPa)
Mean (μ) COV (%)
Standard deviation (σ)
84.13 % (1σ)
97.72 % (2σ)
99.86 % (3σ)
2
5 10
15
20
25
30
35 40
45
50
14.4
10.3 6.90
4.97
3.79
3.03
2.43
2.05 1.75
1.50
1.34
8.9
11.3 13.6
16.0
16.27
16.85
17.6
18.0 18.4
18.7
18.6
1.28
1.16 0.93
0.79
0.61
0.52
0.42
0.37 0.32
0.28
0.24
13.14-15.68
9.14-11.41 5.96-7.84
4.17-5.77
3.17-4.41
2.51-3.54
2.00-2.86
1.68-2.42 1.42-2.07
1.22-1.78
1.09-1.59
11.86-16.96
7.97-12.64 5.04-8.78
3.39-6.57
2.56-5.03
2.00-4.05
1.57-3.29
1.30-2.79 1.10-2.39
0.94-2.06
0.86-1.84
10.58-18.2
6.82-13.7 4.09-9.72
2.57-7.37
1.96-5.64
1.49-4.56
1.17-3.72
0.93-3.16 0.78-2.71
0.65-2.34
0.62-2.06
Computation of Safety Factor and Reliability:
Stress - Strength Interference Theory:
The reliability of existing structure or design of new structure or system with certain desired reliability can
be determined using stress strength interference theory. With this knowledge, it is possible to increase the
286 A. Krishnaveni et al, 2015
Australian Journal of Basic and Applied Sciences, 9(2) February 2015, Pages: 277-291
control on the safety factors that have an important effect on the product quality, and relax over stringent
control on other factors that are not critical to the product quality (Zhou Xun and Yu Xiao-li, 2006). The
computation of the reliability of the component requires the knowledge of the random nature of strength (S) and
the stress (L). If the probability density function of S and L are known then, the reliability of the component can
be evaluated by constructing integral equations as shown in Equation (17). In certain cases, S and L follow
normal, lognormal, exponential or Weibull distributions, and the integral equations can be reduced to simple
form. Otherwise the reliability of the component can be found only by evaluating the integral numerically. The
reliability (R) of a component is given by
0LSPLSPR (17)
dLdsLS,
S.Lf
The probability of failure (Pf) can be expressed as shown in Equation (18) LSPR
fP 11
(18)
If S and L are random variables, the safety margin y is also a random variable and given as in Equation (19). LSy (19)
then the reliability of the component is represented as in Equation (20)
0ypR (20)
When strength and stress have normal density functions, y is also normally distributed and the reliability
(R) is represented17 in the Equation (21).
dz
2
Lσ
2
Sσ
Lμ
Sμ
2
2zexp
2π
1R
(21)
where z is the standard normal random variable, µS is the mean value of the strength, µL is the mean value of the
stress, and σS and σL represents the standard deviations of strength and stress, respectively. The negative sign
portion of the lower limit of the integral in Equation (21) is denoted by Z0. Therefore
2
Lσ
2
Sσ
Lμ
Sμ
0Z
(22)
The factor of safety N is defined as
Lμ
SμN
and the coefficients of variation of the strength and stress is
denoted by VS and VL respectively, then
Sμ
Sσ
SV and
Lμ
Lσ
LV
The Equation (22) is rewritten in terms of safety factor (Kapur and Lamberson, 1977) N as presented in
Equation (23) and Equation (24).in terms of N, VS and VL
2
Lμ
Lσ
2
Lμ
Sσ
1N
0Z
(23)
(24)
In this section, a safety factor is computed using stress-strength interference theory by considering the
experimental failure pressure as strength (S) variable and the predicted failure pressures as stress (L) variable. If
the S and L are independent, then the interference area between the PDF of S and L gives a measure of the
probability of failure (Rao 1996). The mean and standard deviation of strength and stress random variables are
taken from the Tables (9-13) which is obtained from probabilistic failure analysis.
Safety Factor Computation:
For instance, the pressure vessel made of 5Al-2.5Sn-Ti alloy at 20K containing an axial through crack of
length 2c=3.9 mm is considered for safety factor computation. The mean and standard deviation of stress and
strength variables are taken from Table 14. The safety factor is computed using Equation (24) for the specified
reliability. Similarly, the safety factor is computed for other materials and is shown in Table 15.
2
LV
2N
2
SV
1N
0Z
287 A. Krishnaveni et al, 2015
Australian Journal of Basic and Applied Sciences, 9(2) February 2015, Pages: 277-291
Operating Pressure Computation:
The safe operating pressure of the vessel is determined using Equation (25) as given below.
Operating pressure σop = µL/N (25)
where µL is the predicted failure pressure mean and N is safety factor for the specified reliability. The operating
pressure is computed for five different cylindrical pressure vessels and is summarized in Table 15.
Table 14: Predicted Safety Factor for Flawed Pressure Vessels Containing Axial Crack.
Material
Crack length (2c) mm
Failure Pressure, Pbf (MPa)
Test Predicted
Mean
(μS)
Standard
deviation (Lin
et al 2004) (σS)
Mean
(μL)
Standard
deviation (σL)
5Al-2.5Sn-Ti at 20K 3.9 7.40 0.740 7.305 0.602
2024-T3Al 6.1 0.92 0.092 0.913 0.067
2024-T6Al 2.6 12.15 1.215 11.379 1.046
5Al-2.5Sn-Ti at 78K 3.2 8.75 0.875 8.625 0.626
AISI 301 stainless steel 4.3 10.32 1.032 10.992 1.221
Table 15: Predicted Safety Factor and Operating Pressure of Cylinders at a Particular Crack Length for the Specified Reliability.
Cylinders Crack
length (2c) mm
Safety factor (N) Operating pressure (MPa)
90% 95% 99% 99.99% 90% 95% 99% 99.99%
5Al-2.5Sn-Ti at 20K 2.4 1.185 1.246 1.372 1.704 6.17 5.86 5.32 4.29
2024-T3Al 7.1 1.177 1.236 1.359 1.681 0.78 0.74 0.67 0.54
2024-T6Al 2.6 1.188 1.250 1.379 1.714 9.58 9.10 8.25 6.64
5Al-2.5Sn-Ti at 78K 3.2 1.177 1.236 1.363 1.681 7.33 6.98 6.33 5.13
AISI 301 stainless steel 4.3 1.211 1.271 1.419 1.781 9.08 8.65 7.75 6.17
RESULTS AND DISCUSSION
In this chapter, the PFM analysis is carried out for the pressure vessels containing crack and the following
observations made during the analysis are summarized below.
i. In this study, the failure pressure of the cylindrical pressure vessel having axial through crack is predicted
using probabilistic fracture mechanics approach. With the use of statistical properties of predicted failure
pressure, the probabilistic failure pressure range has been determined and is presented in Tables (9-13).
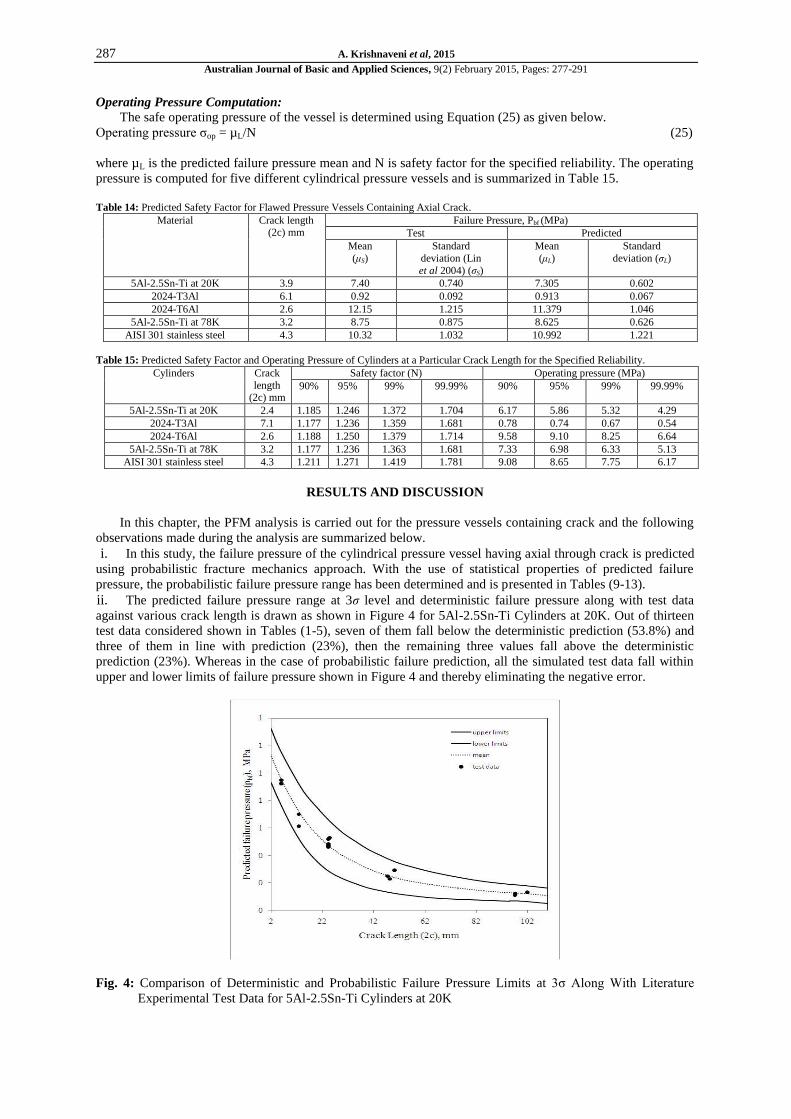
ii. The predicted failure pressure range at 3σ level and deterministic failure pressure along with test data
against various crack length is drawn as shown in Figure 4 for 5Al-2.5Sn-Ti Cylinders at 20K. Out of thirteen
test data considered shown in Tables (1-5), seven of them fall below the deterministic prediction (53.8%) and
three of them in line with prediction (23%), then the remaining three values fall above the deterministic
prediction (23%). Whereas in the case of probabilistic failure prediction, all the simulated test data fall within
upper and lower limits of failure pressure shown in Figure 4 and thereby eliminating the negative error.
Fig. 4: Comparison of Deterministic and Probabilistic Failure Pressure Limits at 3σ Along With Literature
Experimental Test Data for 5Al-2.5Sn-Ti Cylinders at 20K
288 A. Krishnaveni et al, 2015
Australian Journal of Basic and Applied Sciences, 9(2) February 2015, Pages: 277-291
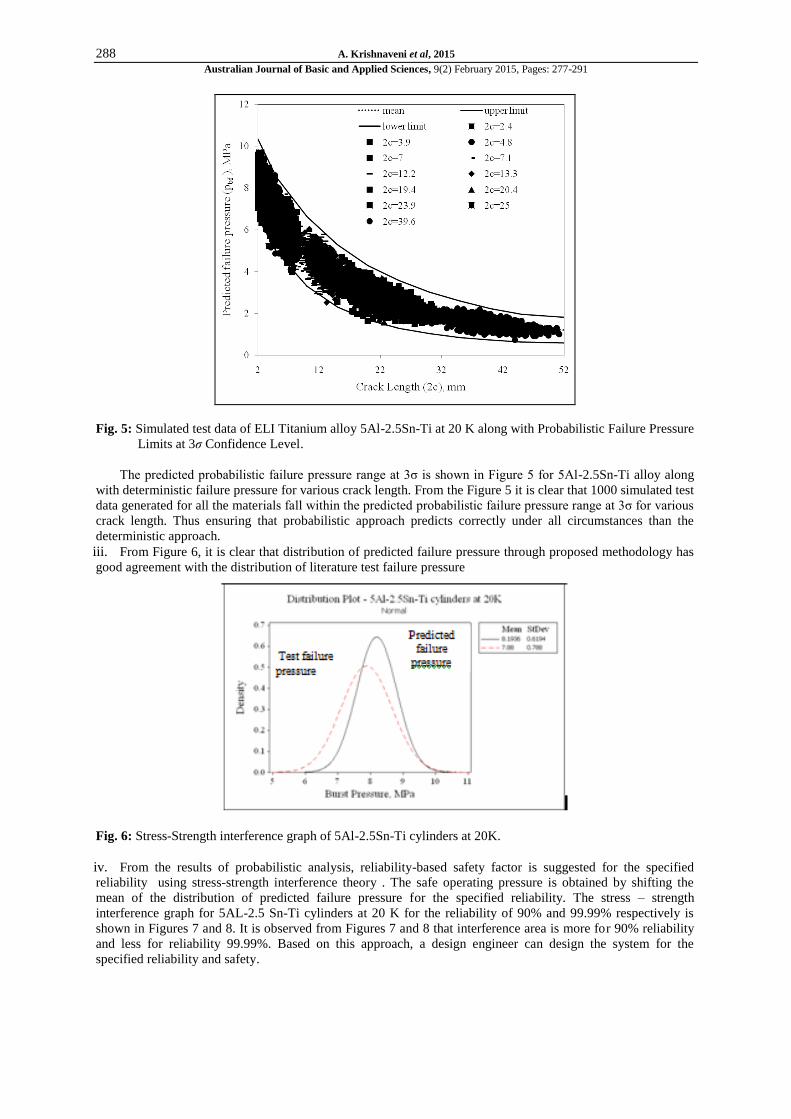
Fig. 5: Simulated test data of ELI Titanium alloy 5Al-2.5Sn-Ti at 20 K along with Probabilistic Failure Pressure
Limits at 3σ Confidence Level.
The predicted probabilistic failure pressure range at 3σ is shown in Figure 5 for 5Al-2.5Sn-Ti alloy along
with deterministic failure pressure for various crack length. From the Figure 5 it is clear that 1000 simulated test
data generated for all the materials fall within the predicted probabilistic failure pressure range at 3σ for various
crack length. Thus ensuring that probabilistic approach predicts correctly under all circumstances than the
deterministic approach.
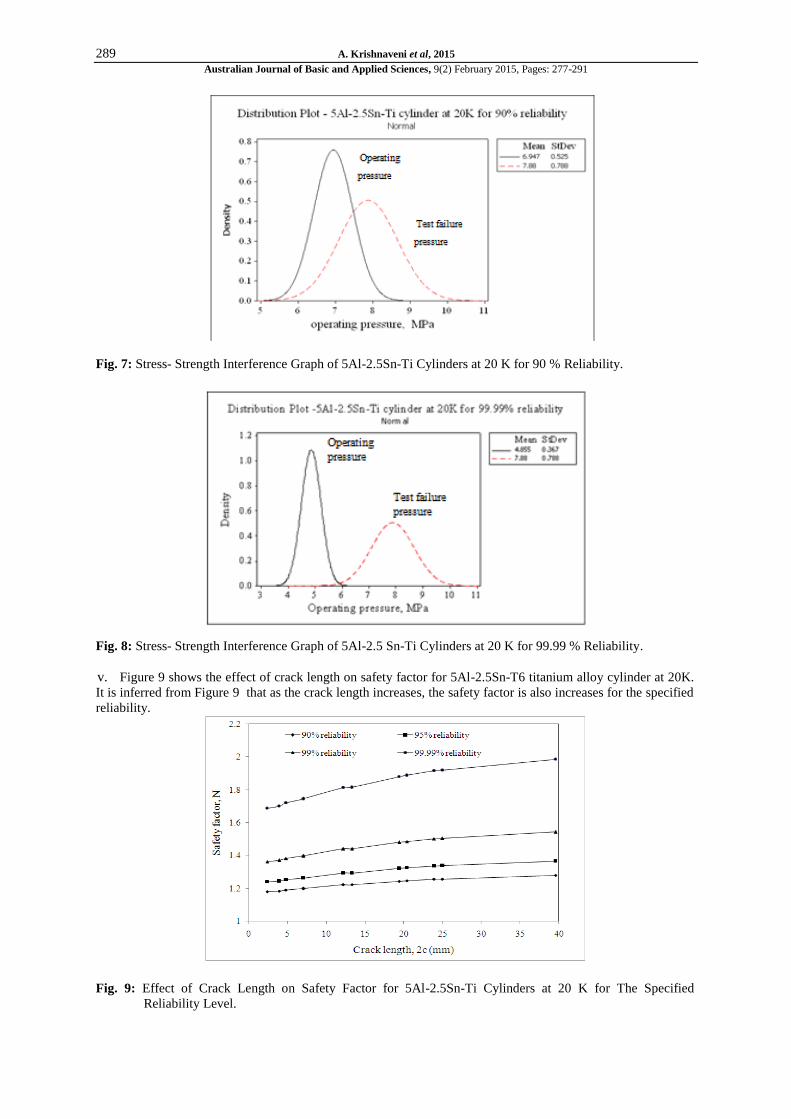
iii. From Figure 6, it is clear that distribution of predicted failure pressure through proposed methodology has
good agreement with the distribution of literature test failure pressure
Fig. 6: Stress-Strength interference graph of 5Al-2.5Sn-Ti cylinders at 20K.
iv. From the results of probabilistic analysis, reliability-based safety factor is suggested for the specified
reliability using stress-strength interference theory . The safe operating pressure is obtained by shifting the
mean of the distribution of predicted failure pressure for the specified reliability. The stress – strength
interference graph for 5AL-2.5 Sn-Ti cylinders at 20 K for the reliability of 90% and 99.99% respectively is
shown in Figures 7 and 8. It is observed from Figures 7 and 8 that interference area is more for 90% reliability
and less for reliability 99.99%. Based on this approach, a design engineer can design the system for the
specified reliability and safety.
289 A. Krishnaveni et al, 2015
Australian Journal of Basic and Applied Sciences, 9(2) February 2015, Pages: 277-291
Fig. 7: Stress- Strength Interference Graph of 5Al-2.5Sn-Ti Cylinders at 20 K for 90 % Reliability.
Fig. 8: Stress- Strength Interference Graph of 5Al-2.5 Sn-Ti Cylinders at 20 K for 99.99 % Reliability.
v. Figure 9 shows the effect of crack length on safety factor for 5Al-2.5Sn-T6 titanium alloy cylinder at 20K.
It is inferred from Figure 9 that as the crack length increases, the safety factor is also increases for the specified
reliability.
Fig. 9: Effect of Crack Length on Safety Factor for 5Al-2.5Sn-Ti Cylinders at 20 K for The Specified
Reliability Level.

290 A. Krishnaveni et al, 2015
Australian Journal of Basic and Applied Sciences, 9(2) February 2015, Pages: 277-291
Conclusion:
In this study, PFM analysis of pressure vessels containing axial through crack under cryogenic
temperatures is performed using the proposed probabilistic failure assessment methodology. The Monte Carlo
simulation technique is adopted for performing probabilistic fracture analysis using MATLAB software. As a
result, reliability-based operating pressure is suggested for five different cylinders having axial through crack
subjected to internal pressure. The proposed work will help the design engineer to decide the operating pressure
of the cracked structure for the specified safety and reliability. In future, this procedure can be extended to the
pressure vessel containing circumferential through crack, combination of axial and circumferential and pressure
vessels made of composite materials.
REFERENCES
Albert Bagaviev and Artur Ulbrich, 2004. Life assessment of turbine components based on deterministic
and probabilistic procedures. International Journal of Pressure Vessels & Piping, 81: 855-859.
Anderson, R.B. and T.L. Sullivan, 1966. Fracture Mechanics of through-cracked cylindrical Pressure
Vessels. NASA -TND -3252.
Calfo, F.D., 1968. Effect of residual stress on fracture strength of AISI 301 stainless steel and Ti-5Al-2.5Sn
ELI titanium cracked thin wall cylinders, NASA-TND-4777.
Christopher, T., B.S.V. Rama, P.K. Sarma, Govindan Potti, B. Nageswara Rao and K.
Sankaranarayanasamy, 2002. A comparative study on failure pressure estimates of unflawed cylindrical vessels.
Internatinal Journal Pressure Vessels & Piping, 79: 53-66.
Christopher, T., B.S.V. Rama Sarma, P.K. Govindan Potti, B. Nageswara Rao and K.
Sankaranarayanasamy, 2002a. A comparative study on failure pressure estimates of unflawed cylindrical
vessels. International Journal Pressure Vessel & Piping, 79: 53-66.
Christopher, T., K. Sankaranarayanasamy and B. Nageswar Rao, Correlating cryogenic fracture strength
using a modified two parameter method. International Journal of Fracture Mechanics, 72: 475-490.
Christopher, T., K. Sankaranarayanasamy and B. Nageswara Rao, 2002. Fracture strength of flawed
cylindrical pressure vessels under cryogenic temperatures, International Journal of Cryogenics, 42: 661-673.
Christopher, T., K. Sankaranarayanasamy and B.N. Rao, 2004. Fracture behaviour of maraging steel tensile
specimens and pressurized cylindrical vessels. International Journal of Fatigue Fracture Engineering Materials
Structure, 27: 177-186.
Christopher, T., K. Sankaranarayanasamy and B. Nageswar Rao, 2002b. Fracture strength of flawed
cylindrical pressure vessels under cryogenic temperatures. International Journal, cryogenics, 42: 661- 673.
Christopher, T., K. Sankaranarayanasamy and B. Nageswar Rao, 2003. Fracture behaviour of Maraging
steel tensile specimens and pressurized cylindrical vessels. Fatigue fracture engineering materials and
structures, 26: 1-10.
Cristina Gentilini, Francesco Ubertini and Erasmo Viola, 2005. Probabilistic analysis of linear elastic
cracked structures with uncertain damage. International Journal of Probabilistic Engineering Mechanics, 20:
307-323.
Genki Yagawa, S., N. Yoshimura, Soneda and M. Hirano, 1997. A study on probabilistic fracture analyses
of nuclear pressure vessels and piping. International Journal of Pressure Vessels & Piping, 174: 91-100.
Jian-Ping Zhao, Wen-Long Huang and Shu-Ho Dai, 1997. A new concept: probabilistic failure assessment
diagram. International Journal of Pressure Vessels & Piping, 71: 165-168.
Jin Xing and Q.P. Zhong, 1997. A probabilistic fracture mechanics assessment method based on the R6
procedure. International Journal of Pressure Vessels & Piping, 73: 161-163.
Kapur, K.C. and L.R. Lamberson, 1997. Reliability in Engineering Design. John Wiley & Sons Inc. New
York.
Krishnaveni, A. and T. Christopher, 2011. Probabilistic Fracture Strength Prediction of Surface Cracked
Tensile Specimens using a Modified Two Parameter Fracture Criterion. European Journal of Scientific
Research, 62(3): 368-379.
Krishnaveni, A., T. Christopher, K. Jeyakumar and D. Jebakani, 2014. Probabilistic Failure Prediction of
High Strength Steel Rocket Motor Cases. Journal of Failure analysis and Prevention, 14(2): 123-264.
Lei, Y. and Xiamen, 1997. A stochastic approach to fatigue crack growth in elastic structural components
under random loading. Acta Mechanica, 132: 63-74.
Lin, Y.C., Y.J. Xie and X.H. Wang, 2004. Probabilistic fracture failure analysis of nuclear piping
containing defects using R6 method. International Journal of Nuclear Engineering Design, 229: 237-246.
Newman, J.C. and I.S. Raju, 1979. Analysis of surface cracks under tension or bending loads. NASA TP:
1578.
Newman, J.C., 1976. Fracture analysis of surface and through cracks in cylindrical pressure vessels.
NASA-TND :8325.
291 A. Krishnaveni et al, 2015
Australian Journal of Basic and Applied Sciences, 9(2) February 2015, Pages: 277-291
Peter, R.W. and P. Kuhn, 1957. Bursting strength of unstiffened pressure cylinders with slits. NACA-TN-
3993.
Potti, P.K.G., B.N. Rao and V.K. Srivastava, 2000. Residual strength of Aluminium–Lithium alloy center
surface crack tension specimens at cryogenic temperatures. International Journal of Cryogenics, 40: 789-795.
Prem Navin, D. and D.S. Ramachandramoorthy, 2005. Probabilistic study of fracture strength of through
wall cracked pipes. Journal of IE. (I), 86: 24-28.
Rahman, S. and J.S. Kim, 2001. Probabilistic fracture mechanics for non linear structures. International
Journal of Pressure Vessels & Piping, 78: 261-269.
Rahman, S., 1997. Probabilistic fracture analysis of cracked pipes with circumferential flaws. International
Journal of Pressure Vessels & Piping, 70: 223-236.
Rao, S.S., 1996. Engineering Optimization. 3rd Edition, New Age International publisher, New Delhi.
Rohit Rastogi, Vivek Bhasin, K.K. Vaze and H.S. Kushwaha, 2002. Probabilistic fracture analysis of a
straight pipe with through-wall circumferential crack using R6 method. International Journal of Nuclear
Engineering Design, 212: 109-114.
Sang-Min Lee, Yoon-Suk Chang, Jae-Boong Choi and Young-Jin Kim, 2006. Failure probability
assessment of wall-thinned nuclear pipes using probabilistic fracture mechanics. International Journal of
Nuclear Engineering Design, 236: 350-358.
Sang-Min Lee, Yoon-Suk Chang, Jae-Voong Choi and Young-Jin Kim, 2006. Failure probability
assessment of wall-thinned nuclear pipes using probabilistic fracture mechanics. Nuclear Engineering and
Design, 236: 350-358.
Sharif Rahman, 2001. Probabilistic fracture mechanics: J-estimation and finite element methods.
International Journal of Fracture Mechanics, 68: 107-25.
Tronskar, J.P., M.A. Mannan, M.O. Lai, G. Sigurdsson and K.O. Halsen, 2003. Crack tip constraint
correction applied to probabilistic fracture mechanics analyses of floating production storage and off-loading
vessels. International Journal of Engineering Fracture Mechanics, 70: 1115-1146.
Zhou Xun and Yu Xiao-li, 2006. Reliability analysis of diesel engine crank shaft based on 2D stress
strength interference model. Journal of Zhejiang University of Science A, 7(3): 391-397.


![Australian Bushcraft [Australian Army education service] c1948](https://static.fdocuments.net/doc/165x107/553cd9be550346a43f8b4b6f/australian-bushcraft-australian-army-education-service-c1948.jpg)