Asymmetric Fluid Flow and Particle Entrapment in the...
26
ANNUAL REPORT 2006 Meeting date: June 15, 2006 Sana Mahmood (M.S. Student) & Brian G. Thomas Department of Mechanical & Industrial Engineering University of Illinois at Urbana-Champaign Asymmetric Fluid Flow and Particle Entrapment in the Nozzle and Mold University of Illinois at Urbana-Champaign • Metals Processing Simulation Lab • Sana Mahmood 2 Acknowledgements • Continuous Casting Consortium Members at University of Illinois at Urbana-Champaign • Fluent, Inc. • Jun Aoki, Bret Rietow, Claudio Ojeda, Liefeng Zang, Quan Yuan, Gogi Lee
Transcript of Asymmetric Fluid Flow and Particle Entrapment in the...

ANNUAL REPORT 2006Meeting date: June 15, 2006
Sana Mahmood (M.S. Student) &Brian G. Thomas
Department of Mechanical & Industrial EngineeringUniversity of Illinois at Urbana-Champaign
Asymmetric Fluid Flow and Particle
Entrapment in the Nozzle and Mold
University of Illinois at Urbana-Champaign • Metals Processing Simulation Lab • Sana Mahmood2
Acknowledgements
• Continuous Casting Consortium Members at University of Illinois at Urbana-Champaign
• Fluent, Inc.
• Jun Aoki, Bret Rietow, Claudio Ojeda, Liefeng Zang, Quan Yuan, Gogi Lee

University of Illinois at Urbana-Champaign • Metals Processing Simulation Lab • Sana Mahmood3
Outline• Part 1: Flow Asymmetries
– Background and Importance
– Objectives
– Validation
– Results (Asymmetries encountered due to various reasons)
– Conclusions and Future Work
• Part 2: Flow in Mold (with shell) and Particle Entrapment in Nozzle and Mold
– Background and Importance
– Objectives
– Results
• Mold flow validation
• Particle Entrapment Model
• Particle Transport and Entrapment in Mold simulation
– Conclusions and Future Work
University of Illinois at Urbana-Champaign • Metals Processing Simulation Lab • Sana Mahmood4

University of Illinois at Urbana-Champaign • Metals Processing Simulation Lab • Sana Mahmood5
Objectives Part 1
• Validate model with LES time averaged results for nozzle
• Investigate various causes of asymmetric fluid flow in a tundish nozzle, including:
– Asymmetric flow entering the nozzle from tundish
– Asymmetric flow due to the presence of slide gate
– Asymmetric flow cased by various types of nozzle clogs
• Introduce Asymmetric flow in the mold with no shell
)( ε−k
University of Illinois at Urbana-Champaign • Metals Processing Simulation Lab • Sana Mahmood6
Model Formulation (validation)
X
Z
Y
SEN
Well Nozzle
Stopper rod
Tundish Region
d=70
d=220
35
98
290
104
d=30
789
All dimensions are in mm
7.98 x 10⁻⁷Fluid Kinematic Viscosity (m2/s)
25.4 Casting Speed (mm/s)
127 SEN Submergence Depth (mm)
32 Bottom nozzle Port Diameter (mm)
75 x 32 (inner bore) Nozzle Port Height x Thickness (mm x mm)
ValueParameter / Property
Inlet Velocity = 0.0312m/s (symmetric velocity)
Angle at side port = 15deg
Pressure at outlet = constant

University of Illinois at Urbana-Champaign • Metals Processing Simulation Lab • Sana Mahmood7
Validation Nozzle
10.90.80.70.60.50.40.30.20.10
Velocity Magnitude (m/s)
0.0940.092Back Flow Zone Fraction
33.0833.76Angle with the X-axis (deg)
0.6750.68Average Velocity (Jet speed) (m/s)
Right Port outlet
Left Port outlet
Front View Side View
University of Illinois at Urbana-Champaign • Metals Processing Simulation Lab • Sana Mahmood8
Validation Nozzle
X (m)
Z(m
)
-0.1 -0.05 0 0.05 0.1
0
0.05
0.1
0.15
0.2
0.25
10.80.60.40.20
(Scale : 1.0m/s)
(Vx2 + Vz
2)1/2 (m/s)
Velocity Along center line of side ports (m/s)
Dis
tan
cefr
omn
ozzl
eb
ott
om(m
)
-0.1 0 0.1 0.2 0.3 0.4 0.5 0.6 0.70
0.01
0.02
0.03
0.04
0.05
0.06
0.07
0.08
0.09
0.1
Vx, Right PortVx, Left PortVz, Right PortVz, Left Port
Velocity along the center line of side ports (m/s)
Dis
tan
cefr
om
no
zzle
bo
tto
m(m
)
-0.3 -0.2 -0.1 0 0.1 0.2 0.3 0.4 0.5 0.6 0.7 0.8 0.90
0.01
0.02
0.03
0.04
0.05
0.06
0.07
0.08
0.09
0.1
Vx, Right PortVx, Left PortVz, Right PortVz, Left Port
Back Flow Zones
)( ε−k
)( ε−k
LES [ Quan Yuan, 2004]
LES [Quan Yuan, 2004 ]

University of Illinois at Urbana-Champaign • Metals Processing Simulation Lab • Sana Mahmood9
Asymmetry Caused by Flow in Tundish
A
A
Section AA
XY
Z279.8
279.8
D=115
D=80
1283
Well Length = 160
124
R=11
Nozzle port height x thickness (mm X mm) =110 X 22SEN nozzle angle at side port = 45 deg
All dimensions are in mm
0.3m/s 0.2m/s
Asymmetric velocity at the inlet of tundish region modeled
University of Illinois at Urbana-Champaign • Metals Processing Simulation Lab • Sana Mahmood10
2 m/s
3.532.521.510.50
Velocity Magnitude (m/s)
0.3m/s 0.2m/s
Why shift towards the left ?
Flow goes around the cylindrical portion of the stopper rod and more enters from the right side
Front View Side View
Asymmetry Caused Near Stopper Rod

University of Illinois at Urbana-Champaign • Metals Processing Simulation Lab • Sana Mahmood11
5 m/s
Velocity (Vx2 + Vz
2)1/2 (m/s)D
ista
nce
fro
mp
ort
bott
om
(mm
)0 1 2 3
0
10
20
30
40
50
60
70
80
90
100
110
Right outlet center lineLeft outlet center line
13.313.3Back Flow Zone Fraction
30.6931.15Angle with the X-axis (deg)
2.552.56Average Velocity (Jet speed) (m/s)
Right Port outlet
Left Port outlet
Velocity at Nozzle Bottom
Conclusion:
Asymmetric flow across tundish bottom does not appear to cause significant time-average flow asymmetry
University of Illinois at Urbana-Champaign • Metals Processing Simulation Lab • Sana Mahmood12
Asymmetry Caused by Slide Gate
35mm
75mm
Y
Z
Slide Gate
X
Z
Y
AA
Slide Gate
Nozzle port height x thickness (mm X mm) =98 X 70SEN nozzle angle at side port = 35 deg
Inlet Velocity = 0.014m/s (symmetric velocity)
Mass Flow Rate = 61.6kg/s
Section A-A
All dimensions are in mm
D=400
D=260
D=141.5
400
109.5
279.8
D=72

University of Illinois at Urbana-Champaign • Metals Processing Simulation Lab • Sana Mahmood13
43.532.521.510.50
Velocity Magnitude (m/s)
1 m/s
Left Port Right Port
Front View Side View
-Y -Y
Asymmetry Caused by Slide Gate
11.1kg/s 19.7kg/s 19.7kg/s 11.1kg/s
Asymmetry within each port
University of Illinois at Urbana-Champaign • Metals Processing Simulation Lab • Sana Mahmood14
Cut Section of Nozzle Bottom
to see Clog Shapes
2.2
1.0 2.0 0.6
1.0
0.9
2.1
2.2
1.5
2.9 2.7
1.1
2.3
2.7
2.1
2.8
Direction 2
Direction 1
SEN outlet port
Top view
after
cutting
direction 1
Top view after
cutting direction 2
All dimensions on pictures are in cm
1.41.3
2.8 2.8 2.12.9
Cut sections measured for 3 nozzles by Gogi Lee, 2005

University of Illinois at Urbana-Champaign • Metals Processing Simulation Lab • Sana Mahmood15
Asymmetry Due to Clogging
43.532.521.510.50
Velocity Magnitude (m/s)
61.6Kg/s 30.8Kg/s 30.8Kg/s 30.8Kg/s 30.8Kg/s
Un-clogged Clog 1 Clog 2 (a) Clog 2 (b) Clog 3
50% 50% 45% 55%55% 45%53% 47% 53% 47%
University of Illinois at Urbana-Champaign • Metals Processing Simulation Lab • Sana Mahmood16
Velocity Magnitude on centerline of Left and Right outlet ports for two different clog shapes
(Vx2 + Vz
2)1/2 (m/s)
Dis
tan
cefr
om
the
port
bott
om
(mm
)
0.5 1 1.5 2 2.50
10
20
30
40
50
60
70
80
90
Left outlet center lineRight outlet center line
(Vx2 + Vz
2)1/2 (m/s)
Dis
tan
cefr
om
the
po
rtb
ott
om
(mm
)
0.5 1 1.5 2 2.50
10
20
30
40
50
60
70
80
90
Left outlet center lineRight outlet center line
Clog 1 Clog 3
Velocity Magnitude at Ports

University of Illinois at Urbana-Champaign • Metals Processing Simulation Lab • Sana Mahmood17
Asymmetry in Mold (no shell)X (m)
Dis
tan
ceb
elo
wm
enis
cus,
Z(m
)-0.6 -0.4 -0.2 0 0.2 0.4 0.6
0
0.2
0.4
0.6
0.8
1
1.2
1.4
1.6
1.8
2
2.2
2.4
1 m/s
Velocity from the outlet of Clog shape 1 was placed as the inlet velocity at mold
inletMold Dimensions = 1300mmx230mmCasting Speed = 0.87m/min
Enlarged View of the Top section of moldVelocity vectors in plane mid way between wide faces
Increased Velocity at the right side
University of Illinois at Urbana-Champaign • Metals Processing Simulation Lab • Sana Mahmood18
Surface Velocity
0.5 m/s
X (m)
Vel
oci
tyM
agn
itud
e(m
/s)
-0.7 -0.6 -0.5 -0.4 -0.3 -0.2 -0.1 0 0.1 0.2 0.3 0.4 0.5 0.6 0.70
0.02
0.04
0.06
0.08
0.1
0.12
0.14
0.16
0.18
0.2
0.22
30.8Kg/s
See generation of vortexes on the left side of the mold
Note: asymmetric flow from a clogged bore causes 2X velocity across top surface

University of Illinois at Urbana-Champaign • Metals Processing Simulation Lab • Sana Mahmood19
Conclusions (Part 1)
• The averaged flow results from LES agree reasonably with resultsfrom k-ℇ model
• Although asymmetry in the tundish does not cause asymmetry at the outlet ports, it increases the likelihood of asymmetric clogging near the nozzle top
• The asymmetry due to the 90deg slide gate orientation causes high swirling within each port, and encourages asymmetric flow at outlet towards the opposite mold wide face
• Clogging of the bore (clog 1) reduces port utilization significantly • Asymmetry between left and right ports increases with increasing
severity of clogging of the well region (Clog 3)• Clogging causes severe asymmetry across the top surface of the
mold (2X velocity difference between sides)
University of Illinois at Urbana-Champaign • Metals Processing Simulation Lab • Sana Mahmood20
Part 2: Particle Entrapment in Nozzle and Mold
• Particle transport and entrapment are an important phenomenon during continuous casting of steel affecting the steel quality
• Entrapped inclusions cause defects such as internal cracks and blisters in the final product
• The inclusions are carried by the steel jets entering the mold and can either be removed by the top liquid slag layer or can be trapped by the solidifying dendrite arms
• Behavior of transport of particles within the mold depends highly on their size and density
• Entrapment of particle depends on the forces present upon it when close to the dendrite arms

University of Illinois at Urbana-Champaign • Metals Processing Simulation Lab • Sana Mahmood21
Objectives Part 2
• Validate flow in the mold (with shell) obtained from model with LES time averaged results
• See where inclusions are trapped inside the nozzle to cause clogging
• See how varying casting parameters can affect particle capture based on the entrapment model developed
• See how particle trajectories are affected with variation in particle size and density
• Add capture criterion at the boundary of the mold as boundary condition in the simulation
)( ε−k
University of Illinois at Urbana-Champaign • Metals Processing Simulation Lab • Sana Mahmood22
Mold Flow Validation
984m m 132m mF ree -S lip Bounary
C asting S peed:2 5 .4 m m /s
zy
x
S hell Boundaries
Je t
2400m m
934m m 80m m
P ressure B.C . a t Bottom
Liquid-pool
7.98 × 10⁻⁷Fluid Kinematic Viscosity (m2/s)
25.4Casting Speed (mm/s)
127SEN Submergence Depth (mm)
32Bottom nozzle Port Diameter (mm)
75 × 32 (inner bore)Nozzle Port Height × Thickness (mm × mm)
2400Domain Length (mm)
132 (top)79.48 (domain bottom)
Domain Thickness (mm)
984 (top)934.04 (domain bottom)
Domain Width (mm)
132Mold Thickness (mm)
984Mold Width (mm)
Case 2-SParameter/Property
• Negative Source terms added to mass and momentum equations in Fluent (by writing user defined functions) to model fluid extraction due to solidification down the mold
[ Quan Yuan, 2004]

University of Illinois at Urbana-Champaign • Metals Processing Simulation Lab • Sana Mahmood23
Velocity vectors in plane mid way b/w wide faces (Mold Validation)
X (m)
Z(m
)
0 0.1 0.2 0.3 0.4 0.50
0.1
0.2
0.3
0.4
0.5
0.6
0.7
0.8
0.9
1
1.1
1.2
1 m/s
-0.4 -0.3 -0.2 -0.1 0 0.1 0.2 0.3 0.40
0.1
0.2
0.3
0.4
0.5
0.6
0.7
0.8
0.9
1
1.1
1.2
(m)
(m) 1m/s:
Time averaged velocity vectors obtained for full mold (LES) [Quan Yuan, 2004 ]
)( ε−kVelocity vectors obtained for half mold
University of Illinois at Urbana-Champaign • Metals Processing Simulation Lab • Sana Mahmood24
Velocity down the mold on a line 293mm from the center (validation)
Speed (Vx2+Vz2)1/2 (m/s)
Dis
tance
Bel
owth
eto
psu
rfac
e,z
(m)
0 0.1 0.2 0.3 0.4 0.5 0.6
0
0.1
0.2
0.3
0.4
0.5
0.6
0.7
0.8
0.9
1
1.1
Time averaged fluid speed, (vx2+vz
2)1/2 (m/s)
Dis
tan
ceb
elo
wth
eto
psu
rfac
e,z
(m)
0 0.1 0.2 0.3 0.4 0.5 0.6
0
0.1
0.2
0.3
0.4
0.5
0.6
0.7
0.8
0.9
1
1.1
Left half in full-mold LES (0.7M cells, no SGS)Right half in full-mold LES (0.7M cells, no SGS)Left half in full-mold LES (0.7M cells, SGS-k)Right half in full-mold LES (0.7M cells, SGS-k)Left half in full-mold LES (0.4M cells, SGS-k)Right half in full-mold LES (0.4M cells, SGS-k)Half-mold LES (1.4M cells, no SGS)
293mm
LES [Quan Yuan, 2004 ] )( ε−k
University of Illinois at Urbana-Champaign • Metals Processing Simulation Lab • Sana Mahmood25
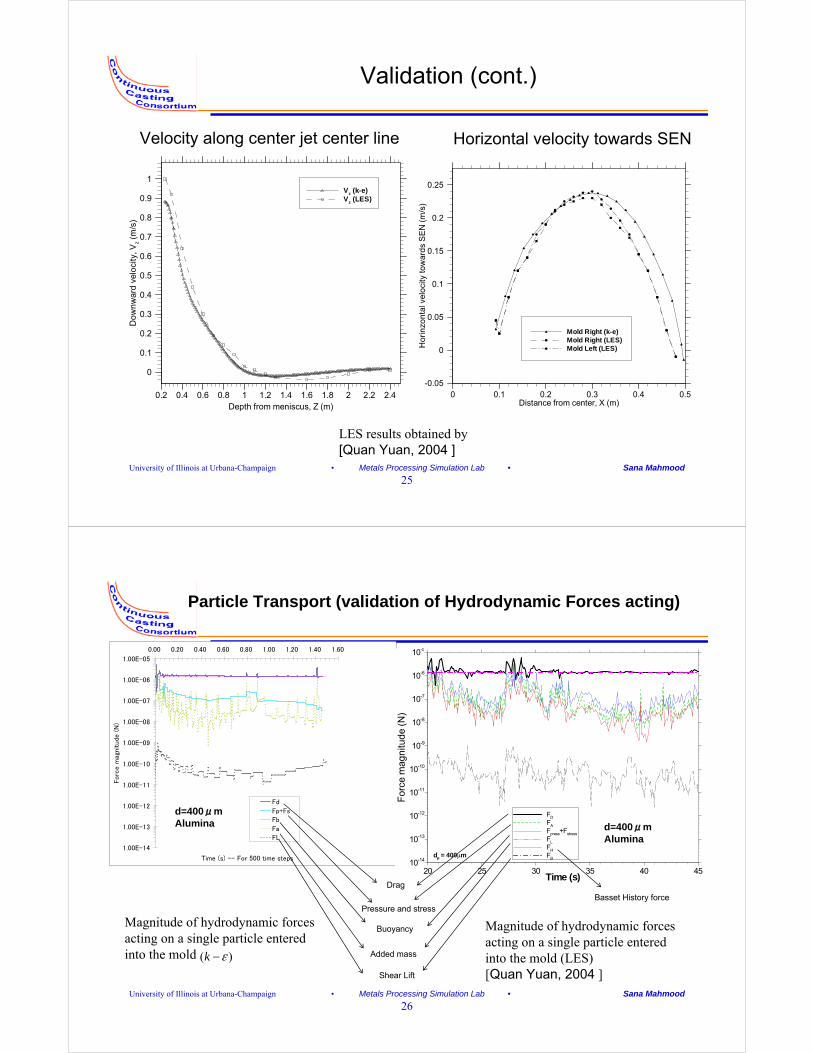
Validation (cont.)
Depth from meniscus, Z (m)
Do
wn
war
dve
loci
ty,V
z(m
/s)
0.2 0.4 0.6 0.8 1 1.2 1.4 1.6 1.8 2 2.2 2.4
0
0.1
0.2
0.3
0.4
0.5
0.6
0.7
0.8
0.9
1Vz (k-e)Vz (LES)
Distance from center, X (m)
Ho
rin
zon
talv
elo
city
tow
ard
sS
EN
(m/s
)
0 0.1 0.2 0.3 0.4 0.5-0.05
0
0.05
0.1
0.15
0.2
0.25
Mold Right (k-e)Mold Right (LES)Mold Left (LES)
Velocity along center jet center line Horizontal velocity towards SEN
LES results obtained by [Quan Yuan, 2004 ]
University of Illinois at Urbana-Champaign • Metals Processing Simulation Lab • Sana Mahmood26
Particle Transport (validation of Hydrodynamic Forces acting)
1.00E-14
1.00E-13
1.00E-12
1.00E-11
1.00E-10
1.00E-09
1.00E-08
1.00E-07
1.00E-06
1.00E-05
0.00 0.20 0.40 0.60 0.80 1.00 1.20 1.40 1.60
Time (s) -- For 500 time steps
Forc
e m
agnitude
(N
)
Fd
Fp+FsFb
FaFL
Time (s)
Fo
rce
mag
nitu
de
(N)
20 25 30 35 40 4510-14
10-13
10-12
10-11
10-10
10-9
10-8
10-7
10-6
10-5
FD
FA
Fpress+Fstress
FL
FH
FBdp = 400μm
Drag
Pressure and stress
Buoyancy
Added mass
Shear Lift
Basset History force
Magnitude of hydrodynamic forces acting on a single particle entered into the mold
Magnitude of hydrodynamic forces acting on a single particle entered into the mold (LES) [Quan Yuan, 2004 ]
)( ε−k
d=400μm Alumina d=400μm
Alumina
University of Illinois at Urbana-Champaign • Metals Processing Simulation Lab • Sana Mahmood27
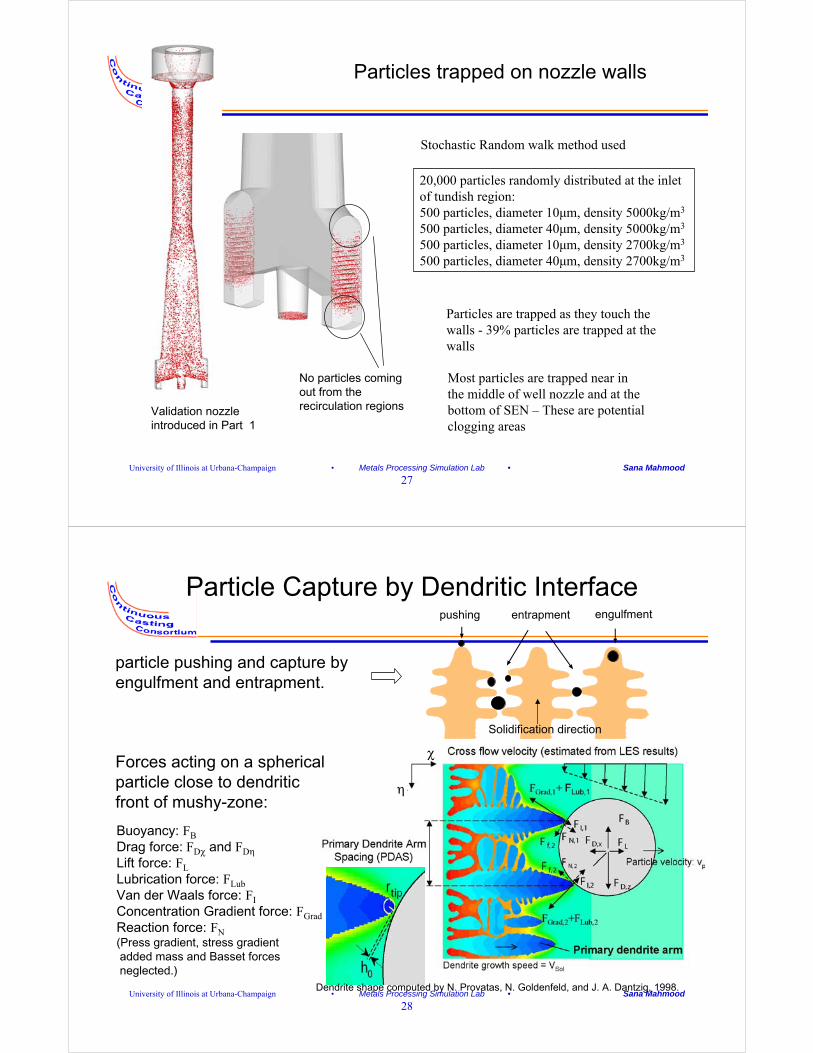
Particles trapped on nozzle walls
No particles coming out from the recirculation regions
20,000 particles randomly distributed at the inlet of tundish region: 500 particles, diameter 10μm, density 5000kg/m3
500 particles, diameter 40μm, density 5000kg/m3
500 particles, diameter 10μm, density 2700kg/m3
500 particles, diameter 40μm, density 2700kg/m3
Most particles are trapped near in the middle of well nozzle and at the bottom of SEN – These are potential clogging areas
Validation nozzle introduced in Part 1
Particles are trapped as they touch the walls - 39% particles are trapped at the walls
Stochastic Random walk method used
University of Illinois at Urbana-Champaign • Metals Processing Simulation Lab • Sana Mahmood28
pushing entrapment engulfment
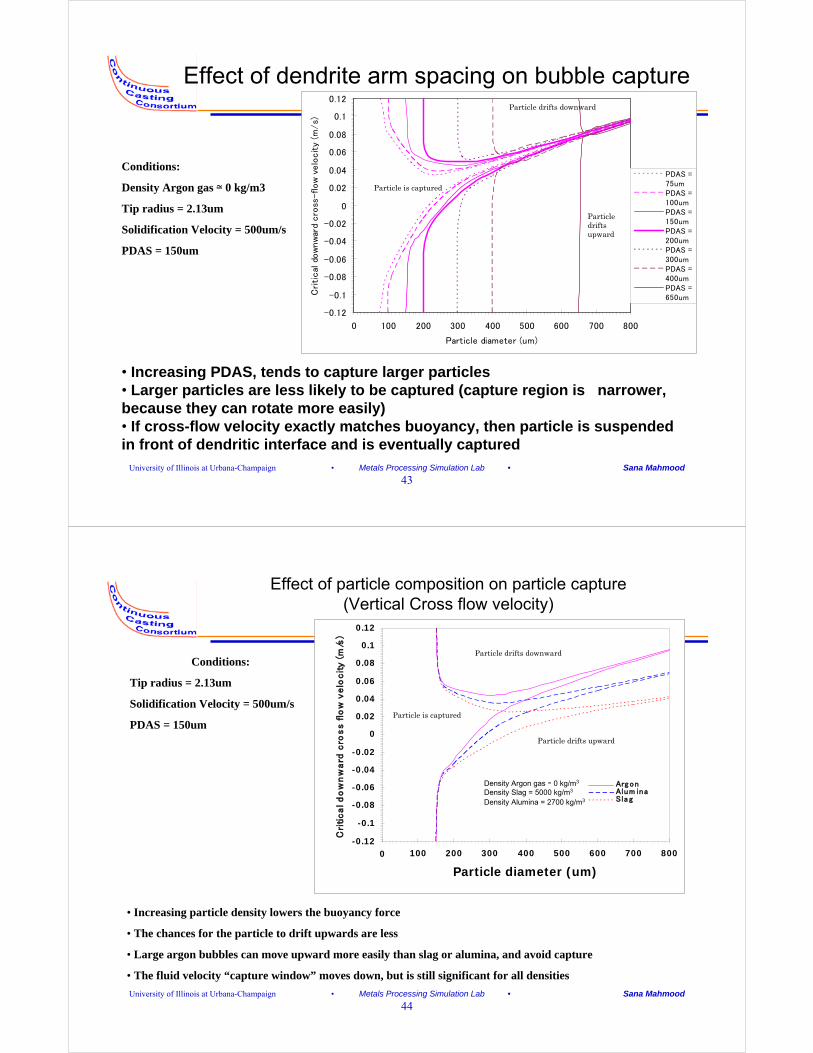
Particle Capture by Dendritic Interface
particle pushing and capture by engulfment and entrapment.
χ
η
Forces acting on a spherical particle close to dendriticfront of mushy-zone:
Dendrite shape computed by N. Provatas, N. Goldenfeld, and J. A. Dantzig, 1998.
Buoyancy: FB
Drag force: FDχ and FDηLift force: FL
Lubrication force: FLubVan der Waals force: FI
Concentration Gradient force: FGrad
Reaction force: FN(Press gradient, stress gradientadded mass and Basset forcesneglected.)
Solidification direction

University of Illinois at Urbana-Champaign • Metals Processing Simulation Lab • Sana Mahmood29
How the Entrapment Model is Incorporated in Fluent
• Particle Entrapment model is incorporated at the mold (with shell) boundaries in Fluent by writing user defined functions
• The η and א directions are evaluated from the solidification front angle and fluid flow direction
– א is in the direction of the vector normal to the face (boundary) that the particle hits– η is in the direction of the component of: sum of buoyancy and flow drag force, lying in
the face plane
• Primary dendrite arm spacing (PDAS) varies down the mold length and is incorporated as the function representing the measured PDAS [B.G.Thomas et al, 1998 ]
• Solidification front velocity also varies down the mold length and is incorporated by using the data obtained from [Quan Yuan, 2003]
• Forces acting on the particles when close to the solidifying front are evaluated
• The entrapment equations (force balance equations) are then used to evaluate the particles fate
University of Illinois at Urbana-Champaign • Metals Processing Simulation Lab • Sana Mahmood30
0.00E+00
5.00E-05
1.00E-04
1.50E-04
2.00E-04
2.50E-04
0 0.2 0.4 0.6 0.8 1 1.2 1.4 1.6 1.8 2 2.2 2.4 2.6
Distance below meniscus (m)
Pri
mar
y d
end
rite
arm
sp
acin
g (P
DA
S)
(m
)
Narrow Facemeasurement
Narrow Faceapproximationused
Wide Facemeasurement
Wide Faceapproximationused
0
0.0002
0.0004
0.0006
0.0008
0.001
0.0012
0.0014
0.0016
0 0.2 0.4 0.6 0.8 1 1.2 1.4 1.6 1.8 2
Distance below meniscus (m)
Shel
l Gro
wth
spe
ed (
m/s
)
V_ so l_ n arrow _ face
V_ so l_ w id e_ face
Variation of PDAS down the caster on narrow face and wide face
Variation of solidification front velocity down the caster on narrow face and wide face
Variation of PDAS and solidification front velocity used down the caster

University of Illinois at Urbana-Champaign • Metals Processing Simulation Lab • Sana Mahmood31
Particle Capture Criterion [ Quan Yuan, 2004]
( ), 2 cos 0L D Lub Grad IF F F F Fχ θ− − − − <
( ) ( ) ( ), , ,cos sin sin 2D B L D Lub Grad IF F F F F F Fη η χθ θ θ+ + − > − −
( ) ( ) ( ), , ,cos sin sin2D B L D Lub Grad IF F F F F F Fη η χθ θ θ− + − > − −
Particle size larger than PDAS (dp≥PDAS)?no Capture
yes
In solidification direction, repulsive force smaller than attractive force?noDrift back to flow
Particle contacts a boundary representing mushy-zone front?yes
noContinue
yes
Can cross-flow and buoyancy drive particle into motion though rotation?
, if FDη and FBη in same direction
, if FDη and FBη in opposite directionand FDη≥FBη
or
or
, if FDη and FBη in opposite directionand FDη<FBη
yes no
( ) ( ) ( ), , ,cos sin sin2B D L D Lub Grad IF F F F F F Fη η χθ θ θ− + − > − −
University of Illinois at Urbana-Champaign • Metals Processing Simulation Lab • Sana Mahmood32
Particle Positions
35.0s2 sec LES
2 sec K-ℇ
LES: 40,000 particles were introduced into the mold in 9sec•500 particles, diameter 10μm, density 5000kg/m3
•500 particles, diameter 40μm, density 5000kg/m3
•500 particles, diameter 10μm, density 2700kg/m3
•500 particles, diameter 40μm, density 2700kg/m3
[Quan Yuan, 2004]

University of Illinois at Urbana-Champaign • Metals Processing Simulation Lab • Sana Mahmood33
Small particles
[Quan Yuan, 2004]
University of Illinois at Urbana-Champaign • Metals Processing Simulation Lab • Sana Mahmood34
100um Particles
10,000 particles of 100μm diameter introduced into the domain from the nozzle ports (LES) [Quan Yuan]
[Quan Yuan, 2004]

University of Illinois at Urbana-Champaign • Metals Processing Simulation Lab • Sana Mahmood35
Slag Entrainment
4000 slag particles of 100μm diameter introduced into the domain from the top surface (LES) [Quan Yuan]
[Quan Yuan, 2004]
University of Illinois at Urbana-Champaign • Metals Processing Simulation Lab • Sana Mahmood36
Particles Trapped (Red dots show the position of trapped particles)
3.5% reach the top surface
~ 3% getting trapped at the top narrow face in K-ℇmodel not present in LES
K-ℇ
48.0s
8% reach the top surface
LES
Particles trap once they touch the boundary
[Quan Yuan, 2004]

University of Illinois at Urbana-Champaign • Metals Processing Simulation Lab • Sana Mahmood37
Particle capture: parameters investigated
• Particle diameter
• Particle density
• Primary dendrite arm spacing (PDAS)
• Sulfur concentration
• Dendrite tip radius (rd)
• Solidification front velocity (Vsol)
• Solidification front angle: angle of solidifying shell (wall) with the horizontal (ø) (decreases with distance below meniscus and with decreasing machine radius)
• Plots are made for critical cross-flow velocity in– Horizontal direction
– Vertical direction (up and down)
• Fluid velocity across the dendrite tips with magnitude exceeding “critical cross-flow velocity” will prevent particle capture
University of Illinois at Urbana-Champaign • Metals Processing Simulation Lab • Sana Mahmood38
Diameter = 100μm, Alumina particles entering from nozzle outlet
t = 45.0sdp = 100μm
K-ℇ
LES
4.62% reach the top surface
12.58% reach the top surface
10,000 particles in full mold 5,000 particles in half mold
Particles are trapped based on the entrapment model
Red dots show the position of trapped particles
[Quan Yuan, 2004]

University of Illinois at Urbana-Champaign • Metals Processing Simulation Lab • Sana Mahmood39
Diameter = 400μm, Alumina particles entering from nozzle outlet
t = 45.0sdp = 400μm
25.5% reach the top surface
69.89% reach the top surface
LES
K-ℇ
10,000 particles in full mold5,000 particles in half mold
[Quan Yuan, 2004]
University of Illinois at Urbana-Champaign • Metals Processing Simulation Lab • Sana Mahmood40
Particles Trapped on Narrow Face (K-ℇ)
Diameter=10μm and 40μm Diameter=100μm Diameter=400μm
•Number of Particles Entrapped in the encircled region (where Jet hits the wall) reduces with increasing particle diameter
•Number of particles being trapped on the narrow face reduces

University of Illinois at Urbana-Champaign • Metals Processing Simulation Lab • Sana Mahmood41
Analysis (K-ℇ)
12.84%Slag (Density ≃ 5000 kg/m3)
25.50%Alumina (Density ≃ 2700 kg/m3)
41.00%Argon (Density ≃ 0 kg/m3)
Particles removed by top surface (K-ℇ)Size (400um)
25.50%400 μm
11.20%250 μm
4.62%100 μm
Particles removed by top surface (K-ℇ)Alumina (Density = 2700 kg/m3)
University of Illinois at Urbana-Champaign • Metals Processing Simulation Lab • Sana Mahmood42
To Investigate more parameters for any mold (Behavior of Particle)
-0 .12
-0 .1
-0 .08
-0 .06
-0 .04
-0 .02
0
0.02
0.04
0.06
0.08
0.1
0.12
0 100 200 300 400 500 600 700 800
Particle diameter (um)
Cri
tica
l d
ow
nw
ard
cro
ss f
low
ve
locit
y (
m/
s)
Arg on
Particle drifts downward
Particle is captured
Particle drifts upwards
Conditions:
Tip radius = 2.13um
Solidification Velocity = 500um/s
PDAS = 150um
University of Illinois at Urbana-Champaign • Metals Processing Simulation Lab • Sana Mahmood43
-0.12
-0.1
-0.08
-0.06
-0.04
-0.02
0
0.02
0.04
0.06
0.08
0.1
0.12
0 100 200 300 400 500 600 700 800
Particle diameter (um)
Cri
tical
dow
nw
ard
cro
ss-flow
velo
cit
y (m
/s)
PDAS =75umPDAS =100umPDAS =150umPDAS =200umPDAS =300umPDAS =400umPDAS =650um
Effect of dendrite arm spacing on bubble capture
Conditions:
Density Argon gas ≃ 0 kg/m3
Tip radius = 2.13um
Solidification Velocity = 500um/s
PDAS = 150um
Particle drifts upward
Particle drifts downward
Particle is captured
• Increasing PDAS, tends to capture larger particles • Larger particles are less likely to be captured (capture region is narrower, because they can rotate more easily) • If cross-flow velocity exactly matches buoyancy, then particle is suspended in front of dendritic interface and is eventually captured
University of Illinois at Urbana-Champaign • Metals Processing Simulation Lab • Sana Mahmood44
-0.12
-0.1
-0.08
-0.06
-0.04
-0.02
0
0.02
0.04
0.06
0.08
0.1
0.12
0 100 200 300 400 500 600 700 800
Particle diameter (um)
Cri
tical d
ow
nw
ard
cro
ss flo
w v
elo
city (m
/s)
Arg onAlum inaSla g
Effect of particle composition on particle capture(Vertical Cross flow velocity)
• Increasing particle density lowers the buoyancy force
• The chances for the particle to drift upwards are less
• Large argon bubbles can move upward more easily than slag or alumina, and avoid capture
• The fluid velocity “capture window” moves down, but is still significant for all densities
Conditions:
Tip radius = 2.13um
Solidification Velocity = 500um/s
PDAS = 150um
Particle drifts downward
Particle drifts upward
Particle is captured
Density Argon gas ≃ 0 kg/m3
Density Slag = 5000 kg/m3
Density Alumina = 2700 kg/m3

University of Illinois at Urbana-Champaign • Metals Processing Simulation Lab • Sana Mahmood45
0
0 .02
0 .04
0 .06
0 .08
0 .1
0 .12
0 100 200 300 400 500 600 700 800
Part icle diameter (um)
Cri
tical
hori
zonta
l cro
ss f
low
velo
cit
y(m
/s)
ArgonAlum inaSlag
Conditions:
Tip radius = 2.13um
Solidification Velocity = 500um/s
PDAS = 150um
Effect of particle composition on particle capture (Horizontal Cross Flow Velocity)
Particle moves in the direction of FNet= FB + FD
Particle is captured
University of Illinois at Urbana-Champaign • Metals Processing Simulation Lab • Sana Mahmood46
Effect of steel sulfur content on bubble capture
-0.12
-0.1
-0.08
-0.06
-0.04
-0.02
0
0.02
0.04
0.06
0.08
0.1
0.12
0 100 200 300 400 500 600 700 800
Particle diameter (um)
Critical
dow
nw
ard
cro
ss flo
w v
elo
city
(m/s)
Lowsulfur
Highsulfur
Conditions:
Density Argon gas ≃ 0 kg/m3
rd = 2.13um
Vsol = 500um/s,
Low sulfur = 0.0028 wt pct
High sulfur = 0.03 wt pct
PDAS = 150um
• Increasing sulfur concentration increases the surface gradient force, by lowering surface tension near the solidification front, due to S rejection during solidification
• Increasing sulfur concentration from 0.0028 to 0.03 wt pct only slightly increases particle capture. (capture window expands).
Particle drifts upward
Particle drifts downward
Particle is captured

University of Illinois at Urbana-Champaign • Metals Processing Simulation Lab • Sana Mahmood47
Effect of dendrite tip radius and sol. front velocity
-0.12
-0.1
-0.08
-0.06
-0.04
-0.02
0
0.02
0.04
0.06
0.08
0.1
0.12
0 100 200 300 400 500 600 700 800
Particle diameter (um)
Critical dow
nw
ard
cro
ss f
low
velo
city (
m/s)
PDAS = 150um,rd = 2.13um,Vsol =500um/s downPDAS = 150um,rd = 3.3um,Vsol = 200umdown
Condition 1:
Density Argon gas ≃ 0 kg/m3
Tip radius = 2.13um
Solidification Velocity = 500um/s
PDAS = 150um
Condition 2:
Density Argon gas ≃ 0 kg/m3
Tip radius = 2.13um
Solidification Velocity = 500um/s
PDAS = 150um
• Increasing solidification velocity only slightly increases lubrication force
• Decreasing dendrite tip radius only slightly increases the surface gradient force
• These two parameters together have negligible effect on increasing particle entrapment near top of caster or at higher casting speed
Particle drifts upward
Particle drifts downward
Particle is captured
University of Illinois at Urbana-Champaign • Metals Processing Simulation Lab • Sana Mahmood48
Particle
Inner radius
φ
Effect of solidification front angle on alumina particle capture (inner radius)
0
0.02
0.04
0.06
0.08
0.1
0.12
0 100 200 300 400 500 600 700 800
Particle diameter (um)
Critical
cro
ss f
low
velo
city
dow
n inclin
e a
t in
side
rad
ius
(m/s)
30deg45deg60deg90deg
Conditions:
Density Alumina ≃ 2700 kg/m3
rd = 2.13um
Vsol = 500um/s
PDAS = 150um
Particle drifts upward
Particle drifts downward
Particle is captured
Particle capture becomes easier on the inner radius with decreasing solidification front angle (ø)(capture window extends to lower flow velocities)
Curved mold caster: Inner radius
Flow Direction

University of Illinois at Urbana-Champaign • Metals Processing Simulation Lab • Sana Mahmood49
Effect of solidification front angle on alumina particle capture (outer radius)
0
0.02
0.04
0.06
0.08
0.1
0.12
0 100 200 300 400 500 600 700 800
Particle diameter (um)
Critical
cro
ss f
low
velo
city
dow
n inclin
e a
t outs
ide r
adiu
s(m
/s)
30 deg
45 deg
60 deg
90 deg
Conditions:
Density Alumina ≃ 2700 kg/m3
rd = 2.13um
Vsol = 500um/s
PDAS = 150um
Particle drifts upward
Particle drifts downward
Particle is captured
•Lowering solidification front angle (ø) (towards horizontal) decreases capture likelihood (particles rotate away more easily)
•Critical particle size exists that will avoid capture for any flow condition
Curved mold caster: Outer radius
Flow Direction Particle
Outer radius
φ
University of Illinois at Urbana-Champaign • Metals Processing Simulation Lab • Sana Mahmood50
Critical alumina particle size to avoid capture (outer radius)
0
0.02
0.04
0.06
0.08
0.1
0.12
0 100 200 300 400 500 600 700 800
Particle diameter (um)
Critica
l cro
ss flo
w v
eloc
ity
dow
n in
clin
e a
t ou
tsid
era
diu
s
30 deg
45 deg
60 deg
Conditions:
Density Alumina ≃ 2700 kg/m3
rd = 2.13um
Vsol = 500um/s
PDAS = 150um
•Buoyancy force is high, allowing particles to float upward, away from capture
•Smaller particles may still be captured (must check rotation about dendrite tips)
•Critical particle diameter exists that always escapes!
Particle moves away from thedendrites in radial direction
Rotation of particle about dendrite tips needs to be checked

University of Illinois at Urbana-Champaign • Metals Processing Simulation Lab • Sana Mahmood51
Conclusions
• The k-ℇ model prediction for steady flow in the nozzle and mold match well with the time averaged results from LES
• Particle transport and entrapment model has been implemented into FLUENT and compared with LES model predictions
• Increasing primary dendrite arm spacing has the most important effect increasing particle capture: small particles are always captured when they touch the solidification front
• Particle composition (density: bubble vs. inclusion) shifts the capture window• Bubbles escape more easily than solid inclusions in stagnant flow regions, but
their capture depends on the flow pattern• Although steels with low sulfur content tend to have less particle entrapment,
the effect is small• The increased ease of particle capture on the inner radius is a large effect
(relative to vertical or outer radius)
Model Validation
Entrapment Model Predictions:
University of Illinois at Urbana-Champaign • Metals Processing Simulation Lab • Sana Mahmood52
Future Work
• The model uses isotropic velocity fluctuations and the velocity magnitude in all spatial directions is significantly different, so match with LES is not perfect. Therefore better fluid flow / turbulence model is needed (eg. Reynolds Stress)
• The model shows high concentration of particle at the top of the narrow face (not seen in LES results)
• Use model to fully investigate effect of other casting conditions and geometries