ASSOCIATION OF PHYSICIANS Original Articles Pre and Postmenopausal Changes of Bone Mineral Density:...
34
-
Upload
duongnguyet -
Category
Documents
-
view
214 -
download
0
Transcript of ASSOCIATION OF PHYSICIANS Original Articles Pre and Postmenopausal Changes of Bone Mineral Density:...


ASSOCIATION OF PHYSICIANS
OF BANGLADESH
JOURNAL COMMITTEE
ADVISORY BOARD
National Prof. Nurul Islam
Nation Prof. Brig. (Rtd) Abdul Malik
Prof. M Amanullah
Prof. Md. Tahir
Prof. Nazrul Islam
Prof. Sk. Nesaruddin Ahmed
Prof. Matiur Rahman
Prof. Hazera Mahtab
Prof. Harun ur Rashid
Prof. Mobin Khan
Prof. Tofayel Ahmed
Prof. Md. Fazlul Hoque
Prof. AZM Maidul Islam
Prof. Syed Kamaluddin
Prof. Moyeenuzzaman
EDITORIAL BOARD
Chairman : Prof. Mahmud Hasan
Editor-in-Chief : Prof. Quazi Tarikul Islam
Assistant Editors : Dr. Ahmed HossainDr. Robed AminDr. Kazi Shahnur AlamDr. Mamun Al Mahtab
Members : Prof. MA FaizProf. Kaniz MoulaProf. MA BasharProf. Projesh Kumar RoyProf. Nooruddin AhmedProf. Md. Ekhlasur RahmanProf. Firoz Ahmed QuraishiProf. Md. Ridwanur RahmanProf. Md. Zakir HossainProf. Dilip DharProf. Col Mamun MostafiProf. Md. Faruk AhmedProf. ARM Saifuddin EkramProf. Md. Alamgir KabirProf. Tahmina BegumDr. Rubina Yasmin
Ex Officio : Prof. Syed Atiqul Haq
Prof. Md. Mujibur Rahman
Dr. Abdul Wadud Chowdhury

ASSOCIATION OF PHYSICIANS
OF BANGLADESH
EXECUTIVE COMMITTEE 2011-2013
President : Prof. Syed Atiqul Haq
Vice President : Prof. Selimur Rahman
Prof. MA Jalil Chowdhury
Treasurer : Prof. MA Rashid
Secretary General : Prof. Md. Mujibur Rahman
Joint Secretary General : Prof. Golam Rabbani
Organizing Secretary : Dr. Mostafa Zaman
Secretary for Scientific Affairs : Dr. Abdul Wadud Chowdhury
Members : Prof. Mahmud Hasan
Prof. Quazi Deen Mohammad
Prof. Md. Abul Kashem Khandaker
Prof. Chowdhury Ali kawsar
Prof. Khwaza Nazimuddin
Prof. Muhammad Rafiqul Alam
Prof. Md. Azizul Kahhar
Prof. Khan Abul Kalam Azad
Prof. Md. Qamrul Hassan Jaigirdar
Ex-Officio : Prof. AKM Rafiquddin
Prof. AKM Mosharraf
Md Qamrul Hassan Jaigirdar
CONTENTS
Original Articles
Pre and Postmenopausal Changes of Bone Mineral Density: A Comparative Study done by 1-7
Dual Energy X-Ray Absorptiometry
M Begum, MI Patwary, MA Ahbab, MH Khan, AI Chowdhury, F Bari
Presentation of Biliary Ascariasis : A Study of 30 Cases 8-11
Hasina Begum, MM Rahman, M Salahuddin, F Ahmed, A Hossain
How accurately physicians measure Blood Pressure- an observational study in 12-16
Enam Medical College and Hospital, Savar
Rukhsana Parvin, Md. Nazmul Haque, Md Imran Ali,Mohammad Mahbubul Alam,
AKM Rafiqueuddin
A Study of Hypoalbuminaemia in Chronic Liver Disease and its Correlation With 17-20
Development of Esophageal Varices
S F Hossain, QT Islam, MR Siddiqui, A Hossain, N Jahan, YU Rahman, MJ Iqbal
Review Article
A Rare And Clinically Important Blood Group- Bombay Blood Group 21-23
Chowdhury FS, Siddiqui MAE, Rahman KGM, Nasreen Z, Begum H.A, Begum HA
Case Reports
A Young Girl with Repeated Episodes of Pneumonia and Intermittent Diarrhoea- 24-26
The primary Immunodeficiency Syndrome
Abdullah-Al-Mamun, Samim Hasan, Syed Ahmed Abdullah, Ahmed Riyad Hossain,
Safiul Alam, Robed Amin, MA Kahhar
A Case of Deep Vein Thrombosis Due To Protein C, Protein S Deficiency And 27-29
Hyper-homocystinaemia, A Rare Genetic Abnormalities
Ahmed Hossain, Quazi Tarikul Islam, Umme Kulsum Mitu, Jayanta Banik,
HM Mostafisur Rahman, Mahmud Hasan, ABM Golam Mostafa

should follow the Vancouver format. In the text theyshould appear as numbers starting at 1. At the endof the paper they should be listed (double spaced) innumerical order corresponding to the orders ofcitation in the text. All authors should be quoted forpapers with upto six authors, for papers with morethan six authors the first six only should be quotedfollowed by et al.Abbreviations for titles of medical periodicals should
conform to those used in the latest edition of Index
Medicus. The first and last page numbers for each
reference should be provided. Abstracts and letter
must be identified as such. Authors must check
references against original sources for accuracy.
Examples of reference are given below:
Articles in Journals :
1. Paganini Hill A, Chao A, Ross Rk, Henderson BE.
Aspirin use and chronic disease : a cohort study of
the elderly. BMJ 1989; 299: 1247-50.
2. Parkin DM, Clayton D, Blook RJ, Massyer E, Fried
HP, Iranov E, et al. Childhood Leukaemia in Europe
after Chernobyl : 5 years follow-up. Br J Cancer 1996;
73 : 1006-12.
Chapter in a Book :
1. Phyllyps SJ, Whisnant JP. Hypertension and Stroke.
In : Lurgh JH, Brennes BM, editors. Hypertension :
Pathophysiology, diagnosis and management. 2nd ed.
New York : Raven Press; 1995. p. 465-78.
Tables should be as few as possible and should
present only essential data. Each table should be
type-written on separate sheets, have a title or
caption with Roman numbers. All photographs,
graphs, diagrams should be referred to as figures and
should be numbered consecutively in the text in
Arabic numericals. The legends for illustrations
should be typed on separate sheets. Photographs
and photomicrographs should be unmounted glossy
prints. Photomicrographs should have internal scale
markers, include in the legend the original
magnification and the stain used. Line diagrams and
graphs should be on separate sheets drawn with black
Indian ink on white paper. A photocopy of all
illustrations should be submitted.
Proofs :
Two marked copies of the proofs may be sent to theprinciple author which should be read carefully forerror. One corrected copy must be returned to theeditor within the next three days. Major alteration in
the text cannot be accepted.
INSTRUCTION TO AUTHORS
The Journal of Association of Physicians of
Bangladesh publishes original papers, reviews
concerned with recent practice and case reports of
exceptional merit. The Journal considers manuscripts
prepared in accordance with the guidelines laid down
by the international committee of Medical Journal
Editors (BMJ 1988; 296: 401-405). A covering letter
signed by all authors must state that the data have
not been published elsewhere in whole or in part
and all authors agree their publication in Journal of
Association of Physicians of Bangladesh. If the work
has been conducted abroad then the article must be
accompanied by certificate from head of the institute
where the work has been done.
Type scripts :
Three typed copies of the article and one copy in a3.5" high density floppy diskette processed inWordperfect 6.0 or MS Word 6.0 should be submittedto the Editor. The text should be type-written in doublespace on one side of the paper not larger than ISOA4 with a 5 cm margin and paper should be numberedconsecutively. The first page of the type script shouldbear the names of the author(s) and the name andaddress of the laboratory or institution where thework has been carried out, in addition to the title ofthe paper. The full address of the principal author towhom proofs will be sent should be given as footnote,as should any permanent change of address and/orappointment. A short (running) title of not more than45 characters should be given. Please write asconcisely as possible. Amendments should be madein the texts and not in the margins. All submittedmanuscripts are reviewed by the editors and rejectedmanuscripts will not be returned. Ethical aspects willbe considered in the assessment of the paper.
Arrangement :
Papers should be divided into: (a) Title page (b)
Summary (c) Introduction (d) Materials and methods
(e) Results (f) Discussion (g) Acknowledgement (h)
Reference (i) Tables (j) Figures and Captions. The
summary should not exceed 250 words and should
state concisely what was done, the main findings and
how the work was interpreted.
Style :
Abbreviations and symbols must be standard and SIunits should be used throughout. Whenever possibledrugs should be given their approved generic name.Acronyms should be used sparingly. Statisticalanalysis must explain the methods used. Reference

Bangladesh J Medicine 2011; 22 : 1-7
ORIGINAL ARTICLES
Introduction:
Over the past 10 years, osteoporosis has emerged asa major clinical challenge for physician and patients,with regard both to its prevalence and to the morbidityand mortality of associated fracture.2
Osteoporosis affects an estimated 75 million peoplein Europe, United States of America (USA), andJapan.3 Osteoporotic fractures occurs 1 in 3 womenas well as 1 in 5 men over 50 years of age.4-6
The most important risk factor for bone loss in women
is the menopause; Women loss about 50% of their
PRE AND POSTMENOPAUSAL CHANGES OF BONEMINERAL DENSITY: A COMPARATIVE STUDY DONEBY DUAL ENERGY X-RAY ABSORPTIOMETRYM BEGUM1, MI PATWARY2, MA AHBAB3, MH KHAN4, AI CHOWDHURY5, F BARI6
Abstract:
Background: Accelerated decline of bone mass occurs in women after the menopause, and might
lead to excessive bone resorption and eventually to osteoporosis.1 To find out the changes of bone
mineral density (BMD) before and after menopause, the shown was undertaken.
Materials and Methods: This comparative study was conducted in the Department of Medicine,
Sylhet M A G Osmani Medical College Hospital, Sylhet during July 2008 to June 2009. Forty
postmenopausal women; monthly income and BMI matched 40 premenopausal women were selected
according to inclusion and exclusion criteria. BMD of lumber vertebrae and femoral neck was
determined using Dual energy x-ray absorptiometry (DXA) method (Norland XR 46, Pencil beam).
Results: The parity of the postmenopausal women was significantly higher than that of
premenopausal women (6.9 ± 2.6 vs 3.1± 1.5; p<0.01). The body weight was significantly lower in
postmenopausal women than that of premenopausal women (54.1 ± 8.3 kg vs 61.0 ± 9.7 Kg;
p<0.01). The height was significantly lower in postmenopausal women than premenopausal women
(148.2 ± 5.7cm vs 153.4 ± 6.4cm; p<0.01). The BMD was lower in postmenopausal women than
premenopausal women in lumber vertebrae (0.68 ± 0.13 gm/cm2 vs 0.94 ± 0.03 gm/cm2; p <0.01)
and also in femoral neck (0.63 ± 0.12 gm/cm2 vs 0.84 ± 0.14 gm/cm2; p < 0.01). A significant
positive correlation was present between BMD and height (r=0.512; p<0.05); and weight (r=0.489;
p<0.05); and a negative correlation between BMD and age (r=-0.408; p<0.05); parity (r=-0.456;
p<0.05) and years since menopause (r=-0.350; p<0.05).
Conclusion: The BMD was significantly lower in postmenopausal women than that of premenopausal
women and negative correlation was present between BMD and age, parity and years since
menopause.
Keywords: Menopause, Bone mineral density.
1. Assistant Professor of Medicine, Jalalabad Ragib Rabeya Medical College, Sylhet.
2. Head of the Department of Medicine, Sylhet M A G Osmani Medical College, Sylhet.
3. Ex. Principal & Head of the dept. of Medicine, Sylhet M A G Osmani Medical College, Sylhet
4. Director Nuclear Medicine Centre, Sylhet.
5. Lecturer, Microbiology, Sylhet M A G Osmani Medical College, Sylhet.
6. Registrar, Medicine, Jalalabad Ragib Rabeya Medical College, Sylhet.
trabecular bone and 30% of their cortical bone during
the course of their lifetime, about half of which is
lost during the first 10years after the menopause.7, 8
A 10% loss of bone mass can double the risk of
vertebral fractures, and 2.5 times greater risk of hip
fracture.9 Their impact on quality of life can be profound
as a result of loss of self-esteem, distorted body image,
depression and activities of daily living.10-14
In an Indian study among women aged 30-60 years
and low income groups showed the bone mineral
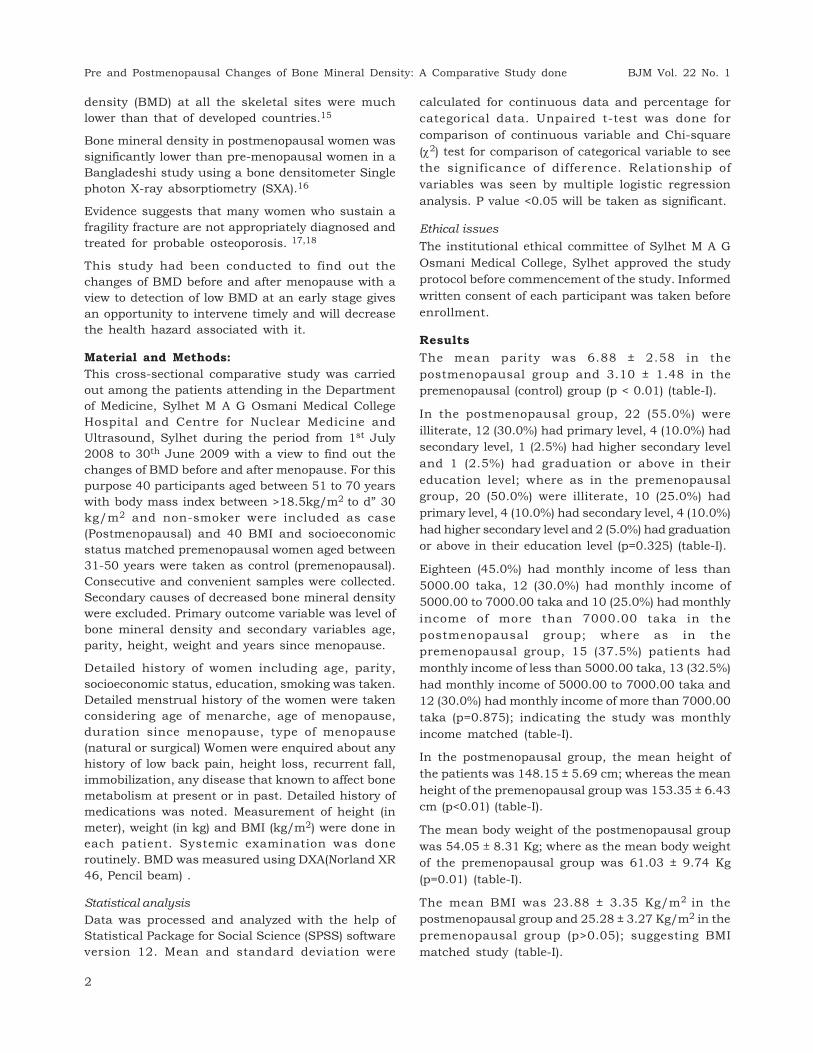
density (BMD) at all the skeletal sites were much
lower than that of developed countries.15
Bone mineral density in postmenopausal women was
significantly lower than pre-menopausal women in a
Bangladeshi study using a bone densitometer Single
photon X-ray absorptiometry (SXA).16
Evidence suggests that many women who sustain a
fragility fracture are not appropriately diagnosed and
treated for probable osteoporosis. 17,18
This study had been conducted to find out the
changes of BMD before and after menopause with a
view to detection of low BMD at an early stage gives
an opportunity to intervene timely and will decrease
the health hazard associated with it.
Material and Methods:
This cross-sectional comparative study was carried
out among the patients attending in the Department
of Medicine, Sylhet M A G Osmani Medical College
Hospital and Centre for Nuclear Medicine and
Ultrasound, Sylhet during the period from 1st July
2008 to 30th June 2009 with a view to find out the
changes of BMD before and after menopause. For this
purpose 40 participants aged between 51 to 70 years
with body mass index between >18.5kg/m2 to d” 30
kg/m2 and non-smoker were included as case
(Postmenopausal) and 40 BMI and socioeconomic
status matched premenopausal women aged between
31-50 years were taken as control (premenopausal).
Consecutive and convenient samples were collected.
Secondary causes of decreased bone mineral density
were excluded. Primary outcome variable was level of
bone mineral density and secondary variables age,
parity, height, weight and years since menopause.
Detailed history of women including age, parity,
socioeconomic status, education, smoking was taken.
Detailed menstrual history of the women were taken
considering age of menarche, age of menopause,
duration since menopause, type of menopause
(natural or surgical) Women were enquired about any
history of low back pain, height loss, recurrent fall,
immobilization, any disease that known to affect bone
metabolism at present or in past. Detailed history of
medications was noted. Measurement of height (in
meter), weight (in kg) and BMI (kg/m2) were done in
each patient. Systemic examination was done
routinely. BMD was measured using DXA(Norland XR
46, Pencil beam) .
Statistical analysis
Data was processed and analyzed with the help of
Statistical Package for Social Science (SPSS) software
version 12. Mean and standard deviation were
calculated for continuous data and percentage for
categorical data. Unpaired t-test was done for
comparison of continuous variable and Chi-square
(χ2) test for comparison of categorical variable to see
the significance of difference. Relationship of
variables was seen by multiple logistic regression
analysis. P value <0.05 will be taken as significant.
Ethical issues
The institutional ethical committee of Sylhet M A G
Osmani Medical College, Sylhet approved the study
protocol before commencement of the study. Informed
written consent of each participant was taken before
enrollment.
Results
The mean parity was 6.88 ± 2.58 in the
postmenopausal group and 3.10 ± 1.48 in the
premenopausal (control) group (p < 0.01) (table-I).
In the postmenopausal group, 22 (55.0%) were
illiterate, 12 (30.0%) had primary level, 4 (10.0%) had
secondary level, 1 (2.5%) had higher secondary level
and 1 (2.5%) had graduation or above in their
education level; where as in the premenopausal
group, 20 (50.0%) were illiterate, 10 (25.0%) had
primary level, 4 (10.0%) had secondary level, 4 (10.0%)
had higher secondary level and 2 (5.0%) had graduation
or above in their education level (p=0.325) (table-I).
Eighteen (45.0%) had monthly income of less than
5000.00 taka, 12 (30.0%) had monthly income of
5000.00 to 7000.00 taka and 10 (25.0%) had monthly
income of more than 7000.00 taka in the
postmenopausal group; where as in the
premenopausal group, 15 (37.5%) patients had
monthly income of less than 5000.00 taka, 13 (32.5%)
had monthly income of 5000.00 to 7000.00 taka and
12 (30.0%) had monthly income of more than 7000.00
taka (p=0.875); indicating the study was monthly
income matched (table-I).
In the postmenopausal group, the mean height of
the patients was 148.15 ± 5.69 cm; whereas the mean
height of the premenopausal group was 153.35 ± 6.43
cm (p<0.01) (table-I).
The mean body weight of the postmenopausal group
was 54.05 ± 8.31 Kg; where as the mean body weight
of the premenopausal group was 61.03 ± 9.74 Kg
(p=0.01) (table-I).
The mean BMI was 23.88 ± 3.35 Kg/m2 in the
postmenopausal group and 25.28 ± 3.27 Kg/m2 in the
premenopausal group (p>0.05); suggesting BMI
matched study (table-I).
2
Pre and Postmenopausal Changes of Bone Mineral Density: A Comparative Study done BJM Vol. 22 No. 1

Table-I
Distribution of the patients by baseline characteristics
Baseline Postmenopausal Premenopausal p
characteristics group (n=40) group (n=40) value
Parity 6.875 ± 2.580 3.100 ± 2.580 <0.01*
(mean ± SD) (range 2 to 12) (range 0 to 7)
Education
Illiterate 22 (55.0) 20 (50.0) 0.325 †
Primary 12 (30.0) 10 (25.0)
Secondary 4 (10.0) 4 (10.0)
Higher secondary 1 (2.5) 4 (10.0)
e” Graduate 1 (2.5) 2 (5.0)
Monthly income (in taka)
<5000 18 (45.0%) 15 (37.5%) 0.875†
5000-7000 12 (30%) 13 (32.5%)
>7000 10 (25.0%) 12 (30.0%)
Height (mean ± 148.15 ± 5.69 153.35±6.43 < 0.01*
SD) (range 140 to 160) (range 139 to 165)
Weight (mean ± 54.05 ± 8.31 61.03 ± 9.74 <0.01*
SD) (range 40 to 72) (range 40 to 80)
BMI 23.88 ± 3.35 25.28 ± 3.27 >0.05*
(mean ± SD) (range 19 to 29) (range 20 to 29)
*Unpaired t-test and †c2 Chi-Squre test were applied to analyse the data.
n = total number.
SD = Standard deviation.
BMD in lumber vertebrae was nearly stable in premenopausal women (31-50 years), but decreased sharply in
postmenopausal women. Distribution of BMD in lumber vertebrae in different age group was shown in figure-1.
Fig.-1: Distribution of BMD in lumber vertebrae in different age group
3
BJM Vol. 22 No. 1 Pre and Postmenopausal Changes of Bone Mineral Density: A Comparative Study done

In the postmenopausal group, the mean BMD in
lumber vertebrae was 0.68 ± 0.13gm/cm2; whereas the
mean BMD in lumber vertebra was 0.94 ± 0.03 gm/
cm2 in the premenopausal group (p < 0.01) (table-II).
The mean BMD in femoral neck was 0.63±0.12 gm/
cm2 in the postmenopausal group; whereas the mean
BMD in femoral neck was 0.84±0.14 gm/cm2 in the
premenopausal group (p < 0.01) (table-II).
Data were presented as mean ± SD. Comparison wasdone between groups by * unpaired t test.
In the postmenopausal group, BMD was osteoporoticlevel in 21(52.5%), osteopenic level in 8 (20.0%)patients, combined in 9 (22.5%) and normal level in 2(5.0%) patients; where as in the premenopausalgroup, osteoporotic level was in 5 (12.5%), osteopeniclevel in 17 (42.5%), combined in 2(5.0%) and normallevel in 16 (40.0%) patients (p<0.001) (table-III).
BMD in femoral neck was nearly stable in premenopausal women (31-50 years), but decreased sharply in
postmenopausal women. Distribution of BMD in femoral neck in different age group was shown in figure-2.
Fig.-2: Distribution of BMD in femoral neck in different age group
Table-II
Distribution of the patients by BMD
BMD Postmenopausal Premenopausal group *p
(gm/cm2) group (n=40) (n=40) value
Lumber 0.68 ± 0.13 (range 0.94 ± 0.03 < 0.01
vertebra 0.42 to 1.02) (range 0.51 to 1.27)
Femoral neck 0.63±0.12 (range 0.84 ±0.14 < 0.01
0.45 to 0.91) (range 0.47 to 1.02)
Table-III
Distribution of patients by BMD (Based on WHO Criteria)
BMD Study group *p value
Postmenopausal Premenopausalwomen (n=40) women (n=40)
Normal 2 (5.0) 16 (40.0) <0.001
Osteopenia 8 (20.0) 17 (42.5)
Osteoporosis 21 (52.5) 5 (12.5)
Combined 9 (22.5) 2 (5.0)
* Combined (either osteoporosis of LV and osteopenia
of FN or osteoporosis of FN and osteopenia of LV).
* χ2 Chi-square test was applied to analyse the data.
* WHO criteria (by T-score) Normal: T-score of -1.0 or above Osteopenia: T-score of -1.1 to 2.4 Osteoporosis: T-score of -2.5 or below
4
Pre and Postmenopausal Changes of Bone Mineral Density: A Comparative Study done BJM Vol. 22 No. 1

Regarding correlation between BMD and selected
variables showed that a significantly negative
correlation was present between BMD and age (r=-
0.408; p<0.05), parity (r=-0.456; p<0.05), years since
menopause (r=-0.350; p<0.05). But a significantly
positive correlation was present between BMD and
height (r=0.512; p<0.01), weight (r=0.489; p<0.05)
(table-IV).
Discussion
Osteoporosis and low bone marrow density are
significant risk factors for morbidity and mortality in
older adults. Not only it gives rise to morbidity but
also markedly diminishes the quality of life of women
after menopause.19
The parity of the postmenopausal women wassignificantly greater than the premenopausal women(6.88 ± 2.58 vs 3.10 ± 1.48; p< 0.01). Similar findingwas observed in the study of Chowdhury.6
Premenopausal women have got chance of havingchildren in future which may cause this disparity. In
the present study a significantly negative correlation
was present between BMD and parity (r=-0.456;
p<0.05). This result was correlated with the study
conducted by Chowdhury .16
In postmenopausal group 55.0% patients were
illiterate, 30.0% had primary level, 10.0% had
secondary level; and higher secondary level and
graduation or above constituted 2.5% each. In this
regards Gur et al, 20 found that prevalence of
osteoporosis had an inverse relationship with the
level of education, 18.6% for the most educated to
34.4% for the no educated women.
The height of the patients was significantly lower inpostmenopausal group than that of premenopausalgroup (148.15 ± 5.69 vs 153.35 ± 6.43; p<0.01) in thisstudy, that also reported by Lau et al,21 (149.3 ± 6.4
cm vs 153.5 ±5.7cm; p<0.001) in their study. a
significant positive correlation was found between
height and the Bone mineral density (r=0.512; p<0.05)
that was similar to the study of Douchi22 .
The weight was significantly lower in postmenopausal
group than that of premenopausal group (54.05 ±
8.31kg vs 61.03 ± 9.74 Kg; p=0.001). This result was
supported by Lau et al,21 53.8 ± 10.9 kg vs 56.0 ± 9.0
kg; p<0.01). Chowdhury and his group,16 found the
mean body weight was 48.2 ± 10.8 Kg in their
postmenopausal women and 49.9 ± 9.4 years in
premenopausal women; but the difference between
the groups was not significant (p=0.23).
Bone mineral density had a positive correlation with
body-weight (r=0.489; p<0.05) in the current study.
This result was similar to the study of Chowdhury,16
that bone mineral density had a positive correlation
with body-weight (p<0.05).
The mean BMI was 23.88 ± 3.35 Kg/m2 in the
postmenopausal women and 25.28 ± 3.27 Kg/m2 in
premenopausal women. The BMI of the patients inboth groups were almost similar statistically (p>0.05).No significant difference was found betweenpostmenopausal and premenopausal women regardingBMI reported by Chowdhury (p=0.79).16
The bone mineral density in lumber vertebrae was0.68 ± 0.13 in postmenopausal women and 0.94 ±0.03 in the premenopausal women (p < 0.01). Thisfinding was correlated with Lau et al,21 that the bonemineral density in lumber vertebrae was 0.70 ± 0.16in postmenopausal women and 0.96 ± 0.12 in thepremenopausal women.
The bone mineral density was 0.63± 0.12 inpostmenopausal women, and 0.84 ± 0.14 in thepremenopausal women in the femoral neck (p< 0.01).This result was also supported by Lau et al that thebone mineral density was 0.55 ± 0.12 inpostmenopausal women, and 0.80± 0.10 in thepremenopausal women in the femoral neck.
A significant negative correlation was found between
BMD and age (r=-0.408; p<0.05 and this finding was
correlated with the study of Chowdhury 16 that a
significant negative correlation was present between
BMD and age (p<0.001).
Table-IV
Correlation of bone mineral density and selected variables -
Variables BMD Age Parity Menopause Height Weight
BMD 1.000 -0.408 * -0.456* 0.350* 0.512** 0.489*
Age 0.408* 1.000 -0.998** 0.988** 0.992** 0.990**
Parity 0.456* -0.998** 1.000 0.985 0.996 0.994**
Menopause 0.350* 0.988** 0.985 1.000 -0.972** -0.969**
Height 0.512* 0.992** 0.996 -0.972** 1.000 -0.989**
Weight 0.489* 0.990** 0.994** -0.969** -0.989** 1.000
5
BJM Vol. 22 No. 1 Pre and Postmenopausal Changes of Bone Mineral Density: A Comparative Study done

A significant negative correlation was found between
BMD and years since menopause (r=-0.350; p<0.05).
This result was supported by the study of Douchi,22
and Enchev.23 A strong negative correlation was found
between bone mineral density and years since
menopause (p<0.001) in the study of Douchi,22 and a
weak negative correlation found between bone mineral
density and years since menopause in the study of
Enchev et al.23
In the present study bone mineral density was
osteoporotic level in 21(52.5%) patients, osteopenic
level was in 8 (20.0%) patients, combined in 9 (22.5%)
and normal level in 2 (5.0%) patients in the
postmenopausal women; whereas in premenopausal
group, osteoporotic level was in 5 (12.5%) patients,
osteopenic level was in 17 (42.5%) patients, combined
in 2 (5.0%) and normal level was in 16 (40.0%)
patients. The level of bone mineral density between
the groups was statistically significant (p<0.001). In
this regards Keramat et al,24 reported that the
prevalence of lumber spine osteoporosis and
osteopenia in the postmenopausal women was 26.5%
and 50% respectively.
In conclusion, the bone mineral density was
significantly lower in postmenopausal women than
premenopausal women both in lumber and femoral
neck; and negative correlation was present between
bone mineral density and age, parity and years since
menopause.
Recommendation:
Considering the findings of this study the following
recommendations are made:
• A study should be conducted using large samplesize in the community level to find out themagnitude of the condition in general population.
• A study involving multicentre with randomsampling should be conducted to determine anydisparity of bone mineral density through out thecountry.
Acknowledgement:
This study was done in as a part of thesis in partial
fulfillment of the requirement for Internal Medicine
MD Part III examination in Sylhet MAG Osmani
Medical College Hospital, Sylhet, Bangladesh.
My heartiest gratitude and thankfulness to all myundergraduate and post graduate teachers.
References:
1. Sayegh RA, Stubblefield PG. Bone metabolism and
the perimenopause: overview, risk factors, screening,
and osteoporosis preventive measures. Obstet
Gynecol Clin North Am. 2002;29:495–510.
2. Delmas PD, Fraser M. Strong bones in later life:
luxury or necessity? Bull World Health Organ.
1994;77:416-22.
3. EFFO, NOF. Who are candidates for prevention
and treatment for osteoporosis? Osteoporos Int.
1997;7:1.
4. Melton LJ 3rd, Atkinson EJ, O’Connor MK. Bone
density and fracture risk in men. J Bone Miner
Res. 1998;13:1915.
5. Melton LJ 3rd, Chrischilles EA, Cooper C.
Perspective. How many women have osteoporosis?
J Bone Miner Res. 1992;7:1005.
6. Kanis JA, Johnell O, Oden A. Long-term risk of
osteoporotic fracture in Malmo. Osteoporos Int.
2000;11:669.
7. Finkelstein JS. Osteoporosis. In: Goldman L,
Ausiello D, editors. Cecil textbook of medicine. 22nd
ed. Philadelphia: WB Saunders. p. 1547–55.
8. Riggs BL, Melton LJ III. The prevention and
treatment of osteoporosis. N Engl J Med.
1992;27:620–7.
9. Klotzbuecher CM, Ross PD, Landsman PB. Patients
with prior fractures have an increased risk of future
fractures: a summary of the literature and statistical
synthesis. J Bone Miner Res. 2000;15:721.
10. Gold DT. The nonskeletal consequences of
osteoporotic fractures. Psychologic and social
outcomes. Rheum Dis Clin North Am. 2001;27:255.
11. Robbins J, Hirsch C, Whitmer R. The association
of bone mineral density and depression in an older
population. J Am Geriatr Soc. 2001;49:732.
12. Lyles KW. Osteoporosis and depression: shedding
more light upon a complex relationship. J Am
Geriatr Soc. 2001;49:827.
13. Tosteson AN, Gabriel SE, Grove MR. Impact of hip
and vertebral fractures on quality-adjusted life years.
Osteoporos Int. 2001;12:1042.
14. Hall SE, Criddle RA, Comito TL, Prince RL. A case-
control study of quality of life and functional
impairment in women with long-standing vertebral
osteoporotic fracture. Osteoporos Int. 1999;9:508.
15. Shatrugna V, Kulkarni B, Kumar PA. Bone status of
Indian women from a low-income group and its
relationship to the nutritional status. Osteoporos
Int. 2005;16:1827.
16. Chowdury S, Ashrafunnessa, Khatun S, Sarkar NR.
Comparison of BMD between pre-menopausal and
post-menopausal women in Bangladesh. Bangladesh
Med Res Counc Bull. 2001;27(2):48-54.
17. Freedman KB, Kaplan FS, Bilker WB. Treatment of
osteoporosis: are physicians missing an opportunity?
J Bone Joint Surg Am. 2000;82-A:1063.
6
Pre and Postmenopausal Changes of Bone Mineral Density: A Comparative Study done BJM Vol. 22 No. 1

18. Siris ES, Miller PD, Barrett-Connor E. Identification
and fracture outcomes of undiagnosed low bone
mineral density in postmenopausal women: results
from the National Osteoporosis Risk Assessment.
JAMA. 2001;286:2815.
19. Sambrook PN, Dequiker J, Rasp HH. Metabolic bone
disease, Report of a WHO study group. Assessment
of fracture risk and its application to screening for
postmenopausal Osteoporosis. WHO Technical
Report Series, Geneva;1994:5.
20. Gur A, Jale AS, Nas K, Cevik R. The relationship
between educational level and bone mineral density
in postmenopausal women, BMC Fam Pract.
2004;5:18.
21. Lau EMC, Tsai KS, Woo J, Chan NF, Leung PC, Lim
L, et al. Bone mineral density in Hong Kong and
Taiwan Chinese, women: a comparative study.
HKMJ. 1995;1:53-72.
22. Douchi T, Yamamoto S, Oki T, Maruta K, Kuwahata
R, Nagata Y. Relationship between body fat
distribution and bone mineral density in
premenopausal Japanese women. Obstet Gynecol.2000;95(5):722-5.
23. Enchev E, Botushanov N, Dzhambazova E. Bonemineral density in premenopausal andpostmenopausal women between 50-55 and 50-57years of age, Akush Ginekol (sofia). 2007;46(2):7-
14.
24. Keramat A, Patwardhan B, Larijani B, Mithal A,Chakravarty D, Adib H, Khosravi A, et al. Theassessment of osteoporosis risk factors in Iranwomen compared with Indian women, BMC
Musculoskelet Disord. 2008;9:28.
7
BJM Vol. 22 No. 1 Pre and Postmenopausal Changes of Bone Mineral Density: A Comparative Study done

Introduction
Ascaris Lumbricoides, the round worm is one of the
commonest and most widespread human parasites.
It has been estimated that more than one billion
people are infected and that it causes around 6000
death per annum 1. In Asia it was estimated to affect
more than 488 million people, in Europe 45 million,
in Africa 49 million and in North America 3 million.
Thus, possibly one out of every four people in the
world’s population is infected2. The incidence of
Ascariasis varies widely from region to region
including region within Asia. It is low in central Asian
Republics where high temperature and widespread
desert areas are unfavorable to the transmission of
helminthes but in humid areas infection may be very
common. In Africa infection rates up to 95% of the
population have been reported2.
Intestinal Ascariasis is very common condition in our
country although there is no population based
representative data. It thrives under condition of poor
sanitation, where warm, humid soil facilitates
embryonation of the eggs in the environment3.
Bangladesh is one of the under developed country of
the world lying in subtropical zone. The literacy rate
here is very low, so also is the knowledge of
sanitation and awareness of the disease and in
addition living standard of majority of the people are
also low. The vast majority of the people living in
rural areas depend on agriculture as a mean for
earning, where faeces are used as agricultural
fertilizer, occupation presents a very important
problem in Ascariasis2. Because of overcrowding in
town of non industrialized country where planning
has been unable to keep up with the population
increase, the prevalence of infection may be higher
in urban than in rural areas3.
Infestation with Ascaris Lumbricoides is endemic and
prevalent in Asia, Africa and South America. Intestinal
Ascariasis is also very common condition in our
country.
PRESENTATION OF BILIARY ASCARIASIS : A STUDYOF 30 CASESHASINA BEGUM1, MM RAHMAN1, M SALAHUDDIN2, F AHMED3, A HOSSAIN4.
1. Department of Radiology and Imaging DMCH.
2. Assistant Prof. (Ex), Department of Pharmacology, Bangladesh Medical College, Dhanmondi, Dhaka.
3. Professor, Department of Gastroenterology, DMCH.
4. Professor (Retd), Department of Radiology and Imaging, DMCH
Bangladesh is one of the underdeveloped countries
of the world lying in subtropics zone. The standard ofliving of the majority of the people of Bangladesh islow in addition.
The knowledge of sanitation and awareness of diseaseand consequences of the disease are minimum. Alion share of the people living in the villages dependson agriculture as mean of earning. In addition,environmental factors and lack of basic sanitationfavour the growth of parasites mainly AscarisLumbricoides all over the country.
The mature worm inhabitants in the gastrointestinaltract commonly causes abdominal discomfort or colicand may be vomited or passed per rectum. Anentangled mass of worm, from a bolus may produceintestinal obstruction, appendicitis, perforation ofpre-existing ulcer of stomach and duodenum4. In caseof heavy infestation it contributes to malnutrition.
Migration of the worm into the biliary tree andpancreatic duct via Ampulla of Vater giving rise toupper abdominal colic, nausea, vomiting, pyogeniccholangitis, stone formation around the ova of deadadult worm, obstructive jaundice, ductal stricture ofeven liver abscess secondary to infection andobstruction of the bilary tree. Uncommonly acutepancreatitis may result from pancreatic ductobstruction by the round worm. Evencholangiocarcinoma may develop.
Biliary complication of round worm is common in
Bangladesh as well as in China & India5. It is also
found in certain parts of USA where immigration from
southeast asia are more. But biliary complications of
round worm are not well documented in Bangladesh
some sporadic expect case reports.
Aim of the study
The aim of the study is to see the clinical profile of
biliary ascariasis in our country.
Materials and Methods
A total of thirty (30) patients were included in this
study depending on their ultrasonographic findings
Bangladesh J Medicine 2011; 22 : 8-11

irrespective of their age, sex and occupation. The
cases were collected from Dhaka Medical College
Hospital, BSMMU and different private hospitals of
Dhaka city from June 2004 to June 2005.
Ultrasonographic Appearance of Biliary Ascariasis
Following were the criteria set for diagnosis of Biliary
Ascariasis ultrasonographically.6
- On longitudinal scan : Linear echogenic structures
without acquastic shadowing.
- On transverse scan : A tube within a tube – “
Target sign” or “ Bull’s eye Sign”.
- Dilatation of biliary tree.
- When infestation is heavy, multiple worms may
lie adjacent to each other within a distended bile
duct, giving a spaghetti like appearance.
- During scan the live moving worm could be seen
also.
Observations and Results
Sex distribution of the patients
Out of the first thirty (30) patients, eleven (11) were
male and the rest nineteen (19) were female. So, about
37% of this patients were male and 63% were
female.(Table - 1)
Table – I
Sex distribution of patients (n = 30)
Sex No Percentage(%)
Male 11 37
Female 19 63
Total 30 100
Age distribution of the patients
The age range of the patients included in this study
was from 19 years to 70 years. Eighteen (18) patients
were within the range of 20 – 40 years (60%), Eleven
(11) patients were more than forty (40) years old
(36.6%) and one (01) patient was less than twenty
(20) years old (3.33%). (Table - II)
Table – II
Age distribution of the patients
Age group(years) No Percentage(%)
>40 11 36.66
20 - 40 18 60.00
<20 01 03.33
Total 30 100.00
Occupation of the patients
Among thirty (30) patients, eighteen (18) were
housewife (60%) and seven (07) were small
businessman (23.3%), three (03) were service holder
(10%) and two (02) were day labourer (6.66%). Among
this female out of 19 (nineteen) all but one (01) was
housewife (95%). That one (01) was a school teacher
(0.05%), (Table-III)
Table – III
Occupation of the patients (N=30)
Occupation No Percentage(%)
Housewife 18 60
Businessman 07 23.3
Service holder 03 10
Day laborers 02 6.66
Total 30 100.00
Table – IV
Occupation among the female patients (N=19)
Occupation No Percentage (%)
Housewife 18 95
Service 01 05
Total 19 100
Economic status of the patients
Out of thirty (30) patients, twenty (20) belong to lower
middle class (66.6%) and rest ten (10) belong to lower
economic class (33.3%).(Table - IV)
Table – V
Economic status of the patients (n=30)
Economic status No Percentage (%)
Lower middle class 20 66.66
Lower class 10 33.33
Total 30 100.00
Symptom of the patients
Main presenting symptoms were recorded in all
patients. Recurrent upper abdominal pain was the
main presenting symptom in all thirty (30) patients
(100%). followed by vomiting in fourteen (14) patients
(46.6%), fever in nine (09) patients (30%), jaundice in
three (03) patients (10%).(Table - VI)
9
BJM Vol. 22 No. 1 Presentation of Biliary Ascariasis : A Study of 30 Cases
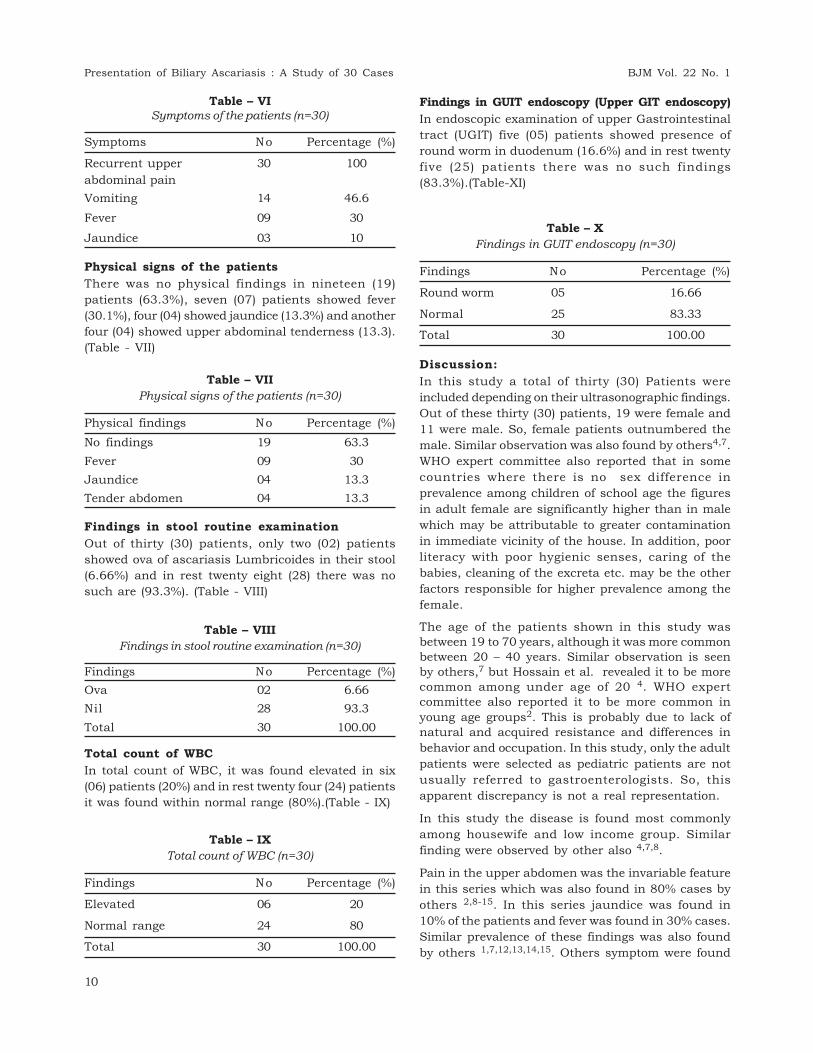
Table – VI
Symptoms of the patients (n=30)
Symptoms No Percentage (%)
Recurrent upper 30 100
abdominal pain
Vomiting 14 46.6
Fever 09 30
Jaundice 03 10
Physical signs of the patients
There was no physical findings in nineteen (19)
patients (63.3%), seven (07) patients showed fever
(30.1%), four (04) showed jaundice (13.3%) and another
four (04) showed upper abdominal tenderness (13.3).
(Table - VII)
Table – VII
Physical signs of the patients (n=30)
Physical findings No Percentage (%)
No findings 19 63.3
Fever 09 30
Jaundice 04 13.3
Tender abdomen 04 13.3
Findings in stool routine examination
Out of thirty (30) patients, only two (02) patients
showed ova of ascariasis Lumbricoides in their stool
(6.66%) and in rest twenty eight (28) there was no
such are (93.3%). (Table - VIII)
Table – VIII
Findings in stool routine examination (n=30)
Findings No Percentage (%)
Ova 02 6.66
Nil 28 93.3
Total 30 100.00
Total count of WBC
In total count of WBC, it was found elevated in six
(06) patients (20%) and in rest twenty four (24) patients
it was found within normal range (80%).(Table - IX)
Table – IX
Total count of WBC (n=30)
Findings No Percentage (%)
Elevated 06 20
Normal range 24 80
Total 30 100.00
Findings in GUIT endoscopy (Upper GIT endoscopy)
In endoscopic examination of upper Gastrointestinal
tract (UGIT) five (05) patients showed presence of
round worm in duodenum (16.6%) and in rest twenty
five (25) patients there was no such findings
(83.3%).(Table-XI)
Table – X
Findings in GUIT endoscopy (n=30)
Findings No Percentage (%)
Round worm 05 16.66
Normal 25 83.33
Total 30 100.00
Discussion:
In this study a total of thirty (30) Patients were
included depending on their ultrasonographic findings.
Out of these thirty (30) patients, 19 were female and
11 were male. So, female patients outnumbered the
male. Similar observation was also found by others4,7.
WHO expert committee also reported that in some
countries where there is no sex difference in
prevalence among children of school age the figures
in adult female are significantly higher than in male
which may be attributable to greater contamination
in immediate vicinity of the house. In addition, poor
literacy with poor hygienic senses, caring of the
babies, cleaning of the excreta etc. may be the other
factors responsible for higher prevalence among the
female.
The age of the patients shown in this study wasbetween 19 to 70 years, although it was more commonbetween 20 – 40 years. Similar observation is seenby others,7 but Hossain et al. revealed it to be morecommon among under age of 20 4. WHO expertcommittee also reported it to be more common inyoung age groups2. This is probably due to lack ofnatural and acquired resistance and differences inbehavior and occupation. In this study, only the adult
patients were selected as pediatric patients are not
usually referred to gastroenterologists. So, this
apparent discrepancy is not a real representation.
In this study the disease is found most commonly
among housewife and low income group. Similar
finding were observed by other also 4,7,8.
Pain in the upper abdomen was the invariable feature
in this series which was also found in 80% cases by
others 2,8-15. In this series jaundice was found in
10% of the patients and fever was found in 30% cases.
Similar prevalence of these findings was also found
by others 1,7,12,13,14,15. Others symptom were found
10
Presentation of Biliary Ascariasis : A Study of 30 Cases BJM Vol. 22 No. 1
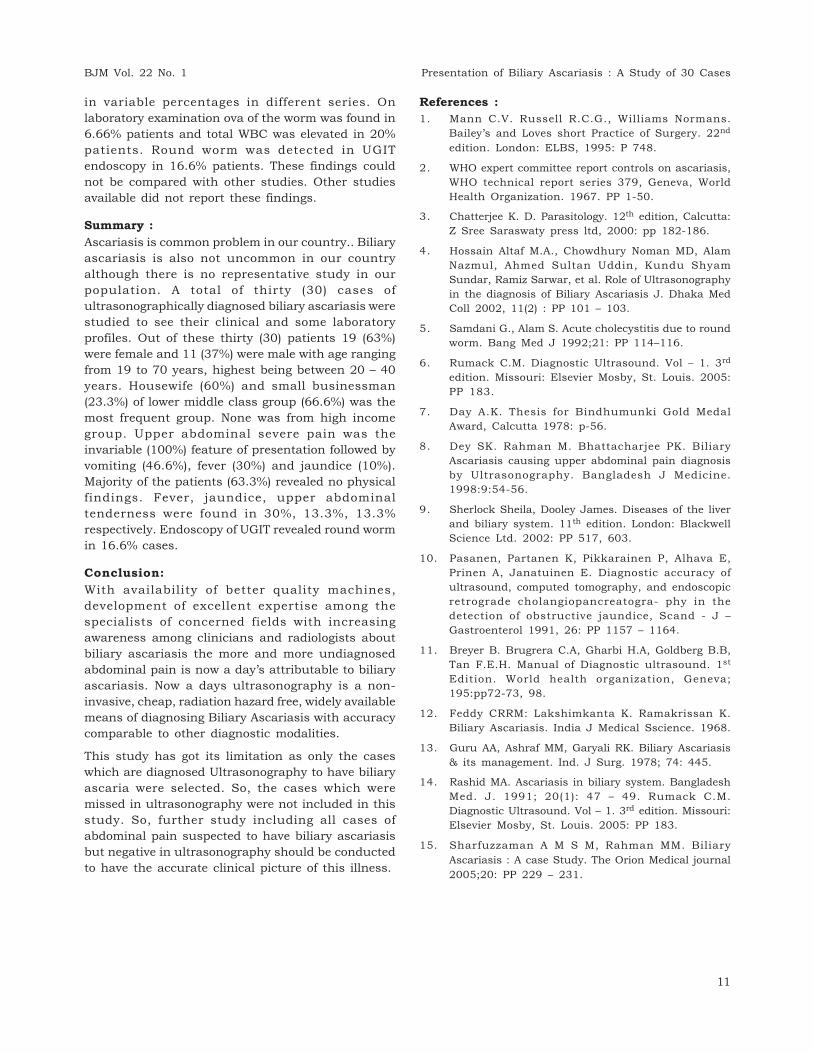
in variable percentages in different series. On
laboratory examination ova of the worm was found in
6.66% patients and total WBC was elevated in 20%
patients. Round worm was detected in UGIT
endoscopy in 16.6% patients. These findings could
not be compared with other studies. Other studies
available did not report these findings.
Summary :
Ascariasis is common problem in our country.. Biliary
ascariasis is also not uncommon in our country
although there is no representative study in our
population. A total of thirty (30) cases of
ultrasonographically diagnosed biliary ascariasis were
studied to see their clinical and some laboratory
profiles. Out of these thirty (30) patients 19 (63%)
were female and 11 (37%) were male with age ranging
from 19 to 70 years, highest being between 20 – 40
years. Housewife (60%) and small businessman
(23.3%) of lower middle class group (66.6%) was the
most frequent group. None was from high income
group. Upper abdominal severe pain was the
invariable (100%) feature of presentation followed by
vomiting (46.6%), fever (30%) and jaundice (10%).
Majority of the patients (63.3%) revealed no physical
findings. Fever, jaundice, upper abdominal
tenderness were found in 30%, 13.3%, 13.3%
respectively. Endoscopy of UGIT revealed round worm
in 16.6% cases.
Conclusion:
With availability of better quality machines,
development of excellent expertise among the
specialists of concerned fields with increasing
awareness among clinicians and radiologists about
biliary ascariasis the more and more undiagnosed
abdominal pain is now a day’s attributable to biliary
ascariasis. Now a days ultrasonography is a non-
invasive, cheap, radiation hazard free, widely available
means of diagnosing Biliary Ascariasis with accuracy
comparable to other diagnostic modalities.
This study has got its limitation as only the cases
which are diagnosed Ultrasonography to have biliary
ascaria were selected. So, the cases which were
missed in ultrasonography were not included in this
study. So, further study including all cases of
abdominal pain suspected to have biliary ascariasis
but negative in ultrasonography should be conducted
to have the accurate clinical picture of this illness.
References :
1. Mann C.V. Russell R.C.G., Williams Normans.
Bailey’s and Loves short Practice of Surgery. 22nd
edition. London: ELBS, 1995: P 748.
2. WHO expert committee report controls on ascariasis,
WHO technical report series 379, Geneva, World
Health Organization. 1967. PP 1-50.
3. Chatterjee K. D. Parasitology. 12th edition, Calcutta:
Z Sree Saraswaty press ltd, 2000: pp 182-186.
4. Hossain Altaf M.A., Chowdhury Noman MD, Alam
Nazmul, Ahmed Sultan Uddin, Kundu Shyam
Sundar, Ramiz Sarwar, et al. Role of Ultrasonography
in the diagnosis of Biliary Ascariasis J. Dhaka Med
Coll 2002, 11(2) : PP 101 – 103.
5. Samdani G., Alam S. Acute cholecystitis due to round
worm. Bang Med J 1992;21: PP 114–116.
6. Rumack C.M. Diagnostic Ultrasound. Vol – 1. 3rd
edition. Missouri: Elsevier Mosby, St. Louis. 2005:
PP 183.
7. Day A.K. Thesis for Bindhumunki Gold Medal
Award, Calcutta 1978: p-56.
8. Dey SK. Rahman M. Bhattacharjee PK. Biliary
Ascariasis causing upper abdominal pain diagnosis
by Ultrasonography. Bangladesh J Medicine.
1998:9:54-56.
9. Sherlock Sheila, Dooley James. Diseases of the liver
and biliary system. 11th edition. London: Blackwell
Science Ltd. 2002: PP 517, 603.
10. Pasanen, Partanen K, Pikkarainen P, Alhava E,
Prinen A, Janatuinen E. Diagnostic accuracy of
ultrasound, computed tomography, and endoscopic
retrograde cholangiopancreatogra- phy in the
detection of obstructive jaundice, Scand - J –
Gastroenterol 1991, 26: PP 1157 – 1164.
11. Breyer B. Brugrera C.A, Gharbi H.A, Goldberg B.B,
Tan F.E.H. Manual of Diagnostic ultrasound. 1st
Edition. World health organization, Geneva;
195:pp72-73, 98.
12. Feddy CRRM: Lakshimkanta K. Ramakrissan K.
Biliary Ascariasis. India J Medical Sscience. 1968.
13. Guru AA, Ashraf MM, Garyali RK. Biliary Ascariasis
& its management. Ind. J Surg. 1978; 74: 445.
14. Rashid MA. Ascariasis in biliary system. Bangladesh
Med. J. 1991; 20(1): 47 – 49. Rumack C.M.
Diagnostic Ultrasound. Vol – 1. 3rd edition. Missouri:
Elsevier Mosby, St. Louis. 2005: PP 183.
15. Sharfuzzaman A M S M, Rahman MM. Biliary
Ascariasis : A case Study. The Orion Medical journal
2005;20: PP 229 – 231.
11
BJM Vol. 22 No. 1 Presentation of Biliary Ascariasis : A Study of 30 Cases
HOW ACCURATELY PHYSICIANS MEASURE BLOODPRESSURE- AN OBSERVATIONAL STUDY IN ENAMMEDICAL COLLEGE AND HOSPITAL, SAVARRUKHSANA PARVIN1, MD. NAZMUL HAQUE2, MD IMRAN ALI3,MOHAMMAD MAHBUBUL ALAM3, AKM
RAFIQUEUDDIN4
Abstract
Objective: The key to blood Pressure (BP) control is good BP measurement. If BP measurements are
not done accurately and reliably, there is a potential for great harm and great cost. Measuring blood
pressure is a routine procedure but errors are frequently committed during recording. The aim of the
study was to look at the prevalent practices in the institute regarding BP recording.
Methods and Materials: This study was conducted in the department of Medicine, Surgery
and Gynaecology and Obstetrics in Enam Medical College, Savar. This is an prospective
observational study performed amongst 50 doctors in EMCH. Doctors in each three departments
were observed by one observer in each department during the act of BP recording. The observer
was well versed with the guidelines issued by British Hypertension Society (BHS) and the deviations
from the standard set of guidelines were noted. The errors were defined as deviations from these
guidelines. The results were recorded as percentage of doctors committing these errors and analysis
of results was done manually with percentage and number.
Results: In our study, 100% doctors used aneroid type sphygmomanometer. Ninety percent of
apparatus were without error. Ninety six percent of the BP cuff was of standard size. Twenty two
percent of the doctors did not let the patient rest before recording BP. None of them recorded BP in
both arms. In outpatient setting, 70% recorded blood pressure in sitting position and 30% in supine
position. In 44% patients where BP was recorded in sitting position BP apparatus was below the
level of heart and 60% did not have their arm supported. Eighty four percent did not use palpatory
method before checking the BP by auscultation. Sixty percent lowered the BP at a rate of more than
2 mm/s. Seventy six percent recorded BP only once and 75 % of the rest reinflated the cuff without
completely deflating and allowing rest before a second reading was obtained.
Conclusion: Although the assessment of BP is the most cost-effective procedure in medicine, it is
rarely performed according to guidelines. Efforts should be taken to improve the practice of BP
measurement which would have a major impact on the health of the population
Keywords: Aneroid, palpatory method, auscultatory method.
1. Assistant Professor, Dept of Medicine, Enam Medical College
2. Assistant Registrar,Dept of Medicine, Enam Medical College
3. Internee doctor ,Dept of Surgery, Enam Medical College
4. Professor and Head of the Department of Medicine, Enam Medical College
Introduction
The blood pressure (BP) measurement is one of the
commonly performed procedures by the doctors.Raised blood pressure (hypertension) is a commoncondition that does not have specific clinicalmanifestations until target organ damage develops1
Routine screening of all the patients, especially highrisk patients, is the only way of detecting hypertensionearly and initiate treatment before target organdamage becomes evident.2 Accurate measurement of
BP is importance for labeling a patient as
hypertensive. Consistently underestimating the BP
by 5 mm Hg could result in two-thirds of hypertensive
patients being missed and over estimating it by 5
mm Hg could more than double the number of
patients being diagnosed as hypertensive.3 Missing
the diagnosis in a hypertensive patient could result
in significant morbidity and mortality due to lack of
treatment. Over diagnosis results in inappropriate
labeling and treatment of healthy individuals. Most
of us are aware of the exact methodology of recording
of BP, yet most of us commit errors frequently
resulting in erroneous high or low recording.
The measurement of BP in clinical practice is done
by a century old Riva-Rocci/Korotkoff technique. The
accurate measurement is dependent on the accurate
transmission and interpretation of a signal (Korotkoff
Bangladesh J Medicine 2011; 22 : 12-16

sound or pulse wave) from a subject via a device (the
sphygmomanometer) to an observer4 Errors in
measurement can occur at each point but the
commonest fallible component is the observer.4
Despite the clear guidelines on BP measurement
technique, there seems to be large inter-observer
variations, both among nursing staff and physicians
as well as between the two groups. In an article by
Graves and Ships in the American Journal of
Hypertension , the authors are of opinion that
‘physicians do not measure BP well, and even if they
do, the usefulness of their BP measurements is
significantly compromised by the white coat effect.’5
The general belief amongst the researchers is that
physicians dealing with diagnosis and treatment of
hypertension do not follow the international society
guidelines.6 In a study by Perloff et al.7, it was found
that nursing staff abided by 40% of the recommended
procedures while medicine teachers, physicians and
residents abided by approximately 70%.8The wide gaps
in the basic theoretic and practical knowledge seem
to be common among interns and first-year family
practice residents resulting in erroneous
measurements.9 In an interesting observational
study, carried out at the Westminster Medical School
in London, showed that 33% out of 80 doctors in
training grades/junior hospital doctors, acknowledged
no formal education on how to measure BP, a finding
confirmed further by the poor accuracy in BP
measurement displayed by one-third of the study
group.10 There has not been many study done in
Bangladesh regarding objective performance of blood
pressure recording according to guideline. This study
was done to observe the practice of blood pressure
recording of physicians in tertiary care hospital and
to identify the pitfall.
Objectives: Our objective was to notice the commonerrors committed during routine blood pressurerecording by the residents and consultants
Methods and Materials
A prospective, observational study was performedamongst 50 doctors (10 consultants and 40 residents).The consultants belonged to the department ofmedicine, surgery and gynaecology and the residents
included interns, house physicians and indoor medical
officer. The study was conducted over a period of 2
months. A single observer from each department were
trained uniformly regarding blood pressure
measurement according to British Hypertension
Society (BHS) and tested clinically by principal
investigator for accuracy and consistency. A single
observer in each department observed the enrolled
subjects during the act of BP recording without any
one of them being aware of the fact that they were
being observed. The common errors committed were
noted in a performance after having observed them
but the recording physicians were not informed
regarding the study procedure of observer. Some
participants were observed again to note the practices
that had been missed during the first observation.
The observer recorded the finding retrospectively in
a structured case report form.
The errors were defined as variations from the
standard set of instructions issued by British
Hypertension Society( BHS)11 This variation from the
standard guidelines were further analyzed and
recorded as percentage of doctors committing these
individual errors. At the end of the study the erring
doctors were apprised of the results of the study and
were told about the standard guidelines.
Results
Fifty study subjects were observed in different
departments of Enam Medical College Hospital
(EMCH) for their blood pressure recording techniques.
In this study, 100% doctors used aneroid type
sphygmomanometer. 90% of apparatus were without
error. 96% of the BP cuff was of standard size. 22%
of the doctors did not let the patient rest before
recording BP. None of them recorded BP in both arms.
In outpatient setting, 70% recorded blood pressure
in sitting position and 30% in supine position. In
44% patients where BP was recorded in sitting
position BP apparatus was below the level of heart
and 60% did not have their arm supported. 84% did
not use palpatory method for noticing systolic BP and
58% did not raise pressure 20-30 mm Hg above the
systolic level before checking the BP by
auscultation.60% lowered the BP at a rate of more
than 2 mm/sec . 76% recorded BP only once and 75%
13
BJM Vol. 22 No. 1 How accurately Physicians Measure Blood Pressure- An Observational Study

of the rest reinflated the cuff without completely
deflating and allowing rest before a second reading
was obtained.
Discussion
The blood pressure in all the individuals varies
considerably throughout the day. A variety of
activities affects the BP and causes it to increase.
Simple activities of daily routine like eating, dressing,
commuting to work, talking on telephone and
attending a meeting raises systolic BP by an average
10-20 mm Hg and diastolic BP by 8-15 mm Hg.3
Numerous studies have proven time and again that
the various exogenous factors also interfere with the
accurate measurement of BP.12,13,14,15,16,17,18. The
important factors being talking, exposure to cold,
ingestion of alcohol and medications especially
antihypertensive drugs.12,13,14 Errors during the
process of BP measurement also contribute to the
erroneous reading.
There are only three sources of errors while BP is
being recorded. These are observer bias, faulty
equipment and failure to standardize techniques of
measurement19.While it may not be possible to do
anything for observer bias but following a standardized
technique and using a good equipment may help to
reduce the error rate to a great extent.
It is well known that mercury instruments provide
the most accurate records and are the preferred
instrument in hospital settings .20 Aneroid
sphygmomanometers are increasingly used due to
ease of handling21but are a source of error if not
maintained properly22 .Since the majority recording
apparatus in our hospital are aneroid based, so 100%
of our recordings were made on them.
The defective apparatus may give a false high or low
BP reading. Similarly, the BP in the dominant hand
is usually higher 1 .Failure to record these facts may
lead to differences in the subsequent BP recordings.
Unfortunately this fact is commonly ignored and not
recorded, as was evident in our study.
It has been shown in a recent study that both the
bell and the diaphragm give equal results when used
for office measurement of BP.23 still the diaphragm
is preferred in clinical practice, as was in our study.
The reason for this lies in it being easier to secure
with the fingers of one hand and also that it covers a
larger area.4
In a survey of 114 doctors conducted by McKay et al
97% doctors used inappropriate cuff size.24 It
indicates that it is a common mistake made by most
of the doctors. It is known that if the cuff is too small
as in the case of a fat patient the systolic BP will be
recorded falsely low by up to 8 mm Hg and diastolic
BP will be recorded high by up to 8 mm Hg.17Our
findings are not different from these observations.
The failure to remove the clothing further adds to
the arm circumference, hence erroneous recording.
A number of studies have shown that measurement
of BP in obese and large muscular arms requires
adjustments. Monograms for adjusting BP recording
in the obese are inadequate. The most important
factor is choosing the correct cuff width-arm
circumference (CW/AC) ratio. Such action reduces
the intersubject variability of BP measurement in
clinical settings.25
It is known that a number of activities of daily living
raise the BP3 and a period of rest before measuring
BP may return it to normal level. Failure to do so may
result in falsely high BP recording. Still 70% of our
study group doctors did not wait and let the patient
rest for some time before recording BP in the OPD.
In a study by McKay et al. this figure was 97%.24
None of our study group doctors recorded BP in both
arms, which is much more than 77% reported in the
literature.22
It is well established that if the BP is only measured
in the supine position the systolic BP may increase
by 3 mm Hg and the diastolic BP will be recorded
lower by 3-5 mm Hg.15,26 It would be worthwhile to
record BP in both supine and sitting position if
possible or at least the position in which the BP is
recorded should be mentioned in the records. This
would be helpful in follow-up visits by the patient.
Unfortunately this fact is taught in the clinics but
not followed by majority of us while recording BP,
especially in the outpatient department.
If the position of the arm is either above or below the
heart level the BP may be recorded false high or low.
For every 10 cm above or below the heart level the
systolic BP decreases (if above) by 8 mm Hg and
increases (if below).15Similar changes are seen in
the diastolic BP with change in the position of arm in
relation to the heart level.15 If the arm is not
supported the systolic and diastolic pressures will
be recorded high by 2 mm Hg.15 Our study showed
that this fact is commonly forgotten during BP
recording in the outpatient department.
About 60% of our study group doctors did not use
palpatory method for noticing systolic BP initially and
70% did not raise pressure 30-40 mm Hg above the
systolic level before checking the BP by auscultation.
McKay et al. in their study noted similar figures,
where the number of such doctors was 61%.24
14
How accurately Physicians Measure Blood Pressure- An Observational Study BJM Vol. 22 No. 1

About 60% in our study group deflated the cuff at a
rate of more than 2 mm/s which is little variationto
82% in another study.24 Also 76% in our study group
recorded BP only once and 75% of the rest reinflated
the cuff without completely deflating and allowing rest
before a second reading was obtained. This may
further increase the incidence of erroneous recording
in clinical practice. In one study by Jamieson et al. it
was observed that the first systolic BP was on an
average 3-4 mm Hg higher while the diastolic BP was
not different when recorded twice.26 Complete
deflation of the cuff and allowing a few minutes rest
between two consecutive measurements may
circumvent this problem, however, this is not routinely
done. The authors of this study have suggested an
alternative, that taking two measurements and
recording the average would help in reducing the
errors, when the BP exceeds 155/90 mm Hg.26
There is tendency by physicians to expect either a
high or low BP. This results in rounding off the systolic
and diastolic BP to the nearest 5-10 mm Hg, which
may result in erroneous high or low BP recording.18
A British study carried out in 18 practices and 67 GP
offices showed digit bias in systolic and diastolic
readings to the nearest 10 mm Hg.27 Also 60% of the
doctors in our study group had a digit preference to
the nearest 5-10 mm Hg. Both under estimation or
over estimation of BP, due to this bias, could have
enormous reflection on the sheer numbers of the
patients either missed or over diagnosed.3
The most recent recommendations of AHA suggest
that the auscultatory technique with a trained
observer and mercury sphygmomanometer to be the
method of choice for measurement of BP. Proper
training of observers, positioning of the patient, and
selection of appropriate cuff size are all essential.20
However, training can reduce, but not abolish, these
inaccuracies. Taking multiple BP measurements
before making clinical decisions can limit the effect
of these inaccuracies.28
Reevs points out that the efficient practitioner can
reserve the proper method for 10-20% of patients who
have known or newly detected elevated BP,
cardiovascular damage, other risk factors or are
receiving antihypertensive therapy.29 This would go
a long way in preventing the errors in patients where
it matters the most.
Conclusion
Accurate measurement of the BP is very important in
the clinical setting. It is a vital parameter to access
and modify cardiovascular risk factors. Very commonly
errors are committed during these simple procedures
and efforts should be made to minimize them by
following the international guidelines. This study
looks at the practices prevalent in a teaching hospital
and proves that accurate measurement of BP is not
difficult provided we know the exact methodology and
follow it too. The tendency to create shortcuts is likely
to result in erroneous high or low recording. We can
correct our mistakes only if we are made aware of
them.
References
1. McAlister FA, Straus SE. Measurement of blood
pressure: an evidence based review. BMJ
2001;322:908-11.
2. Litenberg BA. Practice guidelines revisited:
screening for hypertension. Ann Intern Med
1995;122:937-9
3. Campbell NR, McKay DW. Accurate blood pressure
measurement: why does it matter? Can Med Assoc
J 1999;161:277-8.
4. Beevers G, Lip GY, O’Brien E. Conventional
sphygmomanometry: technique of auscultatory blood
pressure measurement. BMJ 2001;322:1043-7.
5.Graves JW, Sheps SG. Does evidence-based
medicine suggest that physicians should not be
measuring blood pressure in the hypertensive
patient? Am J Hypertens 2004;17:354-60.
6. Vancheri F, Alletto M, Sidoti P. Does this patient
have hypertension? Different methodologies in the
measurement of arterial pressure. Recenti Prog Med
2003;94:106-9. [Article in Italian]
7. Perloff D, Grim C, Flack J, Frohlich ED, Hill M,
McDonald M. Human blood pressure determination
by sphygmomanometry. Circulation 1993;88:2460-
7.
8. Veiga EV, Nogueira MS, Carnio EC, Marques S,
Lavrador MA, Souza LA, et al. Assessment of the
techniques of blood pressure measurement by health
professionals. Arq Bras Cardiol 2003;80:89-93.
9. McKay DW, Raju MK, Campbell NR. Assessment of
blood pressure measurement techniques. Med Educ
1992;26:208-12.
10. Feher M, Harris-St John K, Lant A. Blood pressure
measurement by junior hospital doctors - a gap in
medical education. Health Trends 1992;24:59-61
11. The British Hypertension Society. Blood pressuremeasurement CD ROM. London. BMJ books 1998
12. Le Pailleur C, Helft G, Landais P, Montgermont P.The effect of talking, reading and silence on the“White coat” phenomenon in hypertensive patients.Am J hypertens 1998;11:203-7.
13. Scriven AJ, Brown MJ, Murphy MB, Dollery CT.
Changes in blood pressure and plasma
catacholamines caused by tyramine and cold
exposure. J Cardiovasc Pharmacol 1984;6:954-60.
15
BJM Vol. 22 No. 1 How accurately Physicians Measure Blood Pressure- An Observational Study

14. Potter JF, Watson RD, Skan W, Beever DG. The
pressor and metabolic effects of alcohol in
normotensive subjects. Hypertension 1986;8:625-
31.
15. Neeta RT, Smiths P, Lenders JW, Thein T. Does it
matter whether blood pressure measurement are
taken with subjects sitting or supine? J Hypertens
1998;16:263-8.
16. Wall manning HJ, Pauline JM. Effect of arm position
and support on blood pressure reading. J Clin
Hypertens 1987;3:624-30.
17. Russel AE, Wing LM, Smith SA, Aylward PE, Ritchie
RJ. Optimal size of cuff bladder for indirect
measurement of arterial pressure in adults. J
Hypertens 1989;7:607-13. 18.Neufeld PD, Jhonson
DL. Observer error in blood pressure measurement.
Can Med Asso J 1986;135:633-7.
19. Baily RH, Bauer JH. A review of common errors in
the indirect measurement of blood pressure. Arch
Intern Med 1993;153:2741-8
20. Pickering TG, Hall JE, Appel LJ, Falkner BE, Graves
J, Hill MN, et al. Recommendations for blood
pressure measurement in humans and experimental
animals: part 1: blood pressure measurement in
humans: a statement for professionals from the
subcommittee of professional and public education
of the american heart association council on high
blood pressure research. Circulation 2005;111:697-
716.
21. Décio MJ, Geraldo Pierin AM, Ines L, Fernando N.
Devices and Techniques for Blood Pressure
Measurement and Criteria for Hypertension Adopted
by Brazilian Physicians. Explorat Study Arq Bras
Cardiol 2002;1:79
22. Canzanello VJ, Jensen PL, Schwartz GL. Are
aneroid sphygmomanometers accurate in hospital
settings. Arch Intern Med 2001;161:729-31.
23. Kantola I, Vesalainen R, Kangassalo K, Kariluoto A.
Bell or diaphragm in the measurement of blood
pressure? J Hypertens 2005;23:499-503.
24. McKay DW, Campbell NR, Parab LS, Chokalingam
A, Fodor JG. Clinical assessment of blood pressure.
J Hum Hypertens 1990;4:639-45.
25. Prineas RJ. Measurement of blood pressure in the
obese. Ann Epidemiol 1991;1:321-36.
26. Jamieson MJ, Webster J, Philips S, Jeffers TA, Scott
AK, Robb OJ, et al. The measurement of blood
pressure: sitting or supine, once or twice? J
Hypertens 1990;8:635-40. 27.Ali S, Rouse A.
Practice audits: reliability of sphygmomanometers
and blood pressure recording bias. J Hum Hypertens2002;16:359-61
28. Kay LE. Accuracy of blood pressure measurementin the family practice center. J Am Board Fam Pract.1998;11:252-8.
29. Reevs RA. Does this patient have hypertension?How to measure blood pressure. JAMA 1995;273:1211-8.
16
How accurately Physicians Measure Blood Pressure- An Observational Study BJM Vol. 22 No. 1

Introduction:
Chronic liver disease (CLD) is a common hepatobiliary
problem encountered in day to day clinical practice
in Bangladesh. CLD can occur at any age & often
causes prolonged morbidity & is an important cause
of premature death. The patient who we come across
in the hospital ward is mostly in advanced stage with
overt clinical manifestation and/or complication.
Among them most important life threatening
condition is vomiting out of blood (Haematemesis) &
malaena due to ruptured esophageal varices. Although
90% of patients with cirrhosis develop varices, only
30% of them bleed and 30 – 50% die of the first
episode.1 Two thirds of the survivors will rebleed
A STUDY OF HYPOALBUMINAEMIA IN CHRONICLIVER DISEASE AND ITS CORRELATION WITHDEVELOPMENT OF ESOPHAGEAL VARICESS F HOSSAIN1, Q T ISLAM2, M R SIDDIQUI3, A HOSSAIN4, N JAHAN5, Y U RAHMAN6, M J IQBAL7
Abstract
Background: The aim and objective of this study was to evaluate relationship of serum albumin
and esophageal varices in chronic liver disease (CLD) admitted in the medicine unit and
gastroenterology department of Dhaka Medical College Hospital.
Method: In this cross-sectional study, a total number of 100 randomly selected, clinically diagnosed
patients of chronic liver disease were studied from June 2010 to November 2010 (6 months). All
patients were assessed as per Child-Pugh class and had full blood count, HBsAg, Anti-HCV
antibodies by ELISA, abdominal ultrasound and Endoscopy of upper gastrointestinal tract. Patients
were divided into Group A (serum albumin <3.5 gm%) and Group B (3.55).
Result: Seventy-three male (73%) and twenty seven female patients (27%)] with age range of 16 to
75 years were evaluated. Out of 100 patients 24% were in between 46-55 years age group. 63%
patient fall in child Pugh class A group, 32% fall in child Pugh class B & 5% fall in child Pugh class
C. Mean Serum albumin was 3.8 gm%, (range 2.4-4.9). Esophageal varices (EV) were present in 32
patients (32%) and absent in 68 patients (68%). Group A had 29 patients (29% of the total) with 18
patients (62.06%) having EV. Group B had 71 patients (71% of the total) with 14 patients (19.71%)
having EV. Sensitivity of hypoalbuminaemia as a marker of EV was 56% and specificity 83.8%,
positive predictive value 62.06% and negative predictive value 80.2% and Odds ratio was 6.6. P
value is <0.001.
Conclusion: In Group A that is hypoalbuminaemia (<3.5 gm%), the incidence of Esophageal varices
was more than Group B that is albumin level (>3.5gm%). Hypoalbuminemia is a good surrogate
marker for the presence of esophageal varices in CLD.
Key Words: Chronic liver disease, hypoalbuminaemia, esophageal varices
1. Junior Consultant, Dept. of Medicine, United Hospital Dhaka,
2. Professor (PRL), Dept. of Medicine, Dhaka Medical College,
3. Senior Medical Officer, EECP Heart Therapy, The Medical Centre, Dhaka,
4. Assistant Professor, Dept. of Medicine, Dhaka Medical College,
5. Student, FCPS Medicine P-II Course, Dhaka Medical College,
6. Assistant Registrar, Dept. of Neurology, Dhaka Medical College Hospital,
7. Student, FCPS Medicine P-II Course, Dhaka Medical College,
within six months if not treated with prophylactic â-
blockers or endoscopic therapy.2
Albumin (50%-60% of total plasma protein), globulin,
and fibrinogen make up the major share of plasma
proteins with 24%-56% increased risk of death per
2.5 g% fall in serum albumin.3,4 Child-Pugh score
(serum albumin being integral part of the score)
predicts advanced liver disease.5 Liver produces
albumin at a rate of 130–200 mg/kg/day.3
Hypoalbuminemia in cirrhosis is multifactorial andmay be due to reduced production (liver parenchymareplaced by fibrous tissue), increased removal by
reticuloendothelial system (spleen) or increased loss
through gut 6 (portal gastropathy/enteropathy): all
Bangladesh J Medicine 2011; 22 : 17-20

Fig.-2: Prevalence of hypoalbuminaemia in CLD patients
related to portal hypertension. Hypoalbuminemia
with associated ultrasonographic features e.g. gall-
bladder wall thickness 5 and right liver lobe diameter7
have been cited as non-endoscopic predictors of
esophageal varices. Similarly, Serum Ascitic Albumin
Gradient (the difference between the serum and
ascetic albumin concentration) i.e. SAAG, is thought
to be an indirect marker of portal hypertension,8 with
a high gradient (>1.1 g/dL) indicating portal
hypertension and presence of EV.
Portal hypertension (portal pressure >12 mm Hg or
>5 mm Hg gradient between the wedged hepatic
venous pressure and the free hepatic venous pressure
has been shown in animal studies to induce
hypoalbuminemia.9 Conversely, serum albumin is
increased by 20% when portal pressure is reduced
after Trans jugular Intra-hepatic Porto-systemic
Shunt Procedure suggesting a link between portal
hypertension and hypoalbuminaemia.
Materials and Methods:
In this cross-sectional study, a total number of 100
randomly selected, clinically diagnosed patients of
chronic liver disease were studied for a period of June
2010 to November 2010 (6 months) at medicine units
and gastroenterology department of Dhaka Medical
College Hospital. Clinically CLD diagnosed interlaying
one or more stisgment or child. All patients were
assessed as per Child-Pugh class and had full blood
count, HBsAg, Anti-HCV antibodies by ELISA,
abdominal ultrasound and Endoscopy of upper
gastrointestinal tract. Exclusion criteria were patients
receiving sclerotherapy, band ligation of EV and
prophylactic treatment for portal hypertension,
hypoalbuminemia which in clinically correlated with
congenital cardiac failure nephritic syndrome or
malnutrition patient refusing to give consent to take
part in our study. This study was carried out to
correlate between serum albumin and EV in CLD.
Patients were divided into Group A (serum albumin
<3.5 gm and Group B (albumin >3.5 g/day). Statistical
analysis was carried out by using SPSS v16.0 Windows
statistical software. Descriptive statistics were used
for the interpretation of the findings. Informed and
written consent obtained from all patients or their
guardian. Formal Ethical Clearance was obtained from
the Research Review Committee of Dhaka Medical
College and Hospital.
Result:
Seventy-three male (73%) and twenty seven female
patients (27%) with age range of 16 to 75 years wereevaluated. Out of 100 patients 24% were in between46-55 years age group. 75% of CLD were due to HepatitisB, 7% due to Hepatitis C, 18% due to others. 32%patients have EV and 68% patients do not have EV.
Figure-1 shows that majority of CLD patients 63%
fall in child Pugh class A group, followed by 32% fall
in child Pugh class B & 5% fall in child Pugh class C.
Fig.-1: Distribution of CLD patients in Child Pugh class
Table-I
Gradings of EV in different Child Pugh class
Child Pugh class NO EV (%) Grade I (%) Grade II (%) Grade III (%) Grade IV (%) Total (%)
A 47(74.60) 8 (12.69) 5 (7.93) 1 (1.58) 2 (3.17) 63 (100)
B 20 (62.5) 2 (6.25) 1 (3.13) 2 (6.25) 7 (21.87) 32 (100)
C 1 (20) 0 (0) 2 (40) 1 (20) 1(20) 5 (100)
Total (%) 68 (68) 10 (10) 8 (8) 4 (4) 10 (10) 100
18
A Study of Hypoalbuminaemia in Chronic Liver Disease and its Correlation BJM Vol. 22 No. 1

Table-I shows among 100pts of CLD pts 63 pts (63%)
were in Child Pugh class A from which 74.60% have
no varices. 32 pts (32%) were in Child Pugh class B
from which 62.5% have no varices. 5pts (5%) were in
Child Pugh class C from which 40% have Grade II
varices.
Fig.-2 shows maximum 71% CLD patients have serum
albumin >3.5 gm/dl and 29% patients have serum
albumin <3.5 gm/dl.
Table-II
Frequency of Esophageal varices in group A & group B
in Chronic Liver Disease pts
Albumin Level EV EV Total P
(gm/dl) Present (%) Absent (%) (%) value
Group A 18 (62.06) 11(37.93) 29 (29) <0.001
(<3.5gm/dl)
Group B 14 (19.71) 57 (80.28) 71 (71)
(>3.5gm/dl)
Total 32 68 100
EV : Esophageal varices, CLD: Chronic liver disease
Table-II shows that in group A 62.06% have EV while
in group B only 19.71% have EV, So EV is more in
group A in CLD patients. This Table shows P value is
<0.001 that is association between hypoalbuminaemia
and Esophageal varices is significant. Sensivity:
56%, Specificity: 83.8%, positive predictive value
(PPV): 62.06%, negative predictive value (NPV): 80.2%,
odds ratio: 6.6.
Discussion:
In this study all the patients were grouped in six age
groups. Majority of the study subjects were in between
46-55 years age group 24% followed by 23% between36-45 years age group. Ahsan T et al 10 found 28% inbetween 46-55 years age group which coincide withour study. 73% were male and 27% female. Malefemale ratio was 2.7:1. Mahtab et al 11 found male-female ratio of 2.97:1, which almost coincide withour study. In this study 63% patient fall in child Pughclass A group, 32% fall in child Pugh class B & 5%
fall in child Pugh class C .This study almost coincide
with the study of khan H et al 4 where 70.1% patient
fall in child Pugh class A group, 24.9% patient fall in
child Pugh class B group, 5.1% patient fall in child
Pugh class C group. Present study shows that 32%
of CLD patients have EV & 68% patients did not have
EV. Fook-Hong et al 12 found 53pt (57.60%) have EV,
39 pt (42.39%) did not have, Schepis et al found 13 80
pt (55.9%) have EV, 63 pt (44.05%) did not have. This
difference may be due to sample size and etiological
difference.
In child pugh class A pts, 16pts out of 63 pts(25.40%)
have varices among them 8 pts(12.69%) have grade I,
47 pts (74.60%) have no varices. In child pugh class
B pts, 12pts out of 32 pts (37.50%) have varices among
them 7 pts (21.88%) have grade IV, 20 pts (62.5%)
have no varices. In child pugh class C pts, 4 pts out
of 5 (80%) have varices among them 2 pts (4%) have
grade II, 1 pt (20%) have no varices.
Present study shows that 29 pt (29%) out of 100 have
hypoalbuminaemia (<3.5gm/dl that is group A) while
71 pts (71%) had albumin level > 3.5gm/dl that is
group B. In group A (Albumin level <3.5 gm/dl), 18 pts
(62.06%) have EV, and 11 patient (37.93%) did not
have EV. In group B (Albumin level >3.5 gm/dl), 14
pts (19.71%) have EV, and 57 patient (80.28%) did
not have EV. Mean serum albumin level was 3.8 gm/
dl. Khan H et al.4 found 57 pts (28.9%) out of 197
have hypoalbuminaemia (<3.5gm/dl). Among them 35
pts (61.4%) have EV, while 140 pts (71.1%) had
albumin level >3.5gm/dl) with 28 having EV (20%).
This consistent with the present study. From this
study, hypoalbuminaemia (<3.5gm/dl) is 56%
sensitive & 83.8% specific for presence of EV with
positive predictive value of 62.06% & negative
predictive value of 80.2% and odds ratio is 6.6 and P
value is <0.001(Table 2) that is association between
hypoalbuminaemia and Esophageal varices is
significant. This study almost coincide with the study
of khan H et al 4 which shows that hypo-
albuminaemia (<3.5gm/dl) is 53.2% sensitive &91%
specific predictor of EV with positive predictive value
of 73.3% and negative predictive value of 80.8% and
odds ratio of 11.57. Zein et al 14 in a study of 183
patients with primary sclerosing cholangitis, found
66% sensitivity, 80% specificity, 53.4% PPV, 87.2%
NPV and odd ratio of 7.8 for albuminaemia of <3.5
gm%; almost similar to our results. The minor
differences in figures could be explained on the basis
of difference in etiology of the study population and
sample size. khan H et al 4 used study population
with uniform etiology of infective hepatitis & Zein et
al14 in a study of 183 patients with primary patients
with CLD of diverse etiologies. The minor differences
in sclerosing cholangitis, Bressler et al15 found
albuminemia of <4gm% as an independent risk factor
for EV with odd ratio of 6.02 We used albuminemia of
<3.5 gm% while Schepis et al 13 and Sarwar et al 16
used level of <2.95 gm% to predict the presence of
EV. Odds ratio was 6.6 and the difference could be
explained by <3.5 gm% albumin level we used and
our study population with CLD with diverse etiology.
Specificity of 83.8% and PPV of 62.06% suggests that
hypoalbuminemia is a good indicator of EV. However,
19
BJM Vol. 22 No. 1 A Study of Hypoalbuminaemia in Chronic Liver Disease and its Correlation

low sensitivity of hypoalbuminemia (56%) and NPV
of 80.2% indicates that absence of hypoalbuminema
does not rule out EV.
Conclusion:
Patients with chronic liver disease frequently undergo
endoscopy of upper GIT to detect EV. Doing endoscopy
in all patients of CLD will increase socio-economic
and medical load because of the rising numbers of
such patients. Therefore, there is a particular need
for a noninvasive predictor for the presence of EV to
ease the medical, social and economic burden of the
disease. Many previous studies have documented
good predictive value of various non-endoscopic
variables for the presence or absence of varices, but
available data in our country is limited. We consider
simple, commonly available parameter serum
albumin. From this study it is assumed that
hypoalbuminaemia is a good non-endoscopic marker
for the presence of esophageal varices.
Conflict of interest: We have no conflict of interest.
References:
1. Jalan R, Hayes PC. UK guidelines on the
management of haemorrhage in cirrhotic patients.
British Society of Gastroenterology. Gut 2000;46
Suppl 3-4:III1-III15.
2. Boyer T. Natural history of portal hypertension. Clin
Liver Dis 1997;1:31- 44.
3. Rainey TG, Read CA. Pharmacology of colloids and
crystalloids. In: Chernow B, editor. The
Pharmacologic approach to the critically ill patient.
Baltimore MD: Williams and Wilkins, 1994:.272-
90.
4. Khan H, Iman N. Hypoalbuminaemia ; a marker of
esophageal varices in chronic liver diseasedue to
Hepatitis B& C. Rawal Med J 2009 ; 34: 98-102.
5. Galip E, Ömer O, Salih AU, Mustafa Y, Zeki K, Yücel
B. Gallbladder wall thickening as a sign of
esophageal varices in chronic liver disease.
Turkish Gastroenterol 1999;10:11-14.
6. Torres E, Barros P, Calmet F. Correlation between
serum-ascites albumin concentration gradient and
endoscopic parameters of portal hypertension. Am
J Gastroenterol 1998;93:2172-8.
7. Alempijevic T, KEVacevic N. Right liver lobe
diameter: albumin ratio: a new non-invasive
parameter for prediction of oesophageal varices in
patients with liver cirrhosis (preliminary report).
Gut 2007;56:1166-67.
8. B.B Das, A Purohit, U Acharya and E Treskova.Serum
– Ascites Albumin Gradient: A predictor of
esophageal varices with ascites.Indian Journal of
Paediatrics 2001;68:511-514.
9. Nava MP, Aller MA, Vega M, Prieto I, Valdes F, Arias
J. Altered proteinogram in short term portal vein
stenosed rats. Chinese Physiol. 2002;45(2):89-93.
10. Ahsan T,Ahsan M.Kamal MM,Hossain KJ,Haque
ME,Islam SN. Lifestyle, Nutritional status and
seroclinical profile of liver cirrhotic patients
Bangladesh Medical Journal 2007;36(2):44-47.
11. Mahtab MA, Rahman S, Kamal M, Shrestha A, Akbar
SM, Karim F, Dhar SC. Low viral load does not
exclude significant liver damage in patients with
chronic HBV infection in Bangladesh. BSMMU J.
2008; 1(1): 19-21.
12. Merli M, Nicolini G, Angeloni S, et al. Incidence
and natural history of small esophageal varices in
cirrhotic patients. J Hepatol 2003;38:266-272.
13. Schepis F, Camma C, Niceforo D, Magnano A, Pallio
S, Cinquegrani M, et al. Which Patients With
Cirrhosis Should Undergo Endoscopic Screening for
Esophageal Varices Detection? Hepatology
2001;33:333-38.
14. Zein CO, Lindor KD, Angulo P. Prevalence and
predictors of esophageal varices in patients with
primary sclerosing cholangitis. Hepatology 2004;
39:204-10.
15. Bressler B, Pinto R, El-Ashry D, Heathcote EJ.
Which patients with primary biliary cirrhosis or
primary sclerosing cholangitis should undergo
endoscopic screening for esophageal varices
detection. Gut 2005;54: 407-10.
16. Sarwar S, Khan AA, Butt AK, Shafqat F, Malik K,
Ahmad I, et al. Non-endoscopic prediction of
esophageal varices in cirrhosis. J Coll Physicians
Surg Pak 2005;15:528-31.
20
A Study of Hypoalbuminaemia in Chronic Liver Disease and its Correlation BJM Vol. 22 No. 1
Introduction:
Bombay blood group is the rarest blood group in the
world. It is a blood group which shows absence of
A,B,H antigens on red cells and presence of anti- A,
anti-B and potent wide thermal range anti-Hantibodies in serum reacting with all O blood group1.
Dr. Y.M. Bhende first discovered Bombay blood groupin 1952 at Bombay in India now known as Mumbai.This is the reason why this blood group got the name
Bombay blood group2.
Prevalence
At present about 0.0004% of the general human
population have Bombay blood group, though in some
places such as Mumbai local populations can have
occurrences as much as .01% of inhabitants3. People
with this blood group are found in Maharashtra and
some places of Karnataka which lies at the border of
Maharashtra. In a recent study an incidence of 1 in
33 among Kutia Kondh tribe, 1 in 127 in Kondh tribe
and 1 in 1244 among the tribal populations of Orissa
is found. This is the highest incidence of Bombay
blood group so far reported from India.4. The incidence
of this phenotype as 1 in 13,000 individuals in
Mumbai5. An incidence of 1 in 7600 after screening a
large number of samples in Mumbai.6 In Maharashtra,
reported the incidence of the Bombay phenotype as 1
in 45007. Incidence is 1 in 18,404 amongst Indians
settled in South Africa8. Of the 179 cases 112 (62.6%)
cases belonged to the state of Maharashtra. A slightly
higher frequency of the Bombay phenotype was also
found in the neighboring state of Karnataka (14 cases),
Andhra Pradesh (8 cases), Goa (6 cases), Gujarat (5
cases), Uttar Pradesh (5 cases), and so on in the
decreasing order8. The incidence of the Bombay
phenotype is high in those states of India where
consanguineous marriages are more prevalent, i.e.,
REVIEW ARTICLE
A RARE AND CLINICALLY IMPORTANT BLOODGROUP- BOMBAY BLOOD GROUPCHOWDHURY F.S1, SIDDIQUI M.A.E2, RAHMAN KGM3 ,NASREEN Z 4 , BEGUM H.A5, BEGUM H A 6
1. Assistant Professor, Transfusion Medicine, National institute of Kidney Diseases and Urology.
2. Consultant , Cardiology, NITOR, Dhaka
3. Associate Professor, Forensic Medicine, Dhaka Medical College
4. Medical Officer, Transfusion Medicine, Dhaka Medical College
5. Professor , Transfusion Medicine, Dhaka Medical College
6. Associate Professor, Transfusion Medicine, Dhaka Medical College
Andhra Pradesh, Tamil Nadu, Karnataka,
Maharashtra, Gujarat, etc. than in the other states.
Three cases of a rare blood group, Bombay (Oh)
phenotype, in the Bhuyan tribe of Sundargarh district
in North-Western Orissa were detected, Individuals
with the Bombay blood group were also detected in
Japan (Okubo 1980;Kaneko et al. 1997),Malaysia
(Lopez, 1972),Thailand (Sringarm et al.1977) and Sri
Lanka (De Zoysa 1985)9. H-deficient Bombay
phenotype is rare, since it occurs in about 1 in 10,000
individuals in India and 1 per 1,000,000 individuals
in Europe 10. More recently, a large series (42 H-
deficients) of H-deficient individuals (~1:1000) were
found in a small French island 800 km east of
Madagascar in the Indian Ocean, called Reunion
Island11. This indicates that the Bombay phenotype
is mostly confined to South-East Asian countries.
People with bombay blood group in Bangladesh:
No specific statistics of people with Bombay blood
group in Bangladesh is available. The first person
with Bombay blood group was identified in Bangladesh
in Narayangonj. Till now four people of Bombay blood
group found in Bangladesh. Among them three are
sisters of same family12.So the transfusion centers
should have the means and the thought to test for
Bombay group.
Genetics
99.9% of all individuals have an HH or Hh genotype.Individuals with the Bombay group have inherited tworecessive alleles of the H gene (their genotype is “hh”)and so do not express H antigen13. A antigen and Bantigen are made from H antigen. As a result, people
with Bombay blood group cannot make A antigen or B
antigen on their red blood cells. Because both
parents must carry this recessive allele to transmit
this blood type to their children, the condition mainly
Bangladesh J Medicine 2011; 22 : 21-23

occurs in small closed-off communities where there
is a good chance of both parents of a child either
being of Bombay type, or being heterozygous for the
“h” gene allele and so carrying the Bombay
characteristic as recessive. Although H structure is
responsible for formation of A and B antigen, there
is separate gene for formation of A and B enzymes.
So It is then no longer matters whether the A or B
enzymes are present or not, no A or B antigen can be
produced since the precursor antigen H is not present.
When Bombay blood group was first encountered, it
was found not to contain antigens A or B and so was
thought to be of group O. But experience showed that
Bombay group patients could not even safely receive
normal O-group blood, and this proved to be because
they lacked the H antigen and have potent wide
thermal range anti H.
Detection
It is very difficult to detect Bombay group people whenusual blood group test is conducted. The usual testsfor ABO blood group system would show them asgroup O. There is a serum grouping called reversegrouping for accurate test of a person’s ABO group. Ifthis test is conducted then we can detect thepresence of H antibody, which indicate Bombay blood
group. This test is conducted with the help of a reagent
called H – Lectin which has anti-H like activity. Thus
it is used to determine the presence or absence of
the H antigen on the surface of RBCs. The Bombay
phenotype detected was further confirmed by certain
specialized tests like absorption-elution studies,
titration of naturally occurring antibodies at different
temperatures, hemagglutination-inhibition study on
anti-H by O saliva secretor, and secretor-status of
the person14,15.
Cell grouping Serum grouping Interpretation
Anti A Anti B Anti AB A cells B cells O cells
+ - + - + - A
- + + + - - B
+ + + - - - AB
- - - + + - O
- - - + + + Bombaybloodgroup
Diagram as shown in above diagram, cell grouping is
carried out using anti A, Anti B andante AB
commercially available sera. Serum grouping is carried
out using A cells, B cells and O cells
General Characteristics of Bombay Blood
Group: 13
1. Absence of H, A, and B antigens; NO agglutination
with anti-A, anti-B, or anti-H lectin.
2. Presence of anti-A, anti-B, anti-AB and potent
wide thermal range anti-H in the serum.
3. A, B, H non-secretor (no A, B, or H substances
present in saliva)
4. Absence of H enzyme in serum and H antigen on
red cells.
Fig.-1: Interaction of the Hh and ABO gene.
22
A Rare And Clinically Important Blood Group- Bombay Blood Group BJM Vol. 22 No. 1

5. Presence of A or B enzymes in serum and red
cells.
6. A recessive mode of inheritance.
7. Red cells of the Bombay group are compatible only
with the serum from another Bombay individual.
Transfusion Compatibility
Individuals with Bombay blood group can donate to
all ABO blood group people and can only accept from
Bombay blood group people. The Bombay anti-H is an
IgM antibody that can bind complement and cause
red cell lysis.Because the H antigen is common to all
ABO blood group, Bombay blood is incompatible with
all ABO donors16.
Given that this condition is very rare, any person
with this blood group who needs an urgent blood
transfusion will probably be unable to get it, as no
blood bank would have any stock.Those anticipating
the need for blood transfusion (e.g. in scheduled
surgery) may bank blood for their own use (i.e. an
autologous blood donation), but this option is not
available in case of accidental injury17.
End Note
Bombay blood group is a rare blood group mainly found
in the South East Asia including Bangladesh. People
having this blood group are very small in number. It
doesn’t mean that these people are having any
disease or it’s the symptom of any disease. People
with Bombay blood group should report to the nearest
blood bank. They are advised not to give blood in
donation programs because it is not necessary that
these Bombay blood will be used within 45 days.
Relatives can have Bombay blood group, so they should
be screened for Bombay blood group. People having
Bombay blood group should be listed.Since Bombay
Blood Group is the rarest of the rare group, it is
desirable to develop cryopreservation facilities for rare
donor units. Every blood bank can easily maintain a
rare blood type donor file from their regular voluntary
donors.It is only possible to solve problems related
to rare blood groups like Bombay blood group if each
blood bank has a large number of committed regular
voluntary donors.
References:
1. kWatkins WM, Morgan WT.”Possible genetic
pathway for the biosynthesis of blood group
mucopolysaccharides. Vox Sang 1959:4:97-119.
2. Brozovic B, Brozovic M, Manual of Clinical Blood
Transfusion, 1st edt, Charchill Livingstone,
USA,1986,1-19.
3. Bhende YM, Deshpande CK, Bhatia HM, Sanger R,
Race RR, Morgan WT, et al . A new blood group
character related to the ABO system. Lancet
1952;1:903-4
4. Balgir RS. Detection of a Rare “Bombay (Oh)
Phenotype” among the Kutia Kondh Primitive Tribe
of Orissa, India. Int J Hum Genet 2005;5:193-8.
5. Bhatia HM, Sanghvi LD. Rare blood groups and
consanguinity Bombay phenotype. Vox Sang
1962;7:245-8
6. Bhatia HM, Sathe MS. Incidence of Bombay Oh
phenotype and weaker variants of A and B antigens
in Bombay (India). Vox Sang 1974;27:524-32s
7. Gorakshakar AC, Sathe MS, Shirsat SR, Bhatia HM.
Genetic studies in Ratnagiri and Sindhudurg
districts of Maharashtra: Incidence of ABO, Rho (D),
In a antigens, G-6-PD deficiency and abnormal
hemoglobins. J Indian Anthrop Soc 1987;22:38-46
8. Sathe M, Vasantha K, Mhaisalkar P, Gorakshakar
A. Distribution of Bombay (Oh) Phenotypes in India.
J Indian Anthrop Soc 1988;23:277-80.
9. Balgir RS,Orissa Identification of a rare blood group,
“Bombay (Oh) phenotype,” in Bhuyan tribe of
Northwestern Orissa, India. Indian Journal of
Human Genetics:2007:13:3:101-13
10. Oriol R, Candelier JJ, Mollicone R. Molecular
genetics of H. Vox Sang 2000;78:105-8.
11. Le Pendu J, Gerard G, Vitrac D, Juszczak G, Liberge
G, Rouger P, et al . H-deficient blood groups of
Reunion Island, II: Differences between Indians
(Bombay Phenotype) and White (Reunion phenotype).
Am J Hum Genet 1983;35:484-96
12. Rahman M, Abdullah AZ, Hossain M, Haque KM,
Hossain MM, Bangladesh Med Research Council
Bulletine,1990,Dec:16(20):75-85.
13. Denise M, Modern Blood Banking and Transfision
Practices. 3rd edt,Jaypee Brothers, New Delhi. P:
92,100-102.
14. Flynn JC Jr. Essentials of Immunohematology. WB
Saunders Company: Philadelphia; 1998. p. 23-39.
15. Boorman EK, Dodd BE, Lincoln PJ. Blood Group
Serology. 6th ed. Churchill Livingstone: Edinburgh;
1988. p. 179-99.
16. AABB, Technical Manual, 15th edt,p-304.
23
BJM Vol. 22 No. 1 A Rare And Clinically Important Blood Group- Bombay Blood Group

CASE REPORTS
Introduction:
The primary immunodeficiency syndromes are a rare
group of disorders that can present at an age for
which delay in diagnosis remains common. Persons
with hypogamma globulinaemia are more likely to
get infections and patient suffer from recurrent
infections of various body systems, more so of the
respiratory tract. Replacement therapy with
immunoglobulins in primary immunodefiency
increases life expectancy and reduces infection
frequency and severity1. We present a case of a
young female who developed repeated chest
infections, recurrent diarrhoea and arthritis since
early childhood.
Case report:
A 23 years old female presented with pain and
swelling of multiple joints for last 3 months. Pain
first appeared at right side of the pelvis. About
one month later both wrists, al l
metacarpophalangeal, shoulders, elbows and
knees were successively involved. Pain was
constant, moderate to severe in nature and
A YOUNG GIRL WITH REPEATED EPISODES OFPNEUMONIA AND INTERMITTENT DIARRHOEA- THEPRIMARY IMMUNODEFICIENCY SYNDROMEABDULLAH-AL-MAMUN1, SAMIM HASAN1, SYED AHMED ABDULLAH1, AHMED RIYAD HOSSAIN2, SAFIUL
ALAM3, ROBED AMIN4, MA KAHHAR5
Abstract:
A description is given of a case of a young girl who presented with repeated episodes of
pneumonia since childhood. In addition, she had episodes of intermittent diarrhoea. Her
investigative work-up revealed a deficiency of serum immunoglobulins. The profile was
suggestive of common variable immunodeficiency. Because of a relative rarity of this disease, it
is often misdiagnosed earlier. Late diagnosis and delayed institution of immunoglobulin
replacement therapy results in increased morbidity with a wide variety of organ-specific
complications and increased mortality.
1. Honorary Medical Officer, Department of Medicine, Dhaka Medical College
2. Assistant Registrar, Department of Medicine, Dhaka Medical College
3. Indoor Medical Officer, Department of Medicine, Dhaka Medical College
4. Assistant Professor of Medicine, Dhaka Medical College
5. Professor of Medicine, Dhaka Medical College, Department of Medicine Unit V, Dhaka Medical College
Hospital, Dhaka.
sometimes became so severe that patient could
not move the joints and she had to take analgesics
regularly. Pain was associated with swelling of the
joints but not associated with morning stiffness
and redness. Pain spared back, chest, neck and
feet. For this pain she consulted a rheumatologist
who diagnosed her as a case of ankylosing
spondylitis and prescribed Salphasalazine. But the
patient could not tolerate the drug. She had also
history of getting intra-articular steroid injection.
The patient also mentioned that for last 20 days
she developed fever and burning sensation during
micturition and loose motion. Her father also
stated that since childhood she was growth
retarded and suffered recurrent fever, respiratory
tract infection, loose motion, burning sensation
during micturition and oral sore and for this she
got medication for multiple times. On query,
patient had a history of taking anti-tubercular
drugs for sputum negative pulmonary tuberculosis.
She also underwent lobectomy of left lung for
bronchiectasis 4 months back. (Fig 1)
Bangladesh J Medicine 2011; 22 : 24-26
BJM Vol. 22 No. 1

Patient is asthmatic and it was diagnosed as cough
variant asthma with positive bronchoprovocation test4 months back and for this she was on medicationfor last 3 months. On examination, patient wasemaciated; pulse-80/min ; blood pressure-70/50 mmof Hg; temp-99°F ; Anaemia –moderate; clubbingpresent; no palpable lymphadenopathy & thyroid glandwas not enlarged. Nutritional status: BMI-9.4kg/m2;mid upper arm circumference-15 cm. Examination oflower extrimities & pelvis- bilateral sacroiliac jointtenderness; tenderness over both knee joints but norestrictive movement ; tenderness over lower lumbarspine but no gibbus; Schober’s test was positive; SLRnegative. Examination of upper extrimities-wastingof the small muscles of the hand & dorsal guttering,ulnar deviation of hands; tenderness over both wrists,metacarpophalangeal joints, elbow & shoulder joints
and there was restricted movement of the wrist &
shoulders, no tenderness over proximal & distal
interphalangeal joints.(Fig.2)
Investigations revealed- CBC:Hb-7.7 gm%, ESR-45
mm in 1st hour, WBC count-10.68 thousand/mm3 ,
Neutrophil-76%, Lymphocyte-18% ,Hematocrit-
26.60%, MCV-78.50 fl. CRP-1.72 mg/L(0-3 mg/L). RA
test –negative,Anti CCP antibody < 1 unit/ml. ANA-
negative. HLA-B27-positive.Serum ferritin-827 ng/
ml(15-200ng/ml). Blood C/S- no growth of organisms.
Urine R/M/E-pus cell: 10-12/hpf, epithelial cells:2-
4/hpf, RBC- nil, Albumin-absent. Urine C/S-no
growth of organisms. Urine AFB-not found. Stool R/
M/E: mucous ++, vegetable cells ++.Stool culture –
no growth of organism. X ray Pelvis A/P view: no
significant skeletal abnormality. X ray of lumbosacral
spine B/V: no significant skeletal abnormality. X ray
chest P/A view: old fracture or expansile bony lesion
at the posterior aspect of left 6th rib. X ray hand B/V:
Left- suggestive of inflammatory joint disease; Right
–mild subluxation of fifth metacarpophalangeal
joint.(Fig.-3).
Fig.-1: The scar of left sided lobectomy due to bronchiectasis
Fig 2: Wasting of hand muscles and ulnr deviation
Fig.-3: X ray hands and forearm revealed subluxation of
fifth metacarpophalangeal
USG of whole abdomen- Echogenic liver parenchyma.
Liver Function Test-normal. FBG-4.6 mmol/L. S.
creatinine- 1.08 mg/dl. S electrolytes: sodium-
135mmol/L, potassium-4.7 mmol/L,chloride-98
mmol/L, CO2-24 mmol/L. Serum immunoglobulin
study- Ig G-2.56 gm/L(7-16), IgM-0.17 gm/L(0.4-2.3),
Ig A-0.23 gm/L(0.70-4.00) CT scan of chest- triangular
density areas containing air densities are seen along
medial aspects of left lower lobe, impression of small
25
BJM Vol. 22 No. 1 A Young Girl with Repeated Episodes of Pneumonia and Intermittent Diarrhoe

chronic pneumonia with bronchiectatic changessuggestive of chronic TB. Pneumonia CT guided FNACof lower left lung- smear shows scanty cellularmaterial containing a few polymorphs, lymphocytes& pulmonary macrophages in the background of blood.No malignant or granuloma is seen; suggestive ofinflammatory lesion. Histopathology : section of thelung shows multiple epitheloid granuloma withcaseation necrosis with bronchiectatic changes; nofocal alveolar haemorrage-suggestive of bronchiectaticchanges with PTB. Sputum for AFB (three consecutivemorning samples)-negative. Echocardiography-normal. After evaluation clinically and investigationsshe was diagnosed as a case of Primary Immuno-deficiency Syndrome
Discussion:
Immunoglobulin deficiency disorders are an importantthough uncommon cause of recurrent infections, whichare not often suspected by treating physicians. Theclassical feature of such disorders is an increasedsusceptibility to infections and immunodeficiencyshould be suspected in any patient who presents withrecurrent or persistent infections2. Defects in antibodysynthesis may be primary or secondary and may bequantitative or qualitative. The major cause of primaryantibody deficiency includes common variableimmunodeficiency, selective IgA deficiency, infantilesex linked hypogammaglobulinaemia (Brutonsdisease), transient hypogammaglo nulinaemia ofinfancy, IgG subclass deficiency etc. Secondary causesof antibody deficiency could be either due to decreasedproduction(malnutrition, lymphoproliferative disease,drugs) or increased losses(nephrotic syndrome, proteinlosing enteropathy, burns) 3
Patient with defects in humoral immunity haverecurrent or chronic sinopulmonary infection,meningitis, and bacteremia, most commonly causedby pyogenic bacteria such as Haemophilus influenzae,Streptococcus pneumoniae, and Staphylococcusaureus. Abnormalities of T cell-mediated immunitypredispose to disseminated virus infections,particularly with latent viruses such as Herpessimplex. Varicella zoster and Cytomegalovirus. Inaddition, patient so affected almost invariably developmucocutaneous candidiasis and frequently acquiresystemic fungal infections4.
Recurrent infections usually begin at about one yearof age because maternally transferred antibody affordssome passive protection till that time. Growthretardation is a common symptoms. Delay indiagnosis is frequent and is overlooked for many yearsbefore a diagnosis is made and treatment started Asurvey in England showed a delay in diagnosis in halfof all children and virtually all adults. The length ofranged from 2-27 years in adults and 1 to 5 years inchildren5 . IgA deficiency of common variableimmunodeficiency(CVID) represent polar ends of aclinical spectrum due to the same underlying gene
defect(s).Over a period of years, IgA-deficient patientmay progress to the panhypogammaglobulinaemiaphenotype characteristic of CVID, and vice versa.Patient with isolated IgA deficiency may present withan increased number of respiratory infections thatmay lead to bronchiectasis. Chronic diarrhoealdiseases also occur. It is also associated with arthritisand systemic lupus erythematosus. Patient with CVIDmay also present with signs and symptoms suggestiveof lymphoid malignancy, including fever, weight loss,anemia, thrombocytopenia, splenomegaly, generalizedlymphadenopathy, and lymphocytosis. Oncesuspected, lab diagnosis is simple and measurementof serum immunoglobulins will provide the diagnosis.If the level of immunoglobulins is normal, testing forantibody subclasses or functional antibody may beindicated. Serum complement levels and a normallymphocyte count will serve as screening test to ruleout co-existing deficiency disorders6.
Pulmonary abnormalities develop in most patientswith primary hypogammaglobulinemia. A new findingis that silent and asymptomatic progression ofpulmonary changes may occur in patients despite anadequate immunoglobulin replacement therapy. High-resolution computed tomography is the method ofchoice in monitoring pulmonary changes 7 .Theadministration of intravenous immunoglobulin inadequate doses is an essential part of the preventionand treatment of all these complications4. We treatedour patient with intravenous immunoglobulin(dose400 mg/ kg) once. Immediately after givingimmunoglobulin she felt better including improvementof joint pain. She had improvement on general wellbeing, appetite and was afebrile during hospital stay.There was no adverse event seen during or afteradministration of immunoglobulin. Patient wasadvised for follow up.
References:1. Philip Wood. The value of early diagnosis and
treatment of patients with primary antibodydeficiencies;: Pharmaceuticals Policy and Law.Volume 2008; 10:147-157.
2. Malaviya AN, Rajagopal P, Taneja RL. Pattern ofprimary immunodeficiencies seen in India. J AOI.1977; 25: 465-74.
3. Chapel H, Haeney M. Essentials of ClinicalImmunology; 2nd edition. Oxford: BlackwellScientific Publications; 1988; 68-108.
4. Harrison’s principles of Internal Medicine; 17th
edition; Primary Immune Deficiency Diseases: 2054-2060 pages.
5. Blore J, Haeney MR. Primary antibody deficiencyand diagnostic delay. Br Med J 1989; 298:516-7.
6. Datta U, Kumar L, Metha S, et al. Primaryimmunodeficiency defects seen in PGI: One yearstudy. JAPI 1984; 32: 701-4.
7. Cunningham-Rundles C, Bodian C. Common variableimmunodeficiency: clinical and immunologicalfeatures of 248 patients. Clin Immunol. Jul 1999;92(1):34-48.
26
A Young Girl with Repeated Episodes of Pneumonia and Intermittent Diarrhoe BJM Vol. 22 No. 1

Introduction
Deep vein thromboses are a common and
occasionally, fatal condition that are often clinically
silent. whenever symptomatic, they can easily mimic
or be masked by musculoskeletal conditions.
Deficiencies of natural anticoagulants such as protein
C and protein S leads to inherited thrombophilia which
is defined as an enhanced inherited tendency to form
venous thrombo-embolism without any apparent
causes and tend to recur.1,2 In the early 1980s protein
C and protein S deficiencies were set as causes of
inherited thrombophilia. Their prevalence in general
population vary from 0.2% to 0.4% for protein C
deficiency and 0.2% for protein S deficiency.3
Homocystein has been recognized as an independent
risk factor for atherosclerosis, arterial & venous
thrombosis.4 Individuals with unexplai- ned venous
thrombosis has demonstrated a greater than
expected number of individuals with blood
homocystein level above the 95th percentile.5
Therefore, when any patient presents with deep
venous thrombosis without precipitating conditions
the screening for thrombophilia should be considered
to find out the aetiology.
A CASE OF DEEP VEIN THROMBOSIS DUE TOPROTEIN C, PROTEIN S DEFICIENCY AND HYPER-HOMOCYSTINAEMIA, A RARE GENETICABNORMALITIESAHMED HOSSAIN1, QUAZI TARIKUL ISLAM2, UMME KULSUM MITU3, JAYANTA BANIK4, H.M.
MOSTAFISUR RAHMAN5,MAHMUD HASAN6, A.B.M. GOLAM MOSTAFA7
Abstract
Approximately 80% of Deep Vein Thromboses (DVTs) are clinically asymptomatic, 20% of those that
actually demonstrate signs and symptoms. DVT associated with protein C and protein S deficiencies
are rare genetic abnormalities that cause thrombophilia and lead to thrombosis. Here we describe a
case of 55-year old male who presented with recurrent DVT of left lower limb and eventually
diagnosed as a case of DVT due to protein C and protein S deficiency with hyperhomocystinaemia..
The particular interest in this case report is that it is important to consider sceening for thrombo-
philia incase of DVT with uncertain aetiology.
Key words :Deep Vein Thromboses, protein C ,protein S, thrombophilia,hyperhomocystinaemia
1. Assistant Professor, Department of Medicine, Dhaka Medical College, Dhaka
2. Professor (PRL), Department of Medicine, Dhaka Medical College, Dhaka
3. Post graduate Trainee, Dept. of Medicine, Dhaka Medical College Hospital, Dhaka
4. Post graduate Trainee, Dept. of Medicine, Bangabandhu Sheikh Mujib Medical University, Dhaka
5. Assistant Registrar, ,Dept. of Medicine, Dhaka Medical College Hospital, Dhaka
6. Internal Medical Officer, Dept. of Medicine, Dhaka Medical College Hospital, Dhaka
7. Internal Medical Officer, Dept. of Medicine, Dhaka Medical College Hospital, Dhaka
Case Report
A 55 years old gentleman, previously healthy male
presented with a seven day history of gradual swelling
and pain in the left lower limb. Pain was located
over whole limb associated with redness, increased
temperature and dilatation of the superficial veins.
The pain was aggravated by sitting ,immediately after
walking for certain distance and rest being the only
relieving factor. The patient’s sleep was disturbed,
particularly lying on the affected side. The patient’s
past medical history revealed similar event of swelling
of his left leg 1 year ago which had been treated
successfully. In the patient’s history, there were nohistory of hypertension, recent major surgery,immobilization or occurrence of any serious medicalconditions. On physical examination,he had noabnormalities except swollen left lower limb. Localexamination of left lower limb revealed , skinredness, swelling engorged superficial veins,mildtenderness and increased temperature over wholelimb. All lower extremity pulses were present and of
equal volume in both sides and there were no digital
ischemia.
On Investigation, Complete blood count and blood
film reveals, WBC-6.25X10⁹ /L Hematocrit-38.8%,
Bangladesh J Medicine 2011; 22 : 27-29
platelets-196X109/L, ESR:20 mm/1st hr, Hb-12.7 g/
dl .Urine analysis was negative for protein or red cells.
S. Creatinine-1.33 mg/dl. Fasting Blood Sugar and
Lipid profile were normal. Prothrombin time-14.2 sec
on admission (control 12 sec).USG of whole abdomen
showed thrombus in Inferior Vena Cava . Duplex
Examination of left lower limb showed; deep venous
thrombosis of lf common femoral and popliteal
segment. Protein C -12.4% (70-100) and protein S:
25% (60-130). Serum Homocysteine 26.96 micro mole
/L.(5-15 micro mole)
Discussion
Deep venous thrombosis defined as a partial or
complete occlution of a deep vein by thrombus, is a
relatively uncommon yet important diagnosis in
primary care practice.6,7 The common clinical
presentation of the venous thrombo-embolic disease
(VTE) is with deep vein thrombosis of the leg and /or
pulmonary embolism.8 Risk factors of DVT include
past history of deep vein thrombosis, pulmonary
oedema, operative intervention, immobilization,
trauma, neurological deficit, malignancies, sepsis,
central venus catheter and hyper–coagulable state
etc.9 The prothrombotic states are protein C & protein
S deficiency, activated protein C resistance,
antithrombin III deficiency, elevated homocystiene
level & abnormal lipid profile. The antiphospholipid
syndrome, thrombocythemia & severe bacterial
infection cause acquired hyper coagulable states.9-
13 Homozygous homocystinaemia accounts for 1 in
335 000 live births and is characterized by pre-mature
vascular disease, thrombosis, mental retardation,
skeletal abnormalities and lens disloca-tion.
Heterozygous homocystinaemia is far more common,
affecting up to 0.3-1% of the general populatnd is
associated with recurrent deep venous
thromboembolism.14 Congenital protein C & protein
S deficiencis are inherited disorders & the prevalence
of protein C deficiency is 1 in 300 & that of protein S
deficiency is less frequent than 1 in 1000. So the
possibility of someone inheriting both deficiencies
together is less than 1 in 300000, extremely rare.15
Protein C and protein S systems are the major
regulatory system of haemostasis. These proteins are
vitamin K dependent proenzymes synthesized in the
liver and become activated after binding to thrombin-
thrombomodulin complex on the surface of
endothelial cells. Thus activated protein C inhibits
factors VIIIa & Va. Here protein S acts as a cofactor
& exhibiting their anticoagulant property. Acquired
causes of these deficiencies are seen in liver disease,
DIC, therapy with L-asparaginase, Coumarin & severe
infections etc.16 These deficiencies commonly present
with DVT, account for nearly 90% of all venous
thrombotic episodes & Pulmonary embolism. &
thrombosis in other venous sides about 5% of cases.
Chronic sequelae can be extremely debilitating
because of the post-thrombotic syndrome that can
affect up to 20 % of the patients.17 Recurrent DVT
can occur with. or without thrombophilic conditions
, the highest risk being in the first 6 month.18
Homocysteinaemia has been identified as an
independent risk factor for coronary artery disease,
peripheral vascular disease and thrombosis.
Heterozygous homocysteina- emia has been
recognized in up to 25% of patients with recurrent
venous thrombosis. 14,19
Doppler ultrasonography and venography although
being regarded as the diagnostic ‘ ‘gold
standard”,require a high level of training for the
operator in order to be reliable.Venography is also an
invasive procedure.Recently, the diagnosis of DVT has
been improved by performing a probability test using
the measurement of D-dimer levels (the products of
fibrin degradation that increase with venous
thromboembolism).20
It is often make a fundamental error by testing for
protein C & S deficiency when a patient is taking
Coumarin (warfarin) or when they have had recent
thrombotic event , as both of these causes protein C
& S to be temporarily decreased So to confirm this
deficiency, the patient must be off Coumarin for at
least 14 days & must not have an active clotting
episode in progress. So to confirm , we should repeat
the test after 12 weeks & also testing the patient’s
first-degree relatives.15
Hyperhomocysteinaemia appears to increa-andmeasurement of total fasting homocysteine levelsalone can be misleading as it appears to misclassify40% of patients.Conclusive results can be obtainedusing a moresensitive test by measurement of serumhomocysteine levels before and after oral methionineloading.19
The goals of treatment for DVT include halting clot
formation & preventing recurrence of thrombi & PE.
About 30% of DVT patient have a thrombophilia. The
main stay of treatment was unfractionated heparin
followed by warfarin. Out patient anticoagulant
therapy is recommended for 3 to 6 month for VTE &
for more than 12 month for recurrent VTE.21
Conclusion
So whenever a DVT of uncertain aetiology is
suspected, it might have benefit from
hypercoagulability testing because it is important to
focus on inherited blood clotting problems. Except in
28
A Case of Deep Vein Thrombosis Due To Protein C, Protein S Deficiency BJM Vol. 22 No. 1
the most severe cases, inherited problems are usually
enough to cause DVT or pulmonary embolism on their
own but this problems contribute to clot only when
they are combined with environmental factors which
activates the body’s blood clotting machinery.If an
inherited thrombophilia is diagnosed further
screening and possible identification of other family
members would lead to avoidance of known secondary
risk factors and subsequent thrombo-embolic
manifestations.
References:
1. Simioni P.Who should be tested for thrombophilia?
Curr Opin Hematol. 2006; 13(5): 337-43
2. Pabinger I. Thrombophilia and its impact on
pregnancy.Thromb Res. 2009; 123 Suppl 3:S16-21.
3. Whilatch NL, Orfel TL. Thrombophilias :When
should we test and how does it help? Seminars in
Respiratory and Critical Care
Medicine.2008;29(1):27-36
4. Mayer E, Jacobsen D, Robinson K.Homocysteine and
coronary atherosclerosis. J Am Coll Cardiol
1996;27:517–527.
5. Heijer M, Koster T, Blom H Hyperhomocysteinemia
as a risk factor for deep-vein thrombosis.
N Engl J Med 1996;334:759–762.
6. Anderson FA,Wheeler HB,Goldberg RJ. A
population-based perspective of the hospital
incidence and case fatality rates of deep vein
thrombosis and pulmonary embolism: the Worcester
DVTstudy.Arch Intern Med 1991;151:933-3
7. Silverstein MD, Heit JA, Mohr DN. Trends in the
incidence of deep vein thrombosis and pulmonary
embolism: a 25-year population-based study. Arch
Intern Med 1998,158:585-93
8 J.I.O. Craig, D.B.L. Mc Clelland, H.G. Watson.Blood
disease. In : Nicki R. colledge, Brain R.Walker, Stuart
H. Ralston,editors. Davidson’s Principles and
Practice of Medicine. 21st ed. Philadelphia, USA:
Churchill Livingstone;2010. p.985-1051.
9 Miyata T, Sakata T, Yasumuro Y, Okamura
T,Katsumi A, Saito H, et al. Genetic analysis of
protein C deficiency in nineteen Japanese
families:five recurrent defects can explain half of
the deficiencies. Thromb Res 1998;92:181-87.
10 Saxena R, Mohanthy S, Srivastava A, Choudhry
VP,Kotwal J. Pathogenic factors underlying
juveniledeep vein thrombosis in Indians. Eur J
Hemat 1999;63: 26-28.
11 Bonduel M, Hepner M, Sciuccati G, Torres AF,
Pieroni G, Frontroth JP,et al. Prothrombotic
abnormalities in children with venous thromboembo-
Lism. J Pediatr Hemtol Oncol 2000;22:66-72
12 David M, Andre M. Venous thromboembolic
complications in children. J Pediatr 1993; 123:
337-346.
13 Gerson WT , Dickerman JD, Bovil EG, Golden E.
Severe acquired protein‘C’ deficiency in purpura
fulminans associated with disseminated
intravascular coagulation :Treatment with protein
“C” concen-trate.Pediatrics 1993;91:418-421.
14. Rodgers GM.Thrombosis and antithro- mbotic
therapy. In:LeeGR,Foerster J,Lukens J,Paraskev
F,Greer JP, Rodgers GM, et al. Wintrobe’s Clinical
Hematology. Gizza, Egypt: Williams & Wilkins,
1999; 2:1
15. Douketis JD, Berger PB, Dunn AS, The perioperative
management of antithrombotic therapy: American
College of Chest Physicians Evidence-Based
Clinical Practice Guidelines (8th edition). Chest
2008;133:299S-340S
16 . Hilgartner MW, Corrigan JJ Jr. Coagulation
disorders. In: Miller DR, Baehner RL, Blood Diseases
of Infancy and Childhood. 7th edn. Philadelphia:
Mosby; 1995. p. 971-975
17. Lijfering M, Veeger NJGM, Middeldorp S, Hamulyak
K, Prins MH, Buller HR, et al. A lower risk of
recurrent venous thrombosis in women compared
with men is explained by sex-specific risk factors
at time of first venous thrombosis in.thrombophilic
families.Blood.2009; 114(10): 2031– 2036.
18. Hansson PO, Sorbo J, Eriksson H. Recurrent
venous thromboembolism after deep vein thrombosis:
incidence and risk factors.Arch Intern Med.2000;
160: 769–74.
19. Bostom AG, Jacques PF, Nadeau MR. Post
methionine load hyperhomocystein-emia in persons
normal fasting total plasma homocysteine.Initial
results from the NHLBI Family Heart Study.
Atherosclerosis 1995;116:147-51
20. Hull RD, Stein PD, Ghali WA, Corunz J. Diagnostic
algorithms for deep vein thrombosis: Work in
progress. Am J Med 2002; 113(8): 687-8
21. Ramzi DW, Leeper KV. DVT and pulmonary
embolism: part I: diagnosis. Am Fam Physician.
2004; 69: 2829-36.
29
BJM Vol. 22 No. 1 A Case of Deep Vein Thrombosis Due To Protein C, Protein S Deficiency