Assignment #4 – Research
76
Motives for and Barriers to Participation in Postsecondary Educational Attainment in Northern Wisconsin by Paula M. Collins A Research Paper Submitted in Partial Fulfillment of the Requirements for the Master of Science Degree In Career and Technical Education Approved: 2 Semester Credits / '7 i1i/£'- 01i2 4{-/ Dr. Howard D. Lee Investigation Adviser The Graduate School University of Wisconsin-Stout May, 2011 1
Transcript of Assignment #4 – Research
Motives for and Barriers to Participation in
Postsecondary Educational Attainment
in Northern Wisconsin
by
Paula M. Collins
A Research Paper Submitted in Partial Fulfillment of the
Requirements for the Master of Science Degree
In
Career and Technical Education
Approved: 2 Semester Credits
/
'7i1i/£'-01i2 4{-/ Dr. Howard D. Lee
Investigation Adviser
The Graduate School
University of Wisconsin-Stout
May, 2011
1

2
The Graduate School
University of Wisconsin-Stout
Menomonie, WI
Author: Collins, Paula M.
Title: Motives for and Barriers to Participation in Postsecondary Educational
Attainment in Northern Wisconsin
Graduate Degree/ Major: MS Career and Technical Education
Research Adviser: Howard D. Lee, Ph.D.
Month/Year: May, 2011
Number of Pages: 75
Style Manual Used: American Psychological Association, 6th
edition
Abstract
Current educational disparities of the number of college graduates in northern Wisconsin
exist as compared to the rest of the state. The primary purpose of this study was to identify
barriers to higher education impacting adults in Northern Wisconsin and identify motivations
that exist in overcoming these barriers. This study sought to provide insight as to the type of
post-secondary planning or assistance northern Wisconsin adults need in continuing their
education beyond high school.
Data for this study was collected from adults served by the Educational Opportunity
Centers in Rusk, Sawyer, and Washburn Counties. The survey was designed to collect data on
situational, institutional, and dispositional barriers and internal and external motivating factors.
Analysis of the data showed the primary barriers were distance between home and school, cost of
courses, and not knowing what to study or where to start. Career advancement and major life
3
events were found to play a key role in motivating adults to pursue postsecondary education. By
determining these factors, the Educational Opportunity Centers (EOC) program and educational
institutions in general, will be able to take appropriate action to provide services that widen
participation in postsecondary education in Northern Wisconsin.
4
The Graduate School
University of Wisconsin Stout
Menomonie, WI
Acknowledgments
There are many people I would like to thank for their encouragement and support during
the writing of this paper. Of special mention is Dr. Howard Lee, my thesis advisor. He could
always be counted on for honest feedback and was generous in sharing his knowledge about the
importance of each part of the thesis. He gave me the freedom to explore my own interests and
kept me motivated at key points along the way. There were many times his words of advice
would come to mind “narrow the topic” and “keep going!”
I would also like to acknowledge Dr. Joan Sosalla, Director of the Educational
Opportunity Centers (EOC). She was tremendously helpful as a mentor and provided a focus for
a population to study. Dr. Sosalla was always willing to read the latest version of the paper and
offer advice.
Lastly, I would like to thank my children, Sarah, Mimi, Elizabeth and my husband, Dan.
They took a special interest in the topic and never seemed to tire of hearing about the progress of
the paper.
5
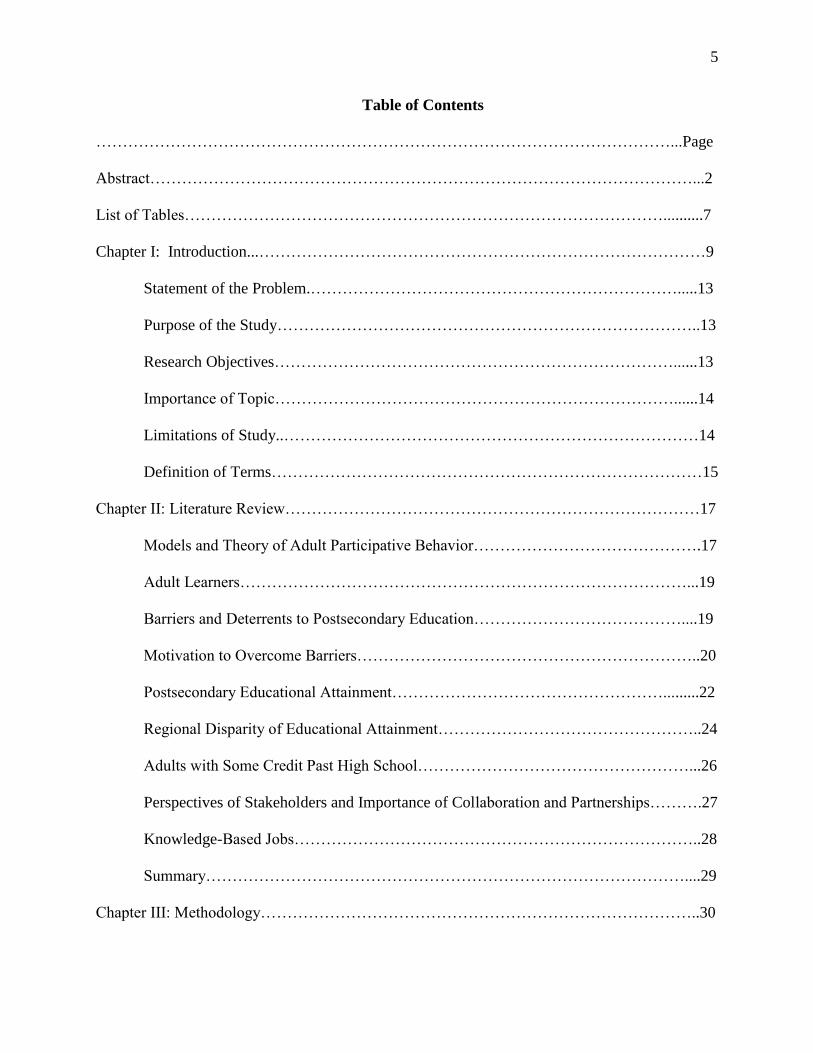
Table of Contents
………………………………………………………………………………………………...Page
Abstract…………………………………………………………………………………………...2
List of Tables………………………………………………………………………………..........7
Chapter I: Introduction...…………………………………………………………………………9
Statement of the Problem.…………………………………………………………….....13
Purpose of the Study……………………………………………………………………..13
Research Objectives…………………………………………………………………......13
Importance of Topic…………………………………………………………………......14
Limitations of Study..……………………………………………………………………14
Definition of Terms………………………………………………………………………15
Chapter II: Literature Review……………………………………………………………………17
Models and Theory of Adult Participative Behavior…………………………………….17
Adult Learners…………………………………………………………………………...19
Barriers and Deterrents to Postsecondary Education…………………………………....19
Motivation to Overcome Barriers………………………………………………………..20
Postsecondary Educational Attainment…………………………………………….........22
Regional Disparity of Educational Attainment…………………………………………..24
Adults with Some Credit Past High School……………………………………………...26
Perspectives of Stakeholders and Importance of Collaboration and Partnerships……….27
Knowledge-Based Jobs…………………………………………………………………..28
Summary………………………………………………………………………………....29
Chapter III: Methodology………………………………………………………………………..30
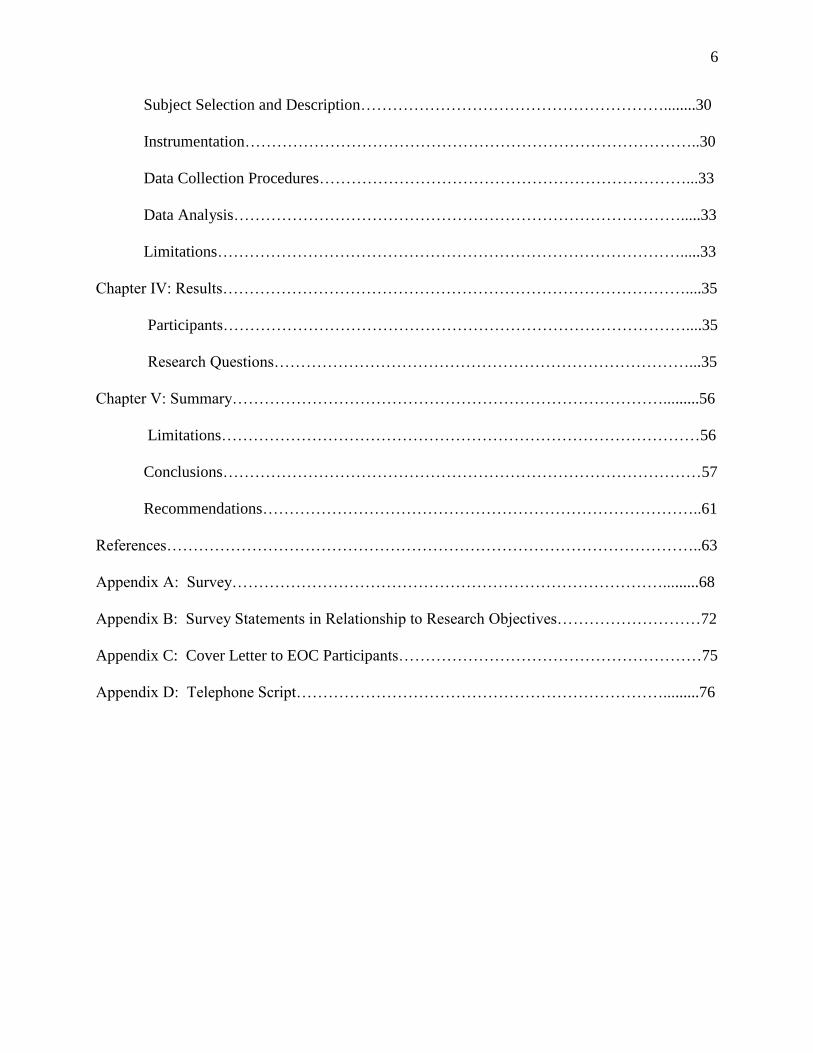
6
Subject Selection and Description…………………………………………………........30
Instrumentation…………………………………………………………………………..30
Data Collection Procedures……………………………………………………………...33
Data Analysis………………………………………………………………………….....33
Limitations…………………………………………………………………………….....33
Chapter IV: Results……………………………………………………………………………....35
Participants……………………………………………………………………………....35
Research Questions……………………………………………………………………...35
Chapter V: Summary……………………………………………………………………….........56
Limitations………………………………………………………………………………56
Conclusions………………………………………………………………………………57
Recommendations………………………………………………………………………..61
References………………………………………………………………………………………..63
Appendix A: Survey……………………………………………………………………….........68
Appendix B: Survey Statements in Relationship to Research Objectives………………………72
Appendix C: Cover Letter to EOC Participants…………………………………………………75
Appendix D: Telephone Script…………………………………………………………….........76
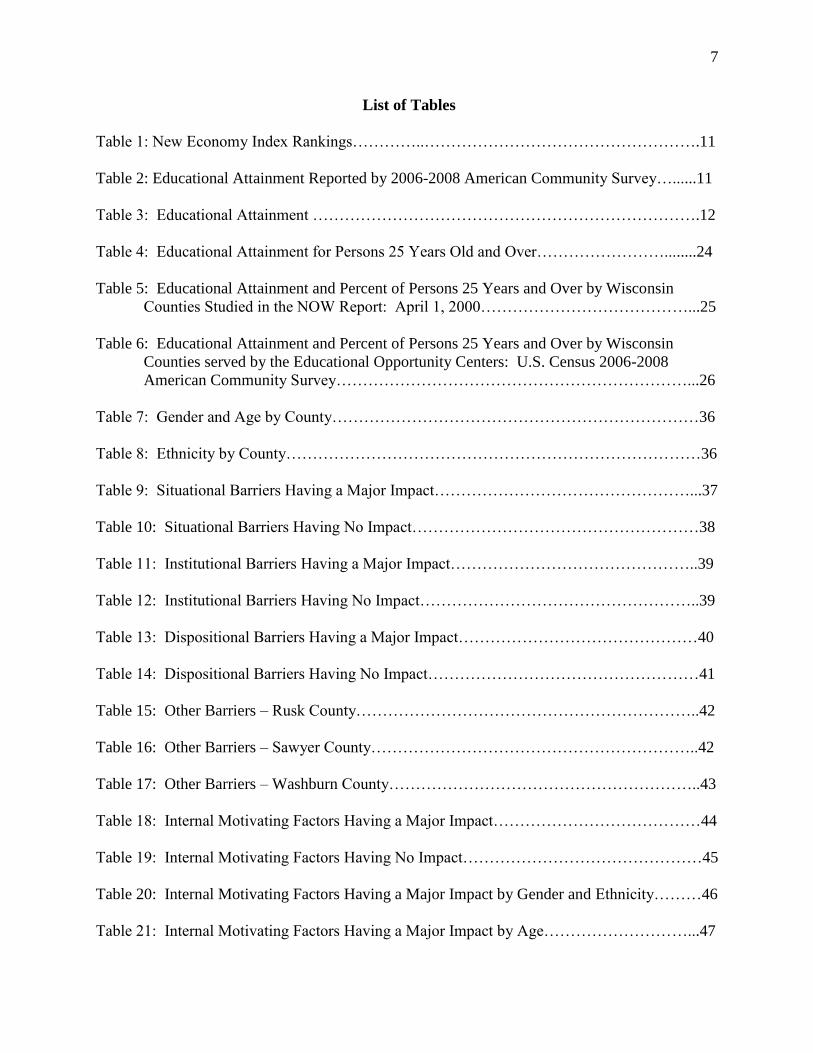
7
List of Tables
Table 1: New Economy Index Rankings…………..…………………………………………….11
Table 2: Educational Attainment Reported by 2006-2008 American Community Survey…......11
Table 3: Educational Attainment ……………………………………………………………….12
Table 4: Educational Attainment for Persons 25 Years Old and Over……………………........24
Table 5: Educational Attainment and Percent of Persons 25 Years and Over by Wisconsin
Counties Studied in the NOW Report: April 1, 2000…………………………………...25
Table 6: Educational Attainment and Percent of Persons 25 Years and Over by Wisconsin
Counties served by the Educational Opportunity Centers: U.S. Census 2006-2008
American Community Survey…………………………………………………………...26
Table 7: Gender and Age by County……………………………………………………………36
Table 8: Ethnicity by County……………………………………………………………………36
Table 9: Situational Barriers Having a Major Impact…………………………………………...37
Table 10: Situational Barriers Having No Impact………………………………………………38
Table 11: Institutional Barriers Having a Major Impact………………………………………..39
Table 12: Institutional Barriers Having No Impact……………………………………………..39
Table 13: Dispositional Barriers Having a Major Impact………………………………………40
Table 14: Dispositional Barriers Having No Impact……………………………………………41
Table 15: Other Barriers – Rusk County………………………………………………………..42
Table 16: Other Barriers – Sawyer County……………………………………………………..42
Table 17: Other Barriers – Washburn County…………………………………………………..43
Table 18: Internal Motivating Factors Having a Major Impact…………………………………44
Table 19: Internal Motivating Factors Having No Impact………………………………………45
Table 20: Internal Motivating Factors Having a Major Impact by Gender and Ethnicity………46
Table 21: Internal Motivating Factors Having a Major Impact by Age………………………...47
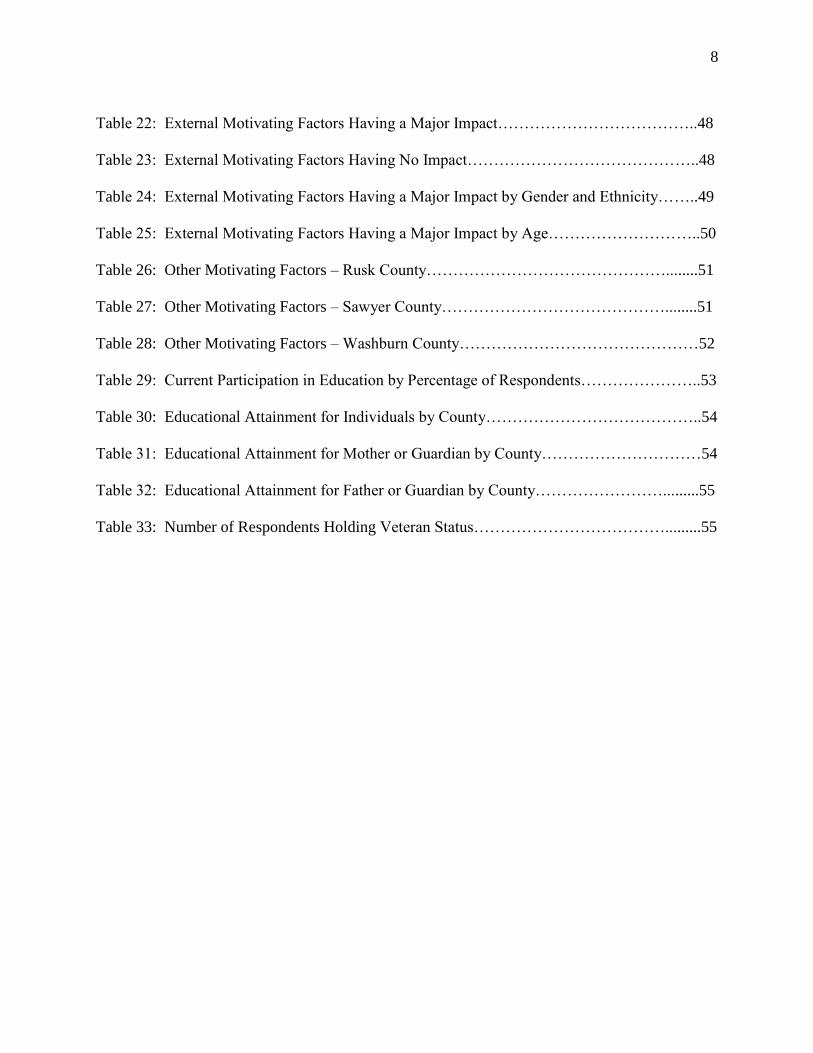
8
Table 22: External Motivating Factors Having a Major Impact………………………………..48
Table 23: External Motivating Factors Having No Impact……………………………………..48
Table 24: External Motivating Factors Having a Major Impact by Gender and Ethnicity……..49
Table 25: External Motivating Factors Having a Major Impact by Age………………………..50
Table 26: Other Motivating Factors – Rusk County………………………………………........51
Table 27: Other Motivating Factors – Sawyer County……………………………………........51
Table 28: Other Motivating Factors – Washburn County………………………………………52
Table 29: Current Participation in Education by Percentage of Respondents…………………..53
Table 30: Educational Attainment for Individuals by County…………………………………..54
Table 31: Educational Attainment for Mother or Guardian by County…………………………54
Table 32: Educational Attainment for Father or Guardian by County…………………….........55
Table 33: Number of Respondents Holding Veteran Status……………………………….........55
9
Chapter I: Introduction
Background of Study
The Wisconsin Technology Council offers the following vision of Wisconsin‟s future in
the publication Vision 2020: A Model Wisconsin Economy.
In a knowledge-based economy, Wisconsin‟s ability to compete will increasingly depend
on its ability to produce and retain a highly skilled, highly-educated workforce that can
fill positions in high-tech businesses. Rapidly growing, high-tech businesses require
large numbers of technically-skilled workers and technically-proficient managers.
(Wisconsin Technology Council, 2002, p. 12)
Wisconsin looks to institutions of higher education to increase this highly skilled, highly
educated workforce which is said to drive Wisconsin‟s economy. “Universities often are called
economic engines in reference to the bounty of human capital and new knowledge these
institutions produce for their states and the nation” (University of Wisconsin Madison News,
2006). Wisconsin public universities, technical colleges, community, and private colleges play
an integral part in educating the workforce and increasing knowledge-based jobs. It is said
Wisconsin‟s technical colleges “stimulate local economic development by providing a well-
educated workforce based solely on the occupational needs of local business and industry”
(Wisconsin Technical College System, 2009). Increasing human capital stimulates regional
economies; however, institutions of higher education cannot work alone to supply the vast
number of tech-savvy workers needed to compete in the new economy. Tom Still, President of
the Wisconsin Technology Council notes that partnerships are a natural off-shoot in fact, “It will
require partnerships between business, education and government.” (Still, 2004)
10
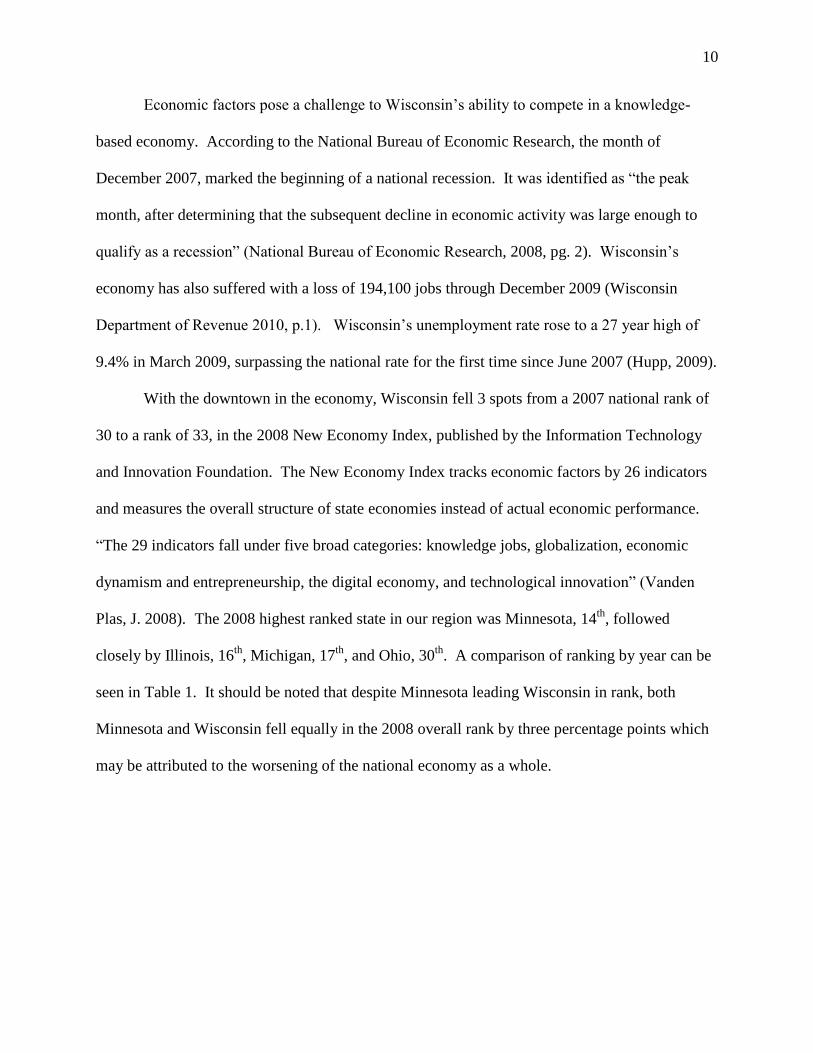
Economic factors pose a challenge to Wisconsin‟s ability to compete in a knowledge-
based economy. According to the National Bureau of Economic Research, the month of
December 2007, marked the beginning of a national recession. It was identified as “the peak
month, after determining that the subsequent decline in economic activity was large enough to
qualify as a recession” (National Bureau of Economic Research, 2008, pg. 2). Wisconsin‟s
economy has also suffered with a loss of 194,100 jobs through December 2009 (Wisconsin
Department of Revenue 2010, p.1). Wisconsin‟s unemployment rate rose to a 27 year high of
9.4% in March 2009, surpassing the national rate for the first time since June 2007 (Hupp, 2009).
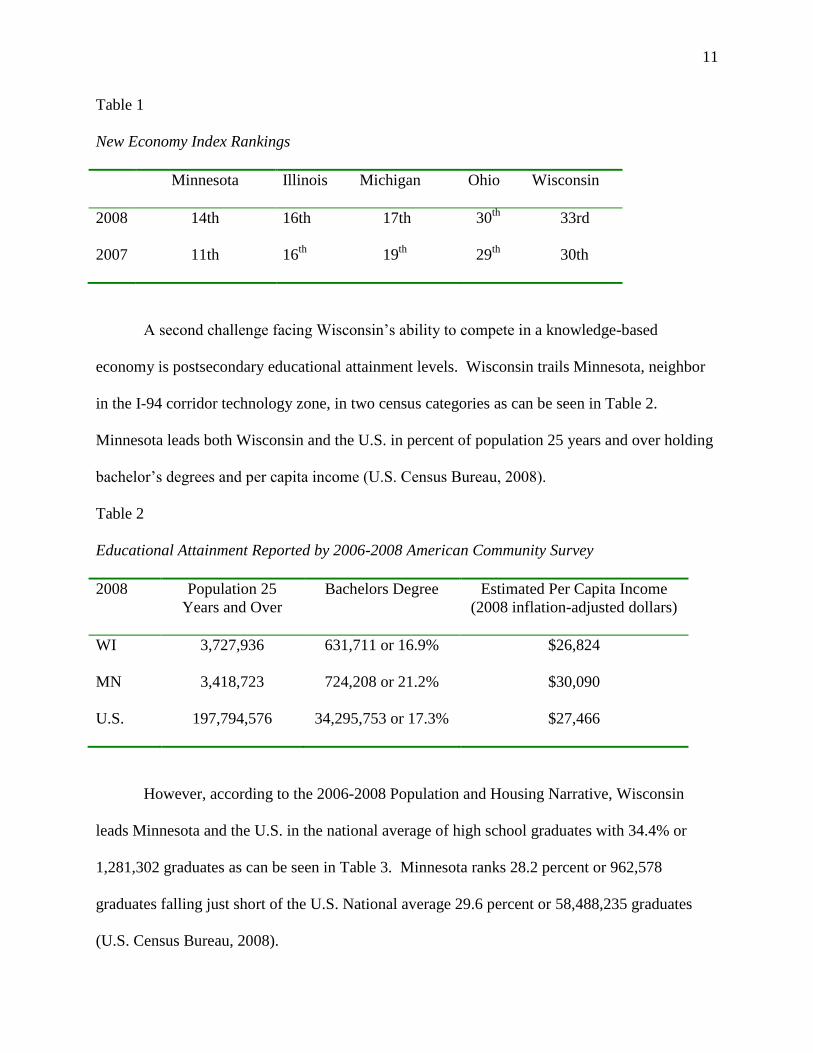
With the downtown in the economy, Wisconsin fell 3 spots from a 2007 national rank of
30 to a rank of 33, in the 2008 New Economy Index, published by the Information Technology
and Innovation Foundation. The New Economy Index tracks economic factors by 26 indicators
and measures the overall structure of state economies instead of actual economic performance.
“The 29 indicators fall under five broad categories: knowledge jobs, globalization, economic
dynamism and entrepreneurship, the digital economy, and technological innovation” (Vanden
Plas, J. 2008). The 2008 highest ranked state in our region was Minnesota, 14th
, followed
closely by Illinois, 16th
, Michigan, 17th
, and Ohio, 30th
. A comparison of ranking by year can be
seen in Table 1. It should be noted that despite Minnesota leading Wisconsin in rank, both
Minnesota and Wisconsin fell equally in the 2008 overall rank by three percentage points which
may be attributed to the worsening of the national economy as a whole.
11
Table 1
New Economy Index Rankings
Minnesota Illinois Michigan Ohio Wisconsin
2008 14th 16th 17th 30th
33rd
2007 11th 16th
19th
29th
30th
A second challenge facing Wisconsin‟s ability to compete in a knowledge-based
economy is postsecondary educational attainment levels. Wisconsin trails Minnesota, neighbor
in the I-94 corridor technology zone, in two census categories as can be seen in Table 2.
Minnesota leads both Wisconsin and the U.S. in percent of population 25 years and over holding
bachelor‟s degrees and per capita income (U.S. Census Bureau, 2008).
Table 2
Educational Attainment Reported by 2006-2008 American Community Survey
2008 Population 25
Years and Over
Bachelors Degree Estimated Per Capita Income
(2008 inflation-adjusted dollars)
WI 3,727,936 631,711 or 16.9% $26,824
MN 3,418,723 724,208 or 21.2% $30,090
U.S. 197,794,576 34,295,753 or 17.3% $27,466
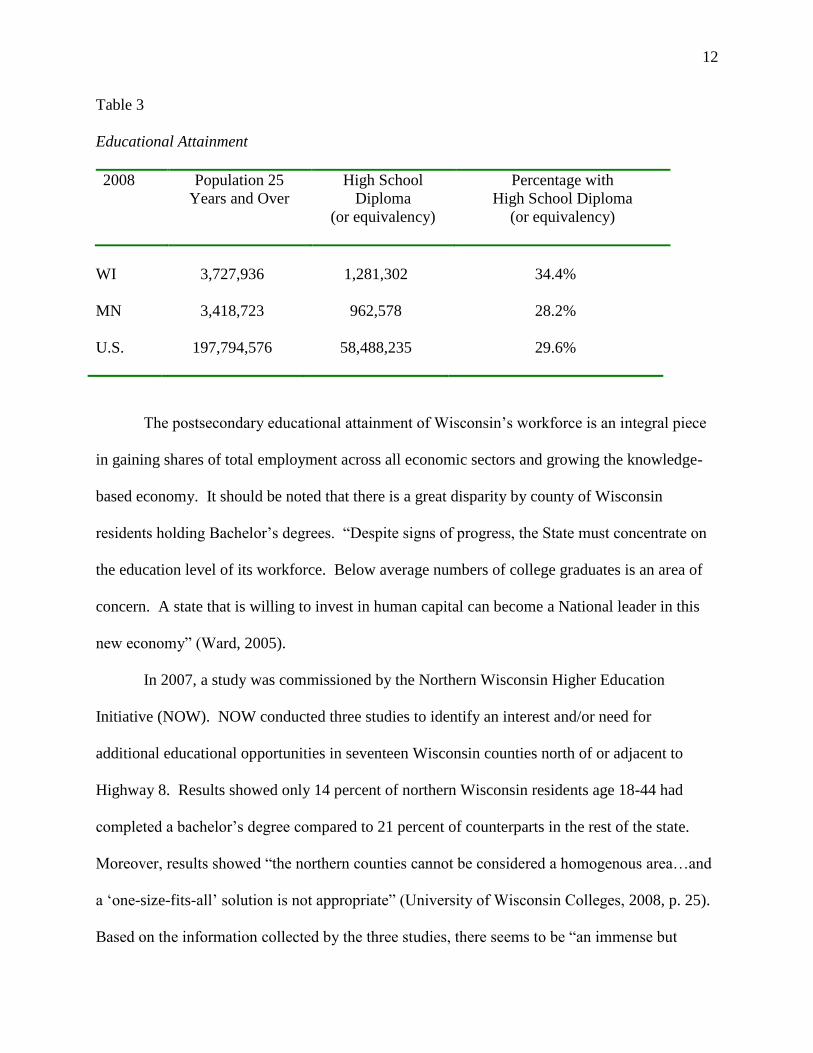
However, according to the 2006-2008 Population and Housing Narrative, Wisconsin
leads Minnesota and the U.S. in the national average of high school graduates with 34.4% or
1,281,302 graduates as can be seen in Table 3. Minnesota ranks 28.2 percent or 962,578
graduates falling just short of the U.S. National average 29.6 percent or 58,488,235 graduates
(U.S. Census Bureau, 2008).
12
Table 3
Educational Attainment
2008 Population 25
Years and Over
High School
Diploma
(or equivalency)
Percentage with
High School Diploma
(or equivalency)
WI 3,727,936 1,281,302 34.4%
MN 3,418,723 962,578 28.2%
U.S. 197,794,576 58,488,235 29.6%
The postsecondary educational attainment of Wisconsin‟s workforce is an integral piece
in gaining shares of total employment across all economic sectors and growing the knowledge-
based economy. It should be noted that there is a great disparity by county of Wisconsin
residents holding Bachelor‟s degrees. “Despite signs of progress, the State must concentrate on
the education level of its workforce. Below average numbers of college graduates is an area of
concern. A state that is willing to invest in human capital can become a National leader in this
new economy” (Ward, 2005).
In 2007, a study was commissioned by the Northern Wisconsin Higher Education
Initiative (NOW). NOW conducted three studies to identify an interest and/or need for
additional educational opportunities in seventeen Wisconsin counties north of or adjacent to
Highway 8. Results showed only 14 percent of northern Wisconsin residents age 18-44 had
completed a bachelor‟s degree compared to 21 percent of counterparts in the rest of the state.
Moreover, results showed “the northern counties cannot be considered a homogenous area…and
a „one-size-fits-all‟ solution is not appropriate” (University of Wisconsin Colleges, 2008, p. 25).
Based on the information collected by the three studies, there seems to be “an immense but

13
dispersed need for higher education in Northern Wisconsin and specific implementation plans
should be developed for the provision of those additional opportunities” (University of
Wisconsin Colleges, 2008, p. 4).
Statement of the Problem
Wisconsin ranks higher in percentage of adults 25 years and older who have completed a
high school diploma than Minnesota and the country as a whole but ranks lower in percentage of
adults with a Bachelor‟s degree or higher. (U.S. Census Bureau, 2007) Moreover, Wisconsin‟s
educational attainment levels vary widely by county with fewer northern Wisconsin adults
pursuing higher education than in the rest of the state. (University of Wisconsin Colleges, 2008)
Purpose of the Study
The purpose of the study was to identify barriers to higher education impacting adults in
Northern Wisconsin and identify motivations that exist in overcoming these barriers. Findings
and recommendations will benefit students and educational institutions in the State of Wisconsin.
A survey developed by the researcher was used to collect data from adults in counties served by
the Educational Opportunity Centers located in Eau Claire and Rice Lake, Wisconsin. The
Educational Opportunities Centers (EOC) is a federally funded TRIO program providing
counseling and information on college admissions to low-income and first-generation adults
entering or continuing a program of postsecondary education. The survey will be conducted in
December 2010.
Research Objectives
The following research objectives will be addressed by this study:
1) Determine barriers perceived to limit adult participation in postsecondary education.
14
2) Determine motivating factors that increase aspirations in adults to participate in
postsecondary education.
3) Identify the difference in barriers perceived to limit adult participation in postsecondary
education common to specific counties in Northern Wisconsin.
4) Identify differences in motivating factors that increase aspirations in adults to participate
in postsecondary education common among gender, ethnicity and age groups.
Importance of Topic
This research topic is important for the following reasons:
1) Barriers, if any, should be determined to widen participation in education by adults in
northern Wisconsin.
2) Motivational factors that caused adults to come forward and seek services for career
planning or the admissions process should be documented.
3) Current educational disparities of the number of college graduates in northern Wisconsin
as compared to the rest of the state should be studied. This study may provide insight as
to the type of post-secondary planning or assistance northern Wisconsin adults need in
continuing their education beyond high school. The data may also aid institutions of
higher education in developing regional recruitment strategies.
4) If Wisconsin invests in human capital and provides educational opportunities for
increasing educational attainment, citizens will enjoy increased prosperity. This
investment could provide a dual benefit of increasing Wisconsin‟s highly skilled, highly
educated workforce, and strengthening its standing in the new economy.
Limitations of Study
This study has the following limitations:

15
1) The study was not able to sample all counties in Northern Wisconsin and was restricted
to participants of the three northern-most counties served by the Educational Opportunity
Centers (EOC) headquartered in Eau Claire. Therefore, the survey results will be limited
to the opinions and responses from the residents of the three-county area.
2) This study was administered to adults seeking services from the EOC. It is understood
that some motivating factor or life changing event caused them to seek help with career
exploration and the possibility of continuing their education.
3) This study is a one-time survey producing a regional snap-shot of adults during a
particular time period. The results may shift over time depending upon changing
demographics or how quickly the economy recovers in a particular sub-region.
Definition of Terms
The following terms are defined for the purpose of this study:
Educational Opportunity Centers (EOC) - The Educational Opportunity Centers
Program (EOC) is a federally funded TRiO program providing counseling and information on
college admissions to qualified adults seeking to enter or continue a program of postsecondary
education. The goal of the EOC program is to increase the number of adult participants who
enroll in postsecondary education institutions (U.S. Department of Education).
First-Generation College Student – “An individual both of whose parents did not
complete a baccalaureate degree; or in the case of any individual who resided with and received
support from only one parent, an individual whose only such parent did not complete a
baccalaureate degree.” (U.S. Department of Education)
Knowledge-Based Economy - Embedded knowledge creates a wealthy society with an
ever increasing standard of living for everyone. The higher the educational attainment of the
16
worker, the more knowledge the person could apply to the job, thereby increasing the worker‟s
overall effectiveness (Wisconsin Technology Council, 2002)
Non-traditional Students – Part-time status and age are most common factors. Students
who satisfy one of the following: delays enrollment after high school, attends part-time for some
of the academic year, works 35 or more hours per week while enrolled, qualifies for financially
independent status for financial aid, has dependents other than a spouse, no high school diploma
or has a GED or other credential. (National Center for Education Statistics, 2002)
TRIO Programs – “The Federal TRIO Programs (TRIO) are Federal outreach and
student services programs designed to identify and provide services for individuals from
disadvantaged backgrounds.” (U.S. Department of Education)
17
Chapter II: Literature Review
Introduction
This chapter includes a comprehensive literature review of models and theories of adult
participative behavior. Adult learners, barriers and deterrents to postsecondary education, and
motivation to overcome barriers are addressed in this chapter. Postsecondary educational
attainment and regional disparity of educational attainment in Wisconsin is reviewed. The
importance of increasing the number of adults with some credits past high school to participate
in higher education is explored. Literature brings to light the perspectives of stakeholders and
the effectiveness of collaboration and partnerships. The chapter concludes with the importance
of participation in higher education thereby increasing the number of high paying knowledge-
based jobs to strategically aligning Wisconsin to compete in the new, global economy.
Models and Theory of Adult Participative Behavior
To better understand the strategies for overcoming barriers to adult participation in
postsecondary education, existing models and theories of participative behavior were reviewed.
The Rubenson Recruitment Paradigm model is a cognitive approach sometimes referred to as an
expectancy-valence approach. It focuses on adult learner perceived value of the learning activity
(valence) and the likelihood of being able to participate and benefit from the learning activity
(expectancy). Participation hinges on the learner view of personal and environmental variables.
Personal variables include needs, attributes, and prior experience. Environmental variables
include learner perception of control over their life, social norms and what educational
possibilities are available. (Rubenson 1977)
The Cross Chain-of-Response model is based on self-concept or self-evaluation and
attitude toward learning. Participation comes from within the individual not from outside forces.
18
Valence and expectancy are largely influenced by life transitions and motivation plays a big role
in learner response to barriers and educational opportunities. Cross categorized barriers by
situational, institutional, and dispositional. (Cross 1981)
The Darkenwald and Merriam Psychosocial Interaction Model is based on a set of
responses to both internal and external stimuli and finds socio-economic status as the strongest
determining factor of participation. The model proposed that the more perceived value placed
on education the higher the participation rate. Four types of barriers were found: situational,
institutional, psychosocial, and informational. (Darkenwald and Merriam 1982) Darkenwald
and others also developed the Deterrents to Participation Scale which identified six barriers:
lack of confidence, lack of course relevancy, time constraints, low personal priority, cost, and
personal and family. (National Center for Education Statistics, 1998)
In a review of several theories, C.L. Scanlon found that deterrents contain multiple
variables which are influenced by individual learner perception of their significance, and the
impact of the variables vary according to individual and life circumstances. Scanlon‟s eight
categories of deterrence factors are listed below (Scanlon, C.L. 1986).
Individual and family or home related problems
Cost concerns
Questionable worth, relevance or quality of educational opportunities
Negative educational perceptions, including prior unfavorable experiences
Apathy or lack of motivation
Lack of self confidence
A general tendency toward non-affiliation
Incompatibilities of time and/or place.
19
The review of literature also described demographic variables of age, gender, ethnicity,
income, employment, and place of residence. Other variables common to special populations
were noted. For example, in a 2009 study of Chicago public schools, three central barriers to
college degree attainment were found: “poor academic preparation that undermines minority and
low-income students‟ access to and performance in college, students‟ difficulties in navigating
the college enrollment process, and the declining real value of financial aid combined with rising
college costs.” (Nagaoka, Roderick, & Coca, 2009)
Adult Learners
Malcom Knowles, historian and champion of adult education in the United States,
defined adult learners in a broad sense. Knowles‟ social definition is when “an individual begins
to perform adult roles such as full-time worker, participating citizen, spouse, parent, etc. and the
psychological definition being when “individuals develop a self-concept of being responsible for
their own life” (Crawford, 2004).
Much of the literature categorized adult learners by a variety of factors ranging from age,
gender, employment, socio-economic status, veteran, living on or off-campus, and by various
levels of educational attainment. Titles included: first-time/full-time, non-traditional, adult/re-
entry, stopping out, independent, first-generation, ageless, lifelong, and third age learner. To
further complicate the profile, in much of the literature, adult learners were classified by various
age groups including 25 years and over, 18-44, 25-34, 35-44, 44 and up, and over the age of 50.
Literature classified adult learners by educational attainment levels of high school graduate or
equivalency, some college-no degree, associates, bachelor, graduate or professional. These
conflicting definitions, factors, and age groups made comparison of adult learners difficult.
Barriers and Deterrents to Postsecondary Education
20
Barriers were described as “factors which keep people who want to participate in some
activity from doing so (Marsden 1980). However, barriers were also viewed as constraints that
can drop participation below a certain level but not eliminate participation entirely. Alexandris
and Carroll (1997) found a distinct difference between two kinds of constraints: “blocking
constraints, those that completely preclude participation, and inhibiting constraints, those that
merely inhibit the ability to participate to a certain extent” (National Center for Education
Statistics, 1998). Because barrier connotates an impediment or unmovable obstacle, another
term found in the literature review was deterrent. This less simplistic term was used by
Valentine and Darkenwald (1990) and demonstrated that deterrents can be multi-faceted and
work in combination with other factors in affecting participation in adult education.
Many research studies are available on barriers to participation in higher education
classified by particular types of adult education. In a review of several studies on barriers by the
U.S. Department of Education‟s National Center for Education Statistics (NCES) two important
situational barriers were consistent: 1) lack of time, and 2) family responsibilities. Two main
institutional barriers were found: 1) inconvenient scheduling of classes, and 2) cost of courses.
Six important dispositional barriers were reported: 1) lack of encouragement or support from
family or friends, 2) worry about ability to succeed, 3) negative prior educational experiences, 4)
fear of not fitting in, 5) feeling too old to be going to school, and 6) perceived notion of difficulty
in starting.
Motivation to Overcome Barriers
“It is some motive that energizes the athlete, and it is some motive that directs the
student‟s behavior toward one particular goal rather than another. The study of
motivation concerns those processes that give behavior its energy and direction. Energy
21
implies that behavior has strength – that it is relatively strong, intense, and persistent.
Direction implies that behavior has purpose – that it is aimed or guided toward achieving
some particular goal or outcome”. (Reeve 2005, pg. 6)
Motivation theory originated in ancient Greece yet motivation study has only developed
over the last hundred years. Motivational concepts evolved from three grand theories based on
the biological and physiological perspectives: Will (Descartes), Instinct (Darwin), and Drive
(Woodworth, 1918; Freud, 1915; and Hull, 1943). During the 1960‟s and 1970‟s the field of
psychology and the study of motivation transitioned away from the biological and physiological
perspective and moved to the cognitive perspective of goals and expectancy. This time period
became known as the Cognitive Revolution.
Mini-theories of Motivation (Reeve 2005, pg. 33):
Achievement motivation theory (Atkinson, 1964)
Attributional theory of achievement motivation (Weiner, 1972)
Cognitive dissonance theory (Festinger, 1957)
Effectance motivation (White, 1959; Harter, 1978a)
Expectancy X Value theory (Vroom, 1964)
Flow theory (Csikszentmihalyi, 1975)
Intrinsic motivation (Deci, 1975)
Goal-setting theory (Locke, 1968)
Learned helplessness theory (Seligman, 1975)
Reactance theory (Brehm, 1966)
Self-efficacy theory (Bandura, 1977)
Self-schemas (Markus, 1977)
22
The Cognitive Revolution led to the humanistic movement and Abraham Maslow‟s
Hiirarchy of Needs. According to Maslow, “an individual is ready to act upon the growth needs
if and only if the deficiency needs are met” (Huitt, 2001).
Motivation is a variable to be measured in participative behavior. The two main types of
motives are said to be intrinsic or extrinsic. Intrinsic or internal experiences are based on needs,
cognitions, and emotion and the need for achievement. Adult learners do not usually return to
school because of peer pressure or parental expectations but instead because of some internal
need like self-improvement or studying a subject of interest. Internal motives can either energize
a learners approach to education or cause them to avoid the environment all together.
External or extrinsic motivation consists of tensions that are internalized originating from
perceived expectations of others. Adult learners may return to school due to an external event
like the loss of a job or retraining. “The best way to motivate adult learners is simply to enhance
their reasons for enrolling and decrease the barriers” (Lieb, 1991).
Postsecondary Educational Attainment
Over the last two decades the United States has fallen as the leader in educational
attainment rankings. In its report Adult Learning in Focus, the Council for Adult and
Experiential Learning (CAEL) reports that the United States now ranks “tenth among
Organization for Economic Cooperation and Development countries in the percentage of young
adults (aged 25-34) with a postsecondary credential” (Council for Adult and Experiential
Learning, 2008 pg. 22). It is thought that this ranking in part is not because the U.S. is declining
but that other nations are catching up and outperforming the United States. Barry McGaw,
director of the Paris-based Organization for Economic Cooperation and Development, a 30-
nation group ranking educational systems by country, applauds the U.S. for remaining “atop the
23
„knowledge economy,‟ one that uses information to produce economic benefits.” However,
McGaw cautions that "education's contribution to that economy is weakening" (Lagorio, 2005).
At the national level, an area of concern is the change in educational attainment among
younger adults. An aging workforce and the retirement of the baby boom generation may be to
blame. The College Board warns “For the first time in the history of our country we face the
prospect that the educational level of one generation of Americans will not exceed, will not
equal, perhaps will not even approach, the level of its parents” (College Board Advocacy, 2008,
pg. 5). To further illustrate this trend,
Young adults are less likely to have earned a degree than their older counterparts,
according to a new report from the Brookings Institution that gathers nearly a decade‟s
worth of data from the government's American Community Survey and foreshadows next
year‟s release of the 2010 Census. Though the percent of adults with a baccalaureate
degree rose from 24 to 28 from 2000 to 2008, a smaller percentage of 25-to-34 year-olds
than 35-to-44 year-olds held one in 2008. The reverse was true in 2000. (Falling
Education Attainment, 2010)
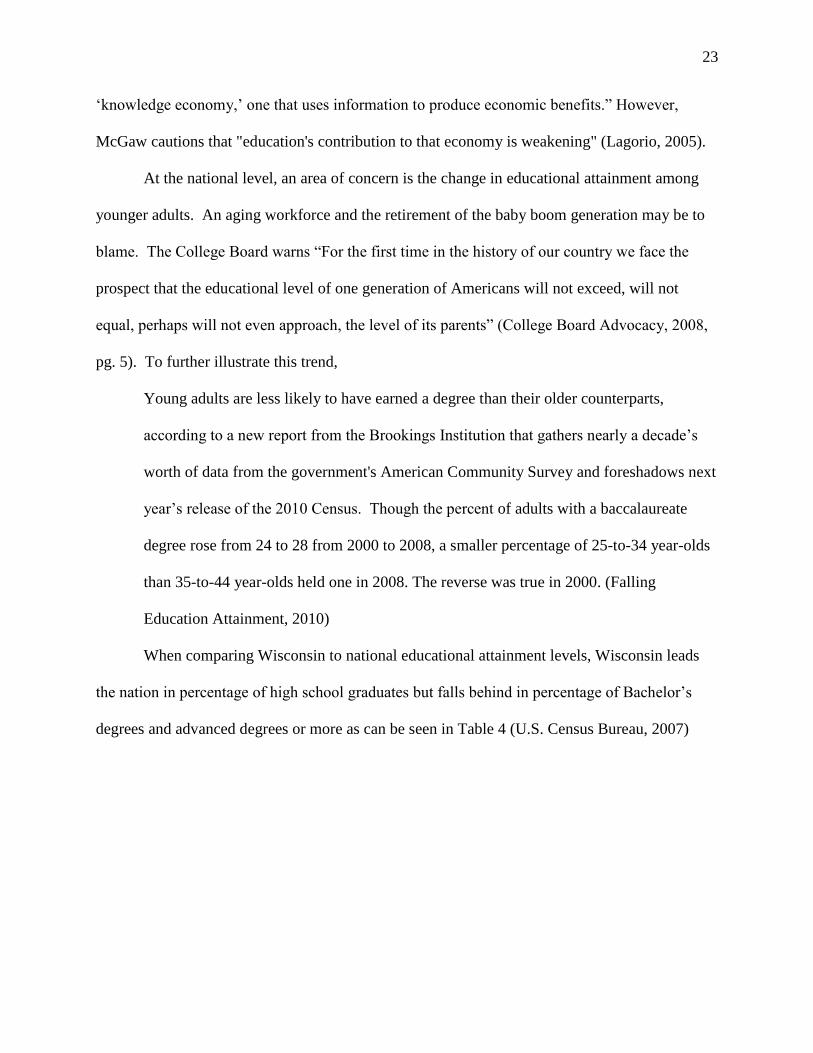
When comparing Wisconsin to national educational attainment levels, Wisconsin leads
the nation in percentage of high school graduates but falls behind in percentage of Bachelor‟s
degrees and advanced degrees or more as can be seen in Table 4 (U.S. Census Bureau, 2007)
24
Table 4
Educational Attainment for Persons 25 Years Old and Over
2007 Percent with High
School or more
Percent with
Bachelor‟s or more
Percent with Advanced
degree or more
U.S. 84.5 27.5 10.1
Wisconsin 89.0 25.4 8.5
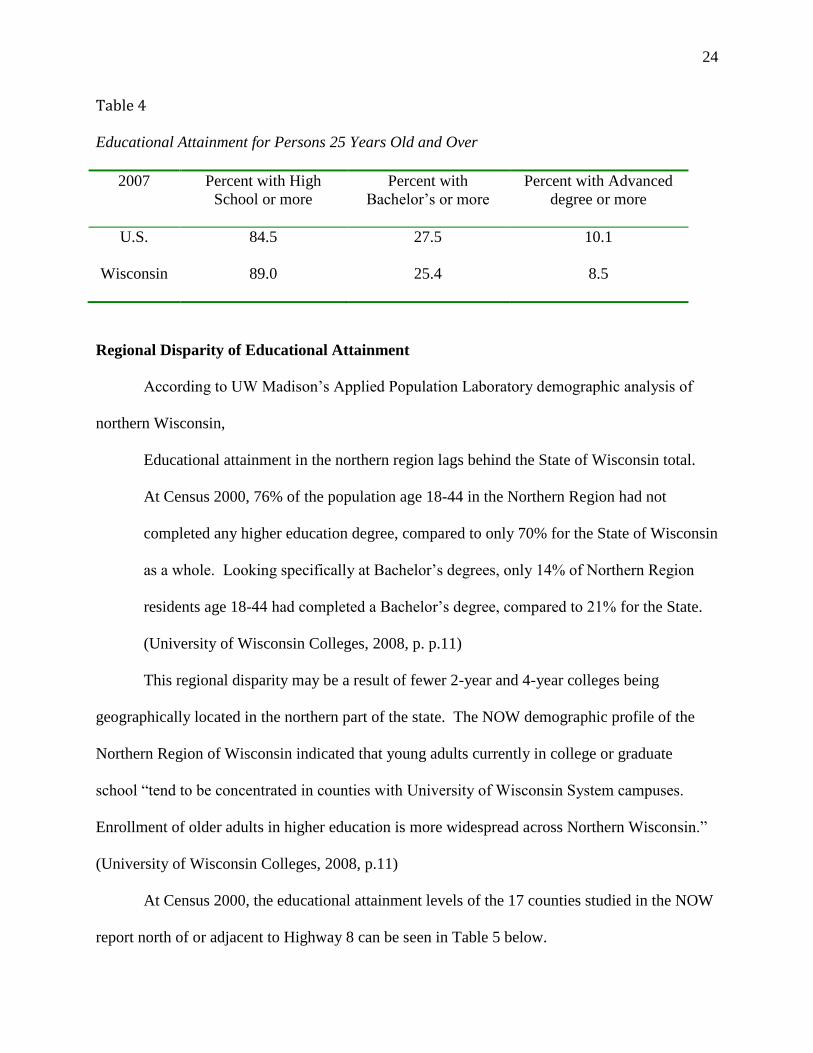
Regional Disparity of Educational Attainment
According to UW Madison‟s Applied Population Laboratory demographic analysis of
northern Wisconsin,
Educational attainment in the northern region lags behind the State of Wisconsin total.
At Census 2000, 76% of the population age 18-44 in the Northern Region had not
completed any higher education degree, compared to only 70% for the State of Wisconsin
as a whole. Looking specifically at Bachelor‟s degrees, only 14% of Northern Region
residents age 18-44 had completed a Bachelor‟s degree, compared to 21% for the State.
(University of Wisconsin Colleges, 2008, p. p.11)
This regional disparity may be a result of fewer 2-year and 4-year colleges being
geographically located in the northern part of the state. The NOW demographic profile of the
Northern Region of Wisconsin indicated that young adults currently in college or graduate
school “tend to be concentrated in counties with University of Wisconsin System campuses.
Enrollment of older adults in higher education is more widespread across Northern Wisconsin.”
(University of Wisconsin Colleges, 2008, p.11)
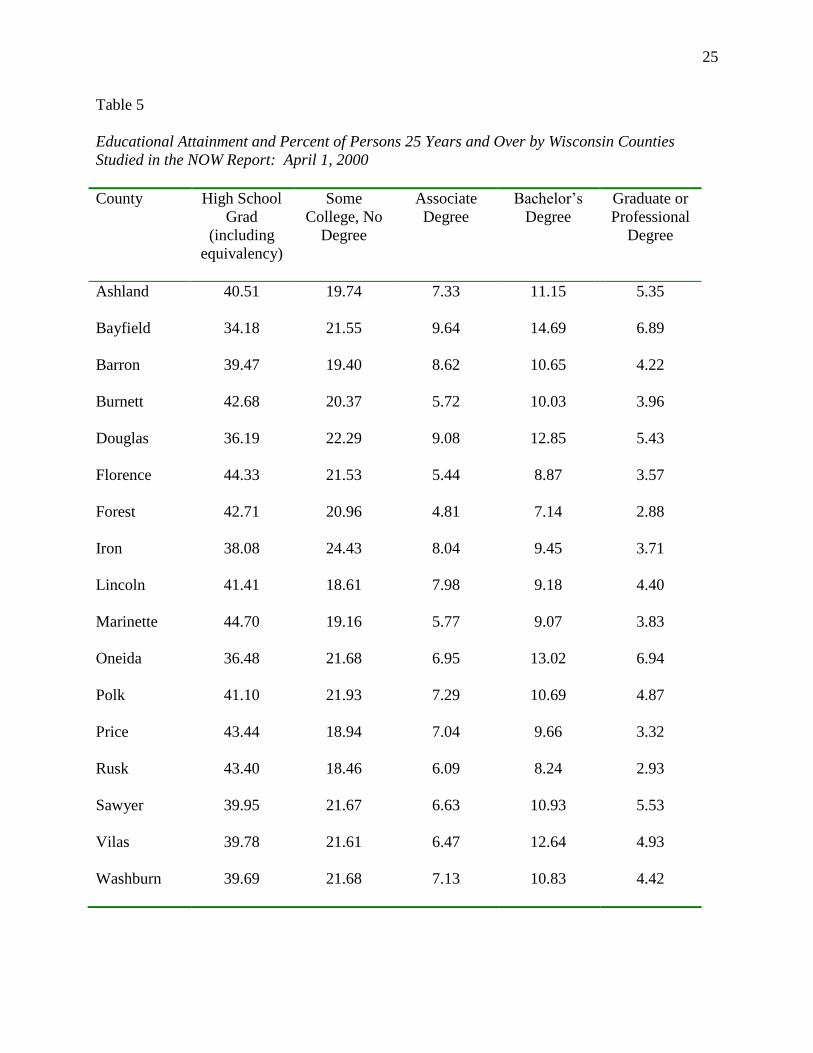
At Census 2000, the educational attainment levels of the 17 counties studied in the NOW
report north of or adjacent to Highway 8 can be seen in Table 5 below.
25
Table 5
Educational Attainment and Percent of Persons 25 Years and Over by Wisconsin Counties
Studied in the NOW Report: April 1, 2000
County High School
Grad
(including
equivalency)
Some
College, No
Degree
Associate
Degree
Bachelor‟s
Degree
Graduate or
Professional
Degree
Ashland 40.51 19.74 7.33 11.15 5.35
Bayfield 34.18 21.55 9.64 14.69 6.89
Barron 39.47 19.40 8.62 10.65 4.22
Burnett 42.68 20.37 5.72 10.03 3.96
Douglas 36.19 22.29 9.08 12.85 5.43
Florence 44.33 21.53 5.44 8.87 3.57
Forest 42.71 20.96 4.81 7.14 2.88
Iron 38.08 24.43 8.04 9.45 3.71
Lincoln 41.41 18.61 7.98 9.18 4.40
Marinette 44.70 19.16 5.77 9.07 3.83
Oneida 36.48 21.68 6.95 13.02 6.94
Polk 41.10 21.93 7.29 10.69 4.87
Price 43.44 18.94 7.04 9.66 3.32
Rusk 43.40 18.46 6.09 8.24 2.93
Sawyer 39.95 21.67 6.63 10.93 5.53
Vilas 39.78 21.61 6.47 12.64 4.93
Washburn 39.69 21.68 7.13 10.83 4.42
26
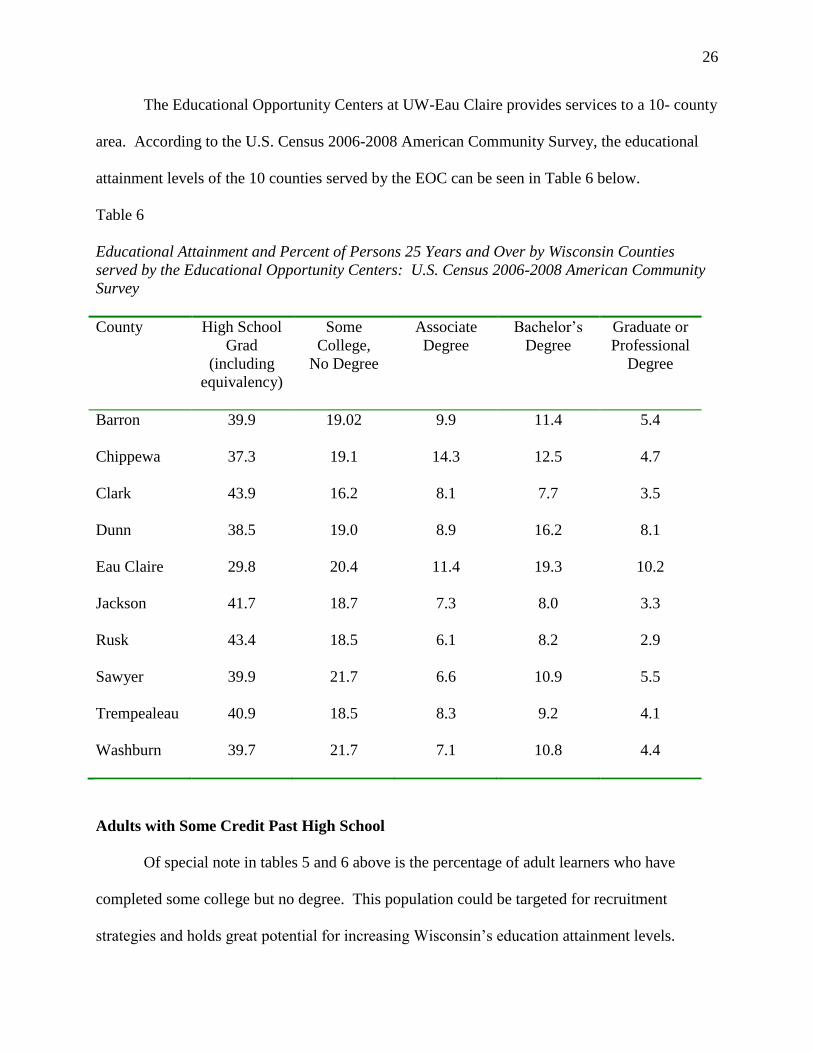
The Educational Opportunity Centers at UW-Eau Claire provides services to a 10- county
area. According to the U.S. Census 2006-2008 American Community Survey, the educational
attainment levels of the 10 counties served by the EOC can be seen in Table 6 below.
Table 6
Educational Attainment and Percent of Persons 25 Years and Over by Wisconsin Counties
served by the Educational Opportunity Centers: U.S. Census 2006-2008 American Community
Survey
County High School
Grad
(including
equivalency)
Some
College,
No Degree
Associate
Degree
Bachelor‟s
Degree
Graduate or
Professional
Degree
Barron 39.9 19.02 9.9 11.4 5.4
Chippewa 37.3 19.1 14.3 12.5 4.7
Clark 43.9 16.2 8.1 7.7 3.5
Dunn 38.5 19.0 8.9 16.2 8.1
Eau Claire 29.8 20.4 11.4 19.3 10.2
Jackson 41.7 18.7 7.3 8.0 3.3
Rusk 43.4 18.5 6.1 8.2 2.9
Sawyer 39.9 21.7 6.6 10.9 5.5
Trempealeau 40.9 18.5 8.3 9.2 4.1
Washburn 39.7 21.7 7.1 10.8 4.4
Adults with Some Credit Past High School
Of special note in tables 5 and 6 above is the percentage of adult learners who have
completed some college but no degree. This population could be targeted for recruitment
strategies and holds great potential for increasing Wisconsin‟s education attainment levels.
27
According to the CAEL Wisconsin Profile of Adult Learners, “of the 3,519,690 Wisconsin
working-age adults (18 to 64) with no college degree, 833,128 have completed some college but
no degree” (Council for Adult and Experiential Learning 2008, p.1). Unfortunately, this number
is not broken down by county or region.
Other states are targeting this population. The state of Kentucky is seeking to double the
number of adults in the labor force who have college degrees. In a study titled Colleges Woo
Adults Who Have Some Credits but No Degree, it is reported that “there are 11,000 or so people
in Kentucky who came within a course or two of earning a college degree, but never did. Almost
half a million more took a few college courses but then dropped out. Now educators are trying
to lure back those erstwhile students to finish what they started”. (Sander, L, 2008)
Perspectives of Stakeholders and Importance of Collaboration and Partnerships
As mentioned in Chapter I, Tom Still notes that partnerships between business,
education, and government should be encouraged. Still states the importance of cooperation
“within that triangle, throughout the „K-through-gray‟ learning spectrum (Still, 2004). Part of
the challenge of maintaining connections to adult learners who have no high school diploma or
have stopped out from postsecondary education is putting in place a system of collaboration
between stakeholders. True collaboration occurs at a variety of levels and arises from a shared
vision. “The term collaboration is reserved for organizations that join together to create a new
entity.” (Padak & Sapin, 2000) Formal agreements are recommended to address goals,
financing, and outline areas of contribution. Padak & Sapin have found the best way to match
collaborators at the community level is to begin with a needs assessment of the adult learner and
begin exploring possible partnerships. The authors caution that collaborative relationships are
complex and note the importance of consensus decision-making.

28
The Florida K-20 educational system is applauded for designing a vehicle for collecting
data such as electronic transcripts of high school students. The Florida K-20 Education Data
Warehouse “includes data on all students in public K–12, college, university, and career and
technical students, and can measure student employment and earnings outcomes by connecting
to the state‟s wage record files” (Brookings). To date, there are only a few states that have
student data systems in place. However, as a result of the stimulus package, other states are
moving in this direction. This may provide the link that is needed to assess the effectiveness of
partnerships and measure earnings by educational attainment in Northern Wisconsin.
In November 2009, the Bill and Melinda Gates Foundation awarded $100,000 to the
Midwestern Higher Education Compact (MHEC) to lead a one year initiative to explore a multi-
state online credential repository. The Minneapolis-based MHEC was founded in 1991,
consisting of twelve neighboring states including Wisconsin. The Midwestern Credential
Repository for Education, Skills, and Training (Midwest-CREST) would allow citizens to “bank
or store college credits they have earned from multiple institutions in a single location and to
document workplace training, community education, and other formalized learning experiences”
(Roberson, 2009). The information would then be made available to schools of higher education
who would bid for the students to complete their degree at their institution. The initiative would
benefit students who start and stop their education or attend courses at multiple schools. It
would help reduce transfer credit loss and bundle educational and career achievements. “The
Midwest-CREST would help facilitate this process by converting credits and other learning
experiences into credentials that have currency in the labor market.” (Roberson, 2009)
Knowledge-Based Jobs
29
At a meeting of the National Governors Association, Virginia Governor Mark Warner
described a new reality in which “Knowledge-based jobs are going to go where the knowledge
workers are and the promise of economic growth and prosperity is going to go with them” (Hunt
& Tierney, 2006, p. 7). Similarly, Wisconsin Governor Jim Doyle offered his vision of the
Wisconsin economy by the year 2020. Governor Doyle envisioned Wisconsin as a “globally
competitive center of research and applied technology…with the help of cutting-edge
technologies developed at home” (Wisconsin Technology Council, 2002, p. 1). Moreover,
Governor Doyle envisioned a state with per capita wages above that of the national average.
Higher per capita wages go hand-in-hand with larger concentrations of college educated
residents. Wisconsin faces a dual challenge in increasing the number of adults participating in
higher education and in increasing the number of high paying knowledge-based jobs in the state
to retain those workers.
Summary
The literature review clearly indicates sufficient data on types of barriers facing adult
learners but somewhat less data on intrinsic and extrinsic motivation of adult learners. There is a
lack of literature on perceived barriers faced by adult learners in the Northern half of Wisconsin.
Therefore, additional information gathered from survey respondents may provide an important
starting point to increase educational attainment in Northern Wisconsin.
30
Chapter III: Methodology
Introduction
The purpose of this research was to identify barriers to higher education impacting adults
in Northern Wisconsin and discover motivational factors that increase aspiration to participate in
postsecondary education. This chapter includes subject selection and description,
instrumentation, data collection procedures, data analysis, and limitations.
Subject Selection and Description
The subjects in this study were limited to active 2009-2010 EOC participants from the
Wisconsin counties of Rusk, Sawyer, and Washburn. These counties represent the three
northern-most counties served by the EOC. Twenty percent of Sawyer County residents, 16% of
Rusk County residents, and 13% of Washburn residents were in poverty (U.S. Census Bureau:
2008). This is in comparison to the state average of 11%. It should be noted that Sawyer County
has the second highest poverty rate in the state. Non-probability convenience sampling was
used, a technique whereby not all members of a population are given an equal chance to be
selected. This type of sampling was selected because the participants were readily accessible to
the researcher. Surveys were administered to all available EOC participants in the three-county
area. Participation was on a voluntary basis. There were a total of 15 males and 20 females
surveyed for a total of 35 subjects. Twenty-one participants completed the survey resulting in a
60% response rate.
Instrumentation
A 46 statement survey was developed by the researcher after a review of existing
literature on barriers to participation in postsecondary education. The survey was constructed
using Qualtrics software. A five-point Likert scale ranking was used for questions relating to
31
barriers to education and motivating factors for participation. It was felt that the Likert scale
offered the best possible way to collect responses relevant to participants‟ situations. The Likert
scale is effective for expressing respondents‟ attitudes or feelings and for ease of scoring survey
results by the researcher. Two open-ended questions were provided for respondents to list other
barriers and motivating factors experienced. It was felt that an open ended question would allow
for collecting extra information that could be used for secondary analysis by the faculty and staff
of the EOC. Please refer to Appendix A for a copy of the finalized survey.
The survey was modeled after the Chain-of-Response Model (Cross 1981) whereby adult
participation in learning is thought to come from an internal response rather than from outside
influences. The main precepts affecting participation in postsecondary education being self-
evaluation and attitude toward education; influence of life transitions; and the effect motivation
plays on an individual‟s perception and subsequent reaction to opportunities and barriers.
Additional survey questions were modeled after Scanlon‟s review of several theories of
deterrents to participation in adult education (Scanlon, 1986) whereby a deterrent includes
variables that are influenced by an individual‟s perception of their significance, and how they
affect the individual based on life circumstance. Questions were organized according to:
individual, family or home related problems; cost; perceived value of educational opportunity;
negative prior educational experience; lack of motivation; lack of self-confidence; non-affiliation
issues, and incompatibilities of time and place. (Scanlan 1986)
Demographic questions collected background information on each subject to compare
findings by sub-groups and counties. Demographic information included: county of residence,
gender, age, and ethnicity. Questions to determine barriers perceived to limit adult participation
in postsecondary education were arranged by situational barriers, institutional barriers, and
32
dispositional barriers. Situational barrier questions included: lack of time to complete a
program, lack of transportation, lack of childcare, family responsibilities, classes offered during
work hours, distance between home and school, and limited or no access to computer/Internet.
Institutional barrier questions included: cost of courses, time and place courses are scheduled,
long waiting lists, perceived quality of educational opportunities, lack of online courses or
programs, and difficulty registering for courses. Dispositional barrier questions included: lack
of encouragement from family/friends, lack of confidence, past negative educational experience,
feeling too old to be going back to school, not knowing what to study or where to start, and
doubt about the worth of additional education. In addition to these three types of barriers, an
open-ended response question was included to solicit specific types of barriers respondents have
experienced. Several of the barrier questions also measured barriers common to life situation,
prior educational experience, and access to educational opportunities.
Questions to determine motivating factors that increase aspirations in adults to participate
in postsecondary education were arranged by internal and external motivating factors. Internal
motivating factor questions included: self-improvement, meeting new people, need for
achievement, learning new things, setting a positive example for children, and career
advancement. External motivating factor questions included: job change, marriage, having
children, earning more money, approaching retirement, retraining, and expectations from family
and friends. In addition to these two types of motivating factors, an open-ended response
question was included to solicit specific types of motivating factors respondents have
experienced. Several of the motivating factors questions also measured motivating factors
common to individual needs, self-perceptions, and major life events.

33
The remaining questions recorded respondents‟ current participation in postsecondary
education, highest education level completed by respondent, mother, father, and/or guardian, and
respondents‟ Veteran status. Please refer to Appendix B listing survey statements in relationship
to research objectives.
Data Collection Procedures
The Institutional Review Board (IRB) at UW-Stout approved the survey instrument and
accompanying cover letter. Please refer to Appendix C for a copy of the cover letter.
Respondents were selected from the EOC Student Access database. The anonymous online
survey was distributed on December10, 2010. The cover letter included a link to the survey and
explained the survey would take approximately five minutes to complete. Participation was
voluntary and results confidential as once the survey was submitted the data could not be
withdrawn or linked to the respondent. No responses were initially received from the online
survey. A second contact was made by telephone (see Appendix D for telephone script used)
beginning December 28, 2010 through January 20, 2011. Confidentiality was insured by
assigning each respondent a number with no other identification marks on the surveys.
Data Analysis
Basic descriptive statistics and cross tabulations were collected in Qualtrics software as
well as mean, variance, standard deviation, and number of total responses collected. Data was
downloaded to Microsoft Excel for analysis. Percentages were computed relative to county
demographic category.
Limitations
1) The survey instrument was designed to meet the needs of this study in particular therefore
there are no measures of validity or reliability.
34
2) Existing participants of the EOC were surveyed therefore it is probable that motivating
factors would be high in this particular population.
3) The percent of people in poverty in these particular counties is high; therefore life
circumstance may play a large part in responses.
35
Chapter IV: Results
Introduction
This chapter presents the results of this research study, barriers to higher education and
motivational factors experienced by adults in Rusk, Sawyer, and Washburn Counties. It provides
information pertaining to the study population and those subjects participating in the study.
Participants
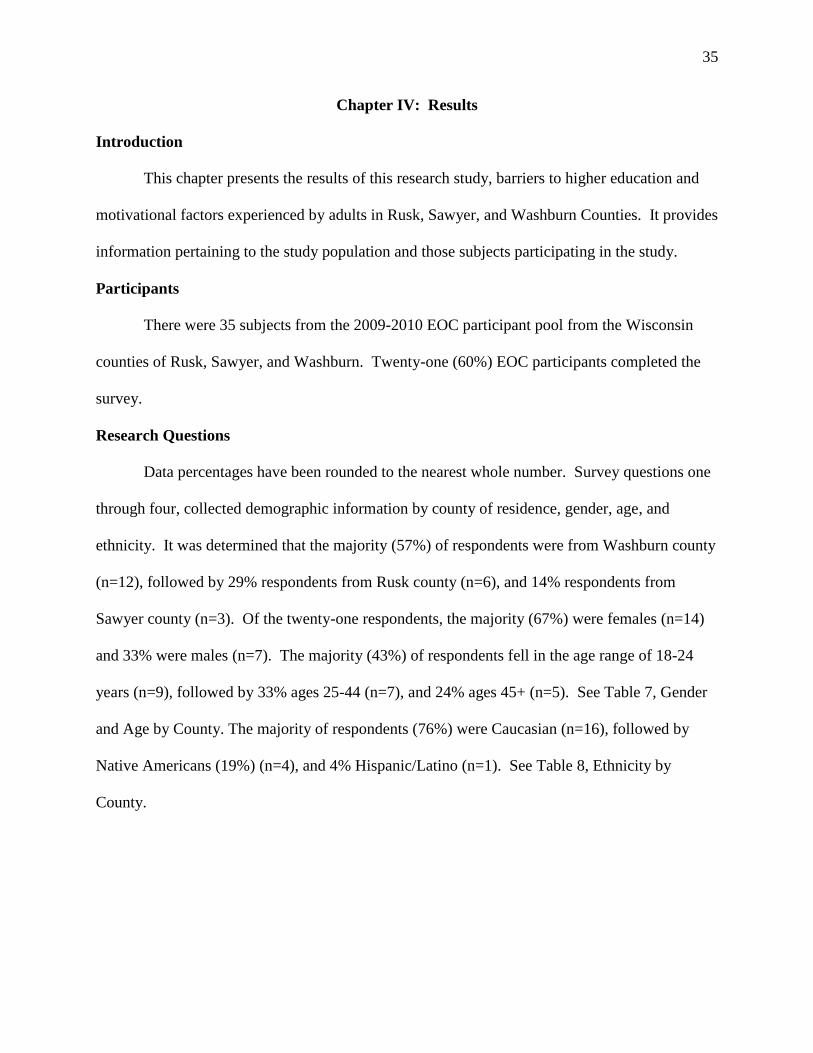
There were 35 subjects from the 2009-2010 EOC participant pool from the Wisconsin
counties of Rusk, Sawyer, and Washburn. Twenty-one (60%) EOC participants completed the
survey.
Research Questions
Data percentages have been rounded to the nearest whole number. Survey questions one
through four, collected demographic information by county of residence, gender, age, and
ethnicity. It was determined that the majority (57%) of respondents were from Washburn county
(n=12), followed by 29% respondents from Rusk county (n=6), and 14% respondents from
Sawyer county (n=3). Of the twenty-one respondents, the majority (67%) were females (n=14)
and 33% were males (n=7). The majority (43%) of respondents fell in the age range of 18-24
years (n=9), followed by 33% ages 25-44 (n=7), and 24% ages 45+ (n=5). See Table 7, Gender
and Age by County. The majority of respondents (76%) were Caucasian (n=16), followed by
Native Americans (19%) (n=4), and 4% Hispanic/Latino (n=1). See Table 8, Ethnicity by
County.
36
Table 7
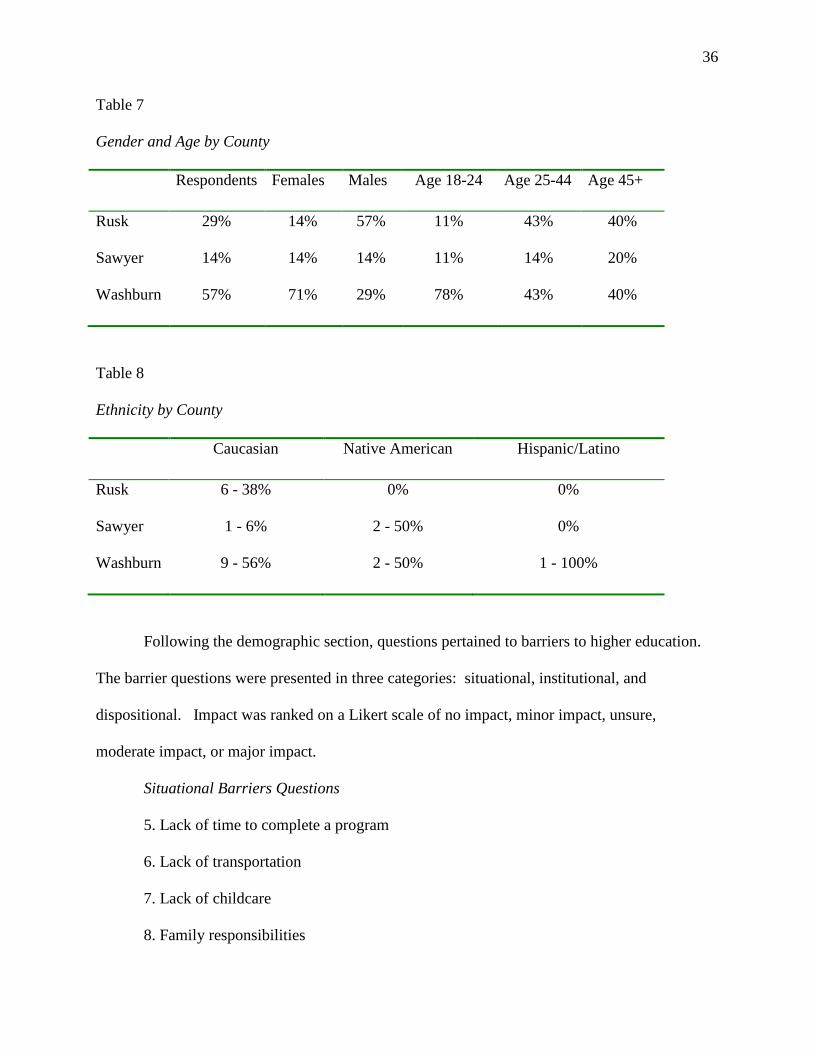
Gender and Age by County
Respondents Females Males Age 18-24 Age 25-44 Age 45+
Rusk 29% 14% 57% 11% 43% 40%
Sawyer 14% 14% 14% 11% 14% 20%
Washburn 57% 71% 29% 78% 43% 40%
Table 8
Ethnicity by County
Caucasian Native American Hispanic/Latino
Rusk 6 - 38% 0% 0%
Sawyer 1 - 6% 2 - 50% 0%
Washburn 9 - 56% 2 - 50% 1 - 100%
Following the demographic section, questions pertained to barriers to higher education.
The barrier questions were presented in three categories: situational, institutional, and
dispositional. Impact was ranked on a Likert scale of no impact, minor impact, unsure,
moderate impact, or major impact.
Situational Barriers Questions
5. Lack of time to complete a program
6. Lack of transportation
7. Lack of childcare
8. Family responsibilities
37
9. Classes offered during work hours
10. Distance between home and school
11. Limited or no access to computer/Internet.
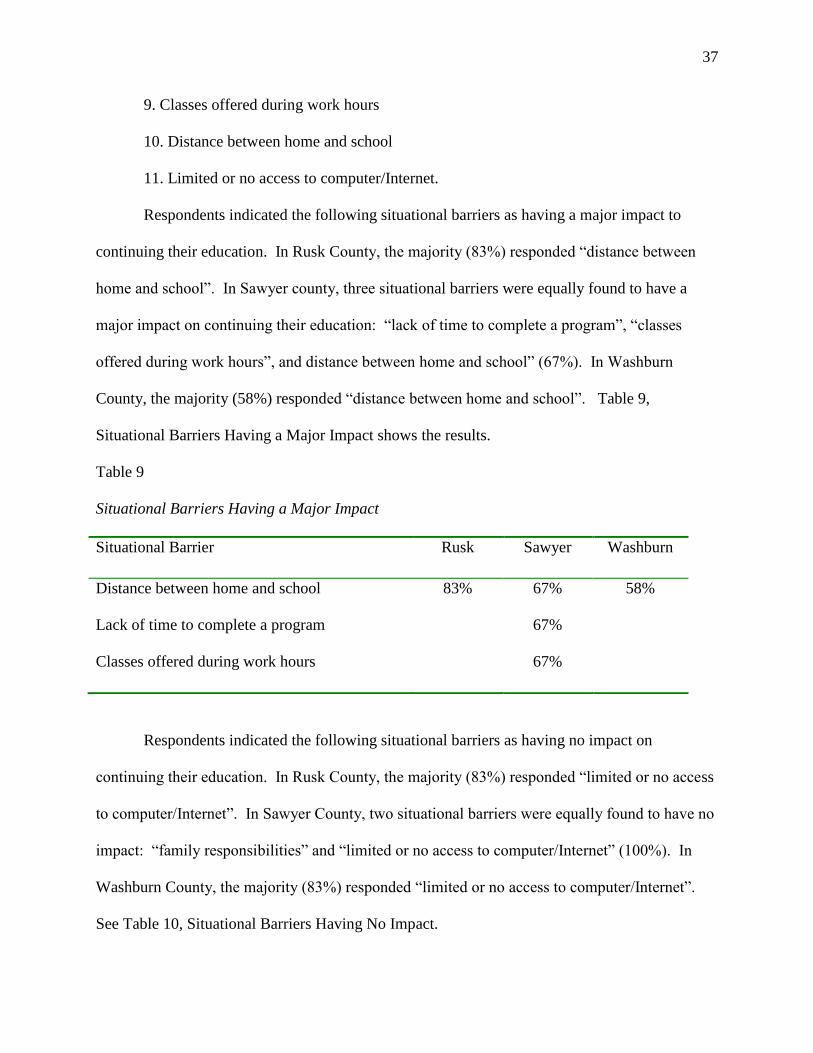
Respondents indicated the following situational barriers as having a major impact to
continuing their education. In Rusk County, the majority (83%) responded “distance between
home and school”. In Sawyer county, three situational barriers were equally found to have a
major impact on continuing their education: “lack of time to complete a program”, “classes
offered during work hours”, and distance between home and school” (67%). In Washburn
County, the majority (58%) responded “distance between home and school”. Table 9,
Situational Barriers Having a Major Impact shows the results.
Table 9
Situational Barriers Having a Major Impact
Situational Barrier
Rusk Sawyer Washburn
Distance between home and school 83% 67% 58%
Lack of time to complete a program 67%
Classes offered during work hours 67%
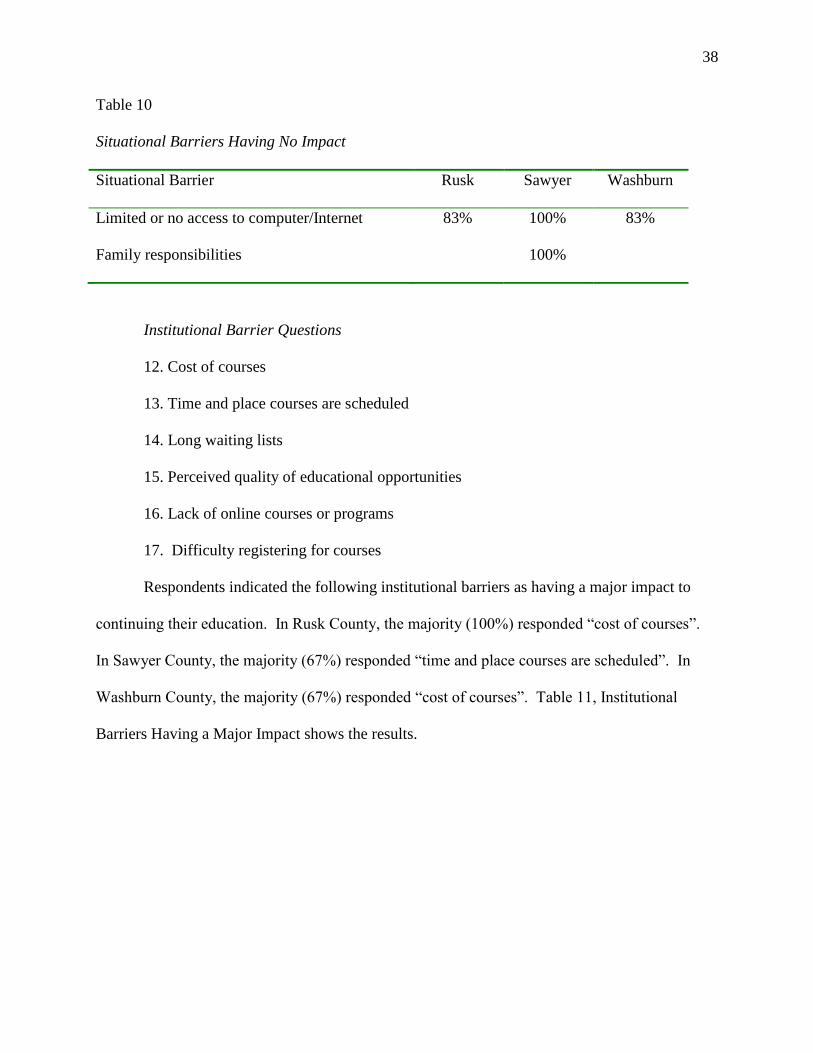
Respondents indicated the following situational barriers as having no impact on
continuing their education. In Rusk County, the majority (83%) responded “limited or no access
to computer/Internet”. In Sawyer County, two situational barriers were equally found to have no
impact: “family responsibilities” and “limited or no access to computer/Internet” (100%). In
Washburn County, the majority (83%) responded “limited or no access to computer/Internet”.
See Table 10, Situational Barriers Having No Impact.
38
Table 10
Situational Barriers Having No Impact
Situational Barrier Rusk Sawyer Washburn
Limited or no access to computer/Internet 83% 100% 83%
Family responsibilities 100%
Institutional Barrier Questions
12. Cost of courses
13. Time and place courses are scheduled
14. Long waiting lists
15. Perceived quality of educational opportunities
16. Lack of online courses or programs
17. Difficulty registering for courses
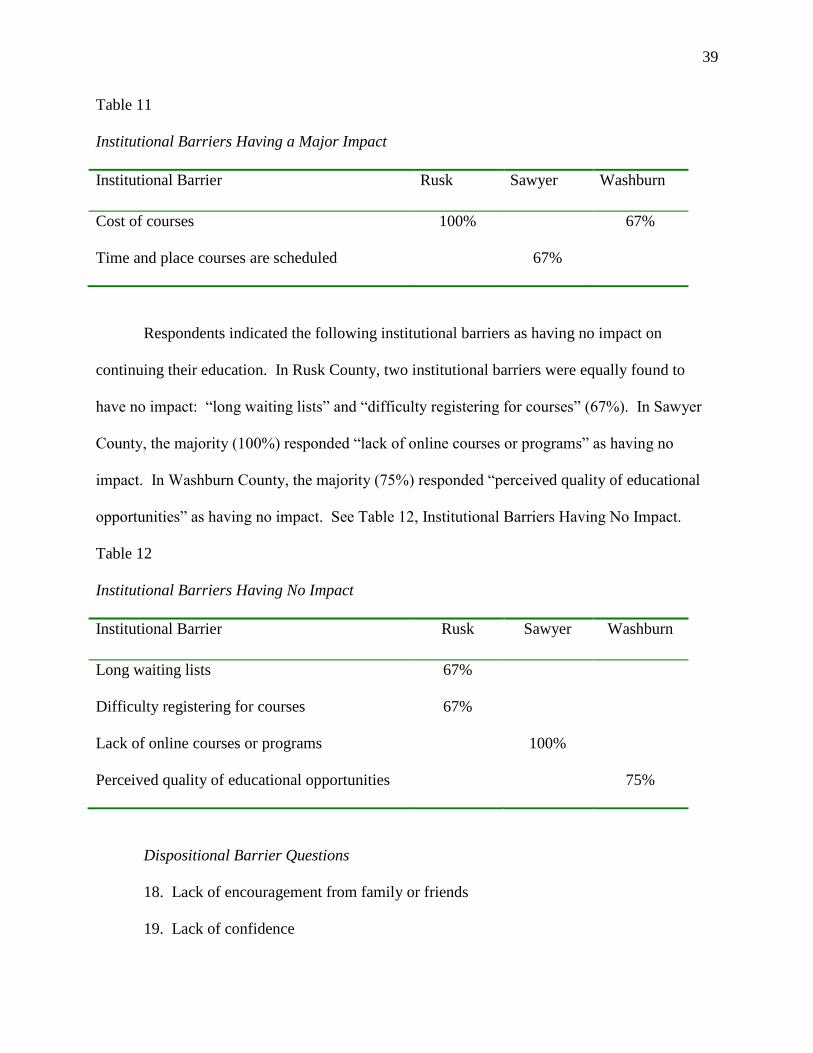
Respondents indicated the following institutional barriers as having a major impact to
continuing their education. In Rusk County, the majority (100%) responded “cost of courses”.
In Sawyer County, the majority (67%) responded “time and place courses are scheduled”. In
Washburn County, the majority (67%) responded “cost of courses”. Table 11, Institutional
Barriers Having a Major Impact shows the results.
39
Table 11
Institutional Barriers Having a Major Impact
Institutional Barrier
Rusk
Sawyer
Washburn
Cost of courses 100% 67%
Time and place courses are scheduled 67%
Respondents indicated the following institutional barriers as having no impact on
continuing their education. In Rusk County, two institutional barriers were equally found to
have no impact: “long waiting lists” and “difficulty registering for courses” (67%). In Sawyer
County, the majority (100%) responded “lack of online courses or programs” as having no
impact. In Washburn County, the majority (75%) responded “perceived quality of educational
opportunities” as having no impact. See Table 12, Institutional Barriers Having No Impact.
Table 12
Institutional Barriers Having No Impact
Institutional Barrier
Rusk
Sawyer
Washburn
Long waiting lists 67%
Difficulty registering for courses 67%
Lack of online courses or programs 100%
Perceived quality of educational opportunities 75%
Dispositional Barrier Questions
18. Lack of encouragement from family or friends
19. Lack of confidence
40
20. Past negative educational experience
21. Feeling too old to be going back to school
22. Not knowing what to study or where to start
23. Doubt about the worth of additional education
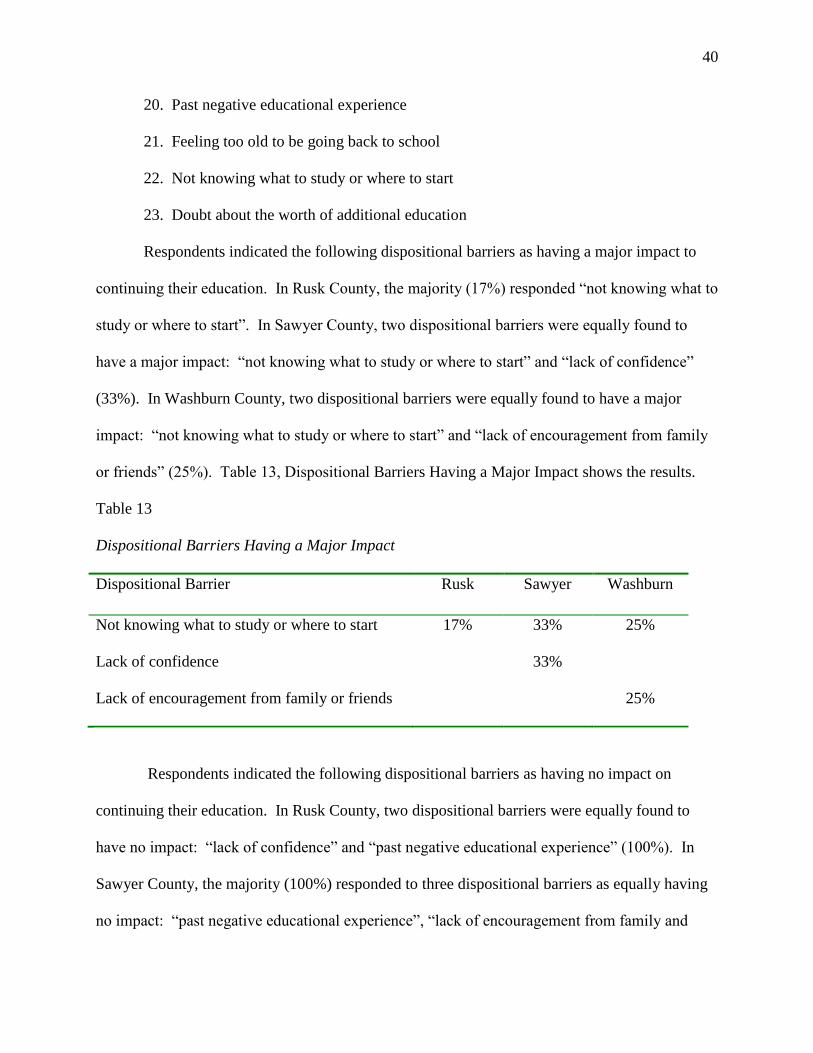
Respondents indicated the following dispositional barriers as having a major impact to
continuing their education. In Rusk County, the majority (17%) responded “not knowing what to
study or where to start”. In Sawyer County, two dispositional barriers were equally found to
have a major impact: “not knowing what to study or where to start” and “lack of confidence”
(33%). In Washburn County, two dispositional barriers were equally found to have a major
impact: “not knowing what to study or where to start” and “lack of encouragement from family
or friends” (25%). Table 13, Dispositional Barriers Having a Major Impact shows the results.
Table 13
Dispositional Barriers Having a Major Impact
Dispositional Barrier
Rusk
Sawyer
Washburn
Not knowing what to study or where to start 17% 33% 25%
Lack of confidence 33%
Lack of encouragement from family or friends 25%
Respondents indicated the following dispositional barriers as having no impact on
continuing their education. In Rusk County, two dispositional barriers were equally found to
have no impact: “lack of confidence” and “past negative educational experience” (100%). In
Sawyer County, the majority (100%) responded to three dispositional barriers as equally having
no impact: “past negative educational experience”, “lack of encouragement from family and

41
friends”, and “doubt about the worth of additional education”. In Washburn County, the
majority (92%) responded equally that “past negative educational experience” and “feeling too
old to be going back to school” had no impact on continuing their education. See Table 14,
Dispositional Barriers Having No Impact.
Table 14
Dispositional Barriers Having No Impact
Dispositional Barrier
Rusk
Sawyer
Washburn
Lack of confidence 100%
Past negative educational experience 100% 100% 92%
Lack of encouragement from family and friends 100%
Doubt about the worth of additional education 100%
Feeling too old to be going back to school 92%
The following open-ended question collected responses by county about other barriers
that may prevent respondents from participating in postsecondary education. See Table 15,
Other Barriers – Rusk County, Table 16, Other Barriers – Sawyer County, and Table 17, Other
Barriers – Washburn County.
42
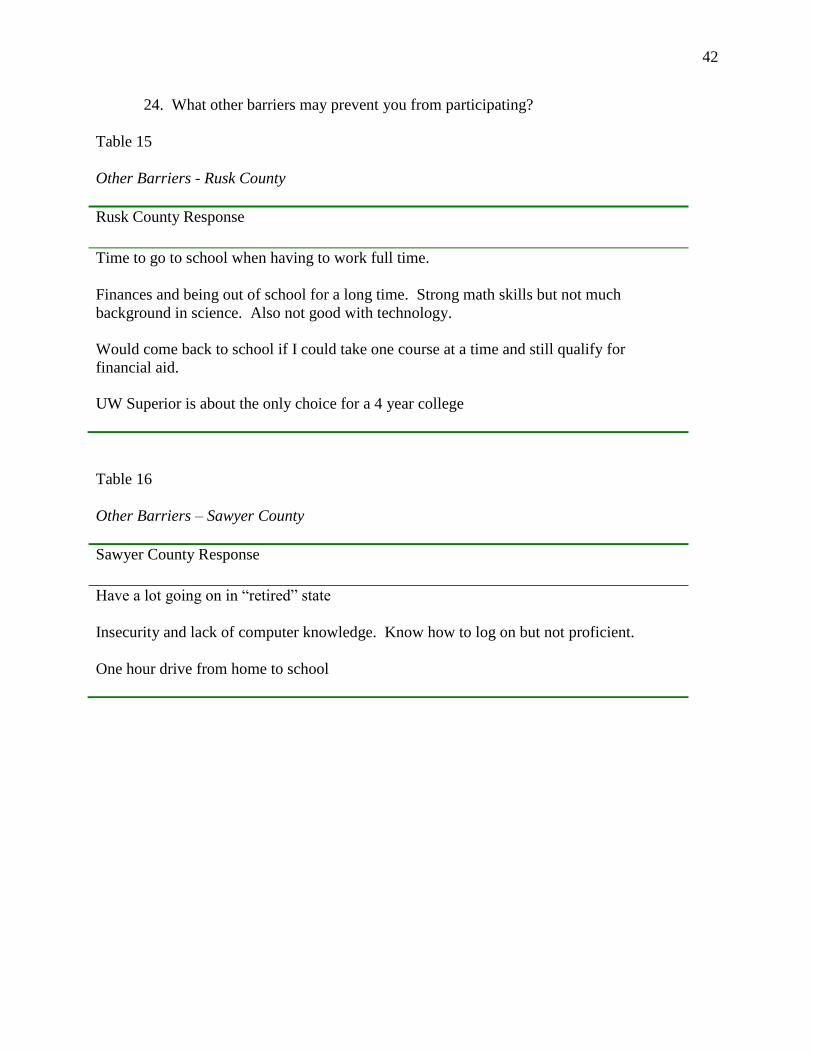
24. What other barriers may prevent you from participating?
Table 15
Other Barriers - Rusk County
Rusk County Response
Time to go to school when having to work full time.
Finances and being out of school for a long time. Strong math skills but not much
background in science. Also not good with technology.
Would come back to school if I could take one course at a time and still qualify for
financial aid. UW Superior is about the only choice for a 4 year college
Table 16
Other Barriers – Sawyer County
Sawyer County Response
Have a lot going on in “retired” state
Insecurity and lack of computer knowledge. Know how to log on but not proficient.
One hour drive from home to school
43
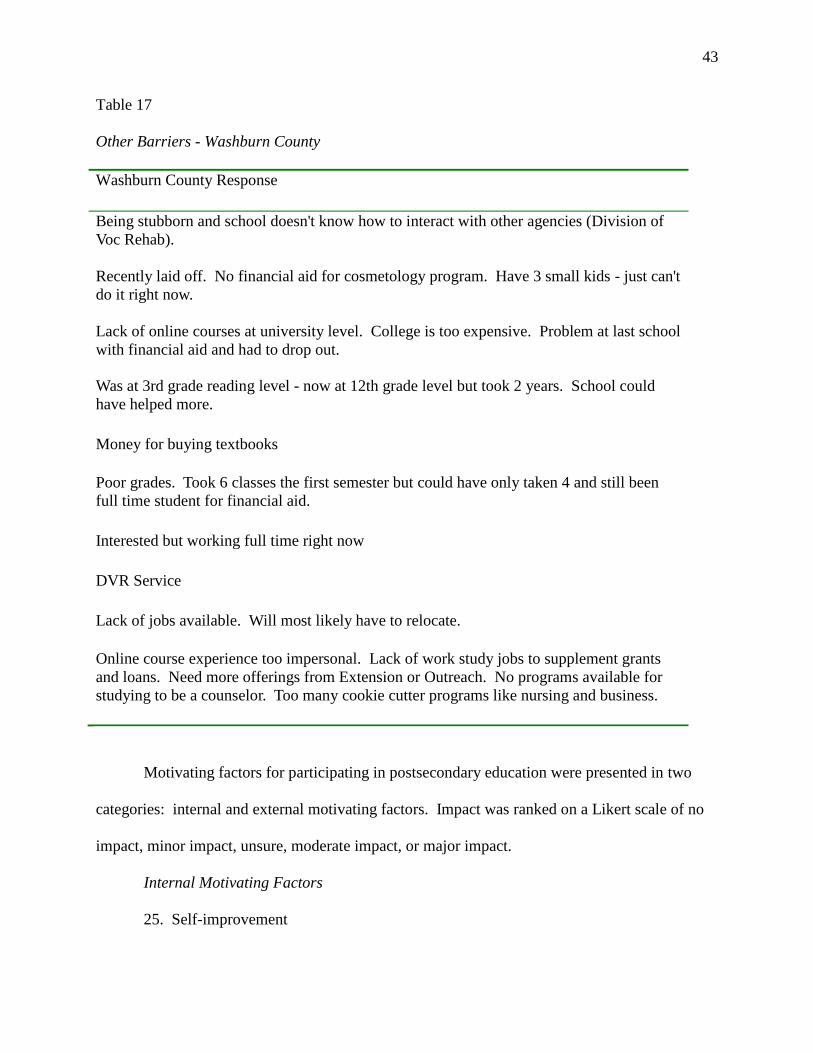
Table 17
Other Barriers - Washburn County
Washburn County Response
Being stubborn and school doesn't know how to interact with other agencies (Division of
Voc Rehab).
Recently laid off. No financial aid for cosmetology program. Have 3 small kids - just can't
do it right now.
Lack of online courses at university level. College is too expensive. Problem at last school
with financial aid and had to drop out.
Was at 3rd grade reading level - now at 12th grade level but took 2 years. School could
have helped more.
Money for buying textbooks
Poor grades. Took 6 classes the first semester but could have only taken 4 and still been
full time student for financial aid.
Interested but working full time right now
DVR Service
Lack of jobs available. Will most likely have to relocate.
Online course experience too impersonal. Lack of work study jobs to supplement grants
and loans. Need more offerings from Extension or Outreach. No programs available for
studying to be a counselor. Too many cookie cutter programs like nursing and business.
Motivating factors for participating in postsecondary education were presented in two
categories: internal and external motivating factors. Impact was ranked on a Likert scale of no
impact, minor impact, unsure, moderate impact, or major impact.
Internal Motivating Factors
25. Self-improvement
44
26. Meeting new people
27. Need for achievement
28. Learning new things
29. Setting a positive example for children
30. Career advancement
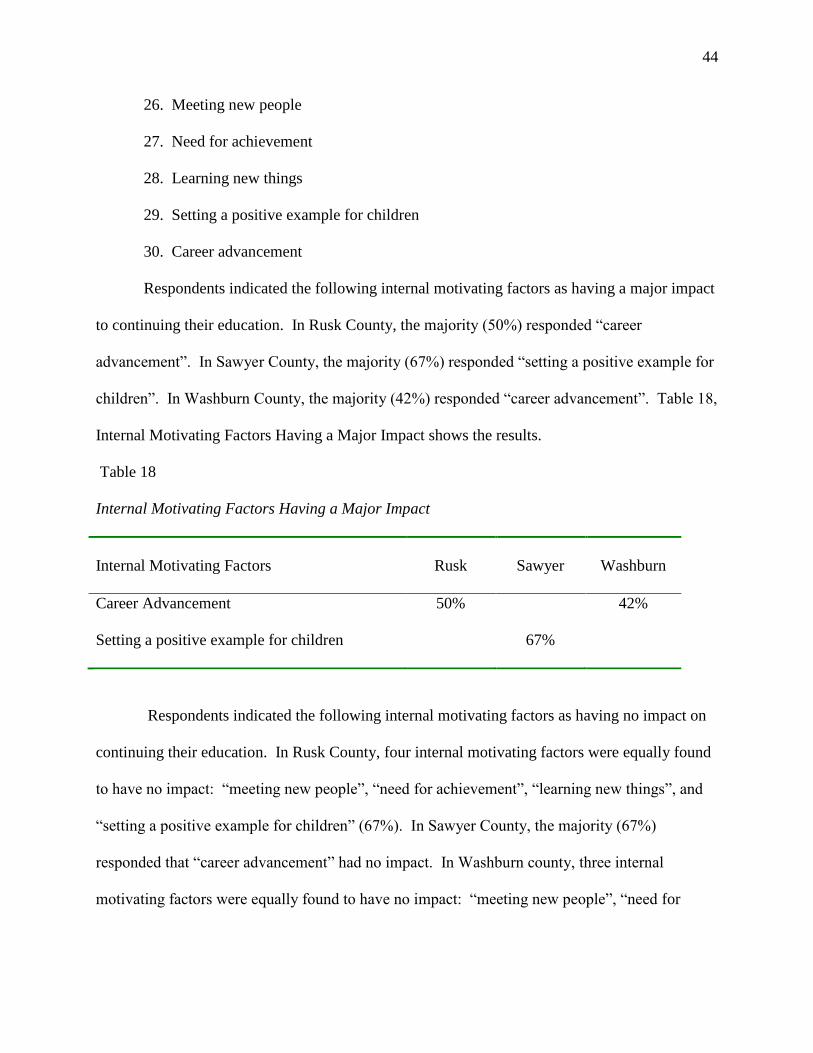
Respondents indicated the following internal motivating factors as having a major impact
to continuing their education. In Rusk County, the majority (50%) responded “career
advancement”. In Sawyer County, the majority (67%) responded “setting a positive example for
children”. In Washburn County, the majority (42%) responded “career advancement”. Table 18,
Internal Motivating Factors Having a Major Impact shows the results.
Table 18
Internal Motivating Factors Having a Major Impact
Internal Motivating Factors
Rusk
Sawyer
Washburn
Career Advancement 50% 42%
Setting a positive example for children 67%
Respondents indicated the following internal motivating factors as having no impact on
continuing their education. In Rusk County, four internal motivating factors were equally found
to have no impact: “meeting new people”, “need for achievement”, “learning new things”, and
“setting a positive example for children” (67%). In Sawyer County, the majority (67%)
responded that “career advancement” had no impact. In Washburn county, three internal
motivating factors were equally found to have no impact: “meeting new people”, “need for
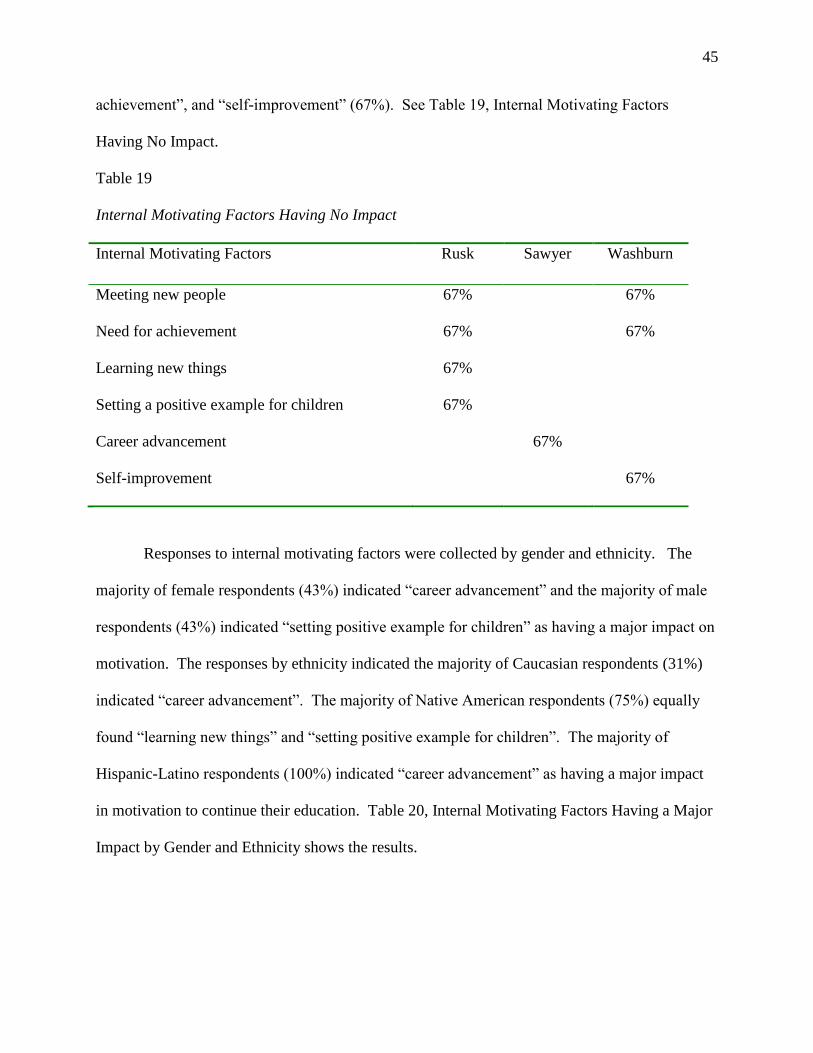
45
achievement”, and “self-improvement” (67%). See Table 19, Internal Motivating Factors
Having No Impact.
Table 19
Internal Motivating Factors Having No Impact
Internal Motivating Factors
Rusk
Sawyer
Washburn
Meeting new people 67% 67%
Need for achievement 67% 67%
Learning new things 67%
Setting a positive example for children 67%
Career advancement 67%
Self-improvement 67%
Responses to internal motivating factors were collected by gender and ethnicity. The
majority of female respondents (43%) indicated “career advancement” and the majority of male
respondents (43%) indicated “setting positive example for children” as having a major impact on
motivation. The responses by ethnicity indicated the majority of Caucasian respondents (31%)
indicated “career advancement”. The majority of Native American respondents (75%) equally
found “learning new things” and “setting positive example for children”. The majority of
Hispanic-Latino respondents (100%) indicated “career advancement” as having a major impact
in motivation to continue their education. Table 20, Internal Motivating Factors Having a Major
Impact by Gender and Ethnicity shows the results.

46
Table 20
Internal Motivating Factors Having a Major Impact by Gender and Ethnicity
Internal Motivating Factors
Female
Male
Caucasian
Native
American
Hispanic-
Latino
Self-improvement 14% 29% 13% 50% 0
Meeting new people 7% 29% 6% 50% 0
Need for achievement 7% 29% 6% 50% 0
Learning new things 14% 29% 6% 75% 0
Setting positive example for children 29% 43% 25% 75% 0
Career advancement 43% 29% 31% 50% 100%
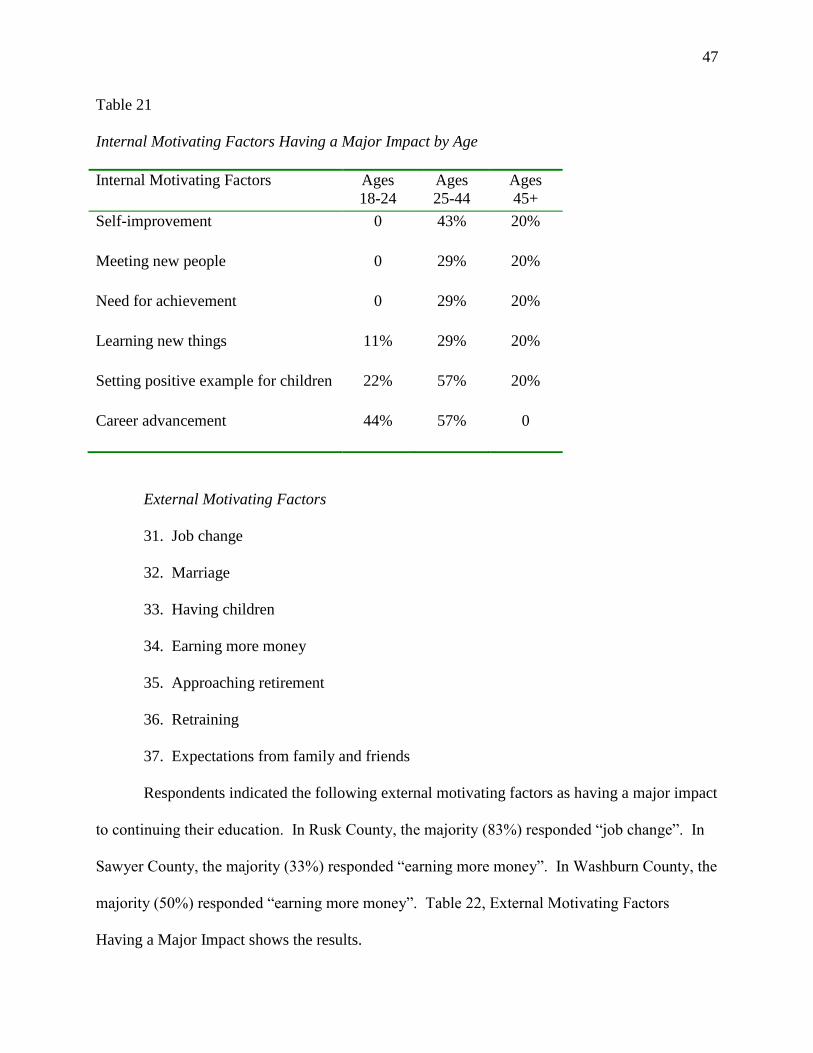
Responses to internal motivating factors were collected by age group. The majority of
respondents in the 18-24 age group (44%) indicated “career advancement” as having a major
impact on motivation. The majority of respondents in the 25-44 age group (57%) responded
equally “setting positive example for children” and “career advancement”. In the 45+ age group,
the majority (20%) responded that “self-improvement”, “meeting new people”, “need for
achievement”, “learning new things”, and “setting a positive example for children” equally had a
major impact in motivation to continue their education. Table 21, Internal Motivating Factors
Having a Major Impact by Age shows the results.
47
Table 21
Internal Motivating Factors Having a Major Impact by Age
Internal Motivating Factors Ages
18-24
Ages
25-44
Ages
45+
Self-improvement 0 43% 20%
Meeting new people 0 29% 20%
Need for achievement 0 29% 20%
Learning new things 11% 29% 20%
Setting positive example for children 22% 57% 20%
Career advancement
44% 57% 0
External Motivating Factors
31. Job change
32. Marriage
33. Having children
34. Earning more money
35. Approaching retirement
36. Retraining
37. Expectations from family and friends
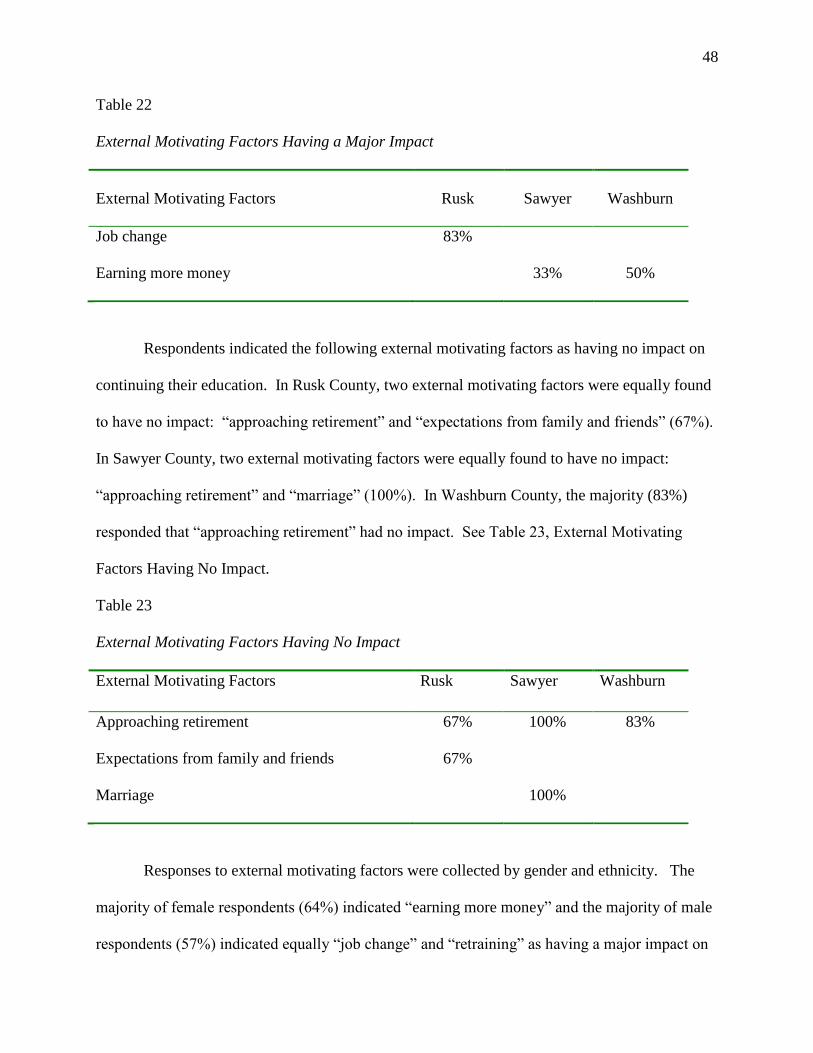
Respondents indicated the following external motivating factors as having a major impact
to continuing their education. In Rusk County, the majority (83%) responded “job change”. In
Sawyer County, the majority (33%) responded “earning more money”. In Washburn County, the
majority (50%) responded “earning more money”. Table 22, External Motivating Factors
Having a Major Impact shows the results.
48
Table 22
External Motivating Factors Having a Major Impact
External Motivating Factors
Rusk
Sawyer
Washburn
Job change 83%
Earning more money 33% 50%
Respondents indicated the following external motivating factors as having no impact on
continuing their education. In Rusk County, two external motivating factors were equally found
to have no impact: “approaching retirement” and “expectations from family and friends” (67%).
In Sawyer County, two external motivating factors were equally found to have no impact:
“approaching retirement” and “marriage” (100%). In Washburn County, the majority (83%)
responded that “approaching retirement” had no impact. See Table 23, External Motivating
Factors Having No Impact.
Table 23
External Motivating Factors Having No Impact
External Motivating Factors
Rusk
Sawyer
Washburn
Approaching retirement 67% 100% 83%
Expectations from family and friends 67%
Marriage 100%
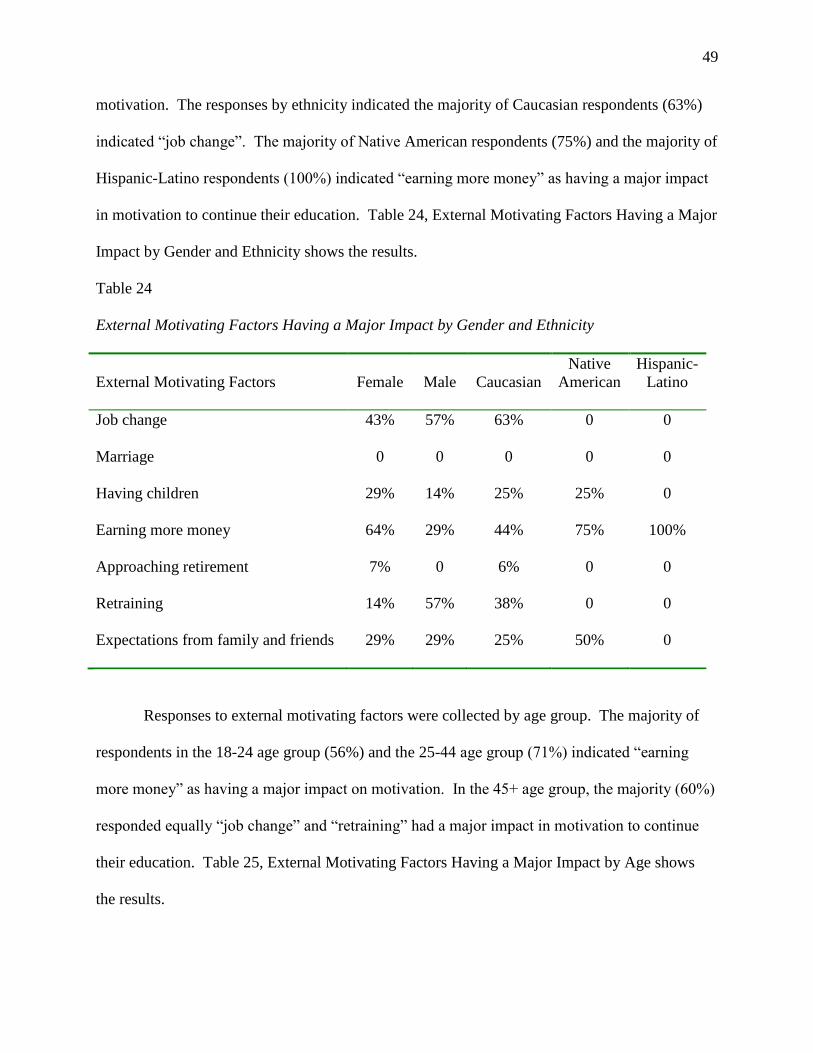
Responses to external motivating factors were collected by gender and ethnicity. The
majority of female respondents (64%) indicated “earning more money” and the majority of male
respondents (57%) indicated equally “job change” and “retraining” as having a major impact on
49
motivation. The responses by ethnicity indicated the majority of Caucasian respondents (63%)
indicated “job change”. The majority of Native American respondents (75%) and the majority of
Hispanic-Latino respondents (100%) indicated “earning more money” as having a major impact
in motivation to continue their education. Table 24, External Motivating Factors Having a Major
Impact by Gender and Ethnicity shows the results.
Table 24
External Motivating Factors Having a Major Impact by Gender and Ethnicity
External Motivating Factors
Female
Male
Caucasian
Native
American
Hispanic-
Latino
Job change 43% 57% 63% 0 0
Marriage 0 0 0 0 0
Having children 29% 14% 25% 25% 0
Earning more money 64% 29% 44% 75% 100%
Approaching retirement 7% 0 6% 0 0
Retraining 14% 57% 38% 0 0
Expectations from family and friends 29% 29% 25% 50% 0
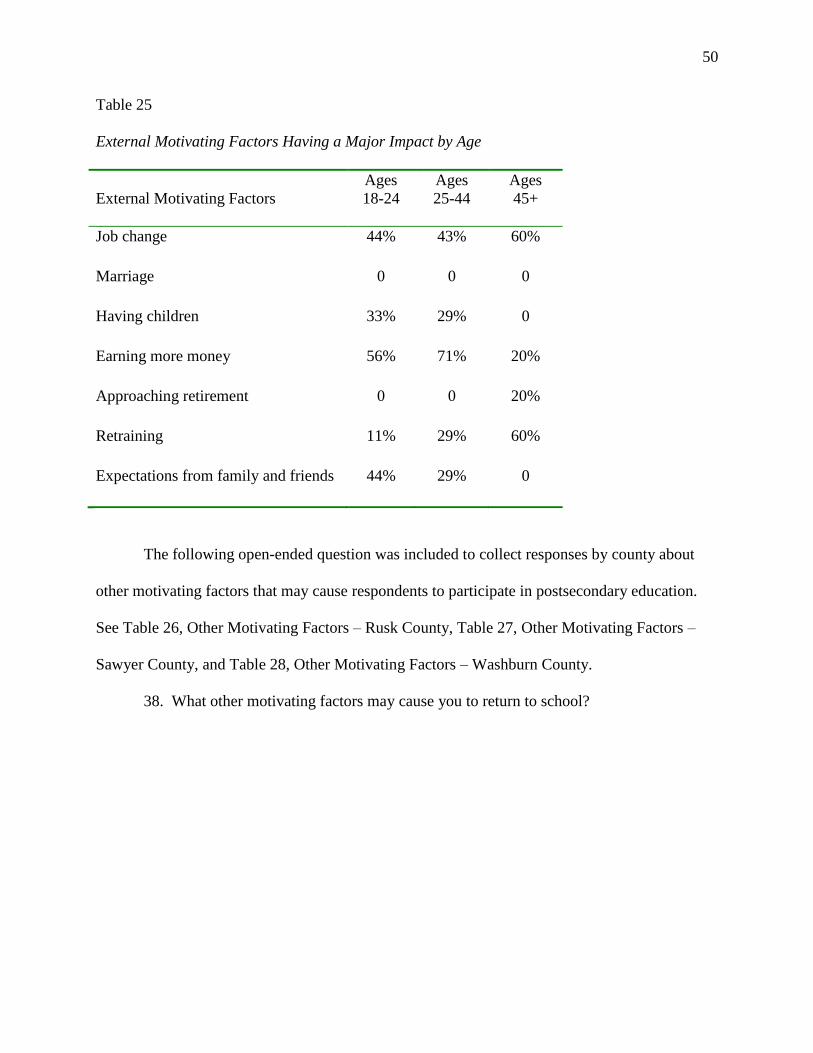
Responses to external motivating factors were collected by age group. The majority of
respondents in the 18-24 age group (56%) and the 25-44 age group (71%) indicated “earning
more money” as having a major impact on motivation. In the 45+ age group, the majority (60%)
responded equally “job change” and “retraining” had a major impact in motivation to continue
their education. Table 25, External Motivating Factors Having a Major Impact by Age shows
the results.
50
Table 25
External Motivating Factors Having a Major Impact by Age
External Motivating Factors
Ages
18-24
Ages
25-44
Ages
45+
Job change 44% 43% 60%
Marriage 0 0 0
Having children 33% 29% 0
Earning more money 56% 71% 20%
Approaching retirement 0 0 20%
Retraining 11% 29% 60%
Expectations from family and friends 44% 29% 0
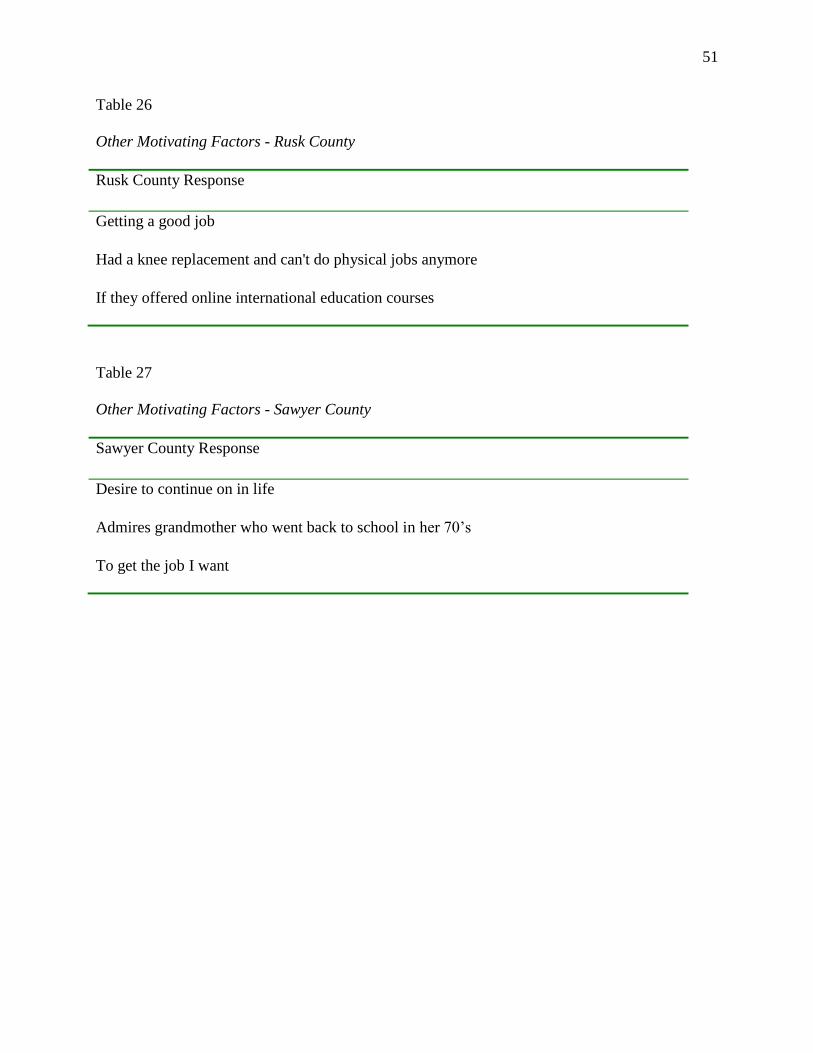
The following open-ended question was included to collect responses by county about
other motivating factors that may cause respondents to participate in postsecondary education.
See Table 26, Other Motivating Factors – Rusk County, Table 27, Other Motivating Factors –
Sawyer County, and Table 28, Other Motivating Factors – Washburn County.
38. What other motivating factors may cause you to return to school?
51
Table 26
Other Motivating Factors - Rusk County
Rusk County Response
Getting a good job
Had a knee replacement and can't do physical jobs anymore
If they offered online international education courses
Table 27
Other Motivating Factors - Sawyer County
Sawyer County Response
Desire to continue on in life
Admires grandmother who went back to school in her 70‟s
To get the job I want

52
Table 28
Other Motivating Factors – Washburn County
Washburn County Response
Becoming disabled in a car accident three years away from retirement. Went back to
school at DVR request.
Very self-motivated. Son knows I want to go to school and he keeps asking about it.
Having to support a family. Got CNA license but not much work available.
In medical assistant program but may switch to food service. Always wanted to own a
restaurant.
Went back to school at same time with a cousin and was able to ride share.
Know it is necessary to become a teacher and get a good career.
Recently got a new job but would like to know how to market a small publishing business.
Self-improvement
Daughter
Training for a better job
Was working in the trades‟ field but can‟t stand for long periods and have to work out of
the weather.
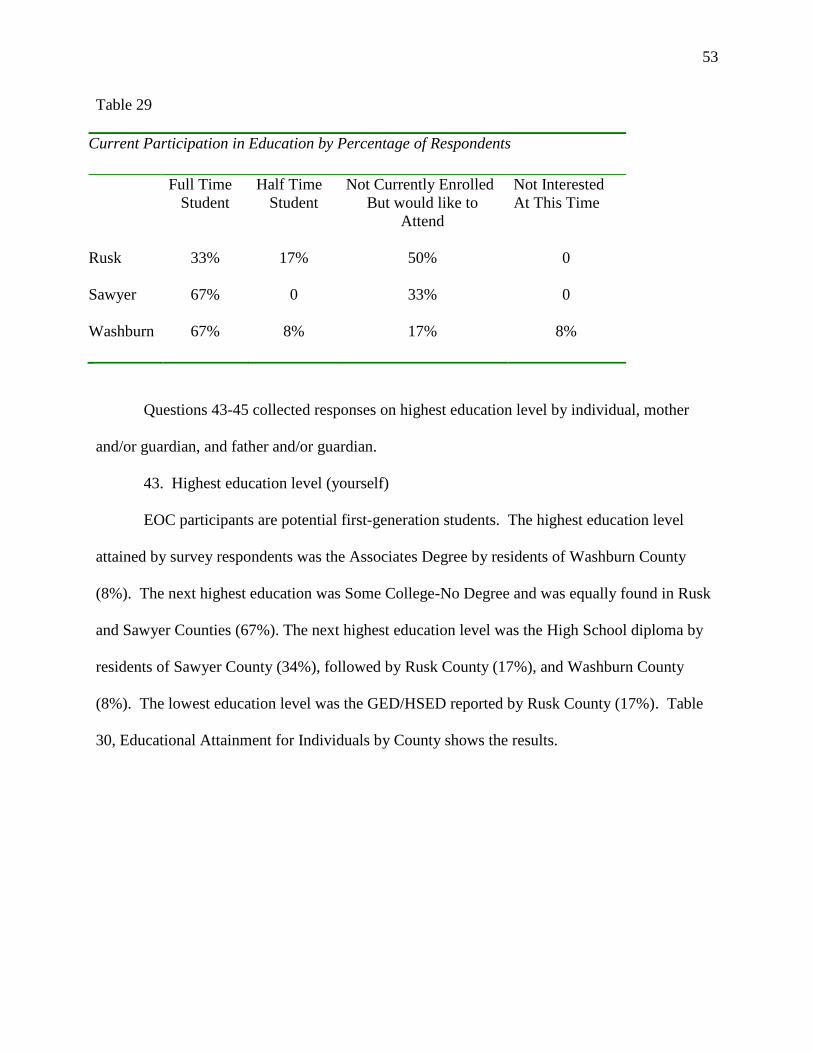
Questions 39-42 collected responses on current participation in postsecondary education.
Sawyer and Washburn Counties were equally found to have 67% of respondents currently
attending school full time compared with 33% of Rusk County respondents. However, 50% of
Rusk County respondents expressed an interest in attending school but were not currently
enrolled. Table 29, Current Participation in Education by Percentage of Respondents shows the
results.
53
Table 29
Current Participation in Education by Percentage of Respondents
Full Time
Student
Half Time
Student
Not Currently Enrolled
But would like to
Attend
Not Interested
At This Time
Rusk 33% 17% 50% 0
Sawyer 67% 0 33% 0
Washburn 67% 8% 17% 8%
Questions 43-45 collected responses on highest education level by individual, mother
and/or guardian, and father and/or guardian.
43. Highest education level (yourself)
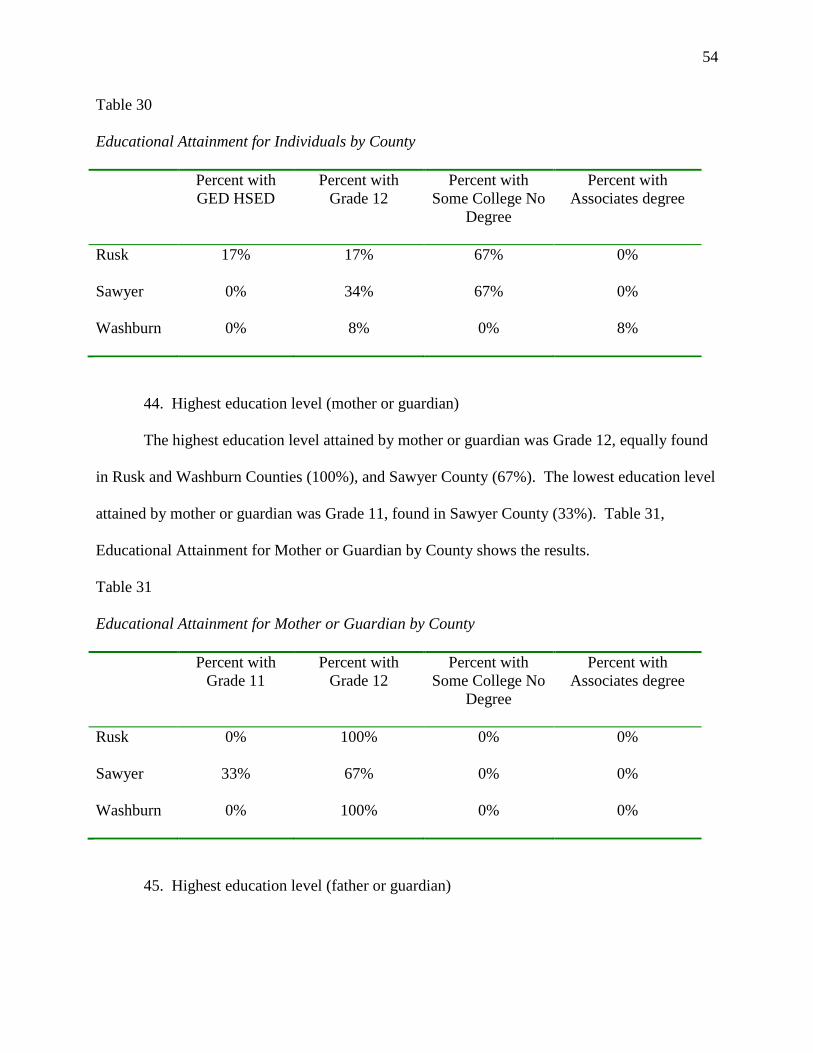
EOC participants are potential first-generation students. The highest education level
attained by survey respondents was the Associates Degree by residents of Washburn County
(8%). The next highest education was Some College-No Degree and was equally found in Rusk
and Sawyer Counties (67%). The next highest education level was the High School diploma by
residents of Sawyer County (34%), followed by Rusk County (17%), and Washburn County
(8%). The lowest education level was the GED/HSED reported by Rusk County (17%). Table
30, Educational Attainment for Individuals by County shows the results.
54
Table 30
Educational Attainment for Individuals by County
Percent with
GED HSED
Percent with
Grade 12
Percent with
Some College No
Degree
Percent with
Associates degree
Rusk 17% 17% 67% 0%
Sawyer 0% 34% 67% 0%
Washburn 0% 8% 0% 8%
44. Highest education level (mother or guardian)
The highest education level attained by mother or guardian was Grade 12, equally found
in Rusk and Washburn Counties (100%), and Sawyer County (67%). The lowest education level
attained by mother or guardian was Grade 11, found in Sawyer County (33%). Table 31,
Educational Attainment for Mother or Guardian by County shows the results.
Table 31
Educational Attainment for Mother or Guardian by County
Percent with
Grade 11
Percent with
Grade 12
Percent with
Some College No
Degree
Percent with
Associates degree
Rusk 0% 100% 0% 0%
Sawyer 33% 67% 0% 0%
Washburn 0% 100% 0% 0%
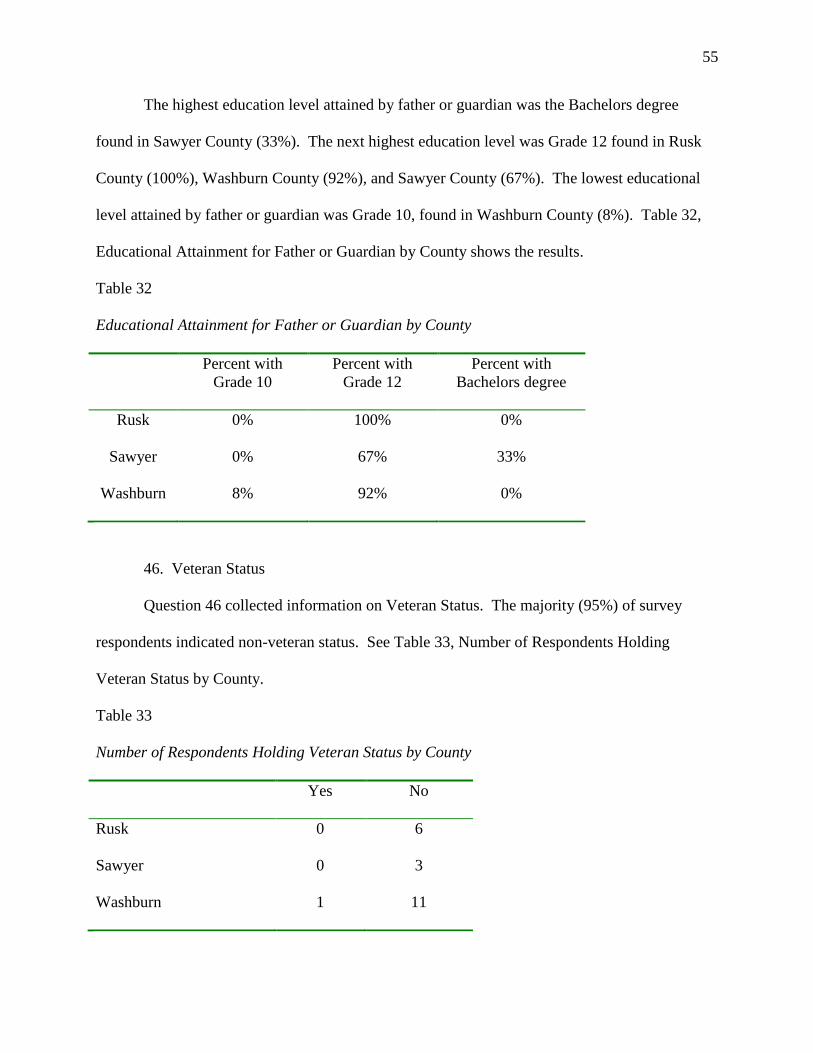
45. Highest education level (father or guardian)
55
The highest education level attained by father or guardian was the Bachelors degree
found in Sawyer County (33%). The next highest education level was Grade 12 found in Rusk
County (100%), Washburn County (92%), and Sawyer County (67%). The lowest educational
level attained by father or guardian was Grade 10, found in Washburn County (8%). Table 32,
Educational Attainment for Father or Guardian by County shows the results.
Table 32
Educational Attainment for Father or Guardian by County
Percent with
Grade 10
Percent with
Grade 12
Percent with
Bachelors degree
Rusk 0% 100% 0%
Sawyer 0% 67% 33%
Washburn 8% 92% 0%
46. Veteran Status
Question 46 collected information on Veteran Status. The majority (95%) of survey
respondents indicated non-veteran status. See Table 33, Number of Respondents Holding
Veteran Status by County.
Table 33
Number of Respondents Holding Veteran Status by County
Yes No
Rusk 0 6
Sawyer 0 3
Washburn 1 11
56
Chapter V: Summary, Limitations, Conclusion and Recommendations
Summary
The primary purpose of this study was to identify barriers encountered by adults pursing
postsecondary education in Northern Wisconsin. A secondary purpose was to discover
motivational factors which encouraged participation in postsecondary education. By
determining these factors, the Educational Opportunity Centers (EOC) program in particular and
educational institutions in general, will be able to take appropriate action to provide services that
lessen barriers and widen participation in postsecondary education in Northern Wisconsin.
Limitations
This study has the following limitations:
1) The study was not able to sample all counties in Northern Wisconsin and was
restricted to participants of the three northern-most counties served by the
Educational Opportunity Centers (EOC) headquartered in Eau Claire. Therefore,
the survey results were limited to the opinions and responses from residents of the
three-county area.
2) This particular population had experienced some type of motivational factor
prompting them to seek the services of the EOC for help in setting career and
educational goals. It is probable that motivating factors were high in this particular
population.
3) Rusk, Sawyer, and Washburn Counties are rural in make-up. There was a high
probability that situational barriers identified would be similar.

57
4) The survey instrument was designed to meet the needs of this study in particular
therefore; there are no measures of validity or reliability beyond this particular
population.
Conclusions
Each research question will be now be restated and conclusion offered for each.
Research Question #1: Determine barriers perceived to limit adult participation in
postsecondary education.
Cross (1981) categorized barriers by situational, institutional, and dispositional. The
results of this survey indicated the major barriers were: distance between home and school
(situational), cost of courses (institutional), and not knowing what to study or where to start
(dispositional). These top three barriers may be due in part to the rural nature of the counties,
higher than average poverty rates, and a lack of area services that offer career and educational
planning.
Consistent with the U.S. Department of Education‟s National Center for Education
Statistics (NCES) findings, results revealed that lack of time, cost, and inconvenient scheduling
of classes were also found to be barriers. Contradictory to the NCES, family responsibilities,
past negative educational experience, and feeling too old to be going back to school had minor or
no impact on participation. This may be due to the fact that fifty-seven percent of respondents
were EOC clients currently enrolled full time in school. The obvious conclusion being they may
have overcome this particular set of barriers.
Scanlon (1986) found that deterrents contain multiple variables which are influenced by
individual learner perception of their significance and vary according to the individual and life
58
circumstance. Two barriers were identified from the analysis consistent with Scanlon‟s
construct: cost of courses and time and place courses are scheduled.
In responses related to technology and educational offerings, the majority of respondents
from all counties reported having access to a computer/internet and reported no lack of online
courses or programs. However, from the responses to the open-ended barrier question,
respondents expressed an interest in a broader array of programming. The lack of programming
choice could be directly related to the region itself, with fewer institutions of higher education
located in Northern Wisconsin than in the rest of the state.
Research Question #2: Determine motivating factors that increase aspirations in adults
to participate in postsecondary education.
Motivation plays an important role in participative behavior and participation hinges on
the learner view of personal and environmental variables. Personal variables include needs,
attributes, and prior experience. Environmental variables include learner perception of control
over their life, social norms, and what educational possibilities are available. (Rubenson 1977)
The results of this survey indicated the major internal motivating factors were setting a positive
example for children and career advancement. The primary external motivating factors were
earning more money and job change.
Results from the open-ended question on motives for participation revealed major life
events like job loss, disability, and changes in health. The researcher cannot be certain if
respondents confused question number 31 (job change) with job loss. A job change is
considered a major life event however; could be viewed in a different light than a job loss. If the
intent of a job change is to better oneself and family, it is consistent with Goal Setting Theory
(Locke, 1968). Responses about major life events were consistent with the open-ended barrier

59
question citing the need for better coordination of services between educational institutions and
other agencies.
Research Question #3: Identify the difference in barriers perceived to limit adult
participation in postsecondary education common to specific counties in Northern Wisconsin.
The barriers cited in the three counties were more alike than different. Two barriers were
found across all counties: distance between home and school (situational) and not knowing what
to study or where to start (dispositional). Rusk County respondents also reported a lack of time
to complete a program (situational), cost of courses (institutional), and time and place courses are
scheduled (institutional). Sawyer County reported lack of time to complete a program
(situational), and classes offered during work hours (situational). Washburn County reported
cost of courses (institutional).
Distance between home and school is a major factor because a large portion of these
counties are held in public owned forests and tribal lands. Bridging the difference could be less
of a factor in the future if coordination of the Rusk, Sawyer, and Washburn regional
transportation plan is implemented or if high speed broadband internet is deployed.
Valentine and Darkenwald (1990) demonstrated that barriers or deterrents can be multi-
faceted and work in combination with other elements in affecting participation in adult
education. For this reason, an open-ended barrier question collected responses about other
variables for analysis by county. Rusk County reported “time to go to school when having to
work full time”, “being out of school for a long time”, “not good with technology”, and “UW
Superior is about the only choice for a 4-year college”. Sawyer County reported “insecurity and
lack of computer knowledge” and “one hour drive from home to school”. Washburn County
cited “poor grades”, “low reading level”, “lack of jobs available”, and “will most likely have to
60
relocate”. These responses indicate a need for brushing up on academic skills and could also
highlight an area of concern about the type of jobs available being related to tourism or seasonal
in nature.
Research Question #4: Identify differences in motivating factors that increase
aspirations in adults to participate in postsecondary education common among gender, ethnicity
and age groups.
Female respondents outnumbered male respondents two to one. The majority of both
genders reported external motivating factors as having a major impact. The majority of females
indicated “earning more money” while males indicated “job change” and “retraining” as equally
having a major impact.
Motivating factors were compared by ethnicity. The majority of Caucasian and
Hispanic/Latino respondents reported external motivating factors as having a major impact.
Caucasian respondents indicated “job change” and Hispanic/Latino respondents reported
“earning more money”. Native American/Alaska Native respondents cited internal motivating
factors of “learning new things” and “setting a positive example for children” as having a major
impact.
In comparing motivating factors by age groups, the individual need for career
advancement was reported as the most common internal motivating factor among the 18-24 and
25-44 age groups. These findings were consistent with the mini-theories of motivation (Reeve
2005). The 45+ age group reported multiple internal motivating factors like self-improvement,
wanting to learn new things, and meeting new people. Major life events seemed to contribute to
external motivating factors reported. Job change was the most common external motivating
factor among all age groups. The internal motivation of self-improvement and the external
61
motivating factors of earning more money and expectations from family and friends were also
reported among the 18-24 and 25-44 age groups.
Recommendations
The following recommendations are offered about the study:
1) Some of the barriers could be eliminated from the questionnaire to shorten the length
of the survey. The situational barrier “family responsibilities” could be eliminated as
it is vague in meaning and easily confused with another barrier “lack of childcare”.
The institutional barrier “long waiting lists” may not accurately reflect a true barrier
as most students are able to take other general education courses while waiting to be
accepted into a program of study. Another institutional barrier “difficulty registering”
could have multiple meanings from difficulty with the admissions process to limited
number of course seats available.
2) More open-ended questions about motivating factors could be included to let
respondents tell their unique story. A less structured format could yield more in-
depth answers and seek a relationship between motivation and attitudes and beliefs
about postsecondary education. Example questions: “In what ways did your parents
and/or guardians prepare you for postsecondary education?” and “What made you
consider continuing your education beyond high school?”
3) Coping strategies to barriers could be the focus of future studies. This would seem to
be a natural pairing with a study of barriers. Findings could reveal important
strategies for coping with common problems students face like time management or a
general fear of not succeeding. Future EOC participants could benefit from
developing a list of these strategies.
62
4) Better participation in the survey could be gained by conducting the survey in person.
A more personal approach would be to conduct the survey at the end of the
counseling appointment at the EOC. Respondents would be able to answer the survey
questions at a time convenient for them and in a private setting with no interruptions.
The following recommendations are made as a result of the research:
1) The EOC should take into consideration the majority of respondents‟ availability to
computers and the internet. A technology-intensive communications plan should be
developed using social media to reach more potential clients and motivate current
participants.
2) The EOC should continue partnering with local business and the Wisconsin
Department of Workforce Development and develop a formal notification system in
the event of plant closings or mass layoffs. This will allow for earlier identification
and quicker response time to coordinate services for employees experiencing a job
loss.
3) The EOC should design an online repository for career and educational planning
resources and information on how to apply and pay for college.
4) The EOC should provide more detailed information of available support services by
county that strengthen academic skills and begin adults on a positive path to college.
5) The EOC should conduct additional research on coping strategies adults use to
overcome barriers.
6) Rusk County should be the next target area for concentrated EOC services due to the
high percentage of respondents who are not currently enrolled but would like to
attend.

63
References
College Board Advocacy. (2008, December). Coming to our senses: Education and the
American future. Retrieved from:
http://professionals.collegeboard.com/profdownload/coming-to-our-senses-college-
board-2008.pdf
Council for Adult and Experiential Learning. (2008). Adult learning in focus. Retrieved from:
http://www.cael.org/pdf/State_Indicators_Monograph.pdf
Council for Adult and Experiential Learning. (2008). Wisconsin profile of adult learners.
Retrieved from: http://www.cael.org/pdf/state_profiles/WISCONSIN.pdf
Crawford, S.R. (2004). Androgogy: Malcom Knowles. Document posted in online Old Dominion
University archived at
http://www.odu.edu/educ/roverbau/Class_Websites/761_Spring_04/Assets/course_docs/I
D_Theory_Reps_Sp04/Knowles-Crawford.pdf
De Vise, D. (2010, July 22). U.S. goes from leading to lagging in young college graduates.
Washington Post. Retrieved from: http://www.washingtonpost.com/wp-
dyn/content/article/2010/07/22/AR2010072201250.html
Falling Education Attainment. (2010, May 10). Inside Higher Ed. Retrieved from:
http://www.insidehighered.com/news/2010/05/10/demographics
Huitt, W. (2001). Motivation to learn: An overview. Educational Psychology Interactive.
Valdosta, GA: Valdosta State University. Retrieved from:
http://www.edpsycinteractive.org/topics/motivation/motivate.html
64
Hunt, J., Tierney, T., (2006, May). American higher education: how does it measure up for the
21st century?. Retrieved from:
http://www.highereducation.org/reports/hunt_tierney/Hunt_Tierney.pdf
Hupp, M. (2009, April 16). Wisconsin‟s unemployment rate hits 27-year high of 9.4%. Journal
Sentinal Online. Retrieved from: http://www.jsonline.com/business/43111002.html
Lagorio, C. (2005). U.S. education slips in rankings. CBS News. Retrieved from:
http://www.cbsnews.com/stories/2005/09/13/national/main838207.shtml
Lieb, S. (1991). Principles of adult learning Vision, Fall 1991. Retrieved from:
http://honolulu.hawaii.edu/intranet/committees/FacDevCom/guidebk/teachtip/adults-
2.htm
Nagaoka, J., Roderick, M., & Coca, V. (2009). Barriers to college attainment: lessons from
Chicago. Center for American Progress. Retrieved from:
http://www.americanprogress.org/issues/2009/01/chicago_schools.html
National Bureau of Economic Research. (2008). Determination of the december 2007 peak in
economic activity. Retrieved from: http://www.nber.org/dec2008.pdf
National Center for Education Statistics. (2009). U.S. Department of Education. Institute of
Education Sciences. Adult education participation decisions and barriers: Review of
conceptual frameworks and empirical studies. Retrieved from:
http://nces.ed.gov/pubs98/9810.pdf
National Center for Education Statistics. (2009). U.S. Department of Education. Institute of
Education Sciences. Special analysis 2002: Nontraditional undergraduates. Retrieved
from: http://nces.ed.gov/programs/coe/2002/analyses/nontraditional/sa01.asp
65
Northern Wisconsin Higher Education Initiative Demographic Profile. (2007). Applied
Population Laboratory. Retrieved from:
http://www.apl.wisc.edu/publications/NOW_report_final.pdf
Padak, N., & Sapin, C. (2000). Collaboration: Working together to support adult learners. Ohio
Literary Resource Center. Retrieved from: http://literacy.kent.edu/Oasis/Pubs/0400-
11.pdf
Reeve, J.M. (2005). Understanding motivation and emotion. New Jersey: John Wiley & Sons,
Inc.
Roberson, M. (2009, November 9). Initiative seeks to explore online platform to promote degree
completion. Midwestern Higher Education Compact. Retrieved from:
http://www.mhec.org/index.asp?pageID=396
Sander, L. (2008, February 15). Colleges woo adults who have some credits but no degree.
Chronicle of Higher Education, 54 (23), 29. (ERIC Document Reproduction Service No.
EJ788876) Retrieved from ERIC (Educational Resources Information Center) database
Scanlon, C.L. (1986). Deterrents to participation: An adult education dilemma. ERIC
Clearinghouse on Adult, Career, and Vocational Education. Retrieved from:
http://www.eric.ed.gov/PDFS/ED272768.pdf
Spanard, J.M. (1990). Beyond intent: Reentering college to complete the degree. [Electronic
Version] American Educational Research Association, 60(3), 309-344. Retrieved from:
JSTOR database
Still, T. (2004, June 30). Higher ed cooperation will produce more skilled workers for
Wisconsin. Wisconsin Technology Network. Retrieved from:
http://wistechnology.com/articles/971/
66
Tech-savvy workers in demand. (2009, February 9). Converge magazine. Retrieved from:
http://www.convergemag.com/stem/Tech-Savvy-Worker-Demand.html
U.S. Census Bureau. (2000). Educational attainment of the total population 25 years and over
for Wisconsin counties: April 1, 2000. Retrieved from:
http://www.doa.state.wi.us/docs_view2.asp?docid=405
U.S. Census Bureau. (2000). State and County Quick Facts. Retrieved from:
http://quickfacts.census.gov/qfd/states/27000.html
U.S. Census Bureau. (2007). American FactFinder 2007 American Community Survey.
Retrieved from: http://www.census.gov/compendia/statab/2010/tables/10s0228.pdf
U.S. Census Bureau. (2008). American Community Survey Fact Sheet. Retrieved from:
http://factfinder.census.gov/servlet/ACSSAFFFacts
U.S. Department of Education. Educational Opportunity Centers Program. Retrieved from:
http://www2.ed.gov/programs/trioeoc/index.html
U.S. Department of Education. Office of Postsecondary Education. Retrieved from:
http://www2.ed.gov/about/offices/list/ope/trio/index.html
U.S. Department of Education. Higher Education Act of 1965, 1998 Higher Education Act
Amendments. Retrieved from: http://www2.ed.gov/about/offices/list/ope/trio/triohea.pdf
U.S. Department of Education. National Center for Education Statistics. Adult education
participation decisions and barriers: Review of conceptual frameworks and empirical
studies. Working Paper No. 98-10, by Tim Silva, Margaret Cahalan, and Natalie
Lacierno-Paquet. Peter Stowe, Project Officer. Washington, D.C.: 1998. Retrieved from:
http://nces.ed.gov/pubs98/9810.pdf

67
University of Wisconsin Colleges. (2008, Jan). Northern Wisconsin higher education initiative
report. Retrieved from:
www.uwex.uwc.edu/chancellor/documents/NOW_report.pdf
UW Extension (2008, June 22). Wisconsin vs. Minnesota: wages in three important sectors.
Retrieved from:
http://www.uwex.edu/CES/cced/economies/economicsnapshot/documents/06-22-08.pdf
University of Wisconsin Madison News. (2006, April 24). Forum weighs impact of higher
education on economy. Retrieved from: http://www.news.wisc.edu/12497
Vanden Plas, J. (2008, November 18). Wisconsin slips in 2008 new economy ranking; kanavas
talks capital formation. Wisconsin Technology Network. Retrieved from:
http://wistechnology.com/articles/5234/
Ward, D. J. (2005, May 31). Human capital and brain power in the wisconsin economy:
Shaping the new wisconsin economy. Retrieved from:
http://www.northstareconomics.com/HumanCapitalReport-final.pdf
Wisconsin Department of Revenue. Division of Research and Policy. (2010, May).
Wisconsin economic outlook. Retrieved from:
http://www.revenue.wi.gov/ra/econ/2010/q1/execsumm.pdf
Wisconsin Technical College System (2009). What we do. Retrieved from:
http://www.wtcsystem.edu/do.htm
Wisconsin Technology Council. (2002). Vision 2020: A model wisconsin economy.
Retrieved from: http://www.wisconsintechnologycouncil.com/uploads/documents/
Vision_2020_web2.pdf

68
Appendix A: Survey
The Educational Opportunity Centers invite you to participate in a voluntary survey.
“This research has been reviewed by the UW-Stout IRB as
required by the Code of Federal Regulations Title 45 Part 46.”
Survey on Motivations and Barriers
Please note: The results of this survey are confidential.
1. Please enter below the county in which you reside:
2. Gender
Female
Male
3. Age
18-24 years
25-44 years
45 +
4. Ethnicity
African-American
Asian
Caucasian
Hispanic/Latino
Native American/Alaska Native
Native Hawaiian or Other Pacific Islander
Other
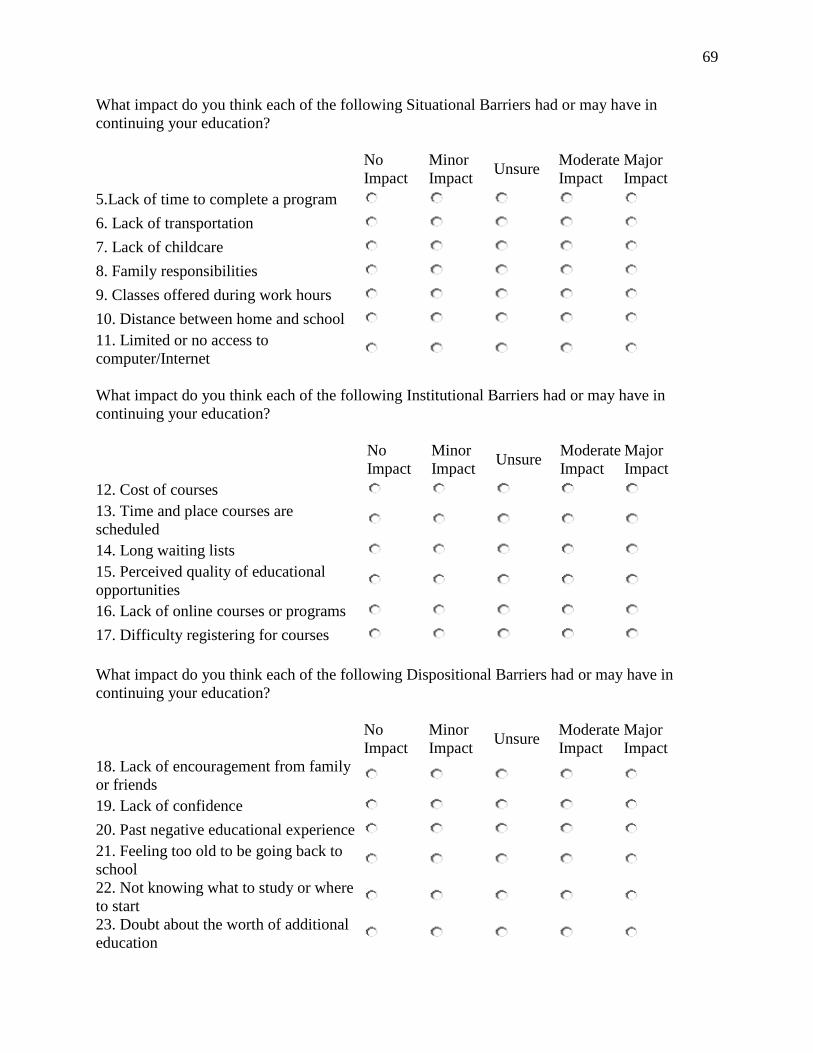
69
What impact do you think each of the following Situational Barriers had or may have in
continuing your education?
No
Impact
Minor
Impact Unsure
Moderate
Impact
Major
Impact
5.Lack of time to complete a program 6. Lack of transportation 7. Lack of childcare 8. Family responsibilities 9. Classes offered during work hours 10. Distance between home and school 11. Limited or no access to
computer/Internet
What impact do you think each of the following Institutional Barriers had or may have in
continuing your education?
No
Impact
Minor
Impact Unsure
Moderate
Impact
Major
Impact
12. Cost of courses 13. Time and place courses are
scheduled
14. Long waiting lists 15. Perceived quality of educational
opportunities
16. Lack of online courses or programs 17. Difficulty registering for courses
What impact do you think each of the following Dispositional Barriers had or may have in
continuing your education?
No
Impact
Minor
Impact Unsure
Moderate
Impact
Major
Impact
18. Lack of encouragement from family
or friends
19. Lack of confidence 20. Past negative educational experience 21. Feeling too old to be going back to
school
22. Not knowing what to study or where
to start
23. Doubt about the worth of additional
education

70
24. What other barriers may prevent you from participating?
What impact do you think each of the following Internal Motivating factors had or may have
in continuing your education?
No
Impact
Minor
Impact Unsure
Moderate
Impact
Major
Impact
25. Self-improvement 26. Meeting new people 27. Need for achievement 28. Learning new things 29. Setting a positive example for
children
30. Career advancement
What impact do you think each of the following External Motivating factors had or may
have in continuing your education?
No
Impact
Minor
Impact Unsure
Moderate
Impact
Major
Impact
31. Job change 32. Marriage 33. Having children 34. Earning more money 35. Approaching retirement 36. Retraining 37. Expectations from family and
friends
38. What other motivating factors may cause you to return to school?
Current participation (Choose One):
39. Full Time Student
40. Half Time Student
41. Not Currently Enrolled but Would like to Attend
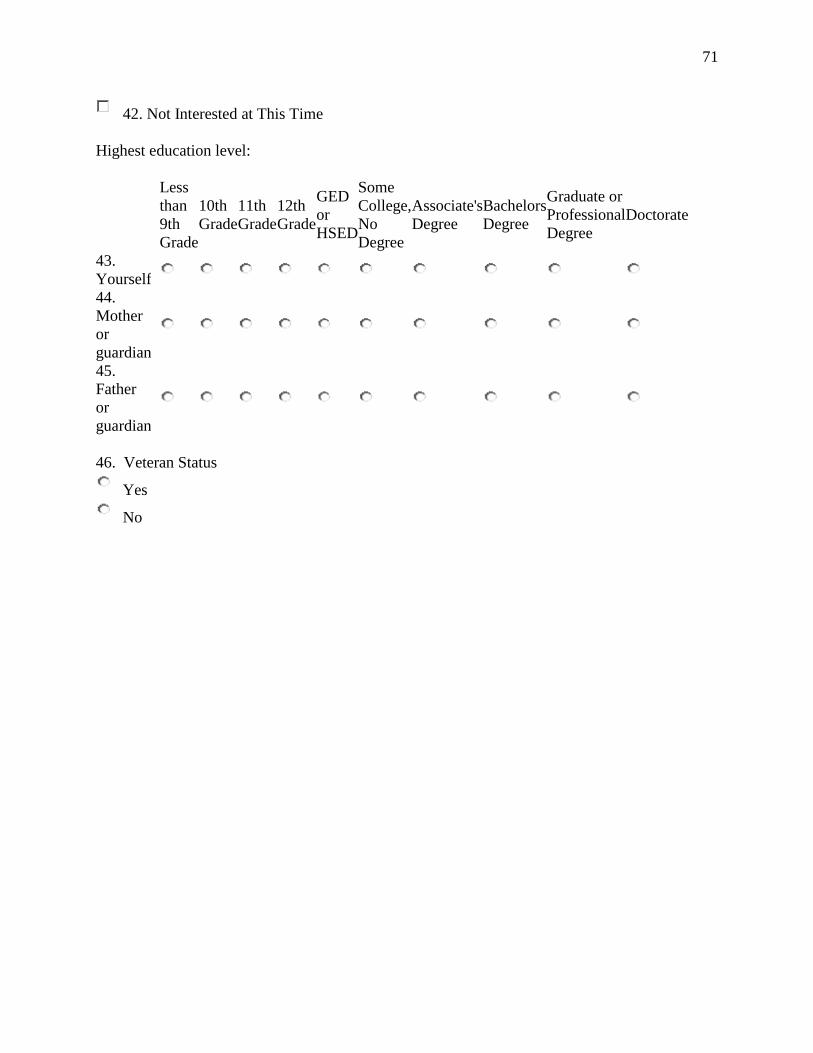
71
42. Not Interested at This Time
Highest education level:
Less
than
9th
Grade
10th
Grade
11th
Grade
12th
Grade
GED
or
HSED
Some
College,
No
Degree
Associate's
Degree
Bachelors
Degree
Graduate or
Professional
Degree
Doctorate
43.
Yourself
44.
Mother
or
guardian
45.
Father
or
guardian
46. Veteran Status
Yes
No
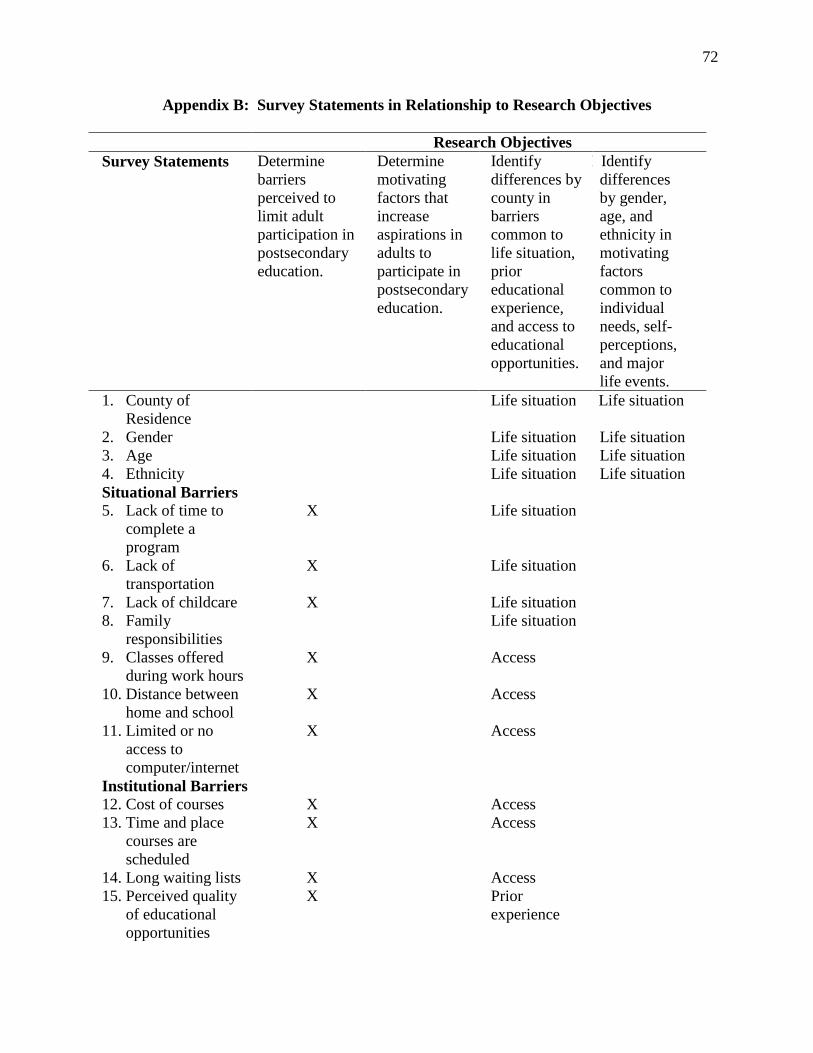
72
Appendix B: Survey Statements in Relationship to Research Objectives
Research Objectives
Survey Statements Determine
barriers
perceived to
limit adult
participation in
postsecondary
education.
Determine
motivating
factors that
increase
aspirations in
adults to
participate in
postsecondary
education.
Identify
differences by
county in
barriers
common to
life situation,
prior
educational
experience,
and access to
educational
opportunities.
I Identify
differences
by gender,
age, and
ethnicity in
motivating
factors
common to
individual
needs, self-
perceptions,
and major
life events.
1. County of
Residence
Life situation Life situation
2. Gender Life situation Life situation
3. Age Life situation Life situation
4. Ethnicity Life situation Life situation
Situational Barriers
5. Lack of time to
complete a
program
X Life situation
6. Lack of
transportation
X Life situation
7. Lack of childcare X Life situation
8. Family
responsibilities
Life situation
9. Classes offered
during work hours
X Access
10. Distance between
home and school
X Access
11. Limited or no
access to
computer/internet
X Access
Institutional Barriers
12. Cost of courses X Access
13. Time and place
courses are
scheduled
X Access
14. Long waiting lists X Access
15. Perceived quality
of educational
opportunities
X Prior
experience
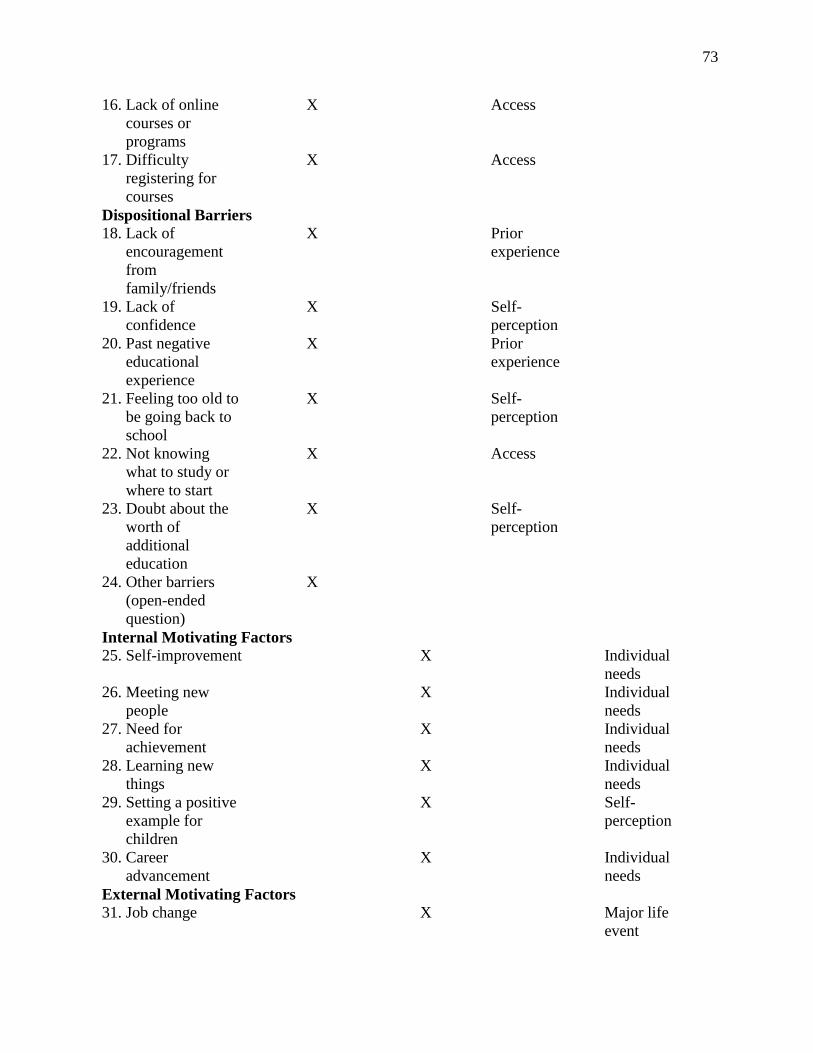
73
16. Lack of online
courses or
programs
X Access
17. Difficulty
registering for
courses
X Access
Dispositional Barriers
18. Lack of
encouragement
from
family/friends
X Prior
experience
19. Lack of
confidence
X Self-
perception
20. Past negative
educational
experience
X Prior
experience
21. Feeling too old to
be going back to
school
X Self-
perception
22. Not knowing
what to study or
where to start
X Access
23. Doubt about the
worth of
additional
education
X Self-
perception
24. Other barriers
(open-ended
question)
X
Internal Motivating Factors
25. Self-improvement X Individual
needs
26. Meeting new
people
X Individual
needs
27. Need for
achievement
X Individual
needs
28. Learning new
things
X Individual
needs
29. Setting a positive
example for
children
X Self-
perception
30. Career
advancement
X Individual
needs
External Motivating Factors
31. Job change X Major life
event

74
32. Marriage X Major life
event
33. Having children Major life
event
34. Earning more
money
X Individual
needs
35. Approaching
retirement
X Major life
event
36. Retraining X Individual
needs
37. Expectations from
family and friends
X Self-
perception
38. Other motivating
factors (open-
ended question)
X
Current Participation
39. Full time student X X
40. Half time student X X
41. Not currently
enrolled but
would like to
attend
X X
42. Not interested at
this time
X X
Highest Education Level
43. Yourself X X
44. Mother or
guardian
X X
45. Father or
guardian
X X
46. Veteran Status X X
75
Appendix C: Cover Letter to EOC Participants
Dear EOC Participant:
I am writing to ask for your participation in an online survey to find out what barriers you face in
reaching your educational goals and the types of motivating factors that may contribute to
overcoming these barriers. The information gained from this survey will help the Educational
Opportunity Centers provide services in the future by providing insight as to the type of
assistance adults need in continuing their education beyond high school.
The survey can be accessed by clicking on the link below.
https://uweauclaire.qualtrics.com/SE/?SID=SV_4O26PUoSxuRBqjq Participation in the survey should take approximately five minutes of your time. The survey is
anonymous and your name will not be included on any documents. We do not believe that you
can be identified from any of this information.
Your participation in this study is entirely voluntary. You may choose not to participate without
any adverse consequences to you. You have the right to stop the survey at any time. However,
should you choose to participate and later wish to withdraw from the study, there is no way to
identify your anonymous document after it has been turned into the investigator. If you are
participating in an anonymous online survey, once you submit your response, the data cannot be
linked to you and cannot be withdrawn. By completing the survey, you agree to participate in
the project entitled, Motives for and Barriers to Participation in Postsecondary Educational
Attainment in Northern Wisconsin.
This study has been reviewed and approved by The University of Wisconsin-Stout's Institutional
Review Board (IRB). The IRB has determined that this study meets the ethical obligations
required by federal law and University policies. If you have questions or concerns regarding this
study, please contact me at 715.836.2024 or via email at [email protected] or you may also
contact Advisor Howard Lee at [email protected]. Should you have any questions, concerns,
or reports regarding your rights as a research subject, you may contact Sue Foxwell, IRB
Administrator, 152 Vocational Rehabilitation Building, UW-Stout, Menomonie, WI,
715.232.2477 or [email protected].
I look forward to receiving your response and I thank you in advance for your assistance in
researching this important topic.
Sincerely,
Paula M. Collins University Services Program Associate | Educational Opportunity Centers University of Wisconsin-Eau Claire| 105 Garfield Avenue | PO Box 4004 Eau Claire WI 54702-4004 |Ph: 715.836.2024 | Toll Free: 800.335.3113 | Email: [email protected]
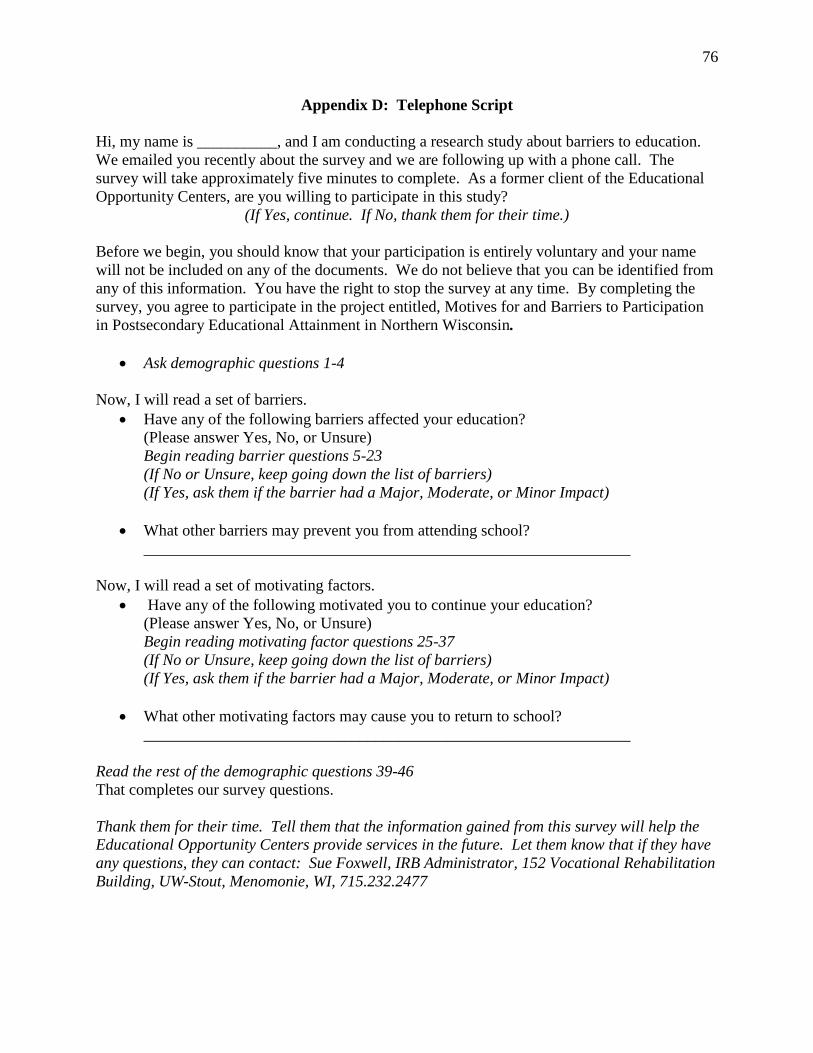
76
Appendix D: Telephone Script
Hi, my name is __________, and I am conducting a research study about barriers to education.
We emailed you recently about the survey and we are following up with a phone call. The
survey will take approximately five minutes to complete. As a former client of the Educational
Opportunity Centers, are you willing to participate in this study?
(If Yes, continue. If No, thank them for their time.)
Before we begin, you should know that your participation is entirely voluntary and your name
will not be included on any of the documents. We do not believe that you can be identified from
any of this information. You have the right to stop the survey at any time. By completing the
survey, you agree to participate in the project entitled, Motives for and Barriers to Participation
in Postsecondary Educational Attainment in Northern Wisconsin.
Ask demographic questions 1-4
Now, I will read a set of barriers.
Have any of the following barriers affected your education?
(Please answer Yes, No, or Unsure)
Begin reading barrier questions 5-23
(If No or Unsure, keep going down the list of barriers)
(If Yes, ask them if the barrier had a Major, Moderate, or Minor Impact)
What other barriers may prevent you from attending school?
_____________________________________________________________
Now, I will read a set of motivating factors.
Have any of the following motivated you to continue your education?
(Please answer Yes, No, or Unsure)
Begin reading motivating factor questions 25-37
(If No or Unsure, keep going down the list of barriers)
(If Yes, ask them if the barrier had a Major, Moderate, or Minor Impact)
What other motivating factors may cause you to return to school?
_____________________________________________________________
Read the rest of the demographic questions 39-46
That completes our survey questions.
Thank them for their time. Tell them that the information gained from this survey will help the
Educational Opportunity Centers provide services in the future. Let them know that if they have
any questions, they can contact: Sue Foxwell, IRB Administrator, 152 Vocational Rehabilitation
Building, UW-Stout, Menomonie, WI, 715.232.2477