ASSESSMENT OF THE VULNERABILITIES AND LOCAL …
79
1 ASSESSMENT OF THE VULNERABILITIES AND LOCAL CAPACITIES OF CITIES DEVELOPMENT INITIATIVE (CDI) CITIES FOR BUILDING URBAN RESILIENCE Strengthening Urban Resilience for Growth with Equity (SURGE) Project CONTRACT NO. AID-492-H-15-00001 DECEMBER 23, 2016 This report is made possible ort of the American people through the United States Agency for International Development (USAID). This report was prepared by the International Council for Local Environmental Initiatives - Local Governments for Sustainability Southeast Asia Secretariat (ICLEI- SEAS), under contract with the International City/County Management Association (ICMA). The contents of this report are the sole responsibility of ICMA.
Transcript of ASSESSMENT OF THE VULNERABILITIES AND LOCAL …
1
ASSESSMENT OF THE VULNERABILITIES AND LOCAL CAPACITIES OF CITIES DEVELOPMENT INITIATIVE (CDI) CITIES FOR BUILDING URBAN RESILIENCE
Strengthening Urban Resilience for Growth with Equity (SURGE) Project CONTRACT NO. AID-492-H-15-00001
DECEMBER 23, 2016
This report is made possible ort of the American people through the United States Agency for International Development (USAID). This report was prepared by the International Council for Local Environmental Initiatives - Local Governments for Sustainability Southeast Asia Secretariat (ICLEI-SEAS), under contract with the International City/County Management Association (ICMA). The contents of this report are the sole responsibility of ICMA.
USAID Strengthening Urban Resilience for Growth with Equity (SURGE) Project Page ii Assessment of the Vulnerabilities and Local Capacities of Cities Development Initiative (CDI) Cities for Building Urban Resilience
ASSESSMENT OF THE VULNERABILITIES AND LOCAL CAPACITIES OF CITIES DEVELOPMENT INITIATIVE (CDI) CITIES FOR BUILDING URBAN RESILIENCE Strengthening Urban Resilience for Growth with Equity (SURGE) Project CONTRACT NO. AID-492-H-15-00001
Program Title: USAID/SURGE
Sponsoring USAID Office: USAID/Philippines
Contract Number: AID-492-H-15-00001
Contractor: International City/County Management Association (ICMA)
Date of Publication: December 23, 2016

USAID Strengthening Urban Resilience for Growth with Equity (SURGE) Project Page iii Assessment of the Vulnerabilities and Local Capacities of Cities Development Initiative (CDI) Cities for Building Urban Resilience
USAID Strengthening Urban Resilience for Growth with Equity (SURGE) Project Page iv Assessment of the Vulnerabilities and Local Capacities of Cities Development Initiative (CDI) Cities for Building Urban Resilience
Contents I. Executive Summary ............................................................................................................. 1
II. Introduction .......................................................................................................................... 4
II. Key Findings ........................................................................................................................ 8
A. Batangas City 8 B. Puerto Princesa City 22 C. Iloilo City 31 D. Tagbilaran City 40 E. Cagayan de Oro City 44 F. Zamboanga City 54
IV. Overall Analysis and Recommendations ..............................................................................67
Tables Table 1. Emerging Priority Urban Systems of the Six SURGE Project Cities 2 Table 2. Indicative List of Core and Secondary Urban Systems 6 Table 3. Summary of Flood Hazards Assessment and Susceptibility in Selected
Barangays of Batangas City 10 Table 4. Vulnerable People and the Supporting Actors Identified in Batangas City 18 Table 5. GHG Emissions Profile of Batangas City, 2010 20 Table 6. Number of Households Vulnerable to Flooding, by Barangay 23 Table 7. Population Vulnerable to Storm Surges 26 Table 8. Key Urban Actors in the Vulnerable Areas of Puerto Princesa City 29 Table 9. Relative Vulnerability of Iloilo City, by Hazard 32 Table 10. Relative Vulnerability of Iloilo City, by Sector 32 Table 11. Vulnerable Places and Key Urban Actors in Iloilo City 37 Table 12. Iloilo City’s GHG Emissions Profile 38 Table 13. Existing Actions of Iloilo City with GHG Reduction Potential 38 Table 14. Key Urban Actors in the Identified Vulnerable Areas in Cagayan de Oro City 50 Table 15. Results of Zamboanga City’s Perceived Threat Level, by Climate Hazard 57 Table 16. Results of Zamboanga City’s Perceived Adaptive Capacity Level 58 Table 17. Results of Zamboanga City’s Relative Vulnerability, By Hazard 58 Table 18. Results of Zamboanga City’s Relative Vulnerability By Sector 58 Table 19. Results of Urban Systems Analysis in Zamboanga City 59 Table 20. Rice Areas Vulnerable to Climate Risks in Zamboanga City 60 Table 21. Emerging Priority Urban Systems of the Six SURGE Project Cities 68

USAID Strengthening Urban Resilience for Growth with Equity (SURGE) Project Page v Assessment of the Vulnerabilities and Local Capacities of Cities Development Initiative (CDI) Cities for Building Urban Resilience
Figures Figure 1. ICLEI – ACCCRN Process 5 Figure 2. Flooding and Landslide Susceptibility Map of Batangas City 9 Figure 3. Storm Surge Flow Depth Map of Batangas City 13 Figure 4. Storm Surge Hazard Map of Batangas City 14 Figure 5. Perceived Adaptive Capacities of Urban Systems in Batangas City 15 Figure 6. Road System in Batangas City Center 17 Figure 7. Flood Susceptibility Map of Puerto Princesa City 24 Figure 8. Production Areas Exposed to Hazard 25 Figure 9. Landslide Susceptibility Map of Puerto Princesa City 26 Figure 10. Perceived Adaptive Capacities of Urban Systems in Puerto Princesa City 27 Figure 11. Flood Hazard Map of Iloilo City 33 Figure 12. Flood Hazard Map of Iloilo City with an Overlay Identifying the
Location of Evacuation Centers 33 Figure 13. Perceived Adaptive Capacities of Urban Systems in Iloilo City 34 Figure 14. Iloilo City’s Water Distribution Map 35 Figure 15. Multi-hazard Risk Map for Cagayan de Oro 45 Figure 16. Drought Vulnerability Map of Cagayan de Oro 46 Figure 17. Flood Vulnerability Map of Cagayan de Oro 47 Figure 18. Landslide Vulnerability Map of Cagayan de Oro 48 Figure 19. Perceived Adaptive Capacities of Urban Systems in Cagayan de Oro 49 Figure 20. Tsunami Hazard Map of Zamboanga City 55 Figure 21. Generalized Landslide and Flood Susceptibility Map of Zamboanga City 56 Figure 22. Flood Susceptibility Map of Zamboanga City Proper and its Environs 57 Figure 23. Zamboanga City Electricity Consumption in kWh 63 Figure 24. Number of Private Vehicles in Zamboanga City 64 Figure 25. Number of Other Land-based Transport in Zamboanga City 64 Figure 26. Number of Hogs in Zamboanga City 65 Figure 27. Number of Other Forms of Livestock in Zamboanga City 65 Figure 28. Perceived Adaptive Capacities of Water system 68 Figure 29. Perceived Adaptive Capacities of Agriculture System 69 Figure 30. Perceived Adaptive Capacities of Transportation System 70 Figure 31. Perceived Adaptive Capacities of Energy System 70
Annex List of Documents Reviewed per City 72
USAID Strengthening Urban Resilience for Growth with Equity (SURGE) Project Page vi Assessment of the Vulnerabilities and Local Capacities of Cities Development Initiative (CDI) Cities for Building Urban Resilience
Acronyms ACCCRN Asian Cities Climate Change Resilience Network AFOLU Agriculture, Forestry, and Other Land Use BATELEC II Batangas Electric Cooperative II BAU Business-as-usual BCWD Batangas City Water District BFAR Bureau of Fisheries and Aquatic Resources BIMP-EAGA Brunei Darussalam-Indonesia-Malaysia-Philippines East ASEAN Growth
Area BLCI Bohol Light Company, Inc. CCTV Central Control Television CDI Cities Development Initiative CDP Comprehensive Development Plan CDDRMC City Disaster Risk Reduction and Management Council CDRRMO City Disaster Risk Reduction and Management Office CEPALCO Cagayan Electric Power and Light Company, Inc. CHO City Health Office CLUP Comprehensive Land Use Plan CO2 Carbon dioxide CO2e Carbon dioxide equivalent DAR Department of Agrarian Reform DENR Department of Environment and Natural Resources DILG Department of the Interior and Local Government DO Dissolved Oxygen DPWH Department of Public Works and Highways DRR-CCA Disaster Risk Reduction – Climate Change Adaptation DRRMO Disaster Risk Reduction and Management Office DRRMP Disaster Risk Reduction and Management Plan ELA Executive Legislative Agenda FAR Floor-to-area-ratio FGD Focus Group Discussion GDP Gross domestic product GHG Greenhouse gas GPC Global Protocol for Community-Scale Greenhouse Gas Emissions GPH Government of the Philippines HLURB Housing and Land Use Regulatory Board HH Households HUC Highly Urbanized City HVC High value crops ICLEI International Council for Local Environmental Initiatives IAP ICLEI – ACCCRN Process ICLEI SEAS International Council for Local Environmental Initiatives -Local
Governments for Sustainability Southeast Asia Secretariat ICMA International City/County Management Association IEC Information, education and communication IIEE Integrated Institute of Electric Engineers IP Indigenous people
USAID Strengthening Urban Resilience for Growth with Equity (SURGE) Project Page vii Assessment of the Vulnerabilities and Local Capacities of Cities Development Initiative (CDI) Cities for Building Urban Resilience
ISET-International Institute for Social and Environmental Transition, International ISF Informal settlement families JMA Japan Meteorological Agency LCCAP Local Climate Change Action Plan LEDS Low-Emission Development Strategies LGU Local Government Unit LTFRB Land Transportation and Franchising Regulatory Board LWUA Local Water Utilities Administration MERALCO Manila Electric Company MGB Mines and Geosciences Bureau MIGEDC Metro Iloilo-Guimaras Economic Development Council MIWD Metro Iloilo Water District MORESCO-1 Misamis Oriental 1 Rural Electric Service Cooperative NAPOCOR National Power Corporation NCCAP National Climate Change Action Plan NCIP National Commission on Indigenous Peoples NEDA National Economic and Development Authority NHA National Housing Authority NRW Non-revenue water NWRB National Water Resources Board OCA Office of the City Agriculturist PCE Planned city extension PCSD Palawan Council for Sustainable Development PFG Partnership for Growth PPCWD Puerto Princesa City Water District PPDO Provincial Planning and Development Office RWSA Rural Waterworks and Sanitation Association SEPPP Socio-economic political physical profile SURGE Strengthening Urban Resiliency for Growth with Equity TDR Transfer development rights TDRO Transportation Development and Regulatory Office TOD Transit-oriented development TWG Technical Working Group UNDP United Nations Development Programme UPLB University of the Philippines Los Baños USAID United States Agency for International Development USG United States Government WRI World Resources Institute ZAMCELCO Zamboanga City Electric Cooperative, Inc. ZCWD Zamboanga City Water District ZO Zoning Ordinance
USAID Strengthening Urban Resilience for Growth with Equity (SURGE) Project Page 1 Assessment of the Vulnerabilities and Local Capacities of Cities Development Initiative (CDI) Cities for Building Urban Resilience
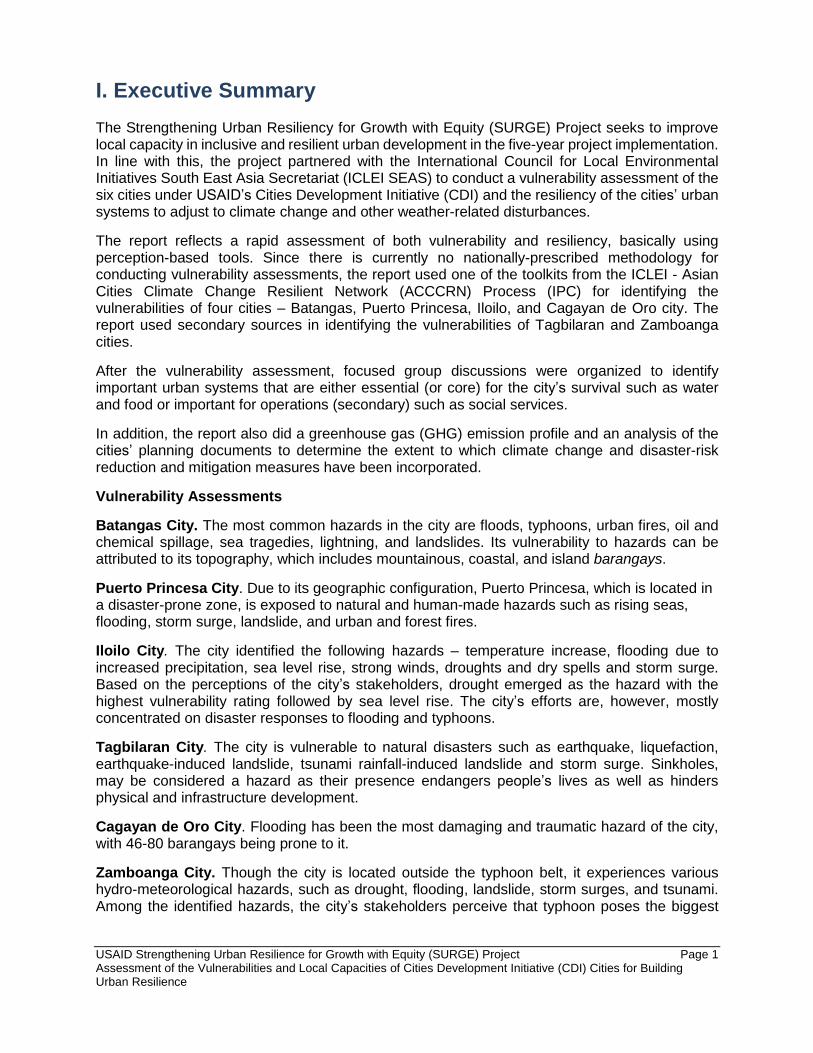
I. Executive Summary The Strengthening Urban Resiliency for Growth with Equity (SURGE) Project seeks to improve local capacity in inclusive and resilient urban development in the five-year project implementation. In line with this, the project partnered with the International Council for Local Environmental Initiatives South East Asia Secretariat (ICLEI SEAS) to conduct a vulnerability assessment of the six cities under USAID’s Cities Development Initiative (CDI) and the resiliency of the cities’ urban systems to adjust to climate change and other weather-related disturbances.
The report reflects a rapid assessment of both vulnerability and resiliency, basically using perception-based tools. Since there is currently no nationally-prescribed methodology for conducting vulnerability assessments, the report used one of the toolkits from the ICLEI - Asian Cities Climate Change Resilient Network (ACCCRN) Process (IPC) for identifying the vulnerabilities of four cities – Batangas, Puerto Princesa, Iloilo, and Cagayan de Oro city. The report used secondary sources in identifying the vulnerabilities of Tagbilaran and Zamboanga cities.
After the vulnerability assessment, focused group discussions were organized to identify important urban systems that are either essential (or core) for the city’s survival such as water and food or important for operations (secondary) such as social services.
In addition, the report also did a greenhouse gas (GHG) emission profile and an analysis of the cities’ planning documents to determine the extent to which climate change and disaster-risk reduction and mitigation measures have been incorporated.
Vulnerability Assessments
Batangas City. The most common hazards in the city are floods, typhoons, urban fires, oil and chemical spillage, sea tragedies, lightning, and landslides. Its vulnerability to hazards can be attributed to its topography, which includes mountainous, coastal, and island barangays.
Puerto Princesa City. Due to its geographic configuration, Puerto Princesa, which is located in a disaster-prone zone, is exposed to natural and human-made hazards such as rising seas, flooding, storm surge, landslide, and urban and forest fires.
Iloilo City. The city identified the following hazards – temperature increase, flooding due to increased precipitation, sea level rise, strong winds, droughts and dry spells and storm surge. Based on the perceptions of the city’s stakeholders, drought emerged as the hazard with the highest vulnerability rating followed by sea level rise. The city’s efforts are, however, mostly concentrated on disaster responses to flooding and typhoons.
Tagbilaran City. The city is vulnerable to natural disasters such as earthquake, liquefaction, earthquake-induced landslide, tsunami rainfall-induced landslide and storm surge. Sinkholes, may be considered a hazard as their presence endangers people’s lives as well as hinders physical and infrastructure development.
Cagayan de Oro City. Flooding has been the most damaging and traumatic hazard of the city, with 46-80 barangays being prone to it.
Zamboanga City. Though the city is located outside the typhoon belt, it experiences various hydro-meteorological hazards, such as drought, flooding, landslide, storm surges, and tsunami. Among the identified hazards, the city’s stakeholders perceive that typhoon poses the biggest
USAID Strengthening Urban Resilience for Growth with Equity (SURGE) Project Page 2 Assessment of the Vulnerabilities and Local Capacities of Cities Development Initiative (CDI) Cities for Building Urban Resilience
threat followed by storm surge. The city is also exposed to human-induced disasters, such as bombings and explosions, capturing the context of multiple conflicts happening in selected areas of Mindanao.
Analysis of Adaptive Capacities in Prioritized Urban Systems
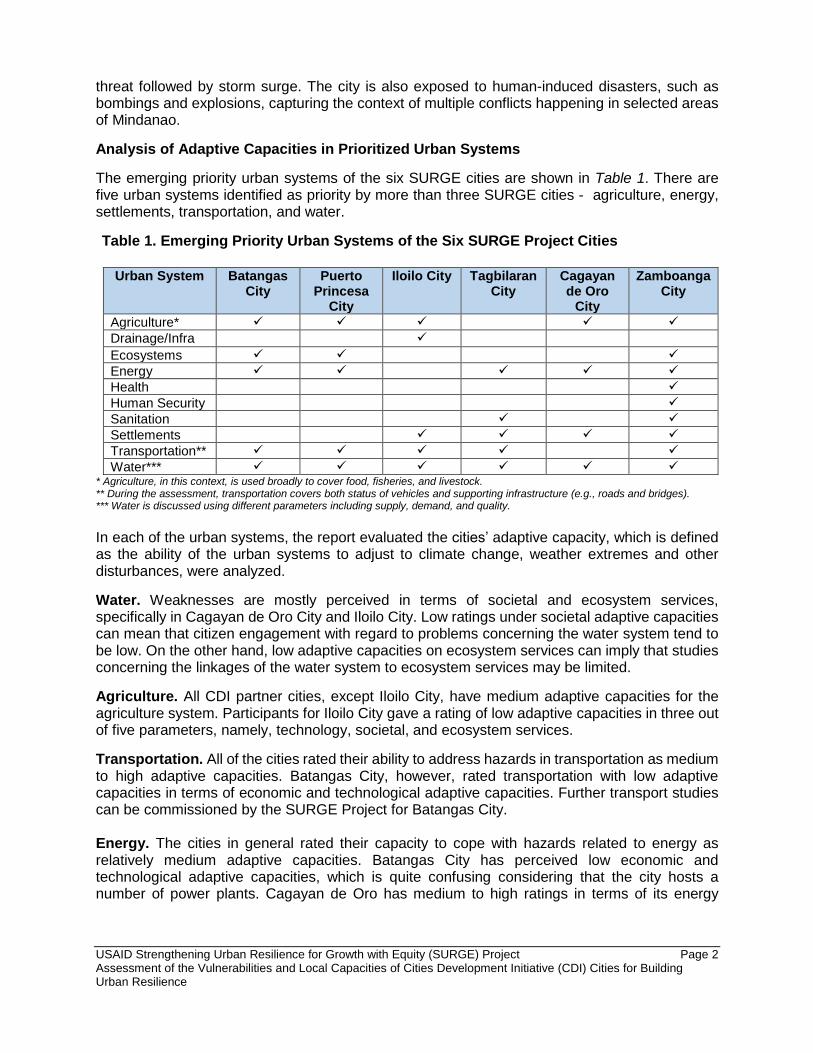
The emerging priority urban systems of the six SURGE cities are shown in Table 1. There are five urban systems identified as priority by more than three SURGE cities - agriculture, energy, settlements, transportation, and water.
Table 1. Emerging Priority Urban Systems of the Six SURGE Project Cities
Urban System Batangas
City Puerto
Princesa City
Iloilo City Tagbilaran City
Cagayan de Oro
City
Zamboanga City
Agriculture* ✓ ✓ ✓ ✓ ✓
Drainage/Infra ✓
Ecosystems ✓ ✓ ✓ Energy ✓ ✓ ✓ ✓ ✓ Health ✓
Human Security ✓ Sanitation ✓ ✓ Settlements ✓ ✓ ✓ ✓ Transportation** ✓ ✓ ✓ ✓ ✓ Water*** ✓ ✓ ✓ ✓ ✓ ✓
* Agriculture, in this context, is used broadly to cover food, fisheries, and livestock. ** During the assessment, transportation covers both status of vehicles and supporting infrastructure (e.g., roads and bridges). *** Water is discussed using different parameters including supply, demand, and quality.
In each of the urban systems, the report evaluated the cities’ adaptive capacity, which is defined as the ability of the urban systems to adjust to climate change, weather extremes and other disturbances, were analyzed.
Water. Weaknesses are mostly perceived in terms of societal and ecosystem services, specifically in Cagayan de Oro City and Iloilo City. Low ratings under societal adaptive capacities can mean that citizen engagement with regard to problems concerning the water system tend to be low. On the other hand, low adaptive capacities on ecosystem services can imply that studies concerning the linkages of the water system to ecosystem services may be limited.
Agriculture. All CDI partner cities, except Iloilo City, have medium adaptive capacities for the agriculture system. Participants for Iloilo City gave a rating of low adaptive capacities in three out of five parameters, namely, technology, societal, and ecosystem services.
Transportation. All of the cities rated their ability to address hazards in transportation as medium to high adaptive capacities. Batangas City, however, rated transportation with low adaptive capacities in terms of economic and technological adaptive capacities. Further transport studies can be commissioned by the SURGE Project for Batangas City. Energy. The cities in general rated their capacity to cope with hazards related to energy as relatively medium adaptive capacities. Batangas City has perceived low economic and technological adaptive capacities, which is quite confusing considering that the city hosts a number of power plants. Cagayan de Oro has medium to high ratings in terms of its energy
USAID Strengthening Urban Resilience for Growth with Equity (SURGE) Project Page 3 Assessment of the Vulnerabilities and Local Capacities of Cities Development Initiative (CDI) Cities for Building Urban Resilience
system’s adaptive capacities. This flags a possible concern, since the sub-region of Mindanao is experiencing a power crisis. The exercise was perception-based and the ratings are highly depended on the participants’ composition, hence, a more detailed assessment on the energy sector of these two cities may be needed.
Settlement. While settlement1 was a priority urban system of four cities, only Cagayan de Oro was able to provide a complete assessment. In CDO, social and ecosystem services were perceived to have low adaptive capacities, which may be attributed to the concerns raised regarding the Badjao settlements within the city. In general, water, energy, and transportation are shared urban systems. This means that the responsibility and management for these systems are not solely within the purview of the city government. There is therefore a need for enhanced partnerships and collaborations with relevant actors to address the issues identified in these sectors. It has been observed, however, that planning processes and implementation in the six cities still tend to be done in silos. There is a pressing need for integration within the city government’s various offices and departments, and between the cities and neighboring municipalities as well as with the national government.
Inventory of Greenhouse Gas Emissions in the Cities
Batangas City and Iloilo City were both supported by USAID in establishing their first city-wide GHG emissions inventory and thereafter formulating a GHG Management Plan. Puerto Princesa City has also previously completed a GHG inventory, which enabled the city to be declared as a carbon-neutral city. This was primarily due to the significant presence of forest land, which sequesters carbon dioxide. The three remaining cities all expressed interest in conducting a GHG inventory. A review of existing secondary documents showed that potential GHG emission sources in the three other cities are also increasing – an expected trend for urbanizing cities.
Analysis of Planning Documents
The six CDI cities are in various stages of preparing the various mandated development plans where the principles of climate change, disaster risk reduction and management and low emission development can be incorporated. The cities of Cagayan de Oro, Puerto Princesa and Iloilo have updated Comprehensive Land Use Plans (CLUPs) Disaster Risk Reduction and Management Plans (DRRMPs) and the Local Climate Change Adaptation Plans (LCCAPs). Zamboanga City and Tagbilaran are currently updating their CLUPs while Batangas is starting the process of CLUP preparation. These cities thus have a chance to incorporate new guidelines from the Housing and Land Use Regulatory Board for CLUP preparation.
Recommendations
The assessments showed that the six CDI partner cities are prepared in achieving urban resiliency at varying levels. The report recommends a more in-depth assessment of vulnerabilities to be conducted, taking into account the most recent climate projections of the Philippine Atmospheric Geophysical and Astronomical Services Administration (PAGASA. Overall, this report provided initial information for possible SURGE Project interventions that would improve local capacity in inclusive and resilient urban development.
1 Iloilo City included settlements as a priority urban system but was unable to submit its ratings. Tagbilaran and Zamboanga City both prioritized settlements. However, the adaptive capacities assessment toolkit was not introduced to them.
USAID Strengthening Urban Resilience for Growth with Equity (SURGE) Project Page 4 Assessment of the Vulnerabilities and Local Capacities of Cities Development Initiative (CDI) Cities for Building Urban Resilience
II. Introduction The SURGE Project is an award of the United States Agency for International Development (USAID) to the International City/County Management Association. The five-year project, from July 27, 2015 to July 26, 2020, supports the USAID/Philippines’ Cities Development Initiative (CDI). SURGE Project is part of the broader Partnership for Growth between the U.S Government and the Philippine Government that aims to shift the Philippines to a sustained and more inclusive growth trajectory. The SURGE Project’s development hypothesis is that second‐tier cities serve as key engines of economic growth and contribute to improved welfare of both urban and rural populations. The Project will assist partner cities and adjacent areas to plan effectively, guarantee basic public services, reduce business transaction costs, promote competitiveness, support sustainable development, and reduce disaster risks while ensuring inclusive and sustainable growth. USAID identified six partner cities to be included in the CDI. These are the cities of Batangas, Puerto Princesa, Iloilo, Tagbilaran, Cagayan De Oro and Zamboanga City. The SURGE Project supports CDI partner cities through its four components: (1) improving local capacity in inclusive and resilient urban development; (2) promoting low‐emission local economic development strategies; (3) expanding economic connectivity and access between urban and rural areas; and (4) strengthening multi‐sectoral capacity to ensure inclusive growth. This report describes the results of the rapid urban systems analysis for the six CDI partner cities that identified gaps and challenges related to infrastructure planning and identified existing disaster risk reduction-climate change adaptation (DRR-CCA) initiatives of CDI partner cities, including those supporting low-emission development strategies (LEDS) and the greenhouse gas (GHG) emission inventory and management. Methodologies Employed The study used a variety of techniques in data collection for the assessment. 1. Desk Review of Secondary Documents. Review of available information on city planning
such as the Comprehensive Land Use Plan (CLUP), Comprehensive Development Plan (CDP), Executive and Legislative Agenda (ELA), Local Climate Change Action Plan (LCCAP), and Disaster Risk Reduction and Management Plan (DRRMP) were conducted. Some data from the CDI partner cities also provided data on their environment code, GHG management plan, and other sectoral plans. Documents and studies on vulnerability and urban development assessments were also obtained from various development partners and universities (Annex 1).
2. Focus Group Discussion (FGD). An FGD was conducted in six CDI partner cities to identify priority development programs, especially in cities highly impacted by climate change. Participants were from the local government unit offices responsible for planning, environment, tourism, DRRM, engineering, transportation and public works, and infrastructure. In some cities, the water district, electric cooperatives, and the private sector, participated in the FGD.
USAID Strengthening Urban Resilience for Growth with Equity (SURGE) Project Page 5 Assessment of the Vulnerabilities and Local Capacities of Cities Development Initiative (CDI) Cities for Building Urban Resilience
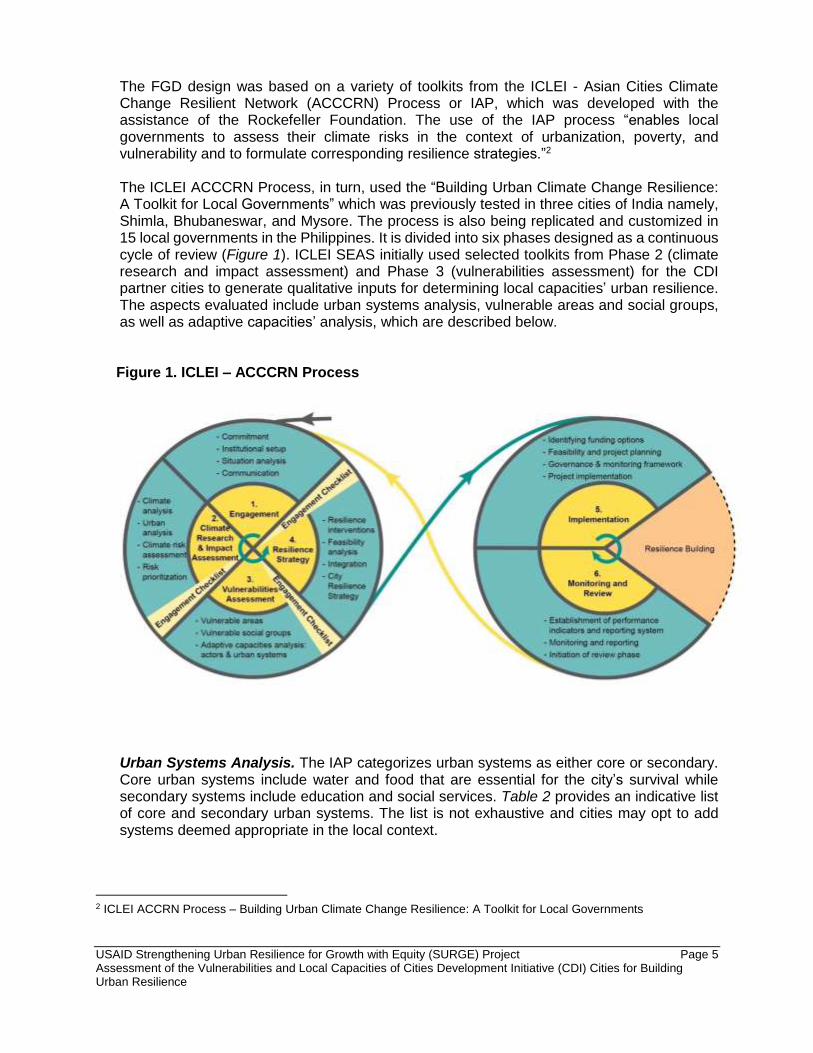
The FGD design was based on a variety of toolkits from the ICLEI - Asian Cities Climate Change Resilient Network (ACCCRN) Process or IAP, which was developed with the assistance of the Rockefeller Foundation. The use of the IAP process “enables local governments to assess their climate risks in the context of urbanization, poverty, and vulnerability and to formulate corresponding resilience strategies.”2 The ICLEI ACCCRN Process, in turn, used the “Building Urban Climate Change Resilience: A Toolkit for Local Governments” which was previously tested in three cities of India namely, Shimla, Bhubaneswar, and Mysore. The process is also being replicated and customized in 15 local governments in the Philippines. It is divided into six phases designed as a continuous cycle of review (Figure 1). ICLEI SEAS initially used selected toolkits from Phase 2 (climate research and impact assessment) and Phase 3 (vulnerabilities assessment) for the CDI partner cities to generate qualitative inputs for determining local capacities’ urban resilience. The aspects evaluated include urban systems analysis, vulnerable areas and social groups, as well as adaptive capacities’ analysis, which are described below.
Figure 1. ICLEI – ACCCRN Process
Urban Systems Analysis. The IAP categorizes urban systems as either core or secondary. Core urban systems include water and food that are essential for the city’s survival while secondary systems include education and social services. Table 2 provides an indicative list of core and secondary urban systems. The list is not exhaustive and cities may opt to add systems deemed appropriate in the local context.
2 ICLEI ACCRN Process – Building Urban Climate Change Resilience: A Toolkit for Local Governments

USAID Strengthening Urban Resilience for Growth with Equity (SURGE) Project Page 6 Assessment of the Vulnerabilities and Local Capacities of Cities Development Initiative (CDI) Cities for Building Urban Resilience
Table 2. Indicative List of Core and Secondary Urban Systems
Some Core Urban Systems Some Secondary Urban Systems
• Ecosystems
• Land
• Energy
• Water
• Food
• Shelter
• Transport
• Communications
• Health care
• Education
• Finance
• Markets
• Sanitation
• Community services
• Public Security
• Taxation
Source: ICLEI – ACCCRN
During the scoping activity, cities were asked to select urban systems which are perceived to be “fragile” and or under pressure even without climate risks. Most of the cities focused on the core urban systems. To characterize fragile urban systems, some “resilience characteristics” were used as guiding principles. Resilient urban systems are defined in the ICLEI-ACCCRN as systems that are able to maintain their functions and linkages in the face of climate stresses and changes. Using the Urban Climate Resilience Planning Framework developed by the Institute for Social and Environmental Transition-International, resilient urban systems are those characterized by:
• Flexibility and diversity wherein a mix of multiple options, assets, and functions are distributed or decentralized, not all affected by a single event;
• Redundancy that pertains to alternatives/back-up systems/contingency plans, capacity for contingency situations, multiple pathways, and options for service delivery in case one or several options fail; and
• Safe failure or the ability to absorb sudden shocks or slow onset stress that will help avoid catastrophic failure.
Vulnerable Areas and Key Urban Actors. Vulnerable areas refer to barangays (villages) affected by a specific climate hazards such as flooding, drought, rain-induced landslides, and other extreme weather events. In this context, vulnerable areas were mostly based on the cities’ previous experiences as well as on information indicated in the maps available from the planning office or the Disaster Risk Reduction and Management Office (DRRMO). The vulnerability assessment exercise was not able to measure the exposure and sensitivity of cities to these hazards since it was focused on the adaptive capacities of actors and urban systems. Two types of actors within the vulnerable areas were (1) vulnerable actors, or those least able to respond to climate impacts; and (2) supporting actors, or those who can aid the local government in helping the vulnerable households to better deal with climate risks. The actors were assessed, using a Likert-type scale or rating scale of 1 to 3 (with 3, as the highest score), based on three parameters. These parameters are capacity to organize and respond, availability of resources, and access to information. This exercise can help identify target beneficiaries for resilience actions and community players who can be engaged to implement resilience actions.

USAID Strengthening Urban Resilience for Growth with Equity (SURGE) Project Page 7 Assessment of the Vulnerabilities and Local Capacities of Cities Development Initiative (CDI) Cities for Building Urban Resilience
Adaptive Capacity of Urban Systems. Adaptive capacity refers to the ability of a system to adjust to climate change, weather extremes, and other disturbances, and take advantage of associated opportunities, according to the Intergovernmental Panel on Climate Change (IPCC). An assessment of the urban system’s adaptive capacity was conducted based on the following criteria identified by the ICLEI – ACCCRN process:
• Economic: availability of financial resources for an urban system;
• Technology/ Infrastructure: the capacity of infrastructure and technologies being adopted for an urban system to address future climate risks;
• Governance: institutionalization of responsibilities and coordination among relevant actors;
• Social: community awareness and engagement; and
• Ecosystems: environmental impacts/consideration.
3. Key Informant Interviews. The FGD was supplemented by interviews particularly on how health, agriculture and environment sectors address climate change concerns.
Limitations of the Study The reliability of information gathered from the cities was highly dependent on the participants’ knowledge. Thus, the results need further validation and analysis in the succeeding activities. The methodologies for each city also varied to some extent, depending on the availability and status of documents on planning. The urban systems analysis toolkit was the only instrument used in Tagbilaran City and Zamboanga City during the March 2016 visit, However, additional ACCCRN toolkits on vulnerability assessment were introduced in the remaining cities in July 2016. In the course of completing this report, the evaluation team attempted to make a consistent assessment despite this limitation.
USAID Strengthening Urban Resilience for Growth with Equity (SURGE) Project Page 8 Assessment of the Vulnerabilities and Local Capacities of Cities Development Initiative (CDI) Cities for Building Urban Resilience
III. Key Findings
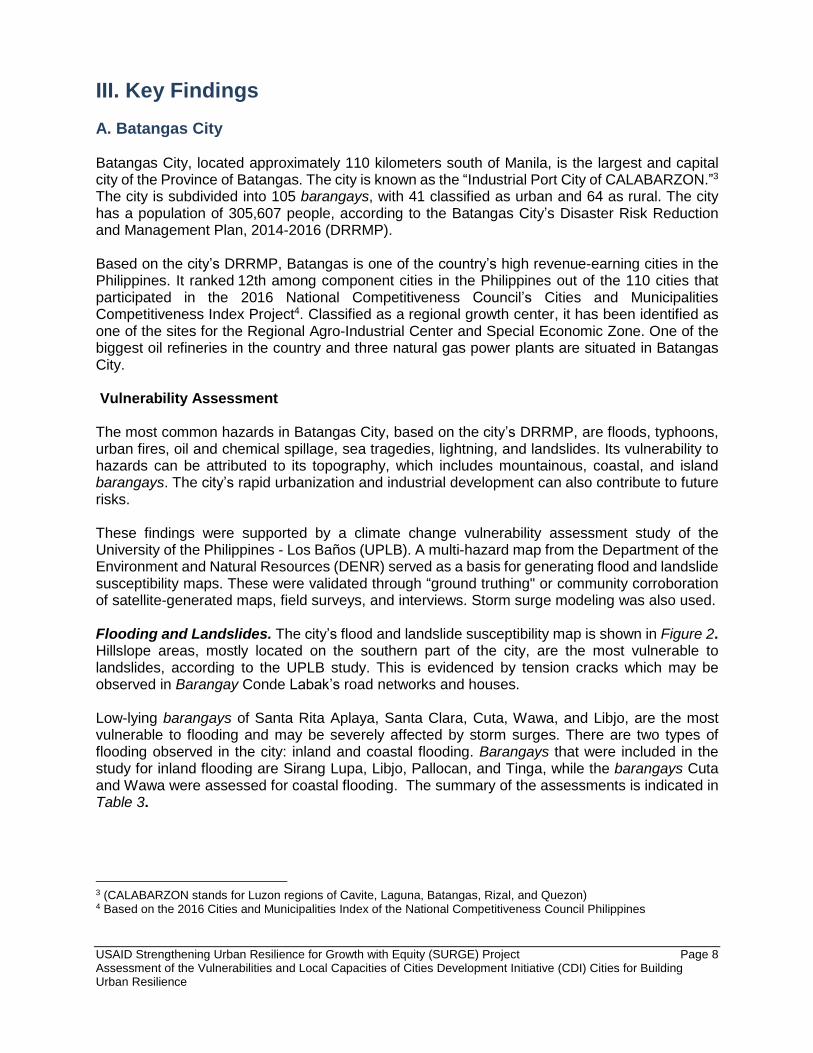
A. Batangas City Batangas City, located approximately 110 kilometers south of Manila, is the largest and capital city of the Province of Batangas. The city is known as the “Industrial Port City of CALABARZON.”3 The city is subdivided into 105 barangays, with 41 classified as urban and 64 as rural. The city has a population of 305,607 people, according to the Batangas City’s Disaster Risk Reduction and Management Plan, 2014-2016 (DRRMP). Based on the city’s DRRMP, Batangas is one of the country’s high revenue-earning cities in the Philippines. It ranked 12th among component cities in the Philippines out of the 110 cities that participated in the 2016 National Competitiveness Council’s Cities and Municipalities Competitiveness Index Project4. Classified as a regional growth center, it has been identified as one of the sites for the Regional Agro-Industrial Center and Special Economic Zone. One of the biggest oil refineries in the country and three natural gas power plants are situated in Batangas City. Vulnerability Assessment The most common hazards in Batangas City, based on the city’s DRRMP, are floods, typhoons, urban fires, oil and chemical spillage, sea tragedies, lightning, and landslides. Its vulnerability to hazards can be attributed to its topography, which includes mountainous, coastal, and island barangays. The city’s rapid urbanization and industrial development can also contribute to future risks. These findings were supported by a climate change vulnerability assessment study of the University of the Philippines - Los Baños (UPLB). A multi-hazard map from the Department of the Environment and Natural Resources (DENR) served as a basis for generating flood and landslide susceptibility maps. These were validated through “ground truthing" or community corroboration of satellite-generated maps, field surveys, and interviews. Storm surge modeling was also used. Flooding and Landslides. The city’s flood and landslide susceptibility map is shown in Figure 2. Hillslope areas, mostly located on the southern part of the city, are the most vulnerable to landslides, according to the UPLB study. This is evidenced by tension cracks which may be observed in Barangay Conde Labak’s road networks and houses. Low-lying barangays of Santa Rita Aplaya, Santa Clara, Cuta, Wawa, and Libjo, are the most vulnerable to flooding and may be severely affected by storm surges. There are two types of flooding observed in the city: inland and coastal flooding. Barangays that were included in the study for inland flooding are Sirang Lupa, Libjo, Pallocan, and Tinga, while the barangays Cuta and Wawa were assessed for coastal flooding. The summary of the assessments is indicated in Table 3.
3 (CALABARZON stands for Luzon regions of Cavite, Laguna, Batangas, Rizal, and Quezon) 4 Based on the 2016 Cities and Municipalities Index of the National Competitiveness Council Philippines

USAID Strengthening Urban Resilience for Growth with Equity (SURGE) Project Page 9 Assessment of the Vulnerabilities and Local Capacities of Cities Development Initiative (CDI) Cities for Building Urban Resilience
Figure 2. Flooding and Landslide Susceptibility Map of Batangas City
Source: UPLB report
USAID Strengthening Urban Resilience for Growth with Equity (SURGE) Project Page 10 Assessment of the Vulnerabilities and Local Capacities of Cities Development Initiative (CDI) Cities for Building Urban Resilience
Table 3. Summary of Flood Hazards Assessment and Susceptibility in Selected Barangays of Batangas City
Location
Flood
Susceptibility Rating
Remarks/Recommendations
INLAND FLOODING
SIRANG LUPA
Bridge over Tangisan River along the road going to Barangay Sirang Lupa N 13°44'3.7" E 121°03'29.2"
Usual: Low Worst: Low
Water level from the Tangisan River rose to about 6 meters during Typhoon Habagat in 2013, causing about 0.5 meters flooding. Flood waters receded after an hour; recurrence (about three times) of the flood was reported within the said period. River width was about 15 meters and dikes were installed on its western portion. Bank erosion of about 10 meters was also noted. Recommendation:
• Monitor and assess the integrity of the dike, and stability of riverbanks.
LIBJO
National Road (near boundary of Barangay Libjo and Barangay San Vicente) N 13° 44.198’ E 121° 04.325’ Alt: 36 m
Usual: Low Worst: Low
No occurrence of flood due to high riverbanks.
Residential area (Sitio Old San Vicente) N 13° 43.937’ E 121° 04.225’ Alt: 20 m
Usual: Low Worst: Moderate
Flood height reached a maximum height of one meter during a heavy rainfall event in the late 90’s. Malitam River does not overflow and flooding does not occur even during typhoons, monsoons, or prolonged rainfall. Recommendations:
• Construct and improve engineering structures along the river
• Develop an early warning device/system
• Designate and identify relocation sites for residents
Riverbank of Malitam River (Sitio Old San Vicente) N 13° 43.805’ E 121° 04.284’ Alt: 2 m
Usual: Low Worst: High
Flood height reached a maximum height of 1.5 meters during a heavy rainfall event in 2007. Malitam River overflowed by as much as 2.5 meters. Recommendations:
• Construct and improve engineering structures along the river
• Develop an early warning device/system
• Designate and identify relocation sites for residents
Riverbank of Malitam River under the wooden bridge (Sitio Old San Vicente)
Usual: Low Worst: Low
No occurrence of flooding due to high riverbanks.
USAID Strengthening Urban Resilience for Growth with Equity (SURGE) Project Page 11 Assessment of the Vulnerabilities and Local Capacities of Cities Development Initiative (CDI) Cities for Building Urban Resilience
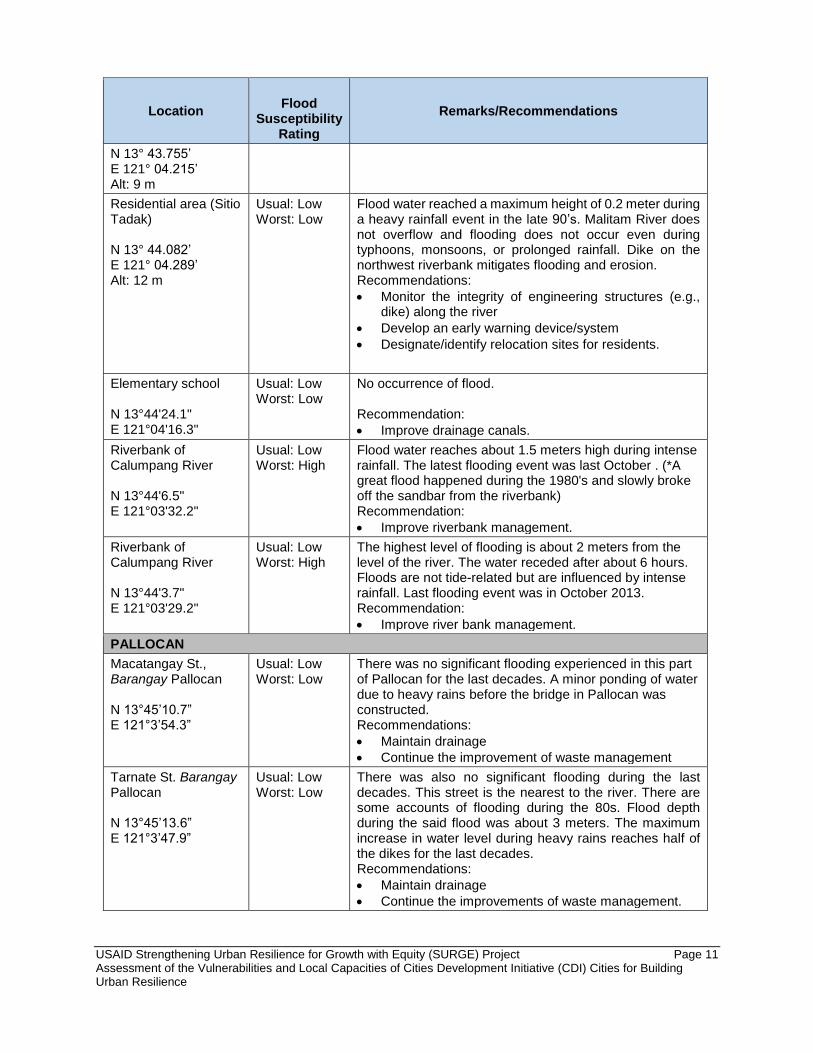
Location
Flood
Susceptibility Rating
Remarks/Recommendations
N 13° 43.755’ E 121° 04.215’ Alt: 9 m
Residential area (Sitio Tadak) N 13° 44.082’ E 121° 04.289’ Alt: 12 m
Usual: Low Worst: Low
Flood water reached a maximum height of 0.2 meter during a heavy rainfall event in the late 90’s. Malitam River does not overflow and flooding does not occur even during typhoons, monsoons, or prolonged rainfall. Dike on the northwest riverbank mitigates flooding and erosion. Recommendations:
• Monitor the integrity of engineering structures (e.g., dike) along the river
• Develop an early warning device/system
• Designate/identify relocation sites for residents.
Elementary school N 13°44'24.1" E 121°04'16.3"
Usual: Low Worst: Low
No occurrence of flood. Recommendation:
• Improve drainage canals.
Riverbank of Calumpang River N 13°44'6.5" E 121°03'32.2"
Usual: Low Worst: High
Flood water reaches about 1.5 meters high during intense rainfall. The latest flooding event was last October . (*A great flood happened during the 1980's and slowly broke off the sandbar from the riverbank) Recommendation:
• Improve riverbank management.
Riverbank of Calumpang River N 13°44'3.7" E 121°03'29.2"
Usual: Low Worst: High
The highest level of flooding is about 2 meters from the level of the river. The water receded after about 6 hours. Floods are not tide-related but are influenced by intense rainfall. Last flooding event was in October 2013. Recommendation:
• Improve river bank management.
PALLOCAN
Macatangay St., Barangay Pallocan N 13°45’10.7” E 121°3’54.3”
Usual: Low Worst: Low
There was no significant flooding experienced in this part of Pallocan for the last decades. A minor ponding of water due to heavy rains before the bridge in Pallocan was constructed. Recommendations:
• Maintain drainage
• Continue the improvement of waste management
Tarnate St. Barangay Pallocan N 13°45’13.6” E 121°3’47.9”
Usual: Low Worst: Low
There was also no significant flooding during the last decades. This street is the nearest to the river. There are some accounts of flooding during the 80s. Flood depth during the said flood was about 3 meters. The maximum increase in water level during heavy rains reaches half of the dikes for the last decades. Recommendations:
• Maintain drainage
• Continue the improvements of waste management.
USAID Strengthening Urban Resilience for Growth with Equity (SURGE) Project Page 12 Assessment of the Vulnerabilities and Local Capacities of Cities Development Initiative (CDI) Cities for Building Urban Resilience
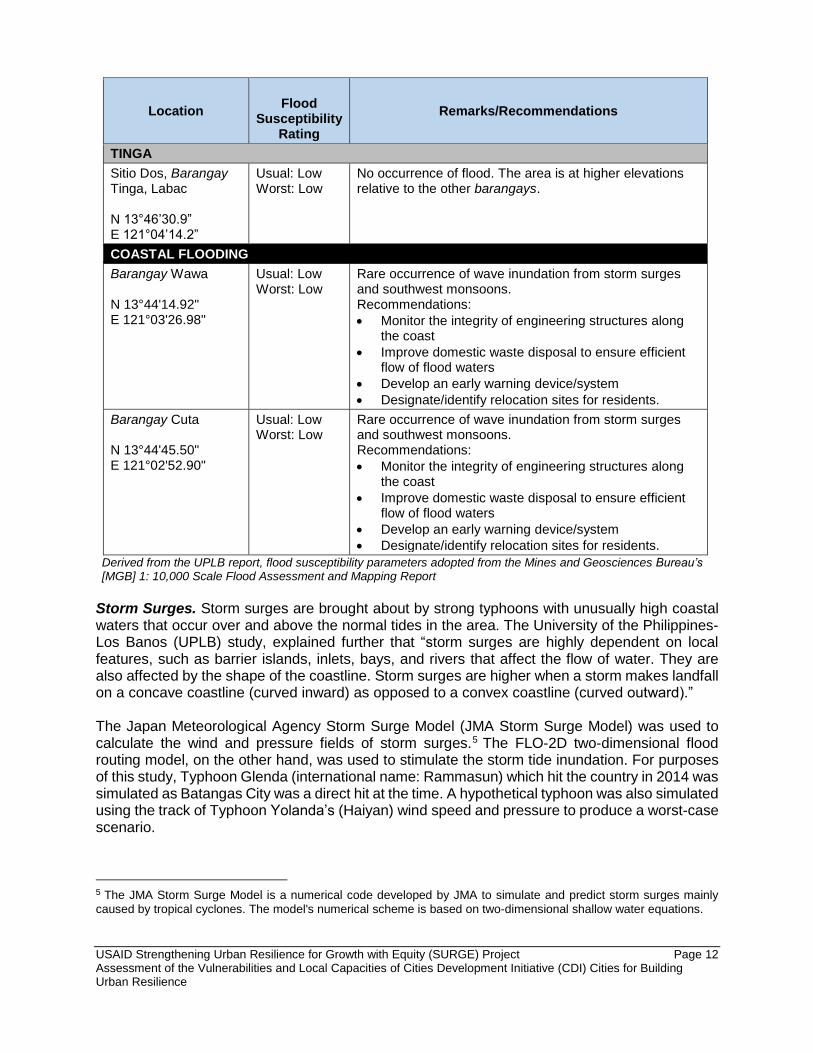
Location
Flood
Susceptibility Rating
Remarks/Recommendations
TINGA
Sitio Dos, Barangay Tinga, Labac N 13°46’30.9” E 121°04’14.2”
Usual: Low Worst: Low
No occurrence of flood. The area is at higher elevations relative to the other barangays.
COASTAL FLOODING
Barangay Wawa N 13°44'14.92" E 121°03'26.98"
Usual: Low Worst: Low
Rare occurrence of wave inundation from storm surges and southwest monsoons. Recommendations:
• Monitor the integrity of engineering structures along the coast
• Improve domestic waste disposal to ensure efficient flow of flood waters
• Develop an early warning device/system
• Designate/identify relocation sites for residents.
Barangay Cuta N 13°44'45.50" E 121°02'52.90"
Usual: Low Worst: Low
Rare occurrence of wave inundation from storm surges and southwest monsoons. Recommendations:
• Monitor the integrity of engineering structures along the coast
• Improve domestic waste disposal to ensure efficient flow of flood waters
• Develop an early warning device/system
• Designate/identify relocation sites for residents.
Derived from the UPLB report, flood susceptibility parameters adopted from the Mines and Geosciences Bureau’s [MGB] 1: 10,000 Scale Flood Assessment and Mapping Report
Storm Surges. Storm surges are brought about by strong typhoons with unusually high coastal waters that occur over and above the normal tides in the area. The University of the Philippines-Los Banos (UPLB) study, explained further that “storm surges are highly dependent on local features, such as barrier islands, inlets, bays, and rivers that affect the flow of water. They are also affected by the shape of the coastline. Storm surges are higher when a storm makes landfall on a concave coastline (curved inward) as opposed to a convex coastline (curved outward).” The Japan Meteorological Agency Storm Surge Model (JMA Storm Surge Model) was used to calculate the wind and pressure fields of storm surges.5 The FLO-2D two-dimensional flood routing model, on the other hand, was used to stimulate the storm tide inundation. For purposes of this study, Typhoon Glenda (international name: Rammasun) which hit the country in 2014 was simulated as Batangas City was a direct hit at the time. A hypothetical typhoon was also simulated using the track of Typhoon Yolanda’s (Haiyan) wind speed and pressure to produce a worst-case scenario.
5 The JMA Storm Surge Model is a numerical code developed by JMA to simulate and predict storm surges mainly
caused by tropical cyclones. The model's numerical scheme is based on two-dimensional shallow water equations.
USAID Strengthening Urban Resilience for Growth with Equity (SURGE) Project Page 13 Assessment of the Vulnerabilities and Local Capacities of Cities Development Initiative (CDI) Cities for Building Urban Resilience
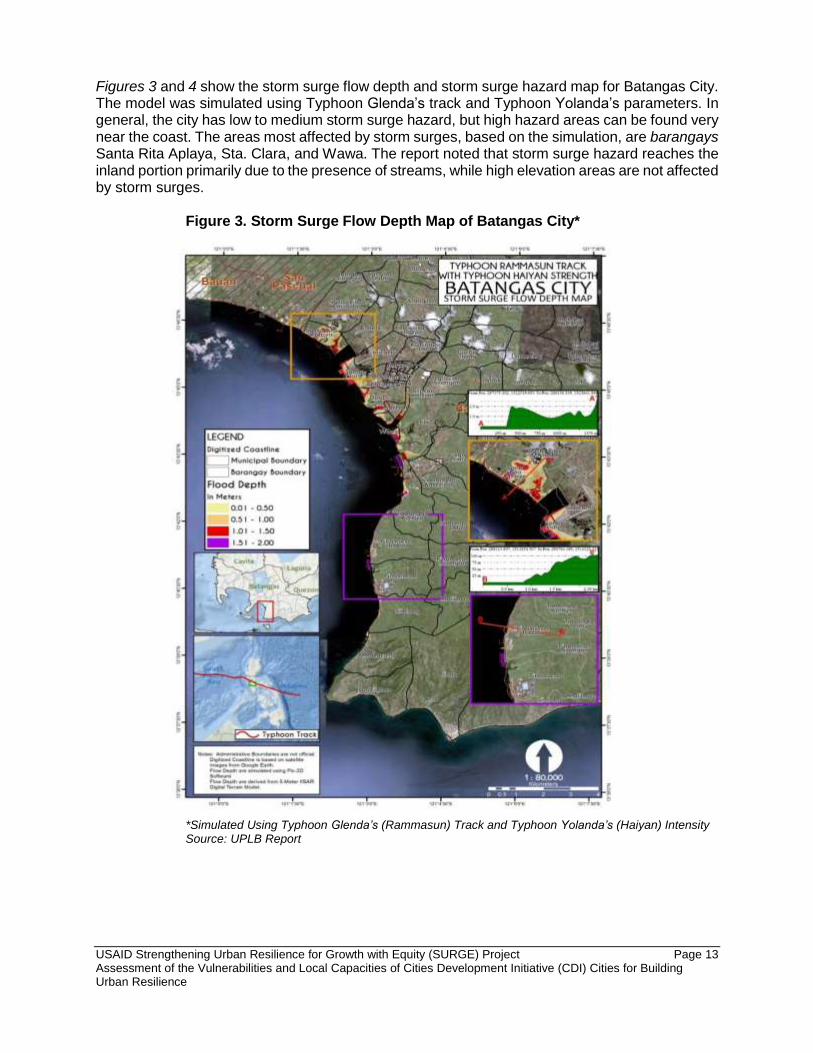
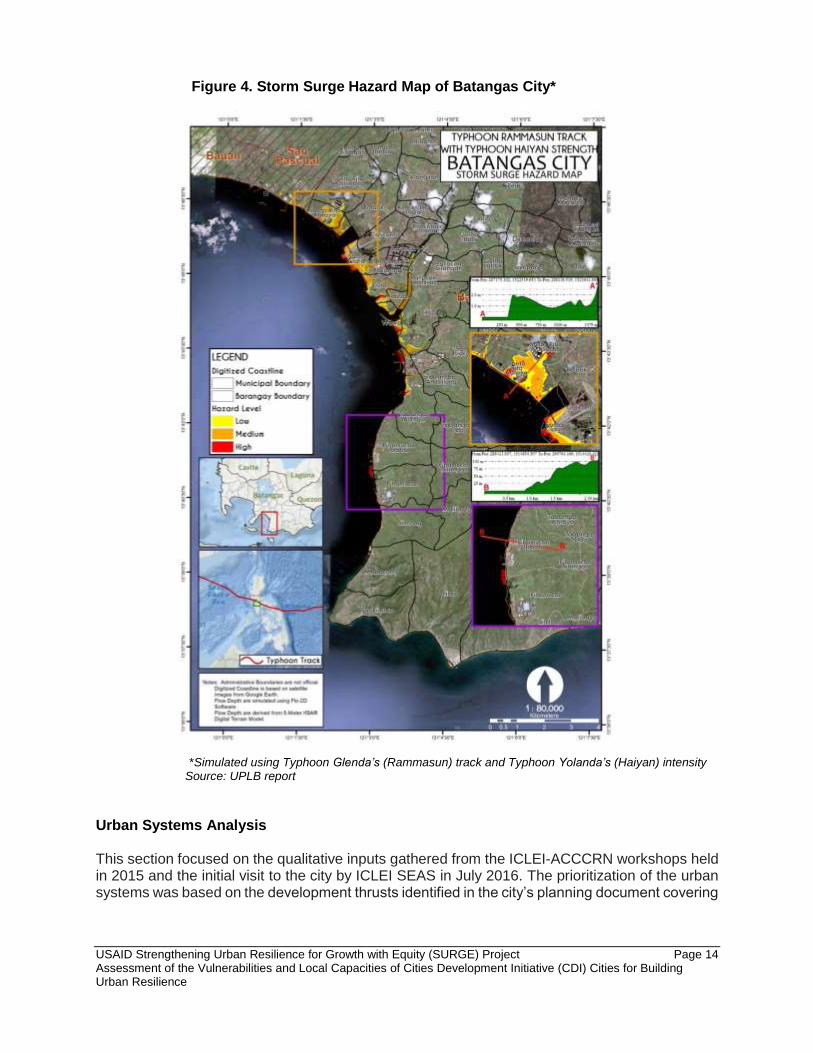
Figures 3 and 4 show the storm surge flow depth and storm surge hazard map for Batangas City. The model was simulated using Typhoon Glenda’s track and Typhoon Yolanda’s parameters. In general, the city has low to medium storm surge hazard, but high hazard areas can be found very near the coast. The areas most affected by storm surges, based on the simulation, are barangays Santa Rita Aplaya, Sta. Clara, and Wawa. The report noted that storm surge hazard reaches the inland portion primarily due to the presence of streams, while high elevation areas are not affected by storm surges.
Figure 3. Storm Surge Flow Depth Map of Batangas City*
*Simulated Using Typhoon Glenda’s (Rammasun) Track and Typhoon Yolanda’s (Haiyan) Intensity Source: UPLB Report
USAID Strengthening Urban Resilience for Growth with Equity (SURGE) Project Page 14 Assessment of the Vulnerabilities and Local Capacities of Cities Development Initiative (CDI) Cities for Building Urban Resilience
Figure 4. Storm Surge Hazard Map of Batangas City*
*Simulated using Typhoon Glenda’s (Rammasun) track and Typhoon Yolanda’s (Haiyan) intensity Source: UPLB report
Urban Systems Analysis This section focused on the qualitative inputs gathered from the ICLEI-ACCCRN workshops held in 2015 and the initial visit to the city by ICLEI SEAS in July 2016. The prioritization of the urban systems was based on the development thrusts identified in the city’s planning document covering

USAID Strengthening Urban Resilience for Growth with Equity (SURGE) Project Page 15 Assessment of the Vulnerabilities and Local Capacities of Cities Development Initiative (CDI) Cities for Building Urban Resilience
2009 to 2018. Figure 5 shows the results of the adaptive capacities assessment of Batangas City’s priority urban systems. Figure 5. Perceived Adaptive Capacities of Urban Systems in Batangas City
Water. The two main water providers in the city are the Batangas City Water District (BCWD) and the Rural Waterworks and Sanitation Associations (RWSAs). The BCWD has the capacity to monitor the volume of water discharged into the distribution system, including water losses incurred and household water consumption trends. The RWSAs, on the other hand, has the capacity to monitor household water consumption only. In terms of infrastructure, pumping stations and generators of the water providers have been upgraded. For instance, a chlorinator via the emergency shutoff valve were already in place. About 80 percent of the water distribution pipes have also been upgraded to Polyvinyl Chlorine (PVC) piping from the use of asbestos cement. Non-revenue water (NRW) has been reduced to 32 percent in 2016 from 58 percent in 2008. Based on the SURGE Project’s rapid water assessment, the BCWD’s average water supply/production capacity was 567,804 cubic meters (m3) per month in 2013while the average monthly demand/consumption capacity is 318,756 m3. The BCWD supplies water to its beneficiaries by pumping from groundwater deep wells and distributing it to consumers through the following systems:
• low-level zones – by gravity from reservoir passing through the break pressure chamber;
• medium-level zones – by gravity flow from reservoir;
• high-level zones – direct-to-line pumping from Soro-Soro Karsada pumping station supported by booster pumping from the Alangilan pumping center;
• supplement to medium – direct-to-line pumping from Kumintang and Calicanto and low-level zones pumping center; and
• barangays far from the main service area including Paharang Kanluran, Dumantay, and Dalig - separate water supply systems using direct-to-line pumping.
The ICLEI-ACCCRN workshop obtained the following perceived climate risks to the city’s water system regarding the identified different hazards:
0
1
2
3
Water Agriculture Ecosystems Transportation Energy
Economic Technology / Infra Governance Societal Ecosystem Services

USAID Strengthening Urban Resilience for Growth with Equity (SURGE) Project Page 16 Assessment of the Vulnerabilities and Local Capacities of Cities Development Initiative (CDI) Cities for Building Urban Resilience
• Changes in Rainfall. It can dry up wells and springs that will cause water supply shortage; increase in rainfall can cause seepage to groundwater which may contaminate the water sources resulting in poor water quality.
• Increase in Temperature. It will decrease water supply from springs, deep well, and shallow wells but it can also lead to an increase in water demand.
• Extreme Weather Event. It can damage water supply sources (such as pipelines) which can add stress to the system.
• Sea-Level Rise (SLR). Coupled with the over-extraction of groundwater, rising seas can put water sources at risk for saltwater intrusion, which will result in poor water quality. At present, there is a dearth of studies on saltwater intrusion in the city.
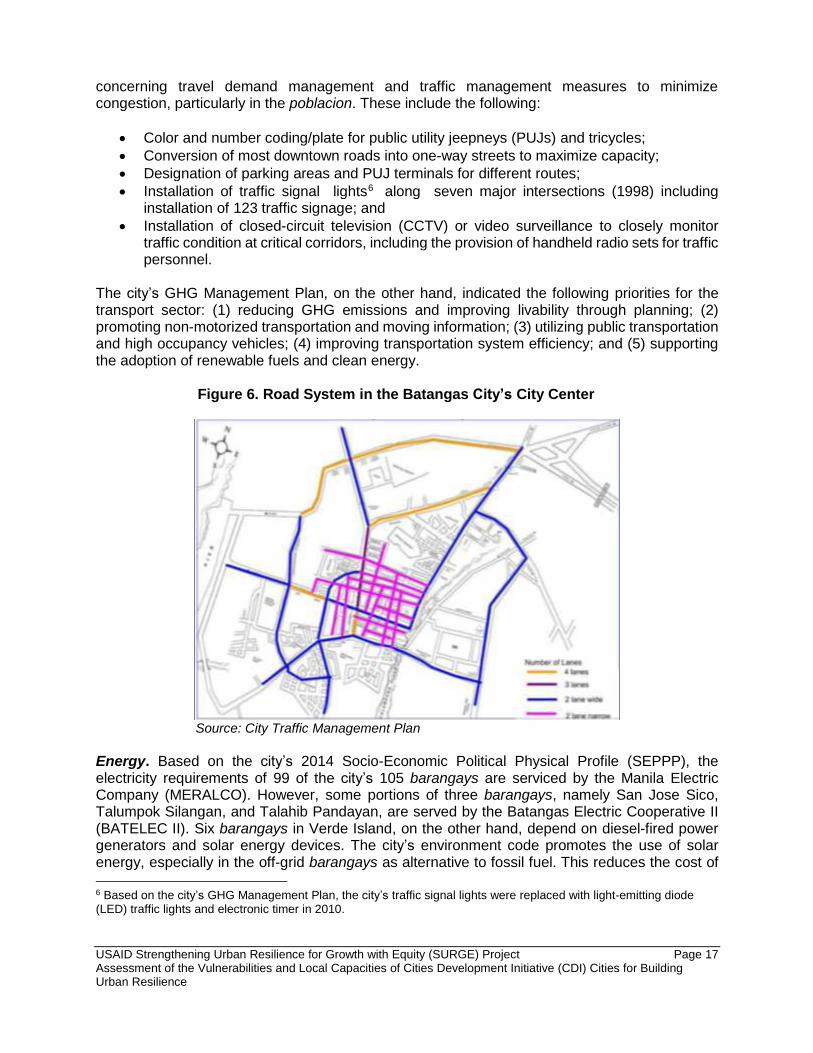
Ecosystems. Calumpang River has been degraded, with its water reclassified from class C to class D. DENR Memorandum Circular No. 1993-07 classified Calumpang River in 1993as class C, suitable for the propagation and growth of aquatic resources, for secondary recreation such as boating, and for industrial water supply which can be used for manufacturing processes after treatment. More recent studies have shown, however, that the water quality has degraded to Class D, limiting the water use to agriculture and cooling purposes for the industries. Calumpang River has high phosphate levels, likely from the animal feeds dumped into the water. The high level of fecal coliform in the water possibly originated from animal wastes. Agriculture (Food). The designated agricultural areas are located mostly in the city’s southern portion. These are suitable only for bamboo production, corn, sugarcane, upland rice, coffee, mango, coconut, and other fruit trees. The city is heavily dependent on agricultural and fishery commodities from nearby towns due to the insufficient production of major agricultural products in the city. During the ICLEI-ACCCRN workshop, participants raised concern over the possibility of (1) abrupt increases in food prices, and (2) road blockage and flooding that can paralyze the city’s supplies in case a large-scale calamity hits the city. Livestock farming is a major industry in Batangas City with large-scale swine and poultry farm operators, making the city highly sufficient in the production of fattener swine. Consequently, the city also exports swine to nearby towns within the province and across the region. There is also an adequate supply of meat products. The monitoring and regulation of livestock farming, however, need to be strengthened since inadequate livestock waste management has been causing the degradation of the ecosystems. Transportation. Results of the ICLEI-ACCCRN workshop indicated that the city’s present transport system lacks alternative access roads, resulting in heavy traffic. Figure 6 shows the current road inventory within the city center, as obtained from the city’s traffic management plan developed by the University of the Philippines Planning and Development Research Foundation, Inc. (UP PLANADES). According to the city’s traffic management plan, traffic congestion can be improved through better coordination with the Land Transportation Franchising and Regulatory Board (LTFRB), and the Department of Public Works and Highways (DPWH), both of which can assist the city in formulating pertinent plans and strategies. From the mitigation perspective, traffic congestion also means more fuel consumption and carbon dioxide (CO2) emissions. Based on the city’s traffic management plan, the city government’s Transportation Development and Regulatory Office (TDRO) has a number of ongoing initiatives
USAID Strengthening Urban Resilience for Growth with Equity (SURGE) Project Page 17 Assessment of the Vulnerabilities and Local Capacities of Cities Development Initiative (CDI) Cities for Building Urban Resilience
concerning travel demand management and traffic management measures to minimize congestion, particularly in the poblacion. These include the following:
• Color and number coding/plate for public utility jeepneys (PUJs) and tricycles;
• Conversion of most downtown roads into one-way streets to maximize capacity;
• Designation of parking areas and PUJ terminals for different routes;
• Installation of traffic signal lights6 along seven major intersections (1998) including installation of 123 traffic signage; and
• Installation of closed-circuit television (CCTV) or video surveillance to closely monitor traffic condition at critical corridors, including the provision of handheld radio sets for traffic personnel.
The city’s GHG Management Plan, on the other hand, indicated the following priorities for the transport sector: (1) reducing GHG emissions and improving livability through planning; (2) promoting non-motorized transportation and moving information; (3) utilizing public transportation and high occupancy vehicles; (4) improving transportation system efficiency; and (5) supporting the adoption of renewable fuels and clean energy.
Figure 6. Road System in the Batangas City’s City Center
Source: City Traffic Management Plan
Energy. Based on the city’s 2014 Socio-Economic Political Physical Profile (SEPPP), the electricity requirements of 99 of the city’s 105 barangays are serviced by the Manila Electric Company (MERALCO). However, some portions of three barangays, namely San Jose Sico, Talumpok Silangan, and Talahib Pandayan, are served by the Batangas Electric Cooperative II (BATELEC II). Six barangays in Verde Island, on the other hand, depend on diesel-fired power generators and solar energy devices. The city’s environment code promotes the use of solar energy, especially in the off-grid barangays as alternative to fossil fuel. This reduces the cost of
6 Based on the city’s GHG Management Plan, the city’s traffic signal lights were replaced with light-emitting diode (LED) traffic lights and electronic timer in 2010.

USAID Strengthening Urban Resilience for Growth with Equity (SURGE) Project Page 18 Assessment of the Vulnerabilities and Local Capacities of Cities Development Initiative (CDI) Cities for Building Urban Resilience
transporting generators as well as of extending the transmission and distribution lines to remote areas such as Verde Island. During the ICLEI-ACCCRN workshop, participants stressed that water and communication systems highly correlate with energy. Power shortages can paralyze water, transport, and communications systems. This is particularly difficult during disasters. Urban Actors’ Characteristics Based on the results of the urban systems analysis, key informants identified vulnerable and supporting actors for each urban system (Table 4). Community members or residents are considered the most vulnerable actors. Farmers and fishermen were also identified as vulnerable, particularly with regard to food and ecosystems. This situation implies that there is a need for the city government to be more engaged with communities in enhancing its programs and initiatives. The programs and policies, which are in place should be reviewed, and strategies should be tailor-fitted to target the vulnerable actors. Table 4. Vulnerable People and the Supporting Actors Identified in Batangas City
Urban System Perceived Problems and Climate Risk/s
Vulnerable Actors
Potential Supporting Actor
Wate
r S
upp
ly
Vulnerability of the city to sea-level rise and storm surges with salt-water intrusion as a secondary impact.
Residents of affected coastal barangays
• LGU
• Schools
• Industries
• Unaffected barangays
Increased precipitation disrupts/damages water supply infrastructure. Increased temperatures lead to increased demand for water stress on the supply system.
Residents relying on the water supply system
• Water District
• LGU
Tra
nsport
Lacks back-up and alternatives resulting in traffic congestion.
Residents in poblacion and commuters
• LGU – Transportation Development and Regulatory Office (TDRO)
Inadequate infrastructure to hold the volume of vehicles plying the streets is present.
Residents • LGU
Potential loss of available green spaces if additional transportation infrastructure will be added.
Residents • LGU
• Barangay Officials
• Residents
• Schools
• Business Establishments
• Private Sectors
• Non-government organizations (NGOs)
USAID Strengthening Urban Resilience for Growth with Equity (SURGE) Project Page 19 Assessment of the Vulnerabilities and Local Capacities of Cities Development Initiative (CDI) Cities for Building Urban Resilience
Urban System Perceived Problems and Climate Risk/s
Vulnerable Actors
Potential Supporting Actor
Fo
od
Heavy dependence on the supply of agriculture and fishery commodities from nearby towns and cities.
Residents Farmers
• LGU – (Office of the City Veterinarian and Agricultural Office (OCVAS)
• DENR
• Universities (Research)
Declining fish catch in the city and imported goods.
Fisher folks Residents
Ecosyste
m
Degrading water quality of Calumpang River
Farmers Fisher folks
• LGU – Environment and Natural Resources Officer (ENRO)
• Commissioned third party laboratory
• UPLB-School of Environmental Science and Management (SESAM)USAID
• Industries and business establishments
• NGOs
• Schools
Rise of informal settlers in public lands and portions of coastal areas and riverbanks. Informal settlers suffer from poor environmental conditions because of overcrowding and lack of water and sanitation facilities. They are also the most vulnerable to disasters especially during typhoons and tropical cyclones.
Indigenous people
• LGU
• Barangay Officials
• UPLB-SESAM
• Private sector
Poor condition of coral reefs. LGU Residents and Fisher folks
• LGU
• Barangay Officials
• DENR
• UPLB-SESAM
• Private sector
Energ
y
Dependence on the sole private distributor, Meralco. Shortage of power supply in Verde Island.
Residents LGU
• LGU
• USAID
Isla Verde Residents
• LGU
• USAID
• Meralco
• Private sector
GHG Emissions Profile Batangas City registered a total net GHG emissions of 421,884 tons of carbon dioxide equivalent (CO2e) in 2010. Table 5 shows a summary of the city’s emissions based on its GHG inventory
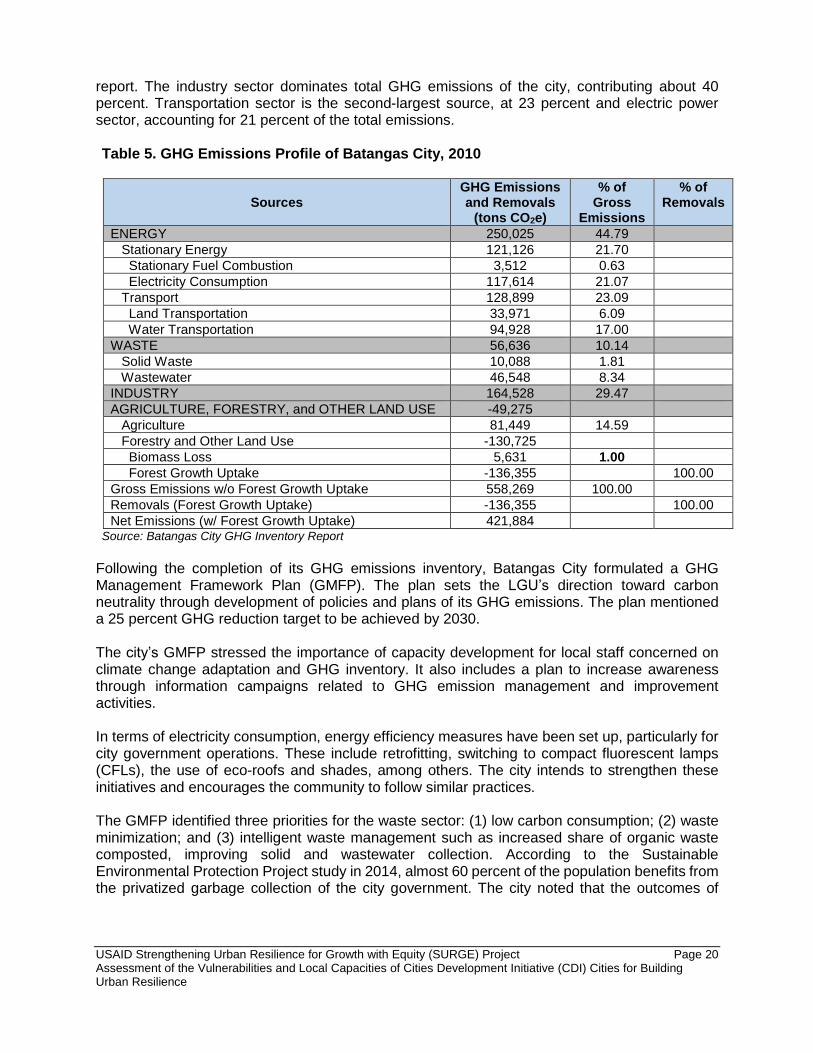
USAID Strengthening Urban Resilience for Growth with Equity (SURGE) Project Page 20 Assessment of the Vulnerabilities and Local Capacities of Cities Development Initiative (CDI) Cities for Building Urban Resilience
report. The industry sector dominates total GHG emissions of the city, contributing about 40 percent. Transportation sector is the second-largest source, at 23 percent and electric power sector, accounting for 21 percent of the total emissions. Table 5. GHG Emissions Profile of Batangas City, 2010
Sources GHG Emissions and Removals
(tons CO2e)
% of Gross
Emissions
% of Removals
ENERGY 250,025 44.79
Stationary Energy 121,126 21.70
Stationary Fuel Combustion 3,512 0.63
Electricity Consumption 117,614 21.07
Transport 128,899 23.09
Land Transportation 33,971 6.09
Water Transportation 94,928 17.00
WASTE 56,636 10.14
Solid Waste 10,088 1.81
Wastewater 46,548 8.34
INDUSTRY 164,528 29.47
AGRICULTURE, FORESTRY, and OTHER LAND USE -49,275
Agriculture 81,449 14.59
Forestry and Other Land Use -130,725
Biomass Loss 5,631 1.00
Forest Growth Uptake -136,355 100.00
Gross Emissions w/o Forest Growth Uptake 558,269 100.00
Removals (Forest Growth Uptake) -136,355 100.00
Net Emissions (w/ Forest Growth Uptake) 421,884 Source: Batangas City GHG Inventory Report
Following the completion of its GHG emissions inventory, Batangas City formulated a GHG Management Framework Plan (GMFP). The plan sets the LGU’s direction toward carbon neutrality through development of policies and plans of its GHG emissions. The plan mentioned a 25 percent GHG reduction target to be achieved by 2030. The city’s GMFP stressed the importance of capacity development for local staff concerned on climate change adaptation and GHG inventory. It also includes a plan to increase awareness through information campaigns related to GHG emission management and improvement activities. In terms of electricity consumption, energy efficiency measures have been set up, particularly for city government operations. These include retrofitting, switching to compact fluorescent lamps (CFLs), the use of eco-roofs and shades, among others. The city intends to strengthen these initiatives and encourages the community to follow similar practices. The GMFP identified three priorities for the waste sector: (1) low carbon consumption; (2) waste minimization; and (3) intelligent waste management such as increased share of organic waste composted, improving solid and wastewater collection. According to the Sustainable Environmental Protection Project study in 2014, almost 60 percent of the population benefits from the privatized garbage collection of the city government. The city noted that the outcomes of
USAID Strengthening Urban Resilience for Growth with Equity (SURGE) Project Page 21 Assessment of the Vulnerabilities and Local Capacities of Cities Development Initiative (CDI) Cities for Building Urban Resilience
reducing carbon emissions from the waste sector are magnified by its co-benefits to the physical surroundings, especially with regard to health and sanitation, and the city’s overall livability. Batangas City identified a number of strategies to reduce emissions from the agriculture and forestry sectors. The agriculture sector focuses on organic and more sustainable production. The city prioritized the promotion of low-carbon crops and cropland management practices as well as the improvement of livestock management. For forestry, priorities were on the reduction of deforestation, improvement of forest management, and establishment of forests in non-forested land. Under the forestry and land use sector, existing strategies, as indicated in the GHG Management Plan of 2013, are the following:
• Implementation of the zoning ordinance (ZO) and the CLUP;
• Greening through tree and mangrove planting;
• Establishment of urban greenbelt and city carbon sink areas at the central business district;
• Establishment of eco-parks and gardens at school grounds; and
• Public-Private Partnerships for the Garbo-Forest Project at the closed city dumpsite.
As indicated in its GHG management plan, the city believes that greening initiatives “do not just play a role in addressing climate change but also offer various benefits such as air quality improvement, flood protection, and revitalization of neighborhoods, to name a few.”7
Analysis of Planning Documents
The city’s current planning documents cover the period 2008 to 2018. UP PLANADES was contracted to update the documents, having done it for the period of 1998-2007. The document includes a separate chapter dedicated to solid waste and traffic management. Some initiatives, particularly those under environmental management and infrastructure sector enumerated in the CDP, adhere to the concepts of DRR-CCA and LEDS. There is, however, needed improvement in mainstreaming DRR-CCA and LEDS into the social and economic development programs and strategies. The city has completed its DRRMP covering 2014 to 2016. The plan aims to strengthen the city’s capacity, along with its partner stakeholders, in building disaster-resilient communities. The DRR office was created and tasked to consolidate local disaster risk information that includes natural hazards, vulnerabilities, and climate change risks. The office also maintains a local risk map. A UPLB study indicated that the city has completed a science-based vulnerability assessment, covering both geological and hydro-meteorological risks. The results of this vulnerability assessment will be useful in updating the city’s DRRMP. The concept of urban resilience was not mentioned in the city’s current planning documents. At present, Batangas City is part of the ICLEI-implemented ACCCRN project supported by Rockefeller Foundation. The ACCCRN project aims to help the city in developing its local climate adaptation action plan (LCCAP). The final output of the project is being developed. The city’s GHG inventory, on the other hand, showed that more than 70 percent of transport emissions are from water-based transport due to the presence of an international port (Table 4).
7 GHG Management Plan 2013, Batangas City
USAID Strengthening Urban Resilience for Growth with Equity (SURGE) Project Page 22 Assessment of the Vulnerabilities and Local Capacities of Cities Development Initiative (CDI) Cities for Building Urban Resilience
Most strategies identified, however, pertain only to land-based transport. Hence, the city may opt to revisit and review its strategies to address the emissions from water-based transport. The city can coordinate with the Philippine Ports Authority (PPA) on this matter.
A rapid review of the GHG Management Plan also showed that while industry registered as the sector with highest GHG emissions, only few strategies were identified for the sector. Interventions were mostly focused on energy use and not on the industrial process and product use. Under the current plan, strategies for the industry are promoting the following:
• use of energy-efficient motors and variable speed drives in industrial facilities;
• use of energy-efficient lighting;
• installation of process efficiency improvements; and
• monitoring and reduction of non-CO2 GHG in industrial facilities.
Since the city’s planning documents are still being prepared, Batangas City is in a position to integrate and mainstream CCA-DRR and LEDS into their plans. Due to climate change and the rapid urbanization in Batangas City, there is an urgent need to look beyond geopolitical boundaries and strengthen ties with neighboring and adjacent municipalities. The watershed or river basin approach may be used to ensure maximum development gains. In the case of Batangas City, the establishment of an inter-municipality Calumpang River Basin Council can help manage the watershed.
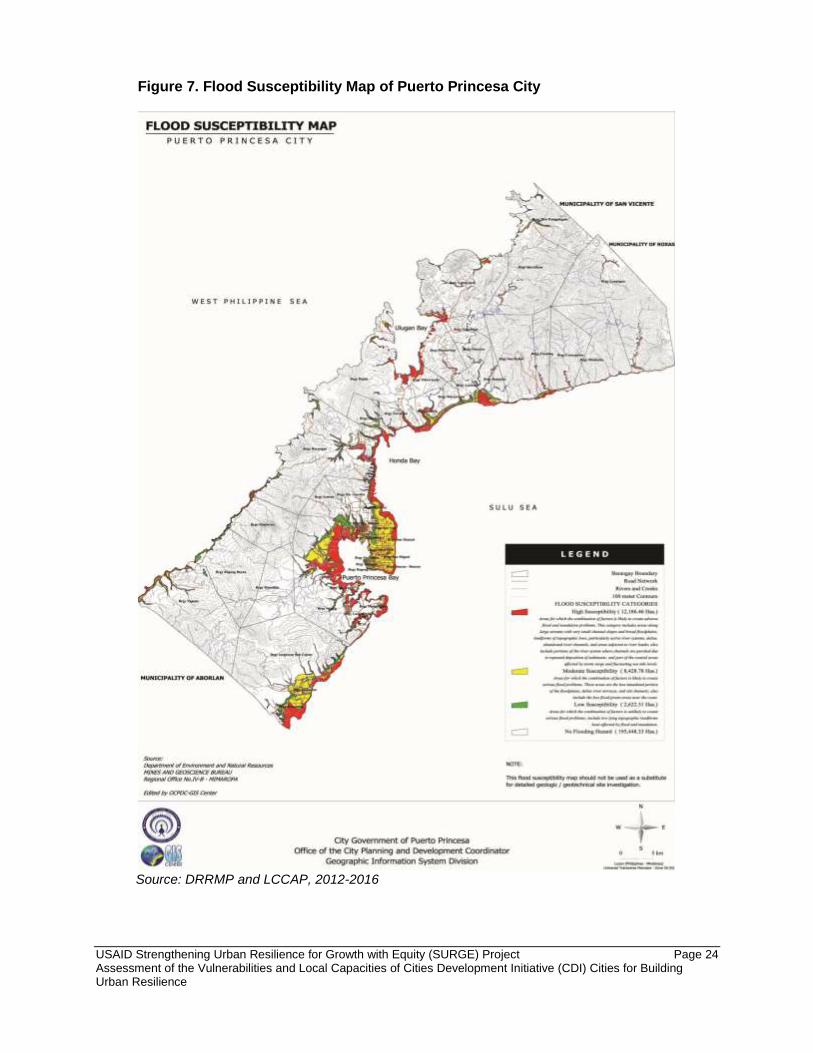
B. Puerto Princesa City Puerto Princesa City is a highly urbanized city in the Province of Palawan with a total population of 222, 673 based on the 2010 Census of Population and Housing (CPH). The city sprawls across 219,339.40 hectares of land and its forest cover stands at 70 percent. The census states that the urban population accounts for the use of 76 percent of the city’s total land area. It is touted as a “city in a forest” for good reason. In its CLUP, it highlighted the vision of being a model city in sustainable development, exhibiting the character of a city in a forest and demonstrating the proper balance between development and environment. Vulnerability Assessment Due to its geographic configuration, Puerto Princesa is located in a disaster-prone zone and is exposed to natural and human-made hazards such as rising seas, flooding, storm surge, landslide, and urban and forest fires. Flooding, particularly in low-lying urban areas, is mainly caused by heavy rainfall aggravated by human activities like blocked waterways due to improper disposal of wastes. The city’s proximity to water bodies on both its east (Honda Bay and Puerto Princesa Bay) and west coasts (Ulugan Bay) exposes the coastal areas to such hazards as storm surge, tsunami, and sea-level rise. The steepness of the hills and the mountains of the city renders its 12 rural barangays susceptible to landslides. Urban and forest fires can also occur in the city due to its large forest cover. According to the DRRMP and LCCAP 2012-2016 of Puerto Princesa, about 10,096 people in 37 barangays are highly vulnerable to flooding (Table 6). An estimated 4.3 percent of Puerto Princesa City’s land area are prone to flooding (Figure 7). The estimate may be conservative as
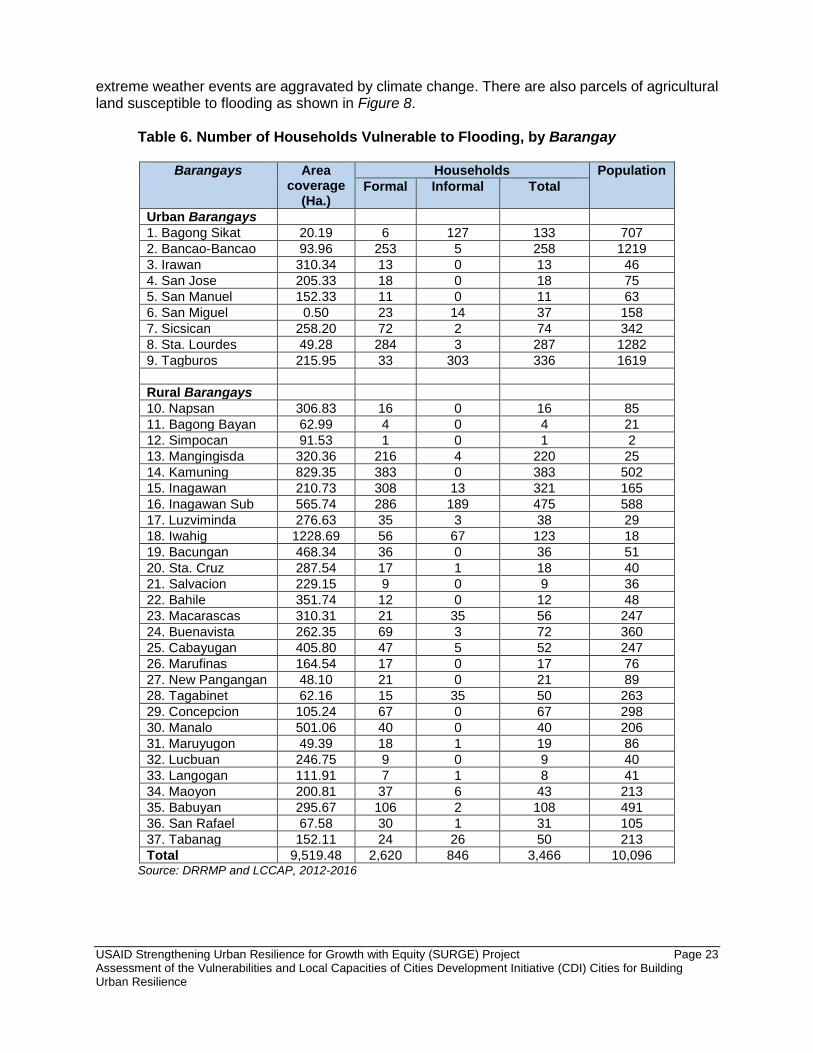
USAID Strengthening Urban Resilience for Growth with Equity (SURGE) Project Page 23 Assessment of the Vulnerabilities and Local Capacities of Cities Development Initiative (CDI) Cities for Building Urban Resilience
extreme weather events are aggravated by climate change. There are also parcels of agricultural land susceptible to flooding as shown in Figure 8.
Table 6. Number of Households Vulnerable to Flooding, by Barangay
Barangays Area coverage
(Ha.)
Households Population
Formal Informal Total
Urban Barangays
1. Bagong Sikat 20.19 6 127 133 707
2. Bancao-Bancao 93.96 253 5 258 1219
3. Irawan 310.34 13 0 13 46
4. San Jose 205.33 18 0 18 75
5. San Manuel 152.33 11 0 11 63
6. San Miguel 0.50 23 14 37 158
7. Sicsican 258.20 72 2 74 342
8. Sta. Lourdes 49.28 284 3 287 1282
9. Tagburos 215.95 33 303 336 1619
Rural Barangays
10. Napsan 306.83 16 0 16 85
11. Bagong Bayan 62.99 4 0 4 21
12. Simpocan 91.53 1 0 1 2
13. Mangingisda 320.36 216 4 220 25
14. Kamuning 829.35 383 0 383 502
15. Inagawan 210.73 308 13 321 165
16. Inagawan Sub 565.74 286 189 475 588
17. Luzviminda 276.63 35 3 38 29
18. Iwahig 1228.69 56 67 123 18
19. Bacungan 468.34 36 0 36 51
20. Sta. Cruz 287.54 17 1 18 40
21. Salvacion 229.15 9 0 9 36
22. Bahile 351.74 12 0 12 48
23. Macarascas 310.31 21 35 56 247
24. Buenavista 262.35 69 3 72 360
25. Cabayugan 405.80 47 5 52 247
26. Marufinas 164.54 17 0 17 76
27. New Pangangan 48.10 21 0 21 89
28. Tagabinet 62.16 15 35 50 263
29. Concepcion 105.24 67 0 67 298
30. Manalo 501.06 40 0 40 206
31. Maruyugon 49.39 18 1 19 86
32. Lucbuan 246.75 9 0 9 40
33. Langogan 111.91 7 1 8 41
34. Maoyon 200.81 37 6 43 213
35. Babuyan 295.67 106 2 108 491
36. San Rafael 67.58 30 1 31 105
37. Tabanag 152.11 24 26 50 213
Total 9,519.48 2,620 846 3,466 10,096 Source: DRRMP and LCCAP, 2012-2016
USAID Strengthening Urban Resilience for Growth with Equity (SURGE) Project Page 24 Assessment of the Vulnerabilities and Local Capacities of Cities Development Initiative (CDI) Cities for Building Urban Resilience
Figure 7. Flood Susceptibility Map of Puerto Princesa City
Source: DRRMP and LCCAP, 2012-2016

USAID Strengthening Urban Resilience for Growth with Equity (SURGE) Project Page 25 Assessment of the Vulnerabilities and Local Capacities of Cities Development Initiative (CDI) Cities for Building Urban Resilience
Figure 8. Production Areas Exposed to Hazard
Source: DRRMP and LCCAP, 2012-2016
USAID Strengthening Urban Resilience for Growth with Equity (SURGE) Project Page 26 Assessment of the Vulnerabilities and Local Capacities of Cities Development Initiative (CDI) Cities for Building Urban Resilience
About 18, 311 residents from 28 barangays, mostly from the informal sector, are highly vulnerable to storm surges. Based on the DRRMP and LCCAP 2012-2016, about 15,932 residents live in six urban barangays while 2,379 residents live in 22 rural barangays (refer to Table 7).
Table 7. Population Vulnerable to Storm Surges
Number of Barangays
Household Population
Formal Informal Total
Urban - 6 674 2,540 3,181 15,932
Rural - 22 479 24 503 2,379
28 Barangays 1,153 2,564 3,684 18,311 Sources: DRRM and LCCA Plans
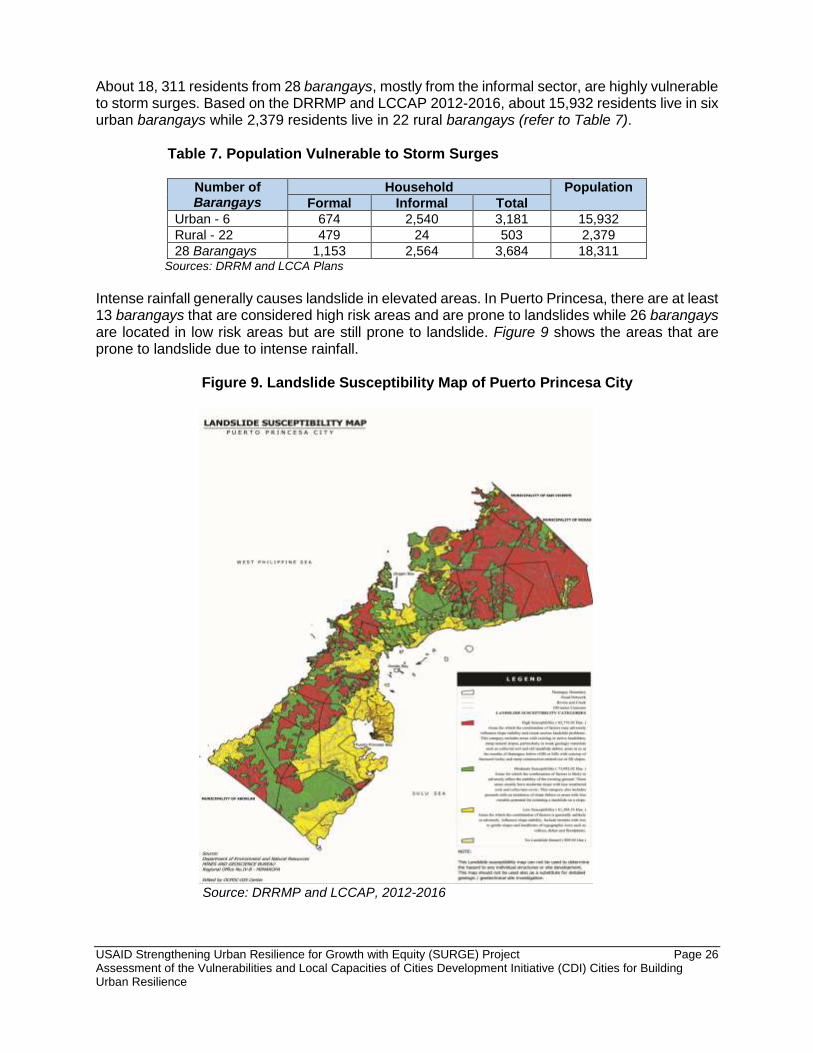
Intense rainfall generally causes landslide in elevated areas. In Puerto Princesa, there are at least 13 barangays that are considered high risk areas and are prone to landslides while 26 barangays are located in low risk areas but are still prone to landslide. Figure 9 shows the areas that are prone to landslide due to intense rainfall.
Figure 9. Landslide Susceptibility Map of Puerto Princesa City
Source: DRRMP and LCCAP, 2012-2016

USAID Strengthening Urban Resilience for Growth with Equity (SURGE) Project Page 27 Assessment of the Vulnerabilities and Local Capacities of Cities Development Initiative (CDI) Cities for Building Urban Resilience
Urban Systems Analysis The FGD participants in Puerto Princesa City prioritized five urban systems. They also rated each system in terms of its adaptive capacities as shown in Figure 10. The rating covered five parameters: economic, technology and infrastructure, governance, societal, and ecosystem services.
Figure 10. Perceived Adaptive Capacities of Urban Systems in Puerto Princesa City
Water. Puerto Princesa City Water District (PPCWD) supply water to 35 urban barangays and two rural barangays. The 29 other rural barangays not covered by the water district rely on Level I water system such as shallow wells, handpumps) and Level II water system such as spring system, bore well. Puerto Princesa has been dealing with water shortages, especially during the dry season from February to April, due to the growing population and increasing tourism activities. Hence, the city must look for additional water sources such as the Lapu-lapu river, according to the KWater study conducted in 2014. However, even the city draws its water supply from other sources aside from its current water source in Campo Uno dam in Barangay Irawan, water supply would still be insufficient to meet the target year 2020 demand. The PPCWD has identified several control measures in protecting the water resources from climate-related impacts, such as increased turbidity and the intrusion of contaminants due to continuous heavy rains in the watershed areas. These control measures are reforestation, riverbank rehabilitation using vetiver grass and bamboo, and the quarterly monitoring of water quality. The city has a high adaptive capacity in terms of water governance. In terms of economic, technology/infrastructure, societal, and ecosystems services, the group maintained that they have medium adaptive capacity. And in terms of water regulation and monitoring, the city’s adaptive capacity might be lower (Figure 10). Agriculture. Agricultural land conversion to huge commercial uses threatens Puerto Princesa City’s food security. This is aggravated by the impacts of extreme weather events in agricultural production and livelihood of the farming community. In terms of agriculture, the city has high
0
1
2
3
Water Agriculture Ecosystems Transportation Energy
Economic Technology / Infra Governance Societal Ecosystem Services

USAID Strengthening Urban Resilience for Growth with Equity (SURGE) Project Page 28 Assessment of the Vulnerabilities and Local Capacities of Cities Development Initiative (CDI) Cities for Building Urban Resilience
governance and economic adaptive capacities but medium adaptive capacities in terms of technology/infrastructure, societal, and ecosystem services. The high adaptive capacity may be attributed to its large tracts of land devoted to agricultural purposes as well as the city’s ability to cope with stresses and shocks. The medium adaptive capacity can be attributed to limited knowledge on suitable crops that can be planted during extreme weather events, efficient agricultural technologies, inadequate farm-to-market roads, and science-based findings on the relationship of agriculture and ecosystem services. Ecosystems. While most forest ecosystems may be in good condition, there seems to be difficulty in monitoring and regulating illegal activities such as slash-and-burn practices and encroachment. Degradation of river systems is due to deforestation and large-scale sand-and-gravel extraction. These illegal activities remain unregulated while likely to be escalating because of the increasing development in Palawan. The city’s budget for monitoring and for the provision of alternative livelihoods is insufficient in order to address these illegal activities. For technology and infrastructure, the Palawan Council for Sustainable Development (PCSD) and the Bureau of Fisheries and Aquatic Resources (BFAR) have equipment for basic laboratory analysis and mapping. For reforestation projects, unsuitable species are used in tree-planting activities due to apparent lack of science-based studies. Transportation. Road accessibility, especially connecting rural roads to other barangays or municipalities, is one of the priority plans based on the city’s CLUP. For instance, the city plans to connect the roads in rural barangays of Marufinas and New Panggangan with that of Barangay Cabayugan and the Municipality of San Vicente. The city, however, is studying further the plan as the construction of the road traverses the Puerto Princesa Subterranean River National Park. Moreover, the city intends to develop a well-articulated circulation network and a multi-modal transport system that provides alternative routes to ease traffic congestion. The city’s economy, governance, and society have high adaptive capacities because city offices can still function even with extreme weather events, except for the two earlier mentioned barangays which may become isolated (Figure 10). The city has medium adaptive capacity on technology/infrastructure and ecosystem services due to inadequate road system and absence of studies and researches linking transport and ecosystem services. Energy. About 73 percent of all households in 58 of 66 barangays are connected to the Palawan Electric Cooperative (PALECO). The remaining unconnected barangays are New Panggangan, Marufinas, Cabayugan, Tagabinet, Buenavista, Bagong Bayan, Napsan, and Simpocan, all located in the remote west coast. Extension of service lines in these barangays by the utility company will be costly and the return on investment is long. Some households have installed individual lighting systems powered by solar energy. Puerto Princesa City, on the other hand, relies heavily on the National Power Corporation for its electricity requirements. Puerto Princesa City has a high economic adaptive capacity considering that renewable energy options can be potential sources of power. Technology/Infrastructure, governance, and ecosystem services were all perceived to have medium adaptive capacities. This may be attributed to the city’s limited mandate in terms of electricity management, including its infrastructure components. Low societal adaptive capacity was rated since the constituents were deemed to have “little” to “no influence” in terms of decision-making (Figure 10).

USAID Strengthening Urban Resilience for Growth with Equity (SURGE) Project Page 29 Assessment of the Vulnerabilities and Local Capacities of Cities Development Initiative (CDI) Cities for Building Urban Resilience
Urban Actors’ Characteristics All residents and consumers are vulnerable actors for water supply as shown in Table 8 which presents the key urban actors identified during the ICLEI preliminary assessment in the city. This vulnerability is due to the limited groundwater storage and production caused by the relatively small watersheds and short intermittent streams, aggravated by saltwater intrusion. In terms of settlements and shelter, informal settlers were identified, particularly in flood-prone areas, coastal barangays, and landslide-prone areas in the uplands. As to energy, all residents and consumers were identified as vulnerable actors owing to extreme weather events, such as increased temperature, which may result to a higher demand for electricity. For agriculture, the perceived risk was food shortage due to the extreme weather events. Several vulnerable actors were identified, including farmers and fishermen who will primarily bear the brunt of extreme weather events, market vendors who may incur income losses, and ultimately the residents themselves. As to ecosystems, increased rainfall can lead to siltation in the river and coastal system as well as changes in temperature, which will adversely impact on biodiversity and ecosystem services. Indigenous peoples and informal settler families were the identified vulnerable actors since they are highly dependent on the ecosystem for food and other services it provides. In terms of transport, intense rainfall may result to flooding, and will contribute to heavy traffic, rendering the roads impassable and thus affecting the mobility of commuters and transport groups. Table 8. Key Urban Actors in the Vulnerable Areas of Puerto Princesa City
Perceived Risk Statement Vulnerable
Areas
Urban Actors
Vulnerable Actors
Potential Supporting Actor
WATER SUPPLY
Increased demand for water; ambient water quality
Citywide Residents PPCWD, Barangay LGU, CDRRMC, Water Concessionaires, Watershed Council, Business sector (resorts and hotels, water refilling stations), City Health Office, National Irrigation Administration, Department of Agriculture
SETTLEMENTS / SHELTER
Tendency of informal settlers residing along the coasts and near the waterways to report more damage to properties and lives due to flooding and typhoons
Citywide Informal Settlers
City Disaster Risk Reduction and Management Office (CDRRMO), Barangay Disaster Risk Reduction and Management Office (BDRRMO), Civil society groups and non-government organizations,
USAID Strengthening Urban Resilience for Growth with Equity (SURGE) Project Page 30 Assessment of the Vulnerabilities and Local Capacities of Cities Development Initiative (CDI) Cities for Building Urban Resilience
Perceived Risk Statement Vulnerable
Areas
Urban Actors
Vulnerable Actors
Potential Supporting Actor
City Planning, City Social Welfare and Development (CSWD) Developers (Real Estate), Homeowners Association
ENERGY
Higher electricity demand with increasing temperature.
Citywide Residents, Consumers
PALECO, Power Providers, City Government, Provincial Government, Philippine Council for Sustainable Development (PCSD), DENR
AGRICULTURE (FOOD)
Food shortage during extreme weather events
Citywide
All residents, Market vendors, Farmers, Fishermen
City Agriculture, DA, Bureau of Fisheries and Aquatic Resources (BFAR) City Fisheries and Aquatic Resources Management Council (FARMC), Academe
ECOSYSTEMS
Siltation in river systems and to the coast due to increased rainfall Adverse impact on biodiversity and corresponding ecosystem services due to changes in temperature
Langogan, Inagawan (with portions below sea level) River segments with unregulated sand and gravel extraction
Indigenous Peoples, Informal settlement families
Barangay LGU, City Environment and Natural Resources Office (ENRO), City Agriculture, DENR, BFAR, DA, City Tourism, PCSD, Academe, Resort owners, Bantay-Gubat, Bantay-Dagat, Bantay-Bakawan, NGOs, Coastguard
TRANSPORT
Heavy traffic due to flooding in major roads during intense rainfall Impassable roads in some areas of the city due during extreme weather events
National road sections in Maoyon, Bacungan, San Rafael, Babuyan, Tagbarungis in Inagawan, Montible, Napsan, and Cabayugan.
Commuters Transport Groups
Traffic Management Office, CDRRMO, City Engineering, City ENRO, City Planning, Department of Public Works and Highways (DPWH), Philippine National Police (PNP)
Analysis of Planning Documents Puerto Princesa City aims to maintain the cleanliness and beauty of the city, and sustain its strong economic and environmental programs. Hence, the city focuses on ecotourism, an industry perceived to be most environment-friendly and sustainable for the city as indicated in the city’s
USAID Strengthening Urban Resilience for Growth with Equity (SURGE) Project Page 31 Assessment of the Vulnerabilities and Local Capacities of Cities Development Initiative (CDI) Cities for Building Urban Resilience
CDP for 2014-2016. The city has formulated its DRRMP and LCCAP 2012-2016, led by the Office of the City Planning and Development Coordinator (CPDC) along with a technical working group (TWG). The preparation of this plan was simultaneously done with the updating of its CLUP, 2013-2022 and CDP, 2014-2016. This allowed the city to integrate the parameters of DRRM and CCA in both planning documents. The DRRMP and LCCAP, 2012-2016 has clearly outlined disaster mitigation and prevention measures in response to the identified hazards. However, as the plan expires this year, there is a need to revisit and update it to include identified climate impacts. The following actions are recommended: (1) include climate projections to properly address the city’s vulnerability; (2) study possible Urban Heat Island effects in the city proper; (3) undertake a more detailed urban systems analysis and adaptive capacity properly supported by data, with the participation of vulnerable actors and other stakeholders; and (4) update and gather relevant data to come up with a more detailed vulnerability assessment.
C. Iloilo City Iloilo City’s vision is to become a premier city by 20158. Toward this end, the city has focused on improving infrastructure projects, recognizing that the completion of such contributes to local economic development as well as social cohesion. The city, however, is faced by common problems associated with rapid urbanization such as in-migration, traffic congestion, proliferation of slums, and poor air and water quality. These development concerns are exacerbated by the adverse impacts of climate change. Vulnerability Assessment The city’s LCCAP which covers the period 2014 to 2028 was formulated by the Iloilo City Climate Change Technical Working Group, with support from UN Habitat. The vulnerability assessment included in the plan was perception-based and looked at the city’s relative vulnerability per hazard and per sector.9 Five hazard types were assessed, namely, flooding, storm surge, typhoon, sea-level rise, and drought. The relative vulnerability was computed by adding the scores on threat level and adaptive capacity. Table and 10 show Iloilo City’s relative vulnerability per hazard and per sector based on the UN Habitat framework.
8 CPD, 2013-2019 9 Sector, in this case, refers to social, economic, infrastructure, land use, and the environment as guided by the UN Habitat framework.
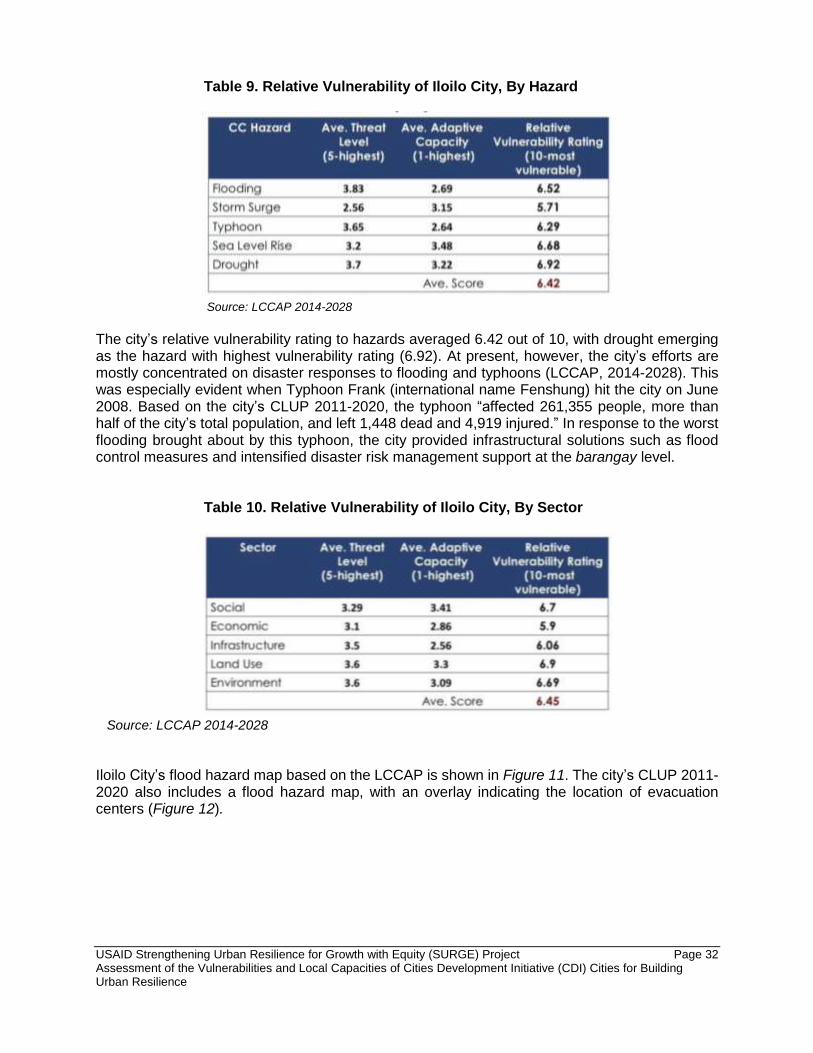
USAID Strengthening Urban Resilience for Growth with Equity (SURGE) Project Page 32 Assessment of the Vulnerabilities and Local Capacities of Cities Development Initiative (CDI) Cities for Building Urban Resilience
Table 9. Relative Vulnerability of Iloilo City, By Hazard
Source: LCCAP 2014-2028
The city’s relative vulnerability rating to hazards averaged 6.42 out of 10, with drought emerging as the hazard with highest vulnerability rating (6.92). At present, however, the city’s efforts are mostly concentrated on disaster responses to flooding and typhoons (LCCAP, 2014-2028). This was especially evident when Typhoon Frank (international name Fenshung) hit the city on June 2008. Based on the city’s CLUP 2011-2020, the typhoon “affected 261,355 people, more than half of the city’s total population, and left 1,448 dead and 4,919 injured.” In response to the worst flooding brought about by this typhoon, the city provided infrastructural solutions such as flood control measures and intensified disaster risk management support at the barangay level.
Table 10. Relative Vulnerability of Iloilo City, By Sector Source: LCCAP 2014-2028
Iloilo City’s flood hazard map based on the LCCAP is shown in Figure 11. The city’s CLUP 2011-2020 also includes a flood hazard map, with an overlay indicating the location of evacuation centers (Figure 12).

USAID Strengthening Urban Resilience for Growth with Equity (SURGE) Project Page 33 Assessment of the Vulnerabilities and Local Capacities of Cities Development Initiative (CDI) Cities for Building Urban Resilience
Figure 11. Flood Hazard Map of Iloilo City
Source: Iloilo City LCCAP 2014-2028
Figure 12.Flood Hazard Map of Iloilo City with an Overlay Identifying the Location of Evacuation Centers
Source: CLUP 2011-2020
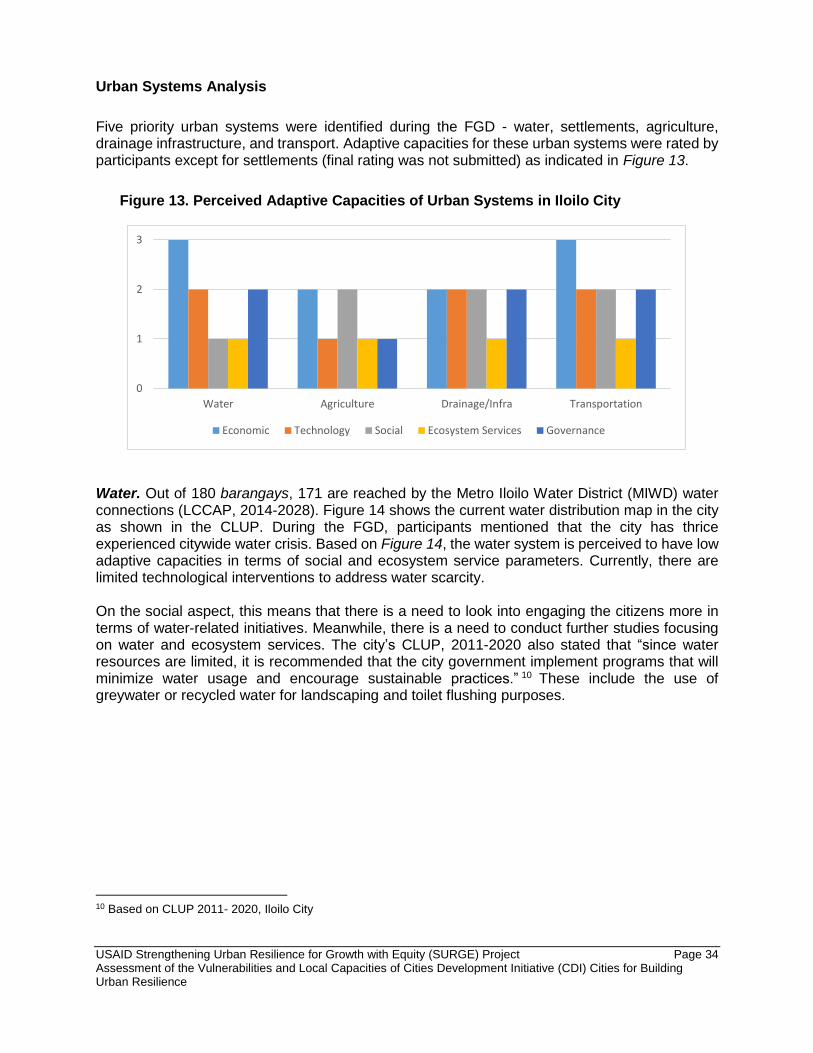
USAID Strengthening Urban Resilience for Growth with Equity (SURGE) Project Page 34 Assessment of the Vulnerabilities and Local Capacities of Cities Development Initiative (CDI) Cities for Building Urban Resilience
Urban Systems Analysis
Five priority urban systems were identified during the FGD - water, settlements, agriculture, drainage infrastructure, and transport. Adaptive capacities for these urban systems were rated by participants except for settlements (final rating was not submitted) as indicated in Figure 13.
Figure 13. Perceived Adaptive Capacities of Urban Systems in Iloilo City
Water. Out of 180 barangays, 171 are reached by the Metro Iloilo Water District (MIWD) water connections (LCCAP, 2014-2028). Figure 14 shows the current water distribution map in the city as shown in the CLUP. During the FGD, participants mentioned that the city has thrice experienced citywide water crisis. Based on Figure 14, the water system is perceived to have low adaptive capacities in terms of social and ecosystem service parameters. Currently, there are limited technological interventions to address water scarcity. On the social aspect, this means that there is a need to look into engaging the citizens more in terms of water-related initiatives. Meanwhile, there is a need to conduct further studies focusing on water and ecosystem services. The city’s CLUP, 2011-2020 also stated that “since water resources are limited, it is recommended that the city government implement programs that will minimize water usage and encourage sustainable practices.” 10 These include the use of greywater or recycled water for landscaping and toilet flushing purposes.
10 Based on CLUP 2011- 2020, Iloilo City
0
1
2
3
Water Agriculture Drainage/Infra Transportation
Economic Technology Social Ecosystem Services Governance
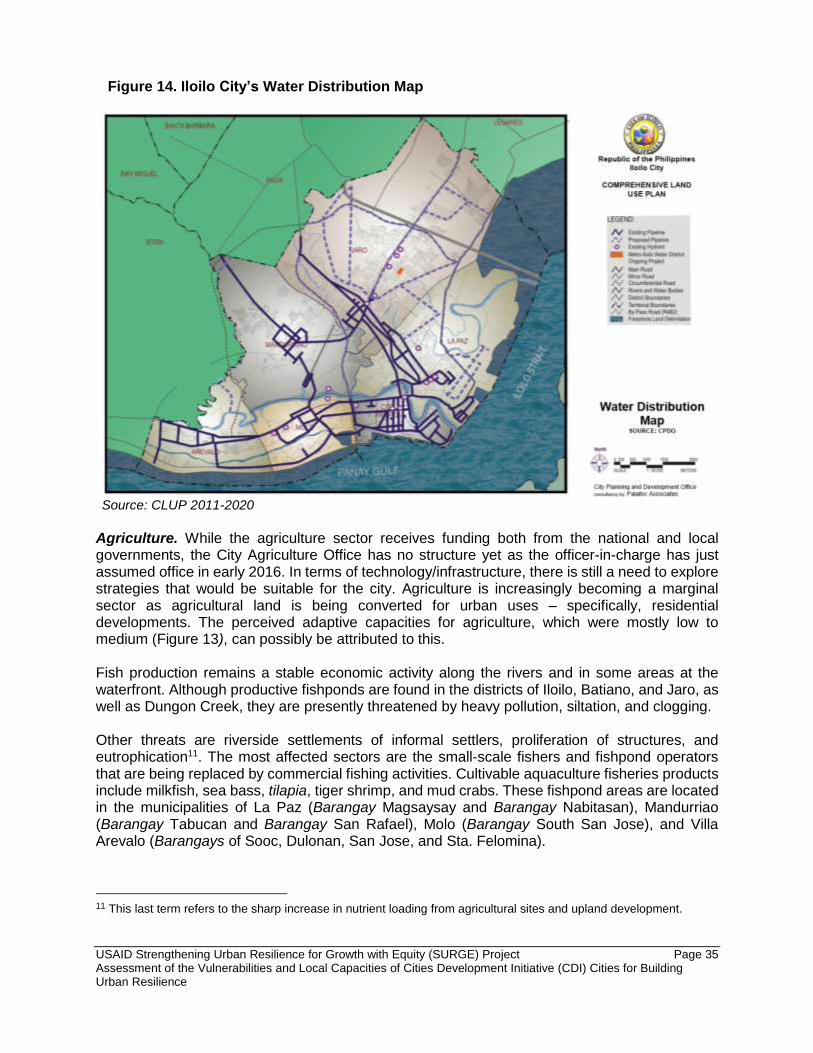
USAID Strengthening Urban Resilience for Growth with Equity (SURGE) Project Page 35 Assessment of the Vulnerabilities and Local Capacities of Cities Development Initiative (CDI) Cities for Building Urban Resilience
Figure 14. Iloilo City’s Water Distribution Map
Source: CLUP 2011-2020
Agriculture. While the agriculture sector receives funding both from the national and local governments, the City Agriculture Office has no structure yet as the officer-in-charge has just assumed office in early 2016. In terms of technology/infrastructure, there is still a need to explore strategies that would be suitable for the city. Agriculture is increasingly becoming a marginal sector as agricultural land is being converted for urban uses – specifically, residential developments. The perceived adaptive capacities for agriculture, which were mostly low to medium (Figure 13), can possibly be attributed to this. Fish production remains a stable economic activity along the rivers and in some areas at the waterfront. Although productive fishponds are found in the districts of Iloilo, Batiano, and Jaro, as well as Dungon Creek, they are presently threatened by heavy pollution, siltation, and clogging. Other threats are riverside settlements of informal settlers, proliferation of structures, and eutrophication11. The most affected sectors are the small-scale fishers and fishpond operators that are being replaced by commercial fishing activities. Cultivable aquaculture fisheries products include milkfish, sea bass, tilapia, tiger shrimp, and mud crabs. These fishpond areas are located in the municipalities of La Paz (Barangay Magsaysay and Barangay Nabitasan), Mandurriao (Barangay Tabucan and Barangay San Rafael), Molo (Barangay South San Jose), and Villa Arevalo (Barangays of Sooc, Dulonan, San Jose, and Sta. Felomina).
11 This last term refers to the sharp increase in nutrient loading from agricultural sites and upland development.
USAID Strengthening Urban Resilience for Growth with Equity (SURGE) Project Page 36 Assessment of the Vulnerabilities and Local Capacities of Cities Development Initiative (CDI) Cities for Building Urban Resilience
Settlement. Informal settlements are typically located along danger zones, specifically along the Batiano River and the coastal areas facing Guimaras Strait. The municipal coastal areas of Villa Arevalo and Molo are most vulnerable to storm surges, hence an inland relocation is being discussed. A relocation site has been established in Barangay Lanit, which is currently occupied by settlers from the riverbanks. Many real estate developments are also expanding in the city proper, and in the municipalities of La Paz, Jaro, Molo, Mandurriao, and Villa. Infrastructure/Drainage. While the city has responded with infrastructural solutions, such as flood control and intensified disaster risk support, in the wake of Typhoon Frank in 2008, the overall drainage system still needs upgrading. The adaptive capacity were rated medium except for ecosystem services (Figure 13), possibly because there are no studies looking at the relations between the two. Transport. Transportation system in the flooded areas gets crippled during flood events. However, the city has high capacity in terms of connectivity due to the presence of bypass roads. Repair and upgrading of the primary road network in the city is recommended following the damage caused by severe floods. Low-emission development strategies of the city include introduction of electric tricycles, promotion of eco-mobility and conversion of single-stroke tricycle engines. Urban Actors’ Characteristics Informal settlers and residents were perceived as the most vulnerable actors among the sectors. This is shown in Table 11 as identified during the preliminary assessment in Iloilo City. The Barangay Disaster Risk Reduction and Management (BDRRM) team was perceived as a vulnerable actor in terms of risks pertaining to settlements as they are frontline responders during emergencies and disasters. They need to undergo capacity development as well as upgrade the equipment used to better respond to emergencies. The transport groups were also considered vulnerable for both drainage and transport systems. The findings imply that there is a need for the city to strengthen its engagement with these actors in terms of devising strategies and programs on urban resiliency. In terms of potential supporting actors, a wide range of actors are at the disposal of the city government, including academic institutions, the private sector, homeowners’ associations, as well as relevant national government agencies.

USAID Strengthening Urban Resilience for Growth with Equity (SURGE) Project Page 37 Assessment of the Vulnerabilities and Local Capacities of Cities Development Initiative (CDI) Cities for Building Urban Resilience
Table 11. Vulnerable Places and Key Urban Actors in Iloilo City
Perceived Risk Statement Vulnerable Areas
Urban Actors
Vulnerable Actors
Potential Supporting Actor
WATER SUPPLY
Higher demand for water as a result of increased temperature which aggravates groundwater extraction.
Citywide Informal Settlers Residents
Metro Iloilo Water District (MIWD), Water Concessionaires, Watershed Council,
SETTLEMENTS / SHELTER
High vulnerability of informal settlers residing in coastal areas and near the waterways to extreme weather events, especially during typhoons and intense rainfall.
Hazard areas: storm surge (La Paz and Mandurriao coasts, Arevalo, Molo), landslide and flooding
Informal Settlers (near Jaro River and City Proper) BDRRM Team
CDRRMO, BDRRMO, CSOs/NGOs, City Planning, CSWD Developers (Real Estate), Homeowners Association
AGRICULTURE (FOOD)
Food shortage in the city due to extreme weather events.
Citywide, Districts with farming barangays: Jaro, Mandurriao and La Paz
All Residents, Market vendors, Farmers Fisher folk
City Agriculture, DA, BFAR City FARMC, University of the Philippines-Visayas (UPV), West Visayas State University (WVSU)
DRAINAGE/ INFRA
Road congestion due to flooding along major roads, especially during heavy rains.
Jaro, La Paz, Mandurriao, Sooc, Arevalo
Commuters Transport Groups
CDRRMO, City ENRO, City Engineering, DPWH, PNP
Flooding in the entire city due to extreme weather events.
Citywide All residents Private sector, CDRRMO, City ENRO, BFP, PNP
TRANSPORT
Heavy traffic and impassable roads due to flooding in major roads.
Commuters Transport Groups
City Planning and Development Office, CDRRMO, City ENRO, City Engineering, DPWH, PNP
GHG Emissions Profile With support from USAID, Iloilo City completed its first study on community level GHG emissions, with 2012 as the base year. The following sectors were covered: (1) stationary energy, (2) transportation, (3) waste, and (4) Agriculture, Forestry and Other Land Use. As indicated in Table 12, the city’s estimated GHG emissions is 1,006,133 tons of carbon dioxide equivalent (tCO2e).
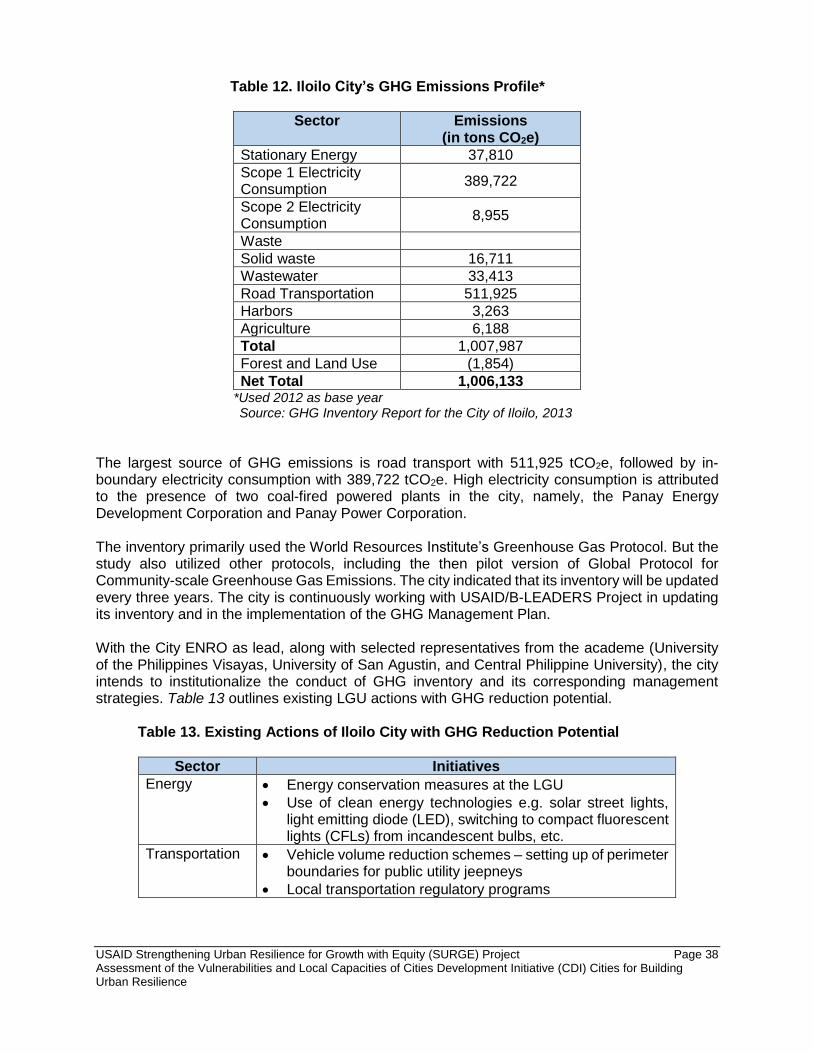
USAID Strengthening Urban Resilience for Growth with Equity (SURGE) Project Page 38 Assessment of the Vulnerabilities and Local Capacities of Cities Development Initiative (CDI) Cities for Building Urban Resilience
Table 12. Iloilo City’s GHG Emissions Profile*
Sector Emissions (in tons CO2e)
Stationary Energy 37,810
Scope 1 Electricity Consumption
389,722
Scope 2 Electricity Consumption
8,955
Waste
Solid waste 16,711
Wastewater 33,413
Road Transportation 511,925
Harbors 3,263
Agriculture 6,188
Total 1,007,987
Forest and Land Use (1,854)
Net Total 1,006,133 *Used 2012 as base year Source: GHG Inventory Report for the City of Iloilo, 2013
The largest source of GHG emissions is road transport with 511,925 tCO2e, followed by in-boundary electricity consumption with 389,722 tCO2e. High electricity consumption is attributed to the presence of two coal-fired powered plants in the city, namely, the Panay Energy Development Corporation and Panay Power Corporation. The inventory primarily used the World Resources Institute’s Greenhouse Gas Protocol. But the study also utilized other protocols, including the then pilot version of Global Protocol for Community-scale Greenhouse Gas Emissions. The city indicated that its inventory will be updated every three years. The city is continuously working with USAID/B-LEADERS Project in updating its inventory and in the implementation of the GHG Management Plan. With the City ENRO as lead, along with selected representatives from the academe (University of the Philippines Visayas, University of San Agustin, and Central Philippine University), the city intends to institutionalize the conduct of GHG inventory and its corresponding management strategies. Table 13 outlines existing LGU actions with GHG reduction potential.
Table 13. Existing Actions of Iloilo City with GHG Reduction Potential
Sector Initiatives
Energy • Energy conservation measures at the LGU
• Use of clean energy technologies e.g. solar street lights, light emitting diode (LED), switching to compact fluorescent lights (CFLs) from incandescent bulbs, etc.
Transportation • Vehicle volume reduction schemes – setting up of perimeter boundaries for public utility jeepneys
• Local transportation regulatory programs

USAID Strengthening Urban Resilience for Growth with Equity (SURGE) Project Page 39 Assessment of the Vulnerabilities and Local Capacities of Cities Development Initiative (CDI) Cities for Building Urban Resilience
Sector Initiatives
• Pedestrianization
• Carless day
Waste • Waste segregation
• Scheduled garbage collection according to type of waste
• Materials Recovery Facility
Forestry • Mangrove tree planting
• Mangrove plantation protection Source: Iloilo City GHG Management Plan, 2014
Analysis of Planning Documents Iloilo’s CLUP 2011-2020, was approved by the HLURB in 2013. It includes a chapter on “Mainstreaming DRR and CCA.” In the CLUP, the city noted that it “shall not present a Disaster Risk Reduction and Management Plan and shall only present a simplified mechanism with which the city shall mainstream DRR and CCA in land use planning and management.”
The CLUP, developed by Palafox consultants, indicated that “the concepts of floor-to-area-ratio (FAR), percentage of lot occupancy (PLO), transit-oriented development (TOD) and transfer development rights (TDR) among others, were introduced as new mechanisms in maintaining large open spaces in the city and as applications of advocacies on green urbanism and walkability.” 12 During consultations, however, many landowners and businessmen opposed these ideas, arguing that these mechanisms “limit their rights to optimizing the value of land.” SURGE can focus on working with the city government in packaging “green projects,” incorporating the mentioned principles to make them bankable and profitable for the business sector. Climate change considerations and the “greening” of infrastructure should not be seen as an added cost but rather an investment opportunity to aid the city in developing smart infrastructure projects, which translate to better economic gains. The Metro Iloilo-Guimaras Economic Development Council (MIGEDC) also offers opportunities for SURGE to strengthen the DRR and climate change agenda within the metropolis. While the DRR-CCA function is not explicitly identified in the MIGEDC areas of cooperation, such considerations can be embedded in the programs that MIGEDC can implement in the future. Iloilo City has a stand-alone LCCAP covering the period 2014 to 2028 which adopts the seven strategic themes stipulated in the National Climate Change Action Plan (NCCAP). Most options and interventions identified focus on DRR and adaptation. Proposed strategies are outlined based on identified hazards including (1) temperature increase, (2) flooding due to increased precipitation, (3) sea level rise, (4) strong winds, (5) droughts and dry spells, and (6) storm surge. Proposed strategies in the city’s LCCAP are a combination of both hard and soft measures. Some examples are:
1. Development of green urban centers, infrastructures, structures and open spaces; 2. Improving city flood management specifically the preparation of a comprehensive urban
drainage master plan and drainage improvement projects;
12 CLUP 2011-2020, Iloilo City

USAID Strengthening Urban Resilience for Growth with Equity (SURGE) Project Page 40 Assessment of the Vulnerabilities and Local Capacities of Cities Development Initiative (CDI) Cities for Building Urban Resilience
3. Strict enforcement of the Zoning Ordinance such as the observance of a “no build” zone, relocation of households in identified dangerous areas;
4. Construction of mitigating infrastructures such as seawalls and dikes, revetment walls; 5. Review of the building code, shelter plans, and other sectoral plans to integrate climate
resiliency; 6. Review or adjustment of the cropping calendar; 7. City-wide advocacy and capacity building programs; and 8. Institutional strengthening.
The city has an existing GHG Management Plan, developed with support from USAID. It serves as a blueprint that will set the city’s direction with regard to its climate change mitigation actions. The plan sets a target of 10 percent GHG emissions reduction within a nine-year period upon implementation of identified priority mitigation programs. With the recent passage of the national Green Building Code (launched last June 2015 by the DPWH), it will be useful for SURGE to examine LEDS consideration in the building sector, particularly in terms of energy consumption. Overall, while there is an effort to link climate change in other planning documents, for example, in the CLUP and CDP, these tend to be skewed toward DRR and CCA. There was no mention of the GHG Management Plan in the city’s current LCCAP even if both plans were completed in 2014. While the LCCAP mentions GHG emissions reduction strategies, these are mostly framed in the areas of air shed management, air quality monitoring, and anti-smoke belching and did not refer to the actual GHG Management Plan. In terms of sectoral needs, it is recommended that a comprehensive review and subsequent restructuring of the entire water sector governance be conducted to assess the resilience of major water resources and infrastructures, manage supply and demand, manage water quality, and promote conservation. There is also a need to study the trade-offs on the diminishing agricultural land in the city. According to the CLUP, private land owners have been converting some agricultural lands into development use through the Department of Agrarian Reform (DAR) and re-classifications with the city government. This alarming trend observed in Iloilo City and nearby municipalities will have significant impact to the city’s food security. Since food security is one of the priorities identified in the city’s LCCAP, agricultural land conversion can become an issue in the future if the city relies on other municipalities. It may be a viable option to study the feasibility of venturing into urban agriculture in the city as a means to support food security.
D. Tagbilaran City Tagbilaran City is a third-class city in the island province of Bohol with a total land area of 32.7 square kilometers (km2). It has a population of 96,792, based on the 2010 Census of Population and Housing. The city has a coastal area of 12.9 km2 serving 60 percent of the population that is heavily dependent on the marine fisheries ecosystems for livelihood through fishing. The city’s coastal area accommodates significant areas of coral reef, mangroves, and seagrasses. A notable physical characteristic of the city is the presence of sinkholes. Situated in the Central Visayas region, the city is seldom visited by typhoons.

USAID Strengthening Urban Resilience for Growth with Equity (SURGE) Project Page 41 Assessment of the Vulnerabilities and Local Capacities of Cities Development Initiative (CDI) Cities for Building Urban Resilience
The city serves as a commercial information technology hub and institutional center, as well as a major port of entry to Bohol Province and nearby islands. The continuing growth of the city’s commercial sector, however, has resulted in increased waste generation as well as increased levels of air and water pollution. These are mainly due to the worsening traffic congestion in the central business district and high incidence of urban sprawl due to the burgeoning informal settlements, particularly in the foreshore areas. Vulnerability Assessment Tagbilaran City is vulnerable to natural disasters such as earthquake, liquefaction, earthquake-induced landslide, tsunami rainfall-induced landslide and storm surge. Hence, the draft CLUP has included major development programs in the areas of DRR and CCA. The programs identified under this section are: (1) creation of Local Disaster Risk Reduction and Management Office (LDRRMO); (2) establishment of an Incident Command System; (3) regular monitoring and evaluation; (4) preparation of a contingency plan; (5) procurement of disaster response equipment including rescue tools, communication equipment, rescue boats, and rescue ambulance, among others; (6) capacity building on Geographic Information System (GIS) mapping, search and rescue operations, as well as risk and vulnerability assessments; and (7) the integration of DRR-CCA in all city plans. While these development programs were identified in the draft CLUP, DRR and CCA have yet to be fully mainstreamed. The presence of sinkholes within the city was highlighted as a primary natural occurrence that endangers people’s lives as well as hinders physical and infrastructural development in the city. Urban Systems Analysis Water Supply. The city is dependent on groundwater which is not enough to supply the needs of the city. Two water utilities operate in the city. These are the City Water Utility Firm, which extracts water within the city (relying on 23 pumping stations located in remote barangays), and Bohol Water, a private water concessionaire which extracts water from a neighboring municipality, Corella. Bohol Water currently supplies five barangays in Tagbilaran City. Both water utilities are dependent on the power sector. One of the main problems identified by participants during the FGD is the unregulated pumping and extraction of groundwater. There are also reported cases of saltwater intrusion possibly due to illegal extraction, which results in the closure of wells. At present, nine barangays have reported cases of saltwater intrusion. Groundwater sources can also be compromised with possible contamination due to the presence of an engineered controlled dump site. Sanitation (including water quality and wastewater). At present, the city utilizes sealed septic tanks; private operators are responsible for taking septic waste. With regard to possible contamination, one indicator that water sources are contaminated is the continued incidence of red tide. This has resulted to a change in residents’ behavior with regard to drinking water, i.e. the locals resort to drinking purified water. Transportation. The city center has narrow roads, the main cause of today’s traffic congestion. Some roads within the city do not allow for other uses apart from carriage use. There is a notable
USAID Strengthening Urban Resilience for Growth with Equity (SURGE) Project Page 42 Assessment of the Vulnerabilities and Local Capacities of Cities Development Initiative (CDI) Cities for Building Urban Resilience
absence of sidewalks, planting strips, and even easements for drainage purposes. There is an existing Master Drainage Plan for the city proper, but it needs to be reviewed because it was formulated in the pre-CCA years of the early 1990s. Problems concerning road transport are becoming an area of concern because of the influx of car companies in Tagbilaran; consequently, the number of privately-owned vehicles is projected to increase. In terms of flooding, floodwater subsides quickly in the city. The city intends to include in its zoning ordinance a provision stating that vehicle owners should have the requisite parking space (residential and commercial). During the earthquake, where there were reports of road collapse, the presence of alternate routes going to and out of the city helped save the day. Energy. Bohol Province is connected to the Leyte grid via an underground cable. Bohol Light Company, Inc. (BLCI) provides continuous supply of electricity to the city. There is also a stand-by diesel-powered plant within Tagbilaran City, although this cannot provide the needs of the whole city. The Provincial Government of Bohol has plans to venture into renewable energy development, but the sites are outside Tagbilaran City. FGD participants recalled that during Typhoon Yolanda, while Tagbilaran City was not affected by the typhoon, their dependence on the Leyte grid affected the city’s power supply. Settlements. There are already observed incidences of migration, particularly from residents affected by the 2013 earthquake. In terms of perceived hazard, there are portions of a settlement in Banatihin that are prone to rain-induced landslide. Possible Indicators of GHG Emission Sources Tagbilaran City has no GHG inventory in place. Nevertheless, the draft CLUP identified waste, transportation, and electricity as contributory factors to the city’s overall emissions. Depending on the city’s interest, SURGE can assist the city in completing its GHG inventory and identify appropriate LEDS strategies. A situational analysis revealed that the city’s road networks connect directly to its adjacent municipalities and to the rest of Bohol Province. The city’s seaport serves as the major point of entry to the city and to the entire island-province. The port also connects to Cebu City and Dumaguete City as well as to Manila, Cagayan de Oro, Plaridel (in Misamis Occidental in the Mindanao coast), and Larena (in the neighboring island-province of Siquijor). The city has its own airport that caters to small and medium-built aircrafts. The accessibility of Tagbilaran City makes it an attractive location for commercial activities. The thriving commercial activities in the city, particularly in the central business district, has worsened traffic congestion and raised GHG emissions. According to the 2013 BLCI data, as presented in the draft CLUP, a total of 99,494,005 kilowatt hour (kWh) of electricity was consumed in 2013. The industrial sector is the largest energy user in the city, accounting for 49 percent of electricity consumption. This was followed by the

USAID Strengthening Urban Resilience for Growth with Equity (SURGE) Project Page 43 Assessment of the Vulnerabilities and Local Capacities of Cities Development Initiative (CDI) Cities for Building Urban Resilience
residential sector (40 percent), public buildings and streetlights (7 percent) and hospitals and radio stations (4 percent). Tagbilaran City’s population is projected to grow by as much as 108,149 by 201713. The increase is attributed to the growing trend in informal settlements in the foreshore areas. At the same time, there has been an observable increase in transient population such as tourists, which will likely aggravate the rising waste generation caused by the growing city population. Based on the draft of the proposed 10-year Solid Waste Management (SWM) Plan 2016-2026, 23 tons of solid waste are already being disposed daily in the city’s open-controlled dumpsite. The open-controlled dumpsite is planned to be closed. The city will then utilize the Bohol Integrated Area Development (BIAD)-I sanitary landfill (SLF) when it is completed. The BIAD-I SLF is a cluster SLF that will serve 15 municipalities. Industries operating in the city have their own liquid waste treatment facilities. In addition to the SWM facilities is the Vermin Composting Facility located in the city nursery. The composting facility is managed by the City Agriculture Office and the Gulayan sa Paaralan (Vegetables in Schools) program of the City Department of Education. The city’s major development programs for the environmental sector, as identified in the draft CLUP, are focused on greening programs and waste management. These programs are on:
1. Pocket Forest Program 2. Urban Greening Program 3. Development City Eco Park 4. Development of City Park and Butterfly Garden 5. Maintenance of Marine Protected Areas 6. Mangrove Reforestation Program 7. Formulation of Environmental and Foreshore Framework Plan 8. Construction of Barangay Materials Recovery Facility (MRF) 9. Backyard Composting Program 10. Construction of model facility for converting waste products to sellable items 11. Updating of the Ten-Year Solid Waste Management Plan 12. Updating of City Environment Code.
The city government has also issued local ordinances related to low-emission development, which are listed below:
1. City Solid Waste Management Code. There was a plan to revisit the Code because certain provisions, such as the MRFs, garbage collection fees, segregation at source, and integration of IEC mechanisms, were not implemented. The establishment of an Integrated Solid Waste Management Board through an Executive Order (EO) was also identified as a necessity since this Board will then oversee all matters relating to the city’s SWM.
2. Ordinance on Backyard Hog Raising 3. Anti-smoke Belching Ordinance 4. No Smoking Ordinance 5. An ordinance banning the use of chemical-based sprays.
In the proposed CLUP, the absence of a City Environmental Management Office (CEMO) was identified as one of the priority concerns. The CEMO will primarily oversee the environmental
13 Based on the draft CLUP of Tagbilaran City

USAID Strengthening Urban Resilience for Growth with Equity (SURGE) Project Page 44 Assessment of the Vulnerabilities and Local Capacities of Cities Development Initiative (CDI) Cities for Building Urban Resilience
concerns of the city. An executive order for its establishment has been prepared, but has not yet been approved. Analysis of Planning Documents The CLUP, 2016-2025 of Tagbilaran City has yet to be completed. This document was formulated by the City Technical Working Group with assistance from the technical team of the Provincial Planning and Development Office of Bohol. Although DRRM and CCA are mentioned in the draft CLUP, the city has not yet integrated these concerns in all city plans. The draft CLUP identified the following key environmental issues that hinder the city from achieving its established vision of being “A Highly Livable City by 2020: The Family Haven of the Philippines”: (1) limited areas for forest development; (2) increasing volume of wastes; (3) water contamination and saltwater intrusion; (4) vulnerability to hazards such as earthquake, tsunami, liquefaction, storm surge, typhoon; (5) uncoordinated efforts in addressing CCA and DRRM; and (6) the absence of a CEMO.
E. Cagayan de Oro City Cagayan de Oro City is a first class highly urbanized city and the capital of the province of Misamis Oriental. Known as the gateway to Northern Mindanao, the city has a total land area of 57,851 hectares and has a population of 602,088 according to the 2010 Census of Population and Housing. The city is composed of 80 barangays, with 66 classified as urban and the remaining 14 as rural (CLUP, 2013-2022). Vulnerability Assessment The DRRMP, 2013-2017 details the different hazards faced by the city. Flooding has been one of the most damaging and traumatic hazard in the city. According to the DRRMO, 46 of 80 barangays are prone to flooding. The implementation strategies identified in the DRRMP are:
• Information and education campaigns
• Competency-based capacity development
• Education on CCA and DRRM for all the residents
• Advocacy and institutionalization of CDRRMC and CDRRMO
• Mainstreaming of DRR and institutionalizing CCA in all plans
• Research, technology development, and knowledge management
• Monitoring, evaluation, and learning
• Networking and partnership building between and among stakeholders, media, and tiers of government
The Local Shelter Plan (LSP), which details the housing needs for both formal and informal sectors of the city as well as contains strategies and implementation plan, is currently awaiting approval from the Sanggunian. The LSP already identifies public and privately-owned areas in danger zones. The DENR-Mines and Geosciences Bureau (MGB) Region X has completed 1:10,000 geo-hazard risk maps on landslide and flooding in December 2014. The city’s vulnerability and adaptation assessment report also includes a multi-hazard map (Figure 15) as well as hazard-specific maps (Figures 16, 17, and 18).

USAID Strengthening Urban Resilience for Growth with Equity (SURGE) Project Page 45 Assessment of the Vulnerabilities and Local Capacities of Cities Development Initiative (CDI) Cities for Building Urban Resilience
Figure 15. Multi-hazard Risk Map for Cagayan de Oro
Source: Vulnerability and Adaptation Assessment Report
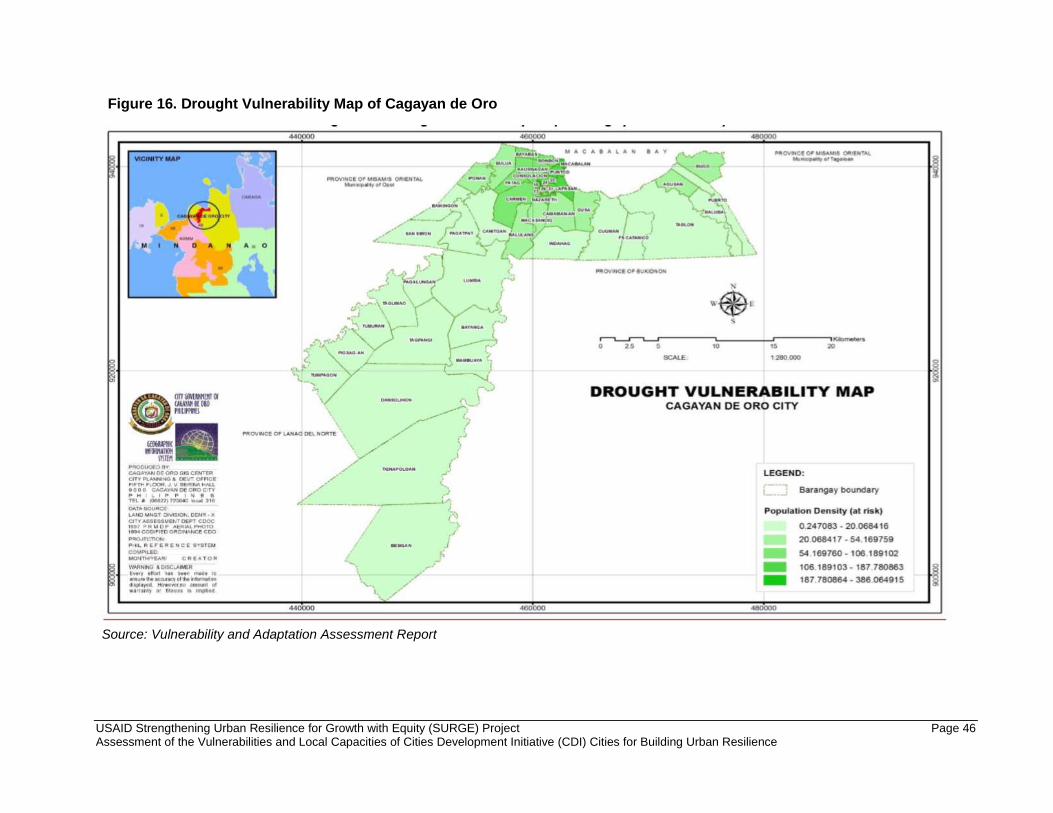
USAID Strengthening Urban Resilience for Growth with Equity (SURGE) Project Page 46 Assessment of the Vulnerabilities and Local Capacities of Cities Development Initiative (CDI) Cities for Building Urban Resilience
Figure 16. Drought Vulnerability Map of Cagayan de Oro
Source: Vulnerability and Adaptation Assessment Report
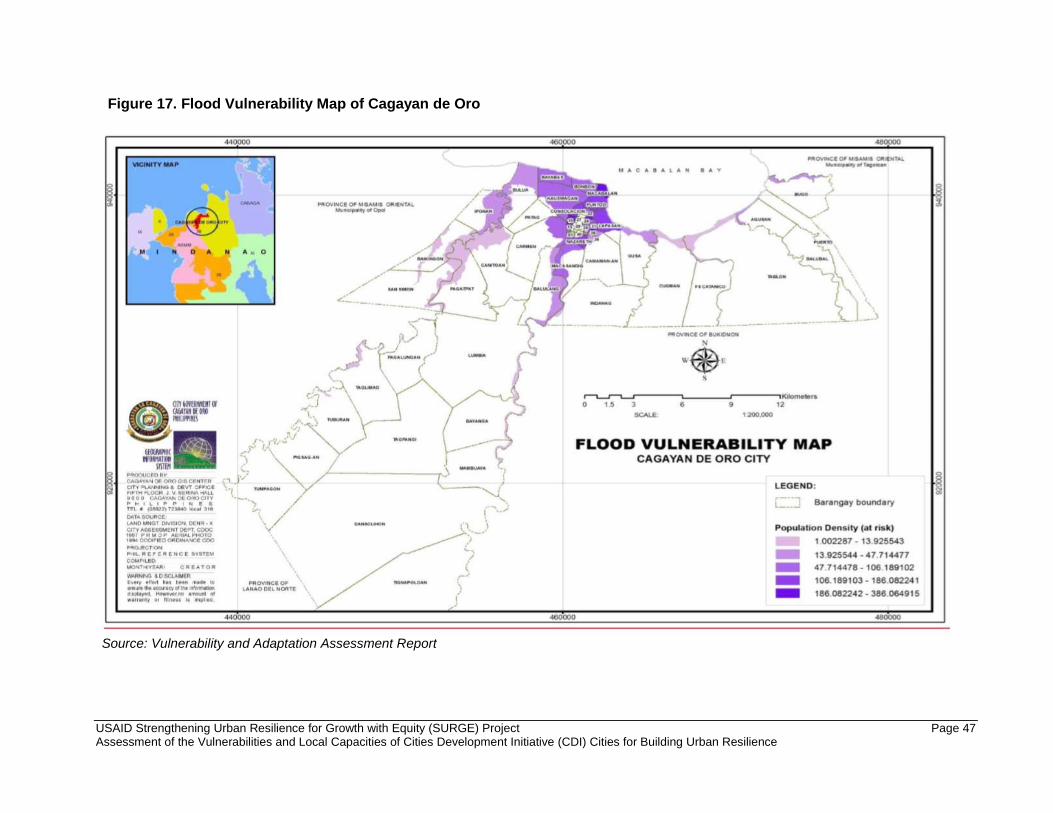
USAID Strengthening Urban Resilience for Growth with Equity (SURGE) Project Page 47 Assessment of the Vulnerabilities and Local Capacities of Cities Development Initiative (CDI) Cities for Building Urban Resilience
Figure 17. Flood Vulnerability Map of Cagayan de Oro
Source: Vulnerability and Adaptation Assessment Report

USAID Strengthening Urban Resilience for Growth with Equity (SURGE) Project Page 48 Assessment of the Vulnerabilities and Local Capacities of Cities Development Initiative (CDI) Cities for Building Urban Resilience
Figure 18. Landslide Vulnerability Map of Cagayan de Oro \
Source: Vulnerability and Adaptation Assessment Report
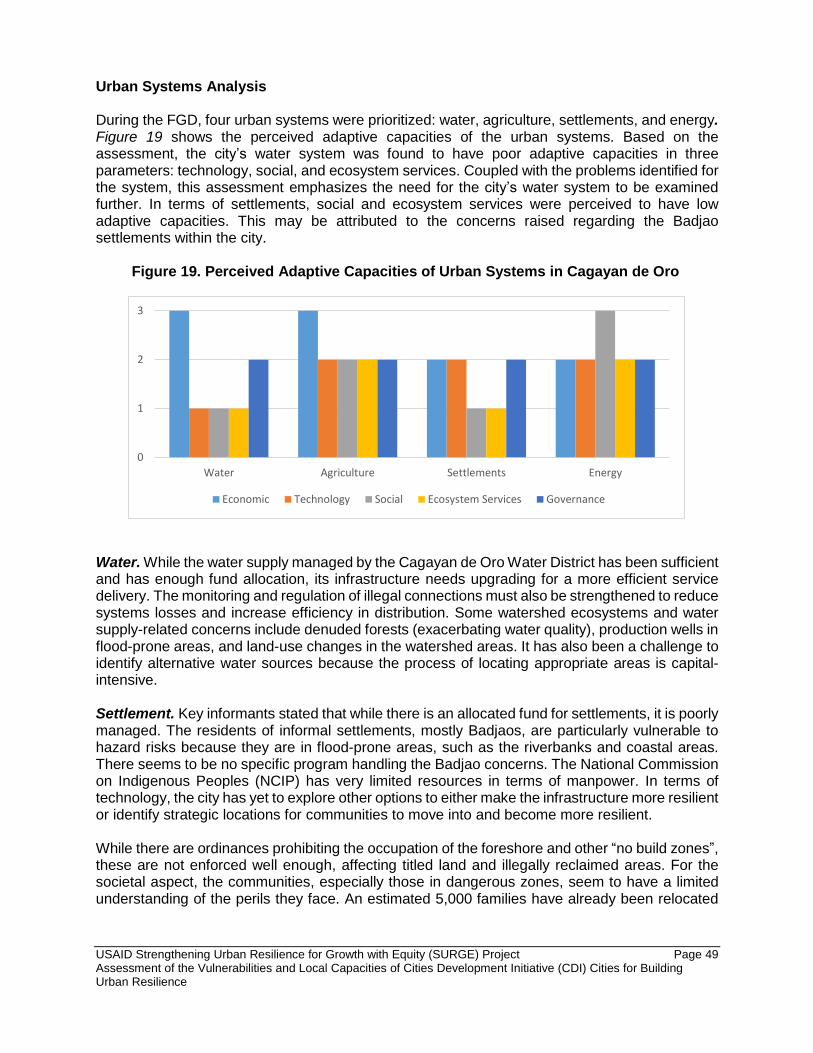
USAID Strengthening Urban Resilience for Growth with Equity (SURGE) Project Page 49 Assessment of the Vulnerabilities and Local Capacities of Cities Development Initiative (CDI) Cities for Building Urban Resilience
Urban Systems Analysis During the FGD, four urban systems were prioritized: water, agriculture, settlements, and energy. Figure 19 shows the perceived adaptive capacities of the urban systems. Based on the assessment, the city’s water system was found to have poor adaptive capacities in three parameters: technology, social, and ecosystem services. Coupled with the problems identified for the system, this assessment emphasizes the need for the city’s water system to be examined further. In terms of settlements, social and ecosystem services were perceived to have low adaptive capacities. This may be attributed to the concerns raised regarding the Badjao settlements within the city.
Figure 19. Perceived Adaptive Capacities of Urban Systems in Cagayan de Oro
Water. While the water supply managed by the Cagayan de Oro Water District has been sufficient and has enough fund allocation, its infrastructure needs upgrading for a more efficient service delivery. The monitoring and regulation of illegal connections must also be strengthened to reduce systems losses and increase efficiency in distribution. Some watershed ecosystems and water supply-related concerns include denuded forests (exacerbating water quality), production wells in flood-prone areas, and land-use changes in the watershed areas. It has also been a challenge to identify alternative water sources because the process of locating appropriate areas is capital-intensive. Settlement. Key informants stated that while there is an allocated fund for settlements, it is poorly managed. The residents of informal settlements, mostly Badjaos, are particularly vulnerable to hazard risks because they are in flood-prone areas, such as the riverbanks and coastal areas. There seems to be no specific program handling the Badjao concerns. The National Commission on Indigenous Peoples (NCIP) has very limited resources in terms of manpower. In terms of technology, the city has yet to explore other options to either make the infrastructure more resilient or identify strategic locations for communities to move into and become more resilient. While there are ordinances prohibiting the occupation of the foreshore and other “no build zones”, these are not enforced well enough, affecting titled land and illegally reclaimed areas. For the societal aspect, the communities, especially those in dangerous zones, seem to have a limited understanding of the perils they face. An estimated 5,000 families have already been relocated
0
1
2
3
Water Agriculture Settlements Energy
Economic Technology Social Ecosystem Services Governance

USAID Strengthening Urban Resilience for Growth with Equity (SURGE) Project Page 50 Assessment of the Vulnerabilities and Local Capacities of Cities Development Initiative (CDI) Cities for Building Urban Resilience
to permanent housing units since April 2012, three months after Super Typhoon Sendong hit the city. The relocation sites are in Barangays Calaanan, Berjaya, Camaman-an, Lumbia, and Indahag. Agriculture. The agriculture sector enjoys budgets from the national and local governments. Assistance from the national government covers the production and livelihood aspects, such as the provision of post-harvest equipment and the construction of farm-to-market roads. Serious damage on crops has been reported in 2015 and 2016 due to drought. Water sources for irrigation are limited, but the areas near the rivers have been provided with irrigation pumps. A variety of climate-resilient products has not yet been introduced to the market. Due to landslides in upland areas, the Sloping Agricultural Land Technology, also known as multi-cropping system, has been identified as one appropriate measure for slope protection and stabilization. This also happens to be a low-cost method of farming because familiar plant crops will be utilized. Besides the low cost, this farming method also helps in securing agricultural soil against the hazards of erosion and landslides. Incidentally, there is also an existing water-impounding system that would store rainwater for farming in the upland areas. Energy. The Cagayan Electric Power and Light Company, Inc. (CEPALCO) has sufficient funding support and can avail of big infrastructure project loans. The city’s electrical poles have been upgraded, and substations are now designed to withstand typhoons and flooding. Sensors that measure thermal anomalies are also now operational in the substations. On the governance aspect, CEPALCO claims to have a strong internal organization and also good coordination with the city, especially with the CDRRMO. In terms of societal aspect, there are ongoing programs, such as regular barangay safety lectures in coordination with the Integrated Institute of Electric Engineers. Residents are also encouraged to contact the company in real time to report irregularities and other complaints through the CEPALCO website. Urban Actors’ Characteristics Table 14 shows the key urban actors identified during the preliminary assessment in vulnerable areas in Cagayan de Oro. The city has a broad range of partners, from the private sector to academic institutions and civil society organizations which can potentially support the city in addressing urban resiliency issues. Table 14. Key Urban Actors in the Identified Vulnerable Areas in Cagayan de Oro City
Perceived Risk Statement Vulnerable Areas
Urban Actors
Vulnerable Actors
Potential Supporting Actor
WATER SUPPLY
Increased demand for water due to rising temperature which aggravates groundwater extraction
Citywide Informal Settlers Residents/ Consumers
Cagayan de Oro Water District, Private Water Concessionaires, City Health Office, City Local Environment and Natural Resources Office (CLENRO),

USAID Strengthening Urban Resilience for Growth with Equity (SURGE) Project Page 51 Assessment of the Vulnerabilities and Local Capacities of Cities Development Initiative (CDI) Cities for Building Urban Resilience
Perceived Risk Statement Vulnerable Areas
Urban Actors
Vulnerable Actors
Potential Supporting Actor
National Water Resource Board (NWRB), DENR –for watershed protection, Cagayan de Oro River Basin Management Council, Rio Verde Consortium
SETTLEMENTS / SHELTER
Vulnerability of Informal settlers living along the waterways to damage to lives and property, especially during intense rainfall.
Hazard areas: Landslide (Baikingon: Zone 2 along barangay road and Zone 3 barangay center and Lumbia, Sitio Kabula; Camaman-an and Pagalungan; barangays Balubal, Gusa, Indahag, and Lapasan) Flooding (low-lying areas located in Bayabas, Bonbon, Kauswagan, Carmen, Consolacion, Puntod and Macabalan; Sitio Tibasak and Biasong in Macasandig and Isla de Oro)
Informal Settlers Residents BDRRM Team
CDRRMO, National Commission on Indigenous Peoples (NCIP), National Housing Authority (NHA) , Housing and Urban Development Coordinating Council (HUDCC), CSOs City Planning, CSWD Land Registration Office Developers (Real Estate)
ENERGY
Higher demand for electricity due to increase in temperature.
Citywide All Residents CEPALCO LGU
AGRICULTURE (FOOD)
Food shortage due to extreme weather events.
Citywide Agricultural areas in the upland (Canitoan, Pagatpat, San Simon, Baikingon, Iponan) Coastal barangays (Bonbon)
All Residents City Agriculture P4MP (Presidents of Farmers Association) Public and Private Markets DA, BFAR Federation of Coastal Barangays Macajalar Bay Development Alliance
USAID Strengthening Urban Resilience for Growth with Equity (SURGE) Project Page 52 Assessment of the Vulnerabilities and Local Capacities of Cities Development Initiative (CDI) Cities for Building Urban Resilience
Possible Indicators of GHG Emission Sources Cagayan de Oro does not have a completed GHG inventory yet. However, it has recently participated in LEDS-related undertakings and advocacies. In 2015, the city joined the World Wildlife Fund for Nature’s Earth Hour City Challenge. This allowed the city to receive basic orientation on GHG inventory concepts and processes. The project also facilitated a GHG activity data assessment to identify possible data sources within the city government – as well as external sources. A review of secondary documents, such as the city’s CDP 2014-2019, stated that CEPALCO and the Misamis Oriental 1 Rural Electric Service Cooperative (MORESCO-1) are the main power distribution companies in Cagayan De Oro City. CEPALCO serves the city’s greater urban area, while MORESCO-1 serves 16 barangays in the western part of the city. Residential use has the highest number of connections for both companies, although roughly 23 percent of households are not connected to either CEPALCO or MORESCO-1. The 2016 projected power requirement of CEPALCO is around 668,018,000 kWh, while that of MORESCO-1 is at 12,892,597 kWh. For the waste sector, the city’s current practice is the collection of mixed waste, based on the 2013 Pre-Feasibility Study (PFS) prepared by the Cities Development Initiatives for Asia (CDIA) and the Asian Development Bank (ADB). The document stated that “domestic solid waste and similar from business is mainly collected by a private company hired by the City which collects about two-thirds of the total waste deposited in the dumpsite (year 2011). Total volume of waste collected in 2011 amounted to 272,826 m3 equivalent to approximately 71,480 tons (estimated at 64 percent of the waste generation). With the increase in population, the volume of waste being generated will also increase. The collected waste is dumped in a landfill located in Upper Dagong, Barangay Carmen. This dumpsite is already full so waste disposal needs to be transferred to an engineered Sanitary Landfill (SLF), which can be constructed in Barangay Pagatpat, according to the PFS. In terms of wastewater, the city currently has no sewerage systems; hence, river systems and creeks serve as natural drainage systems. Such outflow of untreated domestic wastewater poses adverse health and environmental risks. The primary sanitation facilities of residential and other small commercial areas are septic tanks, which are “unable to achieve the required pollution parameters required by DENR. Also the sludge is retained in the septic tanks.” Under the industry sector, Nestle Philippines., Inc., Del Monte Philippines., Inc., and Limketkai Manufacturing Corp. (Marca Leon Cooking Oil) are the three most dominant companies in the city. They process raw materials for production. Two of the companies have their own port to transport goods. Under the Agriculture, Forestry and Other Land Use, the potential GHG emissions may be contributed by agricultural and livestock activities. About 7,579 hectares or 13 percent of the city’s total land area is agricultural. Major crops produced are corn, bananas, nuts, and other fruits and vegetables. Livestock production, on the other hand, is limited to backyard and small-scale raising, with hogs accounting for 57 percent of the total livestock population. Total poultry population are mostly chickens.
USAID Strengthening Urban Resilience for Growth with Equity (SURGE) Project Page 53 Assessment of the Vulnerabilities and Local Capacities of Cities Development Initiative (CDI) Cities for Building Urban Resilience
Roughly 64 percent of the city’s total land area or 36,861.47 hectares is forestland. Quantifying the capacity of CDO’s forest to remove CO2, however, can provide details on whether the city can be classified as a carbon emitter or a carbon sink. Analysis of Planning Documents The city’s current CLUP, 2013-2022 is DRR-CCA-enhanced. It was completed with the assistance of the regional offices of NEDA and HLURB, as well as the United Nations Development Programme (UNDP). The document identified potential growth centers and integrated results of the climate change vulnerability assessment. It was observed, though, that the CLUP was completed prior to the issuance of HLURB guidelines. The city DRRM plan, covering 2013 to 2017, has already been approved by the city council. The plan noted that typhoons, rain-induced floods, earthquakes, landslides, storm surge, and coastal flooding and subsidence have become common phenomena in the city in recent years. The city also has an existing vulnerability assessment supported by UN Habitat’s Cities and Climate Change Initiative.
Priority urban systems identified during the scoping activity were water, settlements, energy, and agriculture. Based on the perceived adaptive capacities of urban systems, water and settlements can be considered as the primary areas of concern in the city. Water, in particular, is perceived to have low adaptive capacities in terms of technology, governance, and social aspects. Settlements have been perceived to have low adaptive capacities regarding governance and social dimensions. There are a number of data gaps on the water sector including, but not limited to, the following:
• studies on saltwater intrusion and the corresponding facility/technology to establish stations to monitor water salinity and ground water in areas where saltwater intrusion has been reported and areas where it is likely to occur;
• localized data on wind direction, speed, rainfall, and sea-level rise; and
• profile of watershed areas and river systems traversing Cagayan de Oro City. At present, only two out of seven watersheds in the city have management plans. The other five need watershed management plans. There are limited studies on biodiversity and other environmental profiling of watershed areas. More studies are also needed regarding the linkages among forest cover and watershed management, with focus on ground water and water quality/quantity. The National Water Resources Board (NWRB) needs to be more pro-active especially because there is poor regulation of deep-well drilling. Science-based studies need to be conducted in relation to the construction of disaster mitigation structures and facilities in hazard-prone areas. Future plans for infrastructure should consider other climatic changes such as stronger wind during typhoons. Based on the discussions with relevant city officials and selected representatives from the regional offices of national government agencies, metropolitanization and inter-local cooperation are potential strategies for development moving forward, especially considering CDO’s strategic location and role in Northern Mindanao. It is recommended that SURGE Project review the completed NEDA regional plan to identify areas where the project can provide technical support.
USAID Strengthening Urban Resilience for Growth with Equity (SURGE) Project Page 54 Assessment of the Vulnerabilities and Local Capacities of Cities Development Initiative (CDI) Cities for Building Urban Resilience
It may also be crucial to explore partnerships with the NCIP to tackle the problems concerning the Badjaos residing in flood-prone areas. Xavier University has expressed interest in hosting a data consolidation workshop so that the city offices can be better informed on the available data and how these can be better utilized especially for planning purposes. The SURGE Project can further explore into this proposal.
F. Zamboanga City Zamboanga City is a highly urbanized city located in Mindanao, and the country’s third largest city by land area with 148,338.49 hectares. The city is comprised of 98 barangays. It has a population of 807,129 as of the 2010 census. The city envisions to become “a unique premier city of Southeast Asia, endowed with rich history, culture, and natural resources.”14 Zamboanga City serves as the gateway to the Brunei Darussalam-Indonesia-Malaysia-Philippines - East ASEAN Growth Area (BIMP-EAGA). Accessible by land, sea, and air, it also serves as the economic and financial center in Zamboanga Peninsula. The city suffers from lopsided urbanization, according to the 2015 UN Habitat report. Half of the city’s population live in 30 urban barangays, making the urban center densely populated. UN Habitat also reported that “much of the urban development has occurred within the 7 kilometer radius from the urban core, in only 20 of the 98 barangays.”15 Vulnerability Assessment Zamboanga City’s DRRMP states that the city is located outside the typhoon belt. But it still experiences various hydro-meteorological hazards, such as drought, flooding, landslide, storm surges, and tsunami. There is also seasonal flooding due to the accumulation of heavy rainfall run-off from rivers and creeks, which usually lasts for one week in a year. The plan also includes human-induced disasters, such as bombings and explosions, capturing the context of multiple conflicts happening in selected areas of Mindanao. The DRRMP includes city-specific hazard maps for landslide, tsunami, and flood susceptibility. Figures 20, 21 and 22 show the city’s hazard maps as indicated in the plan.16 For each hazard, the city identified strategies during various phases of the disaster (mitigation/prevention and preparedness; response, relief, and recovery); the maps also mention recovery services. Lead and supporting agencies have likewise been identified. The LCCAP 2016-2030, on the other hand, adopts the seven strategic themes identified in the NCCAP. Adaptation and a few mitigation strategies per thematic focus were classified into four areas: (1) policy development and governance; (2) research, development, and extension; (3) knowledge sharing and capacity building; and (4) service delivery.
14 Based on the 2010 Census of Population and Housing 15 Based on the UN Habitat’s Urban Development Assessment of Zamboanga City (2015) 16 The El Nino Southern Oscillation (ENSO) map used is for the entire Philippines
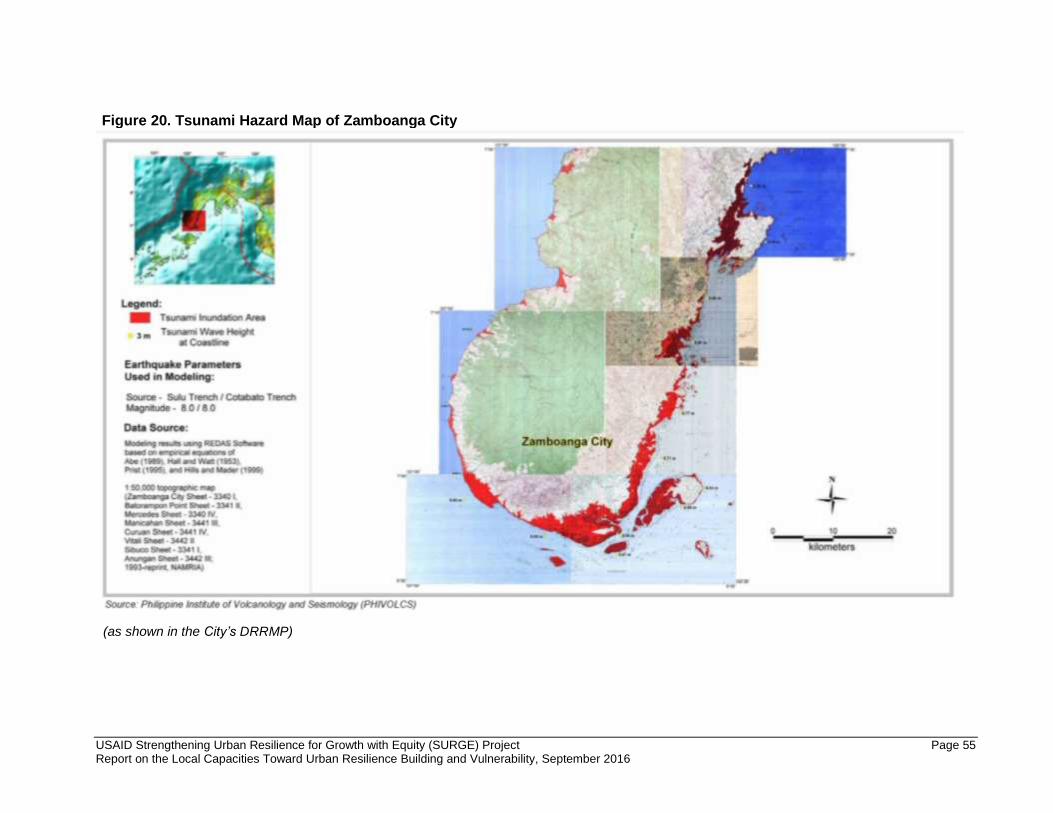
USAID Strengthening Urban Resilience for Growth with Equity (SURGE) Project Page 55 Report on the Local Capacities Toward Urban Resilience Building and Vulnerability, September 2016
Figure 20. Tsunami Hazard Map of Zamboanga City
(as shown in the City’s DRRMP)
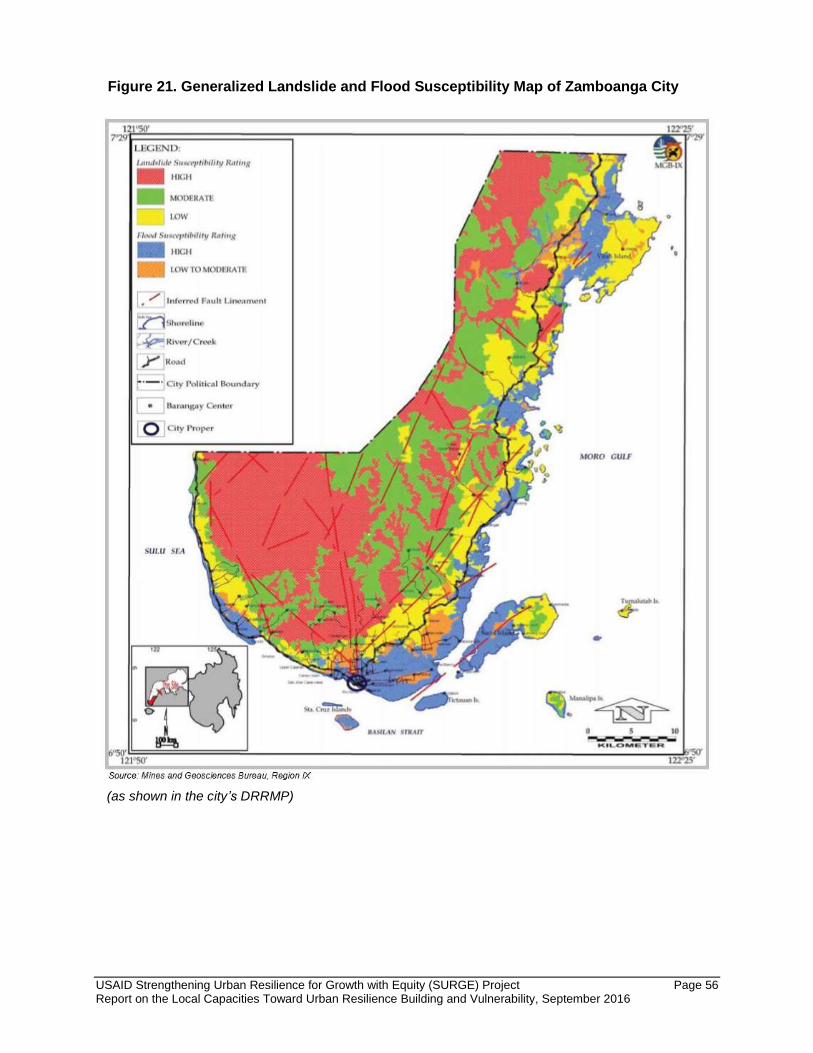
USAID Strengthening Urban Resilience for Growth with Equity (SURGE) Project Page 56 Report on the Local Capacities Toward Urban Resilience Building and Vulnerability, September 2016
Figure 21. Generalized Landslide and Flood Susceptibility Map of Zamboanga City
(as shown in the city’s DRRMP)

USAID Strengthening Urban Resilience for Growth with Equity (SURGE) Project Page 57 Report on the Local Capacities Toward Urban Resilience Building and Vulnerability, September 2016
Figure 22. Flood Susceptibility Map of Zamboanga City Proper and its Environs
(as shown in the city’s DRRMP) The city’s LCCAP includes an assessment of the city’s perceived threat level in terms of exposure and sensitivity, adaptive capacity, and vulnerability to five types of climate hazards such as flood, storm surge, typhoon, sea-level rise, and drought. Tables 15 and 16 show the results of perceived levels of threat and adaptive capacity. The scoring was guided by UN-Habitat’s Planning for Climate Change Toolkit (2014). Analyses were further supported by FGDs and secondary documents including related scientific maps. Overall, the city faces low to medium-low threat for the identified hazards; the highest level threat was identified as typhoon, with a threat level score of 2.8 out of 5, followed by flood with 2.6 threat level score (Table 15). Table 15. Results of Zamboanga City’s Perceived Threat Level, By Climate Hazard*
Sector
Hazards
Flood Storm surge
Typhoon Sea level rise
Drought Average Threat Level
Social 2.00 2.00 2.00 1.00 3.00 2.00 Economic 2.00 2.00 3.00 1.00 3.00 2.20 Infrastructure 3.00 2.00 3.00 1.00 1.00 2.00 Land use 3.00 1.00 3.00 1.00 3.00 2.20 Environment 3.00 1.00 3.00 1.00 3.00 2.20 Overall Threat Level
2.60 1.60 2.80 1.00 2.60 2.10
*Levels: 5 (High; 4 (Medium High); 3 (Medium); 2 (Medium Low); 1 (Low) Source: LCCAP, 2016-2030
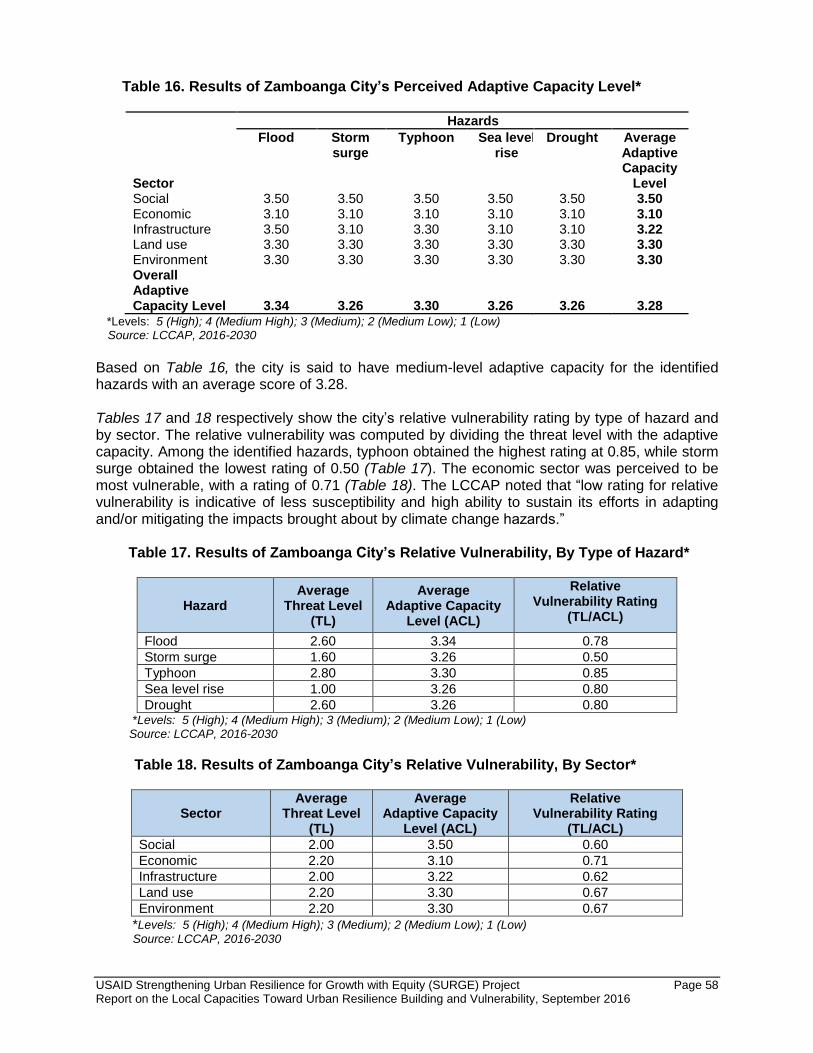
USAID Strengthening Urban Resilience for Growth with Equity (SURGE) Project Page 58 Report on the Local Capacities Toward Urban Resilience Building and Vulnerability, September 2016
Table 16. Results of Zamboanga City’s Perceived Adaptive Capacity Level*
Sector
Hazards
Flood Storm surge
Typhoon Sea level rise
Drought Average Adaptive Capacity
Level Social 3.50 3.50 3.50 3.50 3.50 3.50 Economic 3.10 3.10 3.10 3.10 3.10 3.10 Infrastructure 3.50 3.10 3.30 3.10 3.10 3.22 Land use 3.30 3.30 3.30 3.30 3.30 3.30 Environment 3.30 3.30 3.30 3.30 3.30 3.30 Overall Adaptive Capacity Level
3.34
3.26
3.30
3.26
3.26
3.28 *Levels: 5 (High); 4 (Medium High); 3 (Medium); 2 (Medium Low); 1 (Low)
Source: LCCAP, 2016-2030
Based on Table 16, the city is said to have medium-level adaptive capacity for the identified hazards with an average score of 3.28. Tables 17 and 18 respectively show the city’s relative vulnerability rating by type of hazard and by sector. The relative vulnerability was computed by dividing the threat level with the adaptive capacity. Among the identified hazards, typhoon obtained the highest rating at 0.85, while storm surge obtained the lowest rating of 0.50 (Table 17). The economic sector was perceived to be most vulnerable, with a rating of 0.71 (Table 18). The LCCAP noted that “low rating for relative vulnerability is indicative of less susceptibility and high ability to sustain its efforts in adapting and/or mitigating the impacts brought about by climate change hazards.” Table 17. Results of Zamboanga City’s Relative Vulnerability, By Type of Hazard*
Hazard Average
Threat Level (TL)
Average Adaptive Capacity
Level (ACL)
Relative Vulnerability Rating
(TL/ACL)
Flood 2.60 3.34 0.78
Storm surge 1.60 3.26 0.50
Typhoon 2.80 3.30 0.85
Sea level rise 1.00 3.26 0.80
Drought 2.60 3.26 0.80 *Levels: 5 (High); 4 (Medium High); 3 (Medium); 2 (Medium Low); 1 (Low) Source: LCCAP, 2016-2030
Table 18. Results of Zamboanga City’s Relative Vulnerability, By Sector*
Sector Average
Threat Level (TL)
Average Adaptive Capacity
Level (ACL)
Relative Vulnerability Rating
(TL/ACL)
Social 2.00 3.50 0.60
Economic 2.20 3.10 0.71
Infrastructure 2.00 3.22 0.62
Land use 2.20 3.30 0.67
Environment 2.20 3.30 0.67
*Levels: 5 (High); 4 (Medium High); 3 (Medium); 2 (Medium Low); 1 (Low)
Source: LCCAP, 2016-2030
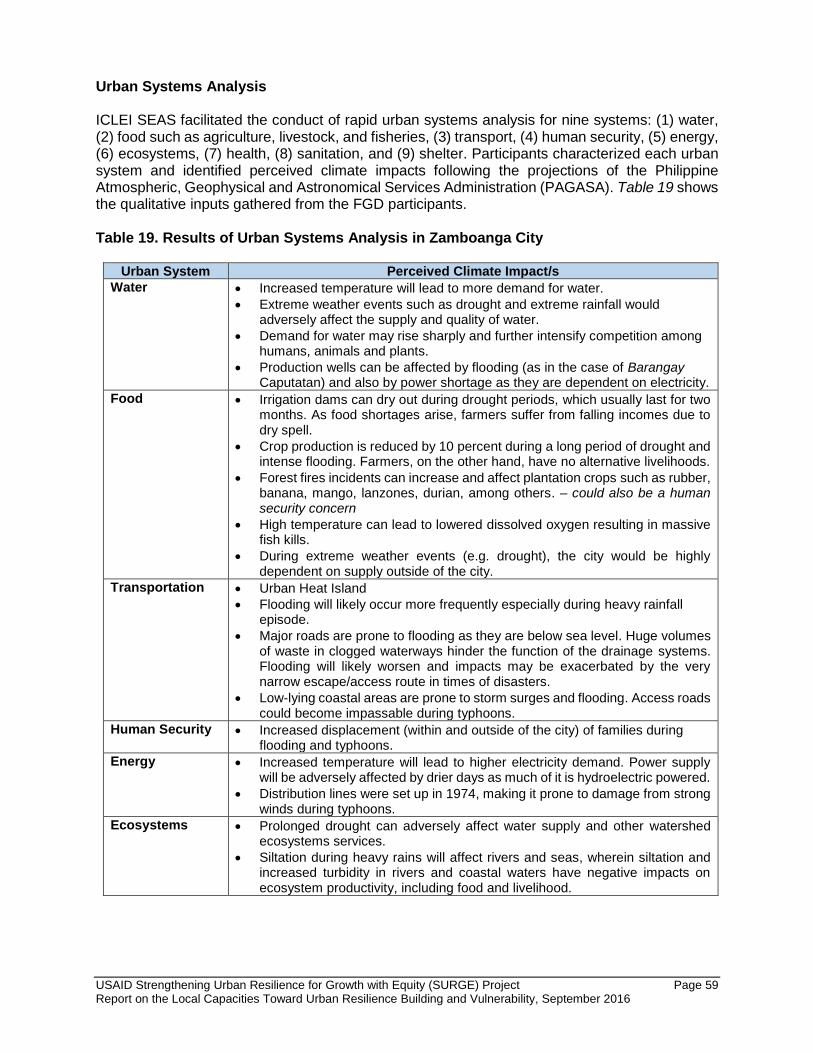
USAID Strengthening Urban Resilience for Growth with Equity (SURGE) Project Page 59 Report on the Local Capacities Toward Urban Resilience Building and Vulnerability, September 2016
Urban Systems Analysis ICLEI SEAS facilitated the conduct of rapid urban systems analysis for nine systems: (1) water, (2) food such as agriculture, livestock, and fisheries, (3) transport, (4) human security, (5) energy, (6) ecosystems, (7) health, (8) sanitation, and (9) shelter. Participants characterized each urban system and identified perceived climate impacts following the projections of the Philippine Atmospheric, Geophysical and Astronomical Services Administration (PAGASA). Table 19 shows the qualitative inputs gathered from the FGD participants. Table 19. Results of Urban Systems Analysis in Zamboanga City
Urban System Perceived Climate Impact/s
Water • Increased temperature will lead to more demand for water.
• Extreme weather events such as drought and extreme rainfall would adversely affect the supply and quality of water.
• Demand for water may rise sharply and further intensify competition among humans, animals and plants.
• Production wells can be affected by flooding (as in the case of Barangay Caputatan) and also by power shortage as they are dependent on electricity.
Food • Irrigation dams can dry out during drought periods, which usually last for two months. As food shortages arise, farmers suffer from falling incomes due to dry spell.
• Crop production is reduced by 10 percent during a long period of drought and intense flooding. Farmers, on the other hand, have no alternative livelihoods.
• Forest fires incidents can increase and affect plantation crops such as rubber, banana, mango, lanzones, durian, among others. – could also be a human security concern
• High temperature can lead to lowered dissolved oxygen resulting in massive fish kills.
• During extreme weather events (e.g. drought), the city would be highly dependent on supply outside of the city.
Transportation • Urban Heat Island
• Flooding will likely occur more frequently especially during heavy rainfall episode.
• Major roads are prone to flooding as they are below sea level. Huge volumes of waste in clogged waterways hinder the function of the drainage systems. Flooding will likely worsen and impacts may be exacerbated by the very narrow escape/access route in times of disasters.
• Low-lying coastal areas are prone to storm surges and flooding. Access roads could become impassable during typhoons.
Human Security • Increased displacement (within and outside of the city) of families during flooding and typhoons.
Energy • Increased temperature will lead to higher electricity demand. Power supply will be adversely affected by drier days as much of it is hydroelectric powered.
• Distribution lines were set up in 1974, making it prone to damage from strong winds during typhoons.
Ecosystems • Prolonged drought can adversely affect water supply and other watershed ecosystems services.
• Siltation during heavy rains will affect rivers and seas, wherein siltation and increased turbidity in rivers and coastal waters have negative impacts on ecosystem productivity, including food and livelihood.
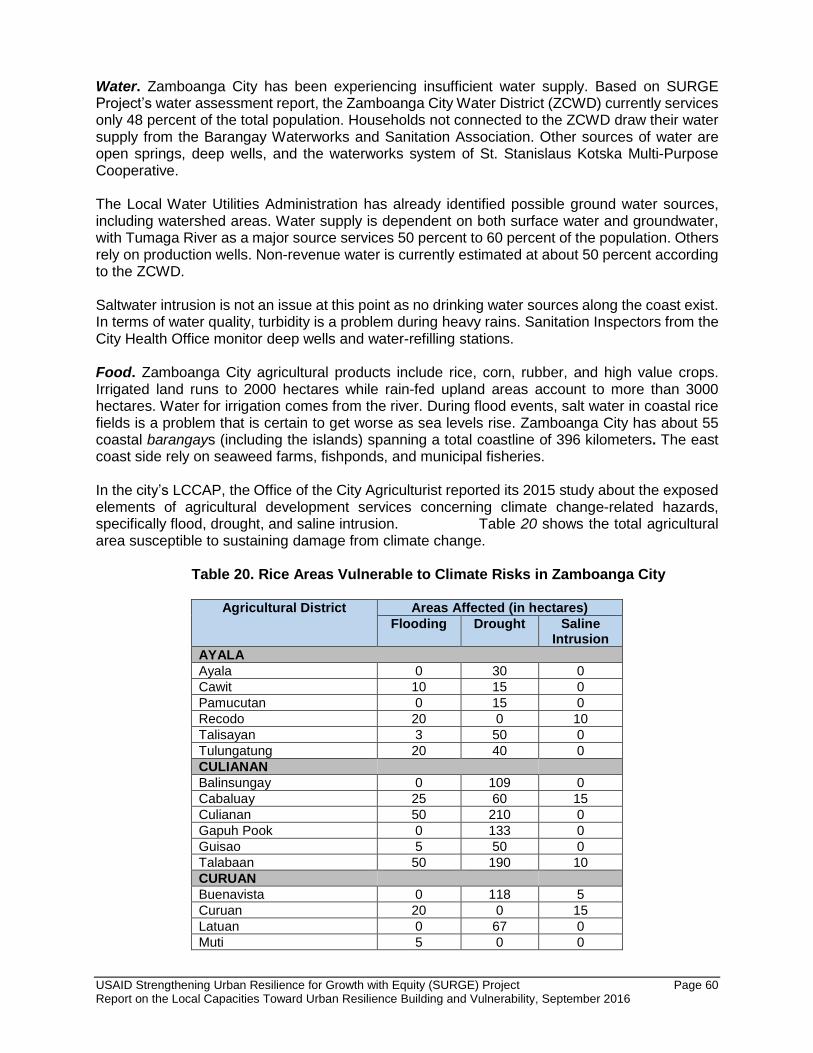
USAID Strengthening Urban Resilience for Growth with Equity (SURGE) Project Page 60 Report on the Local Capacities Toward Urban Resilience Building and Vulnerability, September 2016
Water. Zamboanga City has been experiencing insufficient water supply. Based on SURGE Project’s water assessment report, the Zamboanga City Water District (ZCWD) currently services only 48 percent of the total population. Households not connected to the ZCWD draw their water supply from the Barangay Waterworks and Sanitation Association. Other sources of water are open springs, deep wells, and the waterworks system of St. Stanislaus Kotska Multi-Purpose Cooperative. The Local Water Utilities Administration has already identified possible ground water sources, including watershed areas. Water supply is dependent on both surface water and groundwater, with Tumaga River as a major source services 50 percent to 60 percent of the population. Others rely on production wells. Non-revenue water is currently estimated at about 50 percent according to the ZCWD. Saltwater intrusion is not an issue at this point as no drinking water sources along the coast exist. In terms of water quality, turbidity is a problem during heavy rains. Sanitation Inspectors from the City Health Office monitor deep wells and water-refilling stations. Food. Zamboanga City agricultural products include rice, corn, rubber, and high value crops. Irrigated land runs to 2000 hectares while rain-fed upland areas account to more than 3000 hectares. Water for irrigation comes from the river. During flood events, salt water in coastal rice fields is a problem that is certain to get worse as sea levels rise. Zamboanga City has about 55 coastal barangays (including the islands) spanning a total coastline of 396 kilometers. The east coast side rely on seaweed farms, fishponds, and municipal fisheries. In the city’s LCCAP, the Office of the City Agriculturist reported its 2015 study about the exposed elements of agricultural development services concerning climate change-related hazards, specifically flood, drought, and saline intrusion. Table 20 shows the total agricultural area susceptible to sustaining damage from climate change. Table 20. Rice Areas Vulnerable to Climate Risks in Zamboanga City
Agricultural District Areas Affected (in hectares)
Flooding Drought Saline Intrusion
AYALA
Ayala 0 30 0
Cawit 10 15 0
Pamucutan 0 15 0
Recodo 20 0 10
Talisayan 3 50 0
Tulungatung 20 40 0
CULIANAN
Balinsungay 0 109 0
Cabaluay 25 60 15
Culianan 50 210 0
Gapuh Pook 0 133 0
Guisao 5 50 0
Talabaan 50 190 10
CURUAN
Buenavista 0 118 5
Curuan 20 0 15
Latuan 0 67 0
Muti 5 0 0

USAID Strengthening Urban Resilience for Growth with Equity (SURGE) Project Page 61 Report on the Local Capacities Toward Urban Resilience Building and Vulnerability, September 2016
Agricultural District Areas Affected (in hectares)
Flooding Drought Saline Intrusion
Quiniput 45 93 0
MANICAHAN
Aplaya, Manicahan 8 0 0
Bolong 0 100 10
Bunguiao 8 0 20
Busug, Manicahan 10 0 0
Compania, Bunguiao 0 69 0
Licopon 73 73 0
Mangga Bolong 33 33 0
Paminguitan 0 35 6
San Isidro 8 0 0
Seguinan 0 31 0
TUMAGA
Boalan 30 49 0
Cabatangan/Sta. Maria 50 100 0
Caputatan 0 25 0
Guiwan 80 100 20
Lumiyap 30 30 5
Lunzuran 2 0 0
VITALI
Bataan, Vitali 30 0 0
Bincul, Mangusu 15 0 0
Davuy 12 0 0
Lower Tigbao, Licomo 25 40 0
Mangusu 0 30 0
Taloptap 2 0 10
Tictapul 0 37 0
Tigbao 0 0 8
Tindalo 0 0 3
Vitali 0 247 15
TOTAL 669 2,179 152
Source: Office of the City Agriculturist, 2015 as cited in the LCCAP 2016-2030
Transportation. Zamboanga City has a narrow road network, and there are only two road access to the city. Other modes of transport in order to reach the city is through water and air. However, road construction projects, including the widening of major roads are on-going. Tricycles and jeepneys are the main modes of transportation in the city, but the habal-habal (motorcycle taxis) and sikad (bicycle-drawn pedicabs) also pass through the major roads. Currently, the city has no plan for a mass transit system. There is a need to increase road lanes, but buying road right-of-way can be expensive. Roads are not also pedestrian-friendly. Ambulant vendors occupy the sidewalks. There are no designated jeepney terminals as well as designated loading and unloading zones. The Planned City Extension, an initiative of UN Habitat, is focusing on these issues and presently studying how to decongest the city. Human Security (Human displacement, potential conflict in resource use). Most of the basic services provided by the city government are focused on rescue and relief assistance. Permanent and temporary relocation sites have already been identified. Energy. The Zamboanga City Electric Cooperative, Inc. is the main power distributor in Zamboanga City. Its main source of power is hydroelectric (53 %) sourced from Iligan City. About
USAID Strengthening Urban Resilience for Growth with Equity (SURGE) Project Page 62 Report on the Local Capacities Toward Urban Resilience Building and Vulnerability, September 2016
98 barangays were supplied with electricity ten years ago. There are also plans to reach the island barangays within 2016. For instance, some 145 sitios are scheduled for electrification. The city has scheduled daily power interruptions, about one hour in the morning and one hour in the evening. For instance, for every four megawatts (MW) consumption, there is an equivalent one-hour blackout. There is, however, a plan to install a 30MW solar panel in San Ramon. Some schools have already installed solar panels to augment their energy supply. Systems losses are typically from illegal connections, mostly by informal settlers. Ecosystems. There are three systems examined in the report – watersheds, river systems and forest cover. Watersheds. From the city’s seven watersheds, only the Pasonanca Watershed Forest Reserve, which forms part of the 17,414-hectare natural park was declared under the National Integrated Protected Areas System (NIPAS). There are six other unprotected watershed areas - Ayala, Culianan, Manicahan, Bolong, Curuan, and Vitali. AECOM, a US-based multinational engineering firm, conducted a rapid assessment of these unprotected watersheds, with detailed reports on two. These unprotected watersheds were set aside as potential protected areas, pending an assessment report to be submitted to the DENR as co-manager of the watersheds. However, without a presidential proclamation on the six watersheds, the area can still be utilized for other purposes, such as mining. River Systems. Based on the city’s LCCAP, there are four main river systems that greatly contribute to flooding within the city:
1. Tumaga River can cause flooding of areas along riverbanks and floodplains of barangays Tumaga, Sta. Maria, Tetuan, Tugbungan, and Mampang;
2. Putik River can influence flooding at the A&W Subdivision, low lying areas within Sitio Caputatan, areas downside of Marcos Drive, in Putik, Sitio Tibak in Divisoria and all other areas along the floodplain delta transected by the river;
3. Culianan River severely affects barangay Pasobolong; and 4. Baliwasan River severely affects San Jose Gusu, San Roque, and Baliwasan areas.
Forest Cover. A 2003 satellite imagery showed the big forest cover of the city, encompassing both 13,220 hectares closed canopy and 9,598 hectares open canopy. While some forest areas are occupied by informal settlers, the areas are being considered for forest protection. Presently, there are reforestation programs, particularly in Barangay Cacao, that provide livelihood opportunities. In terms of marine areas, the Great Sta. Cruz Island and the Little Sta. Cruz Island Protected Landscape and Seascape are covered under the NIPAS. Health. The city government does not monitor cases in in private hospitals. For instance, the city has no record for morbidity due to heat stroke. There is an emergency response team within the City Health Office (CHO), which is divided into 16 health districts. The following are gathered from the records of the health centers:
• increased incidence of water-borne diseases (diarrhea)
• increasing cases of skin diseases brought about by water shortage
• incidences of dengue – water shortage (improper storage), flooding
• incidences of respiratory tract infections Sanitation. One of the requirements in the issuance of the building permit is a sanitation facility. The occupancy permit requires sealed septic tanks; nonetheless desludging is the responsibility of establishments. There are private facilities outside the city which conducts desludging. One of
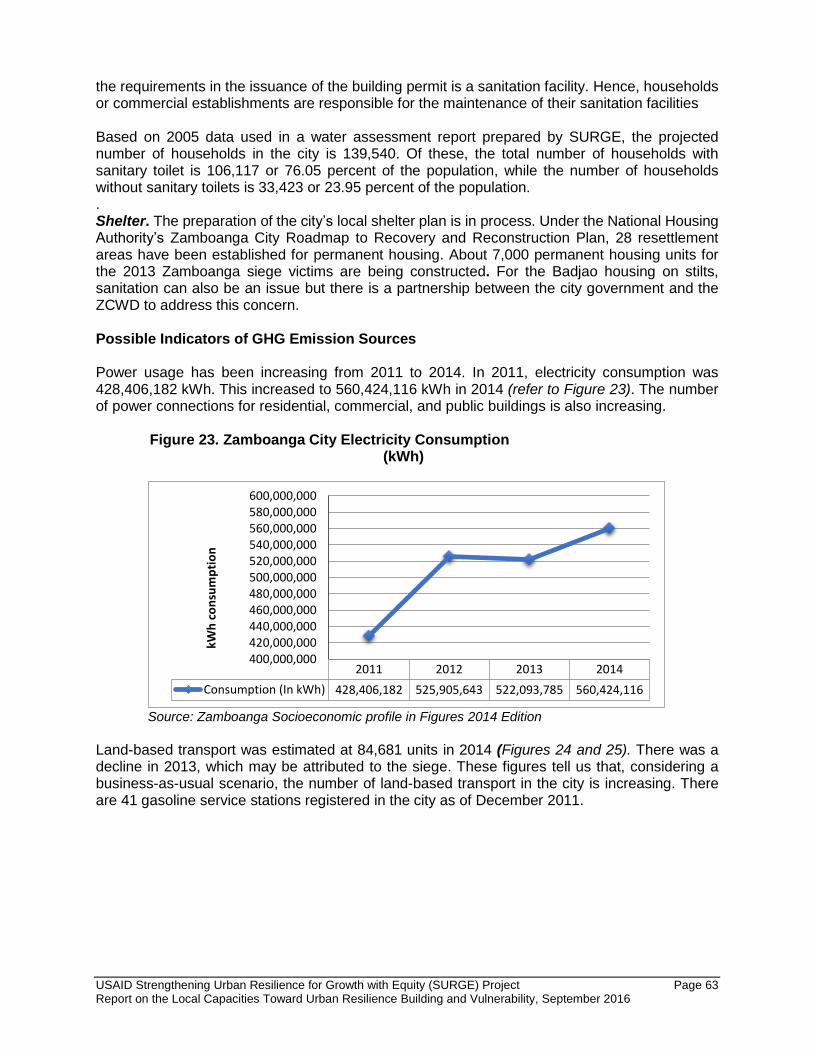
USAID Strengthening Urban Resilience for Growth with Equity (SURGE) Project Page 63 Report on the Local Capacities Toward Urban Resilience Building and Vulnerability, September 2016
the requirements in the issuance of the building permit is a sanitation facility. Hence, households or commercial establishments are responsible for the maintenance of their sanitation facilities Based on 2005 data used in a water assessment report prepared by SURGE, the projected number of households in the city is 139,540. Of these, the total number of households with sanitary toilet is 106,117 or 76.05 percent of the population, while the number of households without sanitary toilets is 33,423 or 23.95 percent of the population. . Shelter. The preparation of the city’s local shelter plan is in process. Under the National Housing Authority’s Zamboanga City Roadmap to Recovery and Reconstruction Plan, 28 resettlement areas have been established for permanent housing. About 7,000 permanent housing units for the 2013 Zamboanga siege victims are being constructed. For the Badjao housing on stilts, sanitation can also be an issue but there is a partnership between the city government and the ZCWD to address this concern. Possible Indicators of GHG Emission Sources Power usage has been increasing from 2011 to 2014. In 2011, electricity consumption was 428,406,182 kWh. This increased to 560,424,116 kWh in 2014 (refer to Figure 23). The number of power connections for residential, commercial, and public buildings is also increasing.
Figure 23. Zamboanga City Electricity Consumption (kWh)
Source: Zamboanga Socioeconomic profile in Figures 2014 Edition
Land-based transport was estimated at 84,681 units in 2014 (Figures 24 and 25). There was a decline in 2013, which may be attributed to the siege. These figures tell us that, considering a business-as-usual scenario, the number of land-based transport in the city is increasing. There are 41 gasoline service stations registered in the city as of December 2011.
2011 2012 2013 2014
Consumption (In kWh) 428,406,182 525,905,643 522,093,785 560,424,116
400,000,000420,000,000440,000,000460,000,000480,000,000500,000,000520,000,000540,000,000560,000,000580,000,000600,000,000
kWh
co
nsu
mp
tio
n

USAID Strengthening Urban Resilience for Growth with Equity (SURGE) Project Page 64 Report on the Local Capacities Toward Urban Resilience Building and Vulnerability, September 2016
Figure 24. Number of Private Vehicles in Zamboanga City
Source: Zamboanga Socioeconomic profile in Figures 2014 Edition
Figure 25. Number of Other Land-based Transport in Zamboanga City
Source: Zamboanga Socioeconomic profile in Figures 2014 Edition
For the waste sector, the city’s environment office has started initial closure activities at the Lumbangan Controlled Disposal Facility while final preparations are ongoing for the operation of the Sanitary Landfill Facility in Salaan. Complementary activities include the operation and maintenance of four material recovery facilities in the city. Based on the 2013 agriculture data, the top three crops produced in the city are coconut, palay, and corn. Agricultural processes release GHG emissions, particularly methane and nitrous oxide. There is also a significant number of hogs, goats, cattle, and carabaos in the city, accounting for livestock emissions. Hogs are the most abundant, with 80,804 registered heads in the 2013 inventory (refer to Figure 26). On the other hand, the inventory of carabaos, cattle, and goats from 2010 to 2013 is shown in Figure 27. The assessment shows that the number of goats is increasing, while carabaos and cattle register a slight decline. For the data in poultry (chicken and ducks), only 2010 and 2011 data were reported. There is a slight increase for both in a one-year period.
64,000
66,000
68,000
70,000
72,000
74,000
76,000
78,000
2011 2012 2013 2014
Private
1,000
2,000
3,000
4,000
5,000
6,000
7,000
8,000
9,000
2011 2012 2013 2014
Government
For Hire
Registered Tricycles

USAID Strengthening Urban Resilience for Growth with Equity (SURGE) Project Page 65 Report on the Local Capacities Toward Urban Resilience Building and Vulnerability, September 2016
Figure 26. Number of Hogs in Zamboanga City*
*Combined backyard and for commercial purposes
Source: Zamboanga Socioeconomic profile in Figures 2014 Edition
Figure 27. Number of Other Forms of Livestock in Zamboanga City*
*Combined backyard and for commercial purposes
Source: Zamboanga Socioeconomic profile in Figures 2014 Edition
The city’s proposed watershed area occupies 22.6 percent of land use, followed by agricultural area with19.3 percent and inland protected area at 14.4 percent. The city has 142,089 hectares of forest land, based on the city’s 2014 socioeconomic profile. From this, the city can determine the role of forests in carbon sequestration. Analysis of Planning Documents In terms of physical and spatial planning, the city is currently updating its CLUP, CDP, and ZO to cover the period of 2016 to 2025. The city has already completed its LCCAP and DRRMP in 2012. The 15-year LCCAP covers 2016 to 2030 and is subject to regular review and updating. Both the LCCAP and DRRMP, however, have been completed. The LCCAP includes a perception-based vulnerability assessment while the DRRMP utilized scientific maps to locate hazard-prone areas. It is important that these outputs are integrated into the land use plan. The
0
20,000
40,000
60,000
80,000
100,000
120,000
140,000
2010 2011 2012 2013
Hog
0
2,000
4,000
6,000
8,000
10,000
12,000
14,000
2010 2011 2012 2013
Carabao
Cattle
Goats
USAID Strengthening Urban Resilience for Growth with Equity (SURGE) Project Page 66 Report on the Local Capacities Toward Urban Resilience Building and Vulnerability, September 2016
CLUP updating can further be enhanced by conducting a more science-based vulnerability assessment. Regarding urban systems, problems on water and sanitation are critical concerns, particularly when observed through the lens of climate projections in the city such as the increase in temperature. The city also needs to prepare for more intense rainfall, which can exacerbate flooding. In relation to water, the city also needs to conduct in-depth studies on its watersheds with the DENR and academic institutions. Through detailed watershed profiling, the city may be able to identify appropriate strategies to preserve and conserve its water sources. At present, Zamboanga City has no GHG inventory in place. It has, however, indicated in its LCCAP that the city will “promote and support policies on climate-friendly industries and services toward the reduction of GHG emissions.” It is recommended that the city conducts a baseline GHG inventory in order to measure its emissions and eventually formulate a GHG management plan. Even without a baseline inventory, a review of secondary documents indicates that sources of GHG emissions are increasing over time. Documents reviewed included the city’s 2014 annual report as well as its socioeconomic profile.
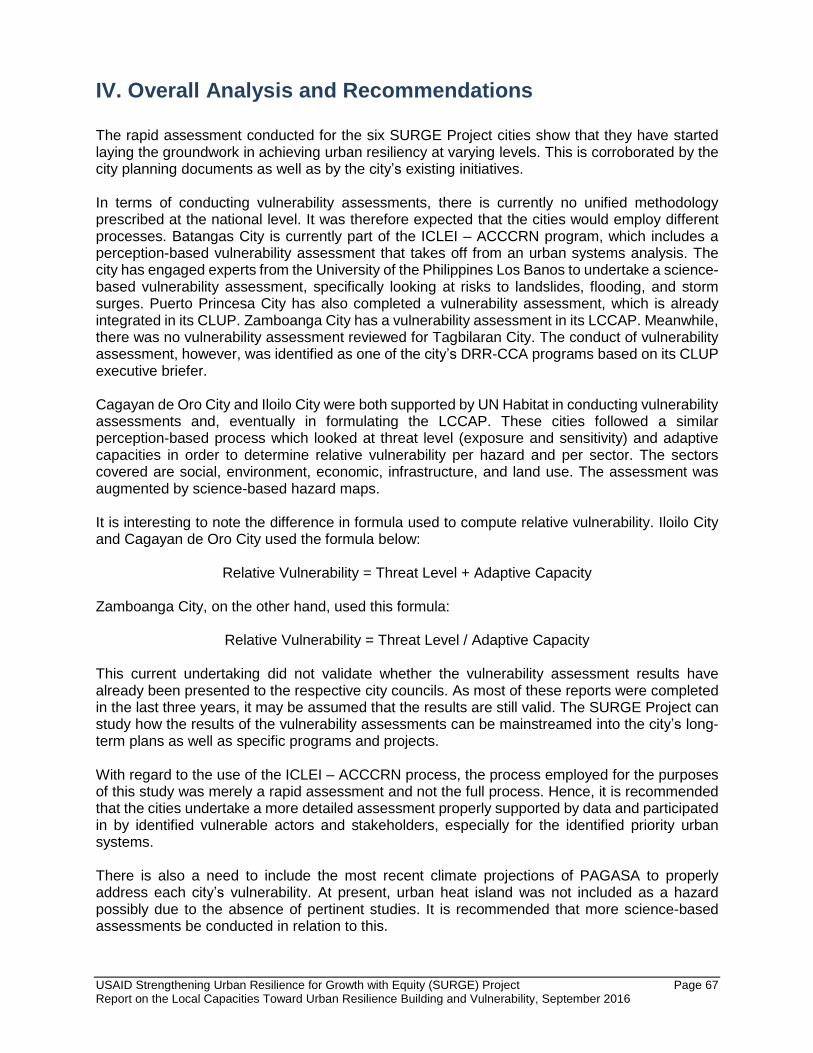
USAID Strengthening Urban Resilience for Growth with Equity (SURGE) Project Page 67 Report on the Local Capacities Toward Urban Resilience Building and Vulnerability, September 2016
IV. Overall Analysis and Recommendations The rapid assessment conducted for the six SURGE Project cities show that they have started laying the groundwork in achieving urban resiliency at varying levels. This is corroborated by the city planning documents as well as by the city’s existing initiatives. In terms of conducting vulnerability assessments, there is currently no unified methodology prescribed at the national level. It was therefore expected that the cities would employ different processes. Batangas City is currently part of the ICLEI – ACCCRN program, which includes a perception-based vulnerability assessment that takes off from an urban systems analysis. The city has engaged experts from the University of the Philippines Los Banos to undertake a science-based vulnerability assessment, specifically looking at risks to landslides, flooding, and storm surges. Puerto Princesa City has also completed a vulnerability assessment, which is already integrated in its CLUP. Zamboanga City has a vulnerability assessment in its LCCAP. Meanwhile, there was no vulnerability assessment reviewed for Tagbilaran City. The conduct of vulnerability assessment, however, was identified as one of the city’s DRR-CCA programs based on its CLUP executive briefer. Cagayan de Oro City and Iloilo City were both supported by UN Habitat in conducting vulnerability assessments and, eventually in formulating the LCCAP. These cities followed a similar perception-based process which looked at threat level (exposure and sensitivity) and adaptive capacities in order to determine relative vulnerability per hazard and per sector. The sectors covered are social, environment, economic, infrastructure, and land use. The assessment was augmented by science-based hazard maps. It is interesting to note the difference in formula used to compute relative vulnerability. Iloilo City and Cagayan de Oro City used the formula below:
Relative Vulnerability = Threat Level + Adaptive Capacity Zamboanga City, on the other hand, used this formula:
Relative Vulnerability = Threat Level / Adaptive Capacity This current undertaking did not validate whether the vulnerability assessment results have already been presented to the respective city councils. As most of these reports were completed in the last three years, it may be assumed that the results are still valid. The SURGE Project can study how the results of the vulnerability assessments can be mainstreamed into the city’s long-term plans as well as specific programs and projects. With regard to the use of the ICLEI – ACCCRN process, the process employed for the purposes of this study was merely a rapid assessment and not the full process. Hence, it is recommended that the cities undertake a more detailed assessment properly supported by data and participated in by identified vulnerable actors and stakeholders, especially for the identified priority urban systems. There is also a need to include the most recent climate projections of PAGASA to properly address each city’s vulnerability. At present, urban heat island was not included as a hazard possibly due to the absence of pertinent studies. It is recommended that more science-based assessments be conducted in relation to this.
USAID Strengthening Urban Resilience for Growth with Equity (SURGE) Project Page 68 Report on the Local Capacities Toward Urban Resilience Building and Vulnerability, September 2016
With regard to the conduct of GHG inventories, Batangas City and Iloilo City were both supported by USAID in establishing their first city-wide GHG emissions inventory and thereafter formulating a GHG Management Plan. Puerto Princesa City has also previously completed a GHG inventory, which enabled the city to be declared as a carbon-neutral city. This was primarily due to the significant presence of forest land, which sequesters carbon dioxide. The three remaining cities all expressed interest in conducting a GHG inventory. A review of existing secondary documents showed that potential GHG emission sources in the three other cities are also increasing – an expected trend for urbanizing cities. The emerging priority urban systems of the six SURGE cities are shown in Table 21. There are five urban systems identified as priority by more than three SURGE cities (i.e., greater than 50 percent). These include agriculture, energy, settlements, transportation, and water. Water is a priority system for the six cities. Agriculture, energy, and transportation are prioritized by five of the six cities. Settlements is prioritized by four cities. Table 21. Emerging Priority Urban Systems of the Six SURGE Project Cities
Urban System Batangas
City Puerto
Princesa City
Iloilo City Tagbilaran City
Cagayan de Oro
City
Zamboanga City
Agriculture* ✓ ✓ ✓ ✓ ✓
Drainage/Infra ✓ Ecosystems ✓ ✓ ✓ Energy ✓ ✓ ✓ ✓ ✓ Health ✓
Human Security ✓ Sanitation ✓ ✓ Settlements ✓ ✓ ✓ ✓ Transportation** ✓ ✓ ✓ ✓ ✓ Water*** ✓ ✓ ✓ ✓ ✓ ✓
* Agriculture, in this context, is used broadly to cover food, fisheries, and livestock. ** During the assessment, transportation covers both status of vehicles and supporting infrastructure (e.g., roads and bridges). *** Water is discussed using different parameters including supply, demand, and quality.
In terms of adaptive capacities assessment for urban system, only four cities were able to complete this exercise as the decision to include the ACCCRN toolkit was made only after processing the workshop results from Tagbilaran City and Zamboanga City. While this assessment is not intended to compare the adaptive capacities of each city per urban system, processing the ratings of all cities per urban system can show commonalities across perceived strengths (those with high adaptive capacities) and weaknesses of each urban system. For the water system, weaknesses are mostly perceived in terms of societal and ecosystem services, specifically in Cagayan de Oro City and Iloilo City as indicated in Figure 28. Low ratings under societal adaptive capacities can mean that citizen engagement with regard to problems concerning the water system tend to be low. On the other hand, low adaptive capacities on ecosystem services can imply that studies concerning the linkages of the water system to ecosystem services may be limited.

USAID Strengthening Urban Resilience for Growth with Equity (SURGE) Project Page 69 Report on the Local Capacities Toward Urban Resilience Building and Vulnerability, September 2016
Figure 28. Perceived Adaptive Capacities of Water System
All SURGE Project cities, except Iloilo City, have medium adaptive capacities for the agriculture system as shown in Figure 29. Participants for Iloilo City gave a rating of low adaptive capacities in three out of five parameters, namely, technology, societal, and ecosystem services. Considering the problems in relation to agricultural land conversion raised by the city as indicated in its planning documents and revalidated during the FGD, there is a huge potential for the SURGE Project to further study the agriculture sector and how it can affect the city’s overall development trajectory. Figure 29. Perceived Adaptive Capacities of Agriculture System
The transportation system was also mostly rated with medium to high adaptive capacities by all cities, as shown in Figure 30. Batangas City, however, rated transportation with low adaptive capacities in terms of economic and technological adaptive capacities. Further transport studies can be commissioned by the SURGE Project for Batangas City.
0 1 2 3
Economic
Technology
Governance
Societal
Ecosystem Services
Adaptive Capacities: Water
Cagayan de Oro Iloilo Puerto Princesa Batangas
0 1 2 3
Economic
Technology
Governance
Societal
Ecosystem Services
Adaptive Capacities: Agriculture
Cagayan de Oro Iloilo Puerto Princesa Batangas
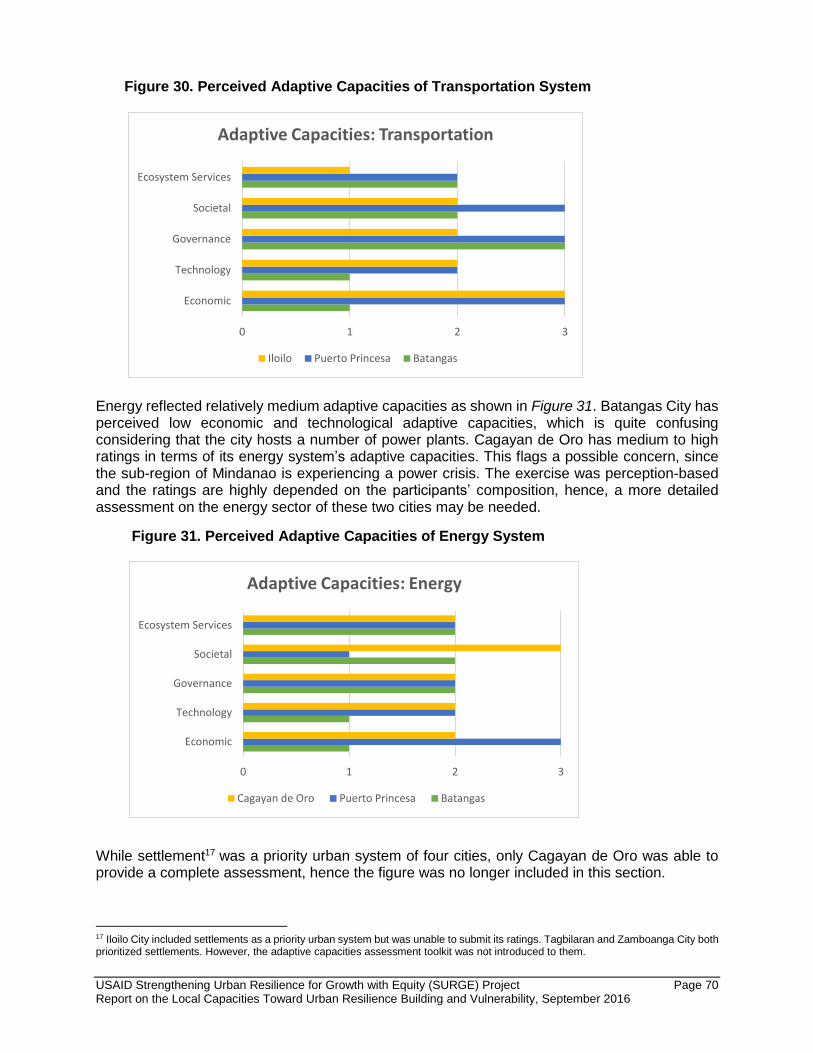
USAID Strengthening Urban Resilience for Growth with Equity (SURGE) Project Page 70 Report on the Local Capacities Toward Urban Resilience Building and Vulnerability, September 2016
Figure 30. Perceived Adaptive Capacities of Transportation System
Energy reflected relatively medium adaptive capacities as shown in Figure 31. Batangas City has perceived low economic and technological adaptive capacities, which is quite confusing considering that the city hosts a number of power plants. Cagayan de Oro has medium to high ratings in terms of its energy system’s adaptive capacities. This flags a possible concern, since the sub-region of Mindanao is experiencing a power crisis. The exercise was perception-based and the ratings are highly depended on the participants’ composition, hence, a more detailed assessment on the energy sector of these two cities may be needed.
Figure 31. Perceived Adaptive Capacities of Energy System
While settlement17 was a priority urban system of four cities, only Cagayan de Oro was able to provide a complete assessment, hence the figure was no longer included in this section.
17 Iloilo City included settlements as a priority urban system but was unable to submit its ratings. Tagbilaran and Zamboanga City both prioritized settlements. However, the adaptive capacities assessment toolkit was not introduced to them.
0 1 2 3
Economic
Technology
Governance
Societal
Ecosystem Services
Adaptive Capacities: Transportation
Iloilo Puerto Princesa Batangas
0 1 2 3
Economic
Technology
Governance
Societal
Ecosystem Services
Adaptive Capacities: Energy
Cagayan de Oro Puerto Princesa Batangas
USAID Strengthening Urban Resilience for Growth with Equity (SURGE) Project Page 71 Report on the Local Capacities Toward Urban Resilience Building and Vulnerability, September 2016
It is also recommended that an exercise on adaptive capacities assessment with regard to key urban actors be conducted in the cities of Tagbilaran and Zamboanga. This is necessary to validate this assessment and sort out certain inconsistencies. In terms of sectoral urban system issues, it must be noted that water, energy, and transportation are shared urban systems. This means that the responsibility and management for these systems are not solely within the purview of the city government. There is therefore a need for enhanced partnerships and collaborations with relevant actors to address the issues identified in these sectors. It has been observed, however, that planning processes and implementation in the six cities still tend to be done in silos. There is a pressing need for integration within the city government’s various offices and departments, and between the cities and neighboring municipalities as well as with the national government.
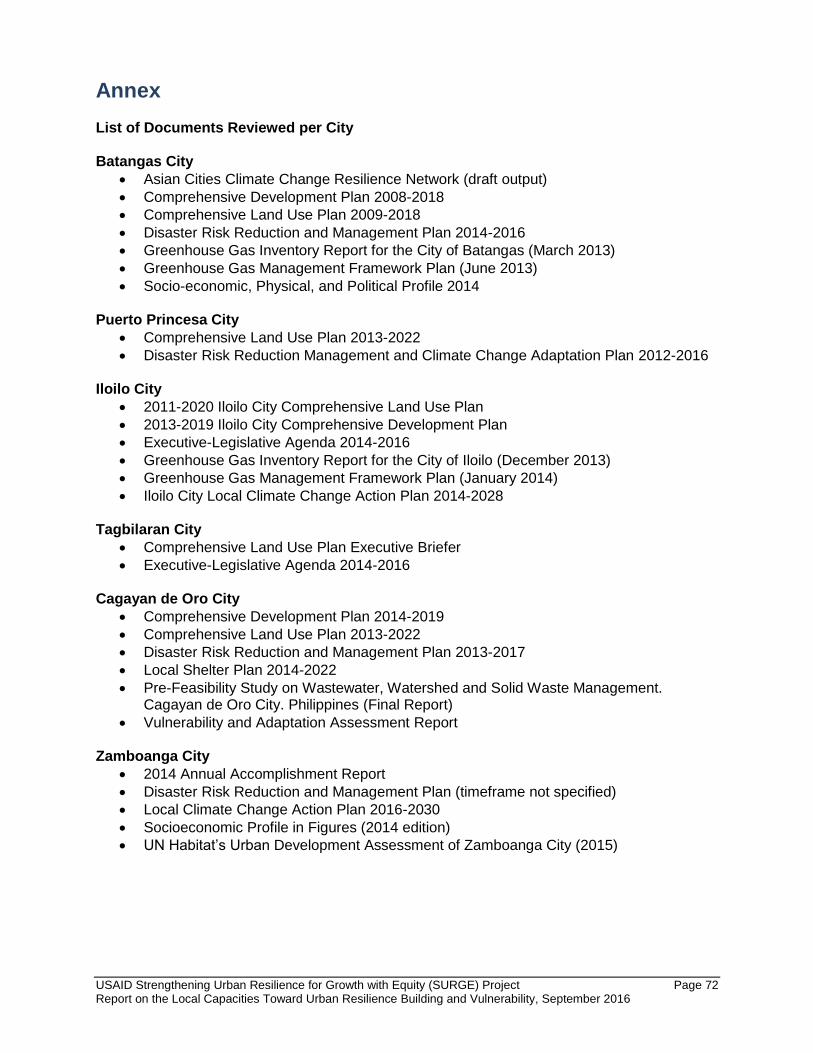
USAID Strengthening Urban Resilience for Growth with Equity (SURGE) Project Page 72 Report on the Local Capacities Toward Urban Resilience Building and Vulnerability, September 2016
Annex List of Documents Reviewed per City Batangas City
• Asian Cities Climate Change Resilience Network (draft output)
• Comprehensive Development Plan 2008-2018
• Comprehensive Land Use Plan 2009-2018
• Disaster Risk Reduction and Management Plan 2014-2016
• Greenhouse Gas Inventory Report for the City of Batangas (March 2013)
• Greenhouse Gas Management Framework Plan (June 2013)
• Socio-economic, Physical, and Political Profile 2014 Puerto Princesa City
• Comprehensive Land Use Plan 2013-2022
• Disaster Risk Reduction Management and Climate Change Adaptation Plan 2012-2016 Iloilo City
• 2011-2020 Iloilo City Comprehensive Land Use Plan
• 2013-2019 Iloilo City Comprehensive Development Plan
• Executive-Legislative Agenda 2014-2016
• Greenhouse Gas Inventory Report for the City of Iloilo (December 2013)
• Greenhouse Gas Management Framework Plan (January 2014)
• Iloilo City Local Climate Change Action Plan 2014-2028 Tagbilaran City
• Comprehensive Land Use Plan Executive Briefer
• Executive-Legislative Agenda 2014-2016 Cagayan de Oro City
• Comprehensive Development Plan 2014-2019
• Comprehensive Land Use Plan 2013-2022
• Disaster Risk Reduction and Management Plan 2013-2017
• Local Shelter Plan 2014-2022
• Pre-Feasibility Study on Wastewater, Watershed and Solid Waste Management. Cagayan de Oro City. Philippines (Final Report)
• Vulnerability and Adaptation Assessment Report Zamboanga City
• 2014 Annual Accomplishment Report
• Disaster Risk Reduction and Management Plan (timeframe not specified)
• Local Climate Change Action Plan 2016-2030
• Socioeconomic Profile in Figures (2014 edition)
• UN Habitat’s Urban Development Assessment of Zamboanga City (2015)