
Security Risk Management - York University · Security Risk Management . Risk Assessment:...
37
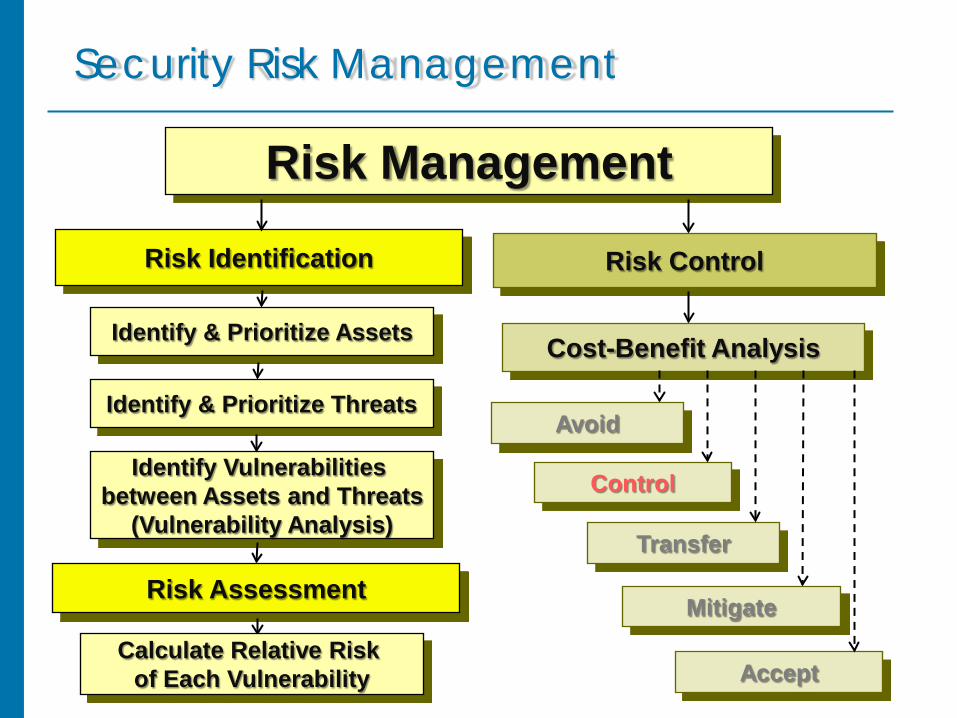
Security Risk Management Risk Management Risk Identification Risk Control Identify & Prioritize Assets Control Transfer Avoid Accept Cost-Benefit Analysis Identify & Prioritize Threats Identify Vulnerabilities between Assets and Threats (Vulnerability Analysis) Risk Assessment Calculate Relative Risk of Each Vulnerability Mitigate
Transcript of Security Risk Management - York University · Security Risk Management . Risk Assessment:...
Security Risk Management
Risk Management
Risk Identification Risk Control
Identify & Prioritize Assets
Control
Transfer
Avoid
Accept
Cost-Benefit Analysis
Identify & Prioritize Threats
Identify Vulnerabilities between Assets and Threats
(Vulnerability Analysis)
Risk Assessment
Calculate Relative Risk of Each Vulnerability
Mitigate
Security Risk Management
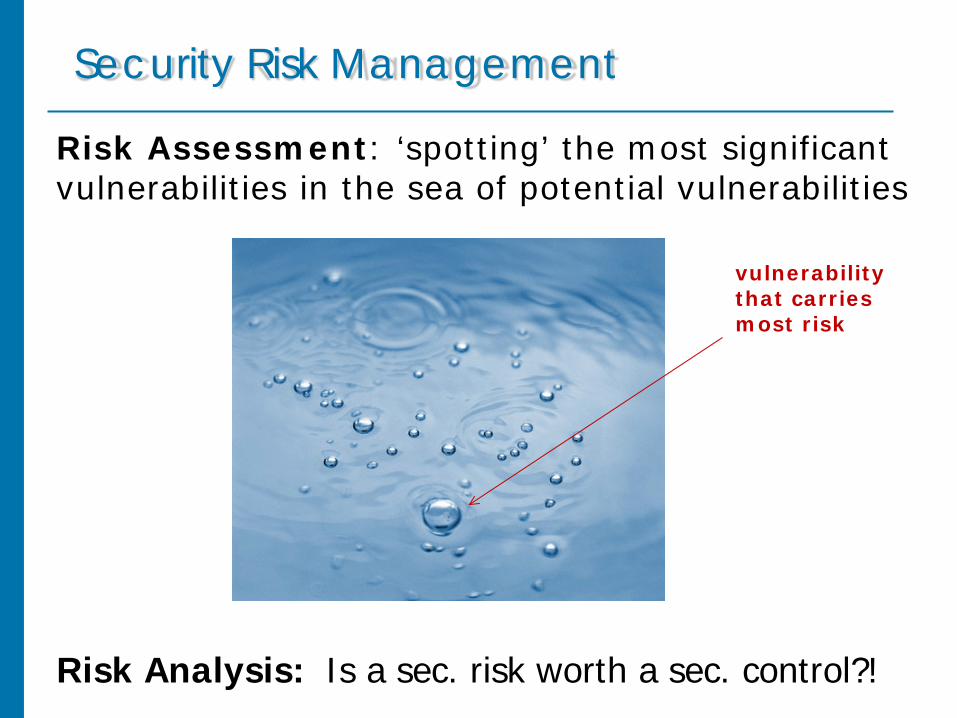
Risk Assessment: ‘spotting’ the most significant vulnerabilities in the sea of potential vulnerabilities
vulnerability that carries most risk
Risk Analysis: Is a sec. risk worth a sec. control?!
Quantitative, Qualitative,
Relative Risk Analysis

Qualitative vs. Quantitative Analysis
• Quantitative Risk – predicts level of monetary loss for each threat, and monetary benefit of controlling the treat
each element is quantified and entered into equations, e.g.:
asset value
threat frequency
severity of vulnerability
damage impact
safeguard cost …
Analysis
• Qualitative Risk – scenario based approach - uses labels & relative values (high/low) rather than numbers; blends in experience & personal judgment
Analysis

Qualitative vs. Quantitative Analysis
Quantitative Analysis Qualitative Analysis
• Easier to automate and evaluate.
• Very useful in performance tracking - provide credible cost/benefit analysis.
• Complex calculations – may not be understood by all.
• Very detailed information about environment need to be gathered.
• Requires simple (or no) calculations.
• Considers hands-on opinions of individuals who know the process best.
• Assessment and results are subjective.
• Does not enable dollar cost/benefit discussion.
• Difficult to track performance.
pros
cons

Qualitative vs. Quantitative Analysis
“Quantitative risk measurement is the standard way of measuring risk in many fields, such as finance and insurance, but it is not commonly used to measure risk in information systems. Two of the reasons claimed for this are: 1) the difficulties in identifying and assigning a value to assets, and 2) the lack of statistical information that would make it possible to determine frequency. Thus, most of the risk assessment tools that are used today for information systems are measurements of qualitative risk.”
http://www.sans.org/reading_room/whitepapers/auditing/ introduction-information-system-risk-management_1204

Qualitative Analysis • Challenges of – define likelihood and impact values in a manner that would allow the same scale to be used across multiple risk assessments
Qualitative Analysis
Example: Sample ‘likelihood of threat’ definitions
Other possibilities: 1) uniform distribution – same % at/for all levels 2) 5 levels of likelihood: very low, low, moderate, very high, high

Qualitative Analysis (cont.)
Example: Sample ‘impact’ definitions
Example: Sample ‘risk determination’ matrix
http://www.sans.org/reading_room/whitepapers/auditing/introduction-information-system-risk-management_1204
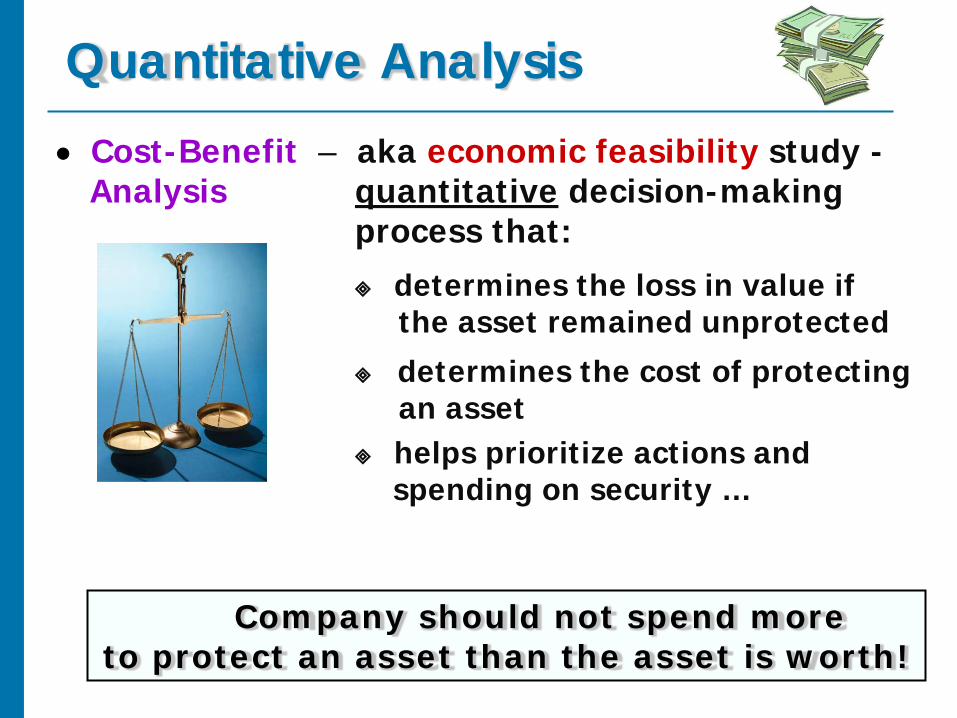
Quantitative Analysis • Cost-Benefit – aka economic feasibility study - quantitative decision-making process that:
determines the loss in value if the asset remained unprotected
determines the cost of protecting an asset
helps prioritize actions and spending on security …
Analysis
Company should not spend more to protect an asset than the asset is worth!

Quantitative Analysis (cont.)
• Asset Value (AV) – includes the following:
cost of buying/developing hardware, software, service
cost of installing, maintaining, upgrading hardware, software, service
cost to train and re-train personnel
• Exposure – percentage loss that would occur from a given vulnerability being exploited by a given threat
Factor (EF)

Quantitative Analysis (cont.)
• Single Loss – most likely loss (in value) from an attack
Expectancy (SLE)
SLE = AV * EF
Example: A Web-site’s SLE due to a DDoS Attack
Estimated value of a Web-site: AV = $ 1,000,000.
A DDoS on the site would result in 10% losses of the site value (EF=0.1).
SLE for the site: AV * EF = $ 100,000. Would it be worth investing in anti-DDoS system that costs $100,000 a year?

Quantitative Analysis (cont.)
• Annualized Rate – indicates how often an attack is expected to successfully occur in a year
if an attack occurs once every 2 years ⇒ ARO = 0.5
of Occurrence (ARO)
• Annualized Loss – overall loss incurred by an attack (i.e. by exploiting a vulnerability) in each year
Expectancy (ALE)
ALE = ARO * SLE

Quantitative Analysis (cont.)
Example: Determining ARO, SLE, ALE
http://www.pearsonhighered.com/assets/hip/us/hip_us_pearsonhighered/ samplechapter/078973446X.pdf
Example: Determining ALE to Occur from Risks http://www.windowsecurity.com/articles/Risk_Assessment_and_Threat_Identification.html
A widget manufacturer has installed new network servers, changing its network from P2P, to client/server-based network.
The network consists of 200 users who make an average of $20 an hour, working on 100 workstations.
Previously, none of the workstations involved in the network had an anti-virus software installed on the machines. This was because there was no connection to the Internet and the workstations did not have USB/disk drives or Internet connectivity, so the risk of viruses was deemed minimal.
One of the new servers provides a broadband connection to the Internet, which employees can now use to send and receive email, and surf the Internet.
Quantitative Analysis (cont.)

Quantitative Analysis (cont.) Example: Determining ALE to Occur from Risks (cont.)
One of the managers read in a trade magazine that other widget companies have reported an annual 75% chance of viruses infecting their network after installing T1 lines, and it may take up to 3 hours to restore the system.
A vendor will sell licensed copies of antivirus software for all servers and the 100 workstations at a cost of $4,700 per year. The company has asked you to determine the annual loss that can be expected from viruses, and determine if it is beneficial in terms of cost to purchase licensed copies of anti-virus software.
• 200 employees • 100 workstations • $20 hour

Quantitative Analysis (cont.) Example: Determining ALE to Occur from Risks (cont.) Based on the provided data: ARO = 0.8 SLE = 200 user * ($ 20 / user-hour) * 3 hours = $ 12,000 ALE = SLE * ARO = $ 9,000 Because the ALE is $9,000, and the cost of the software that will minimize this risk is $4,700 per year, this means the company would save $4,300 per year by purchasing the software ($9,000 - $4,700 = $4,300).

Quantitative Analysis (cont.)
• Cost-Benefit Analysis – expresses cost benefit of a safeguard – i.e., determines whether a particular control is worth its cost
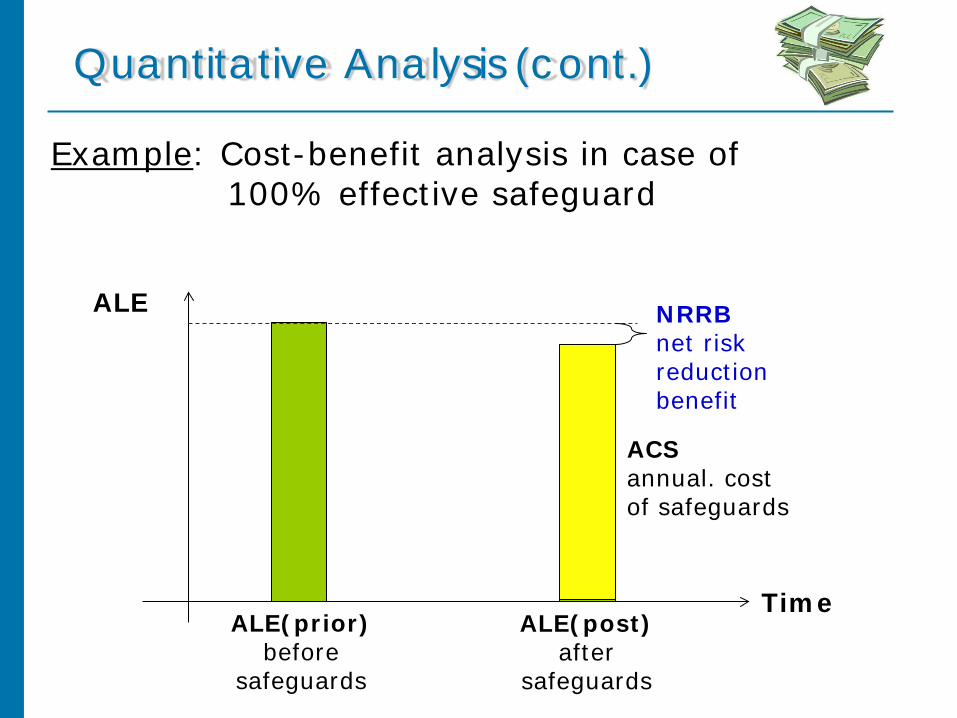
ALE(prior) – ALE before implementing control
ALE(post) – ALE after implementing control
ACS – annual cost of safeguard
Formula
NRRB = [ALE(prior) - ALE(post)] – ACS
GROSS risk reduction benefit
NET risk reduction benefit

Quantitative Analysis (cont.)
Example: Cost-Benefit Analysis
Time
ALE
ALE(prior) before
safeguards
GRRB gross risk reduction
benefit
ALE(post) after
safeguards
ACS annual. cost of safeguards
NRRB net risk reduction benefit
Only NRRB>0 justifies the use of safeguard(s)!

Example: Determining NRRB Your organization has decide to centralize anti-virus support on a server which automatically updates virus signatures on user’s PCs .
When calculating risk due to viruses, the annualized loss expect. (ALE) is $145,000. The cost of this anti-virus countermeasure in a year is estimated to be $24,000, but it will lower the ALE to $65,000.
Is this a cost-effective countermeasure? Why or why not?
ALE (prior) = $145 k ALE (post) = $65 k ACS = $24 k NRRB = ALE (prior) – ALE (post) – ACS = $145 k - $65 k - $24 k = $56 k, so there are positive benefits of this solution
Quantitative Analysis (cont.)

Quantitative Analysis (cont.)
Example: Cert. Info. Sys. Sec. Prof. (CISSP) Exam
ALE (prior) = AV*EF*ARO = $106 *0.1*0.2 = $20,000
ALE (post) = $0 (best case scenario - safeguard 100% eff.)
ACS = ?
For NRRB ≥ 0, safeguard of up to $20,000 acceptable.
Time
ALE
ALE(prior) before
safeguards
ALE(post) after
safeguards
ACS annual. cost of safeguards
NRRB net risk reduction benefit
Quantitative Analysis (cont.)
Example: Cost-benefit analysis in case of 100% effective safeguard

Other Feasibility Measures • Cost-benefit analysis determines whether a security control measure is feasible economically.
• Other ‘measures of feasibility’, when evaluating a security control, include:
• Organizational – examines how well a proposed security control will contribute to organization’s strategic objectives
e.g. a firewall might be a good security safeguard, but may prevent effective flow of multimedia data
Feasibility
Other Feasibility Measures (cont.)
• Behavioral – examines user’s and management’s acceptance and support of a proposed security control
e.g. if users do not accept a new policy / technology / program, it will inevitably fail
most common methods for obtaining user acceptance are:
communication – affected parties must know the purpose and benefits of the proposed change
education – affected parties must be educated on how to work under the new constraints
involvement – affected parties must be given a chance to express what they want and what they will tolerate from the system
Feasibility

Other Feasibility Measures (cont.)
• Technical – determine whether organization has or can acquire technology and/or necessary technical expertise to implement and support a control
e.g. a firewall may require special software hardware support / installation on all computers
Feasibility
• Political – determines what can and cannot be done based on consensus and relationships between different departments …
IT and Info. Sec. department might have to compete for same resources
Feasibility

Relative Analysis • Rather than using quantitative or qualitative risk analysis measures, an organization may resort to relative risk analysis of a control, including:
• Benchmarking – study practices used in other organizations that obtain results you would like to duplicate
• Due Care or – implement a minimum level of security
failure to maintain a standard of due care can open an organization to legal liability – especially important if dealing with customer data
Due Diligence

Relative Assessment (cont.)
• Best Practices – implement entire set of security controls as recommended for your industry / general public
‘best practices’ according to Microsoft:
use antivirus software
use strong passwords
verify your software security setting
update product security
build personal firewalls
back up early and often
protect against power surges and losses
• Gold Standard – implement controls beyond best practices – for those that strive to be ‘the best of the best’

Risk Assessment Methodologies • Risk Assessment – set of procedures & activities that structure risk assessment process
each methodology may be suitable (only) for certain situations and industries
because of various needs and various situations, a variety of risk assessment methodologies (tools) have been developed:
OCTAVE
FAIR
Microsoft Risk Management Approach
ISO Standard for Sec. Risk Management
Methodology
Risk Assessment Methodologies (cont.)
• OCTAVE – Operationally Critical Threat, Asset, and Vulnerability Evaluation - developed by a research team from Carnegie Mellon
suite of tools, techniques and methods
uses a 3-phase approach to assemble a comprehensive picture of information security needs of an enterprise
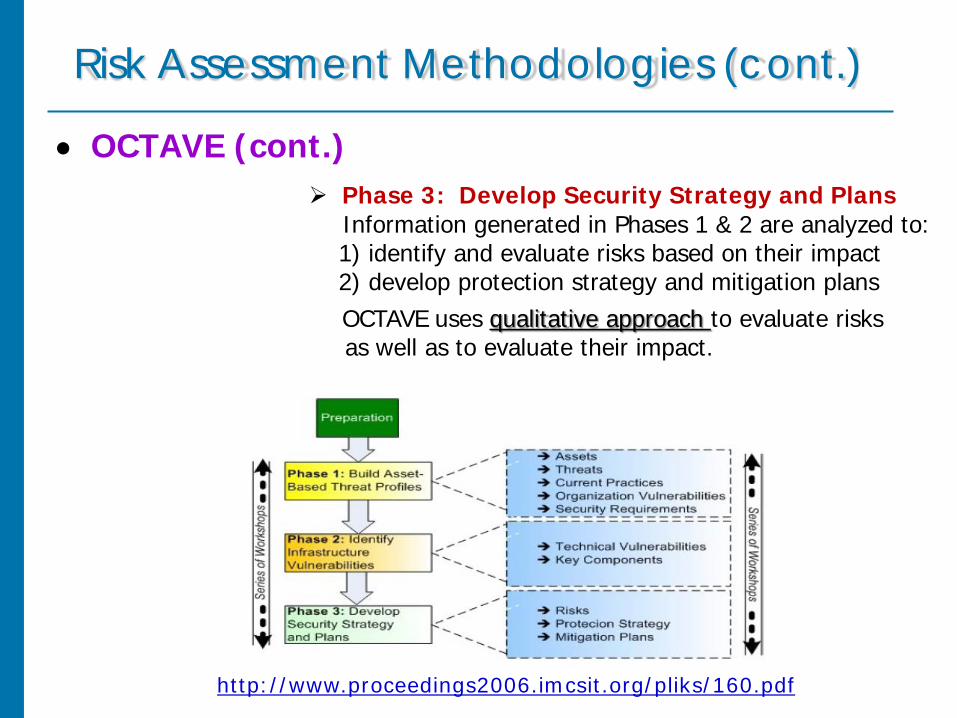
Phase 1: Build Asset-Based Threat Profile Key areas of expertise within organization are examined, through a set of workshops with staff, to identify:
* important information assets
* threats to those assets
* security requirements of assets
* current protection strategies
* weaknesses in organizational policies and practice

Risk Assessment Methodologies (cont.)
• OCTAVE (cont.)
Phase 2: Identify Infrastructure Vulnerabilities Key operational components of IT infrastructure are examined for technical vulnerabilities.
Possible types of vulnerabilities:
* design vulnerabilities
* implementation vulnerability
* configuration vulnerability
Tools that can be used during this phase:
* file integrity checkers
* virus scanners
* system scanners
* network scanners / mappers
Network/system should assessed from outside enterprise, inside enterprise, and from individual subsystems within enterprise
Risk Assessment Methodologies (cont.)
• OCTAVE (cont.)
Phase 3: Develop Security Strategy and Plans Information generated in Phases 1 & 2 are analyzed to: 1) identify and evaluate risks based on their impact 2) develop protection strategy and mitigation plans
OCTAVE uses qualitative approach to evaluate risks as well as to evaluate their impact.
http://www.proceedings2006.imcsit.org/pliks/160.pdf

• OCTAVE (cont.)
Characteristics of OCTAVE:
Self-directed. A small team of organization’s personnel (analyst team) manages the process and analyzes all information.
Multidisciplinary Analyst Team. OCTAVE requires that analyst team comprises representatives from both the mission-related and IT areas of organization.
Workshop-Based Approach. Workshop-based approach for gathering information and making decisions is used. Analyst team members are primary workshop facilitators.
Catalogs of Information. In all three phases, OCTAVE benchmarks organization against catalogs of information: catalog of practices, threat profile, catalog of vulnerabilities.
Risk Assessment Methodologies (cont.)

Risk Assessment Methodologies (cont.)
• FAIR – Factor Analysis of Information Risk, by J. Jones
framework that aims to help organizations understand, analyze & measure information risk (the why and the how)
key components of FAIR framework:
Taxonomy of factors that make up information risk. (provides precise def. of asset, threat, vulnerability, risk)
Methods for measuring factors that derive info. risk. (measures of threat event frequency, vulnerability, loss)
Computational model for math. calculation of risk.
Simulation model that combines the above to build and analyze risk scenarios of any size or complexity.
can be used to strengthen risk analysis processes like OCTAVE

Risk Assessment Methodologies (cont.)
• FAIR Analysis Steps:
Identify Scenario Components
1. identify the asset in risk 2. identify the threat to community under consideration
Evaluate Loss Event Frequency (LEF)
3. estimate the probable threat event frequency (TEF) 4. estimate the threat capability (TCap) 5. estimate control strength 6. derive vulnerability (Vuln) 7. derive loss event frequency (LEF)
Evaluate Probable Loss Magnitude (PLM)
8. estimate worst-case loss 9. estimate probable loss
Derive and Articulate Risk
10. derive and articulate risk
Risk Assessment Methodologies (cont.)
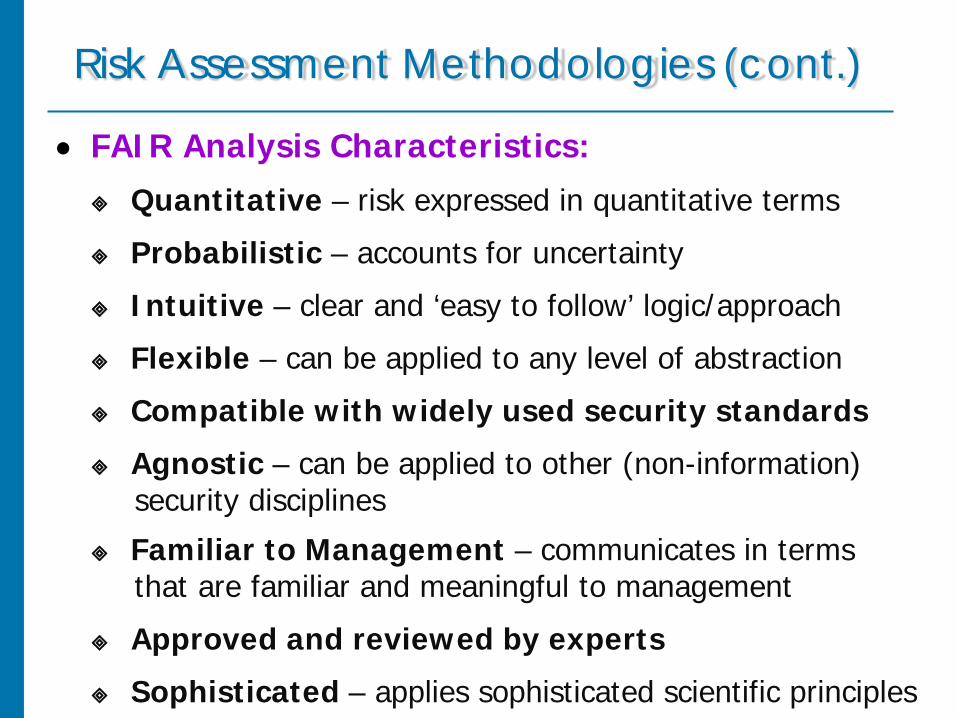
• FAIR Analysis Characteristics:
Quantitative – risk expressed in quantitative terms
Probabilistic – accounts for uncertainty
Intuitive – clear and ‘easy to follow’ logic/approach
Flexible – can be applied to any level of abstraction
Compatible with widely used security standards
Agnostic – can be applied to other (non-information) security disciplines
Familiar to Management – communicates in terms that are familiar and meaningful to management
Approved and reviewed by experts
Sophisticated – applies sophisticated scientific principles
Risk Assessment Methodologies (cont.)
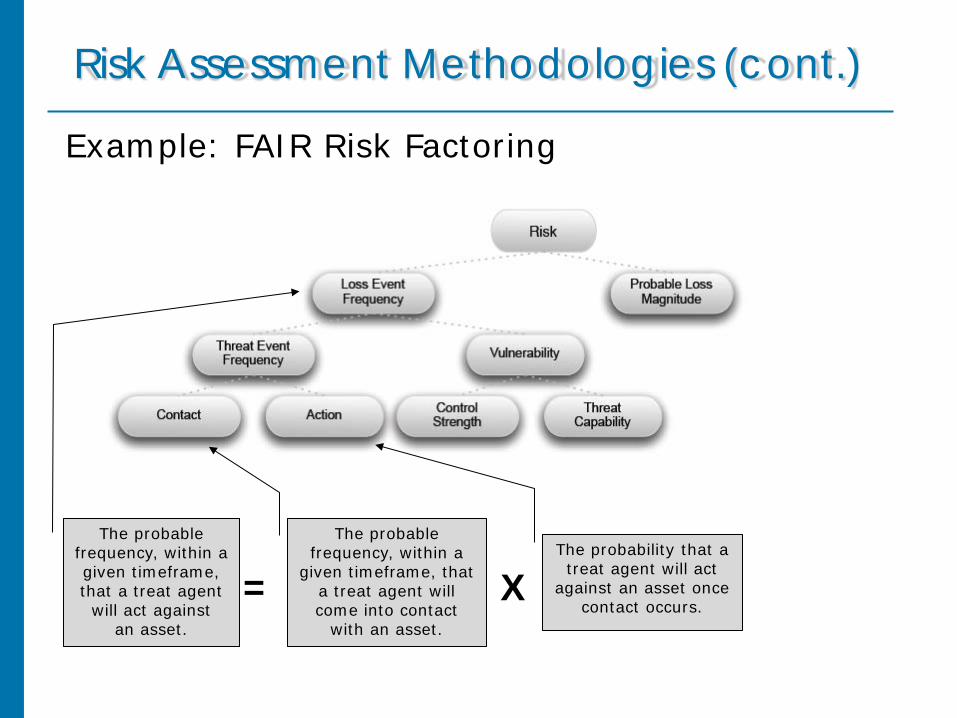
Example: FAIR Risk Factoring
The probable frequency, within a given timeframe, that a treat agent
will act against an asset.
The probable frequency, within a
given timeframe, that a treat agent will come into contact
with an asset.
The probability that a treat agent will act
against an asset once contact occurs.
= X
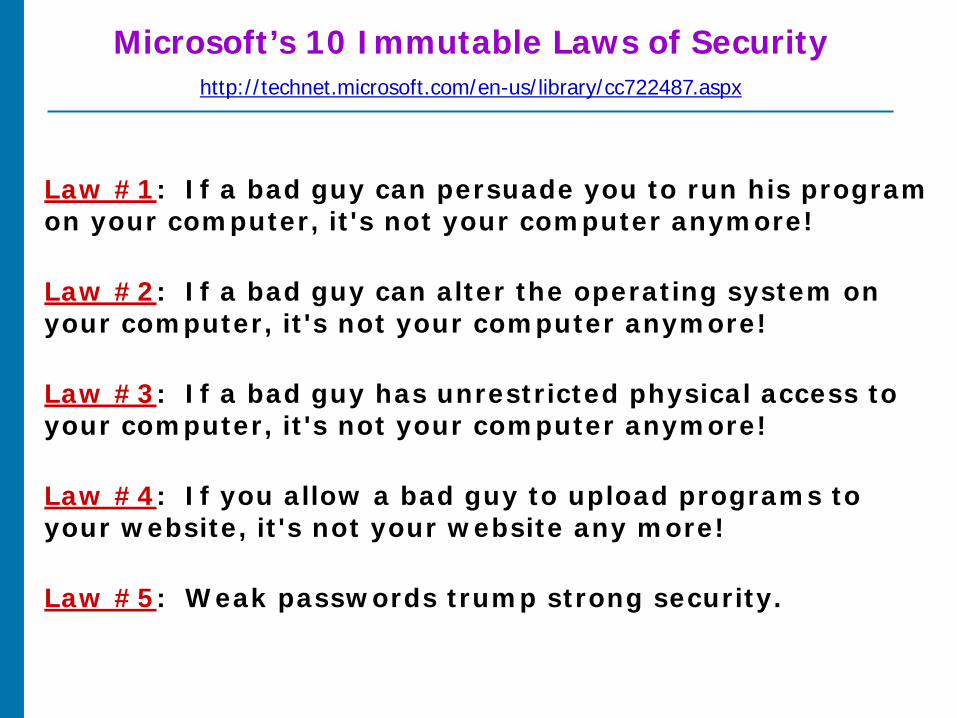
Law #1: If a bad guy can persuade you to run his program on your computer, it's not your computer anymore! Law #2: If a bad guy can alter the operating system on your computer, it's not your computer anymore! Law #3: If a bad guy has unrestricted physical access to your computer, it's not your computer anymore! Law #4: If you allow a bad guy to upload programs to your website, it's not your website any more! Law #5: Weak passwords trump strong security.
Microsoft’s 10 Immutable Laws of Security
http://technet.microsoft.com/en-us/library/cc722487.aspx

Law #6: A computer is only as secure as the administrator is trustworthy. Law #7: Encrypted data is only as secure as the decryption key. Law #8: An out of date virus scanner is only marginally better than no virus scanner at all. Law #9: Absolute anonymity isn't practical, in real life or on the Web. Law #10: Technology is not a panacea.
Microsoft’s 10 Immutable Laws of Security (cont.)


