Assessment of the Effective total quality management on...
29
IOSR Journal of Business and Management (IOSR-JBM) e-ISSN: 2278-487X, p-ISSN: 2319-7668. Volume 18, Issue 8 .Ver. IV (Aug. 2016), PP 56-84 www.iosrjournals.org DOI: 10.9790/487X-1808045684 www.iosrjournals.org 56 | Page Assessment of the Effective total quality management on performance at selective colleges in Tigray regional administrative State, Ethiopia, Gezae Hailu Fissuh a , Yemane Hailu Fissuh b , Zaid Negash c , Haftom Girmay d a Department of Management, Adigrat University, Adigrat, Tigray, Ethiopia b Department of Statistics, Beijing University of Technology, Beijing, China c Department of Management, Adigrat University, Adigrat, Tigray, Ethiopia d Department of Management, Adigrat University, Adigrat, Tigray, Ethiopia Abstract Background: This study attempted to fill a gap in the literature regarding the study of relationships among specific variables, or building blocks, associated with TQM and their use within selective TVET colleges of Tigray state particularly, the eastern zone of Tigray. The study was focused on the TQM and some measuring constructs of TQM. TQM is one of management system like QFD, Six Sigma, ISO 9001, the MBNQA, CQI, Strategic Planning, and the BSC; those are often met with skepticism among leaders of higher educations. Objective: The main aim of this study was assessment of the effective TQM on performance at selective TVET colleges in Tigray, Ethiopia and assessment of associated measuring and affecting factors. Because of time and financial limitations, the study was delimited only on the selective TVET colleges of Eastern zone of Tigray. Methods: Both qualitative and quantitative analysis was conducted passing many procedures through different sources of data. Stratified sampling was employed. Out of Total 7189, sample of 365 was selected. Binary logistic and multiple linear regressions were modeled to measure the relationship among different constructs of TQM. Results and findings: 54.9% of variability in product/service quality and 61.4% of variability in satisfaction were explained by the independent variables altogether and overall multiple regression models were statistically significant (p-value<0.001). Besides of multiple linear regressions, the Hosmer-Lemeshow goodness-of-fit test for both binary logistic regression models with HL statistic ( 8 2 = 12.001( − = 0.151) ) and ( 8 2 = 3.861( − = 0.869) ), indicated that the models are good fit to the data by rejecting 0 : the model is not fit. Conclusions: Finally, multiple linear regression models for both response variables which are the constructs of TQM showed that there are enough association among the dependent constructs of TQM and independent constructs of TQM. So, the strength of the relationship between dependent variables product/service quality and satisfaction with independent variables suggests that TQM practitioners should place more importance on leadership, continuous improvement, internal/external cooperation, employee fulfillment and customer focuses. Keywords: Total quality management, Performance, Product/service Quality, Satisfaction, Binary logistics regression, multiple linear regressions I. Introduction The most widely used quality improvement methodologies from industry are examined in the context of higher education: Quality Function Deployment (QFD), Six Sigma, ISO 9001, the Malcolm Baldrige National Quality Award, and Continuous Quality Improvement (CQI) measures such as Total Quality Management (TQM), Strategic Planning, and the Balanced Scorecard are often met with skepticism among leaders of higher education. TQM was found to have the largest number of historical applications in higher education, while QFD is gaining in popularity. Other techniques observed in industry have seen only limited use in higher education in the United States. The Academic Quality Improvement Program (AQIP), a continuous improvement technique used exclusively in higher education, highlights how higher education has adapted quality management techniques in the framework of collegiate accreditation. AQIP offers institutions of higher education a new, „continuous improvement‟ method of maintaining accreditation. Administrative traditional Patterns are no longer useful methods for higher education institutions, since the current stage of life in the world are rapidly evolving and changing, which makes the task of the Universities and Colleges in the society more difficult than before. Universities and Colleges should pursue this new development but must be preceded to the right direction for the benefit of humanity (Suleiman, 1979). To meet economic, social and cultural challenges require flexible organizational structures and an implementing trend of modern management approach characterized by flexibility, portability and the ability to take advantage of
Transcript of Assessment of the Effective total quality management on...

IOSR Journal of Business and Management (IOSR-JBM)
e-ISSN: 2278-487X, p-ISSN: 2319-7668. Volume 18, Issue 8 .Ver. IV (Aug. 2016), PP 56-84
www.iosrjournals.org
DOI: 10.9790/487X-1808045684 www.iosrjournals.org 56 | Page
Assessment of the Effective total quality management on
performance at selective colleges in Tigray regional
administrative State, Ethiopia,
Gezae Hailu Fissuha, Yemane Hailu Fissuh
b, Zaid Negash
c, Haftom Girmay
d
aDepartment of Management, Adigrat University, Adigrat, Tigray, Ethiopia
bDepartment of Statistics, Beijing University of Technology, Beijing, China
cDepartment of Management, Adigrat University, Adigrat, Tigray, Ethiopia
dDepartment of Management, Adigrat University, Adigrat, Tigray, Ethiopia
Abstract Background: This study attempted to fill a gap in the literature regarding the study of relationships among
specific variables, or building blocks, associated with TQM and their use within selective TVET colleges of
Tigray state particularly, the eastern zone of Tigray. The study was focused on the TQM and some measuring
constructs of TQM. TQM is one of management system like QFD, Six Sigma, ISO 9001, the MBNQA, CQI,
Strategic Planning, and the BSC; those are often met with skepticism among leaders of higher educations.
Objective: The main aim of this study was assessment of the effective TQM on performance at selective TVET
colleges in Tigray, Ethiopia and assessment of associated measuring and affecting factors. Because of time and
financial limitations, the study was delimited only on the selective TVET colleges of Eastern zone of Tigray.
Methods: Both qualitative and quantitative analysis was conducted passing many procedures through different
sources of data. Stratified sampling was employed. Out of Total 7189, sample of 365 was selected. Binary
logistic and multiple linear regressions were modeled to measure the relationship among different constructs of
TQM.
Results and findings: 54.9% of variability in product/service quality and 61.4% of variability in satisfaction
were explained by the independent variables altogether and overall multiple regression models were
statistically significant (p-value<0.001). Besides of multiple linear regressions, the Hosmer-Lemeshow
goodness-of-fit test for both binary logistic regression models with HL statistic (𝑋82 = 12.001(𝑃 − 𝑣𝑎𝑙𝑢𝑒 =
0.151) ) and (𝑋82 = 3.861(𝑃 − 𝑣𝑎𝑙𝑢𝑒 = 0.869) ), indicated that the models are good fit to the data by
rejecting𝐻0 : the model is not fit.
Conclusions: Finally, multiple linear regression models for both response variables which are the constructs of
TQM showed that there are enough association among the dependent constructs of TQM and independent
constructs of TQM. So, the strength of the relationship between dependent variables product/service quality and
satisfaction with independent variables suggests that TQM practitioners should place more importance on
leadership, continuous improvement, internal/external cooperation, employee fulfillment and customer focuses.
Keywords: Total quality management, Performance, Product/service Quality, Satisfaction, Binary logistics
regression, multiple linear regressions
I. Introduction The most widely used quality improvement methodologies from industry are examined in the context
of higher education: Quality Function Deployment (QFD), Six Sigma, ISO 9001, the Malcolm Baldrige
National Quality Award, and Continuous Quality Improvement (CQI) measures such as Total Quality
Management (TQM), Strategic Planning, and the Balanced Scorecard are often met with skepticism among
leaders of higher education. TQM was found to have the largest number of historical applications in higher
education, while QFD is gaining in popularity. Other techniques observed in industry have seen only limited use
in higher education in the United States. The Academic Quality Improvement Program (AQIP), a continuous
improvement technique used exclusively in higher education, highlights how higher education has adapted
quality management techniques in the framework of collegiate accreditation. AQIP offers institutions of higher
education a new, „continuous improvement‟ method of maintaining accreditation.
Administrative traditional Patterns are no longer useful methods for higher education institutions, since
the current stage of life in the world are rapidly evolving and changing, which makes the task of the Universities
and Colleges in the society more difficult than before. Universities and Colleges should pursue this new
development but must be preceded to the right direction for the benefit of humanity (Suleiman, 1979). To meet
economic, social and cultural challenges require flexible organizational structures and an implementing trend of
modern management approach characterized by flexibility, portability and the ability to take advantage of

Assessment of the Effective total quality management on performance at selective colleges in Tigray..
DOI: 10.9790/487X-1808045684 www.iosrjournals.org 57 | Page
modern culture. In order to meet these responsibilities, there are many challenges facing an institution, including
diverse demands for scarcity of material and human resources. Failure to adopt modern management techniques
by the colleges, which proved achieving the desired results, such as total quality management (TQM)
philosophy, is a case that worth making research, study and analysis to arrive at a mechanism of action enable
these institutions to adopt this modern management approach.
Generally, like many Continuous Quality Improvement (CQI) theories, Total Quality Management
(TQM) offers its users a method to understand what is happening within an organization and ways to improve
quality and efficiency.
1.1. Background of Study
The significance of education in the development of a country cannot be underestimated (Ali et al.,
2010). It is education that develops expertise, excellence and knowledge that lead to the overall enlargement of
any economy. This has created a necessity to develop the strategies for the development of Higher Education
(HE) in almost all the countries of the world (Ali et al., 2010). Thus the success of higher education institutions
(HEIs) depends on how the educational leaders work to implement the strategies (Ali et al., 2010). Thus, this
study is concerned with the private and governmental selective TVET colleges to check the TQM of the
corresponding colleges and also to compare the TQM in different colleges of private and governmental with
associated factors.
Total quality management (TQM) can be summarized as a management system for a customer/student-
focused organization that involves all employees in continual improvement. It uses strategy, data or information,
and effective communications to integrate the quality discipline into the culture and activities of the
organization.
The theory of „Total Quality Management‟ (TQM) is well adopted by educational leaders in HE sector
to achieve the aim of quality education. Universities and colleges i.e., HEIs in Ethiopia are also adopting
quality measures to improve the quality of education. Ethiopia is still young and striving to become medium
largest HE sector in the world. However, only few HEIs like private and/or governmental colleges and
Universities are striving to provide world class education therefore, Tigray is also one of the regional states of
Ethiopia trying to fulfill the requirements of Millennium goals in higher educations (HE) (Ali et al., 2010).
Hence, this paper will discuss the importance of quality in colleges‟ management and the reasons why
TQM as a theory of quality management by leadership efforts should be used in colleges for a sustainable
improvement on performance. It also will discuss how the leadership quality of management or the head of
colleges facilitate the implementation of TQM as a tool for holistic development of HEIs (Ali et al., 2010).
„Total Quality Management‟ (TQM) in HEIs has been an important agenda in many countries for the
last several years. Quality management is a necessary strategy for the development of the HEIs because higher
education develops the human resources and professionals for future. According to Ali and Shastri (2010),
World Bank recently revealed, after a study in 190 countries, that it is HE that produces quality professionals.
Therefore, HE is an investment to improve the quality of life. There is a clear link between the education and
economy.
Pandiet al. (2009) stated that, developed countries like USA, UK and Japan have already recognized
the importance of TQM in HE and adopted it successfully in their HE system. However, the management in
HEIs in developing countries like Ethiopia has not demonstrated the leadership potential which is required to
manage total quality in HEIs.
As HE has a variety of stakeholders like students, teaching and non-teaching staffs, employers,
government and its funding agencies, accreditors and auditors (Harvey and Burrows, 1992) the concept of
quality becomes very complex. Every stakeholder defines the term quality according to his or her own interest.
For example, to a student, quality in HE means its ability to provide him with proper facilities to continue the
process of advancement of knowledge. For government, it is the production of engineers, doctors, architects and
trained scientists (Singh et al., 2008). Similarly, for an industrialist quality in HE means turning out graduates
with flexible mind ready to acquire skills and adapt to new methods (Singh et al., 2008). Therefore, it becomes
important to understand what do the intellectuals understand by TQM and how do they define it. This will help
to understand the implementation of TQM in HE at government agencies level as well as universities or HEIs
level. Understanding of TQM also reveals the role of educational leaders in its implementation and opens the
way for its successful implementation.
1.2. Statement of the Problem and Research Questions
A large body of literature exists on the success or failure of TQM within the corporate world, and
regardless of how an individual views TQM; it is difficult to deny that TQM has made a significant impact on
the business world over the past 50 years. While much is written about TQM in the corporate world, far fewer
articles are devoted to the success or failure of TQM within higher education even though many colleges and

Assessment of the Effective total quality management on performance at selective colleges in Tigray..
DOI: 10.9790/487X-1808045684 www.iosrjournals.org 58 | Page
universities attempted to implement TQM or some other form of CQI within their institutions (Burkhalter,
1996).
Even though Ethiopian government is striving to improve the expansion of the higher educational
institutions like colleges and universities still there is limited works done on the quality. That may be because of
the lack of quality in management to achieve the standard TQM system.
As it is fact, the environment in which the Ethiopian colleges operate is rapidly changing. There is a
rapid enrolment expansion in colleges. The private and governmental colleges are also facing inconsistent policy
direction. Under such circumstances, the both private and governmental colleges are required to establish and
implement internal quality assurance mechanisms to safeguard and improve the standards and quality of their
education programs (Proclamation 650/2009). Therefore, in order to bring good quality in their service and
customer satisfaction the colleges must have effective TQM in their institutions. The issue of whether both
private and governmental colleges are actually implementing quality assurance mechanisms to improve quality
of their education and implementing the effective TQM, the current changing environmental context is not clear.
This fundamental research problem is further broken down into basic research questions. As this study
comprises analyses of organizational level TQM systems and practices, it deals with terms and concepts like
quality in service, satisfaction of the customers, continuous quality improvement and performance management
models and their underlying assumptions and with theories that can be used to explain how contextual factors
influence existing practices. Hence, the first research question of this study can be put as:
1. What is Total Quality Management and why should it be implemented in colleges?
2. What are the implications for TQM in selective TVET colleges in Tigray in relation to providing high
quality educational provision?
3. What is the empirical evidence of TQM being used in different context and how effective they are?
4. Are there differences among the colleges regarding TQMpractices? What are the possible explanations for
such differences?
5. What are the indicator factors for efficacy of TQM in performances in selective colleges?
1.3. Objective of the Study
1.3.1. General objective
The general aim of this study is assessment of the effective total quality management on performance at
selective colleges in Tigray regional administration and assessment of associated factors.
1.3.2. Specific objective
To identify components, associated with the use of TQM within selective colleges.
To verify the existence of TQM on performance of selective colleges in Tigray
To compare the effective implementation of TQM on performance at selective colleges.
To check the quality of the management on performance at selective colleges
1.4. Scope of the Study
This study is focused about the general aim of the assessment of the effective total quality management
on performance at selective colleges in Tigray regional administration and assessment of associated factors. The
study is delimited on the target populations of selective colleges in Tigray regional administration. Because of
time and financial constraints, the study will be delimited only on the selective colleges of Eastern zone of
Tigray regional administrative state.
1.5. Significance of Study
After the successful completion, the importance of this study will be as follows:
This research will illustrate the concept of (TQM) as a modern approach that leads to upgrade quality
performance of the Colleges as well as for compensation for the shortfall of literature and research in this topic.
This study is significant as it attempts to fill a gap in the literature regarding the study of relationships
among specific variables, or building blocks, associated with TQM and their use within selective colleges of
Tigray. Since current research exploring the effectiveness of TQM in selective colleges of Tigray is rather
sparse, it is important to undertake a quantitative study that attempts to explore these relationships. This study
can serve as a bridge between existing researches measures where TQM is used within higher educational
institutions such as colleges and Universities.
This study can also be generalized beyond the academic world into public and private business, as it is
a study of how leaders evaluate TQM concepts within their organizations. Thus, if an organization identified a
need to improve their employee or customer satisfaction, the results from this study could be used to identify
what specific components of TQM have positive relationships with the desired outcome. This would prevent a

Assessment of the Effective total quality management on performance at selective colleges in Tigray..
DOI: 10.9790/487X-1808045684 www.iosrjournals.org 59 | Page
TQM practitioner from potentially selecting the wrong components to implement and thus leading to failure in
the area they wish to improve.
1.6. Definitions of the Terms
Total Quality management (TQM): -According to the definitions ofHo and Wearn (1995, p. 25) TQM is
defined as „a way of managing to improve the effectiveness, efficiency, cohesiveness, flexibility, and
competitiveness of a business as a whole.‟ They further offered a list of principles required for successful TQM
implementation, including leadership, commitment, total customer satisfaction, continuous improvement, total
involvement, training
and education, ownership of problems, reward and recognition, error prevention and teamwork.
Customer-focused: - The customer ultimately determines the level of quality. No matter what an organization
does to foster quality improvement-training employees, integrating quality into the design process, upgrading
computers or software, or buying new measuring tools the customer determines whether the efforts were
worthwhile.
Total employee involvement: - all employees participate in working toward common goals. Total employee
commitment can only be obtained after fear has been driven from the workplace, when empowerment has
occurred, and management has provided the proper environment. High-performance work systems integrate
continuous improvement efforts with normal business operations. Self-managed work teams are one form
empowerment.
Process-centered: - A fundamental part of TQM is a focus on process thinking. A process is a series of steps
that take inputs from suppliers (internal or external). The steps required to carry out the process are defined, and
performance measures are continuously monitored in order to detect unexpected variations.
Integrated system: - Although an organization may consist of many different functional specialties often
organized into vertically structured departments, it is the horizontal processes interconnecting these functions
that are the focus of TQM.
Micro-processes add up to larger processes, and processes aggregate into the business processes
required for defining and implementing strategy. Everyone must understand the vision, mission, and guiding
principles as well as the quality policies, objectives, and critical processes of the organization. Business
performance must be monitored and communicated continuously.
An integrated business system may be modeled after Baldrige National Quality Program criteria and/or
incorporate the ISO 9000 standards. Every organization has a unique work culture, and it is virtually impossible
to achieve excellence in its products and services unless a good quality culture has been fostered. Thus, an
integrated system connects business improvement elements in an attempt to continually improve and exceed the
expectations of customers, employees, and other stakeholders.
Strategic and systematic approach: - A critical part of the management quality is the strategic and systematic
approach to achieving an organization‟s vision, mission, and goals. The process, called strategic planning or
strategic management, includes the formulation of a strategic plan that integrates quality as a core component.
Continual improvement: - A major thrust of TQM is continual process improvement. Continual improvement
drives and organization to be both analytical and creative in funding ways to become more competitive and
more effective at meeting stakeholder expectations.
Fact-based decision making: - in order to know how well an organization is performing, data on performance
measures are necessary TQM requires that an organization continually collect and analyze data in order to
improve decision making accuracy, achieve consensus, and allow prediction based on past history.
Communications: - During times of organizational change, as well as part of day-to-day operation, effective
communications play a large part in maintaining morale and in motivating employees at all levels.
Communications involve strategies, method, and timelines.
Finally, these elements mentioned above are considered so essential to TQM that many organizations define
them, in some format, as a set of core values and principles on which the organization is to operate. Source:
http://asq.org/learn-about-quality/total-quality-management/overview/overview.html

Assessment of the Effective total quality management on performance at selective colleges in Tigray..
DOI: 10.9790/487X-1808045684 www.iosrjournals.org 60 | Page
1.7. Assumptions in this study
Several assumptions will be made for this research, the first of which will be that the investigator
would receive a greater response rate through the use of a questionnaire survey, interviews, group discussions
and by reviewing the recorded files and documents than a web-based survey. This assumption was based upon
the situations and regular conditions of Ethiopian websites. Since, Ethiopian websites are not enough good to
have relevant information or data. This assumption contradicts the assumption based upon the research
conducted in 1998 by Nesbary (2000) because his assumption was web based survey is more relevant than
traditional postal delivered survey.
A second assumption will be the recipients of the survey will in a position that allowed them to
evaluate TQM within their organization. All of the respondents will assumed to be college presidents or
management bodies, employees and customers/ students, so it is assumed they will be in a position to evaluate
the use of TQM within their college (Nesbary, 2000).
A third assumption will be the variables and performance measures the survey asked selective TVET
college presidents or management bodies, employees and customers or students to give their perceptions of will
be accurate components of TQM. The surveyor believes this will be a valid assumption as these variables and
measures are based upon extensive evaluation by Anderson et al (1994) and also Grandzol and Gershon (1997,
1998). Using the Delphi technique to solicit responses from experts in the field of TQM, this previous research
established valid variables and measures of the components of TQM.
1.8. Organization of the paper
This master thesis is organized in six main chapters. Each chapter of the study addressed a specific
theme. The first chapter dealt with the background of the study, statement of the problem, research questions,
delimitations and scope of the study, hypothesis of the study, significance of the study, and definition of key
terms. The second chapter clearly described literature review. The third chapter dealt with methodology of the
study such as: proposed research design, study population, study area, data source and data collection, sample
size determination and sampling techniques, method of information gathering, study variables and proposed data
analysis are comprised under this chapter. The fourth chapter dealt with results and findings. The fifth Chapter
dealt with discussions and last chapter dealt with conclusions and recommendations.
II. Literature Review 2.1. Introduction
Management systems such as TQM, Six Sigma, and Strategic Planning are popular methods that
organizations use to improve performance. While these techniques are popular in business and manufacturing
firms, higher education has not extensively adopted these systems into their daily activities (Taylor & Karr,
1999). What makes acceptance and integration of these systems difficult is the viewpoint held by many campus
leaders that they would rather shape the future of their campus based on their individual experiences and the
experiences of those close to them (Petrides, 2003). As a result, leaders can become hesitant to embrace a
system regarded as rigid, fearing that their individual creativity can be blocked.
2.2. Definitions
Quality management in education is a vital milestone in the development of the modern and future
society. The cohesion of the requirements of students, society and university staff is the foundation of
sustainable knowledge spiral to quality education. In order to examine the problem thoroughly one should study
the motivation of the parties involved in the process (Gueorguiev, 2006).
2.3. Total Quality Management
What is ‘Total Quality Management?
Total quality management (TQM) was first introduced as a business management approach in the post-
World War II era when Deming and others successfully reinvented the Japanese economy. Beginning in the
early 1980s, American business leaders looked to the philosophy, principles, and TQM tools to improve the
economy. More recently, education leaders have begun to recognize the potential for TQM applied to
educational organizations. Quality management provides a connection between outcomes and the process by
which outcomes are achieved. If, as many people realize, the cause of failures in education is a problem in
design, quality management may be regarded as an ideal systemic process for managing change in public
education (Frazier, l997).
The concept of quality management first appeared in 1951 (Zink and Vob, 2000). Generally, the term
„Quality‟ is associated with consumer satisfaction. Customers want the best return for the money they pay to
buy something. According to Sims and Sims (1995), “Customers would examine products to see if they met
their standards prior to purchasing them”. Therefore, industries and organizations try to ensure that the products

Assessment of the Effective total quality management on performance at selective colleges in Tigray..
DOI: 10.9790/487X-1808045684 www.iosrjournals.org 61 | Page
launched or marketed by them should be well prepared to satisfy the consumers‟ need. TQM aims to manage
the quality of product and services provided by the organizations to make customers satisfied. Sims and Sims
(1995, p 1), define TQM as- TQM is the process of continuous improvement using selected tools, techniques,
and training to guide decision making and to plan actions. The results are quality processes, products, and
services, and thus high level of customer satisfaction. Thus, TQM is a holistic approach that furnishes
cognizance of the relationship between customer and supplier by the continuous efforts of improvement in all
the departments and functions of an organization (Smith et al., 1999, p.55).
TQM is not just confined to production or services. It also influences the other components like work
culture, employees, employees‟ attitude and other departments of an organization. Voehl (1994, p. 28), claims
that total quality covers three senses, first „every process‟ second „every job‟ and third „every person‟. It points
out that to ensure total quality each and every department of an organization must be responsible for the quality
of their work. Similarly, Oakland (2003, p. 15) argues that each of the components of an organization must
work properly in order to maintain quality as each part, each activity, each person related to organization affects
others and get affected by them.
2.4. Total Quality Management in Higher Education
“TQM was initially used for the measurement of quality in the HE sector in 1993” (Clayton, 1993).
Infect the concept of TQM has come to HE from the business communities. Ideally education should not be
related to business as it is to develop values and the personality of a student. HE too is to make students a
learned person and a qualified professional and eventually a good citizen. But there is a clear component of
business as HEIs charge fees from the students and hence students become selective in choosing the universities
and the course they want to study. Keeping these points in mind the significance of TQM in HE can be
discussed in two sub-headings (i) HE as a business and (ii) HE as service for human development.
i. HE as a business
Some authors believe that colleges and universities should be considered as a business because they
have to compete with other colleges and universities and their funding resources are limited hence they need to
generate money. Arjomandi (2009) claims that in twenty first century colleges and universities have to adopt
business-like strategies to cope with the increasing market competition and limited funding opportunities. That
is why implementation of quality management has become important in HE for instance, colleges. Moreover,
Warner and Palfreyman (2000) reported that HEIs are like enterprises as they collect the fees (money) in cash
which is the life blood of any enterprise. Tuition fees for students give them a chance to do business as it is a
matter of individual institution.
The colleges, therefore, need to maintain quality as they have to attract students to fulfill their funding
needs. As the students pay fees they examine not only the quality of education provided by some colleges but
also other services like student support services, student leaning resources, student communication and
representation and student assessment. In fact, they act as consumers. So it becomes important for the colleges
to assure quality by accreditation and outcome assessment. TQM might support better inputs by focusing on
students‟ achievement, good faculty members and other facilities like library and laboratory to get better output
as high quality outputs results if high quality inputs exist (Voehl, 1994, pp. 10-11).
ii. HE as a service for human development
HE, in general, is considered to encourage personal growth and social responsibilities in an individual,
in addition to his professional training and academic development. It also educates students to become civic
responsible and a citizen of global society (CEPES, 2009). HE must lead to ethical development of students
while its process of imparting education. The standard of education has its direct impact on the development of
the students‟ understandings.
Gupta (1993) recognizes „teaching‟ (transfer of knowledge) as one of the most important activities
which take place in any educational institute. According to him improvement in the quality of teaching is one of
the most important aims of any professor in HEIs. As teaching is a process of transforming knowledge it must
have quality in it because without quality the process of teaching could not achieve the desired level of
education. Though TQM is accepted as a concept in business organizations still it could be used as a tool to
achieve the goal of improving quality in teaching. Voehl‟s theory (1994, pp. 10-11) of high quality input for
high quality output is significant in this case too. If teachers are committed to develop values in students along
with their professional training TQM might support to hire teacher with dedication to develop their students as
good citizens.
In addition to teaching HE is also considered to be the training for the research works. Barnett (1992),
states that the members of academic community believes that to assure quality in education the research profiles
of the staff is more important to the achievement of the students as students achieve success if they are in a

Assessment of the Effective total quality management on performance at selective colleges in Tigray..
DOI: 10.9790/487X-1808045684 www.iosrjournals.org 62 | Page
small group, in the company of recognized researchers. A small group of students discourage business but
encourage teaching and learning process.
The above discussion reveals that the quality management in HE is important in either case. HEIs need
quality management to enhance the quality of education for better service to mankind as well as to fulfill the
expectations of its students in order to keep their position secure.
Generally, through an extensive literature review, they identified specific operational practices that
could be measured to determine how they influence concepts associated with TQM. These variables are
identified as operational concepts or constructs by the researchers. Having identified these constructs, Grandzol
and Gershon (1997) developed a survey instrument to test the theory that there exists “causal relationships
between the constructs and the measures”. The constructs are listed in bold with the performance measures
following:
Leadership: Clarity of vision, long-range orientation, coaching management style, participative
change, employee empowerment, planning/implementing change.
Continuous Improvement: Refinement cycles, improvements.
Internal/External Cooperation: Firm-supplier partnership, single-supplier orientation, collaborative
organization, teamwork, organization-wide involvement, systems view, trust, elimination of fear.
Customer Focus: Customer driven focus.
Learning: Company-wide training, foundational knowledge, process knowledge, educational development,
continuous self-improvement, managerial learning.
Employee Fulfillment: Job satisfaction, job commitment, pride of workmanship.
Process Management: Prevention orientation, reduction of mass inspection, design quality, statistical
process control, understanding variation, elimination of numerical quotas, elimination of merit ratings,
understanding motivation, total cost accounting, stable employment.
Product/Service Quality: Accuracy, completeness, conformance, innovation.
Operational Efficiency: Productivity, cycle time, scrap/waste, energy/efficiency, material usage.
Financial Effectiveness: Return on investment, market share, capital investment ratio.
Public Responsibility: Environmental complaints, community involvement.
Employee Satisfaction: Turnover, requests for transfer, grievances/complaints, absenteeism, surveys.
Customer Satisfaction: Surveys, complaints, inquiries.
2.5. Concept of Quality
The concept of Quality Management is considered as one of modern management approach based on a
set of ideas and principles that can be applied to any institution to achieve the best possible performance,
improve productivity, increase profits and improve the Organization's reputation in domestic and external
markets. The concept of quality has been changed following the development of management science with new
dimensions (Daradkeh and Shibli, 2002). Management researchers and scholars have argued on the definition of
(TQM) based on their cultural back ground and philosophy. Therefore, it is a management philosophy, strategic
approach and mean of change aimed to transfer modern organizations to patterns of thought and action fits with
environment and modern future requirements (Dagher, 2001).
2.6. The Adoption of (TQM) In Higher Education Institutions
The adoption of TQM in higher education has many reasons and motives as follows: -
Costs: A low level of spending in higher education makes Colleges seeks control of cost. TQM is a mean of
tools and principles to control costs during service (Decosmo, 1991). Expenditure on education is increased,
and must be linked to benefit return which is to undertake the role of actual developmental contribute to the
advancement of civilization through the quality of performance (Ibrahim, 2001).
Competition: Colleges and Universities should keep up with student's loyalty (Sims and Sims, 1995). Also
they have a strong competition as each institution seeks to attract the largest possible number of students
through compliance with international standards. The College's overall survival is accomplished by meeting
the best needs for students and society. The adoption of (TQM) enhances credibility to meet the
requirements of the College's performance which leads to improve its competitive position among other
similar academic institutions (Cornesky, 1994).
Quality of higher education and reliability Now a days Governments are keen to assess the quality of higher
education more than ever and trying to apply quality and reliability more widely to develop the society and
realizing that (TQM) is achieving high level of quality for the development of the higher education
institutions.
Service directives after it was the concerned of planners and beneficiaries, Public participation in
restructuring public institutions provides better service by adopting quality standards. the standard of

Assessment of the Effective total quality management on performance at selective colleges in Tigray..
DOI: 10.9790/487X-1808045684 www.iosrjournals.org 63 | Page
educational quality, regardless of its nature, is the criterion capable of showing the value of quality that
characterize educational service provided for students, namely: acts of education (teaching and learning
processes and evaluation), education environment (policies, laws, relations, models and expectations) and
educational content such as knowledge, skills, values (Wahbe, 2003). Colleges have to work on students‟
preparations for the real world, which affirm continuous change of the work (Sims and Sims, 1995).
2.7. The Contents of (TQM) in Higher Education
The most important application of TQM in higher education is the beneficiary satisfaction, desires and
aspirations, as in this case, students are the beneficiaries (Morgan and Murgatroyd, 1997). Therefore, the
satisfaction is the crucial factor in the success of the higher education institutions and student satisfaction and
development must be the focal point in all practices of (TQM) (Sims and Sims, 1995). Students' contribution
was excluded in the past for planning educational process, however, contemporary trends such as (TQM), which
confirms that significant gains through the involvement of undergraduate students in institutional planning
enable them to explore new ideas. Scientific experiments have proved that involvement of students would
achieve added benefits for faculty members and students, as well as the involvement of faculty and
administrative staff in the development of the College. According to Saeed (2001), 37-2001 Universities and
Colleges focused on the following aspects: Full absorption of the beneficiaries, s needs and requirements using
feedback for the sake of the continuity's development. By Connecting the students for needs with educational
process design at the higher education institutions the following experiences can be adopted.
Cooperation and interaction between students and faculty members through an exchange of experiences,
advice, and assistance system
Measure the satisfaction of students and faculty members on the College service through the adoption of
comparison criteria between the concerned College's output and other similar Colleges (Abu Nabaa and
Massad, 2000). The integration of employees of the College and University plays an important role in
bringing management and faculty members close together to solve problems of team work leads to smooth
flow of information and encourage individuals to express their views.
According to Al-Khafaji and Babairman (1995) the criteria in order to improve performance of Colleges and
quality outputs, the following (TQM) steps should be adopted:
Identify main beneficiary of the Colleges output.
Develop the academic institution's mission to enable it for competition through quality performance of
education program, students‟ scientific experiments, service offered to beneficiaries, distinguished
academics, services provided to the surrounding environment.
Set up internal procedures to achieve quality performance.
Identify individuals and groups who carry out the responsibility of the selected criteria.
Provide incentives for those who achieve quality.
Forming teams responsible for quality programs.
Writing down and recognize achievements of high quality and provide incentives according to the selected
criteria.
2.8. Measurement of (TQM) in Higher Education
In order to support and encourage continuous improvement process, Universities or Colleges need a set
of techniques and tools to reach positive results in improving performance. The most important tools are: -
i. Self-Assessment: - It's one of effective tools that guide the leadership to a manner of how to invest
College's resources efficiently to improve its performance compared with an international criterion or with
the College itself through the assessment of the implementation of an annual plan with previous year.
ii. Benchmarking: - It is a process to determine where inputs, processes, outputs, systems, and functions are
significantly different from those of competitors or others. It's also an ongoing regular process to compare
work results at a College or a University with same work at another College or University in the same
educational field, taking into consideration concentration on activities, functions, and internal operations
(Walton, 1985; Alkazzaz, 2001). This method is the most appropriate technique for higher education.
Supporters of this process believe that Benchmarking lead to:
Determine initial values, goals and monitor improvement through providing objective measurements.
Make the College's work in such atmosphere to alleviate resistance of change.
Create a structure of external evaluation.
Effectiveness of the communication networks of new work and its role in sharing experiences between
institutions of higher education and unified strategy (Sanyal, 1998).
ISO

Assessment of the Effective total quality management on performance at selective colleges in Tigray..
DOI: 10.9790/487X-1808045684 www.iosrjournals.org 64 | Page
Following the Adoption of (TQM) by Colleges and Universities, it is necessary to rely on standards set
by the "international standardization Organization (ISO) to ensure quality performance (Ani, 2002). ISO
standard is one of a set of management tools that Colleges and Universities have adopted in recent years. Many
Colleges and Universities worldwide received ISO certification of their quality management systems. In the
United Kingdom more than 20 Colleges received ISO (9002) certification (Ani, 2002).
2.9. Empirical evidence of TQM being used in different context and its effect
TQM is being practiced in HE all around the world. Ethiopian HE also has a well-defined system for
quality management. There are several evidences of TQM being practiced in HEIs in Ethiopia. However, the
majority of them are
Ethiopia possesses a 1,700-year tradition of elite education linked to the Orthodox Church. But secular
higher education was initiated only in 1950 with the founding of the UC of Addis Ababa. During the following
two decades half a dozen specialized technical colleges were established. These institutions hosted an
educational culture that was heavily influenced by its long informal association with the Orthodox Church
(Saint, 2004) Ethiopia now boasts about 60 private colleges, which enroll about a quarter of all students. Most of
these institutions are based in the capital, Addis Ababa, with a few branch campuses in major towns. Virtually
all of these institutions were established in the last half decade. While a closer analysis is warranted, the
enrollment rate appears to have been climbing rapidly for several years; but the pace has now moderated, and in
a few cases a decline has been reported. (Damtew, 2005) Most private institutions in Ethiopia, like others in
Africa, offer courses that render good employment opportunities. The programs include business administration,
computer studies, and information technology (IT). Others also provide training in health care and teacher
education. A few of these colleges also offer distance education to tens of thousands of students (Damtew,
2005). The study focusing on SMUC, SMUC is an outgrowth of St. Mary‟s Language School which was
established in 1991 in Addis Ababa. St. Mary‟s College was established in 1998 under St. Mary's General
Educational Development PLC with its head office in Awassa and a branch in Addis Ababa. After a lot of hard
work and dedication, the College was raised to the level of UC in February 2006. Currently SMUC have
managed to graduate more than twenty thousand students in the conventional and distance modes. SMUC offers
undergraduate and joint graduate programmes in many fields of studies. Excluding the Distance Education
Division, the UC offers courses in ten departments organized under four faculties comprising the Faculties of
Business, Law, Informatics and Education. These courses are run under two categories of programs i.e. the
Regular Program (run during the day time) and the Extension Program (offered in the evening). Students are
trained in the specified levels: the certificate (10+1 and 10+2), the diploma (10+3) and the degree programs.
Klocinski (1999) has determined the extent of failure and success in implementing (TQM) in
educational institutions. A tool applied to 184 educational institutions during the year (1991) and (1996) to find
out the extent of implementing quality management. The researcher used a questionnaire with open questions
distributed to Colleges and Universities owned by the private and public sector. He found that the number of
Colleges and Universities that apply Total Quality Management has been increased). The researcher also found
that 74% of these Colleges in 1991 have had an ongoing (TQM). 86% are encouraged to follow the overall
principles of quality in their administrative operations and services.57% confirmed that it faces obstacles and
problems in implementing (TQM). 37% said they suffer from a lack of administrative support and a weakness in
leadership which is considered a major constraint in implementing (TQM).
Ayoub (2000) seeks to identify the effectiveness of total quality management in the performance of
Universities in Jordan. A random sample of (282) faculty members in the Jordanian Governmental Universities
have been selected. The researcher was able to develop a questionnaire of (35) points and the paper reached the
following conclusions:
There are statistically significant differences among faculty members in estimating efficiency use of (TQM)
to develop performance of the Jordanian Universities, according to the University.
There are no statistically significant differences among faculty members in estimating efficiency use of
(TQM) to develop the performance of the Jordanian Universities, according to the faculty members with
different titles.
Dagher (2001) highlights the most important challenges facing higher education in the Arab world and
the possibility of meeting those challenges by adopting the philosophy of (TQM). The researcher concluded that
the possibility of successful implementation of(TQM) in Universities and Colleges in Iraq and the Arab world,
after this approach has proved successful in improving standards, the traditional administrative methods do not
match the information revolution experienced by the world in all aspects of life.
Al-saud (2002) clarifies the concept of (TQM) and its steps applied at schools in Jordan. The researcher
adopted " Analytic synthetic approach" as a way to identify the nature of (TQM). The characteristics of the
research reached that new strategy for the development of educational systems that must be based on

Assessment of the Effective total quality management on performance at selective colleges in Tigray..
DOI: 10.9790/487X-1808045684 www.iosrjournals.org 65 | Page
development inputs of the educational system and should be based on modern approaches, and should
implement (TQM) in the educational institutions.
Al-gmeez (2004) has examined the implementation of (TQM) at the Ministry of Higher Education in
Saudi Arabia from the perspective of its employees. He found that there are statistically significant differences
to the variable years of experience in planning and the potential ability reflects the quality requirements of
(TQM) (buildings, playgrounds, laboratories, libraries, classrooms, and educational technology)
2.10. Scale reliability and validity of constructs
The Cronbach‟s alpha reliability test was performed on all TQM constructs by Hoang D.T. et al.,
(2010), to assess the reliability of the collected data. According to their study, Cronbach‟s alpha measures the
degree to which a construct is internally consistent and reliable. Generally, variables that had items with a total
correlation below 0.3 were dropped, while a reliability coefficient of 0.7 or more was considered good
(Nunnally&Burnstein, 1994; Hair et al., 1998). The Cronbach‟s alpha for all TQM constructs found in their
sample were well above 0.7, and all the item-total correlation coefficients exceeded 0.3. Therefore, the
instrument developed for measuring TQM and organizational performance constructs was judged to be
sufficiently reliable.
In order to examine the TQM construct validity, Hoang D.T. et al., (2010) used the confirmatory factor
analysis (CFA) method using AMOS 4.0 with a maximum likelihood procedure. In their study the summary
statistics of the analysis variables showed that the variables exhibited a relatively normal distribution with the
values of skewness and kurtosis not exceeding very much the absolute value of 1 (Anderson & Gerbing, 1988;
Hair et al., 1998). First, Hoang D.T. et al., (2010) applied a CFA model for each construct to eliminate items
with weak loading coefficients (smaller than the cut-off point of 0.5) and to validate the measurement model.
During their study and validation process, Hoang D.T. et al., (2010) deleted some variables having poor loading
on their respective latent variables and those deleted variables were five items (the first item of Teamwork
measures; the first, second, and third items of Process Management measures; and the first item of the
Information and Analysis measures). After excluding these items, the Goodness of Fit Indexes (GFI) for all
constructs well exceeded 0.9 and the Standardized Root Mean Squared Residual (SRMR) coefficients were less
than 0.1. These criteria met the requirement for an acceptable model (Kline, 1998). Comparative fit index (CFI),
and standardized Root Mean Squared Residual (SRMR) of the final TQM constructs that safeguard the
reliability and validity of the constructs under investigation.
Next, Hoang D.T. et al., (2010) used a CFA model to assess the means of the 11 TQM constructs.
According to Kline (1998), besides the Chi-square to degrees of freedom ratio (x2/df ratio), the widely used
measures of fit for the model include the goodness of fit index (GFI), the Bentler comparative fit index (CFI),
the Bentler-Bonett non-normed fit index (NNFI), and the standardized root mean squared residual (SRMR). It is
desired that the x2/df ratio is less than 3; the GFI, the CFI, and the NNFI are at least 0.90; and the SRMR is less
than 0.1. All variables had high factor loading coefficients and highly statistical significance (all p-values equal
0). Thus, all variables that measure latent constructs achieved convergent validity (Anderson & Gerbing, 1988).
This indicates the validation of the measurement model, and also demonstrates that TQM is generally
considered as a set of practices, as proven in previous studies (Ahire et al., 1996; Samson & Terziovski, 1999;
Prajogo & Sohal, 2003). In summary, these results provided the safeguard for the reliability and validity of the
TQM constructs under investigation.
Customer satisfaction was also a statistically significant positive predictor within this model, β = 0.28,
p < .01. This indicates that employee satisfaction significantly increased with increasing levels of customer
satisfaction and was likely not due to chance. A t value of 3.44 indicated a statistically significant measure of the
relationship between employee satisfaction and customer satisfaction. B measured the slope of the line and
indicated for every one-unit change in employee satisfaction, customer satisfaction increased by 0.20. The
remaining predictors were not significant.
In recently, Riccardi, et al. (2009) in their paper performed multiple linear regressions after the
reduction of huge variables in to simple form by using factor analysis in order to build the constructs for TQM.
Their interest was to check whether there are statistically significant relationships among independent
variables/predictors and responses such as employee satisfaction: leadership, continuous improvement,
employee fulfillment, learning, process management, internal/external cooperation, customer focus,
product/service quality, operational efficiency, financial effectiveness, public responsibility and customer
satisfaction.
Out of several multiple linear regression models they performed, Riccardi, et al. (2009) particularly
performed the model with response variable customer satisfaction and the model was a statistically significant
with F (12, 149) = 15.66, R2 = .56, p < .01. This indicated that the predictors all together accounted for a
significant amount of variation in the criterion and that together 56% of the variability of customer satisfaction
could be attributed to the predictors.

Assessment of the Effective total quality management on performance at selective colleges in Tigray..
DOI: 10.9790/487X-1808045684 www.iosrjournals.org 66 | Page
Several of the predictors were significant within their model out of them employee fulfillment (𝛽 = −0.29, 𝑝 < .01) was a negative predictor of customer satisfaction within their model. This indicated customer
satisfaction significantly increased with decreasing levels of employee fulfillment. This was statistically
significant and not likely due to chance. A t value of -3.54 indicated a statistically significant negative measure
of the relationship between employee fulfillment and customer satisfaction. B measured the slope of the line and
indicated for every one-unit change in customer satisfaction, employee fulfillment decreased by 0.41.
Whereas Financial effectiveness (𝛽 = 0.20, 𝑝 < .05), Process management (𝛽 = 0.20, 𝑝 < .05),
Customer focus ( 𝛽 = 0.24, 𝑝 < .01, ), Employee satisfaction ( 𝛽 = 0.26, 𝑝 < .01 ) were statistically
significant positive predictors of customer satisfaction, meaning each of them increased significantly with
increasing levels of customer satisfaction within the model and were not likely due to chance. Riccardi, et al.
(2009) also reported that the rest predictors such as leadership, continuous improvement, learning,
internal/external cooperation, product/service quality, operational efficiency and public responsibility were not
significant predictors in their model.
In their model Riccardi, et al. (2009), divided the response variables satisfaction as customer
satisfaction and employee satisfaction to perform two multiple linear regression models with both as a response.
Therefore, in their second model they also found similar results with 𝐹 (12, 147) = 13.30,𝑅2 = .52, 𝑝 < .01 indicating that altogether the predictors accounted for a significant amount of variation in the
criterion and that together 52% of the variability of employee satisfaction could be attributed to the predictors.
Several of the predictors were significant. First, employee fulfillment (𝛽 = 0.33, 𝑝 < .01), Product/service
quality (𝛽 = 0.20, 𝑝 < .05) and were statistically significant positive predictors of employee satisfaction This
indicated that employee satisfaction significantly increased with increasing values of those three predictors and
were not likely due to chance. The remaining predictors were not significant.
Furthermore, in their study Riccardi, et al. (2009), conducted a simple linear regression model to
determine if customer focus was a significant predictor of the level of product/service quality. Their result
revealed that customer focus was a significant positive predictor of product/service quality, 𝐹 (1, 161) = 134.71,𝛽 = 0.68,𝑅2 = .46, 𝑝 < .01.𝛽 showed a positive relationship, meaning that as customer focus
increased, and product/service quality increased. Determination of coefficient i.e.; 𝑅2 indicated that, 46% of the
variability of product service quality was attributed to customer focus. P < .01 indicated that the relationship
between customer focus and product/service quality was statistically significant and was probably not due to
chance (Riccardi, et al., 2009).
III. Methodology of the study 3.1. Study Populations
The proposed target population for this study was concentrated on the selective private and
governmental TVET colleges of Tigray regional administration, Ethiopia. Particularly, the study population is
the 5 private and 5 governmental TVET colleges of eastern zone cluster of Tigray. Therefore, TQM at selective
colleges will be checked and analyzed qualitatively and quantitatively.
3.2. Study Area
The study entitled the assessment of effective total quality management in case of selective colleges of
Tigray regional state was conducted some systematically selected colleges of eastern zone which is one cluster
of Tigray. So, the administration of eastern zone is Adigrat town and is located eastern zone of Tigray regional
state but the north zone from the view of Ethiopia as whole. Adigrat is 115 km far from Mekelle which is the
capital city of Tigray regional state and around 898 km far from the Addis Ababa which is the capital city of
Ethiopia.
3.3. Data Sources and types
For the purpose of this study, both primary source of data and secondary source of data from different
documents and files were used. Primary data is the data that either collected by the investigator at first time or it
is the original data that collected by different kinds of gathering methods such as, interview telephone or face to
face, questionnaire methods, physical observation, experimental test etc.
3.4. Data collection Methods and Data Gathering Instrument
For this study self-administered questionnaires and interviews with semi administered questionnaires
was used to collect relevant information from selective colleges‟ management bodies, employees and customers/
students. Furthermore, the review of relevant documents or files, annual abstract and literatures were conducted
to have adequate information about the TQM on performances. Focus group discussion was also employed to
get the views and opinions of respondents as per necessities. The questionnaires were drafted in English
languages with the guidance of the investigator. One important of statistical survey is questionnaire method. The

Assessment of the Effective total quality management on performance at selective colleges in Tigray..
DOI: 10.9790/487X-1808045684 www.iosrjournals.org 67 | Page
simplest definition of questionnaire is that of a group or sequence of question. A designed to elicit information
up subject from a respondent‟s in this study similar questionnaire for all respondents were prepared.
3.5. Research Design and Method
Cross-sectional study design was performed in this study by using both qualitative and quantitative
research approaches. Therefore, this research with embedded design is employed and both quantitative and
qualitative methods of data analysis were used. Information was collected from respondents through
questionnaire and analyzed quantitatively using different statistical techniques. Moreover, some Information
was collected from various sources through interview, focus group discussion and secondary source to analyze
qualitativelythrough narration of information. Accordingly, a qualitative data is embedded within a quantitative
methodology. Because of its relevance, content analysis design used to collect the quantitative data, the major
data, and interview were used as a qualitative data, the supportive data, gathering instrument. Beside to this the
short training was given to data collectors and the questionnaires were distributed to respondents then collected
and returned back to investigator by the well-trained data collectors as per the schedules.
3.6. Study Variables and descriptions
3.6.1. Dependent Variables
The dependent variables were: (a) product/service quality, (b) Satisfaction (customer & Employee), and (f)
Performance on management (g) TQM practice. All the mentioned are the indicators of TQM.
3.6.2. Independent Variables
The independent variables will be: (a) leadership, (b) continuous improvement, (c) employee
fulfillment, (d) cooperation (Internal/External), and (e) customer focus. (f) Age of the college (g) existence of
quality improvement counsel (h) type of the college
Through the use of inferential statistics, the researcher used the associational approach to explore the
relationships between the dependent and independent variables and see what variables were statistically
significant predictors of the response variables under the study.
3.7. Sample size determinations
Taking sample size have a great advantage over census in different studies to eliminate the wastage of
time as well as cost and resources; therefore, the investigators always take a sub-part of populations which must
represents the information of populations as whole. In order to have adequate information to achieve the
reasonable results and conclusions it is must to have enough sample size with represents the information of
populations as whole. According to the sample size formula published by Dillman (2007), the sample size will
be determined.
𝑛 =𝑁 ∗ 𝑃(1 − 𝑃)
𝑁 − 1 ∗ 𝑑
𝑍𝛼2
2
+ 𝑃(1 − 𝑃)
(1)
Where: 𝑛 is completed sample size needed for desired level of precision 𝑁 is total size of population 𝑃
is chance that any respondent will answer a question the same as any other respondent 𝑑is acceptable amount of
sampling error (margin error) 𝑍𝛼2 is statistic associated with the confidence level.
To have maximum sample size𝑃 = 0.5,𝑑 = 0.05 𝑜𝑟 5% and 𝛼 = 0.05 𝑜𝑟 5% level of significance was taken
and therefore, 𝑍𝛼2 will be equal to 1.96 according to standard normal table. The desired total sample size 𝑛
was proportionally allocated in to strata sample sizes. In this study there will be 10 strata i.e., 5 private and 5
governmental TVET colleges of Eastern zone cluster of Tigray.
Accordingly, to allocate sample size for each stratum the general formula will be used as follows.
𝑛 =𝑛𝑁
𝑁 (2)
Notations: n=the overall sample size: 𝑛 = 𝑛𝑖=1
𝑛 = The sample size in each stratum
𝑁 = The total number populations in the hth
stratum and 𝑁 is total size of study population in all 10 colleges
3.8. Data Analysis and Presentation
On the analysis stage, both quantitative and qualitative data was analyzed independently and mixed at
the discussion stage. Some relevant statistical analysis such as Binary logistic and multiple linear regression
models were implemented based on the characteristics of data with the help of statisticians. In this study to

Assessment of the Effective total quality management on performance at selective colleges in Tigray..
DOI: 10.9790/487X-1808045684 www.iosrjournals.org 68 | Page
observe and overview, the general features of the data on each variable some descriptive as well as inferential
statistics were done. Descriptive statistics is a part of statistics that describes or explains the characteristics of
sample data without generalizations or drawing conclusions about the characteristics of populations. The
techniques most of in used for describing the characteristics of the sample and the major study variables are
displayed in the form of frequency distribution, percentage, proportion, and diagrammatic representation such as
bar chart, pie chart etc. Inferential statistics is statistical method deals with making inference or conclusion
about population based on data obtained from a limited number of observations that come from the population.
Inferential statistics consists of estimation and hypothesis testing. Then with techniques of the different
statistical analysis, the research will be conducted. Therefore, some relevant statistical methods for data analysis
binary logistic regression and multiple linear regressions were modeled.
3.8.1. Binary logistic regression models
Binary logistic regression is one of the statistical models for dichotomous response variables having
two categories success or failure, presence or absence or yes or no and forth (Hosmer and Lemeshow, 2000).
For response variable𝑌𝑖 are binary outcomes with
𝑌𝑖 = 𝑙, 𝑖𝑓𝑠𝑢𝑐𝑐𝑒𝑠𝑠(𝑌𝑒𝑠)0, 𝑖𝑓𝐹𝑎𝑖𝑙𝑢𝑟𝑒(𝑁𝑜)
𝑃 𝑌𝑖 = 𝑙 = 𝜋𝑖 =exp (𝛽𝑜 + 𝛽1𝑋 1𝑖+𝛽2𝑋 2𝑖+⋯+𝛽𝑘𝑋𝑘𝑖 )
1+exp (𝛽𝑜 + 𝛽1𝑋 1𝑖+𝛽2𝑋 2𝑖+⋯+𝛽𝑘𝑋𝑘𝑖 ) (Logistic model) (3)
𝑃 𝑌𝑖 = 0 = 1 − 𝜋𝑖 =1
1 + exp(𝛽𝑜 + 𝛽1𝑋 1𝑖 + 𝛽2𝑋 2𝑖 + ⋯+ 𝛽𝑘𝑋𝑘𝑖)
Where,𝛽𝑜 and 𝛽𝑖 are parameters to be estimated. 𝜋𝑖 isthe probability that 𝑌𝑖 equals one as we will see
shortly,𝛽𝑜 is constant (intercept) and 𝛽𝑖 is the regression coefficient(slope), which measures the rate of change in
𝜋𝑖 for a given change in X.
The parameter 𝛽𝑖determines the rate of increase or decrease in the S-shaped Curve. Positive values of
𝛽𝑖 imply that 𝜋𝑖 increases with x, negative values of 𝛽𝑖 imply that 𝜋𝑖 increases when x decreases. 𝛽𝑖= 0 implies no
relationship between the explanatory variable x and the probability of success𝜋𝑖 . The probability that 𝑌𝑖 = 𝑙
relative to the probability that 𝑌𝑖 = 0 is equal to𝜋𝑖
1−𝜋𝑖 which is known as Odds. If the odds are >1, then the
probability that 𝑌𝑖 = 1 is greater than the probability that𝑌𝑖 = 0; if the odds are <1, then the converse is true. If
we take the natural log of the odds𝑌𝑖 = 1: 𝑙𝑛(𝜋𝑖
1−𝜋𝑖) which is called Logit. This is the logit transformation or link
function that we will term𝑔(𝑋), and which can be modeled against our predictor much more easily as(Hosmer
and Lemeshow, 2000):
𝑔 𝑋 = 𝐸{𝑌𝑖 } = 𝛽𝑜 + 𝛽1𝑋 1𝑖 + 𝛽2𝑋 2𝑖 + ⋯+ 𝛽𝑘𝑋𝑘𝑖 = 𝑙𝑜𝑔𝑖𝑡(𝜋𝑖) (4) The ratio of the two odds is called the odds ratio.
OR =p(y = 1)
p(y = 0)=
eβo + β1X 1i +β2X 2i +⋯+βk X ki
1+eβo + β1X 1i +β2X 2i +⋯+βk X ki
1 −eβo + β1X 1i +β2X 2i +⋯+βk X ki
1+eβo + β1X 1i +β2X 2i +⋯+βk X ki
= eβo + β1X 1i +β2X 2i +⋯+βk X ki (5)
This is telling us that𝛽𝑖 represents the change in the odds of an outcome for an increase in one unit of
X. The constant,𝛽0, is the value of𝑔 𝑋 when 𝑋𝑖 = 0 and represents the intercept of the logistic regression
model; its interpretation is similar to the intercept of the linear regression model (Hosmer and Lemeshow,
2000).
3.8.2. Data Reduction
In real life it is common to have huge number correlated independent and dependent variables. Hence,
it is not easy to manage whole big data and sometimes also many variables are related to each other which lead
the analysis to be affected by multi-co-linearity this in turn mislead us to interpret our results in wrong way.
Thus, it is important to condense similar variables to one factor (constructs). Consequently, data reduction is the
best way for such cases. Data can be reduced by using multivariate statistical techniques so called Principal
component analysis (PCA) and factor analysis (FA). In fact, these two techniques can be exploratory in nature;
FA is used as a tool in attempts to reduce a large set of variables to a more meaningful, smaller set of variables
(Johnston, R., 1978). Beside of this FA is fundamental multivariate model which helps to reduce and condense
the data in to simple and manageable form. Furthermore, it is the best tool to detect the multi-co-linearity
problems in multiple regressions (Johnston, R., 1978). That‟s why it is applied in this paper.

Assessment of the Effective total quality management on performance at selective colleges in Tigray..
DOI: 10.9790/487X-1808045684 www.iosrjournals.org 69 | Page
3.8.3. Multivariate Linear Regression Models
Multiple linear regressions are the most common form of linear regression analysis. As a predictive
analysis, the multiple linear regressions are used to explain the relationship between one continuous dependent
variable from two or more independent variables (Agresti, 1990).
𝒀𝒊 = 𝛽𝑜 + 𝛽1𝑋 1𝑖 + 𝛽2𝑋 2𝑖 + ⋯+ 𝛽𝑘𝑋𝑘𝑖 +∈𝒊 (𝟒)
Where, 𝑌𝑖 independent variable/s, 𝛽𝑖 ′𝑠 are the estimated coefficients or parameters, 𝑋𝑘𝑖 are fixed known
predictors or independent variables and ∈𝑖 ~𝑁 𝜇,𝜎2 random errors.
General concepts regressions are: Linear Regression is a process that allows you to make predictions
about variable “Y” based on knowledge you have about variable “X”. The Correlation Coefficient is a single
summary number that tells you whether a relationship exists between two or more variables, how strong that
relationship is and whether the relationship is positive or negative. The Coefficient of Determination is a single
summary number that tells you how much variation in one variable is directly related to variation in another
variable. The Standard Error of Estimate is a single summary number that allows you to tell how accurate your
predictions are likely to be when you perform Linear Regression (Agresti, 1990).
IV. Results and Analysis 4.1. Data descriptions and General Characteristics
This study generally dealt with assessment of effective TQM on performance at selective colleges in
Tigray regional administrative State, Ethiopia. The study is done based on a number of literature studies dealing
with (TQM) in general and (TQM) in education and higher education in particular. Cross sectional study design
was applied for this careful investigation about effective TQM on performance. Particularly, the study is
conducted at TEVT colleges of Eastern Zone of Tigray. Total of 10 colleges such as 5 private and 5
governmental are included in the investigation. The codes were given to each college as GC1-GC5 for
governmental and PC1-PC5 for private. In order to have relevant information for investigation two types of
well administered questionnaires, one for management body and one for both employees and students/customers
were prepared. Accordingly, 7 core management positions or structures such as Dean of College position, Vice
Dean level position, Human Resource Manager position, Industry Extension Service position, Registrar director
position, Planner position and Finance Director position were taken from each college and the questionnaire was
distributed to total of 70 management bodies 7 each from each colleges. Furthermore, the second questionnaire
was distributed to sample size of 365 respondents that were selected out of total target population size of 7189
by using probability sampling technique. Stratified sampling technique is used and the sample size was
determined for 10 strata by using proportional allocation methods. Under each stratum simple random sampling
method was conducted to gather information. Generally, careful and intentional investigation was conducted in
this study. After the careful and intentional collection of data the investigator has come up with well-organized
methodological and empirical results.
Unlike many literatures included in this paper, this study incorporated the opinions from different
stakeholders. However, most investigators incorporated exclusively opinion of management bodies particularly
president of the higher education institutes as was shown in most literatures in this study. Unlikely, in this case,
a sample of all stakeholders in the college were permitted to participate in the study.
4.1.1. Descriptive Characteristics of the Results for All Stakeholders
Results of this study are based on the objectives and analysis of the sample answers of the respondents
from each college for both management and other stakeholders. The result incorporated both descriptive and
inferential statistics accompanied by empirical analysis and are organized in respective tables. The careful
interpretations, discussions and conclusions were conducted.
Some descriptive characteristics with respective frequencies and percentages of each respondent are
listed in table 4.1. Accordingly, out of total 365 sample size, 137(37.5%) of private and 228(62.5%) were
included in the study. Out of total sample 365 the opinion of 122(33.4%) females and 243(66.6%) male
respondents were included in the study. Moreover, out of total 365 respondents, 333(91.2%) students and
32(8.8%) employees have given their opinion in the questionnaire of this study survey. For more details, please
refer to table 4.1.
Table 4.2 refers the counts and percentages of each respondent with their respective positions in their
colleges. For instance, total of 204(55.9%) students from governmental colleges and 129(39.3%) students from
private college as well as 24(6.6%) employees from governmental and 8(2.2%) employees from private college
were include in the study to give their opinion about TQM in their college. For further details, refer to table 4.2.
According to table 4.3, the description of opinion of respondents on two response variables practice of
TQM and product and/or service quality in the college are indicated. Based on the results indicated in table 4.3,
out of total 365 sample of respondents, 113(31%) reported that there is no practice of TQM in their colleges

Assessment of the Effective total quality management on performance at selective colleges in Tigray..
DOI: 10.9790/487X-1808045684 www.iosrjournals.org 70 | Page
whereas, 252 (69%) of them provided their opinion as their colleges practice TQM. Furthermore, according to
the particular colleges, 48(13.2%) from total sample of respondents and 35% out of 137 from private colleges
have reported that their college does not practice TQM anymore. Unlikely, 89(24.4%) of 365 and 65.0% out of
137 respondents in private colleges have reported that their college does practice TQM. Similarly, 65(17.5%)
out of total 365 respondents and 28.5% out of 228 of governmental colleges have reported that their college
does not practice TQM anymore. However, 163(44.7%) of total 365 respondents and 71.5% out of 228 have
reported that their college practices TQM.
Finally, the result indicates that both type of colleges practice TQM well and it is more practiced in
governmental than private one. Please refer to table 4.3 for more details.
Beside to results of practice of TQM in colleges, the results based on opinion of the respondents
towards product and/or service quality which is one indicator of TQM is also reported in table 4.3. Accordingly,
63(17.3%) of total 365 respondents and also 46% out of 137 that are respondent from private colleges have
reported that their college has no quality in product and/or service whereas, 74(20.3%) of total respondents 365
and 54% out of 137 respondents of private colleges have reported that their college has quality of product and/or
service.
Likewise, 101(27.7%) out of total respondents taken in this survey and 44.3% out of the respondents
taken from governmental colleges have reported that there is no product and /or service quality in their colleges.
Whereas, 127(34.8%) out of total respondents and 55.7% out of the 228 that was taken from governmental
college have reported that there is no quality on product and/or service of their colleges. Generally, 164(44.9%)
of total respondents out of 365 were report that there is no product and/or service quality in their colleges
whereas more than of half 201(55.1%) out of 365 respondents were report that there is quality on product and/or
service in their respective colleges.
Finally, it can be concluded that the quality of product and/service is not enough in both colleges as
result indicates almost half- half of yes and no answers. Please refer to table 4.3 for more details.
According to the results listed in table 4.4, 122(33.4%) of total 365 or 89.1% of 137 of respondents
from private college were report that their college has no continues improvement whereas 15(4.1%) of total 365
and 10.9 of 137 of them were report that their colleges have continues improvement in their progress. Similar to
the private college, the report of respondents from governmental colleges has shown that 214(58.6%) of total
365 or 93.9% of 228 are believed that their colleges do not have any continues improvement in progress.
Whereas, 14(3.8%) of total 365 or 6.1% of 228 were report that their college do have continues improvement in
their progress. Generally, 336 (92.1%) of 365 respondents believe that their college do not have any continues
improvement in progress whereas 29(7.9%) of them believe in contrast.
Additionally, 83(22.7%) of total 365 or 60.6% of 137 respondents from private college were report that
their colleges do not have internal/external cooperation in their progresses. While, 54(14.8%) of total 365 or
39.4% of 137 respondents of them believe that their colleges do have internal/external cooperation in their
progresses. In the same way, 120(32.9%) of total 365 or 52.6% of 228 respondents of governmental colleges
believe that their colleges do not have any cooperation in progress. While, 108(29.6%) of total or 47.4% of 228
of them do believe that their colleges do have internal/external cooperation.
Generally, 203(55.6%) of total 365 of the respondents do believe that their college do not have any
cooperation. While, 162(44.4%) of them do believe that their college do have cooperation in their progresses.
Moreover, 44(12.1%) of total 365 or 32.1% of 137 respondents of private colleges did report that their
colleges do not have quality improvement counsels. Whereas, 93(25.5%) of total 365 or 67.9% of 137
respondents of them were respond as their college do have quality improvement counsels. Likewise,
70(19.2%) of total 365 or 30.7% of 228 respondents from governmental colleges describe that their college do
not have quality improvement counsels. While, 158(43.3%) of total 365 or 69.3% of 228 of them mentioned that
their college do have quality improvement counsels.
Gradually, of total 365 respondents 114(31.2%) of them reported that their colleges do not have quality
improvement counsels. While 251(68.8%) of them agreed that their colleges do have quality improvement
counsels. For more details, take look in table 4.4.
The descriptive characteristics about the opinions of respondents towards implementing leadership and
employee fulfillment situations are displayed in table 4.5. Accordingly, out of total maximum number of
respondents that are about 47(12.9%) of total 365 or 34.3% of 137 from private colleges mentioned that the kind
of leadership implementing in their colleges is clarity of vision and the minimum that are 18(7.1%) of total or
19.0% of 137 of them mentioned that their colleges use employee empowerment kind of leadership. Likewise,
maximum number that are 79(21.6%) of total 365 or 34.6% of 228 respondents of governmental colleges
responded that the implementing leadership in their colleges is clarity of vision. While, the minimum number
23(6.3%) of total 365 or 10.1% of 228 of them responded that their colleges follow plan and implementation
change leadership system.

Assessment of the Effective total quality management on performance at selective colleges in Tigray..
DOI: 10.9790/487X-1808045684 www.iosrjournals.org 71 | Page
Moreover, in both private and governmental colleges most respondents mentioned that the employee
fulfillment in their colleges is partially full and complete. As the result indicated in table 4.5, 62(17%) of total
365 or 45.3% of 137 for private colleges and 114(31.2%) of total 365 or 50% of 228 for governmental colleges
the employee fulfillment is partially full. Whereas, some of them reported that there is deficiency of employee in
their colleges. For more details, take look in table 4.5.1
4.2. Results of Binary Logistic Regression
As it was explained in methodological part of this paper, binary logistic regression is one of the
statistical models for dichotomous response variables having two categories either success or failure, presence
or absence or yes or no and forth.
Research Question:Do Presence of Practice of TQM and product/service quality have any relation with
independent variables type of college, period of working experience of the college, kind of leadership, continues
improvement, internal/external cooperation, availability of quality improvement counsel and employee
fulfillment? To address the above question hypothesis testing plays great role by putting two tentative claims
called null and alternative hypotheses as below.
Null hypothesis 𝑯𝟎:TQM practice or product/service quality has no association with all independent variables.
𝐇𝟎: βi
= 0(odds ratio π(x)
1−π(x)= 1)
Which implies 𝑃(𝑃𝑟𝑒𝑠𝑒𝑛𝑐𝑒𝑜𝑓𝑇𝑄𝑀𝑝𝑟𝑎𝑐𝑡𝑖𝑐𝑒/𝑌𝑒𝑠product/service quality /Yes) 𝑜𝑟 is the same at each level
of independent variable
Alternative hypothesis 𝑯𝑨: Presence of Practice of TQM or product/service quality has association at least
with one independent variable.βi≠ 0(odds ratio
π(x)
1−π(x)≠ 1)
Even though the reference level is chosen by default to be the largest number by SPSS for indicator/dummy
variables, in this paper it was adjusted to take the smallest valued category or level as a reference. In this
analysis there is no continuous variable included in the model. Hence, it is must to create dummy/indicator
variable for all independent variables. Most time people misled in interpreting categorical predictors as they
interpret in similar way to continues predictors and that is very serious mistake. Thus, the interpretation should
be taken relative to reference level for every dummy variable.
According to the results displayed in table 4.6, the existence of TQM practice is positively associated
with all independent variables except employee fulfillment dummy variable two, this is “employee is complete”
relative to the reference level “employee is not full” which is negatively related with TQM practice.
Furthermore, except three dummy variables i.e., period(2) which is long period of experience of the colleges
(𝑃 − 𝑣𝑎𝑙𝑢𝑒 = 0.084) , availability of internal/external cooperation(Yes) (𝑃 − 𝑣𝑎𝑙𝑢𝑒 = 0.417) and quality
improvement counsels(Yes) (𝑃 − 𝑣𝑎𝑙𝑢𝑒 = 0.192) all have statistically significant associated with existence of
TQM practice.
Furthermore, the odds of Practice of TQM is 2.52(52%) most likely existed in governmental college
(𝛽1 = 0.924(0.352)) relative to private college. The coefficient parameters also provide us similar conclusions.
Hence, the coefficient 0.924 indicated that, the presence of TQM Practice is 0.924 times higher in governmental
than private college. Moreover, TQM is 1.150(0.335) times highly practiced in medium period experienced
colleges than short experienced (baseline/reference level). Likewise, it is 0.942 time more practiced in long
period experienced than short experienced one. Besides, the odds of Practice of TQM are 3.158 (15.8%) and
2.566(56.6%) times most likely existed in the colleges which have medium and long period work experiences
respectively.
Additionally, TQM practice is 0.931(0.403) times higher in the colleges those implementing Clarity of
vision leadership system relative to the colleges those “plan and implement change” leadership system is being
implemented which was reference level. Likewise, similar conclusions can be taken by using the odds ratios.
Thus, the odds of Practice of TQM is 3.794(79.4%) times most likely practiced in the colleges those encourage
employee empowerment leadership than “plan and implement change” leadership system is being implemented.
The rest dummy variables could be interpreted in similar ways.
Furthermore, TQM practice is 1.156(0.561) times more existed in the colleges those continues
improvement is being available relative to not available. Likely, the independent variable continuous
improvement(𝑃 − 𝑣𝑎𝑙𝑢𝑒 = 0.039) has statistically significance positive relationship with TQM practice at 5%
level of significance. Thus, there is 95% evidence to reject null hypothesis in favor of alternative hypothesis.
1
NB: EMF= Employee fulfillment, KOL= kind of leadership, CV= Clarity of Vision, LRO= long-range orientation,
CMS=coaching management system, EMEMP= Employee empowerment and PIC= Plan and implementation Change.
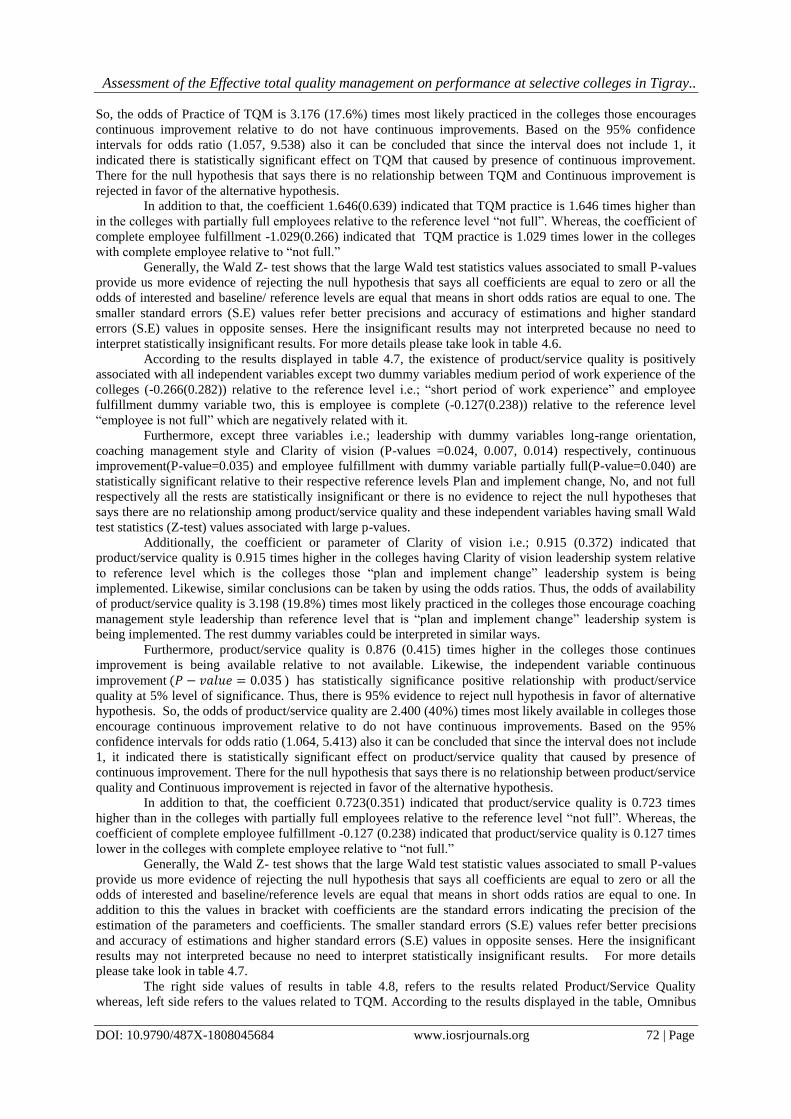
Assessment of the Effective total quality management on performance at selective colleges in Tigray..
DOI: 10.9790/487X-1808045684 www.iosrjournals.org 72 | Page
So, the odds of Practice of TQM is 3.176 (17.6%) times most likely practiced in the colleges those encourages
continuous improvement relative to do not have continuous improvements. Based on the 95% confidence
intervals for odds ratio (1.057, 9.538) also it can be concluded that since the interval does not include 1, it
indicated there is statistically significant effect on TQM that caused by presence of continuous improvement.
There for the null hypothesis that says there is no relationship between TQM and Continuous improvement is
rejected in favor of the alternative hypothesis.
In addition to that, the coefficient 1.646(0.639) indicated that TQM practice is 1.646 times higher than
in the colleges with partially full employees relative to the reference level “not full”. Whereas, the coefficient of
complete employee fulfillment -1.029(0.266) indicated that TQM practice is 1.029 times lower in the colleges
with complete employee relative to “not full.”
Generally, the Wald Z- test shows that the large Wald test statistics values associated to small P-values
provide us more evidence of rejecting the null hypothesis that says all coefficients are equal to zero or all the
odds of interested and baseline/ reference levels are equal that means in short odds ratios are equal to one. The
smaller standard errors (S.E) values refer better precisions and accuracy of estimations and higher standard
errors (S.E) values in opposite senses. Here the insignificant results may not interpreted because no need to
interpret statistically insignificant results. For more details please take look in table 4.6.
According to the results displayed in table 4.7, the existence of product/service quality is positively
associated with all independent variables except two dummy variables medium period of work experience of the
colleges (-0.266(0.282)) relative to the reference level i.e.; “short period of work experience” and employee
fulfillment dummy variable two, this is employee is complete (-0.127(0.238)) relative to the reference level
“employee is not full” which are negatively related with it.
Furthermore, except three variables i.e.; leadership with dummy variables long-range orientation,
coaching management style and Clarity of vision (P-values =0.024, 0.007, 0.014) respectively, continuous
improvement(P-value=0.035) and employee fulfillment with dummy variable partially full(P-value=0.040) are
statistically significant relative to their respective reference levels Plan and implement change, No, and not full
respectively all the rests are statistically insignificant or there is no evidence to reject the null hypotheses that
says there are no relationship among product/service quality and these independent variables having small Wald
test statistics (Z-test) values associated with large p-values.
Additionally, the coefficient or parameter of Clarity of vision i.e.; 0.915 (0.372) indicated that
product/service quality is 0.915 times higher in the colleges having Clarity of vision leadership system relative
to reference level which is the colleges those “plan and implement change” leadership system is being
implemented. Likewise, similar conclusions can be taken by using the odds ratios. Thus, the odds of availability
of product/service quality is 3.198 (19.8%) times most likely practiced in the colleges those encourage coaching
management style leadership than reference level that is “plan and implement change” leadership system is
being implemented. The rest dummy variables could be interpreted in similar ways.
Furthermore, product/service quality is 0.876 (0.415) times higher in the colleges those continues
improvement is being available relative to not available. Likewise, the independent variable continuous
improvement (𝑃 − 𝑣𝑎𝑙𝑢𝑒 = 0.035 ) has statistically significance positive relationship with product/service
quality at 5% level of significance. Thus, there is 95% evidence to reject null hypothesis in favor of alternative
hypothesis. So, the odds of product/service quality are 2.400 (40%) times most likely available in colleges those
encourage continuous improvement relative to do not have continuous improvements. Based on the 95%
confidence intervals for odds ratio (1.064, 5.413) also it can be concluded that since the interval does not include
1, it indicated there is statistically significant effect on product/service quality that caused by presence of
continuous improvement. There for the null hypothesis that says there is no relationship between product/service
quality and Continuous improvement is rejected in favor of the alternative hypothesis.
In addition to that, the coefficient 0.723(0.351) indicated that product/service quality is 0.723 times
higher than in the colleges with partially full employees relative to the reference level “not full”. Whereas, the
coefficient of complete employee fulfillment -0.127 (0.238) indicated that product/service quality is 0.127 times
lower in the colleges with complete employee relative to “not full.”
Generally, the Wald Z- test shows that the large Wald test statistic values associated to small P-values
provide us more evidence of rejecting the null hypothesis that says all coefficients are equal to zero or all the
odds of interested and baseline/reference levels are equal that means in short odds ratios are equal to one. In
addition to this the values in bracket with coefficients are the standard errors indicating the precision of the
estimation of the parameters and coefficients. The smaller standard errors (S.E) values refer better precisions
and accuracy of estimations and higher standard errors (S.E) values in opposite senses. Here the insignificant
results may not interpreted because no need to interpret statistically insignificant results. For more details
please take look in table 4.7.
The right side values of results in table 4.8, refers to the results related Product/Service Quality
whereas, left side refers to the values related to TQM. According to the results displayed in the table, Omnibus

Assessment of the Effective total quality management on performance at selective colleges in Tigray..
DOI: 10.9790/487X-1808045684 www.iosrjournals.org 73 | Page
Tests of Model Coefficients (𝑋122 = 78.8(𝑃 − 𝑣𝑎𝑙𝑢𝑒 < 0.001)) for presence of TQM practice in the college
indicated that the overall model is statistically significance; whereas, the right side results of table have shown
that, there is no enough evidence of statistical significance of the overall binary logistic regression model
(𝑋122 = 19.813(𝑃 − 𝑣𝑎𝑙𝑢𝑒 = 0.071)) at 5% level of significance. In addition to that, the Hosmer-Lemeshow
Goodness-of-Fit Test for both models with HL statistic (𝑋82 = 12.001(𝑃 − 𝑣𝑎𝑙𝑢𝑒 = 0.151) ) and (𝑋8
2 =3.861(𝑃 − 𝑣𝑎𝑙𝑢𝑒 = 0.869)), led us to do not reject the null hypothesis that says there is no difference between
the observed and predicted values or the model is inadequate for the data; indicating that the both logistic
regression models are good fit to the data.
4.3. Results and Discussions of Management Body’s Data
4.3.1. Factor Analysis for Data Reduction
In real life it is common to have huge number correlated independent and dependent variables. Hence,
it is not easy to manage whole big data and sometimes also many variables are related to each other which lead
the analysis to be affected by multi-co-linearity this in turn mislead us to interpret our results in wrong way.
Thus, it is important to condense similar variables to one factor (constructs). Consequently, data reduction is the
best way for such cases. Data can be reduced by using multivariate statistical techniques so called principal
component analysis (PCA) and factor analysis (FA). In fact, these two techniques can be exploratory in nature;
FA is used as a tool in attempts to reduce a large set of variables to a more meaningful, smaller set of variables.
Beside of this FA is fundamental multivariate model which helps to reduce and condense the data in to
simple and manageable form. Furthermore, it is the best tool to detect the multi-co-linearity problems in
multiple regressions. That‟s why it is applied in this paper.
In our case, the data for management body were collected based on total of 20 independent variables
and 9 dependent variables. All variables are displayed in the appendix C of this paper. Finally, the correlations
of original variables were checked and similar factors were grouped in to particular categories by using factor
analysis. Even though it is not displayed in this paper as it was huge table, the correlations among original
independent factors as well as dependent variables were statistically significant. The twenty (20) independent
variables/factors were condensed in to five (5) components/factors and nine (9) dependent variables were also
condensed in to two (2) components/factors with reasonable inter-correlations and communalities among them.
The total variances explained by latent independent variables/constructs of TQM are displayed in the
table 4.9. Hence, 70.393% of the variability are explained or covered by five latent components/factors such as
leadership, Continues Improvement, Employee Fulfillment, Internal or External Cooperation and Customer
Focus however, the rest 29.607% are explained by others. These variables are so taken as the
independent/explanatory variables for multiple regression models to check the relationship of constructs of
TQM.
Similarly, 76.842% of variability is explained by two latent components/factors such as product/service
quality and satisfaction of employee and customers whereas the rest 23.158% are explained by the rest factors as
shown in table 4.9. Hence, these two latent variables are considered as the dependent or response variables of
TQM constructs in multiple regressions which are shown in later below in this paper. Thus, it is reasonable to
condense the huge variables in to five independent latent variables and two latent response/dependent variables.
Generally, in factor analysis for data reduction principal component analysis technique as an extraction
method and most commonly used rotation method of Varimax with Kaiser Normalization were used by SPSS
and the result is displayed in table C.2 and C.3.
The descriptive statistics of the all original variables are also displayed in the appendix. For further
details refer to table C.1.
4.3.2. Multiple Linear Regression Models
In general multiple linear regressions are the most common form of linear regression analysis. As a
predictive analysis, the multiple linear regressions are used to explain the relationship between one continuous
dependent variable from two or more independent variables. The independent variables can be continuous or
categorical (dummy coded as appropriate). In this case the dependent variables are continuous variables which
are the loads of the factor scores of factor analysis results. In this paper two continuous latent responses and 5
continuous latent independent variables are included after the systematic reduction of data. Thus, the results of
multiple regression models with latent responses satisfaction and product/service quality are displayed in table
4.11 and 4.12 respectively.
Questions:
1. Is there relationship between satisfaction and five latent covariates?
2. Is there relationship between product/service quality and five latent covariates?
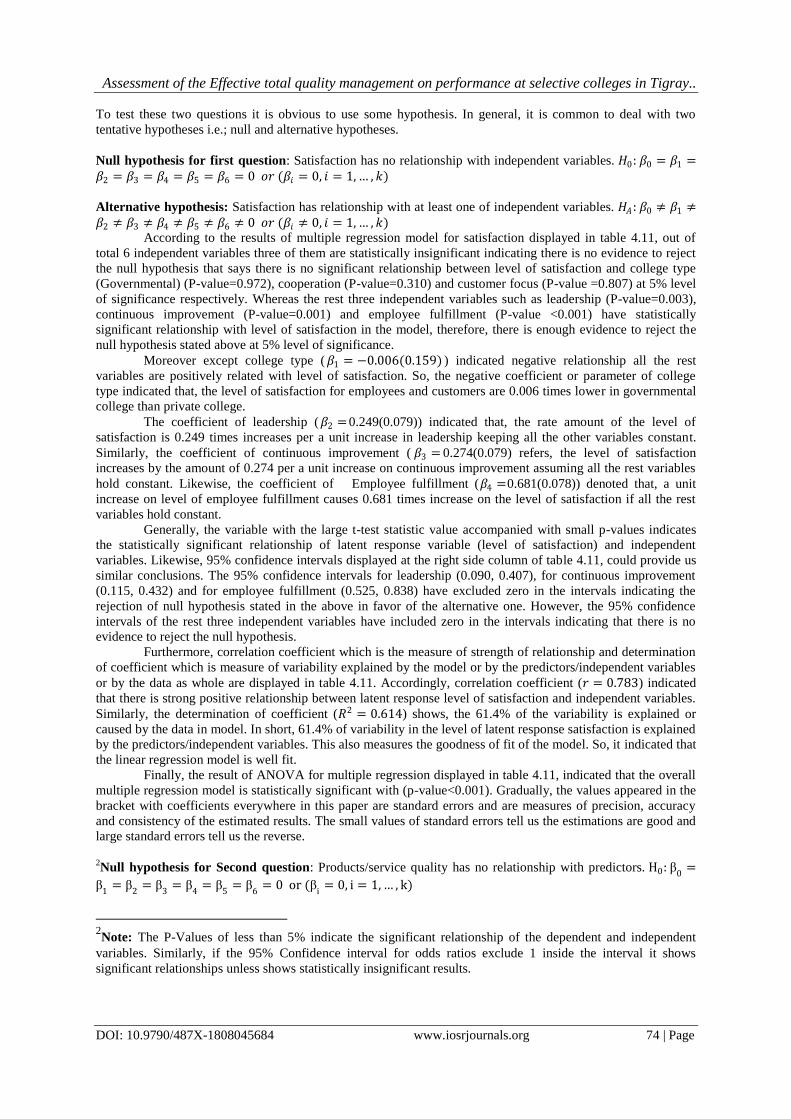
Assessment of the Effective total quality management on performance at selective colleges in Tigray..
DOI: 10.9790/487X-1808045684 www.iosrjournals.org 74 | Page
To test these two questions it is obvious to use some hypothesis. In general, it is common to deal with two
tentative hypotheses i.e.; null and alternative hypotheses.
Null hypothesis for first question: Satisfaction has no relationship with independent variables. 𝐻0: 𝛽0 = 𝛽1 =𝛽2 = 𝛽3 = 𝛽4 = 𝛽5 = 𝛽6 = 0 𝑜𝑟 (𝛽𝑖 = 0, 𝑖 = 1,… , 𝑘)
Alternative hypothesis: Satisfaction has relationship with at least one of independent variables. 𝐻𝐴 : 𝛽0 ≠ 𝛽1 ≠𝛽2 ≠ 𝛽3 ≠ 𝛽4 ≠ 𝛽5 ≠ 𝛽6 ≠ 0 𝑜𝑟 (𝛽𝑖 ≠ 0, 𝑖 = 1,… , 𝑘)
According to the results of multiple regression model for satisfaction displayed in table 4.11, out of
total 6 independent variables three of them are statistically insignificant indicating there is no evidence to reject
the null hypothesis that says there is no significant relationship between level of satisfaction and college type
(Governmental) (P-value=0.972), cooperation (P-value=0.310) and customer focus (P-value =0.807) at 5% level
of significance respectively. Whereas the rest three independent variables such as leadership (P-value=0.003),
continuous improvement (P-value=0.001) and employee fulfillment (P-value <0.001) have statistically
significant relationship with level of satisfaction in the model, therefore, there is enough evidence to reject the
null hypothesis stated above at 5% level of significance.
Moreover except college type (𝛽1 = −0.006(0.159) ) indicated negative relationship all the rest
variables are positively related with level of satisfaction. So, the negative coefficient or parameter of college
type indicated that, the level of satisfaction for employees and customers are 0.006 times lower in governmental
college than private college.
The coefficient of leadership (𝛽2 = 0.249(0.079)) indicated that, the rate amount of the level of
satisfaction is 0.249 times increases per a unit increase in leadership keeping all the other variables constant.
Similarly, the coefficient of continuous improvement ( 𝛽3 = 0.274(0.079) refers, the level of satisfaction
increases by the amount of 0.274 per a unit increase on continuous improvement assuming all the rest variables
hold constant. Likewise, the coefficient of Employee fulfillment (𝛽4 =0.681(0.078)) denoted that, a unit
increase on level of employee fulfillment causes 0.681 times increase on the level of satisfaction if all the rest
variables hold constant.
Generally, the variable with the large t-test statistic value accompanied with small p-values indicates
the statistically significant relationship of latent response variable (level of satisfaction) and independent
variables. Likewise, 95% confidence intervals displayed at the right side column of table 4.11, could provide us
similar conclusions. The 95% confidence intervals for leadership (0.090, 0.407), for continuous improvement
(0.115, 0.432) and for employee fulfillment (0.525, 0.838) have excluded zero in the intervals indicating the
rejection of null hypothesis stated in the above in favor of the alternative one. However, the 95% confidence
intervals of the rest three independent variables have included zero in the intervals indicating that there is no
evidence to reject the null hypothesis.
Furthermore, correlation coefficient which is the measure of strength of relationship and determination
of coefficient which is measure of variability explained by the model or by the predictors/independent variables
or by the data as whole are displayed in table 4.11. Accordingly, correlation coefficient (𝑟 = 0.783) indicated
that there is strong positive relationship between latent response level of satisfaction and independent variables.
Similarly, the determination of coefficient (𝑅2 = 0.614) shows, the 61.4% of the variability is explained or
caused by the data in model. In short, 61.4% of variability in the level of latent response satisfaction is explained
by the predictors/independent variables. This also measures the goodness of fit of the model. So, it indicated that
the linear regression model is well fit.
Finally, the result of ANOVA for multiple regression displayed in table 4.11, indicated that the overall
multiple regression model is statistically significant with (p-value<0.001). Gradually, the values appeared in the
bracket with coefficients everywhere in this paper are standard errors and are measures of precision, accuracy
and consistency of the estimated results. The small values of standard errors tell us the estimations are good and
large standard errors tell us the reverse.
2Null hypothesis for Second question: Products/service quality has no relationship with predictors. H0: β
0=
β1
= β2
= β3
= β4
= β5
= β6
= 0 or (βi
= 0, i = 1,… , k)
2Note: The P-Values of less than 5% indicate the significant relationship of the dependent and independent
variables. Similarly, if the 95% Confidence interval for odds ratios exclude 1 inside the interval it shows
significant relationships unless shows statistically insignificant results.

Assessment of the Effective total quality management on performance at selective colleges in Tigray..
DOI: 10.9790/487X-1808045684 www.iosrjournals.org 75 | Page
Alternative hypothesis:Products/service quality has relationship with at least one of predictor. HA : β0≠ β
1≠
β2≠ β
3≠ β
4≠ β
5≠ β
6≠ 0 or (β
i≠ 0, i = 1,… , k)
According to the results of multiple regression model for latent response variable products/service
quality displayed in table 4.12, out of total 6 independent variables two of them are statistically insignificant
indicating there is no evidence to reject the null hypothesis that says there is no relationship between
products/service quality and college type (Governmental) (P-value=0.799), customer focus (P-value=0.266) at
5% level of significance. Whereas the rest four independent variables such as leadership (P-value<0.001),
continuous improvement (P-value=0.001), employee fulfillment (P-value <0.001) and cooperation (P-
value=0.035) have statistically significant relationship with level of product/service quality in the model;
therefore, there is enough evidence to reject the null hypothesis stated above at 5% level of significance.
Moreover, except college type (𝛽1 = −0.045(0.175)) and also surprisingly customer focus (𝛽6 =-
0.095(0.085)) indicated negative relationship, all the rest variables are positively related with level of
product/service quality. So, the negative coefficient or parameter of college type indicated that, the level of
product/service quality is 0.045 times lower in governmental college than private college. Similarly, the
negative coefficient of level of customer focus indicated that, the level of product/service quality declined by
0.095 per unit increase on level of customer focus.
The coefficient of leadership ( 𝛽2 = 0.413 (0.105)) indicated that, the rate amount of level of
products/service quality increases by rate of 0.413 per a unit increase in level of leadership if all the other
variables kept constant. Similarly, the coefficient of level of continuous improvement (𝛽3 =0.285 (0.086) refers,
the level of product/service quality increases by the amount of 0.285 per a unit increase in continuous
improvement assuming all the rest variables hold constant. Likewise, the coefficient of employee fulfillment
(𝛽4 =0.663 (0.085)) denoted that, a unit increase on employee fulfillment causes 0.681 times increase on the
product/service quality if all the rest variables hold constant. The coefficient of cooperation ( 𝛽5 =0.226(0.105)) also indicated that, a unit increase on cooperation causes 0.226 times increase on the level of
product/service quality if all the rest kept constant.
Generally, the variable with the large test statistic value which is t-values accompanied with small p-
values indicates the statistically significant relationship of latent response variable (level of product/service
quality) with independent variables. Likewise, 95% confidence intervals displayed at the right side column of
table 4.12, could provide us similar conclusions. The 95% confidence intervals for leadership (0.203, 0.623), for
continuous improvement (0.114, 0.456), for employee fulfillment (0.494, 0.833) and for cooperation (0 .016,
0.436) have excluded zero in the intervals indicating the rejection of null hypothesis stated in the above in favor
of the alternative one. However, the 95% confidence intervals of the rest two independent variables have
included zero in the intervals indicating that there is no evidence to reject the null hypothesis.
Furthermore, correlation coefficient which is the measure of strength of relationship and determination
of coefficient which is measure of variability explained by the model or by the predictors/independent variables
or by the data as whole are displayed in table 4.12. Accordingly, correlation coefficient (𝑟 = 0.741) indicated
that there is strong positive relationship between latent response variable level of satisfaction and independent
variables.
Similarly, the determination of coefficient (𝑅2 = 0.549 ) shows, the 54.9% of the variability is
explained or caused by the data in model. In short, 54.9% of the latent response/dependent variable level of
product/service quality is explained by the predictors/independent variables. This also measures the goodness of
fit of the model. So, it indicated that the regression model is fair fit.
Finally, the result of ANOVA for multiple regression displayed in table 4.12, indicated that the overall
multiple regression model is statistical significant with (p-value<0.001).
Gradually, the values appeared in the bracket with coefficients everywhere in this paper are standard
errors and are measures of precision, accuracy and consistency of the estimated results. The small values of
standard errors tell us the estimations are good and large standard errors tell us the reverse. Furthermore, the
standard errors are very important to calculate confidence intervals and estimate coefficients in the model.
Finally, multiple linear regression models for both latent response variables which are the constructs of
TQM showed that there are enough association among the latent dependent variables/constructs of TQM and
latent independent variables/constructs of TQM.
V. Discussions Based on different well organized literatures and analysis that were included in this thesis, some
discussions and review of works are organized as following.
This study was conducted on the title, assessment of the Effective total quality management on
performance at selective colleges in Tigray regional administrative State, Ethiopia. Particularly, it was
concerned with TEVT colleges of eastern zone of Tigray regional state. In summary, the study dealt with TQM

Assessment of the Effective total quality management on performance at selective colleges in Tigray..
DOI: 10.9790/487X-1808045684 www.iosrjournals.org 76 | Page
on performanceand was done based on a number of literature studies dealing with (TQM) in general and (TQM)
in education and higher education in particular.
The study was organized by referring the standard of international standardization Organization (ISO
9001), Six Sigma and the Malcolm Baldrige National Quality Award. The constructs of TQM were designed in
line to those standards by reviewing some literatures mentioned in chapter two of this paper.
The good idea of this paper is unlike most of literatures it was not focused only on the opinion of
president/dean of the colleges rather included the opinion of the other stakeholders like students/customers and
employees of the colleges in order to get the feedback from both sides. This could reduce and compensate the
biases due to the solely responses of leading body.
In some literatures the Cronbach‟s alpha reliability test was performed on all TQM constructs by
Hoang D.T. et al., (2010), to assess the reliability of the collected data. Whereas in this paper even though the
reliability was checked, the results of Cronbach‟s alpha were not included. Multiple linear regression for
management data and binary logistic regressions for data that collected from sample of all stakeholders were
performed to assess the associations of some TQM constructs.
Unlike some literatures included that many constructs of TQM variables such as appeared in this paper,
this study excluded some variables that are constructs of TQM because of some constraints. For instance,
Riccardi, et al. (2009) in their dissertation paper entitled “Perceptions of community college presidents: total
quality management performance measures at their colleges”, they included variables, learning, process
management, operational efficiency, public responsibility, financial effectiveness, leadership, continuous
improvement, internal/external cooperation, customer focus, employee fulfillment, customer satisfaction,
employee satisfaction, product/service quality whereas in this paper only some of the constructs of TQM were
included.
In short the study covered only some latent constructs of TQM that are five independent and two
dependent latent variables after the technical and careful reduction of data by using factor analysis methods.
Thus, finally, the investigator came up with latent independent variables/constructs of TQM such as leadership,
continuous improvement, employee fulfillment, internal/external cooperation and customer focus and latent
dependent variables/constructs of TQM so called level of satisfaction and level of product/service quality.
In this paper, unlike paper of Riccardi, et al. (2009) who modeled several multiple regression models
with several independent and dependent variables, only two multiple linear regression models with two latent
dependent variables level of satisfaction and product quality and five latent independent variables and college
type were fitted .
According to results of Riccardi, et al. (2009), customer focus was a significant positive predictor of
level of product/service quality, with𝐹 1, 161 = 134.71,𝛽 = 0.68,𝑅2 = .46,𝑃 − 𝑣𝑎𝑙𝑢𝑒 < .01. However,
in contrast to that, in this finding there is statistically negative and insignificant relationship between latent
response level of product/service quality and latent predictor customer focus 𝛽6 = −0.095 0.085 , 𝑝 −𝑣𝑎𝑙𝑢𝑒 =0.266.
In this finding, the level of continuous improvement (𝛽6 = 0.249(0.079), P − value = 0.001) was
statistically significant positive latent predictor of latent response level of satisfaction. However, in contrast, it
was statistically insignificant predictor (P-value= 0.338) of level of satisfaction (Riccardi, et al., 2009).
Furthermore, Riccardi, et al. (2009) in their findings of multiple linear regression after the reduction of
data using factor analysis, they reported that leadership (P-value=0.266) was statistically insignificant in their
model showing no relation between leadership and level of satisfaction. Whereas in opposite to that, in this
finding leadership is statistically significant latent predictor of latent response level of satisfaction with p-value=
0.003.
Moreover, this finding has shown that, employee fulfillment (𝛽4 = 0.681 0.078 , P − value < 0.001)
is statistically significant positive latent predictor of level of satisfaction. This relationship is in line with the
research conducted by Riccardi, et al. (2009) that employee fulfillment (𝛽 = 0.35 0.09 ,𝑃 − 𝑣𝑎𝑙𝑢𝑒 < 0.001)
with employee satisfaction. Likewise, the finding revealed that, there is no statistically significant relationship
between latent response variable level of satisfaction and latent predictor internal/external cooperation (𝛽4 =0.080 0.078 ,𝑃 − 𝑣𝑎𝑙𝑢𝑒 = 0.310). The finding is consistent with the latest literature Riccardi, et al. (2009)
that reported association between predictor internal/external cooperation (𝛽 = 0.0.02 0.09 ,𝑃 − 𝑣𝑎𝑙𝑢𝑒 = 0.87)
satisfaction was not significant.
VI. Conclusions and Recommendations 6.1. Conclusions
The main aim of this study was to assess the Effective total quality management on performance at
selective colleges in Tigray regional administrative State, Ethiopia particularly, TEVT colleges in eastern zone
of Tigray.

Assessment of the Effective total quality management on performance at selective colleges in Tigray..
DOI: 10.9790/487X-1808045684 www.iosrjournals.org 77 | Page
This study investigated whether there is a significant difference in the TQM constructs implemented
between private and governmental colleges. The study also elaborated the relationship between level of two
latent response variables and five latent independent variables which are in turn indicators of TQM accompanied
by type of college. Opinions of management body from 7 core positions or structures in each college were
collected. Thus, total of 70 leaders each 7 from each college were questioned about the situations of TQM in
their colleges. Two multiple linear regressions with latent response variables level of satisfaction and level of
product/service quality were fitted.
Unlike other related literatures this study incorporated several types of opinions from different
stakeholder which in turn help to reduce and compensate the response biases that might be occurred from one
side stakeholders and these characteristics made this paper somewhat special from others.
Besides of multiple regression models for leaders‟ opinion, two binary logistic regression models with
dichotomous response variables availability of TQM (Yes/No) and product/service quality (Yes/No) were
modeled. In this study some documents and reports of each college were reviewed and some physical
interviews were also performed. According to interviews, observations and annual and monthly reports of the
college, almost more than half of colleges do practice TQM in their management but still not enough in
implementations. Some of them also practiced but not successful on it and very few of them totally do not apply.
Similar, opinions were reported from the open ended questionnaires.
This paper included several questions with several variables especially in collecting leaders. Therefore,
the numbers of huge variables were collected. Gradually, by using multivariate statistical technique so called
factor analysis, the huge numbers of variable were reduced and condensed in to only few numbers of latent
variables i.e.; five independent and two dependent variables which are the constructs of TQM. As the result for
factor analysis in chapter four indicated, out of total 20 variables, 70.393% of the variability were explained or
covered by five latent components/factors such as leadership, Continues Improvement, Employee Fulfillment,
Internal or External Cooperation and Customer Focus however, the rest 29.607% were explained by rests.
These variables were so taken as the independent/explanatory variables for multiple regression models to check
the relationship of constructs of TQM.
Similarly, out of total of 9 variables, 76.842% of variability was explained by two latent
components/factors such as level of product/service quality and level of satisfaction for employee and customers
whereas the rest 23.158% are explained by the rest factors as shown in table 4.9. Hence, these two variables
were considered as the latent dependent or response variables of TQM constructs in multiple regressions.
Finally, according to results of multiple linear regression models both level of satisfaction and
product/service quality had statistically significant positive relationship with leadership, continuous
improvement and employee fulfillment. Whereas, surprisingly customer focus was negatively related with level
of product/service quality and also it was not significantly associated with both level of satisfaction and
product/service quality. This perhaps happened due to the exclusion of some important and relevant variables in
the model.
Moreover, according to the results of binary logistic regression model, the existence of TQM practice is
positively associated with all independent variables except employee fulfillment dummy variable two
“employee is complete” relative to the reference level “employee is not full” which is negatively related with it.
Furthermore, except three dummy variables i.e., period(2) which is long period of working experience of the
colleges (𝑃 − 𝑣𝑎𝑙𝑢𝑒 = 0.084) , availability of internal/external cooperation(Yes) (𝑃 − 𝑣𝑎𝑙𝑢𝑒 = 0.417) and
quality improvement counsels(Yes) (𝑃 − 𝑣𝑎𝑙𝑢𝑒 = 0.192) all the rest variables have statistically significant
association with existence of TQM practice.
Similarly, the existence of level of latent response product/service quality is positively associated with
all independent variables except two dummy variables medium period of work experience of the colleges (-
0.266(0.282)) relative to the reference level i.e.; “short period of work experience” and employee fulfillment
dummy variable two, this is employee is complete (-0.127(0.238)) relative to the reference level “employee is
not full” which are negatively related with it. Furthermore, except three variables i.e.; leadership with dummy
variables long-range orientation, coaching management style and Clarity of vision (P-values =0.024, 0.007,
0.014) respectively, continuous improvement (P-value=0.035) and employee fulfillment with dummy variable
partially full (P-value=0.040) are statistically significant relative to their respective reference levels Plan and
implement change, No, and not full respectively all the rests are statistically insignificant
Finally, After passing many procedures the results and discussions of this paper elaborated that the
strength of the relationship between latent dependent variables level of product/service quality and satisfaction
with latent independent variables suggests that TQM practitioners should place more importance on leadership,
continuous improvement, internal/external cooperation, employee fulfillment and customer focuses if they wish
to see a subsequent increase in product/service quality and satisfaction of employees and customers or students.

Assessment of the Effective total quality management on performance at selective colleges in Tigray..
DOI: 10.9790/487X-1808045684 www.iosrjournals.org 78 | Page
This study was not limited only on statistical evidence but also empirical study was incorporated by
reviewing the literatures and related documents of different colleges in order to assess the efficacy and adequacy
of TQM on performance.
6.2. Recommendations
Based on the results and discussions the following ideas are recommended.
As an appropriate and relevant data directly related to the qualities and nature of the research, in the
case of limited quality data, the associations of factors or covariates with outcome variables could not be
assessed. Regarding data collection, special efforts are needed to get data of better quality.
The leaders of colleges should update their activities within short time in order to check whether their
management system is going in good track or not.
All TQM practitioners should place more emphasis on the performance and implementation than
simple draft. So they can evaluate their TQM efficacy and effectiveness on performance.
Generally, continuous evaluation of TQM on performance is highly recommended in order to sustain
their implementations.
6.3. Limitations
The investigation was intended to identify the relationship of constructs of TQM in brief however; there were a
lot of constraints starting form data collection up to the end of the works. Some of them are listed here below:
As sample size was large enough it was difficult to print, copy, distribute and collect the questionnaire for
individual respondents.
The respondents were not available at exact time and it credits cost and time crisis.
Some variables were not included in the models due to financial and time constraints and that in turn might
have been negative effect in the work.
Generally these are some of the several constraints and limitations.
Acknowledgement First and foremost I must give thanks to almighty God for all the blessings he bestowed upon me till
today.Then I want to express my sincere gratitude and appreciation to my advisor his Excellency ZaidNegash
(PHD, President of Adigrat University) for his advice and encouragement from inception up to completion.
Secondly my sincere thanks go to my co-advisor Mr. Haftu Girmay (MA) for his excellent advices and
guidance in all aspects.Thirdly my heartfelt gratitude and thanks is extended to my department staffs as whole
for allowing me to do my MA thesis on this title and also for their good encourage in my course studies.I would
like to take this opportunity to express my heartiest appreciation to my beloved brother Yemane Hailu (PHD
Scholar of Biostatistics) for his unlimited and insightful guidance, consistent support, and impressive
encouragement in this paper work from inception up to completion.Finally, and most importantly my deepest
gratitude goes to Aba Tomas Weldesilasie, Mehret Hailu, NiguseKahsay, my mother, my brothers and sisters,
TeberihTesfay, TeameHagos and all my friends who were greatly involved in my work in any means. Last but
not the least my special thanks go to respondents and college staffs for their kind responses and supports.
Reference [1]. Abu nabaa, A., &Massad, F. (2000). Total quality management in educational Institutions. Journal of Manama, 5, 10-25.
[2]. Agresti, A. (1990). Categorical Data Analysis. New York: Wiley.
[3]. Ahire, L.S., Golhar, D.Y., & Waller, M.A. (1996). Development and validation of TQM implementation constructs. Decision Sciences, 27, 23–56.
[4]. Al-gmeez, N. (2004). The exactest of applying standards of (TQM) at the ministry of higher education in Saudi Arabia from the
perspective of managers and heads of departments. Unpublished MA thesis, Yarmouk University, Irbid, Jordan. [5]. Ali. M. and Shastri. R. K. (2010). Implementation of Total Quality Management in higher education.Asian Journal of Business
Management, 2 (1], pp. 9-16.
[6]. Alkazaz, I. (2001). The practical application of requirements of ISO 2000-9001 for quality system. (pp.129-140), Baghdad: ALashqar for printing.
[7]. Al-Khafaji, A., &Babairman, S. (1995). Strategic planning and TQM in academic institutions. Journal of Financial and Banking
Studies, 2, 99-115. [8]. Al-Saud, R. (2002). Total Quality Management: A model proposed for the development of school management in Jordan. Journal of
the University of Damascus, 18, 63-78.
[9]. Anderson, J., Rungtusanatham, M. & Schroeder, R. (1994).A theory of quality management underlying the Deming management method. The Academy of Management Review, 19(3), 472-509.
[10]. Anderson, J.C., & Gerbing, D.W. (1988). Structural equation modeling in practice: A review and recommended two-step approach. Psychological Bulletin, 103, 411–423.
[11]. Ani, K. (2002).TQM and the requirements of ISO 9000. (1st ed). Baghdad: Alshagar Press.
[12]. Arjomandi, M., C. Kestell and P. Grimshaw. 2009. An EFQM Excellence Model forhigher education quality assessment. [online] [Accessed 14 October 2010], Available from: http://www.google.co.uk/search?sourceid=navclient&ie=UTF8&rlz=1T4SKPB_
enGB39 2GB93&q=An+EFQM+excellence+modle+for+higher+education+quality+assessment.

Assessment of the Effective total quality management on performance at selective colleges in Tigray..
DOI: 10.9790/487X-1808045684 www.iosrjournals.org 79 | Page
[13]. Ayoub, A. (2000). The effectiveness of the use of Total Quality Management in the Development of the Performance of the
Jordanian Universities.Unpublished MA thesis, Yarmouk University, Irbid, Jordan.
[14]. Barnett, R. (1992). Improving Higher Education. Suffolk: St Edmundsbury Press Limited. [15]. Burkhalter, B.B. (1996). How can institutions of higher education achieve quality within the new economy? Total Quality
Management, 7(2), 153-160.
[16]. CEPES. (2009). UNESCO Forum on Higher Education in the Europe Region: Access,Values, Quality and Competitiveness. [online] [Accessed 03 December 2010] Available from: http://www.cepes.ro/forum/pdf/welcomenote.pdf.
[17]. Cornesky, R. (1994). Using Deming to improve Quality at Colleges and Universities. New York: man publications.
[18]. Dagher, M. (2001). Total quality management strategy: an approach to the development of higher education in the Arab world. Paper presented at the first Arab Thought Forum: international standards for Universities. July 24-26, 2001. Baghdad, Iraq.
[19]. Damtew T. (2005) Private Higher Education in Ethiopia: The Current Landscape
[20]. Daradkeh, M., &Shibli, T. (2002).Quality at modern organizations. Amman: Dar Safa for printing. [21]. Decosmo, R. (1991). Total quality managements in higher education. San.Francisco, CA: Jossey Bass
[22]. Dillman, D.A. (2007). Mail and internet surveys: The tailored design method (2nd ed.). Hoboken, NJ: John Wiley & Sons.
[23]. Frazier, A. 1997.A roadmap for quality transformation in education.Boca Raton, Fla.: St. Lucie Press. [24]. Grandzol, J.R. &Gershon, M. (1997). Which TQM practices really matter: An empirical investigation. Quality Management
Journal, 4(4), 43-59.
[25]. Grandzol, J.R. &Gershon, M. (1998).A survey instrument for standardizing TQM modeling research. International Journal of Quality Science, 3(1), 80-105.
[26]. Gueorguie, T. (2006), Quality Management in Higher Education
[27]. Gupta, S. K. (1993). Quality Improvement in Teaching.Explorations in Teaching andLearning.3(3], pp. 4-5 [28]. Hair, J.F., Anderson, R.E., Tatham, R.L., & Black, W.C. (1998).Multivariate data analysis. Upper Saddle River, NJ: Prentice-Hall
International Inc.
[29]. Harvey, L. and A. Burrows, 1992. „Empowering students‟, New Academic.1(3]: pp. 2–3. [30]. Ho, S.K., &Wearn, K. (1995). A TQM model for higher education and training.Training for Quality, 3(2), 25–33.
[31]. Hoang D.T. et al., (2010). Total quality management (TQM) strategy and organizational characteristics: Evidence from a recent
WTO member aUniversity of Economics, Hochiminh City, Vietnam; bSchool of Management, Asian Institute of Technology, Pathumthani 12120, Thailand; cIndustrial Engineering Department, Faculty of Engineering, Thammasat University, Pathumthani
12121, Thailand. Vol. 21, No. 9, 931–951.
[32]. Hosmer, DW Jr. and Lemeshow, S. (2000). Applied Logistic Regression, second edition. New York: Wiley. [33]. Ibrahim, I. (2001). Planning, development and education: vision for the future. First edition, Amman: Dar Zahran for publication
and distribution.
[34]. Johnston, R., (1978). Multivariate Statistical Analysis in Geography. [35]. Kline, R.B. (1998). Principles and practice of structural equation modeling. New York: The Guilford Press.
[36]. Klocinski, J. (1999). Evaluation of success and failure factors and criteria in the Implementation of total quality management
principles in administration at selected institutions of higher education.PhD thesis, University of Toledo, Toledo, OH. [37]. Morgan, C., &Murgatroyd, S. (1997). Total quality management in the public sector. Buckingham, UK: Open University Press.
[38]. Nesbary, D.K. (2000). Survey research and the World Wide Web. Needham Heights, MA: Allyn and Bacon.
[39]. Nunnally, J., &Burnstein, I.H. (1994).Pschychometric theory (3rd ed.). New York: McGraw Hill.
[40]. Oakland, J. S. 2003. Total Quality Management: text and cases, Oxford: ButterworthHeinemann.
[41]. Pandi.A.P., Rao, U.S. and Jeyathilagar, D. (2009). A Study of Integrated Total Quality Management, Practice in Technical Institutions Students Perspective. International Journal of Educational Administration, 1(1], pp. 17-30.
[42]. Petrides, L.A. (2003). Strategic planning and information use: The role of institutional leadership in the community college. On the
Horizon, 11(4), 10-14. [43]. Prajogo, D.I., & Sohal, A.S. (2003). The multidimensionality of TQM practices in determining quality and innovation performance
– an empirical examination. Technovation, 24, 443–453.
[44]. Riccardi, M.T., Venneberg, D., Makela C. (2009). Perceptions of community college presidents: total quality management performance measures at their colleges. Dissertation submitted to school of Education, Colorado State University Fort Collins,
Colorado.
[45]. Saeed, H. (2001). Total quality management in higher education, a survey of a sample of professors and students of the faculties of Economics and Administration at the University of Baghdad and Mustansiriya. Unpublished MA Thesis, University of Baghdad,
Baghdad, Iraq.
[46]. Saint, W. (2004) Higher Education in Ethiopia: The Vision and its Challenges, Boston College & Council for the Development of Social Science Research in Africa
[47]. Samson, D., & Terziovski, M. (1999).The relationship between total quality management practices and operational performance.
Journal of Operations Management, 17, 393–409. [48]. Sanyal, B. (1998). Strategies for higher education in Asia and the pacific in the past Cold-war era.11EP, contributions No.29.
[49]. Sims, S.J. and Sims, R.R. (1995).Total Quality Management in Higher Education: isit working? Why or why not? London: Praegar.
[50]. Singh V, Grover S. and Kumar. A. 2008. Evaluation of Quality in an Educational Institute: a quality function deployment approach. Educational research Review, 3(4], pp.162 168.
[51]. Smith.Armstrong, H, M. and Brown, S. (1999).Benchmarking andThreshold Standers in Higher Education.San Francisco: Jossey-
Bass. [52]. Suleiman, A. (1979). Mission and objectives of University education in a changing World.A series of silver jubilee, 3, 12-27.
[53]. Taylor, A.L., & Karr, S. (1999). Strategic planning approaches used to respond to issues confronting research universities.
Innovative Higher Education, 23(3), 221-234. [54]. Voehl, F. (1994).Total Quality in Higher Education.Florida: St. Lucie Press.
[55]. Wahbe, N. (2003). Nature of education and quality. Beirut, Lebanon: NakhlehWehbeh Publisher.
[56]. Walton, M. (1985).The Deming management method. NY: Putnam publishing group. [57]. Warner, D. and Palfreyman.D. (2000).Higher Education Management: The KeyElement. Suffolk: St Edmundsbury Press Ltd.
[58]. Zink, K. and Vob, W. (2000).The new EFQM excellence model and its impact on higher education institutions.In: Proceedings of
the TQM for Higher Education InstitutionsConference: Higher Education Institutions and the Issue of Total Quality, 30–31 August, 1999 Verona. pp. 241–55.

Assessment of the Effective total quality management on performance at selective colleges in Tigray..
DOI: 10.9790/487X-1808045684 www.iosrjournals.org 80 | Page
Table 4.1 Frequency Distribution of the respondents of each college Type of college
Private Governmental Total Count Row
N %
Table
N %
Column
N %
Count Row
N %
Table
N %
Column
N %
Count Table
N %
Sex Female 46 37.7 12.6 33.6 76 62.3 20.8 33.3 122 33.4
Male 91 37.4 24.9 66.4 152 62.6 41.6 66.7 243 66.6 Total 137 37.5 37.5 100.0 228 62.5 62.5 100.0 365 100.0
Age of respondents
<21 50 41.3 13.7 36.5 71 58.7 19.5 31.1 121 33.2
21-30 76 39.6 20.8 55.5 116 60.4 31.8 50.9 192 52.6
31-40 7 21.9 1.9 5.1 25 78.1 6.8 11.0 32 8.8
41-50 1 10.0 0.3 0.7 9 90.0 2.5 3.9 10 2.7
>50 3 30.0 0.8 2.2 7 70.0 1.9 3.1 10 2.7 Total 137 37.5 37.5 228 62.5 62.5 100.0 365 100.0
Year of stay
in the college
Short 50 36.5 13.7 36.5 87 63.5 23.8 38.2 137 37.5
Medium 44 43.6 12.1 32.1 57 56.4 15.6 25.0 101 27.7
Long 43 33.9 11.8 31.4 84 66.1 23.0 36.8 127 34.8
Total 137 37.5 37.5 100.0 228 62.5 62.5 100.0 365 100.0
Position of
the
respondents
Customer/Student 129 38.7 35.3 94.2 204 61.3 55.9 89.5 333 91.2
Employee 8 25.0 2.2 5.8 24 75.0 6.6 10.5 32 8.8 Total 137 37.5 37.5 100.0 228 62.5 62.5 100.0 365 100.0
Table 4.2 Frequency Distribution of the positions of respondents in each college Colleges Position of the respondents in the college Customer/Student Employee Total
Count Row N %
Table N %
Column N %
Count Row N %
Table N %
Column N %
Count Table N %
College ID
indicated
GC1 70 90.9% 19.2% 21.0% 7 9.1% 1.9% 21.9% 77 21.1%
GC2 27 87.1% 7.4% 8.1% 4 12.9% 1.1% 12.5% 31 8.5%
GC3 43 86.0% 11.8% 12.9% 7 14.0% 1.9% 21.9% 50 13.7%
GC4 61 92.4% 16.7% 18.3% 5 7.6% 1.4% 15.6% 66 18.1%
GC5 3 75.0% 0.8% 0.9% 1 25.0% 0.3% 3.1% 4 1.1%
Subtotal 204 89.5% 55.9% 61.3% 24 10.5% 6.6% 75.0% 228 62.5%
PC1 34 89.5% 9.3% 10.2% 4 10.5% 1.1% 12.5% 38 10.4%
PC2 54 98.2% 14.8% 16.2% 1 1.8% 0.3% 3.1% 55 15.1%
PC3 12 92.3% 3.3% 3.6% 1 7.7% 0.3% 3.1% 13 3.6%
PC4 18 94.7% 4.9% 5.4% 1 5.3% 0.3% 3.1% 19 5.2%
PC5 11 91.7% 3.0% 3.3% 1 8.3% 0.3% 3.1% 12 3.3%
Subtotal 129 94.2% 35.3% 38.7% 8 5.8% 2.2% 25.0% 137 37.5%

Assessment of the Effective total quality management on performance at selective colleges in Tigray..
DOI: 10.9790/487X-1808045684 www.iosrjournals.org 81 | Page
Total 333 91.2% 91.2% 100.0% 32 8.8% 8.8% 100.0% 365 100.0%
Table 4.3 Frequency Distribution of the respondents‟ opinion on Practice of TQM and Product and or/Service
Quality of their college Type of college
Private Governmental
Count Row N %
Table N %
Column N %
Count Row N %
Table N %
Column N %
Count Table N %
TQM Practice
No 48 42.5% 13.2% 35.0% 65 57.5% 17.8% 28.5% 113 31.0%
Yes 89 35.3% 24.4% 65.0% 163 64.7% 44.7% 71.5% 252 69.0% Subtotal 137 37.5% 37.5% 100.0% 228 62.5% 62.5% 100.0% 365 100.0%
Product or service
quality
No 63 38.4% 17.3% 46.0% 101 61.6% 27.7% 44.3% 164 44.9%
Yes 74 36.8% 20.3% 54.0% 127 63.2% 34.8% 55.7% 201 55.1%
Subtotal 137 37.5% 37.5% 100.0% 228 62.5% 62.5% 100.0% 365 100.0%
Total 137 37.5% 37.5% 100.0% 228 62.5% 62.5% 100.0% 365 100.0%
Table 4.4 The respondents‟ opinion on availability of CI, cooperation and QIC in their colleges. Type of college
Private Governmental Total
Count Row N %
Column N %
Table N %
Count Row N %
Column N %
Table N %
Count
Table N %
Continuous improvement
No 122 36.3% 89.1% 33.4% 214 63.7% 93.9% 58.6% 336 92.1%
Yes 15 51.7% 10.9% 4.1% 14 48.3% 6.1% 3.8% 29 7.9%
Internal /External Cooperation
No 83 40.9% 60.6% 22.7% 120 59.1% 52.6% 32.9% 203 55.6%
Yes 54 33.3% 39.4% 14.8% 108 66.7% 47.4% 29.6% 162 44.4% Quality
improvement
Counsel
No 44 38.6% 32.1% 12.1% 70 61.4% 30.7% 19.2% 114 31.2%
Yes 93 37.1% 67.9% 25.5% 158 62.9% 69.3% 43.3% 251 68.8% Total 137 37.5% 100.0% 37.5% 228 62.5% 100.0% 62.5% 365 100.0%
Table 4.5 The respondents‟ opinion on kind of leadership and employee fulfillment in colleges. Type of college
Private Governmental Total
Count Row N
%
Column N
%
Table N
%
Count Row N
%
Column N
%
Table N
%
Count Table N
%
KOL CV 47 37.3% 34.3% 12.9% 79 62.7% 34.6% 21.6% 126 34.5%
LRO 26 30.2% 19.0% 7.1% 60 69.8% 26.3% 16.4% 86 23.6%
CMS 22 40.0% 16.1% 6.0% 33 60.0% 14.5% 9.0% 55 15.1%
EMEMP 18 35.3% 13.1% 4.9% 33 64.7% 14.5% 9.0% 51 14.0%
PIC 24 51.1% 17.5% 6.6% 23 48.9% 10.1% 6.3% 47 12.9% EMF Not Full 24 46.2% 17.5% 6.6% 28 53.8% 12.3% 7.7% 52 14.2%
Partially
Full
62 35.2% 45.3% 17.0% 114 64.8% 50.0% 31.2% 176 48.2%
Complete 51 37.2% 37.2% 14.0% 86 62.8% 37.7% 23.6% 137 37.5%
Total 137 37.5% 100.0% 37.5% 228 62.5% 100.0% 62.5% 365 100.0%
Table 4.6 Binary Logistic Regression for Practice on TQM Variables in the Equation
B S.E. Wald df Sig. Exp(B) 95% C.I.for EXP(B)
Lower Upper Constant -1.469 0.570 6.654 1 0.010 0.230
Step 1a TypeC(1) 0.924 0.352 6.890 1 0.009 2.520 1.264 5.024
Period(1) 1.150 0.335 11.797 1 0.001 3.158 1.638 6.087
Period(2) 0.942 0.546 2.976 1 0.084 2.566 0.880 7.485
KOL(1) 0.872 0.430 4.112 1 0.043 2.392 1.030 5.556
KOL(2) 1.707 0.499 11.680 1 0.001 5.510 2.071 14.662
KOL(3) 1.334 0.479 7.747 1 0.005 3.794 1.484 9.704
KOL(4) 0.931 0.403 5.345 1 0.021 2.538 1.152 5.590
CI(1) 1.156 0.561 4.242 1 0.039 3.176 1.057 9.538
Cooperation(1) 0.211 0.260 0.660 1 0.417 1.235 0.742 2.053
QIC(1) 0.375 0.287 1.705 1 0.192 1.455 0.829 2.556
Employee(1) 1.646 0.639 6.636 1 0.010 5.184 1.482 18.129
Employee(2) -1.029 0.266 14.963 1 0.000 0.358 0.212 0.602
Table 4.7 Binary Logistic Regression for Product and /or Service Quality Variables in the Equation
B S.E. Wald df Sig. Exp(B) 95% C.I.for EXP(B) Lower Upper

Assessment of the Effective total quality management on performance at selective colleges in Tigray..
DOI: 10.9790/487X-1808045684 www.iosrjournals.org 82 | Page
Constant -1.385 0.620 4.993 1 0.025 0.250
Step 1a TypeC(1) 0.001 0.283 0.000 1 0.996 1.001 0.575 1.745
Period(1) -0.266 0.282 0.894 1 0.344 0.766 0.441 1.331
Period(2) 0.112 0.477 0.055 1 0.814 1.119 0.439 2.850
KOL(1) 0.887 0.393 5.104 1 0.024 2.428 1.125 5.240
KOL(2) 1.162 0.428 7.367 1 0.007 3.198 1.381 7.403
KOL(3) 0.837 0.427 3.836 1 0.050 2.310 0.999 5.338
KOL(4) 0.915 0.372 6.038 1 0.014 2.496 1.203 5.179
CI(1) 0.876 0.415 4.453 1 0.035 2.400 1.064 5.413
Cooperation(1) 0.112 0.222 0.256 1 0.613 1.119 0.724 1.730
QIC(1) 0.044 0.238 0.034 1 0.854 1.045 0.656 1.665
Employee(1) 0.723 0.351 4.230 1 0.040 2.060 1.035 4.102
Employee(2) -0.127 0.238 0.287 1 0.592 0.881 0.553 1.403
Table 4.8. Test of goodness and Model summary
Table 4.9 The Total Variance Explained by Five Constructs of TQM (Independent variables) Total Variance Explained(For Independent Factors)
Component Rotation Sums of Squared Loadings
Total % of Variance Cumulative %
1 3.657 18.284 18.284
2 3.546 17.730 36.014
3 2.654 13.271 49.285
4 2.207 11.034 60.319
5 2.015 10.074 70.393
Total Variance Explained(For Dependent Variables)
Component Rotation Sums of Squared Loadings
Total % of Variance Cumulative %
1 3.833 42.586 42.586
2 3.083 34.256 76.842
Extraction Method: Principal Component Analysis.
Table 4.11 Multiple Linear Regression model for Satisfaction Predictors Coefficients(𝛽) SE t p-value 95% CI
Lower Upper
Constant 0.003 0.111 0.025 .980 -0.220 0.225
CType(Gov‟tal) -0.006 0.159 -0.035 0.972 -0.324 0.313
Leadership 0.249 0.079 3.135 0.003 0.090 0.407
CI 0.274 0.079 3.457 0.001 0.115 0.432
Employee 0.681 0.078 8.694 0.000 0.525 0.838
Cooperation 0.080 0.078 1.024 0.310 -0.076 0.237
Customer Focus 0.020 0.084 0.245 0.807 -0.147 0.188
Model Summary Model Correlation
Coefficient(r)
Coefficient of
Determination(𝑅2)
Adjusted R-
Square
Standard Error of the
Estimates
0.783 0.614 0.577 0.6504 ANOVA
Model Sum Squares (SS)
DF Mean Square(MS)
F P-Value(Sig.)
Regression 42.348 6 7.058 16.684 0.000
Residual 26.652 63 0.423
Total 69.000 69
Table 4.12 Results of Multiple Linear Regression model for Products & service Quality Predictors Coefficients(𝛽) SE t p-value 95% CI
Omnibus Tests of Model Coefficients
TQM Practice Product/Service Quality Chi-square df Sig. Chi-square df Sig.
Step 1
Step 78.618 12 0.000 19.813 12 0.071
Block 78.618 12 0.000 19.813 12 0.071
Model 78.618 12 0.000 19.813 12 0.071
Model Summary
Step -2 Log
likelihood
Cox & Snell R
Square
Nagelkerke R
Square
-2 Log
likelihood
Cox & Snell
R Square
Nagelkerke
R Square 1 373.085a 0.194 0.273 482.427a 0.053 0.071
Hosmer and Lemeshow Test Step Chi-square df Sig. Chi-square df Sig. 1 12.001 8 0.151 3.861 8 0.869

Assessment of the Effective total quality management on performance at selective colleges in Tigray..
DOI: 10.9790/487X-1808045684 www.iosrjournals.org 83 | Page
Lower Upper Constant 0.022 0.121 0.184 0.855 -0.220 0.265
CType(G) -0.045 0.175 -0.255 0.799 -0.395 0.305
Leadership 0.413 0.105 3.927 0.000 0.203 0.623
CI 0.285 0.086 3.323 0.001 0.114 0.456
Employee 0.663 0.085 7.818 0.000 0.494 0.833
Cooperation 0.226 0.105 2.152 0.035 0 .016 0.436
Customerfocus -0.095 0.085 -1.123 0.266 -0.264 0.074
Model Summary
Model Correlation Coefficient(r)
Coefficient of Determination(𝑅2) Adjusted R-Square
Standard Error of the Estimates
0.741 0.549 0.506 0.7030
ANOVA Model Sum Squares
(SS) DF Mean Square(MS) F P-Value(Sig.)
Regression 37.869 6 6.312 12.773 0.000
Residual 31.131 63 0.494
Total 69.000 69
Table C.1 descriptive statistics original variables Descriptive Statistics
Mean Std. N
Senior administrators share similar beliefs about the future direction of this college 3.27 2.119 70
Activities and investments that have long-term benefits receive little support from senior administrators
3.40 1.244 70
Employees have the opportunity to share in and are encouraged to help the college implement
change
3.36 1.240 70
Administrators and supervisors rarely allow employees to take necessary actions on their own 3.84 1.293 70
Senior administrators anticipate change and make plans to accommodate 3.24 1.122 70
This college encourages continual study and improvement of all its products, services, and
processes
3.74 2.005 70
Employees usually don‟t get an opportunity to suggest changes or modifications to existing
processes
3.40 1.279 70
Many of our services have been improved in the recent past 3.16 1.337 70
This college has received recent compliments and recognition for improving its services and
processes
3.19 1.322 70
My work duties and responsibilities contribute little to satisfying my need to create quality
services
3.36 1.694 70
Employees in this college are dedicated to their jobs 3.83 1.494 70
Administrators and supervisors create a work environment that encourages employees to
perform to the best of their abilities
3.83 1.606 70
Administrators, supervisors, and employees from different departments work independently to
achieve their own department‟s goals
3.76 1.959 70
In this college, teamwork is common 3.00 1.445 70
In this college, everyone participates in improving our products, services, and processes 3.16 1.538 70
Senior administrators look at the “whole picture” when they make decisions 3.31 1.602 70
Senior administrators insist on accuracy and reliability of all information and communications
within the college
3.27 1.541 70
Our processes and activities are centered on satisfying our customers 4.14 1.875 70
Administrators and supervisors encourage activities that improve customer satisfaction 3.21 1.710 70
Senior administrators behave in ways that lessen the importance of our customers 3.04 1.637 70
Our services usually have some kind of mistakes, defects, or errors. 3.70 1.747 70
Table C.2 Factor analysis result for rotated component Matrix for independent variables Rotated Component Matrixa
Component
1 2 3 4 5
Senior administrators share similar beliefs about the future direction of this college
.174 -.642 .435 -.020 -.027
Lea
der
ship
Activities and investments that have long-term benefits receive little
support from senior administrators
.195 .834 -.136 -.025 -.025
Employees have the opportunity to share in and are encouraged to help
the college implement change
-.087 .854 -.117 .022 .022
Administrators and supervisors rarely allow employees to take
necessary actions on their own
-.039 .820 -.249 -.006 -.005
Senior administrators anticipate change and make plans to
accommodate it
.044 .866 -.059 -.040 .082
This college encourages continual study and improvement of all its
products, services, and processes
-.061 -.037 .008 -.735 .149
Con
tinues
Imp
rov
eme
nt
Employees usually don‟t get an opportunity to suggest changes or
modifications to existing processes
-.135 -.149 -.107 .755 .182

Assessment of the Effective total quality management on performance at selective colleges in Tigray..
DOI: 10.9790/487X-1808045684 www.iosrjournals.org 84 | Page
Many of our services have been improved in the recent past .172 -.084 .118 .783 .202
This college has received recent compliments and recognition for
improving its services and processes
.084 .190 .054 .657 -.325
My work duties and responsibilities contribute little to satisfying my
need to create quality services
-.031 -.068 .041 .041 -.800
Em
plo
yee
Fu
lfil
lmen
t
Employees in this college are dedicated to their jobs .007 -.013 -.073 .052 .784
Administrators and supervisors create a work environment that
encourages employees to perform to the best of their abilities
.051 .044 .247 -.035 .698
Administrators, supervisors, and employees from different departments work independently to achieve their own department‟s goals
-.896 -.088 .033 -.150 .148
Inte
rnal
o
r E
xte
rnal
Coop
erat
ion
In this college, teamwork is common .768 -.066 .125 .036 .118
In this college, everyone participates in improving our products,
services, and processes
.814 -.087 -.100 .015 -.058
Senior administrators look at the “whole picture” when they make
decisions
.830 .152 .013 .059 .108
Senior administrators insist on accuracy and reliability of all
information and communications within the college
.873 -.069 .064 -.063 .062
Our processes and activities are centered on satisfying our customers .049 -.229 .911 .016 .007
Cu
stom
er F
ocu
s
Administrators and supervisors encourage activities that improve
customer satisfaction
.033 .112 -.879 -.027 -.039
Senior administrators behave in ways that lessen the importance of our customers
.038 .110 -.823 -.114 .034
Our services usually have some kind of mistakes, defects, or errors. .081 -.318 .802 -.151 .131
Extraction Method: Principal Component Analysis.
Rotation Method: Varimax with Kaiser Normalization.
a. Rotation converged in 6 iterations.
Table C.3 Factor analysis result for rotated component Matrix for dependent variables Rotated Component Matrixa
Component Constructs of TQM Variables
1 2
Our services usually have some kind of mistakes, defects, or errors. -.245 -.880 P
rodu
ct
or
Ser
vic
e
Qu
alit
y Our services have all necessary parts, features, or elements .172 .826
Our services meet customers‟ requirements .549 .676
This college doesn‟t develop new ideas or methods in its services .447 .765
Satisfaction results show improvement over time -.910 -.206
Cu
stom
er
and
Em
plo
yee
s
Sat
isfa
ctio
n
This college lacks a process to provide satisfactory responses to inquiries .826 .219
This college has processes in place to listen to and resolve complaints .666 .487
This college has very low employee turnover .795 .408
Employees file very few complaints against administration in this college .811 .303
Extraction Method: Principal Component Analysis. Rotation Method: Varimax with Kaiser Normalization.
a. Rotation converged in 3 iterations.