Assessing Asian Exchange Rates Coordination under Regional Currency Basket System

Assessing the Prospects for
Selected Australian Asian Vegetables
A report for the Rural Industries Research and Development Corporation by Barry Lee Connectica International
September 1999 RIRDC Publication No 99/135 RIRDC Project No CON-4A

ii
© 1999 Rural Industries Research and Development Corporation. All rights reserved. ISBN 0 642 57966 0 ISSN 1440-6845 Assessing the Prospects for Selected Australian Asian Vegetables Publication no. 99/135 Project no. CON-4A The views expressed and the conclusions reached in this publication are those of the author and not necessarily those of persons consulted. RIRDC shall not be responsible in any way whatsoever to any person who relies in whole or in part on the contents of this report. This publication is copyright. However, RIRDC encourages wide dissemination of its research, providing the Corporation is clearly acknowledged. For any other enquiries concerning reproduction, contact the Publications Manager on phone 02 6272 3186. Researcher Contact Details Mr Barry Lee PO Box 324 THE GAP QLD 4061 Phone: 0418 230 393 Fax: 02 94700718 Email: [email protected] RIRDC Contact Details Rural Industries Research and Development Corporation Level 1, AMA House 42 Macquarie Street BARTON ACT 2600 PO Box 4776 KINGSTON ACT 2604 Phone: 02 6272 4539 Fax: 02 6272 5877 Email: [email protected]. Website: http://www.rirdc.gov.au Published in September 1999 Printed on environmentally friendly paper by Canprint

iii
FOREWORD This report evaluates the commercial viability of Asian vegetable export opportunities. Previous research funded by RIRDC has identified export market opportunities for Asian vegetables grown in Australia. Most importantly during an Asian Foods Conference, industry confirmed their support for the further evaluation of the commercial viability of these export opportunities in Asia. This report has applied a ‘whole of supply chain’ approach to the study, and provides a framework to measure costs, risks and returns for the Asian vegetable industry. With ten case studies, the study reviews the commercial viability of Chinese Cabbage, Lotus Root, Burdock and Daikon in Asian markets including Taiwan, Korea and Japan. Commercial risks and benefits were defined in the case studies, and key factors affecting the commercial competitiveness of the vegetable exports included direct and indirect production costs, marketable yield, packaging and transport, importers costs and returns, and management labour for these ‘new’ crops. The project collaborated extensively with Australian industry and their support of this project is gratefully acknowledged by RIRDC. This report, a new addition to RIRDCs diverse range of almost 400 research publications, forms part of our Asian Foods Research and Development Program which aims to foster the development of a viable Australian Asian foods industry.
Most of our publications are available for viewing, downloading or purchasing online through our website: • downloads at www.rirdc.gov.au/reports/Index.htm • purchases at www.rirdc.gov.au/pub/cat/contents.html Peter Core Managing Director Rural Industries Research and Development Corporation

iv
ACKNOWLEDGEMENTS Connectica International would like to acknowledge the advice and assistance of many people during this study: - Rural Industries Research and Development Corporation: Dr Jeff Davis, Dr Roslyn Prinsley. - State Government organisations: Institute of Horticultural Development, Victoria, Dr Wendy
Morgan, Ms Mandy Chew; Department of Agriculture, Western Australia, Mr Peter Gartrell; Department of Agriculture, NSW, Dr Vong Nguyen, Ms Kate Elton, Mr Lloyd Davies.
- Key commercial industry growers throughout Queensland, Victoria and NSW including Mr
Kim Jones. - Industry researchers: Prof. David Midmore. - Industry consultants: Mr Grant Vinning, Mr Jeff Hastings. ABBREVIATIONS A$ Australian Dollar ABS Australian Bureau of Statistics AHC Australian Horticultural Corporation CIF Cost, Insurance and Freight DNRE Department of Natural Resources and Environment, Victoria DPIE Department of Primary Industries and Energy (Commonwealth) FOB Free On Board NT$ New Taiwan Dollar R&D Research and Development RIRDC Rural Industries Research and Development Corporation W Won (Korean currency) − Yen (Japanese currency)

v
CONTENTS FOREWORD............................................................................................................. iii ACKNOWLEDGEMENTS......................................................................................... iv ABBREVIATIONS..................................................................................................... iv EXECUTIVE SUMMARY .......................................................................................... vi 1.0 BACKGROUND TO THE PROJECT .............................................................. 1 2.0 OBJECTIVES OF THE PROJECT.................................................................. 3 3.0 INTRODUCTION............................................................................................. 4
3.1 Assessment of priority vegetables and markets......................................... 4 4.0 ECONOMIC ANALYSIS APPROACH ............................................................ 7
4.1 A staged approach for new products ......................................................... 7 4.2 Study approach for economic feasibility assessment ................................ 9
5.0 CHINESE CABBAGE CASE STUDIES ........................................................ 13 5.1 Product and description ........................................................................... 13 5.2 Market situation ....................................................................................... 14 5.3 Economic analyses case studies ............................................................. 14
6.0 LOTUS ROOT CASE-STUDY....................................................................... 27 6.1 Product and description ........................................................................... 27 6.2 Market situation ....................................................................................... 27 6.3 Economic analysis case study ................................................................. 28
7.0 BURDOCK CASE STUDIES......................................................................... 40 7.1 Product and description ........................................................................... 40 7.2 Market situation ....................................................................................... 40 7.3 Economic analyses case studies ............................................................. 41
8.0 DAIKON CASE STUDY ................................................................................ 56 8.1 Product and description ........................................................................... 56 8.2 Market situation ....................................................................................... 57 8.3 Economic analysis case study ................................................................. 57
9.0 DISCUSSION ................................................................................................ 69 9.1 Key factors influencing production and marketing ................................... 69 9.2 Economic feasibility of the priority Asian vegetables ............................... 70 9.3 Supply chain management ...................................................................... 72
10.0 CONCLUSIONS AND RECOMMENDATIONS ............................................. 73 11.0 APPENDIX - Summary of Korean & Indonesian Market Research .......... 75 12.0 REFERENCES.............................................................................................. 89 13.0 RIRDC PUBLICATIONS ............................................................................... 91

vi
EXECUTIVE SUMMARY
As a result of research conducted under the Asian vegetables research program of the Rural Industries Research and Development Corporation (RIRDC), Asian vegetables grown and/or processed in Australia have been identified as strategic opportunities in both the Australian and Asian export markets.
Results of this research were presented to industry at the Australian Asian Foods Industry
Conference during 1995, and industry confirmed the need to evaluate the commercial benefits and commercial viability of the Asian vegetable export opportunities.
The principal objective of this study is to conduct an economic feasibility assessment,
and define and quantify the major opportunities and economic benefits for the selected ‘priority’ Asian vegetables and markets.
Specifically the key issues addressed in this study include:
Confirmation of priority Asian vegetables and markets for further assessment.
Identification of key factors influencing the industry in respect to production and
marketing.
Assessment of economic feasibility for the export of Asian vegetables using industry case studies.
The study has applied a ‘whole of supply chain’ approach to the commercial analyses of
Asian vegetables for export. Overall, the analysis aims to establish the cost of Asian vegetables landed at the export market port. In addition, the analysis provides a framework to measure costs, risks and returns, and also identifies factors requiring further evaluation at an enterprise level.
The key findings from ten case-studies with industry are:
The Chinese cabbage market is volatile and experiences strong competition from both
other importers and local industry in the markets. The markets of Taiwan, Japan and Korea were not considered to be commercially viable in the case-studies.
Lotus Root is a less volatile product market; however it is also a less well-known and less well-established (production) vegetable in Australia. Nevertheless, it appears to be a commercially viable Australian export to Japan, but not to Taiwan.
Burdock similarly, is a less well-known vegetable in Australia but appears to have significant market potential and commercial viability for export to Japan and Korea.
Daikon, as a fresh product is a relatively common vegetable in Japan with significant market volumes. However, the market of Japan was not considered to be commercially viable in the case-study.
These findings of the commercial viability of the Asian vegetables by case-study export
market are summarised in the following table. Summary of Case-Studies and Commercial Viability of Asian Vegetable Exports

vii
Asian Vegetable/ Case-study
Japan
Taiwan
Korea
Chinese Cabbage - Queensland - Victoria - Western Australia
NA NA X
X X
NA
NA NA NA
Lotus Root - NSW
Υ
X
NA
Burdock - NSW - Western Australia
Υ Υ
X X
Υ Υ
DAIKON - Western Australia
X
NA
NA
Υ Economically Viable X Not Economically Viable NA Not Analysed
The following key factors were identified as having a major influence upon the
commercial viability of Asian vegetable exports.
Direct Costs The most important direct cost item in all case-studies was labour, and in all the case-studies it was shown that the use of mechanisation was a major opportunity to reduce labour costs. Indirect Costs The case-studies showed that indirect costs for plant, depreciation and other general costs were a significant cost especially where new plant was required as in the Lotus Root and Burdock case-studies. This is not so much the case with Chinese cabbage as existing equipment used for other brassicas may also be used for Chinese cabbage. Marketable Yield While this is not a ‘cost’ per se, it has a significant impact on the amount and quality of produce yielded by the crop. ‘Production performance’ in turn affects the price returns or market premiums, and the break-even cost of production. Packaging and Transport Packaging and transport are the most significant costs and risks for the exporter.

viii
Moreover, the case-studies showed that the sensitivity of these costs upon total export costs is critical. For example, shipping or freight costs may account for 55-65% of the export costs, while packing and packaging may account for up to 35% of the exporters costs. Importers Costs and Returns These costs are obviously market specific as they shall include tariffs, port and customs costs, and risks and profits prevailing in the market. These costs however, are a significant cost component in the supply chain and need to be assessed accurately. Management Labour for ‘New’ Crops Importantly, management labour and return to capital invested in the land and machinery are not included in the analyses in this study. It is recognised however that management labour in the introduction and development of new crops is a significant cost during at least the initial years of introduction.

ix
Recommendations Recommendation 1 Communicate the ‘supply chain’ approach and results of this study to industry, and encourage industry to conduct ‘enterprise’ specific business plan studies for their export ‘priority’ Asian vegetables. Recommendation 2 Support research to conduct a study of the economic benefits of Asian vegetables for the Australian market, especially as a complementary market for exports. Recommendation 3 Support industry research to address the control and/or reduction of the specific cost issues identified in this study for export Asian vegetables. Recommendation 4 Support industry research to develop transparency in the supply chain especially for accurate and timely market data for ‘priority’ export Asian vegetables. Recommendation 5 Support the development of ‘national industry working groups’ responsible for the dissemination of strategic industry information for new Asian vegetables.

1
1.0 BACKGROUND TO THE PROJECT As a result of research conducted under RIRDC’s Asian vegetables research program, Asian vegetables grown and/or processed in Australia have been identified as strategic opportunities in both the Australian and Asian export markets (Lee (1995), Vinning (1995), Pan (1995), Nguyen (1998), Midmore (1998). Results of this research were presented to industry at the inaugural Australian Asian Foods Industry Conference at Parliament House during 1995 (Lee & Prinsley (1996)). The Conference assessed that the following Asian vegetables as shown in Table 1.1, were priorities for further development in the Australian and export markets. Table 1.1 Priority Asian Vegetables From the Australian Asian Vegetables Industry Conference
Priority Asian Vegetable
Market
Fresh
Processed
Australian Market
- Baak Choi - Chinese Broccoli/Kale - Luffa
Fresh-cut: - Chinese cabbage - Asian style salad mixes
Australian and Export Market
- - Chinese Cabbage/Wong Bok - Daikon - Burdock - Lotus Root - Taro (Satoimo)
Frozen: - Green soybean - Diced daikon - Stir fry mixes Salted: - Chinese cabbage - Japanese cucumber Dried: - Daikon strips - Japanese pumpkin Fresh-cut: - Chinese cabbage - Asian style salad mixes &
stir frys
Subsequent meetings with industry confirmed the need to initially focus upon fresh Asian vegetables for export. Table 1.2 identifies those Asian vegetables considered to be ‘export priorities’ for further assessment.

2
Table 1.2 Export Priority Asian Vegetables
Chinese Cabbage (Brassica pekinensis) Daikon (Raphanus satvus) Burdock (Arctium lappa, A edule) Lotus Root (Nelumbo nucifera) Taro (Colocasia esculenta) Water Chestnut (Eleocharis dulcis)
While the RIRDC research has identified the market potential for Australian grown Asian vegetables, industry confirmed the need to further evaluate the economic benefits and commercial viability of the export opportunities for the ‘priority’ Asian vegetables.
3
2.0 OBJECTIVES OF THE PROJECT The principal objective is to conduct an economic feasibility assessment and define and quantify the major opportunities and economic benefits for the selected ‘priority’ Asian vegetables and markets as determined by an industry workshop. Specifically the key issues to be addressed in this study include:
Confirmation of priority Asian vegetables and markets for further assessment.
Identification of key factors influencing the industry in respect to production and marketing.
Assessment of economic feasibility for the export of Asian vegetables using industry case studies.
This study seeks to define the economic feasibility for the export of selected Asian vegetables, and provides an economic framework for: - Further commercial analysis using farm specific costs at the enterprise level. - Comparison of returns with other export crops.

4
3.0 INTRODUCTION An extensive and comprehensive process was undertaken in the selection of the priority markets and Asian vegetables for economic analysis 3.1 ASSESSMENT OF PRIORITY VEGETABLES AND MARKETS 3.1.1 Markets The priority accorded to the markets and vegetables was developed from meetings with industry which focussed upon the key strategic and economic issues for the growth of the Australian industry. The key issues raised by the industry are shown at Table 3.1. Table 3.1 Key Industry Issues for Economic Assessment of Australian Asian Vegetables
Assessment
Issue
Strategic Issues
- Markets for today and tomorrow. - Australian and export market potential. - Alternative market options. - Build on Australian industry strengths of seasonality,
capital, and technology. - Maximise further processing opportunities. - Market specifications and quality assurance. - Trade barriers.
Economic Issues
- Market price models of high and low seasons. - Costs of production, processing and packaging. - Freight and transport costs and seasonality of supply. - Production volumes and breakeven costs. - Production gross margins. - Post-harvest costs and export costs.
Economic Assessment
- Seasonality analysis. - Sensitivity analysis. - Risk assessment.

5
The issue of ‘Asian vegetables markets for today and tomorrow’ received considerable review and discussion. Accordingly, the major markets for this study were expanded from Japan, Taiwan and Hong Kong to include South Korea and Indonesia
3.1.2 Export Priority Asian Vegetables As shown in Table 1.1, the export priority Asian vegetables includes:
Chinese Cabbage Daikon Burdock Lotus Root Taro Water Chestnut
However, Taro and Water Chestnut were subsequently excluded from this study as: - There appears to be no commercial growers of the (Japanese) taro in Australia. - The economic assessment of water chestnut is included within a major project supported by
growers, RIRDC, and Central Queensland University. Accordingly, the list of Asian vegetables and markets was amended to those shown at Table 3.2. Table 3.2 Export Priority List of Asian Vegetables And Markets Asian Vegetable
‘Today’ Markets
‘Tomorrow’ Markets
1. Chinese Cabbage
Japan, Hong Kong, Singapore, Taiwan
South Korea, Indonesia
2. Daikon
Japan, Hong Kong, Singapore, Taiwan
South Korea, Indonesia
3. Burdock
Japan, Taiwan
South Korea
4. Lotus Root
Japan, Hong Kong, Singapore, Taiwan
-
However, the ‘Tomorrow’ markets were considered to require preliminary qualification prior to the proposed commercial analysis in this study. As a result, market research was conducted in

6
South Korea and Indonesia to qualify the commercial market opportunity for Australian Asian vegetable exports, and a summary of the market research is shown at Appendix A. In South Korea, the research showed:
Chinese Cabbage (Paechu) Australian Seoul CIF price for Chinese Cabbage is some 100% greater than the local Korean product.
Daikon (Mu) Australian Seoul CIF price for Daikon is some 200% greater than the local Korean product.
Lotus Root (Yong-gun) A minor vegetable with limited market demand.
Burdock (Uong) A minor vegetable with limited market demand. In Indonesia, the research showed:
Chinese Cabbage Australian Jakarta CIF price for Chinese Cabbage (Kol Gebeng) is some 200% greater than the local product.
Daikon A minor vegetable with limited market demand.
Lotus Root A minor vegetable with limited market demand.
Burdock A minor vegetable with limited market demand. In general, the market research in South Korea and Indonesia showed that the commercial opportunity for exports of Asian vegetables from Australia was not commercially viable. As a result, these markets were not included in this study.

7
4.0 STUDY APPROACH FOR THE COMMERCIAL ANALYSIS The commercial feasibility assessment focuses upon cost structures throughout the entire supply chain to the markets for Asian vegetables 4.1 A STAGED APPROACH FOR NEW PRODUCTS Recent research confirms that with the globalisation of trade, reduction in trade barriers and increasing competition, there is the need for Australian industry to focus upon the efficiency and cost effectiveness of its supply chains. Traditionally, the cost analysis of supply has been based upon the approach of conducting a gross margin analysis of farm costs which do not extend beyond the farmgate. This approach is a calculation of farm revenues and farm costs, to yield a production gross margin at the farmgate. Accordingly, by definition this approach only addresses the production part of the supply chain. In addition, discussions with researchers, economists and agriculturalists confirm that many methods are adopted for the analysis of production gross margins, and there are considerable differences between the approaches. In many cases, the results from the different analyses are not directly comparable. Not withstanding this, such gross margin analyses are important for farm level management plans. However, it is contended that such analyses need to extend further along the supply chain to the market, to ensure an understanding of the commercial viability and risks for new crops such as Asian vegetables exported from Australia. There is a requirement for a consistent ‘whole of supply chain’ approach to the commercial analysis of Asian vegetables for export. The approach adopted for this study is shown at Figure 4.1.
Following discussions with industry groups in Queensland, Victoria and NSW, it was considered that a ‘whole of supply chain’ analysis needs to be conducted at two levels: Level 1 Commercial Feasibility Assessment Assessment of the cost structures in the whole supply chain, and the economic benefits of the export product for estimated costs and prices. This study assesses the cost structures for the selected Asian vegetables for export and sale in Asian markets such as Taiwan, Korea and Japan.

8
Schematic of Study Approach
GROWER EXPORTER IMPORTER WHOLESALE MARKET
Pack House
Distribution Centre
Costs
Direct Inputs
Indirect Inputs
Costs
Post farmgate transport
Cooling
and storage
Packaging labour and materials
Costs
Freight to port
Export administration
Sea freight
Costs
Customs
Tariffs
Import Administration
Market data
Average monthly pricing
Average monthly volumes
Seasonality
Figure 4.1
Breakeven cost of export plus
nominal profit (A$/kg)
Breakeven cost of import plus
nominal profit (A$/kg)
‘Peak’ market price
(A$/kg)
Margin excess
(shortfall) (A$/kg)
Production Export Port and Sea Freight
Market Port
Breakeven costs of production plus nominal profit
(A$/kg)
9
Overall, the analysis aims to establish the cost of Asian vegetables landed at the export market port (CIF). In addition, this analysis provides a framework to measure costs, risks and returns, and also identifies factors requiring further evaluation in Business Plans at an enterprise level.
Level 2 Business Plan Assessment for an Individual Farm Enterprise Assessment of the ‘enterprise specific’ cost structures along the whole supply chain, and the economic benefits of the export product for the specific costs and returns. As shown in this study, costs, prices and issues affecting enterprises can vary considerably; not only at an enterprise level, but also throughout regional Australia and in specific export markets. Overall, industry endorsed this staged approach as the introduction of new (Asian vegetables) products for export, necessitates the need to understand and evaluate any new issues and costs, whereas the issues for existing product exports are relatively well-understood.
4.2 STUDY APPROACH FOR ECONOMIC FEASIBILITY ASSESSMENT Based upon previous project work completed by the Department of Agriculture in Western Australia (1995), this study has adopted a ‘Break-Even Analysis’ approach. Costs are calculated throughout the whole supply chain, and returns or prices to recover those costs or to ‘break-even’ are determined. In addition, the margin between the export market price and the landed export market cost can then be considered in terms of economic parameters such as return on investment or internal rate of return. The analysis considers four main areas: 4.2.1 Grower Cost Structures Costs of Production This shall vary between seasons, time of production, geographic location and business resources. The commercial yields and direct costs for the priority vegetables in this study have been developed based upon commercial industry case-study examples in Australia. Indirect or overhead costs of plant, depreciation and general business costs have been based upon industry estimates of typical costs. However obviously, these costs are enterprise specific and can be reduced significantly where economies from larger scale operations can be developed. Labour Requirements

10
Labour requirement estimates are quite critical to the estimate of the costs of production. These estimates have been based upon industry case-studies but again it is acknowledged that these shall obviously be site specific. Marketable Yield Marketable yield is that which is assumed to meet product specifications and quality requirements for the market and the customer. Produce which does not achieve these standards is assumed to be discarded as waste; though it may be commercially saleable in other local and overseas markets. Breakeven Cost of Production Definition Breakeven cost of production ($/kg) is the required returns for the grower to equal the costs of production. This is calculated by dividing the total costs per hectare by the marketable yield of the produce. Determining the breakeven cost of production for the Asian vegetables to be marketed is a critical point in the analysis. The following key questions should be reviewed at this point:
What is the farm gate price for the Asian vegetables? What variations shall be experienced for costs and marketable yields, and therefore what is
the sensitivity of the estimated breakeven price? What is the overall impact of production risk on price requirements?
It is also emphasised that the breakeven costs do not include profits or return on investment capital. As a result, producers (and exporters) can use this part of the analysis to assess the attractiveness of prices in export markets. In the worst case scenario where prices do not cover the costs of production, producers can control the extent of their losses by not proceeding with any further processing or marketing beyond the farm gate.
Importantly, management labour and return to capital invested in the land and machinery are not included in this cost. It is recognised however that management labour in the introduction and development of new crops is a significant cost during at least the initial years of introduction. For example, in a recent Asian vegetables industry newsletter (DNRE and RIRDC, 1998), it was noted that there are a relatively small number of chemicals registered for use on Asian vegetables. The cost associated with registering a new chemical for usage on Asian vegetables is high, and this is likely to restrict the number of chemicals to be registered for Asian vegetables. 4.2.2 Exporter Cost Structures Including Freight And Packing

11
The export costs in this study include all post-farm gate activities including:
Post-farm gate transport. Cooling and storage before packing. Packaging cost including labour and materials. Freight to port. Shipping costs including container freight, port handling fees, customs clearance, and
insurance to the export market. Final market port costs, customs and tariffs are assumed to be handled by the importing company or buyer.
Administration costs. Other cost risks such as product returns and claims, and non-payment have not been included in this costing. In this study, these above cost estimates have been obtained from industry estimates and case studies, and are designed to provide a costing CIF at the final market port. Breakeven Cost of Export Definition Breakeven cost of export ($/kg) is the required returns for the exporter to equal the costs of export to the market port.
Determining the breakeven cost of export for the Asian vegetables to be marketed is another critical point in the analysis. The following key questions should be reviewed at this point:
What is the market price for the Asian vegetables? What variations shall be experienced for shipping and packaging costs, and therefore what is
the sensitivity of the export breakeven price? What are the overall impact of market risk and price requirements.
Also, often the sensitivity of the costs upon total export costs are significant and warrant the following comments:
The cost of shipping often accounts for over 50% of export costs. Packing and packaging costs often account for over 25% of export costs. The packing efficiency in shipping containers is clearly a critical component of the costs
structure. All shipping and cost estimates require careful analysis to derive an accurate cost of
exporting. Changes in shipping and packaging will result in significant changes to export costs.
4.2.3 Importer Cost Structures

12
Importer cost structures include tariffs and duties, customs and port charges, administration and overheads. In this study, these ‘in-market’ costs have been difficult to accurately define, and are based upon industry estimates. 4.2.4 Wholesale Market Pricing And Sensitivities This project aims to develop a framework for industry to utilise for further analyses at an enterprise level. Accordingly, the export markets have been assessed by:
Analysing average monthly wholesale pricing over at least 3-5 years. Analysing average monthly volumes or throughput of wholesale product over at least 3-5
years. Developing seasonality patterns for the wholesale market data. Estimating other relevant costs and currency risks associated with the market.
It is emphasised that the monthly prices are average prices only, and that premium or spot markets may co-exist with these market trends in price. Such premium markets are subject to market supply and demand forces and quality of product. Therefore, in this study by adding the expected production and exporters cost together, the total breakeven cost (CIF) is established. This is the returns required by the grower and the exporter to equal the costs of production and export.
4.2.5 Assessment of Commercial Feasibility Comparisons of total grower, exporter and importer costs in the supply chain against market pricing, shall provide an assessment of the commercial feasibility of the Asian vegetable exports. Commercial feasibility is assessed in two ways:
The difference between the total breakeven cost for the producer and exporter only, and the average monthly market price provides an indication of the margin to accommodate importer costs and profits in the market.
Alternatively, a comparison is conducted whereby producer, exporter and importer costs and nominal profits, are compared to an average monthly high price during a peak market period in a year.

13
5.0 CHINESE CABBAGE CASE STUDIES Domestic consumption is growing rapidly and exports have increased 275% in 7 years (Tomkins and Daly, 1998) 5.1 PRODUCT AND DESCRIPTION In Australia, Chinese cabbage (Brassica pekinensis or B. rapa var Pekinensis) is a heading type of brassica crop which depending upon cultivar, can vary in appearance from short, squat wong bok types to longer, slender rocket or michihili types. Chinese cabbage has been grown successfully in all Australian states by experienced vegetable growers of traditional brassicas such as cabbage, cauliflower and broccoli. Chinese cabbage production is ideally suited to these producers as it represents a diversification of production without the need for any additionally specialised production, handling or storage equipment. While Chinese cabbage exports during 1997/86 was only to the order of 5,485 tonnes, it nevertheless ranked as one of Australia’s top 10 exports of fresh horticultural produce (ABS, 1998). Table 5.1 Key Export Statistics for Chinese Cabbage (1997/98)
Market
Volume (tonnes)
Market %
(%)
Value
($’000)
Hong Kong
2,508
45.7
2,583
Japan
5.3
0.1
10.7
Malaysia
192
3.5
193
New Zealand
4.5
0.1
5.5
Philippines
1.3
0
1.3
Singapore
2,186
39.9
2,138
Taiwan
507
9.2
501
Other
80.5
1.5
73.5
Total
5,485
100
5,506
(ABS, 1998)

14
5.2 MARKET SITUATION While the Australian supermarkets and Asian grocery stores are a rapidly growing market for Asian vegetables (Lee, 1996), the major market opportunity for Chinese cabbage was identified as the export markets (Vinning (1995), Pan (1995)). Exports of Chinese cabbage from Australia have increased from $2.5 million in 1987/88 to $5.5 million in 1997/98. The major markets in 1997/98 were Hong Kong, Singapore and Taiwan. During 1997/98, these three major markets of Hong Kong, Singapore and Taiwan imported over 5,200 tonnes or 95% of Australian Chinese cabbage exports. (ABS, 1998). Discussions with industry in Queensland, NSW and Victoria indicated that both Hong Kong and Singapore were major entrepot trading centres, and that Taiwan was considered the most strategic market for further development. Accordingly, the Chinese cabbage case-studies have focussed upon the Australian industry’s ability to supply from a Autumn harvest during the off-season period of June to September to the Taiwan market.
5.3 ECONOMIC ANALYSES CASE STUDIES 5.3.1 Grower Cost Structures The economic analyses were developed from data provided by three Queensland growers and one Victorian grower of Chinese cabbage. Later in this section, this data is compared to a similar case-study conducted in Western Australia during 1995. Table 5.2 shows a cost summary of the estimated direct and overhead costs for the four case studies. Table 5.2 Cost Summary for Production of Chinese Cabbage for the Case-Studies ($ Cost/Ha)
Case Study
Q1 ($)
Q2 ($)
Q3 ($)
V1 ($)
Direct Costs
10,166
10,039
7,763
9,665
Indirect Cash Costs
457
750
800
2,000
Indirect Non-Cash Costs
441
606
758
3,079
Total Costs/Ha
11,064
11,396
9,321
14,744
Scale of Production (Ha)
35
16
10
1
As outlined previously in Chapter 4, direct costs include all operating costs, while indirect cash costs include general business costs (eg, telephone, insurances, etc), and indirect non-cash costs include plant replacement (depreciation) and other capital equipment.

15
The indirect costs are based on an ‘average business’ estimate, and it is acknowledged that these costs can be reduced through economies of scale derived from the size of the enterprises. Also, for the purposes of this study, it was considered prudent to derive these indirect costs on a conservative basis, and therefore these costs in some cases may appear high. Variations in costs in Table 5.2 appear to be due to variations in local geography, and the scale of production for the individual enterprises. For example, indirect cash costs are affected by the scale of the enterprise. Case-study Q1 was based upon an enterprise of some 35 ha whereas case-study V1 was for a smaller enterprise of only 1 ha. It is also noted that management labour and return to capital invested in land and machinery are not included in these costs. As for many horticultural crops the labour component is the most significant cost of production. Table 5.3 shows that over 50% of the direct costs of production are labour costs. Accordingly, labour is a critical point for the production of Chinese cabbage, and the use of mechanisation should be considered a priority area for the opportunity to reduce labour costs. Other costs such as fuel, maintenance, irrigation and, seed and fertiliser vary considerably, and again are influenced by the scale of operation of the enterprises in the case-studies. Table 5.3 Relative Significance (%) of Direct Cost Components
Case Study
Q1
Q2
Q3
V1
Labour
55
55
72
56
Fuel, Maint=ce, Irrigation
22
22
2
6
Freight and Finance
10
10
10
12
Seed and Fertiliser
7
5
7
26
Pesticides
7
7
9
1
Estimated Labour/Ha (hrs)
371
371
371
359
Table 5.4 shows the income summary based on input from the industry case-study sources. It is emphasised that this does not reflect current or suggested returns for producers. Rather, it is a current average market price that was prevailing during the collation of data for this study. In addition, it is noted that in case-study V1, the marketable yield is relatively high due to the enterprise’s practice of densely planting seedlings.

16
Table 5.4 Income Summary for Chinese Cabbage Case-Studies
Case Study
Q1
Q2
Q3
V1
Producer Price (per kg)
$0.30
$0.30
$0.30
$0.30
Marketable Yield (kg/ha)
47,600
48,000
40,000
59,500
Gross Income (per ha)
14,280
14,400
12,000
17,850
Production Gross Margin (per ha)
4,114
4,361
4,237
8,185
As indicated in Chapter 4, breakeven cost of production ($/kg) is the required returns for the grower to equal the costs of production. The breakeven cost of producing the Chinese cabbage is the key first part of this economic analysis. Table 5.5 shows the breakeven cost of production per kilogram of Chinese cabbage which is calculated from the total production costs (Table 5.2) and marketable yield (Table 5.4). Table 5.5 Breakeven Costs for Production of Chinese Cabbage Case-Studies ($)
Case Study
Q1
Q2
Q3
V1
Breakeven Cost of Production (per kg)
0.23
0.24
0.23
0.25
Therefore for the case-studies, the expected breakeven cost of growing each kilogram of Chinese cabbage varies from A$0.23 to A$0.25.
Producers and exporters can use this part of the analysis to assess the attractiveness of market prices on offer, and assist producers to assess the impact of the risks for production in comparison to the price ‘rewards’. Breakeven costs do not include profit or return to invested capital. In addition, the costs of production and marketable yields should be tested in a sensitivity analysis to assess their impact on the sensitivity of the break-even costs. This is shown in Table 5.6, and shows that for a 15% variation in the marketable yield of Chinese cabbage, the change in the breakeven price can vary by up to 42%.

17
Table 5.6 Breakeven Costs and Sensitivity to Various Costs and Marketable Yields Case-Study: Q1
Direct and Indirect Costs ($/ha)
Marketable Yield
(-20%) $ 8,851
(-10%) $ 9,957
(0)
$ 11,064
(+10%) $ 12,170
(+20%) $ 13,277
54,740 kg/ha
0.16
0.18
0.20
0.22
0.24
47,600 kg/ha
0.19
0.21
0.23
0.26
0.28
40,460 kg/ha
0.22
0.25
0.27
0.30
0.33
Case-Study: Q2
Direct and Indirect Costs ($/ha)
Marketable Yield
(-20%) $ 9,117
(-10%) $ 10,256
(0)
$ 11, 396
(+10%) $ 12,535
(+20%) $ 13,675
55,200 kg/ha
0.17
0.19
0.21
0.23
0.25
48,000 kg/ha
0.19
0.21
0.24
0.26
0.28
40,800 kg/ha
0.22
0.25
0.28
0.31
0.34
Case-Study: Q3
Direct and Indirect Costs ($/ha)
Marketable Yield
(-20%) $ 7,457
(-10%) $ 8,389
(0)
$ 9,321
(+10%) $ 10,253
(+20%) $ 11,185
46,000 kg/ha
0.17
0.18
0.20
0.22
0.24
40,000 kg/ha
0.19
0.21
0.23
0.26
0.28
34,000 kg/ha
0.22
0.25
0.27
0.30
0.33
Case-Study: V1
Direct and Indirect Costs ($/ha)
Marketable Yield
(-20%) $ 11,795
(-10%) $ 13,270
(0)
$ 14,744
(+10%) $ 16,218
(+20%) $ 17,693
50,575 kg/ha
0.23
0.26
0.29
0.32
0.35
59,500 kg/ha
0.20
0.22
0.25
0.27
0.30
68,425 kg/ha
0.17
0.19
0.22
0.24
0.26

18
5.3.2 Exporters Cost Structure As indicated in Section 4.3.2 above, the exporter is responsible for all costs beyond the farmgate to the importer. Cost estimates have been obtained from the experience of the case-study growers, and freight forwarders. Chinese cabbage is costed to be delivered CIF to Taiwan. It is also noted that no estimate has been made for the overhead costs for the exporter such as offices, staff etc. Table 5.7 shows the post-harvest cost summary for the case-studies. Table 5.7 Post-Harvest Cost Summary for Case-Studies
Approximate Cost ($/Tonne)
Case Study
Q1 ($)
Q2 ($)
Q3 ($)
V1 ($)
Forced Air Cooling
10
10
15
10
Storage before packing
20
20
15
20
Packaging Cost
150
150
180
115
Packaging Labour
20
65
50
87
Freight to Port
40
15
15
15
Administration Costs
20
20
20
20
Sea Freight Cost/Taiwan ($7,100/40 ft container)
323
323
323
323
Total Cost per Tonne
583
603
618
590
Total Cost per Kg
$0.58
$0.60
$0.62
$0.59

19
Therefore the expected breakeven cost of exporting each kilogram of marketable produce is shown in Table 5.8. Table 5.8 Breakeven Export Costs for Chinese Cabbage for the Case-Studies ($)
Case Study
Q1
Q2
Q3
V1
Breakeven export costs ($/kg)
0.58
0.60
0.62
0.59
Table 5.9 shows the post-harvest cost summary as a percentage of costs for the case-studies. Table 5.9 Post-Harvest Cost Percentages Summary for Case-Studies
Percentage of Cost Structure (%)
Case Study
Q1 ($)
Q2 ($)
Q3 ($)
V1 ($)
Forced Air Cooling
2
2
2
2
Storage before packing
3
3
2
3
Packaging Cost
26
25
29
20
Packaging Labour
3
11
8
15
Freight to Port
7
2
2
3
Administration Costs
3
3
3
3
Sea Freight
55
54
52
55
The cost of shipping accounts for between 52 and 55% of the exporters costs. Packing and packaging costs account for between 29-37% of the exporters costs. The packing efficiency in the shipping containers is clearly a critical component of this cost.
The shipping costs include all costs (including freight, port handling charges, customs clearance and insurance) ex-Brisbane or Melbourne and delivered CIF to Taiwan. Taiwan port costs, customs and tariffs are assumed to be handled by the importer as shown later. Changes in costs such as shipping and packaging have the potential to significantly affect export costs. Accordingly, Table 5.10 outlines the sensitivity of export costs to variations in post-harvest costs as shown in the bottom half of Table 5.10.

20
Table 5.10 Sensitivity of Export Costs for Case Studies Percentage Change in Major Export Cost Scenarios Scenario
Sea Freight
Packaging
Packing
Other
High Scenario
5 %
10%
15%
10%
Low Scenario
-5%
- 10%
- 15%
-10 %
Scenario
Q1
Q2
Q3
V1 Expected
$0.58
$0.60
$0.62
$0.59
High
$0.63
$0.65
$0.67
$0.64
Low
$0.54
$0.56
$0.57
$0.54
Therefore, the combination of the breakeven production costs (Table 5.5) and breakeven export costs (Table 5.8) shall provide a total expected breakeven cost for each kilogram of marketable produce delivered CIF to Taiwan. This is shown in Table 5.11. Table 5.11 Total Breakeven CIF Costs for Chinese Cabbage for the Case-Studies ($)
Case Study
Q1
Q2
Q3
V1
Breakeven Cost for Production ($/kg)
0.23
0.24
0.23
0.25
Breakeven Cost for Export ($/kg)
0.58
0.60
0.62
0.59
Total Breakeven CIF Costs For Production and Export (per kg)
0.81
0.84
0.85
0.84
Therefore the expected breakeven cost of growing and exporting each kilogram of Chinese cabbage varies from A$0.81 to A$0.85

21
5.4.3 Market Analysis This analysis aims to outline the Taiwan wholesale market trends and the costs and risks associated with the market. Vinning (1995) indicates in Taiwan, Chinese cabbage imports show strong growth albeit from a low base. CIF prices have been around A$0.50/kg. Vinning indicates that the Taiwan annual wholesale throughput is trending downwards while prices are trending upwards. Annual average wholesale prices (1987-1993) for fresh products varies from A$0.25/kg - A$0.40/kg, while average monthly wholesale prices varies from A$0.20/kg to A$0.80/kg (A$1 = NT$22). For this case study, Taiwan wholesale data from 1990 to 1994 has been used to derive monthly prices over 5 years. Average, highest and lowest monthly prices over this period are shown in Figure 5.1.
Figure 5.1 Chinese Cabbage - Average Monthly Wholesale Price Data
Taiwan 1990-1994 (Source: Taiwan Agricultural Yearbooks)
0.00
0.20
0.40
0.60
0.80
1.00
Jan Feb Mar Apr May Jun Jul Aug Sep Oct Nov
Pric
e pe
r kg
(A$)
Total Breakeven CIF Cost Average Mthly Price

22
Prices for Chinese Cabbage appear to peak in August/September and generally coincides with a reduced supply or throughput in the wholesale market as shown in Figure 5.2.
Figure 5.2 Chinese Cabbage - Average Monthly Wholesale Throughput Data
Taiwan 1990-1994 (Source: Taiwan Agricultural Yearbooks)
It is emphasised that these above prices are average figures and do not allow for spot market prices where premium prices may be on offer in the market. It only give a general trend in the market. Nevertheless, this average pricing scenario provides the basis to compare the breakeven costs for the case-studies with the average market conditions. By adding the expected production and exporters breakeven costs together, the expected total breakeven CIF cost (Table 5.11) can be compared to an average monthly wholesale market price of A$0.41/kg. The difference between the market price and the total breakeven costs should (for commercial viability) be an excess, and would indicate the margin to accommodate grower and exporter profits. Importers costs have not been included in the breakeven costs at this stage of the analysis. However, as shown in Figure 5.3, case-study Q1 shows that the average monthly wholesale market price of A$0.41/kg (NT$9.43/kg) does not provide an excess above the breakeven costs of A$0.81/kg. Similarly, all the other case-studies and their break-even costs do not exceed the wholesale market price.
01000200030004000500060007000
Jan Feb Mar Apr May Jun Jul Aug Sep Oct Nov Dec
Tonn
es
Ave Mthly Volume Ave Mthly High Volume Ave Mthly Low Volume

23
Figure 5.3 Chinese Cabbage – Comparison of Breakeven Costs for Case-Study Q1
with Average Monthly Wholesale Price Data Taiwan 1990-1994
(Source: Taiwan Agricultural Yearbooks)
To allow for an alternative scenario, Table 5.12 shows an example of where industry may ‘target’ a market window during the peak market period of August/September which averages NT$14.30/kg or A$0.65/kg. The expected total breakeven CIF costs plus a nominal 10% profit for producer and exporter, and an ‘estimated’ nominal cost and profit for importers are compared to the ‘peak’ wholesale price of A$0.65/kg during this August/September period. It is noted that importer costs shall be unique to each importer but shall include produce tariff value, costs, risks and profits. Table 5.12 Comparison of Breakeven Costs Plus Nominal Profit To Peak Market Price
Cost and Returns
Case Study
A$/kg
Q1 ($)
Q2 ($)
Q3 ($)
V1 ($)
Producer cost and profits
0.25
0.26
0.25
0.28
Exporter cost and profits
0.66
0.68
0.64
0.65
Importer cost and profits
0.10
0.10
0.10
0.10
Sub-Total cost and profits
1.01
1.04
0.99
1.03
‘Peak’ market price
0.65
0.65
0.65
0.65
00.10.20.30.40.50.60.70.80.9
Jan Feb Mar Apr May Jun Jul Aug Sep Oct Nov Dec
Pric
e pe
r kg
(A$)
Total Breakeven CIF Cost Average Mthly Price

24
Margin Excess/(Shortfall)
(0.36)
(0.39)
(0.34)
(0.38)
Again, in each case-study the result is a shortfall where breakeven costs and (nominal) profit exceed the ‘peak’ market price. The results in Table 5.12 are shown as a schematic summary in Figure 5.4.
Chinese Cabbage Case-Study in Western Australia During 1995, the Department of Agriculture in Western Australia conducted an analysis for Chinese Cabbage exports to Japan based upon market data from 1990 to 1994. The approach of the case-study was similar to that used in this study, and showed that the Japanese market was a ‘risk’ due to the fluctuations in market prices and the cost of sea freight. It was concluded that the Chinese cabbage exports from WA would need to have a market premium of 60% above the average wholesale price in Japan to realise a margin of zero.

25
Chinese Cabbage – Schematic Summary Comparing Breakeven Costs (plus Nominal Profits) to Peak Market Prices in Taiwan
GROWER EXPORTER IMPORTER WHOLESALE MARKET
Pack House
Distribution Centre
Costs
Direct Inputs
Indirect Inputs
Costs
Post farmgate transport
Cooling
and storage
Packaging labour and materials
Costs
Freight to port
Export administration
Sea freight
Costs
Customs
Tariffs
Import Administration
Market data
Average monthly pricing
Average monthly volumes
Seasonality
Figure 5.4
Breakeven cost of export plus
nominal profit (A$/kg)
Breakeven cost of import plus
nominal profit (A$/kg)
‘Peak’ market Price (A$/kg)
Margin excess
(shortfall) (A$/kg)
0.25 – 0.28
0.64 – 0.68
0.10
0.65
(0.34 - 0.39)
Production Export Port and Sea Freight
Market Port
Breakeven costs of production plus
nominal profit (A$/kg)

26
5.4.4 Summary of Case-Studies for Chinese Cabbage While the Taiwan market for Chinese cabbage is an increasing trend for price and a decreasing trend for supply, the above case studies from Queensland and Victoria show that average and ‘peak’ market prices during 1990 to 1994, do not exceed breakeven costs of production and export. Taiwan appears to be a market risk for the costs of production and export in the case-studies. A market premium for Chinese cabbage would need to be some 52-60% above the target ‘peak’ market price of A$0.65/kg to realise a margin of zero. Even if it was considered that some of the cost estimates in this study were conservative and too high, it is unlikely that costs of production and export would decrease below the target market prices. Further, market risks such as buyer payments and exchange rate fluctuations associated with the recent Asian currency crisis have not been included in this analysis. As the margins in the case-studies are negative, the growers, exporters and importers need to review their anticipated profits and costs in greater detail; else avoid the Taiwan market. Recent discussions with industry groups corroborate this conclusion, and confirm that the Taiwan market has not been commercially viable, but a market presence has often been maintained for strategic purposes. Industry also noted that the introduction of modern production techniques for Chinese Cabbage in Asia has prolonged seasonal production for Chinese cabbage in Asia. As a result Australia’s competitive advantage for ‘off-season’ supply was being threatened.

27
6.0 LOTUS ROOT CASE-STUDY 6.1 PRODUCT AND DESCRIPTION In Australia, Lotus Root (Nelumbo nucifera) is a relatively little known aquatic rhizome vegetable. It is a plant of great versatility as every part of the plant (from the flower and seed, to the root) is consumed. The focus of this case-study is upon the rhizome which is consumed in Asia in stir-frys, soups and salads. The rhizome is shaped similar to a wooden sausage; are a light brown buff colour and occur 60-90 cms long but form as sausage like segments about 15-20 cms long and 5 cms wide. The distinctive identifying feature of the rhizome is the air passages which run the length of the segments, giving the appearance of a wagon-wheel design in cross-section. While Lotus Root is common throughout Asia, only two Australian commercial growers of Lotus Root were identified in this study. Further, the production of commercial quantities of Lotus Root have been small to date. Lotus Root production is ideally suited to existing producers of other aquatic plants and vegetables such as water chestnuts. It could represent a diversification of production without the need for any additionally specialised production, handling or storage equipment. However, it is noted that current research is assessing the suitability of Lotus Root and water chestnuts as rotational crops. 6.2 MARKET SITUATION Vinning (1995) notes that in major markets such as Japan and Taiwan, Lotus Root production is steadily declining while wholesale prices are increasing over time. This is largely attributed to the labour intensive nature of the production and an ageing farmer population. Moreover, the product is an arduous crop to harvest as the roots must be dug from heavy mud at the bottom of ponds. Despite this decline in production in Japan and Taiwan, Vinning states that annual prices are moving upwards. Annual prices are around A$2.50/kg in Taiwan and A$6/kg in Japan. In terms of trade, only data for China is noted by Vinning. China=s volume is rising with the value rising at an even faster rate with CIF prices approaching A$1.00/kg. Volume data indicates that both China and Taiwan are competitive exporters to Japan during September to March. Commercial production of Lotus Root has only become established in the last 5 years in Australia, and commercial sales for the Australian and export markets have just commenced. The crop is relatively unknown in the Australian market, and this study aims to target the off-season period (June to September) in export markets where the crop is established in the market and has a history of demand. Accordingly, discussions with industry in NSW, confirmed that the strategic markets for the export of Lotus Root were Japan and Taiwan.
28
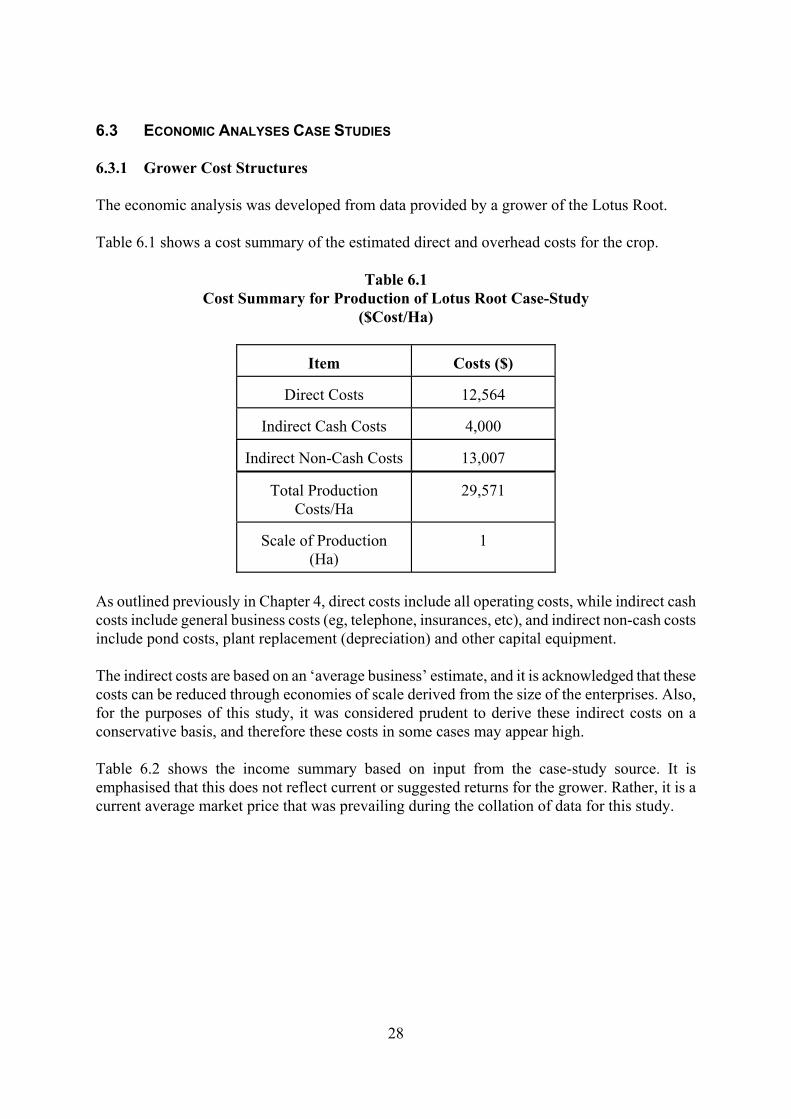
6.3 ECONOMIC ANALYSES CASE STUDIES 6.3.1 Grower Cost Structures The economic analysis was developed from data provided by a grower of the Lotus Root. Table 6.1 shows a cost summary of the estimated direct and overhead costs for the crop. Table 6.1 Cost Summary for Production of Lotus Root Case-Study ($Cost/Ha)
Item
Costs ($)
Direct Costs
12,564
Indirect Cash Costs
4,000
Indirect Non-Cash Costs
13,007
Total Production
Costs/Ha
29,571
Scale of Production
(Ha)
1
As outlined previously in Chapter 4, direct costs include all operating costs, while indirect cash costs include general business costs (eg, telephone, insurances, etc), and indirect non-cash costs include pond costs, plant replacement (depreciation) and other capital equipment. The indirect costs are based on an ‘average business’ estimate, and it is acknowledged that these costs can be reduced through economies of scale derived from the size of the enterprises. Also, for the purposes of this study, it was considered prudent to derive these indirect costs on a conservative basis, and therefore these costs in some cases may appear high. Table 6.2 shows the income summary based on input from the case-study source. It is emphasised that this does not reflect current or suggested returns for the grower. Rather, it is a current average market price that was prevailing during the collation of data for this study.

29
Table 6.2 Income Summary for Lotus Root Case-Study
Item
Income/Value ($)
Producer Price (per kg)
4.00
Marketable Yield (kg/ha)
10,000
Gross Income (per ha)
40,000
Gross Margin (per ha)
27,436
The breakeven cost of producing the Lotus Root is the key first part of this economic analysis. Table 6.3 shows the breakeven cost of production per kilogram of Lotus Root is A$2.96, which is calculated from the total production costs (Table 6.1) and marketable yield (Table 6.2). Therefore for the case-study the expected breakeven cost of growing each kilogram of Lotus Root is A$2.96
The sensitivity analysis in Table 6.3 also shows that for a 15% variation in the marketable yield of Lotus Root, the change in the breakeven cost can vary by up to 44%. Producers and exporters can use this part of the analysis to assess the attractiveness of market prices on offer, and assist producers to assess the impact of the risks for production in comparison to the price >rewards=. Breakeven costs do not include profit or return to invested capital. Table 6.3 Breakeven Cost and Sensitivity to Various Costs and Marketable Yields Lotus Root
Direct and Indirect Costs ($/ha)
Marketable Yield
(-20%) $ 23,657
(-10%) $ 26,614
(0)
$ 29,571
(+10%) $ 32,528
(+20%) $ 35,485
11,500 kg/ha
2.06
2.31
2.57
2.83
3.09
10,000 kg/ha
2.37
2.66
2.96
3.25
3.55
8,500 kg/ha
2.78
3.13
3.48
3.83
4.17
6.3.2 Exporters Cost Structure As indicated in Section 4.3.2 above, the exporter is responsible for all costs beyond the farmgate to the importer. Cost estimates have been gained from the experience of the case-study. Table 6.4 shows the post-harvest cost summary for the markets of Japan and Taiwan for the case-study. Table 6.4

30
Post-Harvest Cost Summary for Lotus Root Case-Study
Item
Approximate Cost For Taiwan and
Japan ($/tonne)
Forced Air Cooling
0
Storage before packing
0
Packaging Cost
120
Packaging Labour
450
Freight to Port
90
Administration Costs
10
Sea Freight Cost/Taiwan ($9,200 per 40’ container)
920
Total Cost per Tonne
1,590
Total Cost per Kg
$1.59
Therefore the expected breakeven cost of exporting each kilogram of Lotus Root is A$1.59
Table 6.5 shows the post-harvest cost summary as a percentage of costs for the case-study.

31
Table 6.5 Post-Harvest Cost Percentages Summary for Case-Study
Item
Cost Percentages For Taiwan and Japan (%)
Forced Air Cooling
0
Storage before packing
0
Packaging Cost
8
Packaging Labour
28
Freight to Port
6
Administration Costs
1
Sea Freight Cost (of $9,200)
58
The cost of shipping accounts for between 58% of the export costs. Packing and packaging costs account for 36% of the export costs. The packing efficiency in the shipping containers is clearly a critical component of this cost.
The shipping costs include all costs (including freight, port handling charges, customs clearance and insurance) ex-Brisbane and CIF to Taiwan and Japan. Overseas port costs, customs and tariffs are assumed to be handled by the importer as shown later. Changes in costs such as shipping and packaging have the potential to significantly affect export costs. Accordingly, Table 6.6 outlines the sensitivity of export costs to variations in post-harvest costs as shown in the bottom half of Table 6.6

32
Table 6.6 Sensitivity of Export Costs for Case Studies Percentage Change in Major Export Cost Scenarios
Scenario
Sea Freight
Packaging
Packing
Other
High Scenario
5 %
10%
15%
10%
Low Scenario
-5%
- 10%
- 15%
-10 %
Scenario
Taiwan
Japan Expected
$1.59
$1.59
High
$1.73
$1.70
Low
$1.45
$1.48
Therefore, the combination of the breakeven production costs (Table 6.3) and breakeven export costs (Table 6.4) shall provide a total expected breakeven cost for each kilogram of marketable produce delivered CIF to Taiwan and Japan. This is shown in Table 6.7. Table 6.7 Total Breakeven CIF Costs for Lotus Root for Case-Study To Taiwan and Japan
Lotus Root Case-Study
$
Breakeven Cost of Production ($/kg)
2.96
Breakeven Cost of Export ($/kg)
1.59
Total Breakeven CIF Costs (per kg)
4.55
Therefore the expected total breakeven cost of growing and exporting each kilogram of Lotus Root is A$4.55
6.3.3 Market Analysis This analysis aims to outline the Taiwan and Japan wholesale market trends and the costs and risks associated with the market.

33
Vinning (1995) indicates that import data for Lotus Root into Taiwan and Japan is scant. Vinning indicates that the Taiwan and Japan annual wholesale throughput is trending downwards while prices are trending upwards. Data sourced by the case study grower shows that annual average wholesale prices (1991-1994) in Taiwan varied from A$1.96/kg to A$2.46/kg (based upon A$1 = $NT22), while annual average wholesale prices (1989-1995) in Japan varies from A$4.28/kg to A$6.76/kg (based upon A$1 = ¥85). On a average monthly wholesale basis, prices varied from A$1.49/kg to A$2.72/kg in Taiwan, and from A$2.18/kg to A$16.76/kg in Japan. For this case study, the above Taiwan and Japan wholesale data has been used to derive monthly prices over 5 years and 7 years respectively. Average, highest and lowest monthly prices over this period are shown in Figure 6.1 and Figure 6.2.
Figure 6.1 Lotus Root - Average Monthly Wholesale Price Data
Taiwan 1991-1994 (Source: Taipei Agricultural Products Marketing Corporation)
Figure 6.2 Lotus Root - Average Monthly Wholesale Price Data
Japan 1989-1995 (Source: Tokyo Municipal Government)
Prices for Lotus Root appear to peak in July and generally coincides with a reduced supply or throughput in the Japan wholesale market as shown in Figure 6.4. This is not the case in Taiwan
0.00
5.00
10.00
15.00
20.00
Jan Feb Mar Apr May Jun Jul Aug Sep Oct Nov Dec
Pric
e pe
r kg
(A$)
Ave Mthly Price Ave Mthly Low Price Ave Mthly High Price
0.000.501.001.502.002.503.00
Jan Feb Mar Apr May Jun Jul Aug Sep Oct Nov Dec
Pric
e pe
r kg
(A$)
Ave Mthly Price Ave Mthly High Price Ave Mthly Low Price

34
(Figure 6.3) where the wholesale throughput volume remains high during the July period. Vinning has noted in previous research (1995, p181), that between 1991 and 1994, both prices and throughput have risen concurrently in Taiwan and is in marked contrast to the Japan market. Nevertheless, for Japan the July period is a strategic target period for supply by the Australian industry. However, it is noted that during recent years China has been exporting some 10-15,000 tonnes per year of Lotus Root to Japan (in competition to Taiwan), and price and quality are key issues.
Figure 6.3 Lotus Root - Average Monthly Wholesale Throughput Data
Taiwan 1991-1994 (Source: Taipei Agricultural Products Marketing Corporation)
Figure 6.4 Lotus Root - Average Monthly Wholesale Throughput Data
Japan 1989-1995 (Source: Tokyo Municipal Government)
It is emphasised that these above prices are average figures and do not allow for spot market prices where premium prices may be on offer in the market. It only give a general trend in the market. Nevertheless, this average pricing scenario provides the basis to compare the breakeven costs for
0
500
1000
1500
2000
Jan Feb Mar Apr May Jun Jul Aug Sep Oct Nov Dec
Ave Mthly Volume Ave Mthly High Volume Ave Mthly Low Volume
020406080
100120
Jan Feb Mar Apr May Jun Jul Aug Sep Oct Nov Dec
Tonn
es
Ave Mthly Volume Ave Mthly High Volume Ave Mthly Low Volume

35
the case-study with the average market conditions. By adding the expected production and exporters breakeven costs together, the expected total breakeven CIF cost (Table 6.7) can be compared to an average monthly wholesale market price of A$2.38/kg in Taiwan and A$5.92 in Japan. The difference between the market price and the total breakeven costs should (for commercial viability) be an excess, and would indicate the margin to accommodate grower and exporter profits. Importers costs have not been included in the breakeven costs at this stage. Figure 6.5 shows that the average monthly wholesale market price of A$2.38/kg (NT$52) in Taiwan does not provide an excess above the breakeven costs of A$4.55/kg. By comparison, Figure 6.6 shows that the average monthly wholesale market price of A$5.92/kg (−503) in Japan does provide an excess above the breakeven costs of A$4.55/kg.
Figure 6.5 Lotus Root – Comparison of Breakeven Costs with Average Monthly Wholesale Price Data
in Taiwan (Source: Taipei Agricultural Products Marketing Corporation)
0.001.002.003.004.005.00
Jan Feb Mar Apr May Jun Jul Aug Sep Oct Nov Dec
Pric
e pe
r kg
(A$)
Ave Mthly Price Total Breakeven CIF Cost

36
Figure 6.6 Lotus Root – Comparison of Breakeven Costs with Average Monthly Wholesale Price Data
in Japan (Source: Tokyo Municipal Government)
To allow for an alternative scenario, Table 6.8 shows an example of where industry may ‘target’ a market window during the peak market period during May to July for Taiwan, and June to August for Japan. The expected total breakeven CIF costs plus a nominal 10% profit for producer and exporter, and an ‘estimated’ nominal cost and profit for importers are compared to a ‘peak’ wholesale price of A$2.57/kg (NT$56) in Taiwan, and $10.52 (−894) in Japan. It is noted that importer costs shall be unique to each importer but shall include produce tariff value, costs, risks and profits.
0.00
2.00
4.00
6.00
8.00
Jan Feb Mar Apr May Jun Jul Aug Sep Oct Nov Dec
Pric
e pe
r kg
(A$)
Ave Mthly Price Total Breakeven CIF Cost

37
Table 6.8 Comparison of Breakeven Costs Plus Nominal Profit To Peak Market Price
Markets
Cost and Returns
Taiwan (A$/kg)
Japan (A$/kg)
Producer cost and profits
3.26
3.26
Exporter cost and profits
1.75
1.75
Importer cost and profits
0.55
0.55
Sub-Total cost and profits
5.56
5.56
‘Peak’ market price
2.57
10.52
Margin Excess/(Shortfall)
(2.99)
4.96
Again for the Taiwan market, the case-study result is a shortfall where breakeven costs and (nominal) profit exceed the ‘peak’ market price. However, for the Japanese market, the case-study result shows that the ‘peak’ market price exceeds breakeven costs and (nominal) profit. This provides the grower, exporter and importer margin to optimise their respective profits. The results in Table 6.8 are shown as a schematic summary in Figure 6.7.

38
Lotus Root – Schematic Summary Comparing Breakeven Costs (plus Nominal Profits) to Peak Market Prices in Taiwan and Japan
GROWER EXPORTER IMPORTER WHOLESALE MARKET
Pack House
Distribution Centre
Costs
Direct Inputs
Indirect Inputs
Costs
Post farmgate transport
Cooling
and storage
Packaging labour and materials
Costs
Freight to port
Export administration
Sea freight
Costs
Customs
Tariffs
Import Administration
Market data
Average monthly pricing
Average monthly volumes
Seasonality
Figure 6.7
Breakeven cost of export plus
nominal profit (A$/kg)
Breakeven cost of import plus
nominal profit (A$/kg)
‘Peak’ market
price (A$/kg)
Margin excess (shortfall)(A$/kg)
3.26 (Taiwan) 3.26 (Japan)
1.75 (Taiwan) 1.75 (Japan)
0.55 (Taiwan) 0.55 (Japan)
2.57 (Taiwan) 10.52 (Japan)
(2.99) (T’wn) 4.96 (Japan)
Production Export Port and Sea Freight
Market Port
Breakeven costs of production plus
nominal profit (A$/kg)

39
6.4.4 Summary of Case-Study For Lotus Root While the Taiwan market for Lotus Root is an increasing trend for price and a decreasing trend for supply, the case study from NSW shows that average and ‘peak’ market prices during 1991 to 1994, do not exceed breakeven costs of production and export. Taiwan appears to be a market risk for the costs of production and export in the case-study. A market premium for Lotus Root would need to be some 216% above the target market price of A$2.57/kg to realise a margin of zero. Even if it was considered that some of the cost estimates were conservative and as a result too high, it is unlikely that costs of production and export would decrease below the target market prices. Further, market risks such as buyer payments and exchange rate fluctuations associated with the recent Asian currency crisis have not been included in this analysis. By comparison, the Japanese market appears to be more attractive as average and ‘peak’ market prices during 1989 to 1995, exceed breakeven costs of production and export. A margin excess of A$4.96 occurs for the ‘peak’ market and is at a premium of 89% above costs for the case study. In addition, Australia’s ability to supply out-of season for the Japanese market would also confer a strategic advantage for Australian exporters over competitor suppliers such as China and Taiwan. It is emphasised that these case-studies are based upon data available at the time of this study. However, the methodology and data is this study can form the basis for a more detailed analysis with more recent and/or detailed data for an individual enterprise.

40
7.0 Burdock 7.1 PRODUCT AND DESCRIPTION Burdock (Arctium lappa) is a long, root vegetable which is a native of Asia. Today, large areas of burdock are only grown in Japan. Taiwan, China and some other South East Asian countries grow burdock but it is mainly for export to Japan. Burdock is a biennial plant which carries its leaves on long stems (approximately 60 cm long) with a crown about 3 cm in diameter. The long tapering tap root can reach lengths of up to 120 cm. However, commercial grades of fresh burdock root need to be 60-90 cm long and less than 3.5 cms in diameter at the crown. Roots usually have a brown skin with a white flesh which discolours rapidly on exposure to air. For this reason, burdock is rarely peeled prior to use and is usually stored in plastic in refrigerated conditions. Burdock is tasty and high in fibre, and has a crunchy texture. It is a popular vegetable in Japan and is a staple vegetable consumed in soups, stews, boiled or deep fried. In the processed form, it is consumed as a pickle, paste or tea. It is also valued for its purported aphrodisiac and medicinal properties. Quality of the product is important and this is expressed in the grading system in Asian markets as shown in Table 7.1. Table 7.1 Grading of Burdock Grade
Size
Root Diameter (mm)
Root Length (cm)
A`
3L 2L L
>36
31-35 26-30
>60 >60 >60
B
M S 2S
21-25 11-15 <10
>60 >55 >35
C
BL BM BS
Cutting
>35
25-35 >15 >20
45-60 45-60 45-60 >40
7.2 MARKET SITUATION Nguyen (1998) notes that Japan produces approximately 200,000 tonnes of burdock annually, valued at some A$800 million wholesale. However, Nguyen also notes that during 1989 to 1995 the Japanese production of burdock has declined, while wholesale prices remained relatively static during this period. Average monthly wholesale prices have been around A$3.50/kg.

41
Similarly, Vinning (1995) confirms that burdock production in Japan has declined by some 20% during the last 30 years, and China and Taiwan are becoming low cost, low quality suppliers to Japan. However to date, Japanese imports have been relatively small at less than 10,000 tonnes. Vinning also notes that in Korea, the market for burdock has been steadily increasing during 1984 to 1992 while in Taiwan steady market growth was disrupted with a sudden increase in market supply and significant price declines during 1993. While international trade focuses upon Japan, Australia has the opportunity to supply not only Japan, but also Taiwan and Korea especially during the period June to August when fresh burdock is in short supply. Accordingly, the economic analysis case-study has focussed upon the markets of Japan, Taiwan and Korea.
7.3 ECONOMIC ANALYSES CASE STUDIES 7.3.1 Grower Cost Structures The economic analysis was developed from data provided by the Departments of Agriculture in NSW and Western Australia for individual growers of Burdock in their states. Table 7.2 shows a cost summary of the estimated direct and overhead costs for the 2 case studies. Table 7.2 Cost Summary for Production of Burdock Case-Studies ($ Cost/Ha)
Case Study
NSW1 ($)
WA1 ($)
Direct Costs
6,899
8,492
Indirect Cash Costs
4,000
2,299
Indirect Non-Cash Costs
5,955
2,551
Total Production Costs/Ha
16,853
13,342
Scale of Production (Ha)
1
1
As outlined previously in Chapter 4, direct costs include all operating costs, while indirect cash costs include general business costs (eg, telephone, insurances, etc), and indirect non-cash costs include plant replacement (depreciation) and other capital equipment. Differences between the costs in the case-studies are due to the reduced usage of labour and increased utilisation of mechanisation for the NSW case-study.
42
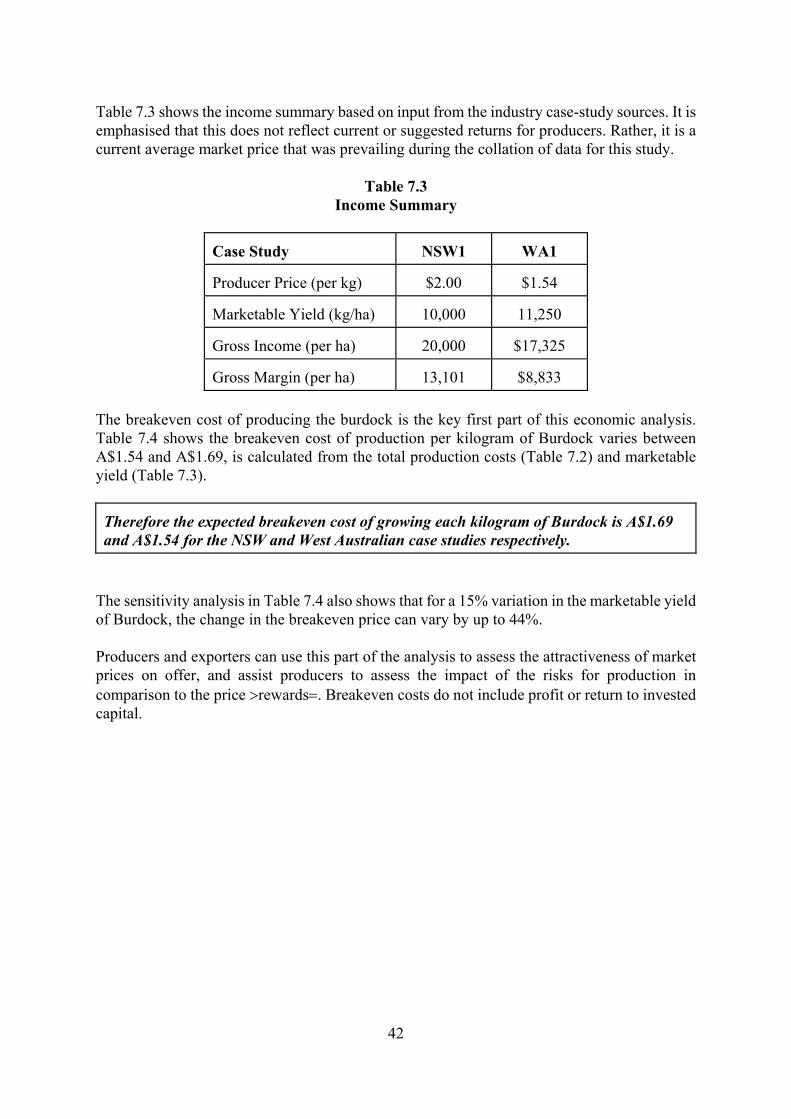
Table 7.3 shows the income summary based on input from the industry case-study sources. It is emphasised that this does not reflect current or suggested returns for producers. Rather, it is a current average market price that was prevailing during the collation of data for this study. Table 7.3 Income Summary
Case Study
NSW1
WA1
Producer Price (per kg)
$2.00
$1.54
Marketable Yield (kg/ha)
10,000
11,250
Gross Income (per ha)
20,000
$17,325
Gross Margin (per ha)
13,101
$8,833
The breakeven cost of producing the burdock is the key first part of this economic analysis. Table 7.4 shows the breakeven cost of production per kilogram of Burdock varies between A$1.54 and A$1.69, is calculated from the total production costs (Table 7.2) and marketable yield (Table 7.3). Therefore the expected breakeven cost of growing each kilogram of Burdock is A$1.69 and A$1.54 for the NSW and West Australian case studies respectively.
The sensitivity analysis in Table 7.4 also shows that for a 15% variation in the marketable yield of Burdock, the change in the breakeven price can vary by up to 44%. Producers and exporters can use this part of the analysis to assess the attractiveness of market prices on offer, and assist producers to assess the impact of the risks for production in comparison to the price >rewards=. Breakeven costs do not include profit or return to invested capital.

43
Table 7.4 Breakeven Price and Sensitivity to Costs and Marketable Yields For Burdock Case Studies Case-Study: NSW1
Direct and Indirect Costs ($/ha)
Marketable Yield
(-20%) $ 13,483
(-10%) $ 15,168
(0)
$ 16,853
(+10%) $ 18,539
(+20%) $ 20,224
11,500 kg/ha
1.17
1.32
1.47
1.61
1.76
10,000 kg/ha
1.35
1.52
1.69
1.85
2.02
8,500 kg/ha
1.59
1.78
1.98
2.18
2.38
Case-Study: WA1
Direct and Indirect Costs ($/ha)
Marketable Yield
(-20%) $ 1,000
(-10%) $ 2,500
(0)
$ 4,000
(+10%) $ 5,500
(+20%) $ 7,000
12,938 kg/ha
1.11
1.22
1.34
1.46
1.57
11,250 kg/ha
1.27
1.41
1.54
1.67
1.81
9,563 kg/ha
1.50
1.66
1.81
1.97
2.13
7.3.2 Exporters Cost Structure As indicated in Section 4.3.2 above, the exporter is responsible for all costs beyond the farmgate to the importer. Cost estimates have been gained from the experience of the case-study growers. The burdock is costed to be delivered CIF to Japan, Taiwan and Korea. It is also noted that no estimate has been made for the overhead costs for the exporter. Table 7.5 shows the post-harvest cost summary for the case-studies.

44
Table 7.5 Post-Harvest Cost Summary for Case-Studies
Approximate Cost ($/Tonne)
Case Study
NSW1
WA1
Market
Taiwan
And Korea
Japan
Forced Air Cooling
0
15
Storage before packing
0
15
Packaging Cost
150
180
Packaging Labour
500
50
Freight to Port
165
15
Administration Costs
520
20
Sea Freight Cost/Taiwan
450
383
Total Cost per Tonne
1,785
678
Total Cost per Kg
$1.79
$0.68
Therefore the expected breakeven cost of exporting each kilogram of Burdock is A$1.79 and A$0.68 for the NSW and West Australian case-studies respectively.
There are significant cost differences between the case-studies shown in Table 7.5. The major cause of this is that in the WA1 case-study, the WA Department of Agriculture have based the post-harvest costs upon extrapolated costs for carrots. By comparison the NSW costs are based upon field data from south west NSW. Accordingly, it is considered that the WA1 costs are conservative. As indicated in Chapter 4, significant costs can be incurred in the production and marketing of new crops. Therefore, in the NSW1 case-study, a significant extra amount of costs have been allowed for the >intensive nature= of the packing for burdock and new (export) crop management. Table 7.6 shows the post-harvest cost summary as a percentage of costs for the case-studies.

45
Table 7.6 Post-Harvest Cost Percentages Summary for Case-Studies
Percentage of Cost Structure
($/Tonne) Case Study
NSW1
WA1
Market
Taiwan and
Korea
Japan
Forced Air Cooling
0
2
Storage before packing
0
2
Packaging Cost
8
7
Packaging Labour
28
27
Freight to Port
9
2
Administration Costs
29
3
Sea Freight Cost/Taiwan
25
57
The cost of shipping accounts for between 25 and 57% of the exporters costs. Packing and packaging costs account for between 35-36% of the exporters costs. The packing efficiency in the shipping containers is clearly a critical component of this cost. And as a result of allowing for additional new crop costs, administration for the NSW1 case-study accounts for nearly 30% of export costs.
The shipping costs include all costs (including freight, port handling charges, customs clearance and insurance) ex-Brisbane CIF to Taiwan or Korea. These port costs, customs and tariffs are assumed to be handled by the importer and are shown later. Changes in costs such as shipping and packaging have the potential to significantly affect export costs. Accordingly, Table 7.7 outlines the sensitivity of export costs to variations in post-harvest costs as shown in the bottom half of Table 7.7.
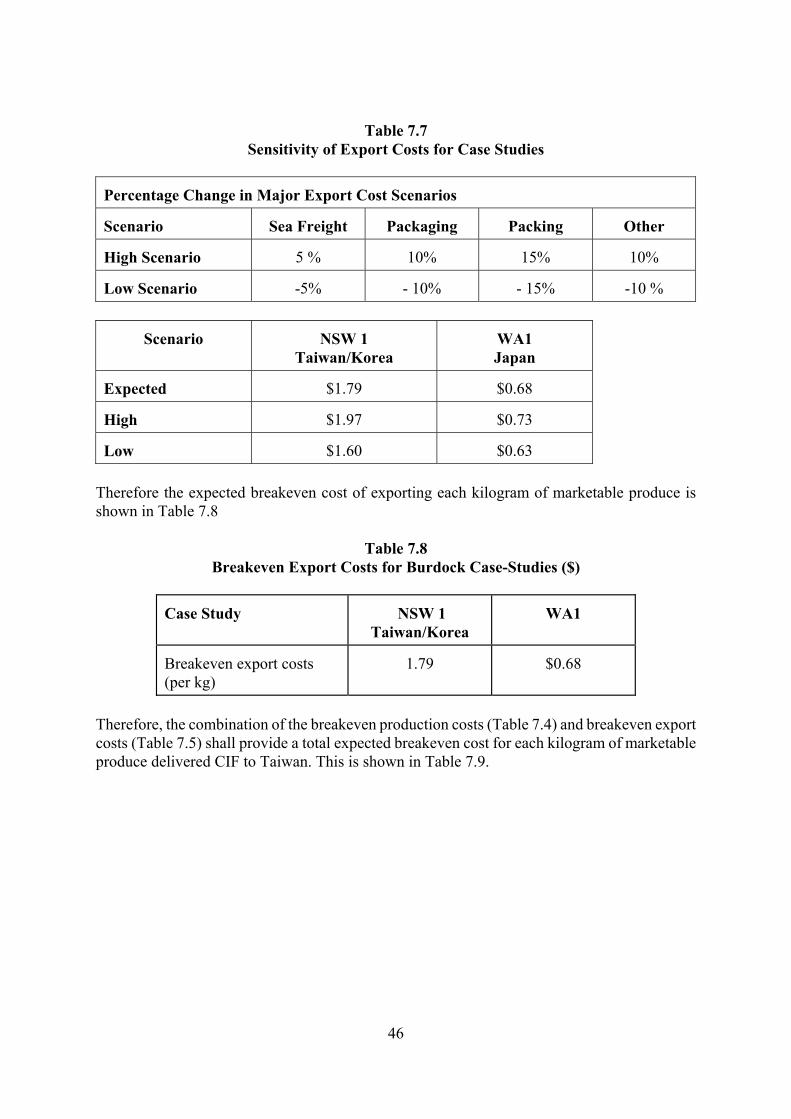
46
Table 7.7 Sensitivity of Export Costs for Case Studies Percentage Change in Major Export Cost Scenarios Scenario
Sea Freight
Packaging
Packing
Other
High Scenario
5 %
10%
15%
10%
Low Scenario
-5%
- 10%
- 15%
-10 %
Scenario
NSW 1 Taiwan/Korea
WA1 Japan
Expected
$1.79
$0.68
High
$1.97
$0.73
Low
$1.60
$0.63
Therefore the expected breakeven cost of exporting each kilogram of marketable produce is shown in Table 7.8 Table 7.8 Breakeven Export Costs for Burdock Case-Studies ($)
Case Study
NSW 1 Taiwan/Korea
WA1
Breakeven export costs (per kg)
1.79
$0.68
Therefore, the combination of the breakeven production costs (Table 7.4) and breakeven export costs (Table 7.5) shall provide a total expected breakeven cost for each kilogram of marketable produce delivered CIF to Taiwan. This is shown in Table 7.9.

47
Table 7.9 Total Breakeven CIF Costs for Burdock Case-Studies ($)
Case Study
NSW 1 Taiwan/Korea
WA 1 Japan
Breakeven Cost for Production ($/kg)
1.69
1.54
Breakeven Cost for Export ($/kg)
1.79
0.68
Total Breakeven CIF Costs ($/kg)
$3.48
$2.22
Therefore the expected breakeven cost of growing and exporting each kilogram of Burdock is A$3.48 for the NSW case study and to A$2.22 for the WA case study
7.3.3 Market Analysis This analysis aims to outline the Japan, Taiwan and Korea wholesale market trends and the costs and risks associated with the market. Vinning (1995) indicates in Japan, annual production of burdock has trended downwards to 250,000 tonnes, wholesale throughput has trended upwards and that wholesale prices are around A$4.50/kg. By comparison, the Taiwan annual wholesale throughput is increasing at a much faster rate than Japan and annual wholesale prices are around A$2/kg. While throughput volumes are not available for Korea, prices have averaged about A$3.30/kg and have increased steadily since 1984. For this case study, wholesale data from Taiwan, Japan and Korea has been used to derive monthly prices over 5 years. Average, highest and lowest monthly prices over this period are shown in Figures 7.1 – 7.3.

48
Figure 7.1
Burdock - Average Monthly Wholesale Price Data Taiwan 1991-1994
(Source: Taiwan Agricultural Products Marketing Corporation)
Figure 7.2 Burdock - Average Monthly Wholesale Price Data
Korea 1993-1995 (Source: Statistical Yearbook of Agriculture, Forestry and Fisheries)
00.5
11.5
22.5
33.5
Jan Feb Mar Apr May Jun Jul Aug Sep Oct Nov Dec
Pric
e pe
r kg
(A$)
Ave Mthly Price Ave Mthly High Price Ave Mthly Low Price
0.00
5.00
10.00
15.00
20.00
25.00
30.00
Jan Feb Mar Apr May Jun Jul Aug Sep Oct Nov Dec
Pric
e pe
r kg
(A$)
Ave Mthly Price Ave Mthly High Price Ave Mthly Low Price

49
Figure 7.3 Burdock - Average Monthly Wholesale Price Data
Japan 1990-1994 (Source: Tokyo Municipal Government)
Prices for Burdock appear to peak in December/January and generally coincides with a reduced supply or throughput in the wholesale market as shown in Figure 7.4 and Figure 7.5
Figure 7.4 Burdock - Average Monthly Wholesale Throughput Data
Taiwan 1990-1994 (Source: Taiwan Agricultural Products Marketing Corporation)
0.00
2.00
4.00
6.00
8.00
10.00
Jan Feb Mar Apr May Jun Jul Aug Sep Oct Nov Dec
Pric
e pe
r kg
(A$)
Ave Mthly Price Ave Mthly High Price Ave Mthly Low Price
020406080
100120140
Jan Feb Mar Apr May Jun Jul Aug Sep Oct Nov Dec
Ave Mthly Volume Ave Mthly High Volume Ave Mthly Low Volume

50
Figure 7.5 Burdock - Average Monthly Wholesale Throughput Data
Japan 1990-1994 (Source: Tokyo Municipal Government)
It is emphasised that these above prices are average figures and do not allow for spot market prices where premium prices may be on offer in the market. It only give a general trend in the market. Nevertheless, this average pricing scenario provides the basis to compare the breakeven costs for the case-studies with the average market conditions. By adding the expected production and exporters breakeven costs together, the expected total breakeven CIF cost (Table 7.9) can be compared to the average monthly market price of A$1.89/kg in Taiwan, A$3.56/kg in Korea and A$3.82/kg in Japan. The difference between the market price and the total breakeven costs should (for commercial viability) be an excess, and would indicate the margin to accommodate grower and exporter profits. Importers costs have not been included in the breakeven costs at this stage of the analysis. However as shown in Figure 7.6, all the case-studies show that the average monthly wholesale market price of A$1.89/kg (NT$41) in Taiwan does not provide an excess above the breakeven costs of A$3.48/kg. However Figures 7.7 and 7.8 show that average monthly wholesale market prices of A$3.56/kg (W2472/kg) and A$3.82/kg (−325/kg) exceed the breakeven costs in Korea (A$3.48/kg) and Japan (A$2.22/kg) respectively.
0
500
1000
1500
2000
2500
3000
Jan Feb Mar Apr May Jun Jul Aug Sep Oct Nov Dec
Tonn
es
Ave Mthly Volume Ave Mthly High Volume Ave Mthly Low Volume

51
Figure 7.6 Burdock – Comparison of Breakeven Costs
with Average Monthly Wholesale Price Data in Taiwan (Source: Taiwan Agricultural Products Marketing Corporation)
Figure 7.7 Burdock – Comparison of Breakeven Costs
with Average Monthly Wholesale Price Data in Korea
(Source: Statistical Yearbook of Agriculture, Forestry and Fisheries)
Figure 7.8 Burdock – Comparison of Breakeven Costs
with Average Monthly Wholesale Price Data in Japan
0.00
1.00
2.00
3.00
4.00
Jan Feb Mar Apr May Jun Jul Aug Sep Oct Nov Dec
Ave Mthly Price Total Breakeven CIF Cost NSW Total Breakeven CIF Cost WA
0.00
1.00
2.00
3.00
4.00
5.00
Jan Feb Mar Apr May Jun Jul Aug Sep Oct Nov Dec
Ave Mthly Price Total Breakeven CIF Cost NSW Total Breakeven CIF Cost WA
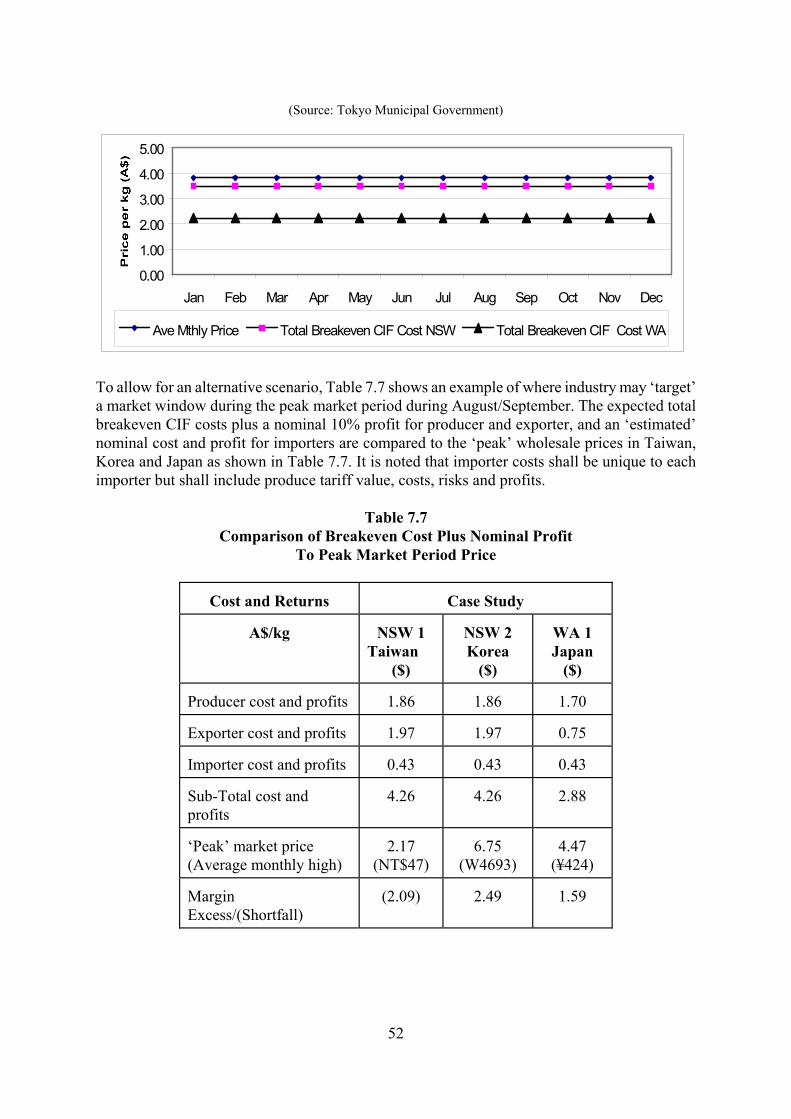
52
(Source: Tokyo Municipal Government)
To allow for an alternative scenario, Table 7.7 shows an example of where industry may ‘target’ a market window during the peak market period during August/September. The expected total breakeven CIF costs plus a nominal 10% profit for producer and exporter, and an ‘estimated’ nominal cost and profit for importers are compared to the ‘peak’ wholesale prices in Taiwan, Korea and Japan as shown in Table 7.7. It is noted that importer costs shall be unique to each importer but shall include produce tariff value, costs, risks and profits. Table 7.7 Comparison of Breakeven Cost Plus Nominal Profit To Peak Market Period Price
Cost and Returns
Case Study
A$/kg
NSW 1 Taiwan ($)
NSW 2 Korea ($)
WA 1 Japan ($)
Producer cost and profits
1.86
1.86
1.70
Exporter cost and profits
1.97
1.97
0.75
Importer cost and profits
0.43
0.43
0.43
Sub-Total cost and profits
4.26
4.26
2.88
‘Peak’ market price (Average monthly high)
2.17
(NT$47)
6.75
(W4693)
4.47
(¥424) Margin Excess/(Shortfall)
(2.09)
2.49
1.59
0.00
1.00
2.00
3.00
4.00
5.00
Jan Feb Mar Apr May Jun Jul Aug Sep Oct Nov Dec
Ave Mthly Price Total Breakeven CIF Cost NSW Total Breakeven CIF Cost WA

53
Again, in the case-studies that target Korea and Japan the result is that the ‘peak’ market price exceeds the breakeven costs and (nominal) profit. However, Taiwan’s ‘peak’ market price appears insufficient to achieve an excess above profit and costs is realised The results in Table 7.7 are shown as a schematic summary in Figure 7.9.

54
Burdock – Schematic Summary Comparing Breakeven Costs (plus Nominal Profits) to Peak Market Prices in Taiwan, Korea and Japan
Figure 7.9
GROWER EXPORTER IMPORTER WHOLESALE MARKET Pack
House Distribution
Centre
Costs
Direct Inputs
Indirect Inputs
Costs
Post farmgate transport
Cooling
and storage
Packaging labour and materials
Costs
Freight to port
Export administration
Sea freight
Costs
Customs
Tariffs
Import Administration
Market data
Average monthly pricing
Average monthly volumes
Seasonality
Breakeven cost of export plus
nominal profit (A$/kg)
Breakeven cost of import plus
nominal profit (A$/kg)
‘Peak’ market
price (A$/kg)
Margin excess (shortfall)(A$/kg)
1.86 (Taiwan) 1.86 (Korea) 1.70 (Japan)
1.97 (Taiwan) 1.97 (Korea) 0.75 (Japan)
0.43 (Taiwan) 0.43 (Korea) 0.43 (Japan)
2.17 (Taiwan) 6.75 (Korea) 4.47 (Japan)
(2.09) (Taiwan) 2.49 (Korea) 1.59 (Japan)
Production Export Port and Sea Freight
Market Port
Breakeven costs of production plus
nominal profit (A$/kg)

55
7.3.4 Summary of Case-Studies for Burdock While the Taiwan market for Burdock is an increasing trend for price, the above case studies from NSW and West Australia show that average and >peak= market prices for the Taiwan market, do not exceed breakeven costs of production and export. Taiwan appears to be a market risk for the costs of production and export in the case-studies. A market premium for Burdock would need to be some 96% above the target market price of A$2.17/kg to realise a margin of zero. Further, market risks such as buyer payments and exchange rate fluctuations associated with the recent Asian currency crisis have not been included in this analysis. By comparison, the Japan and Taiwan markets appears to be more attractive as average and ‘peak’ market prices, exceed breakeven costs of production and export. In the case of Japan, a margin excess of some 55% (or A$1.59/kg) occurs for the >peak= market. For Korea, a margin excess of some 58% (or A$2.49/kg) occurs for the >peak= market. In addition for both Japan and Korea, the NSW case-study includes the additional >new crop= administration/labour costs (Table 7.5) for the post harvest handling and marketing of burdock. In addition, Australia’s ability to supply from a Autumn harvest would enable the industry to supply out-of season during May to August for the Japanese market. This would confer a strategic advantage for Australian exporters over other Asian competitor suppliers such as China and Taiwan. It is emphasised that these case-studies are based upon data available at the time of this study. However, the methodology and data is this study can form the basis for a more detailed analysis with more recent and/or detailed data for an individual enterprise.

56
8.0 Daikon 8.1 PRODUCT AND DESCRIPTION Daikon or long white radish (Raphanus sativus) is a long, root vegetable which is well-established in Asia where annual production is estimated at approximately 20 million tonnes per annum. The radish plant grows erect with a short stem and leafy rosettes. Daikon or the root is the swollen tap root and occurs in a variety of shapes and sizes; the different forms reflecting the crops response to different soil and climatic conditions. Some varieties are snubbed nose and not tapered while others are tapered in the form of a long tap root. Sizes of the radish varies from giant varieties which can reach up to 1.2 metres in length, and weigh up to 30 kgs, to the more common sizes of 35-60 cms in length and 5-10 cms in diameter. Daikon is a good source of vitamin C and dietary fibre. The root, leaf and seed pod are all consumed as cooked vegetables, but may also be consumed raw or further processed into pickled, salted or dried forms. Quality of the product is important and this is expressed in the grading system in Japanese markets as shown in Table 8.1. Table 8.1
Grading of Daikon
Grade Type
2L
(gms)
L
(gms)
M
(gms)
S
(gms)
Long >1200 900-1200 700-900 400-700
Short >1300 1000-1300 800-1000 600-800
Stubby >2500
2000-2500 1500-2000 1000-1500

57
8.2 MARKET SITUATION Most markets in Asia consume Daikon due to its ubiquitous occurrence. Therefore Daikon has a considerable number of potential markets. However, Vinning notes that production of Daikon in Asia appears to be declining due to the ageing and declining farmer population and the relatively low price of the product. Nguyen (1998) confirms this where he noted that Japan’s production of Daikon has reduced from 2 million tonnes to 1.6 million tonnes between the 1980’s and 1990’s. To gain premium prices, RIRDC’s research (Nguyen, 1998, Vinning, 1995, Pan, 1995) suggests that higher premium market opportunities exist for supplying Daikon fresh or processed for further processing eg, drying and pickling. Nguyen notes that imported quantities of Daikon are relatively low at less than 500 tonnes per annum during 1990 – 1994. Annual wholesale prices vary around A$1.00 – 1.20 per kg. Various sources note that the prices for processed product are higher but this information is unclear and separate import statistics for processed product in Japan is not available. The research generally considers that Japan is the major market opportunity with annual prices trending upwards at a greater rate than the downward trend in production (Vinning 1995). 8.3 ECONOMIC ANALYSES CASE STUDIES 8.3.1 Grower Cost Structures The economic analysis was developed based upon data provided by the Department of Agriculture Western Australia (1997). Table 8.2 shows a cost summary of the estimated direct and overhead costs for the case study. Table 8.2 Cost Summary for Production of Daikon Case-Study ($ Cost/Ha)
Case Study
WA1 ($)
Direct Costs
14,920
Indirect Cash Costs
2,299
Indirect Non-Cash Costs
2,088
Total Production Costs/Ha
19,307
Scale of Production (Ha)
1

58
As outlined previously in Chapter 4, direct costs include all operating costs, while indirect cash costs include general business costs (eg, telephone, insurances, etc), and indirect non-cash costs include plant replacement (depreciation) and other capital equipment. The indirect costs are based on an >average business= estimate, and it is acknowledged that these costs can be reduced through economies of scale derived from the size of the enterprises. Also, for the purposes of this study, it was considered prudent to derive these indirect costs on a conservative basis, and therefore these costs in some cases may appear high. Table 8.3 shows the income summary. It is emphasised that this does not reflect current or suggested returns for producers. Rather, it is a current average market price that was prevailing during the collation of data for this study. Table 8.3 Income Summary
Case Study
WA1
Producer Price (per kg)
$0.40
Marketable Yield (kg/ha)
60,000
Gross Income (per ha)
24,000
Gross Margin (per ha)
$9,080
The breakeven cost of producing the Daikon is the key first part of this economic analysis. Table 8.4 shows the breakeven cost of production per kilogram of Daikon is A$0.32, and is calculated from the total production costs (Table 8.2) and marketable yield (Table 8.3). Therefore the expected breakeven cost of growing each kilogram of Daikon is A$0.32 for the Western Australian case study.
The sensitivity analysis in Table 8.4 also shows that for a 15% variation in the marketable yield of Daikon, the change in the breakeven price can vary by up to 45%. Producers and exporters can use this part of the analysis to assess the attractiveness of market prices on offer, and assist producers to assess the impact of the risks for production in comparison to the price >rewards=. Breakeven costs do not include profit or return to invested capital.

59
Table 8.4 Breakeven Price and Sensitivity to Costs and Marketable Yields For Daikon Case Study Case-Study: WA1
Direct and Indirect Costs ($/ha)
Marketable Yield
(-20%) $ 15,446
(-10%) $ 17,376
(0)
$ 19,307
(+10%) $ 21,238
(+20%) $ 23,169
69,000 kg/ha
0.22
0.25
0.28
0.31
0.34
60,000 kg/ha
0.26
0.29
0.32
0.35
0.39
51,000 kg/ha
0.30
0.34
0.38
0.42
0.45
8.3.2 Exporters Cost Structure As indicated in Section 4.3.2 above, the exporter is responsible for all costs beyond the farmgate to the importer. Cost estimates have been gained from the experience of the case-study growers. The Daikon is costed to be delivered CIF to Japan. It is also noted that no estimate has been made for the overhead costs for the exporter such as offices and staff. Table 8.5 shows the post-harvest cost summary for the case-study.

60
Table 8.5 Post-Harvest Cost Summary for Case-Studies
Approximate Cost
($/Tonne) Case Study
WA1 Market
Japan
Forced Air Cooling
15
Storage before packing
15
Packaging Cost
180
Packaging Labour
50
Freight to Port
15
Administration Costs
20
Sea Freight Cost/Taiwan
418
Total Cost per Tonne
713
Total Cost per Kg
$0.71
Therefore the expected breakeven cost of exporting each kilogram of Daikon is A$0.71 for the West Australian case-study.
Table 8.6 shows the post-harvest cost summary as a percentage of costs for the case-study.

61
Table 8.6 Post-Harvest Cost Percentages Summary for Case-Studies
Percentage of Cost
Structure (%)
Case Study
WA1
Market
Japan
Forced Air Cooling
2
Storage before packing
2
Packaging Cost
25
Packaging Labour
7
Freight to Port
2
Administration Costs
3
Sea Freight Cost/Japan
59
The cost of shipping accounts for 59% of the exporters costs. Packing and packaging costs account for 32% of the exporters costs. The packing efficiency in the shipping containers is clearly a critical component of this cost.
The shipping costs include all costs (including freight, port handling charges, customs clearance and insurance) ex-Perth to Japan. These port costs, customs and tariffs are assumed to be handled by the importer as shown later. Changes in costs such as shipping and packaging have the potential to significantly affect export costs. Accordingly, Table 8.7 outlines the sensitivity of export costs to variations in post-harvest costs as shown in the bottom half of Table 8.7.

62
Table 8.7 Sensitivity of Export Costs for Case Studies Percentage Change in Major Export Cost Scenarios Scenario
Sea Freight
Packaging
Packing
Other
High Scenario
5 %
10%
15%
10%
Low Scenario
-5%
- 10%
- 15%
-10 %
Scenario
WA1 Japan
Expected
$0.71
High
$0.77
Low
$0.66
Therefore the expected breakeven cost of exporting each kilogram of marketable produce is shown in Table 8.8 Table 8.8 Breakeven Export Costs for Daikon Case-Study ($)
Case Study
WA1
Breakeven export costs (per kg)
$0.71
Therefore, the combination of the breakeven production costs (Table 8.4) and breakeven export costs (Table 8.5) shall provide a total expected breakeven cost for each kilogram of marketable produce delivered CIF to Japan. This is shown in Table 8.9.

63
Table 8.9 Total Breakeven CIF Costs for Daikon Case-Study ($)
Case Study
WA 1 Japan
Breakeven Cost for Production ($/kg)
0.32
Breakeven Cost for Export ($/kg)
0.71
Total Breakeven CIF Costs ($/kg)
$1.03
Therefore the expected breakeven cost of growing and exporting each kilogram of Daikon is A$1.03 for the WA case study
8.3.3 Market Analysis This analysis aims to outline the Japanese wholesale market trends and the costs and risks associated with the market. Vinning (1995) indicates in Japan, year round production is achieved using various seasonal Daikon cropping types. However despite this, the Japanese market experiences a summer constraint of high temperatures and humidity inducing bacterial rot and Fusarium diseases, and a winter-early spring constraint of low temperatures inducing flower bud initiation and poor root thickening. The annual production of Daikon has trended downwards to 60,000 ha in the 1990’s, and wholesale throughput has also declined to 170,000 tonnes in 1996. Average monthly wholesale fresh prices in Japan have trended upwards to around A$1.20/kg. As noted previously, Daikon may be further processed into dry and pickled forms, and nearly four times the volume of fresh Daikon goes to the pickled or Takuan form (Nguyen (1998)) He also notes that Takuan comprises some 32% of the approximately A$6 billion ‘pickled vegetable’ market. Average monthly wholesale Takuan prices in Japan have trended upwards to around A$5.00/kg. For this case study, Japan wholesale data from 1990 to 1994 has been used to derive monthly prices over 5 years. Average, highest and lowest monthly prices over this period are shown in Figure 8.1 and provides a confirmation of the general trend for price increases.

64
Figure 8.1
Daikon - Average Monthly Wholesale Price Data Japan 1990-1994
(Source: Tokyo Municipal Government)
Prices for Daikon appear to peak in July/August and generally coincides with a reduced supply or throughput in the wholesale market as shown in Figure 8.2
Figure 8.2 Daikon - Average Monthly Wholesale Throughput Data
Japan 1990-1994 (Source: Tokyo Municipal Government)
It is emphasised that these above prices are average figures and do not allow for spot market prices where premium prices may be on offer in the market. It only give a general trend in the market. Nevertheless, this average pricing scenario provides the basis to compare the breakeven costs for the case-studies with the average market conditions. By adding the expected production and
0.000.501.001.502.002.50
Jan Feb Mar Apr May Jun Jul Aug Sep Oct Nov Dec
Pric
e pe
r kg
(A$)
Ave Mthly Price Ave Mthly High Price Ave Mthly Low Price
05000
10000150002000025000
Jan Feb Mar Apr May Jun Jul Aug Sep Oct Nov Dec
Tonn
es
Ave Mthly Volume Ave Mthly High Volume Ave Mthly Low Volume

65
exporters breakeven costs together, the expected total breakeven CIF cost (Table 8.6) can be compared to an average monthly market price of A$1.18 per kg. The difference between the market price and the total breakeven costs should (hopefully) be an excess, and would indicate the margin to accommodate grower and exporter profits. Importers costs have not been included in the breakeven costs at this stage of the analysis. However, as shown in Figure 8.3, the case-study shows that the average monthly wholesale market price of A$1.18/kg (−100/kg) in Japan does provide an excess above the breakeven cost of A$1.03/kg. But it is noted that this excess is only 15% above the breakeven cost, and may not be sufficient to accommodate profits and risks along the supply chain.
Figure 8.3 Daikon – Comparison of Breakeven Costs
with Average Monthly Wholesale Price Data in Japan (Source: Tokyo Municipal Government)
To allow for an alternative scenario, Table 8.7 shows an example of where industry may >target= a market window during the peak market period during August/September. The expected total breakeven CIF costs plus a nominal 10% profit for producer and exporter, and an >estimated= nominal cost and profit for importers are compared to the peak wholesale prices in Japan as shown in Table 8.7. It is noted that importer costs shall be unique to each importer but shall include produce tariff value, costs, risks and profits.
0.951.001.051.101.151.20
Jan Feb Mar Apr May Jun Jul Aug Sep Oct Nov Dec
Pric
e pe
r kg
(A$)
Ave Mthly Price Total Breakeven CIF Cost WA

66
Table 8.10
Comparison of Breakeven Cost Plus Nominal Profit To Peak Market Period Price
Cost and Returns
Case Study
A$/kg
WA 1 Japan ($A)
Producer cost and profits
0.35
Exporter cost and profits
0.78
Importer cost and profits
0.43
Sub-Total cost and profits
1.56
‘Peak’ market price
1.38
Margin Excess/(Shortfall)
(0.18)
In this scenario for the case-study, the result is that the ‘peak’ market price in Japan exceeds the breakeven costs and (nominal) profit. The results in Table 8.10 is shown as a schematic summary in Figure 8.4.

67
Daikon – Schematic Summary Comparing Breakeven Costs (plus Nominal Profits) to Peak Market Prices in Japan
Figure 8.4
GROWER EXPORTER IMPORTER WHOLESALE MARKET
Pack House
Distribution Centre
Costs
Direct Inputs
Indirect Inputs
Costs
Post farmgate transport
Cooling
and storage
Packaging labour and materials
Costs
Freight to port
Export administration
Sea freight
Costs
Customs
Tariffs
Import Administration
Market data
Average monthly pricing
Average monthly volumes
Seasonality
Breakeven cost of export plus
nominal profit (A$/kg)
Breakeven cost of import plus
nominal profit (A$/kg)
‘Peak’ market
price (A$/kg)
Margin excess (shortfall)(A$/kg)
0.35
0.78
0.43
1.38 (0.18)
Production Export Port and Sea Freight
Market Port
Breakeven costs of production plus
nominal profit (A$/kg)

68
8.3.4 Summary of Case-Studies for Daikon While the Japan market for Daikon is an increasing trend for price, the above case study from West Australia show that while average Japan market prices exceed breakeven production and export costs, the ‘peak= market prices do not exceed breakeven costs of production, export and import. Japan appears to be a market risk for the costs of production and export in the case-study. A market premium for Daikon would need to be some 13% above the ‘peak’ wholesale market price of A$1.38/kg to realise a margin of zero. Further, market risks such as buyer payments and exchange rate fluctuations associated with the recent Asian currency crisis have not been included in this analysis. While it has not been the subject of this study, a possible market opportunity may be the value-added and processed ‘Takuan’ form of Daikon. As reported by Pan (1995) and Nguyen (1998), this product attracts higher market prices in Japan than fresh daikon.

69
9.0 DISCUSSION The following factors directly affected the commercial viability of the Asian vegetables in the case-studies 9.1 KEY FACTORS INFLUENCING PRODUCTION AND MARKETING 9.1.1 Direct Costs Direct or operating costs for production in all the case-studies were major costs. The most important direct cost item in all case-studies was labour, and in all the case-studies it was shown that the use of mechanisation was a major opportunity to reduce labour costs. 9.1.2 Indirect Costs While plant and equipment may reduce direct labour costs, such investments shall also increase indirect costs. The case-studies showed that indirect costs for plant, depreciation and other general costs were a significant cost especially where new plant was required as in the Lotus Root and Burdock case-studies. This may not be the case with Chinese cabbage as existing equipment used for other brassicas may be also used for Chinese cabbage. However, these equipment costs are essentially start-up costs which over a longer period of time may be depreciated. Nevetheless, these are a real and major cost for the development of new Asian vegetables. 9.1.3 Marketable Yield While this is not a >cost= per se, it has a significant impact on the amount and quality of produce yielded by the crop. >Production performance= in turn affects the price returns or market premiums, and the break-even cost of production. Importantly, marketable yield is influenced by environmental factors and certain regions of Australia may provide a more competitive environment for production than others. 9.1.4 Packaging and Transport Packaging and transport are the most significant costs and risks for the exporter. Moreover, the case-studies showed that the sensitivity of these costs upon total export costs is critical. For example, shipping or freight costs could account for 55-65% of the export costs, while packing and packaging could account for up to 35% of the exporters costs. All shipping and cost estimates require careful analysis to derive an accurate export cost. 9.1.5 Importers Costs and Returns In the analyses in this study, no attempt has been made to accurately assess importer costs and returns. These costs are obviously market specific as they shall include tariffs, port and customs costs, and risks and profits prevailing in the market. These costs however, are a significant cost component in the supply chain and need to be assessed accurately.

70
Importantly, importers shall often assist with marketing arrangements and may often provide the market and consumer feedback for the supply chain. Accordingly, importer ‘costs’ are an important part of a business plan for new crops such as Asian vegetables into export markets. 9.1.6 Management Labour for ‘New’ Crops Importantly, management labour and return to capital invested in the land and machinery are not included in the analyses in this study. It is recognised however that management labour in the introduction and development of new crops is a significant cost during at least the initial years of introduction. Industry information and data for this cost item was found to be generally unavailable. Industry sources conceded and acknowledged the significant cost of this item but found it difficult to quantify. 9.2 COMMERCIAL FEASIBILITY OF THE PRIORITY ASIAN VEGETABLES Table 9.1 summarises the results of the commercial viability of the Asian vegetables by case-study export market. Table 9.1 Summary of Case-Studies and Commercial Viability
Asian Vegetable/ Case-study
Japan
Taiwan
Korea
Chinese Cabbage < Queensland < Victoria < Western Australia
NA NA ς
ς ς
NA
NA NA NA
Lotus Root < NSW
Υ
ς
NA
Burdock < NSW < Western Australia
Υ Υ
ς ς
Υ Υ
DAIKON < Western Australia
ς
NA
NA
Υ Economically Viable ς Not Economically Viable NA Not Analysed
Discussions with the growers who provided support for the case-studies confirm that:
The Chinese cabbage market is volatile and experiences strong competition from both other importers and local industry in the markets. The markets of Taiwan, Japan and Korea were

71
not commercially viable in these case-studies.
More recently, the strong demand for Chinese cabbage in Australia highlights the opportunity to develop a diversified market strategy which includes both the export and Australian markets. It is also further noted that the product for the Australian market is often of a different specification, and may complement the specification of export product.
Lotus Root is a less volatile product market; however it is also a less well-known and less well-established (production) vegetable in Australia. Nevertheless, it appears to be a commercially viable Australian export to Japan, but not to Taiwan.
Again, it is noted that industry has highlighted the recent growth in demand for Lotus Root in the Australian market.
Burdock similarly, is a less well-known vegetable in Australia but appears to have significant
market potential and commercial viability for export to Japan and Korea.
Daikon, as a fresh product is a relatively common vegetable in Japan with significant market volumes. However, the market of Japan was not considered to be commercially viable in the case-study. The processed form of Daikon (Takuan) may be a more attractive market opportunity in Japan.

72
9.3 SUPPLY CHAIN MANAGEMENT Demand driven supply chains are the current competitive frontier of trade in agribusiness. Companies are achieving strong competitive advantages by collaborating as participants in ‘strong’ chains. These chains cross state and national borders (and in some cases, commodity or industry borders) and often dwarf the competitiveness of individual companies acting alone. As the competitive advantages from seasonal windows of supply narrow, and spot markets become more opportunistic, export competition for Asian vegetables is becoming ‘supply chain versus supply chain’. It is no longer simply product versus product or company versus company. This development highlights the ‘need and opportunity’ for developing effective collaboration with others in order to compete in export markets. As previously mentioned, this study adopts the approach whereby the management of the multiple factors that result in efficient, demand–driven flow of Asian vegetables from primary producer to consumer, is required to satisfy the expectation of consumers. A more accurate definition of the supply chain may be ‘the end to end process of producing, processing, distributing, marketing and final sale of the products or services to the consumer’. As a result for Australian grown Asian vegetables, the supply chain for production and processing may well include horizontal grower industry groups throughout different regions of Australia. Therefore, alliances between production regions of Asian vegetables in Australia may enhance the continuity of Asian vegetable supply especially where regional competitive advantages complement each other, and add value for the supply chain.

73
10.0 CONCLUSIONS AND RECOMMENDATIONS Conclusion 1 This study has demonstrated the economic feasibility for selected Asian vegetables for export markets. It has applied a ‘whole-of-supply chain’ approach and provides a framework for analyses for other Asian vegetables at both the feasibility and specific enterprise level. It is emphasised that the information used in the case-studies are market and enterprise specific, but are broadly representative of enterprises and the markets during the study. As a result, this study can form a reference point from which other studies can be conducted for specific enterprises and their business plans. Recommendation 1 Communicate the ‘supply chain’ approach and results of this study to industry, and encourage industry to conduct ‘enterprise’ specific business plan studies for their export ‘priority’ Asian vegetables. Conclusion 2 The relatively high risk and negative returns shown for some of the Asian vegetables in the selected markets, highlights the need for industry to pursue diversified markets. In this respect, the Australian domestic market should be considered an important market especially for product which is more a suitable grade for the Australian market. Recommendation 2 Support research to conduct a study of the economic benefits of Asian vegetables for the Australian market, especially as a complementary market for exports. Conclusion 3 This analysis confirms the importance of the following key economic assessment issues raised by industry.
Market price models of average, high and low seasons. Cost of production, processing and packaging. Gross margins. Freight and transport costs. Production volumes and breakeven costs. Seasonality analysis. Sensitivity analyses.
Further, the analysis identifies the following specific issues as having a major effect upon production and marketing costs.
Direct labour costs. Indirect plant and equipment costs.

74
Marketable yield. Packaging and transport. Importers costs and returns. Management labour for ‘new’ crops.
Recommendation 3 Support industry research to address the control and/or reduction of the specific cost issues identified in this study for export Asian vegetables. Conclusion 4 The availability and accuracy of information is relatively difficult to access at the importer and market price end of the supply chain. This lack of transparency in market information is a barrier to the improvement of the commercial viability of Asian vegetable exports. Recommendation 4 Support industry research to develop transparency in the supply chain especially for accurate and timely market data for ‘priority’ export Asian vegetables. Conclusion 5 The Asian vegetables industry remains a relatively diverse and fragmented industry. During this study, communication of economic or market information with industry in different regions of Australia often proved difficult. This precludes communication of industry and market information for growers. Recommendation 5 Support the development of ‘national industry working groups’ responsible for the dissemination of strategic industry information for new Asian vegetables.

75
11.0 APPENDICES

76
APPENDIX A
Summary of Korean and Indonesian Market Research

77
KOREA VEGETABLE PRODUCTION
! Korean vegetables production is increasing - however, most of the increase is from pumpkin, water melon and carrots.
! Considerable seasonal production variations especially due to the cold winters.
! These extreme seasonal supply fluctuations are being addressed with large scale vertical integration to farms and contract farming.

78
KOREA VEGETABLE CONSUMPTION
! Koreans have a high per capita consumption of vegetables - almost 140 kg/pa.
! This is largely due to the role of vegetables in the conventional meals eg, (soup) kuk, pan chan, kim chi.
! Vegetable consumption has grown in line with economic growth with per capita income rising to US$10,000 in 1996.
! However, >westernisation= is slowing the growth of vegetable consumption.

79
KOREA VEGETABLE MARKETING AND DISTRIBUTION
! Traditional outlets of sijangs and >wholesale= markets - Development of Co-operative supply/marketing groups - Sijangs or small-scale shopkeepers dominate food retailing with 80%+ of vegetables being distributed.
! Western retail chains
- Retail chains represent 1% of total store numbers but sell 13% of all retail food. - Chain growth is relatively slow .
! Food Service sector
- Hotels, restaurants and ship chandling. - Traditional Asian hotels/restaurants and Kimpap Korean takeaways are major users of Asian vegetables.
! Food processors - 5,600 establishments tho= only 300 process vegetables.
! Food exporters
- Relatively small.

80
KOREA IMPORT ISSUES FOR VEGETABLES
! Tariffs - 19.7-45% ad valorum duties plus fees. - Market liberalisation reforms commencing 1997.
! Quarantine - Schedule of 100 prohibited pests and diseases
- Phytosanitary certificates (eg, Paechu/Chinese Cabbage) - Potential pests and diseases for Australian Asian vegetables which would require fumigation include:
a. Tobacco blue mold b. Sweet corn stem borer and weevil c. Burrowing nematode (eg, Mu/Daikon, ) d. Oriental and Qld fruit flys
- Effects of methyl bromide fumigation?
! Infrastructure - Poor quarantine inspection facilities. - Cold chain issues. - Small vehicular transport.

81
KOREA POTENTIAL ASIAN VEGETABLES
! Paechu (Chinese Cabbage) - Major vegetable with Mu represents 60% of the total vegetable production. - Market growth especially due to Kim Chi.
! Mu (Daikon)
- Major vegetable with Paechu represents 60% of the total vegetable production. - Market growth especially due to Kim Chi.
! Yon-gun(Lotus)
- Minor vegetable but some potential due to trend to processed foods.
! Uong (Burdock) - Comparatively minor vegetable. - Data inaccuracies
! Toran (Taro)
- Comparatively minor vegetable. - Data inaccuracies

82
KOREA ECONOMIC ASSESSMENT OF POTENTIAL ASIAN VEGETABLES
! Comparison of Korean and Australian wholesale prices
! Assumptions - Australian wholesale price is monthly wholesale markets price in Brisbane during 1995. - Yong-gun, Uong and Toran are based upon Japan/competitive wholesale prices as there are no Australian prices. - Estimated cost of transport of vegetables (Brisbane-Seoul) is A$.30/kg including: a. 20 foot reefer Brisbane- Pusan (85% load)
b. Australian port charges c. Korean port/cartage charges.
- Costs of fumigation and customs clearance/duties are no included.
! Results - Paechu: Australian Seoul landed price for Paechu is 100% greater than the local Korean product. - Mu: Australian Seoul landed price for Mu is 200% greater than the local Korean product. - Yong-gun, Uong and Toran: Does not appear commercially viable for Australian product.

83
INDONESIA VEGETABLE PRODUCTION
! Indonesia is a large producer of vegetables some 4.9 million tons in 1995 (cp.Korean with over 10 million tons in 1995)
! Indonesia is net exporter of vegetables with a trade surplus to the order of US$20 million.
! Considerable seasonal production variations especially due to typhoons during November-February.
! These extreme seasonal supply fluctuations are being addressed with large scale vertical integration to farms through co-operatives and contract farming.
! The major issue raised by industry was consistency of production, quality and >unpredictable costs=.

84
INDONESIA VEGETABLE CONSUMPTION
! Indonesians apparently have a high per capita consumption of vegetables - over 180 kg/pa (but the data is questionable)
! International pressures resulted in Indonesia allowing >unrestricted= imports of vegetables in June 1992.
! Major focus upon branding eg, Licensing Australian product >made in Indonesia=.
! However, due to the flood of imports, the Government have recently introduced legislation for the inspection of fruit and vegetables. Many see this as a non-tariff trade barrier to aide local growers.
! Major Government initiative to >Traditional Indonesian Foods and Culture=.

85
INDONESIA VEGETABLE MARKETING AND DISTRIBUTION
! Traditional outlets and Pasar Induk=s/>wholesale= markets - Shift from small scale growers to commercial farming co-operatives and capital intensive farms. eg, Shiitake. - Limited quality seed, post-harvest handling and capital have been constraining growth. - Major issue is unpredictability of arrival and costs (fluctuations).
! Collectors (Tengkulak)
- Production traders.
! Grosirs - Distributors within the urban demand areas.
! Retail dual markets of Western retail chains vs traditional outlets
- Western supermarkets mainly in Jakarta. - Jakarta in 1995: 224 supermarkets, 162 traditional markets. - But traditional markets account for 75% of retail sales but declining. - More margin in fruit than vegetables (sales ratio of 3:1).
! Food Service sector
- Hotels, restaurants
! Food processors - Small number but strong growth with export developments.

86
INDONESIA IMPORT ISSUES FOR VEGETABLES
! Tariffs
- 30% ad valorum duties plus fees.
! Quarantine - New (8/96) MRL regulations.
- Inspections by Ministries of Health/Agriculture.
! Infrastructure
- Poor quarantine inspection facilities.
- Cold chain issues.
- Small vehicular transport.
- Unpredictable costs.

87
INDONESIA POTENTIAL ASIAN VEGETABLES
! Chinese Cabbage - Major vegetable with some current imports from Australia. - One of the >Top 5' vegetables for retailers/markets (Others are Baak Choy, Kan Kong, Choi Sum, Spring Onions)
! Daikon
- Not a major vegetable, but grown and used relatively extensively.
! Lotus Root - Minor vegetable, not well-recognised.
! Burdock
- Generally, not recognised.
! Taro - Comparatively minor vegetable.
! Processed Product
- Appears to be significant opportunity/interest for JV=s with Chinese Cabbage, Takana and Japanese Eggplant.

88
INDONESIA ECONOMIC ASSESSMENT OF POTENTIAL ASIAN VEGETABLES
! Comparison of Indonesian and Australian wholesale prices
! Assumptions - Australian wholesale price is monthly wholesale markets price in Brisbane during 1995. - Estimated cost of transport of vegetables (Brisbane-Jakarta) is A$.25/kg including: a. 20 foot reefer Brisbane- Jakarta (85% load)
b. Australian port charges c. Indonesian port/cartage charges.
- Costs of fumigation and customs clearance/duties are no included.
! Results - Chinese Cabbage: Australian Jakarta landed price for Chinese Cabbage is 200% greater than the local product. - All others: Does not appear commercially viable for Australian product. - Processed Product: Not yet assessed.

89
12.0 REFERENCES AHC (1997) - The Australian Horticultural Statistics
Handbook 1996/97 edition. Australian Horticultural Corporation.
Department of Agriculture - Production and Export Costings for Select Western Australia (1995) Selected Asian Vegetables by Peter Gartrell,
Regional Economist Agriculture WA. Department of Agriculture - A Business Plan for the Project HBI Australia (1997) Developing New Export Vegetables – Burdock.
Gartrell, Pasqual & Tan, March 1997. DNRE and RIRDC (1998) - Access Asian Vegetables Newsletter, Issue 7
March 1998. A Publication of the Dept of Natural Resources & Environment (Vic) and the Rural Industries Research and Development Corporation.
Lee, B (1995) - Audit of the Australian Asian Vegetables
Industry. Report for Rural Industries Research and Development Corporation. Research Paper No. 95/13.
Lee, B (1996) - Australian Asian Vegetables. Assessment of
Market Demand in Australia. Report for Rural Industries Research and Development Corporation. Research Paper No. 96/7.
Lee, B and Prinsley, R (1996) - Proceedings of an Asian Food Industry
Conference. Report for Rural Industries Research and Development Corporation. Research Paper No. 96/9.
Midmore, D (1998) - Chinese Waterchesnut. Article in The New
Rural Industries. Publication of the Rural Industries Research and Development Corporation. Edited by K Hyde (1998).

90
Nguyen, VQ (1998) - Burdock. Article in The New Rural Industries. Publication of the Rural Industries Research and Development Corporation. Edited by K Hyde (1998).
Nguyen, VQ (1998) - Long White Radish (daikon). Article in The
New Rural Industries. Publication of Rural Industries Research and Development Corporation. Edited by K Hyde (1998).
Pan, C (1995) - Market Opportunities for Fresh and
Processed Asian Foods. Report for Rural Industries Research and Development Corporation. Research Paper No. 95/14.
Tomkins, B & Daly, P (1998) - Burdock. Article in The New Rural
Industries. Publication of the Rural Industries Research and Development Corporation. Edited by K Hyde (1998).
Vinning, G (1995) - Market Compendium of Asian Vegetables.
Report for Rural Industries Research and Development Corporation. Research Paper No. 95/12.