
CHINA AND EAST ASIAN ENERGY: PROSPECTS AND ISSUES
118
ASIA PACIFIC ECONOMIC PAPERS NO. 369, 2008 CHINA AND EAST ASIAN ENERGY: PROSPECTS AND ISSUES VOLUME II, PART I AUSTRALIA–JAPAN RESEARCH CENTRE ANU COLLEGE OF ASIA & THE PACIFIC CRAWFORD SCHOOL OF ECONOMICS AND GOVERNMENT
Transcript of CHINA AND EAST ASIAN ENERGY: PROSPECTS AND ISSUES

ASIA PACIFIC ECONOMIC PAPERSNO. 369, 2008
CHINA AND EAST ASIAN ENERGY: PROSPECTSAND ISSUES
VOLUME II, PART I
AUSTRALIA–JAPAN RESEARCH CENTRE
ANU COLLEGE OF ASIA & THE PACIFIC
CRAWFORD SCHOOL OF ECONOMICS AND GOVERNMENT


ASIA PACIFIC ECONOMIC PAPER NO. 369
PART I, 2008
AUSTRALIA–JAPAN RESEARCH CENTRECRAWFORD SCHOOL OF ECONOMICS & GOVERNMENT
ANU COLLEGE OF ASIA AND THE PACIFIC
China and East Asian Energy:Prospects and Issues
Volume II
Proceedings of the Conference on 10–11 October 2005Xindadu Hotel, Beijing
Peter Drysdale, Kejun Jiang and Dominic Meagher (eds)

ii
© Australia–Japan Research Centre 2008
This work is copyright. Apart from those uses which may be permitted under the CopyrightAct 1968 as amended, no part may be reproduced by any process without writtenpermission.
Asia Pacific Economic Papers (formerly Pacific Economic Papers) are publishedunder the direction of the Editorial Committee of the Australia–Japan Research Centre(AJRC). Members of the Editorial Committee are:
Professor Jenny CorbettExecutive DirectorAustralia–Japan Research CentreThe Australian National University, Canberra
Professor Emeritus Peter DrysdaleCrawford School of Economics and GovernmentThe Australian National University, Canberra
Professor Christopher FindlayProfessor of EconomicsUniversity of AdelaideAdelaide, South Australia
Professor Stuart HarrisDepartment of International RelationsThe Australian National University, Canberra
Dr Kazuki OnjiPost-Doctoral FellowAustralia–Japan Research CentreThe Australian National University, Canberra
Papers submitted for publication in this working paper series are subject to double-blindexternal review by two referees.The views expressed in APEPs are those of the individualauthors and do not represent the views of the Australia–Japan Research Centre, theCrawford School, or the institutions to which authors are attached.
The Australia–Japan Research Centre is part of the Crawford School of Economicsand Government, The Australian National University, Canberra.
ISSN 0 728 8409ISBN 0 86413 322 7
Australia–Japan Research CentreCrawford School of Economics and GovernmentThe Australian National UniversityCanberra ACT 0200
Telephone: (61 2) 6125 3780Facsimile: (61 2) 6125 0767E-mail: [email protected]: http://www.crawford.anu.edu.au

iii
CONTENTS
Preface ivAcknowledgments vContributors viAbbreviations vii
1 Introduction 1Dominic Meagher
2 Scenarios for Chinese energy demand and supply to 2020: 7Further factors: national policy and plan, energy demand inbuilding, clean coal technologyXiulian Hu and Kejun Jiang
3 Strategies for the management of the environmental impact of 33energy consumption in ChinaKejun Jiang and Xiulian Hu
4 Managing the environmental impact of East Asian energy use 71Tony Beck
5 Growth, energy use and GHGs in China 85Warwick J. McKibbin

iv
PREFACE
This collection of papers in two volumes is the second in a series on China and EastAsian Energy, a major project which is an initiative of the East Asia Forum inconjunction with the China Economy and Business Program in the CrawfordSchool of Economics and Government at the Australian National University(ANU). The first volume was published in April 2007.
The research program is directed at understanding the factors influencingChina’s energy markets. It also involves high-level training and capacity building tofoster long-term links between policy thinkers in China and Australia. It provides for
regular dialogue with participants from the energy and policy sectors in the majormarkets in East Asia and Australia. The backbone of the dialogue is an annualconference, the location of which has thus far alternated between Beijing and
Canberra.
The objective is to advance a research agenda that informs and influences theenergy policy discussion in China, Australia and the region.
This special edition of the Asia Pacific Economic Papers brings together papers
presented at the second conference in the series. Due to their number and length,papers from that second conference are published across two volumes of the Asia PacificEconomic Papers. This volume includes the first half of the papers, while the next
volume includes the second half. The third conference in the project is scheduled forJuly 2008.
Peter Drysdale, Kejun Jiang and Dominic Meagher
Canberra and Beijing
January 2008

v
ACKNOWLEDGMENTS
We would like to thank paper writers and all participants in the second China andEast Asian Energy Conference held in Canberra in August 2006 for theircontribution to this project. In particular, paper discussants provided carefulcommentary and insightful feedback. They included: Jan Adams, Ross Garnaut,Malcolm Gray, Llewelyn Hughes, Hayden Lesbirel, Deshun Liu, Bob Pegler,Xunpeng Shi, Bill Shields, Ligang Song and Seung-Jick Yoo.
The support of a number of institutions have made this project possible: in Japan,the Institute of Energy Economics; in Korea, the Korea Energy EconomicsInstitute; and in China, the Energy Research Institute, the National Developmentand Reform Commission of the State Council, China Institute of ContemporaryInternational Relations, Tsinghua University, Renmin University, Petro China,the State Administration for Work and Coalmine Safety, the China Coal Informa-tion Institute, State Power, the Chinese Economic Institution Reform Commit-tee, the National Economy Research Institute and the China Technical andEconomic Research Institute all extended support in various ways. The East AsiaForum at the Crawford School of Economics and Government and the Asia PacificCentre for Excellence at the Australian National University have been instrumen-tal in carrying out this project.
We are especially grateful to Trevor Wilson, without whom this volume would nothave been completed. Special thanks are also due to Sue Matthews for hermeticulous attention to detail in editing and to Minni Reis and Aylwen Gardiner-Garden for preparing the volumes for publication.
Peter Drysdale, Kejun Jiang and Dominic MeagherCanberra and BeijingJanuary 2008

vi
CONTRIBUTORS
Tony Beck, Visiting Fellow in the Crawford School of Economics and Govern-ment, Australian National University; Director, Beck Consulting Services Pty Ltd<[email protected]>
Edward A. Cunningham, Research Fellow, Massachusetts Institute of Technol-ogy <[email protected]>
Kejun Jiang, Director of Research Management and International CollaborationDivision, Energy Research Institute of China <[email protected]>Xiulian Hu, China Energy Research Institute < [email protected]>
Hu Yuhong, Deputy Director-General, China Coal Industry Association<[email protected]>
Hu Zhaoguang, Vice President, State Power Economic Research Institute, China<[email protected]>
Kim Jinwoo, Director, Center for Energy Research on Northeast Asia, KoreaEnergy Economics Institute <[email protected]>
Warwick McKibbin, Executive Director, Centre for Applied MacroeconomicAnalysis, The Australian National University. <[email protected]>
Takeo Suzuki, Senior Coordinator, Institute of Energy Economics, Japan<[email protected]>
Yang Jianhong, Senior Engineer, Petrochina Planning and Engineering Institute,China
Zhao Hongtu, Associate Research Professor and Deputy Director, Institute forWorld Economic Studies, China Institutes of Contemporary International Rela-tions <[email protected]>
Yong Zhao, Technical Economic Research Institute, China Huaneng Group<[email protected]>
Zhu Xingshan, Researcher, PetroChina Planning Department, Beijing<[email protected]>

vii
ABBREVIATIONS
$ are US dollars unless otherwise specifiedRMB are Renminbi (Chinese Yuan)Tons always refers to metric tons unless otherwise indicated
ACC advanced clean coalAIM Alternative Investment MarketASEAN Association of South East Asian NationsAP6 Asia-Pacific Partnership for Clean Development and ClimateAPEC Asia Pacific Economic CooperationAPP Asia Pacific PartnershipBbl barrelBOF Basic Oxygen FurnaceCBM coal bed methaneCCS carbon capture and storageCDM Clean Development MechanismCFB circulating fluid bedCMM Coal mine methaneCNOOC China National Offshore Oil CompanyCO2 Carbon DioxideCPCNPC National Congress of the Communist Party of ChinaDC Direct CurrentDOE United States Department of EnergyDNAs Designated National AuthoritiesE&P Exploration and ProductionECEDTC Eastern China Electricity Dispatching and Trading CenterEECPs Early entrance co-production plantsERI Energy Research Institute (of China)ETS Emissions Trading Scheme
viii
EU ETS European Union Emissions Trading SchemeFBDC Fluidised Bed Desulphurisation CombustionFYP Five Year PlanGDP Gross Domestic ProductGHG Green House GasGW Giga-Watt (109 Watts)ha HectareHC Hydro CarbonsIEA International Energy AgencyIGCC integrated gasification combined cycleIPAC Integrated Policy Assessment Model for ChinaIPCC International Panel on Climate ChangeIPO Initial Public OfferingKEPCO Korea Electric Power CorporationKOGAS Korea Gas CorporationKNOC Korea National Oil CorporationKW Kilo-Watt (103 Watts)kV kilo-VoltsLIFAC Limestone Injection into the Furnace and Activation of CalciumOxideLNG liquefied natural gasLPDME liquid phase dimethyl etherLPG Liquid Petroleum GasLPMEOH liquid phase methanolm2 square metresm3 cubic metresMHP Magneto-hydrodynamicMLTECP China Medium and Long-Term Energy Conservation PlanMt Million TonsMtoe Million Tons of Oil EquivalentMW Mega-Watt (106 Watts)NDRC National Development and Reform CommissionNEDO New Energy Development Organisation (in Japan)NEDTC Northeast Electricity Dispatching and Trading CenterNERC Northeast Electricity Regulatory CommissionNDRC National Development and Reform CommissionNOx Nitrous Oxides

ix
OH Hydrogen MonoxideOPEC Organisatino of Petroleum Exporting CountriesPFBC Pressurised Fluidised Bed CombustionPJ PetajoulesPNG piped natural gasR&D Research and DevelopmentSCEDC Southern China Electricity Dispatching CenterSCETC Southern China Electricity Trading CenterSEPA State Environmental Protection AdministrationSERC State Electricity Regulatory CommissionSO2 Sulphur Dioxidetce tons of coal equivalentTOU time-of-useTRP Top-pressure Recovery TurbineTSP Total Suspended ParticulatesTWh Terra-Watt HoursUNFCCC United Nation’s Framework Convention on Climate Changeu tons micro tons

x

1 INTRODUCTION
DOMINIC MEAGHER
In 2007 climate change moved to the forefront of international politics. TheUnited Nations Secretary General, Ban Ki-Moon, described turning the ‘climatecrisis into a climate compact’ as the ‘moral challenge of our generation’.1 Yetprogress towards agreement is painfully slow. At the centre of this challenge isChina.
China is already the world’s second largest energy consuming nation, andaccording to some estimates has already surpassed the United States as the world’slargest emitter of green house gases (GHGs). That China adds ‘a new coal firedpower station every week’ has been so often repeated that it has becomeconventional wisdom. That conventional wisdom has frequently been exploited,giving credence to the notion that any efforts the rest of the world make will paleinto insignificance next to the tremendous expansion that China is undergoing.Yet clarity and understanding regarding exactly what is happening in China isscarce.
The papers collected in these two volumes seek to elucidate one aspect ofChina’s growth: energy. Understanding China’s energy prospects and the issuessurrounding them are critical for a number of reasons.
Most important, from the perspective of long-term sustainable develop-ment, is the impact on the global environment of China’s seemingly insatiablethirst for energy. According to the UN Framework Convention on ClimateChange reporting, around 85 per cent of total GHG emissions come from theenergy sector.2
For China, a clearer understanding of its energy prospects and issues is centralnot only to its sustainable development, but also to the much heralded goal ofachieving a harmonious society.
And for Australia, insight into China’s energy prospects and issues is criticalto strategic investment and policy decisions. Australia is a key supplier of uraniumto China, as well as a major exporter of high quality coal and liquid natural gas(LNG). Australia has also exported entrepreneurs, scientists and engineers withexpertise in renewable energy.

2 INTRODUCTION
Asia Pacific Economic Papers
Within this context, this second collection of papers under the CrawfordSchool of Economics and Government’s China and East Asian Energy Projectbrings together leading researchers on China and East Asia’s energy issues.
In Chapter 2, Kejun Jiang and Xiulian Hu, of the Chinese Energy ResearchInstitute (ERI), present scenarios for China’s energy demand and supply to 2020.The ERI is China’s national body responsible for conducting energy research, andis situated in the National Development and Reform Commission (NDRC).Energy forecasting conducted in the ERI uses a sophisticated approach to energydemand and supply modelling in China, called the Integrated Policy AssessmentModel for China (IPAC).
Their model takes into account various assumptions about the developmentand deployment of numerous technologies relevant to energy demand and supplyin China. It also allows modellers to make alternative assumptions about thepolicy environment. This chapter showcases improvements made on the modelover the previous year—particularly by incorporating a major focus on theconsumption of energy in buildings.
Jiang and Hu also present a detailed analysis of the policy environment inChina relating to energy. Owing to the rapidly changing nature of China’s policyframeworks, it is often difficult for outsiders to gain a proper perspective on thecontent of China’s policies at any given time. This chapter goes a long way toproviding clarity on China’s energy policies.
Chapter 3, also by Jiang and Hu, moves the analysis to the environmentalimpacts of China’s energy consumption. Coal (the ‘dirtiest’ major source ofenergy) provides the majority of China’s energy supply, a situation which is almostcertainly not going to change in the near future. Jiang and Hu present forecastsof China’s emissions of each of the major GHGs through to 2030. They also detaila number of other environmental consequences of China’s energy use.
In this chapter, Jiang and Hu provide as well a detailed picture of strategiesavailable in China for mitigating the environmental impact of energy. Thesestrategies are broken into four broad categories: legal strategies (at both nationaland local levels); fuel substitution strategies (to promote alternative energy);technological strategies (clean coal technologies, improving energy efficiency atthe consumption end, and a discussion of potential gains across several keyindustries and in transport and construction); and market strategies (developmentof international markets and the use of taxes and special funds).

DOMINIC MEAGHER 3
No. 369, 2008
In Chapter 4, Tony Beck takes the analysis to the international level, askingwhat international institutions can best manage GHG emissions. He outlines twobroad approaches. The first is a market-based approach, represented by the KyotoProtocol and its Clean Development Mechanism (CDM). The second is atechnology-focused plurilateral approach, represented by the Asia-Pacific Part-nership for Clean Development and Climate (AP6).
Chapter 5 reproduces a paper authored by Warwick McKibbin commis-sioned for this project on China and Northeast Asian Energy Issues, but firstappearing in Song and Garnaut, 2006.3 The chapter details the McKibbin–Wilcoxen Blueprint—a model for establishing a market for carbon emissions. TheMcKibbin–Wilcoxen Blueprint has three key features. First, it is conceived of asa national system, not a global system (although it can easily become a globalsystem). The rationale for such an approach is to avoid difficult and timeconsuming international negotiations.
Second, it establishes a long-term carbon price, based on 100-year licencesto emit 1 ton of carbon equivalent each year. The quantity of such permitsavailable is set by the long-term emission targets of the government and would befixed in supply (similar to real estate). Finally, there is a complimentary short-term(10 year) market which the government can use to smooth the price transition ofemissions. The chapter details the rationale and results of the model and looks atthe impact of its implementation in China.
China’s international procurement of energy has, especially over the last 2–3 years, been creating considerable consternation, particularly in Washington. InChapter 6, Zhao Hongtu discusses China’s energy procurement. One of themain areas of contested opinion is whether international acquisitions by China’senergy firms represent a national procurement strategy driven by the centralgovernment or simple profit-maximising behaviour by enterprises in China’senergy sector, and the implications of either situation for China and the world.Many Chinese analysts tend to believe that no such national procurement strategyexists. They point to several failed international bids for oil acquisition as evidenceof the absence of a governmental strategy for foreign energy procurement. Incontrast, most Western analysts not only believe that China has such a strategy, butalso that the government is diligent in carrying it out.
The next two chapters compare China’s energy prospects to those of Koreaand Japan. In Chapter 7, Jin-Woo Kim describes Korea’s experience in securingenergy supplies. In Chapter 8, Takeo Suzuki discusses how Japan diversified itsenergy source from predominantly relying on imported oil.

4 INTRODUCTION
Asia Pacific Economic Papers
The next two chapters focus on China’s electricity sector. In Chapter 9,Zhaoguang Hu provides a very insightful analysis of the institutions and structureof China’s electricity market. Hu discusses the market reforms in China’selectricity sector and the privatisation of the industry. He also describes how thenewly privatised electricity market is regulated.
While Hu goes to lengths to present a comprehensible picture of China’selectricity regulation and institutions, in Chapter 10, Edward Cunninghamprovides a very different picture. He describes energy governance at the nationallevel in China as fragmented, incoherent and dominated by de facto decisions atthe local level. Meanwhile, at the industry level, dramatic capacity expansion hastaken place and greatly diversified ownership rights; while at the firm level ofpower production, hybrid corporate energy actors are emerging, born frompartnerships between traditional electricity firms and nuclear, non-traditional,and upstream resource firms seeking to hedge against rising fuel costs and to‘diversify around’ disjointed central price controls. Cunningham does an excellentjob of not only making it clear why it is so hard to wrap the mind around China’senergy regulations, but also manages to do just that.
In Chapter 11, Yuhong Hu focuses on the development and outlook ofChina’s coal sector. This paper begins by discussing the role of coal in China’senergy sector, and then looks in detail at the state of China’s coal reserves,considering separately each of the 13 major coal bases set for future development.It then provides an analysis of China’s coal market, considering the rising demandfor coal in China and the supply-side response, as well as the impacts on China’sinternational trade in coal. The paper concludes with a brief outlook of theprospects for China’s coal industry.
The final chapter, Chapter 12, by Xingshan Zhu and Jianhong Yang,focuses on China’s gas industry. Zhu and Yang introduce China’s gas productioncapacities and the state of installed and planned gas distribution infrastructure.They then describe developments in the demand and consumption of gas inChina. The chapter then analyses the structure of China’s gas industry, and howgas contributes to China’s national energy strategy. Recent reforms to theregulatory framework of the gas industry are discussed, focusing on the pricingmechanism. Finally, consideration is paid to the relationship between China’s gasindustry and the global industry.

DOMINIC MEAGHER 5
No. 369, 2008
Notes
1 Text of speech available at http://www.un.org/apps/news/infocus/sgspeeches/search_full.asp?statID=161
2 United Nations Framework Convention on Climate Change, 2006. Key Greenhouse Gas Emissions Datafor 1990–2003.
3 Song and Garnaut (eds), 2006, The Turning Point in China’s Economic Development, Asia Pacific Press,Canberra

6 INTRODUCTION
Asia Pacific Economic Papers

2 SCENARIOS FOR CHINESE ENERGY DEMAND AND
SUPPLY TO 2020: NATIONAL POLICY AND PLANNING,
ENERGY DEMAND IN BUILDINGS AND CLEAN COAL
TECHNOLOGY
JIANG KEJUN AND HU XIULIAN
Introduction
This paper focuses on key factors affecting China’s energy scenarios: energy consumption
in buildings and the development of clean coal technologies. Due to rapid energy demand
growth and significant environmental problems, many policies and programs have been
established in China over the last two years.
This paper begins by introducing energy policies in China that impact the future energy
demand pathway. Due to the occurrence of serious energy shortages since 2003, a series of
national policies and plans have been announced. These include the ‘11th Five Year Plan’
(FYP), the ‘Renewable Energy Development Plan’, the ‘Energy Conservation Plan’, and the
‘Energy Conservation Program’.
One of the most remarkable policy objectives is contained in the 11th FYP: to reduce
energy intensity by 20 per cent during the plan period (2006–10). Because of these recent
policy and planning changes, recent studies on energy scenarios to 2020 have focused mostly
on assessing the expected impact of the most recent national energy policies and plans. Recent
studies also focus on the availability of energy resources, clean coal technology, and sectoral
energy demand analyses.
Results from our study show the importance of coal use in China. Coal will still provide
more than 50 per cent of China’s energy to 2030, meaning that development and utilisation
of clean coal technology is crucial for China’s low-energy demand and carbon future. This
paper analyses the development of clean coal technology and presents scenarios for
forecasting.
Large-scale coal extraction and combustion have already severely impacted the
environmental capacity of coal mining areas. Air pollution in both urban and rural areas has
become increasingly serious. Coal production in 2004 was over 1.8 billion tons, equal to
nearly 50 times the level at the time of the establishment of the People’s Republic of China.

8 SCENARIOS FOR CHINESE ENERGY DEMAND AND SUPPLY TO 2020: NATIONAL PLANNING AND BUILDINGS
Asia Pacific Economic Papers
However, coal is expected to remain the major source for energy in China for the next several
decades. The coal industry plays an important role in China’s economy. We provide a detailed
analysis of coal, especially clean coal technologies, in China.
Since the 1970s, the Chinese government has focused its efforts on environmental
protection; however this has been constrained by both economic capacity and the level of
technical development. The government’s resources have been insufficient for the task. The
following five points reflect the most significant impacts of directing insufficient resources to
environmental protection:
• First, land resources have been damaged by coal exploration. Up to 2004, about 48,000
hectares (ha) of land had collapsed. On average, 0.2 ha becomes collapsed per 10,000 tons
of coal extracted. The rate of land collapse has increased by more than 20,000 ha per year.
Despite this, the rate of recovery is now only about 20 per cent.
• Second, coal exploration has damaged water resources and caused pollution. For example, 19
per cent of water resources in bedrock was polluted to some extent in North China in 2004.
• Third, accumulated coal stone occupies land and has damaged river beds. Accumulated coal
stone from coal production reached 3 billion tons in 2005, increasing at a rate of 150–200
million tons per year. A large portion of coal stone is therefore burned as waste, emitting carbon
dioxide (CO2).
• Fourth, methane is emitted during the coal mining process. Coal mining accounts for around
10 per cent of total methane emission from anthropogenic sources. In China methane
emissions from the coal industry account for one-third to one-quarter of total methane
emissions from coal mining in the world.
• And finally, coal combustion is a major source of air pollution in China. Sulphur dioxide (SO2)
emissions were 19.5 million tons in 2001, around 85 per cent of which were emitted from
coal combustion. Acid rain has occurred in more than one-third of China’s land area.
Increasing energy use in buildings (including urban residential, rural residential and the
service sector) is one of the major driving forces for rising energy consumption in China over
the last few years (see Figure 2.1). During 1990–2000 energy use in buildings increased only
marginally, mostly due to replacement of coal with natural gas in urban areas. However a
significant increase in energy demand was seen after 2000. A major reason for this increase
is the rise of energy service demands accompanying higher incomes and standards of living.
For example, the prevalence of air conditioning and electric appliances has increased
markedly. Demand for these services is becoming a key factor contributing to power
shortages in China.

JIANG KEJUN AND HU XIULIAN 9
No. 369, 2008
Figure 2.1 Energy use in buildings in China (Mtoe)
Note: Mtoe = million tons of oil equivalent.Source: China Energy Statistical Yearbook, 2006. National Bureau of Statistics, Beijing.
Energy efficiency in buildings is therefore a major issue of concern for policymaking
and energy supply. This paper seeks to explore the future path of energy use in buildings
presenting alternative feasible scenarios and the impact of different policy options to reduce
energy demand. This study is part of an energy demand and emission scenario analysis for
China, conducted by the Integrated Policy Assessment Model for China (IPAC) modelling
team at the China Energy Research Institute.
National policies
The 16th National Congress of the Communist Party of China (CPCNC) proposed
that China will achieve the objectives of building an all-round, well-off society by 2020. Along
with an increased population and the acceleration of industrialisation and urbanisation, the
demand for energy will increase significantly. The imbalance between energy constraints and
economic development and the environmental pollution brought about by energy utilisation
will become even more evident.
In November 2004, the China Medium and Long-Term Energy Conservation Plan
(MLTECP) was announced. This plan aims to push the whole society towards energy
conservation and lower energy intensity, to remove energy bottlenecks, to build an energy
saving society, and to promote sustainable social and economic development, thus realising
the grand objective of building a society that is well-off in every aspect.
The plan foreshadows incentive policies to intensify energy conservation and to
implement the guideline of prioritising energy conservation. It also includes efforts to:
0
50
100
150
200
250
1990 1995 2000 2004
ResidentService

• implement unified and harmonised energy and environmental policies to promote energy
conservation;
• implement industrial policies to facilitate structural adjustment;
• strengthen energy conservation management according to laws;
• accelerate the development, demonstration and promotion of energy conservation technol-
ogy;
• promote new market-based energy conservation mechanisms;
• reinforce energy conservation regulation on key energy consuming units;
• intensify promotion, education and training on energy conservation;
• enhance organisation and leadership; and
• promote program implementation.
If the government targets for energy conservation contained in the MLTECP are
achieved, we estimate that energy demand growth in China will drop significantly—from 11.9
per cent annually during the 10th FYP period (2001–05) to just 3.8 per cent annually during
the 11th FYP period (2006–10), assuming GDP growth of 8.5 per cent. The impact of this
energy conservation strategy on Chinese enterprises could be significant, given the energy-
intensive nature of China’s economy. While machinery and equipment sectors may benefit
from increased investment in energy conservation, environmental protection and renewable
energy, and upstream oil companies may suffer.
The Chinese political system is currently in the process of devising more detailed
sectoral implementation plans under the 11th FYP, including an Energy Plan, which is
expected to draw heavily on the MLTECP. One specific initiative currently under preparation
is the ‘1000 Enterprise Program’, which would require the largest energy end-use enterprises
(many of which are state-controlled enterprises) to report on their energy use and to enter
into voluntary agreements with the government. These companies are responsible for
approximately 30 per cent of China’s total energy demand and the program is expected to
result in fuel savings equivalent to 500 million tons of coal equivalent (tce) (14.7 EJ) by 2010.
As provincial and local plans for implementation of the 11th FYP are devised over the next
months, more concrete carrots and sticks for enterprises to engage in energy efficiency
improvements will emerge.
China’s 11th FYP for National Economic and Social Development puts energy at the
top of the agenda and represents a major shift in government strategy towards a ‘scientific
approach to development’. For the first time, the Chinese Communist Party formally
recognised that economic growth (measured in GDP terms) is not an adequate measure of
economic development. This policy shift is reflected explicitly in the 11th FYP, which contains
two quantitative targets:
10 SCENARIOS FOR CHINESE ENERGY DEMAND AND SUPPLY TO 2020: NATIONAL PLANNING AND BUILDINGS

• doubling of per capita GDP between 2000 and 2010; and
• a 20 per cent reduction in energy intensity (energy consumption per unit of GDP) over the
period 2006–10.
Clean coal technology future
Global progress
In 2000, the United States initiated Vision 21, a program that focuses on the
development of various advanced integrated technologies to promote the highly efficient and
clean utilisation of coal. The final target of the program is to develop clean coal technologies
with near zero emissions. The basic idea is to begin with the gasification of coal, and then
further refine the gasified coal to hydrogen (H2). H2 could be used for power generation with
an efficiency of nearly 60 per cent through fuel cell and gas turbine combined cycles. H2 could
also be used as transportation fuel. Carbon dioxide (CO2) produced during the process can
be collected and stored.
Early entrance co-production plants (EECPs) were planned to be in commercial use
by 2007 with financial support from the Department of Energy (DOE) to verify technology
feasibility and risk control. This program initiated three pilot phase feasibility projects.
In the United States, the Air Product & Chemicals Co. and Eastman Chemical
Products Co. started to construct pilot phase plants utilising the liquid phase methanol
(LPMEOH) and liquid phase dimethyl ether (LPDME) processes. These plants were
constructed in 1997. Some well-known international companies, including BP, GE, Air
Products and Chemicals, and Shell, conducted studies on coal integrated generation systems.
More than 10 sets of integrated gasification combined cycle (IGCC) systems are operating
in petrochemical companies in the world.
However, as coal use is reducing in many European countries, the investment funds
for clean coal technology R&D are decreasing. Even in the United States, the investment for
energy technology R&D is decreasing. This presents a challenge for future clean coal
technology development. More initiatives and international collaboration will be required in
the near future.
Clean coal technology development in China
The following section contains a brief status report of the current state of clean coal
technology in China.
JIANG KEJUN AND HU XIULIAN 11

12 SCENARIOS FOR CHINESE ENERGY DEMAND AND SUPPLY TO 2020: NATIONAL PLANNING AND BUILDINGS
Asia Pacific Economic Papers
• Coal washing. In 2003, the coal washing rate was only 24 per cent, a very low washing rate.
• Coal water mixture. There are huge developments in coal water mixture in China. In 1999
the production capacity was less than 900,000 tons. The production capacity increased to
nearly 7 million tons in 2003.
• Industry briquettes. Because of high prices, progress on industrial briquettes is slow. Recently
air pollution issues increased the likelihood of greater use of industrial briquettes.
• Ultra super critical unit. A 1-gigawatt (GW) unit is under construction in Yuantian Power
Plant; construction started in 2004 and the unit will be in operation in 2007. This is one
component of the National 863 Project.
• IGCC. A project feasibility study was done for the Beijing IGCC project and the Yantai IGCC
project during 1995–2000. Now the Yantai IGCC project is under construction. Yanzhou
Coal Mine Group also made plans for IGCC, together with a methanol generation system.
This project started construction in 2003.
• Underground coal gasification. Shandong Lineng Group made plans for a pilot phase project
on underground coal gasification. This project includes four gasification furnaces with a total
capacity of 3 million m3 per day.
• Poly-generation. A preliminary analysis was conducted in the 973 Program; and several
companies, research institutes and universities are planning to construct gasification power
generation, fuel and feedstock poly-generation systems.
• Direct coal liquefaction. In 2002, the Shenhua direct coal liquefaction project was approved
by the State Council and entered construction. This project is expected to start production
in 2007. Research institutes such as the China Coal Research Academy undertake research for
direct coal liquefaction.
• Desulphurisation. With the recent rapid increase of coal-fired power plants, newly constructed
coal-fired power plants with a sulphur content higher than 1 per cent must be equipped with
desulphurisation technology. Additionally, due to air pollution in cities, some existing coal-
fired power plants near cities have begun to be equipped with desulphurisation equipment.
• Low NOx combustion technology. This is still in the research stage. One pilot project is under
construction as a research project. More than 10 units are equipped with a low nitrous oxide
(NOx) combustor.
National programs and planning
The National High Technology Research and Development Program (known as the
‘863 Program’) was launched in March 1986 with the aim of enhancing China’s international
competitiveness and improving China’s overall R&D capability in high technology. The
program covers 20 subject topics selected from eight priority areas: biotechnology,

JIANG KEJUN AND HU XIULIAN 13
No. 369, 2008
information, automation, energy, advanced materials, marine, space and laser. The first six
areas are managed by the Ministry of Science and Technology. In the program, there are
several key energy technologies for development, including clean coal technology. In this
program under the 10th FYP, advanced coal-fired power generation, advanced coal
conversion and fluid gas purification of coal combustion were set as key research topics.
The Coal-Fired Magneto-hydrodynamic (MHD) Power Generating Technology
Project has completed the design and manufacture of a helical electrical MHD propeller used
for conducting performance tests of the high-field superconducting electrical MHD
propeller. Through international cooperation, the performance test of a 15-tesla high-field
helical closed loop electrical MHD propeller was conducted successfully. The actual field
intensity was 14 teslas. Additionally, a 700-ampere electrode current and 9.3-14 per cent
propeller efficiency were achieved under the high-field condition.
In recognition of the importance of coal in China, clean-coal focused policies have been
adopted. In 1995, the China Clean Coal 9th FYP and Development Framework up to 2010
was announced by the government. This plan mainly covers four areas, including coal
processing, high efficiency clean combustion, coal conversion, emission control and disposal
processing. Fourteen technologies were specified in the plan: coal washing and dressing,
briquette use, coal liquefaction, FBDC, pressurised fluidised bed combustion (PFBC),
integrated coal gasification combined cycle (IGCC), fuel cells, fluid gas control, utilisation
of waste from power plants, utilisation of coal bed methane, coal stone washing water use,
industrial boilers and kilns.
Energy scenarios with a focus on clean coal
Our future projections are made using a baseline scenario. This scenario uses a basic
trend to describe future economic activities. It is expected that there will be better international
trading and that China’s economy will increasingly be integrated with the global economy.
Therefore China could rely on international markets and energy resource imports to meet
part of its energy supply needs.
With rapid economic growth in China, primary energy demand in the baseline scenario
could reach 2.1 billion tons of oil equivalent (toe) in 2020 and 2.7 billion toe in 2030 (see
Figure 2.1). The annual growth rate from 2000 to 2030 is forecast at 3.6 per cent, while the
energy elasticity of GDP is 0.58. Coal will remain the major energy source in China for the
next several decades. In the baseline scenario, coal use will be 1.4 billion toe in 2020 and 1.7
billion toe in 2030, accounting for 58 per cent of energy use, compared to 720 million toe
in 2000. A rapid increase in natural gas demand is expected in China, with its share in total

14 SCENARIOS FOR CHINESE ENERGY DEMAND AND SUPPLY TO 2020: NATIONAL PLANNING AND BUILDINGS
Asia Pacific Economic Papers
primary energy use increasing from 4 per cent in 2000 to 17.3 per cent in 2030 (annual growth
rate: 10 per cent).
Figure 2.2 Primary energy demand in China (baseline scenario) (Mtoe)
Note: Mtoe = million tons of oil equivalent.Source: Authors’ calculations.
With respect to final energy use, electricity and natural gas increase rapidly. Electricity
demand increases from 112 million toe in 2000 to 478 million toe in 2030. Natural gas
demand increases from 21 million toe in 2000 to 437 million toe in 2030. Coal and oil demand
increase more slowly. Coal use in the residential sector will generally decrease and be replaced
by gas and electricity; coal will be mainly used in large equipment such as boilers and in steel
making and building material production. Demand for oil products used for transport will
grow quickly with the rapid increase of vehicles in China. Oil use in transport will increase
from 105 million tce in 2000 to 457 million tce in 2030 (see Figure 2.2).
Figure 2.3 Final energy demand in China (baseline scenario) (Mtoe)
Note: Mtoe = million tons of oil equivalent.Source: Authors’ calculations.
0
500
1,000
1,500
2,000
2,500
3,000
2000 2010 2020 2030
Oil
Renewable
Nuclear
NGas
Coal
0
500
1000
1500
2000
2000 2010 2020 2030
Electricity
Gas
Oil Products
Coal

JIANG KEJUN AND HU XIULIAN 15
No. 369, 2008
From these results we can see that coal will play a very important role in both primary
and final energy supplies. Coal production could reach 1.31 billion tce by 2020 and 1.48
billion tce by 2030. Chinese coal industry experts estimate an upper limit of coal production
of 1.2 billion tce by 2020. Coal demand, therefore, could exceed domestic coal production
in China (Figures 2.3 and 2.4).
Figure 2.4 Energy production (baseline scenario) (Mtoe)
Note: Mtoe = million tons of oil equivalent.Source: Authors’ calculations.
Figure 2.5 Coal use by sector (Mtoe)
Note: Mtoe = million tons of oil equivalent.Source: Authors’ calculations
0
200
400
600
800
1,000
1,200
1,400
1,600
1,800
1990 2000 2010 2020 2030
Transport
Commercial/residential
Industry
Power generation
0
500
1,000
1,500
2,000
2,500
2000 2010 2020 2030
Other renewableModern biomassHydro
Nuclear
GasOilCoal

16 SCENARIOS FOR CHINESE ENERGY DEMAND AND SUPPLY TO 2020: NATIONAL PLANNING AND BUILDINGS
Asia Pacific Economic Papers
In the baseline scenario, development of these technologies was assumed to diffuse
naturally throughout the market. Table 2.1 outlines the principal technologies in the baseline
scenario.
Table 2.1 Clean coal technologies (baseline scenario)
Sector Technology Share in 2030 of totalcoal use
Power generation Super critical 25%IGCC 4%
Industry/boiler Advanced boiler 45%Industry/kiln Advanced kiln 38%Coal processing Coal liquefaction 2%Desulphurisation in power plants 58% of total coal fired
power plants
Note: IGCC = integrated gasification combined cycle.
By assuming the adoption of energy and environmental policy measures, the policy
scenario results are described in Figures 2.5 and 2.6. Compared with the baseline scenario,
energy demand is nearly 245 million tce lower in 2020 and 280 million tce lower in 2030.
There is 160 million toe coal saved due to the alternative policies. By exploring the policy
options, we found significant pressure to apply these policy options in order to reach the lower
energy demand scenario. Furthermore, there is considerable urgency regarding their
introduction due to the long life span of energy technologies. Among these policy options,
clean coal technology development and diffusion is a key component. The major assumptions
regarding clean coal technology development in this scenario are given in Table 2.2.
Figure 2.6 Primary energy demand (policy scenario) (Mtoe)
Note: Mtoe = million tons of oil equivalent.Source: Authors’ calculations.
0
500
1,000
1,500
2,000
2,500
3,000
2000 2010 2020 2030
Renewable
Nuclear
Gas
Oil
Coal

JIANG KEJUN AND HU XIULIAN 17
No. 369, 2008
Figure 2.7 Final energy demand (policy scenario) (Mtoe)
Note: Mtoe = million tons of oil equivalent.Source: Authors’ calculations.
Table 2.2 presents the clean coal technology diffusion in the policy scenario.
Table 2.2 Clean coal technology (policy scenario)
Sector/process Technology Share in 2030
Power generation Super critical 25%
IGCC 30%
Industry/boiler Advanced boiler 75%
Industry/kiln Advanced kiln 70%
Coal processing Coal liquefaction 10% of total coal
Desulphurisation in power plants 80% of total coal firedpower plants
Note: IGCC = integrated gasification combined cycle.
0
500
1,000
1,500
2,000
2,500
3,000
2000 2010 2020 2030
Electricity
Gas
Oil products
Coal

18 SCENARIOS FOR CHINESE ENERGY DEMAND AND SUPPLY TO 2020: NATIONAL PLANNING AND BUILDINGS
Asia Pacific Economic Papers
Energy demand in buildings
Scenario assumptions
Beside GDP growth and population, several important factors need to be considered
in the scenario study for buildings. These additional factors are presented in Table 2.3.
Table 2.3 Factors influenced by key driving forces
Driving forces Factors Policies to promote the change
Social efficiency change Energy activity change within Public education, price policiesthe sector (such as change ofuse of heating and cooling, useof more efficient electricalappliances, etc.)
Technology progress Efficiency progress for Technology R&D promotion,technology (unit energy use market oriented policies, andimprovement) international collaborationTechnology mix change (more Market-oriented policies andadvanced technologies) environmental regulationFuel mix change (more National energy industryrenewable energy and nuclear) policies, import and exportpolicies, tax system
Our study covers three sectors: urban residential, rural residential and the service sector
(tertiary sector not including transport). The number of households, size of the living area
in the residential sector, and total building area in the service sector are major factors
determining energy demand. Assumptions relating to the residential sector are given in Table
2.4.
Table 2.4 Assumptions regarding the residential sector
2000 2010 2020 2030
Number of urban households (million) 139 205 273 326Number of people per urban household 3.30 3.20 3.10 3.05Living area per person in urban (m2) 19.70 30.00 34.84 36.72Number of rural households (million) 227 196 175 158Number of people per rural household 3.84 3.70 3.5 3.4Living area per person in rural (m2) 24.7 31.1 36.0 38.8
This model considers technology used in these sectors by providing desired energy
services. Energy services are activities such as lighting, space heating and washing machines

JIANG KEJUN AND HU XIULIAN 19
No. 369, 2008
in buildings, and steel and copper output in the industrial sector. These energy services can
be measured in different ways, such as heating demand per square meter in buildings. But
here we use service demand by household area as the major driving force. This was decided
based on assumptions for service ownership, intensity change and utilisation time change. For
ease of comparison, we take the energy services in 2000 as a benchmark. Service assumptions
and factors for service change for the urban and rural sectors are given in Tables 2.5–2.10.
Table 2.5 Service assumptions for urban residents
Energy service 2000 2010 2020 2030
Cooking 139 205 273 326
Electric cooking 115 225 462 639
Hot water 85 197 516 815
Space heating 51 133 234 329
Air conditioner 51 247 681 1096
Fan 209 297 546 685
Lighting: C 100 148 280 632
Lighting: F 40 148 315 843
Refrigerator 94 154 363 489
Colour TV 109 207 455 665
Black & white TV 56 71 31 0
Washing machine 167 286 721 1552
Other appliances 76 141 254 310
Table 2.6 Change index in intensity of services for urban residents, 1990=1
Energy service 2000 2010 2020 2030
Cooking Cooking time 1.05 1.05 1.05 1
Electric cooking Use times per week(2 hours in 1990) 1.1 1.2 1.3 1.4
Hot water Heating time 1.5 1.8 2.1 2.5
Space heating Heating time 1.25 1.3 1.33 1.36
Air conditioner Cooling time 1.2 1.36 1.5 1.5
Fan Lighting time(3.5 hours in 1990) 1.10 1.22 1.22 1.22
Incandescent lighting Lighting time 1.14 1.29 1.29 2.50
Fluorescent lighting Capacity change 1.14 1.29 1.29 2.50
Refrigerator Capacity change 1.05 1.2 1.4 1.5
Colour TV Capacity change 1.1 1.3 1.4 1.5
Washing machine Capacity change 1.05 1.1 1.2 1.7
Other appliances Capacity change 1.5 2.5 3.5 4.5

20 SCENARIOS FOR CHINESE ENERGY DEMAND AND SUPPLY TO 2020: NATIONAL PLANNING AND BUILDINGS
Asia Pacific Economic Papers
Table 2.7 Ownership of services for urban residents, per 100 household
Energy use 2000 2010 2020 2030
Cooking 100 100 100 100
Electric cooking 90 120 130 140
Hot water 49 70 90 100
Space heating 37 40 43 45
Air conditioner 30.8 60 100 130
Fan 180 190 200 210
Incandescent lighting 75 50 48 45
Fluorescent lighting 30 50 54 60
Refrigerator 77 82 95 100
Colour TV 80 90 105 120
Washing machine 91 98 100 100
Other appliance 65 90 93 95
Table 2.8 Service assumptions for rural residents
2000 2010 2020 2030
Cooking 272.40 254.55 245.28 236.25
Electric cooking 27.24 58.74 96.36 110.25
Hot water 13.62 48.95 87.60 126.00
Space heating 80.02 142.22 204.95 279.02
Air conditioner 2.95 44.33 418.27 1066.86
Fan 159.35 180.15 227.76 236.25
Incandescent lighting 147.10 136.29 135.94 131.31
Fluorescent lighting 74.91 142.22 188.22 227.60
Refrigerator 22.70 39.16 70.08 141.75
Colour TV 79.45 97.91 147.17 209.48
Black and white TV 158.90 137.07 134.90 86.63
Washing machine 62.43 70.49 122.64 240.98
Other appliance 204.30 274.14 350.40 401.63
Table 2.9 Change index in service intensity for rural residents, 1990=1
2000 2010 2020 2030
Cooking 1.2 1.3 1.4 1.5
Electric cooking 1.2 1.3 1.4 1.5
Hot water 1.2 1.3 1.4 1.5
Space heating 1 1.5 2.1 2.55
Air conditioner 1 1.87 3 3.9
Fan 1.08 1.15 1.3 1.5

JIANG KEJUN AND HU XIULIAN 21
No. 369, 2008
Incandescent lighting 1.08 1.15 1.3 1.5
Fluorescent lighting 1.1 1.2 1.35 1.6
Refrigerator 1 1 1 1
Colour TV 1 1 1.2 1.4
Black & white TV 1 1 1.1 1.1
Washing machine 1.1 1.2 1.4 1.8
Other Appliances 1.5 2 2.5 3
Table 2.10 Ownership of services for rural residents (per 100 households)
2000 2010 2020 2030
Cooking 100 100 100 100
Electric cooking 10 30 55 70
Hot water 5 20 50 80
Space heating 38 40 42 50
Air conditioner 1.4 1 4 125
Fan 65 80 100 100
Incandescent lighting 60 50 45 40
Fluorescent lighting 30 50 60 65
Refrigerator 10 20 40 90
Colour TV 35 50 70 95
Black & white TV 70 70 70 50
Washing machine 25 30 50 85
Other appliances 60 70 80 85
Energy service demand and key factors in the service sector are given in Tables 2.11–
13. Table 2.11 gives the building area in the services sector. Different building areas are
reflected in the ownership of energy services.
Table 2.11 Energy service demand in the service sector
Energy use 2000 2010 2020 2030
Building area (million m2)
9,000 16,000 23,000 28,000
Cooling 44.9 38.0 88.9 157.2
Space heating 71.5 110.3 153.3 210.6
Lighting 209.0 312.0 429.0 560.0
Duplicating machine 13.2 24.2 42.8 63.0
Computer 22.6 61.8 123.6 211.7
Elevator 21.5 36.0 52.3 71.3
Other electric appliance 76.6 114.3 157.1 205.1
Hot water 48.9 89.9 139.0 194.4Cooking 13.6 23.5 26.8 49.6

22 SCENARIOS FOR CHINESE ENERGY DEMAND AND SUPPLY TO 2020: NATIONAL PLANNING AND BUILDINGS
Asia Pacific Economic Papers
Table 2.12 Service ownership changes in the service sector (per cent)
Energy use 2000 2010 2020 2030
Cooling 21.0 24.0 26.0 28.0
Space heating 38.0 41.0 43.0 45.0
Lighting 100.0 100.0 100.0 100.0
Duplicating machine 7.0 9.0 12.0 14.0
Computer 12.0 22.0 32.0 42.0
Elevator 12.0 14.0 16.0 18.0
Other electric appliance 40.7 40.7 40.7 40.7
Hot water 26.0 32.0 36.0 40.0
Cooking 100.0 100.0 100.0 100.0
Table 2.13 Change index in service intensity change, 1990=1
Energy use 2000 2010 2020 2030
Cooling 1.25 1.28 1.34 1.38
Space heating 1.1 1.15 1.2 1.3
Lighting 1.1 1.2 1.3 1.4
Duplicating machine 1.1 1.15 1.2 1.25
Computer 1.1 1.2 1.3 1.4
Elevator 1.05 1.1 1.1 1.1
Other electric appliance 1.1 1.2 1.3 1.4
Hot water 1.1 1.2 1.3 1.35
Cooking 1.1 1.2 1.3 1.35
The model calculates energy demand based on technology use for each energy service.
More than 100 energy technologies are listed in the model. Table 2.14 summarises the
technology used in different sectors.
Table 2.14 Technologies used in the sectors
Energy service Technology Sectors
Energy saving buildings Normal building Urban residential, ruralresidential, 50% energy saving building Rural residentialservice sector 60% energy saving building Service sector
75% energy saving buildingSpace heating Co-generation heat supply
Central heat supplySmall coal stoveElectric heaterSpace heating by gasGas boilerAir conditioner for space heating

JIANG KEJUN AND HU XIULIAN 23
No. 369, 2008
Air conditioner for coolingCooking Gas stove (for cooking)
Coal stove (for cooking)Briquette stoveLPG stoveWork gas stoveBiomass stove Rural residentialEfficient biomass stoveBiogas stove
Electric cooking Electric pot Urban residential,New Electric pot rural residential,
Incandescent light Incandescent light service sectorIncandescent light (8 energy efficiency orhigher)Incandescent light (20 energy efficiency orhigher)
Fluorescent light Fluorescent light (normal)Fluorescent light (20 energy saving)Compact fluorescent light (75 energysaving)Ring fluorescent light (20 energy saving)
Space cooling Electric air conditionerAdvanced Electric air conditionerSuper air conditionerCentral air cooling Service sector
Fan Fan Urban residential,Washing machine Washing machine rural residential
New washing machineRefrigerator Electric refrigerator
New electric refrigeratorColour TV Colour TVBlack & white TV Black & white TVOther electric appliances Other electric
Other electric (advanced)Hot water Solar heater
Gas heaterLPG heaterElectric heater
Computer Computer Service sectorEnergy-efficient computer
Duplicator DuplicatorEnergy saving duplicator
Elevator ElevatorEnergy saving elevator
Other office appliance Office applianceEnergy saving office appliance
Energy demand scenarios
In order to analyse future energy demand in buildings in China, we consider two
scenarios. The Baseline uses a basic trend to describe future energy use assuming moderate
energy efficiency improvements. The policy scenario assumes that energy efficiency in
buildings and equipment is greater than that suggested by current trends. Policy options to
be considered in the policy scenario are given in Table 2.15.

24 SCENARIOS FOR CHINESE ENERGY DEMAND AND SUPPLY TO 2020: NATIONAL PLANNING AND BUILDINGS
Asia Pacific Economic Papers
Table 2.15 Policy options used in the modelling study
Area Options (in 2030)
Cooking Natural gas cooking in urban households, LPG and biogas in ruralhouseholdsSpace heating 70% of urban buildings and 65 per cent of rural buildings using energy
saving central heating. Rural buildings also using heat pumps.Space cooling 60% adoption of ultra high efficiency air conditioners
80% adoption of energy efficient coolingElectric appliances 100% utilisation of high efficiency refrigerators
45% utilisation of higher efficiency washing machinesLighting 100% utilisation of compact lighting
80% higher efficiencyHot water Solar heaterOffice electric equipment 30% utilisation of higher efficiency computers and photocopiers
Results
Energy demand is calculated using the IPAC-AIM/technology model. Baseline
scenario results are given in Figures 2.5 and 2.6. Final energy use in buildings in the baseline
scenario could reach 417 million toe in 2020 and 666 million toe in 2030. The annual growth
rate from 2000 to 2030 is 6.2 per cent. By 2020 urban residential buildings will consume 39
per cent of energy consumed in buildings while rural residential buildings will consume 27 per
cent and buildings in the service sector will consume 34 per cent (see Figure 2.8). Electricity
will be the main form of energy used in buildings, accounting for 42 per cent in 2020 and 48
per cent in 2030; however coal use will also increase due to cooking and space heating demand
(see Figures 2.3 and 2.4).
Figure 2.8 Final energy use in buildings by sectors (baseline scenario) (Mtoe)
Note: Mtoe = million tons of oil equivalent.Source: Authors’ calculations.
0
100
200
300
400
500
600
700
800
2000 2010 2020 2030
Rural residential
Service
Urban residential

JIANG KEJUN AND HU XIULIAN 25
No. 369, 2008
Figure 2.9 Final energy use in buildings by energy type (baseline scenario) (Mtoe)
Note: Mtoe = million tons of oil equivalent.Source: Authors’ calculations.
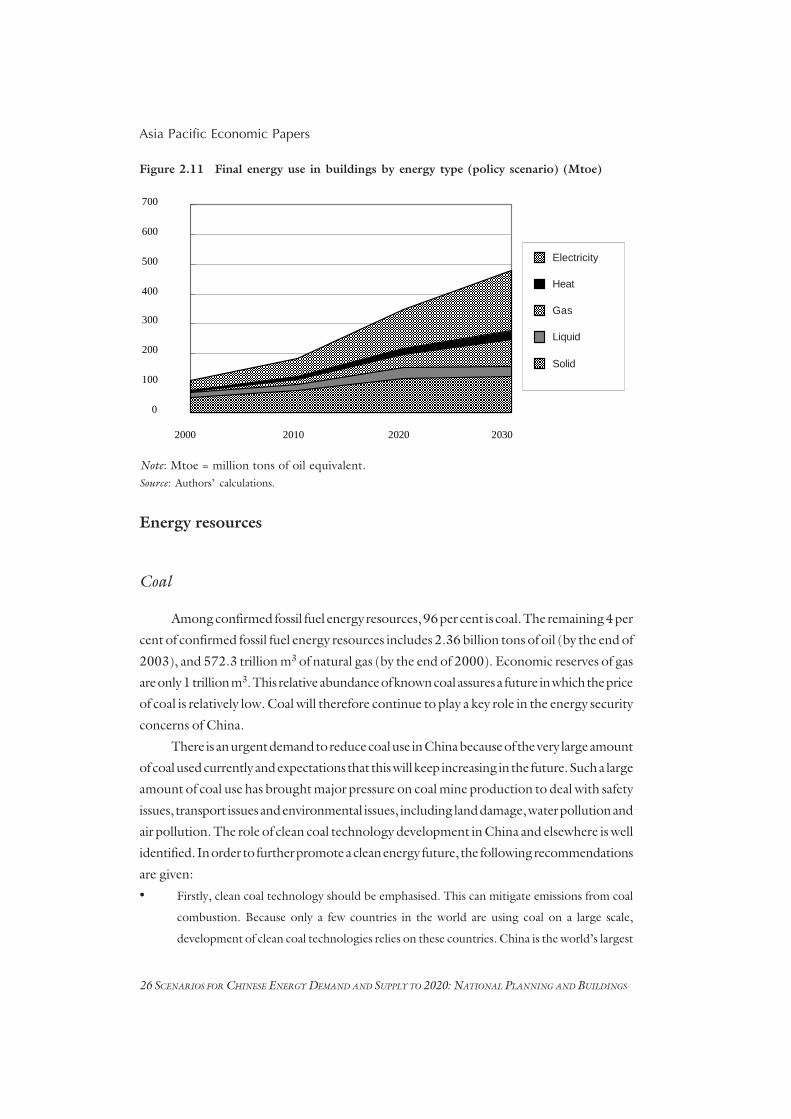
In the policy scenario, final energy demand in buildings is forecast to reach 347 million
toe by 2020 and 479 million toe by 2030, an annual growth rate of 6.2 per cent from 2000
to 2030. By 2020 urban residential buildings will consume 37 per cent of all energy consumed
in buildings, while rural residential buildings will consume 30 per cent and buildings in the
services sector 33 per cent. By 2030 these figures will be 36 per cent, 32 per cent and 32 per
cent respectively, a slight shift away from urban residential buildings (see Figure 2.10).
Electricity will be the major energy form used in buildings, taking a share of 38 per cent by
2020 and 42 per cent by 2030 (see Figure 2.11).
Figure 2.10 Final energy use in buildings by sectors (policy scenario) (Mtoe)
Note: Mtoe = million tons of oil equivalent.Source: Authors’ calculations.
0
100
200
300
400
500
600
700
2000 2010 2020 2030
Electricity
Heat
Gas
Liquid
Solid
0
100
200
300
400
500
600
700
800
2000 2010 2020 2030
Rural resident
Urban resident
Service
26 SCENARIOS FOR CHINESE ENERGY DEMAND AND SUPPLY TO 2020: NATIONAL PLANNING AND BUILDINGS
Asia Pacific Economic Papers
Figure 2.11 Final energy use in buildings by energy type (policy scenario) (Mtoe)
Note: Mtoe = million tons of oil equivalent.Source: Authors’ calculations.
Energy resources
Coal
Among confirmed fossil fuel energy resources, 96 per cent is coal. The remaining 4 per
cent of confirmed fossil fuel energy resources includes 2.36 billion tons of oil (by the end of
2003), and 572.3 trillion m3 of natural gas (by the end of 2000). Economic reserves of gas
are only 1 trillion m3. This relative abundance of known coal assures a future in which the price
of coal is relatively low. Coal will therefore continue to play a key role in the energy security
concerns of China.
There is an urgent demand to reduce coal use in China because of the very large amount
of coal used currently and expectations that this will keep increasing in the future. Such a large
amount of coal use has brought major pressure on coal mine production to deal with safety
issues, transport issues and environmental issues, including land damage, water pollution and
air pollution. The role of clean coal technology development in China and elsewhere is well
identified. In order to further promote a clean energy future, the following recommendations
are given:
• Firstly, clean coal technology should be emphasised. This can mitigate emissions from coal
combustion. Because only a few countries in the world are using coal on a large scale,
development of clean coal technologies relies on these countries. China is the world’s largest
0
100
200
300
400
500
600
700
2000 2010 2020 2030
Electricity
Heat
Gas
Liquid
Solid

JIANG KEJUN AND HU XIULIAN 27
No. 369, 2008
coal consumer. In future China’s use of coal is only likely to increase, with China potentially
taking more than 40 per cent of world coal consumption by 2020. Therefore China should
be a leading partner in the development and adaptation of clean coal technology, working
closely with several other countries.
• Secondly, various national laws, regulations and standards for the energy industry should be
prepared to enable China to reach the target of a clean energy system. So far the legal system
is very weak for the promotion of a clean energy system.
• Third, R&D must be emphasised. Technology is the key issue for clean energy and lower
energy demand in the future. International collaboration for technology transfer and
diffusion must be encouraged. China and a few other major coal consuming countries should
further develop clean coal technologies.
• Finally, international activities for clean coal technology R&D, such as clean coal partnership
and the Clean Development Mechanism, should be promoted. These provide opportunities
for China and for a clean coal future.
Gas
Historically China has paid less attention to natural gas than to other energy sources,
with much less investment in exploration for gas resources. However, the emphasis on
environmental protection in recent years has led both the Chinese government and private
firms to direct much more investment to natural gas resource exploration. In the last two years
three very large natural gas resources have been found in mainland China.
Hydropower
China has significant hydropower resources, but they are very unevenly distributed.
Seventy per cent of hydropower resources are located in southwest China, far from the main
consumption centres. Water resources appropriate to smaller-scale hydropower are plentiful
in China. According to the results of China’s latest hydropower resource survey, the potential
total capacity of small-scale hydropower that could be feasibly developed in the country is 125
GW. The hydropower resource base is widely distributed, including sites in over 1,600
counties (or cities) spread over 30 of China’s provinces (or provincial level municipalities).
Of 1,600 counties, 65 are located in southwest China; the small-scale hydropower resources
of this region account for over 50 per cent of total national potential capacity.
The Chinese government has implemented policies that strongly support small-scale
hydropower, including in its rural electrification plans. Small-scale hydropower has already
played a very important role in the electrification of China, particularly in rural areas. About

28 SCENARIOS FOR CHINESE ENERGY DEMAND AND SUPPLY TO 2020: NATIONAL PLANNING AND BUILDINGS
Asia Pacific Economic Papers
one-third of China’s counties rely on small-scale hydropower as their main source of
electricity. China has further made the building of small-scale hydropower stations a critical
component of rural energy development in its Western China Cropland Conversion Program
and its Western China Energy Development Program. Within the context of these programs,
the government has provided special funds derived from government bonds for small-scale
hydropower development. At present, existing small-scale hydropower stations, with an
installed capacity of 30 GW, represent about 20 per cent of the total projected potential
capacity. It is expected that between 2020 and 2030 China’s small-scale hydropower
resources will be almost fully developed, with a capacity of 100 GW and accounting for about
10 per cent of China’s total installed power capacity.
This development has had to overcome several problems, such as bad transportation
infrastructure, difficulties in construction, economic problems in long-distance transmission,
ecosystem problems, long payback periods and difficulties in raising capital. China will need
to continue to overcome these problems to further develop its small hydro capacity.
Nuclear power
China has good conditions for the development of nuclear power. Domestic uranium
resources are 650 kilotons (Kt), and international uranium resources are also quite large.
There are around 3–4 million tons of uranium resources with extraction costs below $80 per
kilogram of uranium—enough for more than 50 years of power generation. If uranium is used
in fast-breeder reactors, the uranium reserves would be enough for more then 3,000 years.
Chinese companies already produce 300 MW using light-water reactor technologies, and
nuclear power plants could be constructed with domestic technologies. Chinese companies
already have the ability to produce 3–4 sets of nuclear power generators. The existing capacity
of nuclear power plants in China is already more than 40–50 GW. China also has the ability
to produce and supply nuclear fuel, and to process used fuels.
Biomass energy
China’s main biomass resources are agricultural wastes, scraps from the forestry and
forest product industries, and municipal waste. Agricultural wastes are widely distributed.
Among them, the annual production of crop stalks alone surpasses 600 million tons. Crop
stalks suitable for energy production are estimated to represent a potential of 12,000
petajoules (PJ) annually. Wastes from the processing of agricultural products and manure
from livestock farms could theoretically yield nearly 80 billion cubic metres of biogas. Scraps

JIANG KEJUN AND HU XIULIAN 29
No. 369, 2008
from forestry and forest product industries represent a resource equivalent to 8,000 PJ per
annum.
Furthermore, with the implementation of China’s Natural Forest Protection Program
(which includes logging bans and logging reductions over much of the nation’s natural
forests) and its Sloping Cropland Conversion Program (which calls for the conversion of
much of the nation’s sloping cropland to trees and grasses), it is expected that the amount
of scraps from forestry and forest product industries used in energy applications will increase
substantially, potentially reaching 12,000 PJ per annum by 2020.
Municipal waste in China is expected to reach 210 million tons per annum in 2020. If
60 per cent of this is used in landfill methane applications, 2–10 billion cubic metres of
methane could be produced.
Finally, ‘energy crops’ are a biomass energy resource with the potential for commer-
cialisation. Many types of energy crops are suited for growing in China. Chief among these
are rapeseed and other edible oil plants and some plants that grow in the wild, such as sumac,
Chinese goldthread, and sweet broomcorn. By 2020, such crops could potentially yield over
50 million tons of liquid fuel annually, including over 28 million tons of ethanol and 24 million
tons of biodiesel. In sum, whether burned directly, used to produce electricity or used as a
substitute liquid fuel, biomass energy resources have the potential to play a decisive role in
China’s energy supply.
Wind power
With its large land mass and long coastline, China has relatively abundant wind
resources. According to estimates by the China Meteorology Research Institute, land-based
exploitable wind resources represent a potential power generation capacity of 253 GW (based
on wind resources at a height of 10 metres above the ground). The institute has further
estimated ocean-based wind resources to represent an exploitable potential of about 750 GW,
so the total estimated wind power potential of China is about 1,000 GW. Areas rich in wind
resources are located mainly along the southeast coast and nearby islands and in Inner
Mongolia, Xinjiang, Gansu Province’s Hexi corridor, and some parts of northeast China,
northwest China, north China, and the Qinghai–Tibetan Plateau. Aside from this, certain
areas in China’s interior are rich in wind resources. China also has large marine areas with
plentiful ocean-based wind resources. With current technology, wind turbines can be installed
in the ocean up to 10 kilometres away from the coast and at ocean depths of up to 20 metres.
By the end of 2003, the total capacity of installed and grid-connected wind power in
China was 560 MW, ranking China 10th in the world in terms of total installed wind power
capacity. Aside from grid-connected installations, China has about 200,000 stand-alone

30 SCENARIOS FOR CHINESE ENERGY DEMAND AND SUPPLY TO 2020: NATIONAL PLANNING AND BUILDINGS
Asia Pacific Economic Papers
small-scale wind turbines (with installed capacity of 25 MW) that provide electricity to rural
households located in remote areas. China can manufacture large-scale wind turbines with
a capacity of 750 KW or less efficiently and economically; at the time of writing, it was in the
process of developing megawatt-scale turbines. China has also established 40 wind farms with
efficient operation and management. There are now qualified technical personnel in the areas
of wind power design and construction, creating a sound base for developing large-scale wind
power in China.
Conclusion
The national government has established a portfolio of policies for energy conservation
and the development of renewable energy. The centre of this policy portfolio is the target for
2010, established in the 11th FYP, of reducing energy intensity by 20 per cent from 2000
levels. Energy issues have become a top concern of the government in China. The recently
developed policies are expected to be fully backed by action, with the government fully
committed to reach the targets.
There are several international collaboration programs currently under way, including
under the Kyoto Protocol. Now, however, post-Kyoto discussion is required. Other
programs include the Asia Pacific Partnership on Clean Development and Climate and
numerous bilateral collaborations. These programs will support the Chinese government’s
national program by establishing various opportunities for collaboration and cooperation with
other countries.
Our study shows that the energy demand of buildings in China will increase
significantly. The energy demand in buildings could range from 347 to 417 million toe in
2020, and 479 to 666 million toe in 2030. This depends critically on technological progress
and government polices.
A combination of the right policies and the widespread adoption of new technologies
could significantly reduce energy demand in buildings in China. Even with falling costs for
existing technologies (energy-efficient buildings, solar heaters, high-efficiency refrigerators
and air conditioners), energy demand could be much lower.
China’s buildings provide considerable potential for major energy savings at potentially
low costs. For these savings to be achieved, strong policies are urgently needed to encourage
the adoption of new energy saving technologies and to change energy consumption behaviour
in buildings.
Policies regulating energy efficiency in buildings (with strong government enforce-
ment), fiscal policies to reduce the cost of space heating for users of energy-efficient buildings,
much higher energy efficiency standards for electric appliances, and the promotion of solar

JIANG KEJUN AND HU XIULIAN 31
No. 369, 2008
and geothermal heaters for space heating and heat pumps should be implemented as soon
as possible to avoid long technology lock-in effects. There are precedents for successful
energy saving in buildings in other countries. China should make efforts now to reduce rapid
increases in energy use in buildings in China. This is necessary for the sake of energy security
as well as local and global environmental issues; the IPAC modelling team has demonstrated
that it is also beneficial for local economic activities (Jiang et al. 2005).
Our study shows that the use of appropriate technologies and policy options can
contribute to at least a 28 per cent energy saving in buildings compared with the baseline
scenario. However, we did not consider some advanced technologies that are available now
– for example, distributed heating, cooling and power generation systems, super high energy
saving buildings, and countermeasures such as energy-saving campaigns. If those technolo-
gies are also implemented, the potential energy savings will be even greater.
It is clear that coal demand in China will keep growing. We can conclude that emissions
from coal use will also keep increasing if we do not make further efforts. Development of clean
coal technology in China is therefore both urgent and critical. In 2004, the coal industry
employed 7.6 million people; it is projected to employ 7.8 million by 2030. The sustainable
development of coal can therefore provide many opportunities for low-income people to find
employment.
Furthermore, taking a global lead in the development of clean coal technology will bring
major economic benefits. However the environmental impacts of developing clean coal
technologies are more important for long-term sustainability. CO2, SO2, NOx and particulate
matter (PM) emissions, as well as water pollution, will be significantly reduced by the use of
clean coal technologies. This will have major beneficial impacts on China’s local environment
and on climate change. Finally, the development of clean coal technologies will be crucial for
successfully meeting the government’s environmental target in the 11th FYP.
References
Asia-Pacific Integrated Model Project Team, 1996. ‘A guide to the AIM/end use model’, AIMInterim Paper, IP 95-05, Tsukuba, Japan.
Anonymous, 2004. ‘Power industry information’, China Power, 38 (3).China, National Bureau of Statistics, 2004. China Year Book 2004, State Statistical Bureau, Beijing.——, 2004. China Energy Yearbook 2002–2003, National Bureau of Statistics, Beijing.China, National Bureau of Statistics and National Development and Reform Commission, 2007.
China Energy Statistical Yearbook 2006, National Bureau of Statistics and National Devel-opment and Reform Commission, Beijing.
China, Environment Year Book Editing Committee, 2004. China Environment Year Book 2004,China Environment Year Book Editing Committee, Beijing.
Edmonds, J. and Reilly, J., 1983. ‘A long term global energy economic model of carbon dioxiderelease from fossil fuel use’, Energy Economics, 5: 75–88.

32 SCENARIOS FOR CHINESE ENERGY DEMAND AND SUPPLY TO 2020: NATIONAL PLANNING AND BUILDINGS
Asia Pacific Economic Papers
Edmonds, J., Wise, M. and Barns, D., 1995. ‘Carbon Coalitions: The cost and effectiveness ofenergy agreement to alter trajectories of atmospheric carbon dioxide emissions’, EnergyPolicy, 23: 309–335.
Edmonds, J., Wise, M., Sands, R., Brown, R., and Kheshgi, H., 1996. Agriculture, Land Use, andCommercial Biomass Energy: A Preliminary Integrated Analysis of the Potential Role ofBiomass Energy for Reducing Future Greenhouse Related Emissions, Pacific NorthwestNational Laboratory, Washington DC.
Hu, X., Jiang, K. and Liu, J., 1996. ‘Application of AIM/emission model in P.R. China andpreliminary analysis on simulated results’, AIM Interim Paper, IP-96-02, Tsukuba, Japan.
Hu, X. and Jiang, K., 2001. GHG Mitigation Technology Assessment, China Environment SciencePublishing House, Beijing. (in Chinese)
Intergovernmental Panel on Climate Change (IPCC), 2001. Climate Change 2001: Mitigation,IPCC Working Group III, Cambridge University Press, Cambridge.
——, 2002. Synthesis Report on the Third Assessment Report, Cambridge University Press, Cam-bridge.
Jiang, K., Hu, X., Matsuoka, Y., and Morita, T., 1998. ‘Energy technology changes and CO2 emissionscenarios in China’, Environment Economics and Policy Studies, 1: 141–160.
Jiang, K, Morita, T., Masui, T., and Matsuoka, Y., 1999. ‘Long term emission scenarios forChina’£¬Environment Economics and Policy Studies, 2: 267–287.
——, 2000a. ‘Global long-term GHG mitigation emission scenarios based on AIM’£¬EnvironmentEconomics and Policy Studies, 3(2): 195–224.
——, 2000b. ‘Long-term GHG emission scenarios of Asia Pacific and the world’, TechnologicalForecasting and Social Change, 61(2-3): 207–229.
Jiang, K., Zhou, D., 2005. Development and Climate, research report, available at: http://www.developmentfirst.org
Liu, J., Ma, F. and Fang.L, 2002. China Sustainable Development Strategy, China AgriculturePublishing House, Beijing. (in Chinese)
Lu, Z., Zhao, Y. and Shen, Z., 2003. Whether China Can Become a Global Factory, EconomicManagement Publishing House, Beijing. (in Chinese)
Nakicenovic, N. and Swart, R. (eds), 2001. IPCC Special Report on Emissions Scenarios, CambridgeUniversity Press, Cambridge.
Qu, K., 2003. Energy, Environment, Sustainable Development Study, China Environment SciencesPublishing House, Beijing.
Tan, S., Wang, Y. and Jiang, S., 2002. Economy, Globalisation and Developing Countries, SocialScience Documentation Publishing House, Beijing.
Zheng, Y. and Wang, S., 2004. China Environment and Development Review, Social SciencesDocumentation Publishing House, Beijing.

3 STRATEGIES FOR THE MANAGEMENT OF THE
ENVIRONMENTAL IMPACT OF ENERGY CONSUMPTION IN
CHINA
XIULIAN HU AND KEJUN JIANG
Introduction
This chapter assesses the environmental impact of energy use in China. The first section
provides an overview of energy use throughout the Chinese economy. The overall growth
of energy production and consumption is considered, along with the structure of different
fuel types. Energy use in each of three key consuming sectors - industry, buildings, and
transport - is considered in additional detail. The first section should provide context for
understanding the scale and nature of China’s energy consumption.
The second section quantifies pollution levels resulting from energy use in China. The
specific forms of environmental degradation resulting from each fuel type - coal, oil and
natural gas - are discussed, along with environmental damage caused in the generation of
electricity. Pollution and environmental damage associated with different final uses is also
discussed, paying particular attention to industry and vehicle consumption.
The third section is the most extensive part of the chapter, providing a detailed picture
of strategies available in China for mitigating the environmental impact of energy. These
strategies are broken into four broad categories: legal strategies (at both national and local
levels); fuel substitution strategies (to promote alternative energy); technological strategies
(clean coal technologies, improving energy efficiency at the consumption end, and a
discussion of potential gains across several key industries and in transport and construction);
and market strategies (development of international markets and the use of taxes and special
funds).
The final section presents forecasts of emissions of the major pollutants, NOx, SO2,
CO2 and TSP based on scenarios of various levels of adoption of the pollution control
measures discussed in the previous section. A baseline scenario, in which only a limited set
of environmental policy options are utilised, is contrasted with a policy scenario, in which a

34 STRATEGIES FOR MANAGEMENT OF THE ENVIRONMENTAL IMPACT OF ENERGY CONSUMPTION IN CHINA
Asia Pacific Economic Papers
Energy and Environmental Development in China
Coal dominant energy production and consumption in China
China is facing an unprecedented challenge in energy use. Dealing with this challenge
is a key requirement for sustained economic growth. From 1978 (the beginning of economic
reform in China) to 2000, primary energy consumption in China rose from 400 Mtoe (million
tons of oil equivalent) to 970 Mtoe, an annual increase of 4.11 per cent. GDP in this period
grew by 9.66 per cent resulting in an average energy consumption elasticity over the 22 years
of 0.43. Since 2000, energy consumption in China has grown at an unusually rapid rate,
outstripping GDP growth for the first time since the reform period. From 2000 to 2005,
primary energy consumption increased from 970 Mtoe to 1557 Mtoe, an annual increase of
9.93 per cent. In the same period, the average annual growth of GDP was 9.49 per cent,
indicating an energy consumption elasticity of production greater than 1 (equal to 1.05).
Putting this growth in context, the global average annual increase of primary energy
over the 2000 to 2005 period was 3.08 per cent, while in East Asia1 energy consumption grew
by 6.86 per cent. In both output (GDP) and energy consumption, China’s growth far
outstripped both the region and the globe over the last five years. This rapid growth has led
to a situation in which primary energy consumption in China in 2005 accounted for 59.4 per
cent of total consumption in East Asia and 14.8 per cent of the world total, making China
the second largest energy consuming nation, after the United States.
In 2005 total energy consumption in East Asia was 2,614 Mtoe, accounting for 76.4
per cent of energy consumption in the Asia Pacific region and 24.8 per cent in the world.
Energy related carbon emissions were 1,790 Mt, accounting for 26.1 per cent of total carbon
emissions in the world. Excluding China (which mainly relies on coal), the countries of East
Asia mainly rely on oil. As a whole, the consumption of oil, natural gas, nuclear power and
hydropower in East Asia in 2005 accounted for 22 per cent, 9.9 per cent, 18 per cent and
17.5 per cent respectively of the total world consumption, while coal consumption accounted
for 44.4 per cent. Of this, China, consumes about 36.9 percent. From 1990 to 2005, global
coal consumption increased by 696 Mtoe, while that in East Asia increased by 812 Mtoe, of
which 551 Mtoe is from China alone. Figure 3.1 and Figure 3.2 show the primary energy
consumption in East Asia from 1980 to 2005 and the energy consumption mix in 2005.

XIULIAN HU AND KEJUN JIANG 35
No. 369, 2008
0%
20%40%
60%80%
100%
China
Indonesia
Japan
Malaysia
Singapore
South Korea
Thailand
Mix
Hydro electric
Nuclear Energy
Coal
Natural Gas
Oil
Figure 3.1: Primary energy consumption in East Asia from 1980 to 2005
Source: Authors’ calculations
Figure 3.2: Energy consumption mix in East Asia by 2005
Source: Authors’ calculations
China has a relatively high population but insufficient energy resources. It is now in a
process of rapid industrialisation and urbanisation. It is faced with a situation of very rapid and
energy intensive economic growth. Continual expansion of the scale of consumption and the
growing conflict between energy supply and demand have become serious problems in the
economic development of China.
Energy Development
Because of rapid economic growth, total primary energy consumption increased from
400 Mtoe in 1978 to nearly 1557 Mtoe in 2005, with an annual average rate of increase of
5.16 per cent (see Figure 3.3) (China Energy Year Book 2002-5, China Year Book 2004-
5). Coal is the major energy source, providing 70.7 per cent of total primary energy use in
1978 and 69.9 per cent in 2005 (see Figure 3.4). Recent years have witnessed a dramatic
surge in the rate of increase of energy use in China and widespread energy shortages.
30002500200015001000500
0
ThailandSouth KoreaSingaporeMalaysiaJapanIndonesiaChina
1980
1985
1990
1995
2000
2001
2002
2003
2004
2005

Figure 3.3: Primary energy production and consumption in China
Source: China Energy Statistical Year Book 2000-6, National Bureau of Statistics, Beijing.
Figure 3.4: Primary energy use in China by energy type
Source: China Energy Statistical Year Book 2000-6, National Bureau of Statistics, Beijing.
China is the largest coal producing and consuming country in the world. Between 1978
and 2005, total raw coal output increased from 618 Mt to more than 2,187 Mt, with an
average annual growth rate of 4.8 per cent per year. Prior to 2000, the share of coal use in
total energy use decreased, but it then increased again, from 66.6 per cent in 2000 to 75.8
per cent in 2005. The heavy dependence on coal has led to serious environmental problems
and represents a burden for the transportation system.
Between 1978 and 2005, total crude oil output increased from 104 Mt to 181 Mt (an
average annual growth rate of 2.1 per cent). Of the total oil output in 2002, 154 Mt is
produced on land and 27 Mt is produced offshore. Crude oil output in China accounts for
4.7 per cent of the world total. Between 1978 and 2005, total natural gas output increased
from 13.7 billion cubic metres to 50 billion cubic metres (an average annual growth rate of
4.91 per cent). Natural gas output in China accounts for 1.8 per cent of the world total.
Thermal power generation (including coal- and oil-fired power generation and natural
gas-fired power generation) is the main pattern of power generation in the world at present.
According to UN statistics, thermal power accounted for 65 per cent of total power
generation in the world in 2005. In developed countries, the coal used for electricity
generation generally accounts for more than 80 per cent of total coal consumption (and more
0
300
600
900
1200
1500
1800
1949 1960 1975 1985 2000 2003 2006
Mto
e
Primary EnergyProductionPrimary EnergyConsumption
0%
20%
40%
60%
80%
100%
1950 1965 1980 1995 2002 2005
Hydro and Nuclear Power
Natural Gas
Oil
Coal
36 STRATEGIES FOR MANAGEMENT OF THE ENVIRONMENTAL IMPACT OF ENERGY CONSUMPTION IN CHINA

than 92 per cent in the United States). Coal is the main energy resource in China and is also
presently the cheapest energy resource. In 2005, coal used for electricity generation in China
amounted to 1,100 million tons (Mt), just 50.5 per cent of total coal consumption.
During the 22-year period between 1978 and 2000, the economic reforms imple-
mented by the Chinese government drove the rapid development of China’s economy. The
installed capacity for power generation during this period increased at an annual rate of 8.13
per cent, from 57.1 gigawatts (GW) to 319 GW; power generation increased at an annual
rate of 7.9 per cent from 256 terawatt hours (TWh) to 1,369 TWh. The power industry
experienced the fastest growth from 2000 to 2005: during this period, installed capacity
increased at 9.9 per cent per annum, from 319 GW to 512 GW, and power generation
increased at 12.6 per cent per annum, from 1,369 TWh to 2,475 TWh. At the time of writing,
China ranked second in the world for total installed capacity and total power generation, lower
only than the United States.
With continual economic growth, the demand for power has been very strong in recent
years. From 2000 to 2005, the total newly installed capacity was 191 GW, representing a
growth in capacity of more than 30 GW each year and more than 60 GW in 2005 alone. By
comparison, the average annual newly installed capacity from 1990 to 2000 was only 18 GW.
In total, installed capacity in 2005 was 512 GW. Hydropower accounted for 115 GW
(22.5 per cent), while thermal power accounted for 389 GW (76 per cent), nuclear power
6.84 GW (1.3 per cent), and renewable energy such as wind power 1.2 GW (just 0.2 per cent
of total installed electric generation capacity).
In contrast to the installed capacity, the actual electric power generation from hydro
plants was 402.6 TWh, 16.3 per cent of the total power generation in 2005 (2,475 TWh).
Generation from thermal power was 2,018 TWh (81.55 per cent of total generation) while
generation from nuclear power was 50.5 TWh (2.04 per cent) and generation from renewable
energy was 3.6 TWh (0.11 per cent). Coal accounted for 95 per cent of the total thermal
power generation.
The development of hydropower in China is relatively slow and the exploitation ratio
is presently only about 25 per cent. The development of nuclear and renewable energy is also
slow; after 10 years of effort, the share of nuclear power in total installed capacity is only 1.3
per cent, much lower than the global level of 10 per cent. Additionally, the share of renewable
energy such as wind power and solar power is only 0.2 per cent, also much lower than the
global level of 1 per cent.
The power shortages of recent years have led to a resurgence in the construction of low
parameter thermal power units, with a rising trend similar to that of total installed capacity.
In 2004 the total installed capacity of thermal power units with unit capacity lower than 100
MW was 91.5 GW, accounting for as much as 29.5 per cent of total installed thermal power
XIULIAN HU AND KEJUN JIANG 37

38 STRATEGIES FOR MANAGEMENT OF THE ENVIRONMENTAL IMPACT OF ENERGY CONSUMPTION IN CHINA
Asia Pacific Economic Papers
capacity. Steam power units with unit capacity lower than 50 MW accounted for more than
50 per cent of all power units with capacity between 6 MW and 100 MW, resulting in a high
coal consumption rate, low energy efficiency and high environmental pollution. The mix of
installed capacity and power generation from 1978 to 2005 in China can be seen in Figure
3.5 and Figure 3.6.
Figure 3.5: Installed capacity of electricity power generation in China
Source: China Power Yearbook 1990-2005, China Power Press, Beijing.
Figure 3.6: Power Generation in China
Source: China Power Yearbook 1990-2005, China Power Press, Beijing.
Energy consumption
Energy consumption in China has seven main characteristics. First, rapid economic
growth leads to a high increase in energy consumption. Second, coal continuously takes a
leading role in total energy consumption. Third, the pace of industrialisation has increased
and heavy industry has become more and more dominant in relation to energy consumption.
Fourth, the building and transportation sectors have become new driving forces for energy
consumption. Fifth, the potential for energy efficiency improvements and energy saving is
high. Sixth, as a result of energy consumption, the emission of pollutants and greenhouse
0100200300400500600
1978
1980
1985
1990
1995
2000
2001
2002
2003
2004
2005
(GW)
Other
Nuclear power
Coal power
Hydropower
0
500
1000
1500
2000
2500
3000
1978
1980
1985
1990
1995
2000
2001
2002
2003
2004
2005
(TWh) Nuclear power
Coal power
Hydropower

XIULIAN HU AND KEJUN JIANG 39
No. 369, 2008
1985
1986
1987
1988
1989
1990
1991
1992
1993
1994
1995
1996
1997
1998
1999
2000
2001
2002
2003
2004
20%
15%
10%
5%
0%
-5%
Electricity ConsumptionGrowth rate of GDP Energy Consumption
Annu
al Gr
owth
gases (GHGs) has increased rapidly. Finally, energy consumption has grown faster than GDP
since 2001see Figure 3.7.
Figure 3.7 Growth rate of GDP, Energy and Electricity use
Source: China Statistical Yearbook 1990-2005, National Bureau of Statistics, Beijing.
The industry sector has been the main energy consumer in China. In 1995, energy
consumption in industry accounted for 73.3 per cent of total energy consumption (Figure 3.8
and Figure 3.9). In the process of accelerated industrialisation, heavy and chemical industries
have tended to have an increasing share of in the economic structure of China. The rapid
growth of heavy industries and chemical industries has led to a tremendous increase in energy
consumption, particularly in recent years. This industrial growth has contributed significantly
to the growth of energy consumption, exceeding the growth of GDP, reflected in the fact that
the energy elasticity factors for these three years are all higher than 1. By comparison, in
developed countries, the manufacturing, transportation and construction industries each
account for one-third of total energy consumption.
As for the internal structure of industry, the output of energy intensive products such
as black metal, non-ferrous metal and building materials has increased rapidly. From 2000
to 2005, the output of steel materials increased by 24.7 per cent annually, that of crude steel
by 22.36 per cent annually, and that of machine-made paper and paperboard by 16.79 per
cent annually. Currently, the energy intensity of output in the industrial sector is 70-90 per
cent higher than the energy intensity per unit of GDP.

40 STRATEGIES FOR MANAGEMENT OF THE ENVIRONMENTAL IMPACT OF ENERGY CONSUMPTION IN CHINA
Asia Pacific Economic Papers
Other Energy
Electricity
Heat
Natural Gas
Oil
Coal
1980
1990
2000
2002
2004
100%
80%
60%
40%
20%
0%
Figure 3.8 Final energy consumption mix in China
Source: Authors’ calculations
Figure 3.9 Final energy consumption mix in China
Source: Authors’ calculations
Coal dominates in energy production and consumption in China. The energy structure
is not optimised sufficiently and technological innovation is not encouraged. China’s industrial
system is still backward as a whole and its energy efficiency is obviously lower than that of
developed countries. Figure 3.10 shows the average unit energy consumption for six main
energy intensive products (electricity, steel, petroleum refining, cement, synthetic ammonia
and ethylene) as an index comparing China to a 'global frontier' (the average value of selected,
advanced countries). For China, the coal consumption for power supply is 15 per cent higher
than the average value for the selected advanced countries; the comparable unit steel
consumption of large scale steel plants is 10 per cent higher; the integrated energy
consumption of cement production is 35 per cent higher, the energy consumption of large
scale gas-based synthetic ammonia is 18 per cent higher; the integrated energy consumption
of oil refining is 25 per cent higher; and the integrated energy consumption of ethylene
production is 22 per cent higher.
The structure of the energy mix is not optimal in part due to the use of outdated
technologies. For example, clean coal technologies such as Integrated Gasification Combined
100%80%60%40%20%0%
1990
1995
2000
2001
2002
2003
2004
OtherResidentialServiceTransportConstructionAgricultureIndustry

XIULIAN HU AND KEJUN JIANG 41
No. 369, 2008
Cycle (IGCC) are not well developed and their running costs are high, so there is only limited
clean use of coal. Coal consumption in China is more than 40 per cent of final energy
consumption, much higher than in developed countries.
Figure 3.10 Energy consumption for main energy intensive products by comparingChina with selected countries (2004)
Source: Authors' calculations
In recent years, the building and transportation sectors have grown rapidly, becoming
new engines of energy consumption in China.
Energy use in buildings
Floor space per capita, measured in square metres, provides an indicator of the
development of national economies. International experience indicates that, as per capita
GDP reaches $800, demand for accommodation begins to increase dramatically. The
accompanying high growth period for the construction sector lasts until the dwelling area per
capita reaches around 30-35 m2. China’s construction and building sector entered just such
a period in 2004, with GDP per capita exceeding $1,000. The World Bank estimates that in
2015, half of China’s building area for civil use will have been constructed after 2000.
By the end of 2004, China had constructed 42 billion m2 of building area, 29 per cent
higher than in 1990 (32.6 billion m2). Since 2000, the annual newly completed building area
has been more than 1 billion m2, higher than the annual total newly completed building area
in all developed countries in the same period.
China is yet to establish reliable statistical regulations for energy consumption in
buildings, so the energy consumption of buildings can only be estimated. The Ministry of
Construction of China estimates that energy consumption in buildings was around 320 Mtoe

42 STRATEGIES FOR MANAGEMENT OF THE ENVIRONMENTAL IMPACT OF ENERGY CONSUMPTION IN CHINA
Asia Pacific Economic Papers
in 2003, accounting for about 26.1 per cent of total energy consumption. Energy for heating
and cooling accounted for 65 per cent of all energy used in buildings in that year.
The energy consumption for heating per unit of building area in China is about 2-3
times higher than that in developed countries with similar climates. The heat loss through
external walls is about 3-5 times higher in China than in Canada or other countries in the
Northern Hemisphere and the heat loss through windows is about two times higher. It is
feasible and practical to fully implement a 50 per cent energy saving standard in public and
residential buildings in China. Even after meeting this target, there would still be an energy
saving potential of 50 per cent in China’s buildings.
Energy use in transport
The demand for transportation also closely tracks the development of the national
economy. China’s increasing use of transportation is consistent with its growth in GDP. The
rapid development of the national economy, the acceleration of industrialisation and
urbanisation, rising incomes and changing living styles are the main driving forces for the
development of the transportation sector.
The transportation sector in China is composed of five transportation forms: railway,
road, water, civil aviation and the pipe system. Since the 1990s, along with economic
development and income growth, the total volume and structure of transportation has
changed remarkably. From 1990 to 2004, traffic volume increased by 8 per cent annually for
passenger transportation and by 7.2 per cent annually for freight transportation; the number
of vehicles for civil use increased by 12 per cent annually, including a 23 per cent annual
increase in the number of private cars in China. Vehicle ownership per 1,000 people also
increased, from 7.9 in 1994 to 21.1 in 2004.
Energy consumption in the sector also increased. In 2004, energy consumption for
transport was 113 Mtoe, about 2.86 times the level in 1990. The share of transport in final
energy use increased from 7 per cent in 1990 to 16 per cent in 2004. Most energy consumed
for transport is in the form of oil. In 2004, China consumed 82 Mt of oil for transport,
accounting for 40 per cent of total oil consumption in China.
Energy environmental issues in China
The rapidly growing energy consumption in China, especially in buildings and the
transport sector, creates considerable environmental strains. These are exacerbated by the
dominance of coal as China’s primary source of energy.
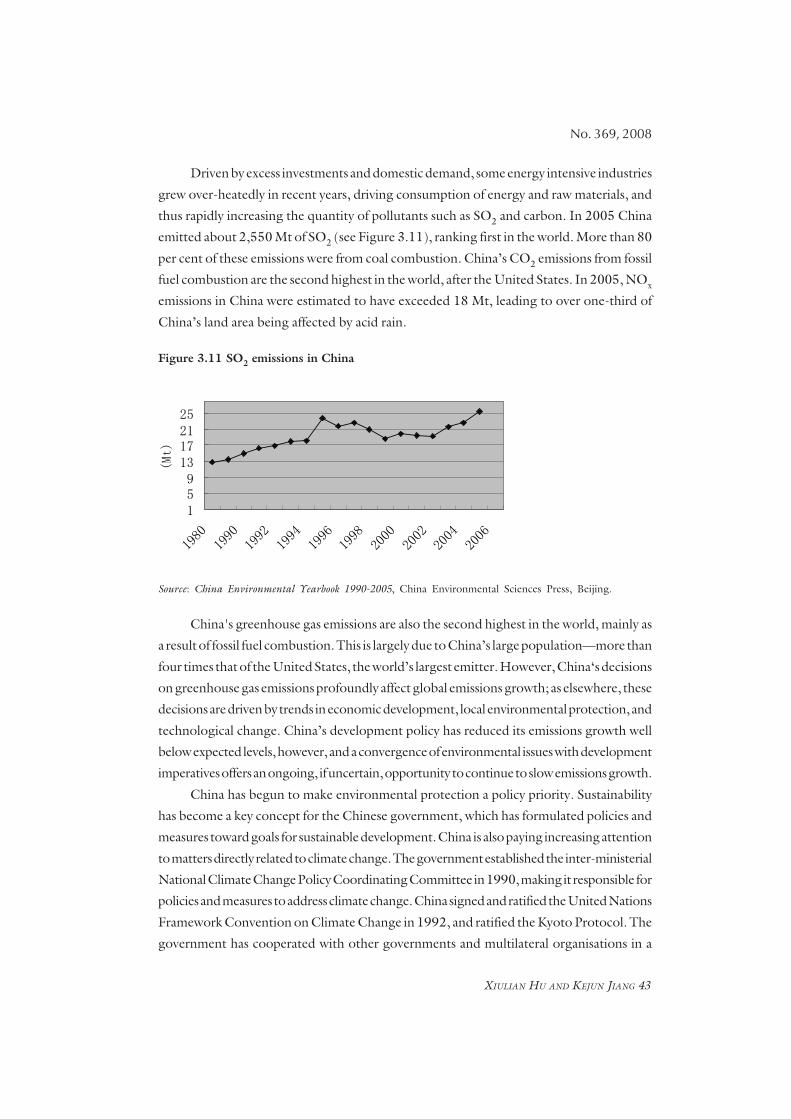
XIULIAN HU AND KEJUN JIANG 43
No. 369, 2008
Driven by excess investments and domestic demand, some energy intensive industries
grew over-heatedly in recent years, driving consumption of energy and raw materials, and
thus rapidly increasing the quantity of pollutants such as SO2 and carbon. In 2005 China
emitted about 2,550 Mt of SO2 (see Figure 3.11), ranking first in the world. More than 80
per cent of these emissions were from coal combustion. China’s CO2 emissions from fossil
fuel combustion are the second highest in the world, after the United States. In 2005, NOx
emissions in China were estimated to have exceeded 18 Mt, leading to over one-third of
China’s land area being affected by acid rain.
Figure 3.11 SO2 emissions in China
Source: China Environmental Yearbook 1990-2005, China Environmental Sciences Press, Beijing.
China's greenhouse gas emissions are also the second highest in the world, mainly as
a result of fossil fuel combustion. This is largely due to China’s large population—more than
four times that of the United States, the world’s largest emitter. However, China‘s decisions
on greenhouse gas emissions profoundly affect global emissions growth; as elsewhere, these
decisions are driven by trends in economic development, local environmental protection, and
technological change. China’s development policy has reduced its emissions growth well
below expected levels, however, and a convergence of environmental issues with development
imperatives offers an ongoing, if uncertain, opportunity to continue to slow emissions growth.
China has begun to make environmental protection a policy priority. Sustainability
has become a key concept for the Chinese government, which has formulated policies and
measures toward goals for sustainable development. China is also paying increasing attention
to matters directly related to climate change. The government established the inter-ministerial
National Climate Change Policy Coordinating Committee in 1990, making it responsible for
policies and measures to address climate change. China signed and ratified the United Nations
Framework Convention on Climate Change in 1992, and ratified the Kyoto Protocol. The
government has cooperated with other governments and multilateral organisations in a
159
13172125
1980
1990
1992
1994
1996
1998
2000
2002
2004
2006
(Mt)

44 STRATEGIES FOR MANAGEMENT OF THE ENVIRONMENTAL IMPACT OF ENERGY CONSUMPTION IN CHINA
Asia Pacific Economic Papers
number of international programs in the broad field of climate change. For example, it has
conducted five joint implementation projects conducted in cooperation with Japan, Norway,
and the United States.
Figure 3.12 [Davids et al, 2001] shows CO2 emissions in China, calculated using
IPCC emission factors [IPCC 1997] and some revised emission factors for the country.
Figure 3.12 CO2 emissions in China, by source
Source: Streets et al, 2001 IPCC 1997
To date, policy priorities have focused on economic growth rather than environmen-
tal issues. The concept of sustainable development is gaining traction, driven by the
obvious costs of local environmental problems; however, due to resource constraints,
climate change is still far from the top priority in China. The international negotiation
process has made climate change increasingly political; however, this has both positive and
negative impacts on the government’s ability to act on the issue. It draws attention to the
issues, but it can also place pressure on the government to take political rather than
scientific positions. There is a need to find a way to combine combating climate change
with local development policies.
Pollution from energy activities in China
Pollution from coal development
As noted in Hu and Jiang (2007), coal has developed as China‘s main source of
energy, with coal combustion having severe environmental impactis, especially in coal
mining areas. Air pollution in urban and rural areas has become more and more serious.
-1000
-500
0
500
1000
1500
2000
2500
3000
1990
1991
1992
1993
1994
1995
1996
1997
1998
1999
2000
2001
2002
coal combustion
biofuel combustion
oil combustion
cement production
Gas combustion
Carbon Uptake

XIULIAN HU AND KEJUN JIANG 45
No. 369, 2008
Coal production in 2005 was over 2.2 billion tons, nearly 70 times the level of production
when the People’s Republic of China was first established. The government has been aware
of the importance of environmental protection since the 1970s; however, its capacity to
act has been constrained by economic and technological factors. As described in Hu and
Jiang (2007), coal has five main detrimental impacts. Below we update the figures provided
in Hu and Jiang (2007).
Damaged land resources due to coal exploration. Up to 2004, about 480,000
hectares (ha) lands had collapsed. On average, 0.2 ha will collapse for every 10,000 tons of
coal mined. The annual collapse of land has increased by more than 20,000 ha; however, the
rate of recovery is now only about 20 percent.
Damaged water resources due to coal exploration. Nineteen per cent of water
resources in bedrock have been polluted to some extent in North China. Some 2.2 billion tons
of waste water has been discharged from various coal mine and coal washing process.
Occupation of land and damaged river beds due to coal production. Accumu-
lated coal stone from coal production has reached 3 billion tons. The burning of waste coal
stones occupies land and causes damage to river beds.
Emission of methane during the coal mining process. The emission of methane
during the coal mining process accounts for around 10 per cent of total from anthropogenic
methane emissions. Chinese methane emissions from the coal industry account for one-third
or one-fourth of global coal mining methane emissions.
Coal combustion as a major source of air pollution. In 2005, SO2 emissions were
25.5 million tons, and around 85 per cent of which were due to coal combustion. Acid rain
covered more than one-third of China’s area.
Pollution from oil and natural gas industry
As with coal, activities in the oil and natural gas industries have environmental impacts.
These activities include exploration, extraction, processing, transport and use. Potential
sources of impact include oil leakage, waste water and the discharge of polluted water.
Evaporation and leakage from oil stock and transport also cause environmental problems.
Evaporation mainly occurs during the loading and unloading processes of oil tanks, allowing
hydrocarbons and sulphurated hydrogen to escape as vapourised substances. Leakages and
other accidents, such as breaks in pipelines and capsising oil tankers also have considerable
local impacts.
Waste water, exhausted gas and waste residue are major pollutants from oil refineries.
Waste water has malfeasance compound transformed from the sulphur, oxygen and nitrogen
content in crude oil. Approximately 3 to 4 tons of waste water was discharged per ton of oil

46 STRATEGIES FOR MANAGEMENT OF THE ENVIRONMENTAL IMPACT OF ENERGY CONSUMPTION IN CHINA
Asia Pacific Economic Papers
processed in 1980s in China. Major pollutants in exhaust gases include SO2H2S, NOx,
CO2, hydrocarbon components, and dust. Much of exhausted gas is fetor which has
negative health impacts on humans. Waste residue is mainly chemical waste which has a
high toxicity and could damage soil, water and air.
There is waste water from natural gas exploration. There areSince sulphur, lithium,
kalium, bromine, and caesium are contained in waste water, it could damage soil.
Pollution from power generation industry
China is the world’s second largest producer of electricity, after the United States, with
2475 TWh generated in 2005 (82 per cent of which comes from coal fired power plants).
Electricity generation resulted in the consumption of 1040 million tons coal in 2005.
Most of the coal used in electricity generation in China does not go through washing
and selection processes, leading to high ash rates. Therefore coal used in electricity generation
is a major source of SO2, NOx and dust, which lead to acid rain (a major problem in China).
And coal is of course a major emitter of CO2.
According to data from the China Environmental Year Book, in 2004 9.29 million
tons of SO2 were emitted from electricity generation, accounting for 41.21 per cent of the
national total and 3.2 million tons of dust emissions, accounting 29.24 per cent of the
national total. An estimated 7.2 million tons of NOx were emitted from power generation.
In 2004 2.3 billion tons waste water and 210 million tons waste residue were discharged
in this sector. Table 3.1 and Table 3.2 show energy consumption and emissions of SO2,
dust and NOx in the electricity sector in China. in which the figures for year 2005 are the
estimated values.
Table 3.1: The energy consumption of thermal power generation units with capacity equalor higher than 600 MW in China from 2000 to 2005
Year Energy Consumption Share of Coal Share of energy Share of powerused for power used for power in total final
Coal (Mt) Oil(Mt) Gas(Mm3)generation in generation in energytotal coal total primary consumption
production energy ( per cent)( per cent) consumption
( per cent)
2000 528 10.41 15382 60.85 41.72 16.65
2001 576 10.23 18112 58.2 42.9 17.69
2002 656 10.89 21147 51.47 43.56 18.19
2003 765 13.22 31657 50.96 43.8 18.39
2004 994 14.88 44320 51.00 46.3 18.40
2005 1048 50.00
Source: Chinese Electricity Yearbook, 2000-2005, Chinese Electricity Press, Beijing.

XIULIAN HU AND KEJUN JIANG 47
No. 369, 2008
Table 3.2: SO2 and dust emissions from thermal power plants in China from 2000 to2005
SO2 Emissions (10,000 ton) Dust Emissions (10,000 ton)
National Thermal Share in National Thermal Share intotal power national total total power national
( per cent) total( per cent)
2000 1995 720 36.09 1165 301 25.85
2001 1948 654* 33.58 1070 290 27.08
2002 1927 667 34.61 1013 292 28.87
2003 2159 803 37.18 1049 313 29.83
2004 2255 929 41.21 1095 320 29.24
2005 2550 1110 43.55 1182 345 29.19
2000-2005( per cent) 5.02 9.04 0.29 2.77
Note: The SO2 emission volumes in 2001 is the statisticare compiled from data of 1033 powerplants, which consume 500M tons of raw coal, accounting for 86 per cent of total coal usedin power plants (576M tons).
Sources: China Environmental Yearbook, 1990-2005, China Environmental Sciences Press; China StatisticsYearbook, 2000-2004, National Bureau of Statistics, Beijing.
In 2005 the Energy Research Institute (ERI) undertook a project to compile China’s
inventory of greenhouse gas emissions from energy combustion. CO2 emissions from the
power sector were around 600 Mt of carbon; CO2 emissions per unit of power generation
were around 0.29 7 kg of carbon per kilowatt hour. The fuel structure and power generation
technology level are two major factors influencing CO2 emissions per unit of power
generation. Since coal will continue to be a dominant fuel for heat and electricity production
in China in the future, the power sector will continue to be China’s main emitter of CO2 in
the future.
Pollution from final energy consumption sectors
In China, most coal combustion occurs in industry boilers and kilns. Boiler capacity
has grown almost as much as industry and coal use. Industry boilers, industry kilns and
utility boilers are major consumers of coal (accounting for about 900 Mt in 2004, or 46
per cent of total coal consumption). They are also major sources of pollutants: SO2
emissions are about 7.6 Mt (accounting for about 34 per cent of the total in China) and
34 per cent of NOx emissions. Some 5.29 Mt of SO2 emissions come from the oil refining
and coke-making industry, the chemical industry, the construction material industry, the
steel industry and the non-ferrous industry, accounting for about 70 per cent of total
emissions from industrial boilers and kilns. Industrial boilers are more numerous, more
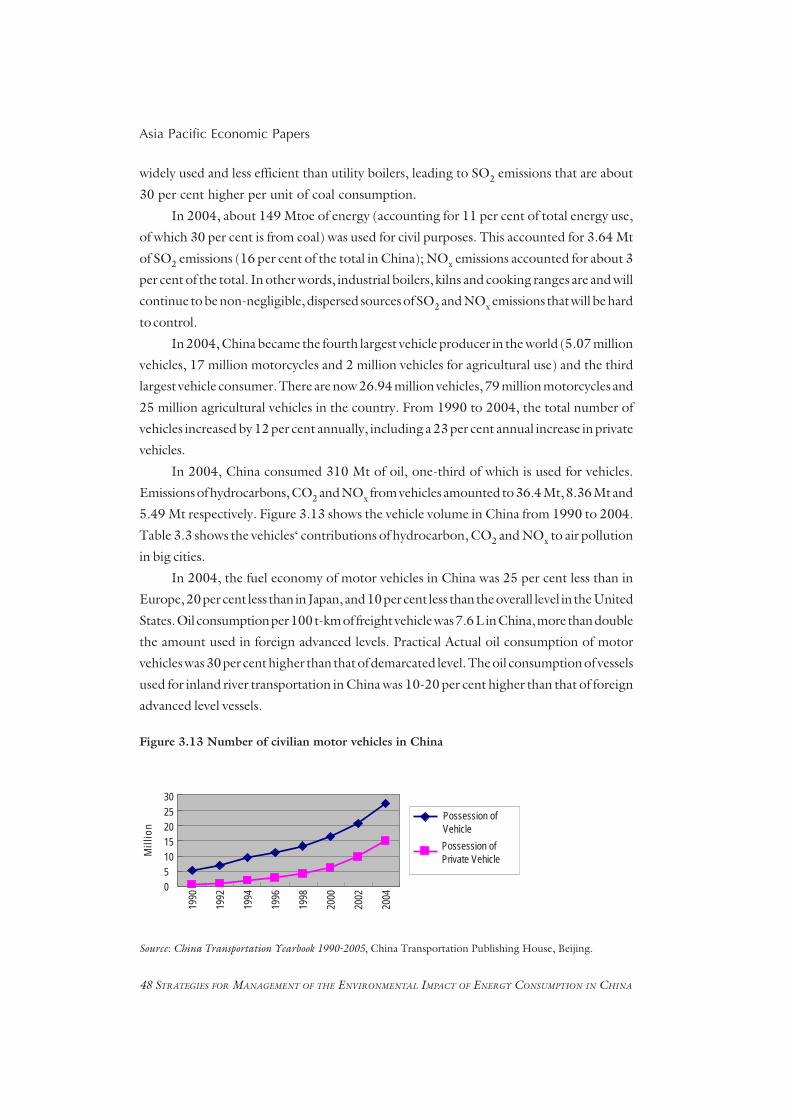
48 STRATEGIES FOR MANAGEMENT OF THE ENVIRONMENTAL IMPACT OF ENERGY CONSUMPTION IN CHINA
Asia Pacific Economic Papers
widely used and less efficient than utility boilers, leading to SO2 emissions that are about
30 per cent higher per unit of coal consumption.
In 2004, about 149 Mtoe of energy (accounting for 11 per cent of total energy use,
of which 30 per cent is from coal) was used for civil purposes. This accounted for 3.64 Mt
of SO2 emissions (16 per cent of the total in China); NOx emissions accounted for about 3
per cent of the total. In other words, industrial boilers, kilns and cooking ranges are and will
continue to be non-negligible, dispersed sources of SO2 and NOx emissions that will be hard
to control.
In 2004, China became the fourth largest vehicle producer in the world (5.07 million
vehicles, 17 million motorcycles and 2 million vehicles for agricultural use) and the third
largest vehicle consumer. There are now 26.94 million vehicles, 79 million motorcycles and
25 million agricultural vehicles in the country. From 1990 to 2004, the total number of
vehicles increased by 12 per cent annually, including a 23 per cent annual increase in private
vehicles.
In 2004, China consumed 310 Mt of oil, one-third of which is used for vehicles.
Emissions of hydrocarbons, CO2 and NOx from vehicles amounted to 36.4 Mt, 8.36 Mt and
5.49 Mt respectively. Figure 3.13 shows the vehicle volume in China from 1990 to 2004.
Table 3.3 shows the vehicles‘ contributions of hydrocarbon, CO2 and NOx to air pollution
in big cities.
In 2004, the fuel economy of motor vehicles in China was 25 per cent less than in
Europe, 20 per cent less than in Japan, and 10 per cent less than the overall level in the United
States. Oil consumption per 100 t-km of freight vehicle was 7.6 L in China, more than double
the amount used in foreign advanced levels. Practical Actual oil consumption of motor
vehicles was 30 per cent higher than that of demarcated level. The oil consumption of vessels
used for inland river transportation in China was 10-20 per cent higher than that of foreign
advanced level vessels.
Figure 3.13 Number of civilian motor vehicles in China
Source: China Transportation Yearbook 1990-2005, China Transportation Publishing House, Beijing.
302520151050
Possession ofVehiclePossession ofPrivate Vehicle
1990
1992
1994
1996
1998
2000
2002
2004
Mill
ion

XIULIAN HU AND KEJUN JIANG 49
No. 369, 2008
Table 3.3 Share rate of vehicle contamination (per cent)
City CO2 HC NOx
Beijing 63.4 73.5 46.0
Shanghai 87.0 97.0 74.0
Chongqing 85.8 36.6 86.3
Xian 98.6 - 69.7
Qingao 70.0 20.0 10.0
Urumchi 88.7 - 48.5
Tianjin 83.0 81.0 55.0
Chengdu 62.0 70.0 45.0
Guangzhou 84.1 - 25.7
Source: Huang Yonghe, 2005. Leveraging the Chinese Tax System to Promote Clean, Fuel Efficient VehicleDevelopment, Presentation to Clean Air Initiative for Asian Cities conference, 22 October 2005,Beijing.
Strategies for the management of the environmental impact ofenergy use in China
Energy policy has become integrated with China’s sustainable development objectives.
Energy saving and environmental protection have become priority areas for China’s goal of
sustainable development and they are important driving forces in ensuring national energy
security, promoting technology improvement and innovation, protecting and improving
environmental quality, improving international competition, establishing a resource saving
society and improving the sustainable development of China’s society and economy.
In March 2006, the Chinese government issued the Outline of the Eleventh Five Year
Plan for National Economic and Social Development (‘the Outline‘). In order to address the
acute problem of mounting pressure on resources and the environment, the Outline set a
target for reducing energy consumption per unit of GDP by 20 per cent over 5 years, with
a target for cutting the total discharge of major pollutants by 10 percent. This equates to an
annual reduction of 4.4 per cent from 2005 to 2010.
In order to achieve the above targets, China is pursuing four types of strategies:
• First, legal strategies will be used to establish and improve laws, regulations, policies and
standards in the field of energy and the environment; to clarify the responsibilities of different
entities such as governments, enterprises, producers and consumers; to build a new mechanism
to promote energy saving and environmental protection in market economy conditions and
a comprehensive policy system for energy and environment; and to carry out plans and action
plans for energy saving and environmental protection.

50 STRATEGIES FOR MANAGEMENT OF THE ENVIRONMENTAL IMPACT OF ENERGY CONSUMPTION IN CHINA
Asia Pacific Economic Papers
• Second, fuel substitution strategies will be used. The principle of ‘multi energy development‘
will be adopted; efforts will be made to exploit and utilise clean energy, alternative energy and
renewable energy; a reasonable consumption pattern will be encouraged; the international
energy market will be expanded; and the energy supply and consumption structure will be
optimised.
• Third, technological strategies will be used. People will be encouraged to rely on scientific and
technological advances and innovations to promote the economical, clean and effective use
of coal. The efficiency and benefit of final energy use will be promoted. People will be
provided with information on the technologies of pollution control and management.
Pollution from urban transportation will be strictly controlled, and the challenge of global
warming will be responded to actively.
• Fourth, market strategies will be used. Foreign experience will be used in measures to promote
energy saving and environmental protection on the basis of an economic incentive mecha-
nism. Further, the government will establish price and tax policies to promote energy saving
and environmental protection. In the short term, it will do this by introducing a fuel tax levy,
improving the pollution fee system, cancelling the production subsidy for energy intensive
products, and promoting the internalisation of environmental costs. In the long term, a carbon
tax and energy tax will be introduced.
Legal strategies
In order to effectively mitigate the impact of energy activities on the environment, China
has established a series of laws, regulations, policies and standards at all levels of government
to improve the management of energy activity and standardise all kinds of activities associated
with energy production and consumption that have impacts on the environment. Below we
outline the current environmental policy system as it affects energy use. There are three main
areas: laws, regulations and standards.
Laws: national and local
The central government uses national laws in an attempt to regulate environmental
damage and pollution. The key laws at the national level include the Environmental Protection
Law of the People’s Republic of China, the Law of the People’s Republic of China on the
Prevention and Control of Atmospheric Pollution, the Law of the People’s Republic of China
on the Prevention and Control of Water Pollution, the Law of the People’s Republic of
China on Prevention and Control of Pollution from Environmental Noise, the Law of the
People’s Republic of China on the Prevention and Control of Environmental Pollution

XIULIAN HU AND KEJUN JIANG 51
No. 369, 2008
by Solid Waste, the Marine Environment Protection Law of the People’s Republic of
China, the Law of the People’s Republic of China on the Promotion of Clean Production,
the Law of the People’s Republic of China on Conserving Energy, and the Renewable
Energy Law of the People’s Republic of China.
In addition to these national laws, some local governments establish their own laws
and regulations on energy activities in order to achieve their targets for environmental
quality. For example, in many cities the local government has issued regulations limiting
the use of small scale coal fired boilers in urban areas, playing an active role in reducing
pollutions from coal combustion and improving local air quality.
Regulations: national and local
The State Environmental Protection Administration (SEPA) of China formulates
the relevant regulations on the control of SO2 emission in ‘Two Controlled Zones‘,
prescribing strict limits on coal exploitation activities and the sulphur content of coal and
desulphurisation facilities in power plants in the two zones. SEPA also established policies
to close and stop ‘fifteen kinds of small scale enterprises‘ with high energy consumption
and high pollution within a prescribed limit of time, which plays an active role in limiting
the environmental impact of energy activities. Since 2000, SEPA has implemented a system
to limit the total quantity of pollutant discharge in different enterprises. This system was
strengthened and deepened in the tenth five year planning period and played an active role
in controlling the total quantity of pollutants, including those from the energy sector, and
improving environmental quality.
In 2005, the National Development and Reform Commission (NDRC) formulated
the Advices for Promoting the Development of Flue Gas Desulphurization in Thermal
Power Plants and issued ‘the first set of small scale thermal power units needed to be close
down or stopped and the timeline for action‘. This was done essentially to solve the
problems of SO2 pollution from thermal power plants and promote the health benefits of
developing flue gas desulphurisation measures in thermal power plants. In order to
promote the orderly development of projects under the Clean Development Mechanism
(CDM) addressing climate change in China, four ministries and commissions jointly
issued the Operation and Administration Rules for CDM Project. In 2005, the NDRC
established and issued the Medium- and Long-term Special Plans for Energy Conserva-
tion.
Standards: mandatory and non-mandatory
The SEPA has issued a series of standards to strictly control pollutant discharge from
energy production enterprises. Some local environmental departments have established their

52 STRATEGIES FOR MANAGEMENT OF THE ENVIRONMENTAL IMPACT OF ENERGY CONSUMPTION IN CHINA
Asia Pacific Economic Papers
own environmental standards to meet local requirements for environmental quality. For
example, Shanxi Province is now planning to establish an SO2 emission performance
standard for local power industries and Beijing has established standards for vehicle
pollution which are stricter than the national standard.
Besides issuing mandatory standards, the environmental departments issued a lot of
non-mandatory standards, such as the national standards for clean production. The objective
of these non-mandatory standards is to enhance environmental management and the
supervision of energy activities. In addition, a series of national, local and industrial standards
have been established and issued to promote energy saving in buildings, household electric
instruments and the transportation sector, The strict implementation and enforcement of
these standards would bring the control of emissions and environmental degradation within
the realm of the possible. However, this will be an arduous task, with strong resistance from
adversely affected sectors and firms. The use of non-mandatory standards is itself an
acknowledgement of this reality.
Fuel substitution strategies
Developing international energy markets and establishing stable channels for energy
imports
Establishing global energy markets is essential for optimising the use of high quality and
clean fuels. China will continue efforts to develop an international energy market, broaden
import channels for crude oil, further diversify import sources of crude oil, and encourage
private enterprises to develop oversea oil markets through policy stimulus.
In recent years, there has been rapid development of liquefied natural gas (LNG)
production projects based on purchased overseas resources. The Guangdong LNG project
in cooperation with ALNG Corporation of Australia was the first LNG project in China. The
first phase began in mid-2006, with the second phase beginning in 2008.
Utilising clean and alternative energy
Coal dominates China’s fuel consumption. While this will continue to be the case for
many years, adopting the principle of “multi energy development” is a critical component of
China’s sustainable development strategy. Multi energy development requires the promotion
of alternative fuels, including hydro, nuclear, natural gas, coal mine methane and
renewable energy. Of these alternatives, hydro is currently the most developed within
China.

XIULIAN HU AND KEJUN JIANG 53
No. 369, 2008
Hydropower
The relevant Chinese government departments are to promote the development of
hydropower by strengthening macroeconomic regulation and market planning, regulating
the construction of hydropower projects and establishing practical and feasible policies
such as incentives and taxes.
The plans of relevant departments can be summarised as follows. The exploitation
of hydro resources such as the Hongshui River, the middle and upper reaches of the Yangze
(Chang Jiang) River, the upper reaches of the Yellow River, the middle and lower reaches
of the Lancang River and the Wujiang River have added more than 2GW of annually installed
capacity of small hydro power. The installed capacity of hydropower in China is now expected
to reach 180 GW by 2010, and the exploitation rate of hydropower will be 33 per cent. From
2010 to 2020, newly installed middle and large scale hydropower will be around 110 GW. Mini
hydropower and small scale hydropower will continue expanding at an annual rate of 2 GW.
Total installed capacity of small scale hydropower will reach 260 GW by 2020, with an
exploitation rate of more than 56 per cent. By 2030, the exploitation of hydropower will
approach its upper limit (70 per cent) and total installed capacity will be around 300 GW.
Newly installed hydropower between 2004 and 2030 is expected to be approximately
equivalent to 82 Mtoe.
Natural gas
The total verified geological reserves of natural gas in China are expected to reach
around 1012 m3 by 2020. The domestic production of natural gas will rise to 80-100 Gm3 by
2010 and to 120-150 Gm3 by 2020. The consumption of natural gas in China in 2004 is 39
Gm3, accounting for 2.6 per cent of total primary energy consumption. As the world average
percentage is 24.2 per cent, the Chinese value is less than 10 per cent of the world average
and 25 per cent of the average in the Asia Pacific region. In recent years, natural gas has been
the fastest growing energy form, with annual growth as high as 14 per cent.
Industry currently accounts for the largest share of natural gas consumption in China
(78 per cent). The main industrial use of natural gas is for chemical materials. The second
largest consumer is the transport sector, accounting for about 20 per cent of China’s gas
consumption. On the basis of the availability of natural reserves, natural gas consumption is
expected to increase significantly. The main uses are expected to diversify, with electricity
generation, the building sector and the chemical materials sector being the major sources
of demand.

54 STRATEGIES FOR MANAGEMENT OF THE ENVIRONMENTAL IMPACT OF ENERGY CONSUMPTION IN CHINA
Asia Pacific Economic Papers
Nuclear power
China started the construction of nuclear power plants in 1985. By 2004, the total
installed capacity of nuclear power was 6.84 GW. This accounted for just 1.6 per cent of
China’s total installed capacity in 2004, with 2.36 per cent of total electricity generation
coming from nuclear plants. By comparison, in 2000 the share of nuclear power in total power
generation in the world was 16 per cent; while in developed countries nuclear power
represents 20 per cent of total electricity generation. There is a still considerable potential
for the development of nuclear power in China. The Chinese government has included the
development of nuclear power in its national plan. The installed capacity of nuclear power is
projected to be 40 GW by 2020.
Coal mine methane
Coal mine methane (CMM) is an abundant resource in China and the exploitable
portion is estimated around 1012 m3. By the end of 2000, the annual drainage of CMM in
China was 820 Mm3. Most of the CMM was used in electricity generation, chemical
production (carbon black and fertiliser) and household fuel. Production of CMM in China
is projected to reach 10 Gm3 by 2010, 22 Gm3 by 2020, and 35 Gm3 by 2030. Between 2004
and 2030, CMM production is expected to expand by 35 Mtoe.
Technological strategies
Production technologies: clean and high efficiency coal
Regardless of efforts to increase the use of alternative fuels, coal will be a major part
of China’s energy future for many years. The total amount of coal consumption will continue
to rise, from about 2.1 billion tons per year in 2005 to 2.5 billion tons per year by 2020.
Making coal cheaper, cleaner and more efficient is essential for China’s long-term sustainable
development.
It is cheaper to produce energy using coal than using oil. The cost of producing a given
amount of energy from oil is 2-3 times that of coal on the international market; the difference
is even greater in the domestic market, where the price of oil is 4-6 times higher than that
of thermal coal in China, and that of natural gas 3-4 higher than that of thermal coal.
A variety of methods exist for making coal use cleaner and more efficient. Examples
are advanced coal processing technologies such as coal washing, coal shaping, coal blending
and coal water slurry; advanced coal conversion technologies such as circulating fluid bed
(CFB), pressured fluid bed combustion (PFBC) power generation, IGCC, coal gasifica-

XIULIAN HU AND KEJUN JIANG 55
No. 369, 2008
tion co- generation of energy, supercritical and ultra supercritical power generation;
technologies for converting coal to substitute oil and gas, such as coal liquefaction and coal
gasification technologies; and advanced high efficiency industry boilers and kilns and
household cooking ranges.
Developing and promoting clean and efficient coal technologies and increasing their
share in relevant industries will improve the energy and economic efficiency of coal use;
increase the share of coal being directly converted to electricity and the conversion
efficiency; reduce the direct consumption of coal in end use sectors; optimise the final
energy consumption structure; and reduce pollutant and GHGs discharged from relevant
equipment.
Below we discuss some of these issues as they apply to final energy use.
Final energy use technologies: advanced and high efficiency
Key industries
Iron and Steel Industry
China should speed up the replacement of out-of-date processing equipment and
enhance energy consumption standards for new buildings and for retrofitting and expansion
projects. It should employ large advanced technical equipment, and production processing
characterised by being systematic, continuous, integrated and highly efficient, so as to
maximise the utilisation of various energies and resources. Large iron and steel enterprises
equipped with coke ovens should install coke dry quenching facilities; large blast furnaces
should be equipped with furnace top pressure differential power generating equipment
(TRT); and steel producers should apply technologies such as continuous casting and
methods to preventing slag splashing in furnaces. Steel rolling systems should continue to
increase the use of continuous casting; they should also increase the use of single heating
processes to final production of continuous casting billets; increase the use of hot charge and
hot conveyance technology; and apply heat storage combustion technology. Producers
should use combustible gases such as blast furnace gas, coke oven gas and basic oxygen
furnace gas, and various steams, and should use self- sustained power stations to save energy
and reduce consumption.

56 STRATEGIES FOR MANAGEMENT OF THE ENVIRONMENTAL IMPACT OF ENERGY CONSUMPTION IN CHINA
Asia Pacific Economic Papers
Nonferrous Metals Industry
The use of large, efficient, energy saving equipment will increase the efficiency of
mining and ore dressing.
Copper smelting should be done using advanced oxygen enriched flash and oxygen
enriched bath smelting processes rather than traditional technologies such as reverberatory
furnaces, blast furnaces and electric furnaces; this will improve smelting intensity.
Alumina smelting should be done through technologies such as the ore dressing Bayer
process, with direct heating and melting technology gradually replaced.
The electrolytic aluminum smelting process should be done using large pre baking
electrolytic cells; within a specified period, self baking electrolytic cells should be discarded
and the small pre baking electrolytic cells should be gradually phased out.
Lead smelting should be done using the new lead smelting process of oxygen bottom
blowing and other technologies that involve direct lead smelting by oxygen; plants should
renew the sintering blast furnace process and eliminate the traditional primitive lead smelting
process.
Zinc smelting should be done using the new wet process rather than traditional primitive
zinc smelting processes.
Oil and Petrochemical Industry
In the exploitation of oil and natural gas, optimisation technology should be used for
the oil exploitation system; energy saving supplementary technology should be used for thick
oil hot exploitation; optimised operation technology should be used for the water filling
system; comprehensive energy saving technology should be used for oil and gas enclosed
collection and transmission; and recovery and reutilisation technology should be used for
discharged natural gas.
In the process of oil refining, China should improve equipment operation loading and
heat exchange efficiency, optimise operation and decrease processing loss. In the process of
ethylene production, China should optimise the raw material structure, retrofit ethylene
cracking furnaces with advanced technology, optimise quenching system operation, strengthen
facilities management and decrease energy consumption in the process of non production.
It should also replace fuel oil (light oil) with clean coal, natural gas and high sulphur petroleum
coke; promote circulating fluidised bed boiler technology and petroleum coke gasifying
combustion technology; and recover and reuse residual heat and geothermal energy through
the use of energy optimisation technologies, heavy oil emulsification, high efficiency burners
and absorption heat pumps.

XIULIAN HU AND KEJUN JIANG 57
No. 369, 2008
Chemical Industry
Large-scale synthetic ammonia plants should use advanced energy saving technical
processes, new catalysts and high-efficiency energy saving equipment, so as to enhance
conversion efficiency and the recovery and reuse of residual heat. China should promote the
use of technology to recover residual heat from flue gas in one-section furnaces for gas-based
synthetic ammonia, and renovate its steam system. It should accelerate the retrofitting of
measures to replace fuel oil with clean coal or natural gas for oil based synthetic ammonia.
It should apply energy saving equipment and variable pressure adsorption recovery
technology to medium- and small-scale synthetic ammonia production processes, so as to
reduce energy consumption. Coal gas production should increasingly involve the use of
coal water slurry or advanced pulverised coal gasification technology to replace traditional
fixed bed coal gasification technology.
In the production of caustic soda, China should gradually eliminate the graphite
anode diaphragm process and should increase the use of the ion membrane method.
In the production of soda ash, China should discontinue the use of energy intensive
equipment and replace it with large scale and automatic equipment.
Building Materials Industry
The cement industry should use the new dry-process kiln with precalcinator technol-
ogy; increase the percentage of the new dry-process cement clinker; promote energy efficient
grinding equipment and power generating technology by using residual heat recovered from
cement kiln; improve the performance of existing large and medium sized rotary kilns, mills
and drying machines for the purpose of energy conservation; gradually phase out mechanised
vertical kilns, wet process kilns, long dry process kilns and other outdated cement production
technologies.
In the glass industry, China should develop advanced float processes; eliminate
outdated Fourcault and Colburn processes; promote technologies of overall heat insulation
for furnace and kiln and enriched oxygen and full oxygen combustion.
The architectural ceramics industry should discard outdated kilns such as downdraft
kilns, pushed slab kilns and multi-hole kilns; promote roller kiln technology; and improve
combustion systems. The sanitary ceramics industry should move to clean gas fuel so as to
apply sagger free burning technology. China should encourage the use of new wall materials,
thermal insulation material, sound insulation material, waterproof material and sealing
material that are of high quality, offer environmental protection and are energy efficient. It
should also increase the use of high performance concrete.

58 STRATEGIES FOR MANAGEMENT OF THE ENVIRONMENTAL IMPACT OF ENERGY CONSUMPTION IN CHINA
Asia Pacific Economic Papers
Transportation
Road transport
China should speed up its push to eliminate old energy intensive automobiles and
it should develop diesel automobiles, large tonnage automobiles and special vehicles. It
should promote the use of vans and special transport vehicles such as container vehicles,
and should improve road quality. It should accelerate progress in the development of
transport enterprises and improve the organisational structure of China’s transport systems
People should be discouraged from operating single vehicles without loads and encour-
aged to improve transport efficiency.
Newly Added Motor Vehicles
Experience in the United States, Japan and European countries suggests that the
most economic and effective measure to reduce the oil consumption of motor driven
vehicles is to formulate and implement fuel oil economy standards for motor vehicles and
related measures such as vehicle fuel oil taxes. In this way, automotive manufacturers can
be encouraged to improve technology, reduce oil consumption, increase fuel oil economy
and encourage consumers to purchase cars with relatively low oil requirements.
Urban Transportation
China should accelerate the development of public transport such as rail and improve
the efficiency of integrated traffic and transport systems. In China’s large cities, improving
public road transport (such as busses) should be a priority, with rail transit as an auxiliary
method, private motor vehicle transport a supplementary method and bicycle transport
encouraged. In China’s medium and small cities, public road transport and private vehicle
transport shoud be the main development direction.
Construction, commercial and residential building
Buildings
During the period of the Eleventh Five year Plan, new buildings should be strictly
required to meet the design standard of 50 per cent energy conservation. Major cities such
as Beijing and Tianjin should take a lead in implementing the 65 per cent energy saving
standard. There should be full-scale reform of the heat supply system. In large and medium
sized cities, a charge system based on thermal meter will be widely spread in district heating

XIULIAN HU AND KEJUN JIANG 59
No. 369, 2008
of residential and public buildings; small cities will be used as a pilot program. As urban
reconstruction is carried out, residential and public buildings should be retrofitted to make
them more energy efficient. The target is for a 25 per cent improvement in the energy
efficiency of large cities, 15 per cent in medium cities and 10 per cent in small cities. The
government will promote the use of cold storage air conditioners, heat storage air conditioners
and cold heat electricity cogeneration technology. People will be encouraged to use
centralised air conditioning systems with variable frequency speed adjustable technology for
fans and pumps; and to use energy saving doors and windows and new wall materials. In
addition, we should speed up application of renewable energy such as solar and geothermal
energies in buildings.
Household and Office Electric Appliances
China should promote the use of energy efficient household and office electric
appliances such as refrigerators, air conditioners, televisions and washing machines; reduce
energy consumption through standby; implement energy efficiency standards and labelling;
and standardise the market for energy saving products.
Lighting Appliances
China should promote the use of high efficiency fluorescent lamp products such as
phosphorus energy saving lamps and high intensity gas discharge lamps. It should encourage
people to decrease the use of incandescent lamps, gradually eliminate high pressure mercury
vapor lamps, introduce and enforce a standard for energy efficient lighting products and
increase the use of energy efficient saving fluorescent lamps.
Advanced and efficient pollution control and treatment technologies
Pollution reduction technologies are a critical part of any comprehensive strategy to
mitigate the environmental impact of energy consumption. Pollution can be captured either
pre or post combustion, however a comprehensive approach to developing mitigation
technologies should include both.
Pre-combustion pollution control technologies
Coal blending technologies is a key pre combustion pollution control technology. The
basic principle of coal blending is to manufacture environmentally friendly, high quality and
homogenous coal that is most required by markets from low cost coal. The blended coal will
obviously improve the combustion efficiency of boilers, improve the economy benefit of end
users such as power plants and steel plants and help them meet environmental standards.

60 STRATEGIES FOR MANAGEMENT OF THE ENVIRONMENTAL IMPACT OF ENERGY CONSUMPTION IN CHINA
Asia Pacific Economic Papers
The first phase of the biggest coal blending center (CBF project) has been fully
initiated in China. Gaining support from enterprises, the CBF project will help complete
the coal supply chain in China and improve the coal utilisation efficiency, reduce loss and
reduce environmental pollution. In the first phase of this project four coal blending centers
will be established in June 2006. The expected construction period is 10 months. After
completion, the center will be capable of processing 40 Mton of coal each year. By 2010
China expects to have completed 16 such centers.
Post-combustion pollution control technologies
The main combustion or post combustion pollution control technologies include:
CFB boiler combustion, limestone plaster methods, simple wet method, rotate spraying
method, LIFAC (Limestone Injection into the Furnace and Activation of Calcium Oxide),
electronic beam method and new ammonia desulphurisation. The relevant departments
of Chinese government have formulated incentive policies directed at the consumers of
desulphurisation technologies and sectors for studying and manufacturing desulphurisation
equipments to actively support the demonstration projects of localisation of flue gas
desulphurisation technologies (including mature ones and new ones) to promote the
localisation process of desulphurisation technologies in China. They also provide support
for the manufacture and supply of desulphurisation equipments and establish the quality
standards and technology criterions for the processing and installation of desulphurisation
equipments and components; train and give support to the competitive desulphurisation
companies to improve their abilities to undertake all the activities to deliver a complete
project, including system design, complete set of equipments, construction, installation,
adjustment and management; strengthen the regulation of bidding and introduce the
market incentive mechanisms; and establish supportive policies for promoting the
localisation of flue gas desulphurisation in power plants including loans, tax deductions,
electricity deployment, and electricity price subsidies.
Market strategies
Implementing economic incentive policies in favor of energy saving and environ-
mental protection, including the energy tax and carbon tax, subsidies to consumers,
establishment of technological, environmental and emission standards, etc.
Key sectors such as thermal power, steel, electrolytic aluminum and cement
producers should be required to obtain permission to emit pollutants. In particular, the
allowable total discharge amount and reduction amount of main pollutants should be
clarified for key enterprises. This can be done in four main ways. First, companies can be
required to install in-site monitoring equipment and this can be enforced through strict
XIULIAN HU AND KEJUN JIANG 61
No. 369, 2008
supervision and management. Second, enterprises that violate pollution standards can be
asked to treat the pollution in a given time frame, during which production and pollution
will be limited. Third, if enterprises still cannot meet requirements, local governments can
fine them and stop their production.
Governments should make full use of special funds for environmental protection.
They can do this in seven main ways. First, they should promote air pollution control
projects, particularly those focused on the control of coal fired pollution. Second, they can
prohibit the combustion of high pollution fuels in certain areas. Third, they can prohibit
the the use of equipment that burns high pollution fuels. Fourth, they can encourage
people to use clean energy rather than coal. Fifth, they can encourage urbanisation and
reduce coal combustion in cities. Sixth, they can limit the use of high sulphur coal,
accelerating improvements in urban air quality.
In addition, they can require or encourage existing thermal power plants to
internalise desulphurisation costs by including them in the grid electricity price., They can
provide price deductions for environmental protection measures in power generation. To
reduce SO2 pollution, they can introduce fees for those producing emissions, encourage
those who carry out desulphurisation; and use funds from national debt and pollution fees
to subside key desulphurisation projects.
The Administration Rules for Collection and Utilisation of Pollution Fees introduce
a system for charging for the total discharge of pollutants and new charging criteria. In the
future, the range of charges for pollutant discharge will be expanded and the criteria for
charging for SO2 pollution will be gradually increased until the charges equal or surpass the
pollution treatment costs. This will encourage enterprises to take initiatives to mitigate
pollution. The pollution fee will be listed in the fiscal budget and included in special funds for
environmental protection.
The vehicle fuel tax is a kind of energy tax system adopted in many countries. With
China’s oil demand and transport energy use growing rapidly, the adoption of a vehicle fuel
tax will have a positive impact in guiding the behaviour of people using transport, encouraging
the development of advanced traffic technologies and limiting the fast growth of energy
demand for vehicles.
International experience suggests that a carbon levy will promote the development of
new industries—for example, clean coal technology using carbon removal and carbon storage
methods; renewable energy industries; nuclear power generation; and energy saving
technology.
The fiscal and tax policies to promote energy saving should be introduced as soon as
possible. A vehicle fuel tax and environmental tax could be considered for the short term and
a carbon tax and energy tax for the long term. Economic incentives and fiscal and tax policies

62 STRATEGIES FOR MANAGEMENT OF THE ENVIRONMENTAL IMPACT OF ENERGY CONSUMPTION IN CHINA
Asia Pacific Economic Papers
will be very important saving energy in end use sectors such as industry, building and
transportation.
Results of policy options for pollutants and CO2 emission mitigationsimulation
The impact of energy use on the environment could be the continuous of existing policy
options, with much more efforts. Table 3.4 lists policy options could be used in both short
term and long-term. Technologies are also identified in IPAC modeling study for energy
conservation, new and renewable energy, for clean energy future. Table 3.5 presents the
technologies available for near future on energy conservation.
Table 3.4 Policy options for pollutants and carbon emission mitigation
Policy Related measures
Incentive policy for investment on preferential duty/subsidiesenergy efficiency improvement low or no interest loan
information publicationregistered trademark/standardinvestment on public transport systemvoluntary compliance agreement
Energy tax gasoline/kerosene tax as one component of “green tax” system
Market share policy on energy end preferential duty/subsidies on natural gas or biofueluse emission standard establishment
Incentives for application of high engineering standard and emission standardperformance gas turbine combined institutional reformcycle (CC) technologies and R&D grantsadvanced clean coal (ACC) additional investmenttechnologies in power generation
Enhancing the share of nuclear engineering standard and emission standardpower and renewable energy (such implementation of renewable energy quota systemas solar energy and wind power) in energy institutional reformpower generation R&D grants
additional investment and constitution of financing mechanism
Accelerating the application of biofuel R&D grantduty free/subsidies on end userslow or no interest loanimplementation of renewable energy quota system
Charge of carbon tax imposing carbon tax on fuel use by every industrial sector

XIULIAN HU AND KEJUN JIANG 63
No. 369, 2008
Incentives for power generation R&D grantfrom new energy sources or low or no interest loanrenewable energy sources (such as high return rate guarantee for electricity feeded insolar energy, wind energy, small national power gridhydropower, biomass, etc.) institutional reform
Initiating international cooperation bilateral and multilateral cooperationon natual gas development and strengthening the development and utilisation ofutilisation natural gas
Table 3.5 Technologies contributing to pollutant and GHG emission reduction in shortand medium term
Sector Technologies
Steel Industry Large size equipment (Coke Oven, Blast furnace, Basic oxygen furnace,etc.), Equipment of coke dry quenching, Continuous casting machine,TRT,Continuous rolling machine, Equipment of coke oven gas, OH gasand BOF gas recovery , DC electric arc furnace
Chemical Industry Large size equipment for Chemical Production, Waste Heat RecoverSystem, Ion membrane technology, Existing Technology Improving
Paper Making Co generation System, facilities of residue heat utilisation, Black liquorrecovery system, Continuous distillation system
Textile Co generation System, Shuttleless loom, High Speed Printing andDyeing
Non ferrous metal Reverberator furnace, Waste Heat Recover System, QSL for lead and zincproduction
Building Materials dry process rotary kiln with pre calciner, Electric power generator withresidue heat, Colburn process, Hoffman kiln, Tunnel kiln
Machinery High speed cutting, Electric hydraulic hammer, Heat PreservationFurnace
Residential Cooking by gas, Centralised Space Heating System, Energy SavingElectric Appliance, High Efficient Lighting
Service Centralised Space Heating System, Centralised Cooling Heating System,Co generation System, Energy Saving Electric Appliance, High EfficientLighting
Transport Diesel truck, Low Energy Use Car, Electric Car, Natural Gas Car,Electric Railway Locomotives
Common Use Technology High Efficiency Boiler, FCB Technology, High Efficiency ElectricMotorSpeed Adjustable Motor, Centrifugal Electric Fun, Energy SavingLighting
Power generation Supercritical coal fired generating units, natural gas integrated combinedcycle generating units, nuclear power generating units, hydroelectricpower generating, new energy power generating, •integrated coalgasification combined cycle (IGCC) power generating
General purpose technology high efficiency boiler•fluidised bed boiler•high efficiencyelectromotor•frequency adjustment electromotor•centrifugal fan•highefficiency lighting
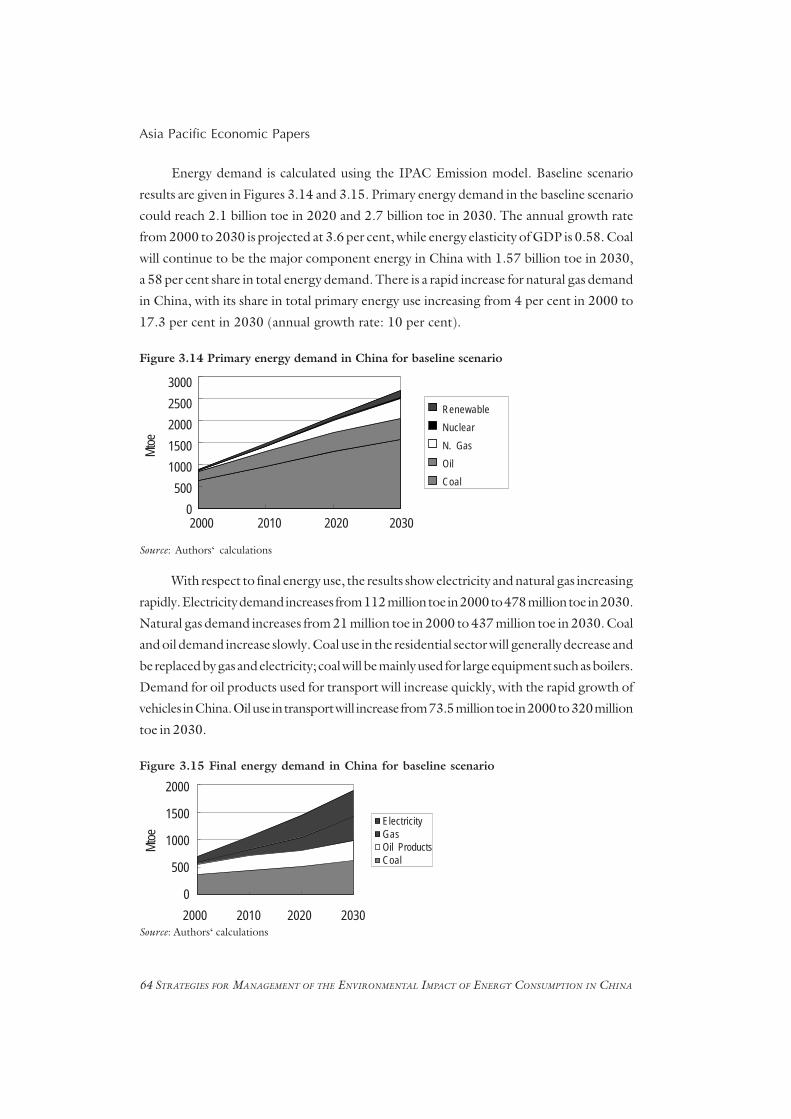
64 STRATEGIES FOR MANAGEMENT OF THE ENVIRONMENTAL IMPACT OF ENERGY CONSUMPTION IN CHINA
Asia Pacific Economic Papers
Energy demand is calculated using the IPAC Emission model. Baseline scenario
results are given in Figures 3.14 and 3.15. Primary energy demand in the baseline scenario
could reach 2.1 billion toe in 2020 and 2.7 billion toe in 2030. The annual growth rate
from 2000 to 2030 is projected at 3.6 per cent, while energy elasticity of GDP is 0.58. Coal
will continue to be the major component energy in China with 1.57 billion toe in 2030,
a 58 per cent share in total energy demand. There is a rapid increase for natural gas demand
in China, with its share in total primary energy use increasing from 4 per cent in 2000 to
17.3 per cent in 2030 (annual growth rate: 10 per cent).
Figure 3.14 Primary energy demand in China for baseline scenario
Source: Authors‘ calculations
With respect to final energy use, the results show electricity and natural gas increasing
rapidly. Electricity demand increases from 112 million toe in 2000 to 478 million toe in 2030.
Natural gas demand increases from 21 million toe in 2000 to 437 million toe in 2030. Coal
and oil demand increase slowly. Coal use in the residential sector will generally decrease and
be replaced by gas and electricity; coal will be mainly used for large equipment such as boilers.
Demand for oil products used for transport will increase quickly, with the rapid growth of
vehicles in China. Oil use in transport will increase from 73.5 million toe in 2000 to 320 million
toe in 2030.
Figure 3.15 Final energy demand in China for baseline scenario
Source: Authors‘ calculations
2000
1500
1000
500
02000 2010 2020 2030
ElectricityGasOil ProductsCoal
Mtoe
30002500200015001000
50002000 2010 2020 2030
RenewableNuclearN. GasOilCoal
Mtoe

XIULIAN HU AND KEJUN JIANG 65
No. 369, 2008
2500
2000
1500
1000
500
020302000 2010 2020
ElectricityGasOil ProductsCoal
3000
2500
2000
1500
1000
500
02000 2010 2020 2030
RenewableNuclearN.GasOIlCoal
By assuming the adoption of energy and environmental policy measures, the policy
scenario results are described in Figures 3.16 and 3.17. Compared to the baseline scenario,
there is nearly 172 million toe energy demand lower in 2020, 200 million toe in 2030. By
exploring the policy options, we found there is significant pressure to apply these policy
options in order to reach the lower energy demand scenario. The policy options are also
time sensitive, needing to be introduced early due to the long life span of energy
technologies.
Figure 3.16 Primary energy demand in policy scenario
Source: Authors' calculations
Figure 3.17 Final energy demand in policy scenario
Source: Authors‘ calculations
With the calculation of energy demand, several pollutant emissions were calculated.
Figure 3.18 to 3.21 give SO2, NOx, TSP and CO2 emissions from energy activities. SO2
emissions will keep increasing before 2010 with the rapid increase of coal use in China.
After 2010, more and more desulphurisation technologies will be used and therefore SO2
emissions will depart from fossil fuel use. Compared with the high demand scenario, SO2
emissions for the baseline scenario in 2010 will be 4.5 million tons lower, but still increase
by 9.45 million ton from 2000. Because of lack of policy to controls emissions of NOx, and
TSP continue to rise. This will provide a considerable challenge for the government
targets.

66 STRATEGIES FOR MANAGEMENT OF THE ENVIRONMENTAL IMPACT OF ENERGY CONSUMPTION IN CHINA
Asia Pacific Economic Papers
Figure 3.18 SO2 emissions in China
Source: Authors‘ calculations
Figure 3.19 NOx emissions in China
Source: Authors‘ calculations
Figure 3.20 TSP emissions in China
Source: Authors‘ calculations
Figure 3.21 CO2 Emissions in China
Source: Authors‘ calculations
0
5
10
15
20
25
30
1990 2000 2010 2020 2030 2040
Mill
ion
t-NO
2
BaselineHigh DemandPolicy
0112233445
1990 2000 2010 2020 2030 2040
Mill
ion
ton
BaselineHigh DemandPolicy
05
10152025303540
1990 2010 2030 2050
Mill
ion
t-S BaselineHigh DemandPolicy
0.0
0.5
1.0
1.5
2.0
2.5
1990 2000 2010 2020 2030 2040
Bill
ion
t-C BaselineHigh DemandPolicy

XIULIAN HU AND KEJUN JIANG 67
No. 369, 2008
In this study, the IPAC model also was used to analyse the effects of energy fiscal
policies. The results are described in Figures 3.22 and 3.23. This analysis shows the use
of an energy tax would have a significant impact on energy use. By 2010 with a tax rate
of 50 yuan/tce, energy demand will decrease 6.3 per cent, around 123 million tce,
compared with baseline scenario. By 2030 with tax rate 120 yuan/tce, energy demand will
decrease 16.2 per cent, around 400 million tce.
Levy of vehicle fuel tax could have strong impact on fuel demand in road transport.
By 2010 with tax rate 2.7 yuan/litre gasoline, energy demand for vehicles will decrease
10.3 per cent, around 16 million ton oil, compared with baseline scenario. By 2030 with
tax rate 4.6 yuan/litre gasoline, energy demand will decrease 20 per cent, around 90
million ton oil. Vehicle fuel tax is commonly used in developed countries with valuable
experience. Seeing rapid increase of oil demand and vehicle fuel demand in China, use of
vehicle fuel tax could have very active effects. Properly use of fiscal policies on energy could
guide public consumption preference, promote clean and new vehicle technology
development. Vehicle fuel tax is such kind of policy option and could have good effects.
Such policies would have some negative impact on GDP, but the impact is limited.
In 2010, loss would be 0.4 per cent and 0.36 per cent in 2030. The main reason is the
reduction of output from energy industries due to energy saving, and impact on other
sectors due to energy price increase. But this modeling study did not fully reflect the impact
of reduced energy import, and new economic activities due to more investment on other
new sectors. If these factors could be considered, the negative impact on GDP develop-
ment could be abated. In the meantime, such a GDP loss could not be reflected in change
of GDP growth rate. And more importantly, the green GDP concept could further abate
the negative impact.
Figure 3.22 Impact of carbon tax on energy demand
Source: Authors calculations
0
500
1000
1500
2000
2500
3000
3500
4000
2000 2010 2020 2030
Mtc
e Baseline
Energy Tax

68 STRATEGIES FOR MANAGEMENT OF THE ENVIRONMENTAL IMPACT OF ENERGY CONSUMPTION IN CHINA
Asia Pacific Economic Papers
Figure 3.23 Impact of vehicle fuel tax on energy demand
Source: Authors‘ calculations
Conclusion
It is clear that energy development in China already has considerable impact on local
environmental issues such as air pollution, water pollution, land damage and toxic material
emissions. Energy policies are partially driven by environmental pressures, as experienced in
developed countries. This trend will continue and is expected to intensify as issues such as
climate change become more concerning. In order to reach sustainable development targets,
there is a need for well-developed policies for China’s clean energy future. These will require
the integration of energy development and environmental policies design with economic
policies on issues such as industry development and international trade.
Thermal power generation, energy intensive industries, buildings and transport are
major sources of pollutants and greenhouse emissions; this situation is likely to continue for
the next 20 years. However, they can be reduced or abated through measures such as the use
of energy supplies from a variety of sources, a better energy mix, increased energy efficiency
and wider diffusion of clean coal and pollution control technologies.
China’s energy development strategy places a high priority on greater energy efficiency
and energy conservation and the efficient and clean use of coal and other fossil energy sources.
The development of clean coal technology will improve the efficiency of coal use, reduce
environmental pollution and promote economic development. If China is to achieve a low
emission development path, its energy policies must encourage the development of
technology to promote efficient energy use and clean technology.
NOx emissions will continue to grow with increasing economic activity. China should
follow the example of developed countries in controlling NOx emissions by including them
as a package for a national mitigation strategy in response to climate change and to support
local sustainable development.
These energy related fiscal policy options are very important for China. Recently,
there have been wide discussions on the use of vehicle fuel taxes. These discussions provide
0500
100015002000
2500300035004000
2000 2010 2020 2030
Mtc
e Baseline
Carbon Tax
XIULIAN HU AND KEJUN JIANG 69
No. 369, 2008
a solid basis for expanding energy tax policies. Carbon taxes have a strong effect on carbon
emissions and the optimisation of the energy system in China. Further, the impact of such
a policy on GDP is expected to be limited. Any negative impacts a carbon tax does have
are likely to be offset by the stimulation of new technologies and industries based on clean
coal technologies, new and renewable energy, energy services, and the upgrading of
technology in China, therefore promoting economic development.
The multi-source energy supply, improving energy mix, raising energy efficiency,
wide diffusion of clean coal technologies and pollution control technologies, making more
policies especially fiscal policies will contribute to reduce or abate pollutant and GHG
emissions.
References
China, National Bureau of Statistics, 1990-2006. China Statistical Yearbook 1990-2005, ChinaStatistical Press, Beijing
China, China Environmental Yearbook 1990-2005, China Environmental Sciences Press, 1990-2006, Beijing
China, China Power Yearbook 1990-2005, China Power Press, 1990-2006, BeijingChina, China Steel Yearbook 1990-2005, The Editorial Board of China Steel Yearbook, 1990-2006,
BeijingChina, National Development and Research Commission, 2005. China medium and Long Term
Energy Conservation Plan, National Development and Research Commission, Beijing.China, China Transportation Yearbook 1990-2005, China Transportation Publishing House,
Beijing.Hu X., 2005. Environmental problems existed in the power sector in China, China Energy,
2005No.12, Beijing——, and Jiang, K., 2000. Chinas iron and steel industry A study on technology transfer to mitigate
greenhouse gas emission, Asia Pacific Tech Monitor, March- April.——, 2001. GHG Mitigation Technology Assessment, China Environmental Sciences Publishing
House, Beijing (in Chinese).
HuX., LiuQ., and Jiang, K., 2007. Sectoral technological potentials to mitigate carbon emissionin China, Sino-Global Energy, 12 (4) August.
Huang, Y.H., 2005. Leveraging the Chinese Tax System to Promote Clean, Fuel Efficient VehicleDevelopment, Presentation to the Clean Air Initiative for Asian Cities for the ChinaAutomobile Technology & Research Center, 22 October 2005, Beijing.
Jiang, K., and Hu, X., 2005. Emission scenario of non CO2 gases from energy activities and othersources in China, 0Science in China0Ser. C Life Sciences 2005 Vol.48 No.1 1—10
——, 2006a. ‘Energy Demand and emissions in 2030 in China: scenarios policy options‘,Environmental Economics and Policy Studies, 7(3), Japan
——, 2006b. Energy Tax and Carbon Tax for the Mid and Long term, Economic Science Press,Beijing (in Chinese).
Li, J., Song, Y., Hu, X., 2004. ‘A Renewable Energy Development Plan and Strategy forChina‘EETIC Infopoint, IEA/OECD UK Issue 3/2004 (November).
Liu, J. Ma, F. and Fang.L., 2002. China Sustainable Development Strategy, China AgriculturePublishing House, Beijing. (in Chinese)

70 STRATEGIES FOR MANAGEMENT OF THE ENVIRONMENTAL IMPACT OF ENERGY CONSUMPTION IN CHINA
Asia Pacific Economic Papers
Lu, Z., Zhao, Y., and Shen, Z., 2003. Whether China Can Become a Global Factory?(in Chinese),Economic Management Publishing House, Beijing.
Nakicenovic, N. and Swart, R. (eds), 2001. IPCC Special Report on Emissions Scenarios, for the UNEnvironment Programme and the World Meteorological Organisation, Cambridge Univer-sity Press, UK.
Streets, D., Jiang, K., Hu, X., Sinton, J., Zhang, X., Xu, D., Jacobson, M. and Hansen, J., 2001.‘Recent Reductions in Chinas Greenhouse Gas Emissions’, Policy Forum: Climate Change,Science,vol. 294 (30 November). Available at:http://china.lbl.gov/publications/streets_et_al_science-301101.pdf
Notes
1 In this article, East Asia is defined to include China, Indonesia, Japan, Malaysia, Singapore, South Koreaand Thailand.

4 MANAGING THE ENVIRONMENTAL IMPACT OF EAST
ASIAN ENERGY USE
TONY BECK
Introduction
Unprecedented growth in energy demand in East Asia, especially China, presents unprec-
edented challenges of environmental management. The capacity to manage greenhouse gas
emissions from China probably holds the key to effective global greenhouse gas emission
management.
In this chapter two broad approaches are outlined. The first is a market-based
approach, represented by the Kyoto Protocol and its Clean Development Mechanism
(CDM). The second is a technology-focused plurilateral approach, represented by the Asia-
Pacific Partnership for Clean Development and Climate (AP6). Both are currently being
trialled and, to some extent, are competing to become the prime vehicle for ongoing global
emission abatement beyond Kyoto—that is, post-2012.
Early results from the market approach are positive, but questions remain about if and
how this approach can develop to provide the basis for an effective longer-term response. The
technology-focused approach is still in the early stages of implementation and it remains to
be seen if questions of incentives for technical innovation and deployment can be addressed.
Previous analysis (Beck and Gray 2005) indicates that, in meeting China’s growing
demand for energy, the future availability and price of coal are not likely to be serious issues
for China and it is likely to be possible to increase the imports of other fossil fuels. However,
the environmental impact of fossil fuel use is going to be an increasing concern. Local
environmental impacts will continue to be significant but can be addressed over time with
regulatory and technological advances, but the carbon dioxide (CO2) emissions from the
combustion of fossil fuel, especially coal, will remain an issue. China is the second largest
contributor to global energy related CO2 emissions after the United States. The annual
growth rate of Chinese emissions is projected to be 2.8 per cent, leading to China’s share of
global emissions increasing from 14 per cent to 19 per cent over the period to 2030.
Management of China’s emissions from fossil fuel use will therefore be critical to any
effective global emissions management regime. Atmospheric concentrations of greenhouse
gases are already 30 per cent above 18th century levels and projections by the International
Panel on Climate Change (IPCC) suggest that it will take a concerted global effort to contain
the increase in atmospheric concentrations to less than double 18th century levels (see
Figure 4.1).1

Asia Pacific Economic Papers
72 MANAGING THE ENVIRONMENTAL IMPACT OF EAST ASIAN ENERGY USE
Consequently, the unprecedented growth in energy demand in East Asia, especially
China, presents unprecedented challenges for environmental management. The capacity to
manage greenhouse gas emissions from China probably holds the key to effective global
emission management. However, whether this will ultimately prove possible is an open
question.
Market-based approach: Kyoto protocol and the clean developmentmechanism
The Kyoto Protocol came into force in February 2005 after more than 10 years of multilateral
negotiations. To date 175 countries have ratified the protocol, making it one of the best-
supported international treaties in history.
The protocol is essentially the framework for a cap-and-trade emissions trading scheme
for developed countries supported by a baseline-and-credit scheme for developing party
members. Developed country parties have accepted a legally binding target that they can meet
by domestic abatement, by trading amongst themselves, or by using emission credits
generated from emission abatement projects in developing country parties, through the CDM
or, in other developed country parties, through joint implementation (JI).2
The CDM uses a ‘baseline-and-credit’ approach whereby project proponents must
demonstrate that their projects reduce emissions below the level that would otherwise have
occurred. Approved projects earn tradable certified emission reduction (CER) units that can
CO
2 co
ncen
trat
ion
(ppm
)
Note: CO2 = carbon dioxide.Source: IPPC data, 2005: see <www.ipcc.ch>.
Figure 4.1 Atmospheric carbon dioxide concentrations

No. 369, 2008
TONY BECK 73
then be used to meet domestic targets. The CDM itself was conceived to help industrialised
countries to meet their Kyoto emission targets through investment in emission abating
projects in developing countries. It is also seen as a prime instrument for technology transfer
and capacity building. The effectiveness of the CDM is therefore a test of one of the
fundamental elements of the multilateral market approach.
Progress with the CDM. After a slow start the CDM has grown rapidly in terms of projects
approved and expected abatement achieved As of September 2007, around 800 projects have
been registered representing a total expected abatement of over 1000 megatons (Mt) of CO2
emissions by 2012. This represents a rapid growth in project approvals: at the end of 2005,
only around 140 activities were registered or being considered for registration.
Around 83 Mt of certified emission reductions have already been issued. The CDM
Executive Board recently announced that it expects to generate at least two billion tons of
emission reductions by the end of 2012 from around 2000 projects.3 This equates to 2 billion
tradable certified emission reduction units with a possible market value of more than $20
billion.
CDM in Asia
The significance of this scheme in Asia is demonstrated by the fact that over 50 per cent of
projects and over 60 per cent of projected certified emission reductions are in Asia. Host
countries are diverse but four countries have so far proven the most prospective in terms of
expected certified emission reduction generation. These are China, India, South Korea and
Brazil. Together they account for around 80 per cent of the expected certified emission
reductions from currently registered projects, with China alone accounting for over 40 per
cent (see Figure 4.4).
The wide range of project sizes means that the incidence of projects across host
countries (Figure 4.5) can differ markedly from the distribution of expected certified emission
reductions. This is particularly the case for China, which accounts for only 15 per cent of
projects (but over 40 per cent of certified emission reductions), and India, which accounts
for over 35 per cent of projects (but only 16 per cent of expected certified emission
reductions). China’s portfolio of registered projects includes several large industrial emission
reduction projects which generate large volumes of certified emission reduction s; the Indian
portfolio of projects includes more small-scale projects.
Energy sector focus. The CDM is particularly relevant to the energy sector, with energy-
related projects dominating the registered project list. However, significant numbers of
projects have also been approved in waste handling, agriculture, and manufacturing
industries.

Asia Pacific Economic Papers
74 MANAGING THE ENVIRONMENTAL IMPACT OF EAST ASIAN ENERGY USE
Figure 4.2 Expected average annual CERs from registered projects by host parties.
Source: CDM Executive Board, 2007; see <http://cdm.unfccc.int>.
Figure 4.3 Registered project activities by host parties
Source: CDM Executive Board, 2007; see <http://cdm.unfccc.int>.
Buyers. European and Japanese private entities dominated the buy-side of the market,
accounting for nearly 90 per cent of all transacted project emission reductions in the last three
years.
No. 369, 2008
TONY BECK 75
Developing country participation in CDM. The take-off in CDM activity has been
facilitated by the establishment of designated national authorities (DNAs) in each participat-
ing country to provide a one-stop shop for project proponents seeking information about
CDM potential, local regulatory requirements, government facilitation, and so on. To date
126 countries, including most in Asia, have established designated national authorities. These
include designated national authorities that have also been established in most (25) developed
country parties to provide support for their national companies in seeking and implementing
CDM project development and investment opportunities.
The recent World Bank survey of the global carbon market (World Bank 2006a) found
that developing countries have become engaged and active in promoting the CDM as they
have recognised the large potential of the market. Many CDM host countries have eased their
administrative processes for approval by the designated national authorities.
In China, the designated national authority is the Office of the National Coordination
Committee on Climate Change within the National Development and Reform Commission.
China has established and refined the guidelines to facilitate the smooth implementation of
CDM projects, and an effective official website has been established for access and
information.4 China has also demonstrated its commitment to support sustainable develop-
ment by announcing that it intends to reinvest significant proceeds from the sale of carbon
credits from hydrofluorocarbons and other gases to support renewable energy development
through the China Clean Development Mechanism Fund.5
Project management and technology transfer. With certified emission reduction sellers
increasingly bearing project registration risk, the primary concern of buyers has moved
downstream to project performance, issuance of certified emission reductions and delivery
into the buyer’s account. The World Bank (2006a:36) reports that in an effort to reduce
potential operational and performance risks, many buyers are becoming more actively
involved in the development of the project as a means to deal with technology risks, especially
the risks associated with the operational and commercial aspects of the technology used in
the project activity. For instance, they may offer extended assistance during the early stages
of the project or once it has started, participate in the operation and maintenance of the
project, or participate in the monitoring of the certified emission reduction data.
Some buyers invest in the underlying project itself, especially when the buyer is familiar
with the technology to be implemented (for instance, a multi-service energy company
developing renewable energy projects or a company selling catalyst incinerators for nitrous
oxide projects). These actions to hedge against technology risk can also create a closer tie
between buyers and sellers; this was a key element in recent successful negotiations.

Asia Pacific Economic Papers
76 MANAGING THE ENVIRONMENTAL IMPACT OF EAST ASIAN ENERGY USE
Technology-focused plurilateral cooperation
The Kyoto Protocol approach has been strongly criticised by some developed country
governments, principally the United States and Australia, mainly on the grounds that it does
not include binding emission targets for the major developing countries such as China and
India. This, they say, fails to address the growing proportion of global emissions being
generated by these developing countries while giving developing countries an unfair trade
advantage. Consequently, the United States and Australia have not ratified the protocol. In
April 2006 Australia’s Prime Minister, John Howard, stated the government’s position in
these terms:
Signing up to Kyoto is not going to help because China and America aren’t part of Kyoto in
the way that we would be. China is, but China doesn’t have any obligations and if we sign Kyoto
in its present form it would be more attractive for investment to leave Australia and go to China
or Indonesia. Now I’m not going to do that because that would export Australian jobs.6
Asia-Pacific partnership for clean development and climate. The Australian and US
concerns about the Kyoto Protocol have led to the launch of the AP6, an alternative plurilateral
approach to global emissions management involving six major emitting countries (Australia,
China, India, Japan, South Korea and the United States). Together these countries account
for around half of global emissions, population and income. The Australian Prime Minister
spelt out the rationale for the AP6 in April 2006:
You can’t do more on greenhouse gas until you get the biggest polluters in the world inside
the tent and the biggest polluters in the world are America and China. And one of the
advantages of this Asia Pacific Partnership which we put together is that it brings America
and China into contact with the process.7
The emphasis of the AP6 is on voluntary cooperation to develop and deploy low-
emission technology in order to make the achievement of significant abatement cuts less costly
in the long term. As set out in the AP6 Charter,8 its purposes are to:
• Create a voluntary, non-legally binding framework for international cooperation to facilitate
the development, diffusion, deployment, and transfer of existing, emerging and longer term
cost-effective, cleaner, more efficient technologies and practices among the Partners through
concrete and substantial cooperation so as to achieve practical results;
• Promote and create enabling environments to assist in such efforts;

No. 369, 2008
TONY BECK 77
• Facilitate attainment of our respective national pollution reduction, energy security and
climate change objectives; and
• Provide a forum for exploring the Partners’ respective policy approaches relevant to addressing
interlinked development, energy, environment, and climate change issues within the context
of clean development goals, and for sharing experiences in developing and implementing
respective national development and energy strategies.
The AP6 is organised through a Policy and Implementation Committee and an
Administrative Support Group.9 The Policy and Implementation Committee comprises
representatives from the partner countries and governs the overall framework, policies and
procedures of the partnership, will periodically review progress of collaboration, and will
provide direction to the Administrative Support Group. It will be responsible for managing
the implementation of the cooperative activities of the partnership, and for engaging
representatives of the private sector, as well as representatives of development banks, research
institutions, and other relevant governmental, intergovernmental and non-governmental
organisations, as appropriate. It will undertake activities in the promotion and creation of
enabling environments within partner economies and in support of partners’ efforts to meet
relevant national-level clean development objectives.
The Policy and Implementation Committee may form appropriate task forces and
other subgroups to assist it in its work. The Policy and Implementation Committee will meet
as often as is determined necessary by its members to accomplish its work, and may focus
its agenda on policy issues or technical issues, or both, as appropriate. Policy and
Implementation Committee decisions are to be made by consensus of the partners on the
committee.
Taskforces and action plans. The inaugural meeting of the AP6 was held in January 2006
in Sydney. It established some task forces and received initial pledges of funding (A$100
million over five years from Australia, and a proposed US$52 million from the United States).
The eight public private sector task forces cover cleaner fossil energy; renewable energy
and distributed generation; power generation and transmission; steel; aluminium; cement;
coal mining; and buildings and appliances. Each task force has formulated action plans
outlining both immediate and medium-term specific actions, including possible ‘flagship’
projects and relevant indicators of progress. The task forces were asked to:
• review the current status of their sector with regard to clean development and climate;
• share knowledge, experience and good practice examples of how industrial efficiency, energy
efficiency and environmental outcomes can be improved, including through valuable and
practical short-term actions;

Asia Pacific Economic Papers
78 MANAGING THE ENVIRONMENTAL IMPACT OF EAST ASIAN ENERGY USE
• identify specific opportunities for cooperation, including with relevant international financial
organisations such as the Asian Development Bank and the World Bank;
• define the current state of the technology in terms of cost, performance, market share and
barriers;
• identify cost and performance objectives and the actions needed to achieve these objectives;
and
• identify, wherever possible, ambitious and realistic goals.10
Discussion
Both the market-based and technology-based approaches to emission management are in the
early stages of implementation and have only just started to deal with the enormity of the
emissions management task ahead. The initial responses of governments and markets to the
CDM have been encouraging and this suggests that a market-based approach has good
potential as a basis for emission management in China and globally. Perhaps most telling in
this regard has been the response of capital markets.
Capital market response to CDM. The capacity of policies to generate a positive capital
market response will be critical to the success of effective emission management in China and
globally. Reducing climate change risk and promoting investment in clean energy systems is
a long-term venture requiring billions of dollars of annual investment. The World Bank and
International Monetary Fund estimate that about $40 billion annually of incremental capital
will be required for climate change mitigation in developing countries over the next two
decades.11 Only private capital markets have the capacity to generate enough long-term
resources to undertake the necessary scale of investment.
The World Bank (2006a), in its survey of the carbon market, found that the capital
markets had started to respond to CDM opportunities:
A growing number of companies successfully raised capital for those [CDM abatement project]
efforts through IPOs on the London Alternative Investment Market (AIM) or attracted hedge
fund capital to arbitrage between markets. Financial innovation thrived as a plethora of clever
carbon-based securities and hedge instruments became available to hedge carbon price risk
against price volatility in other commodity markets. Brokers, consultants, carbon procure-
ment funds, hedge fund managers and other buyers scoured the globe for opportunities to buy
credits associated with projects that reduce emissions in developing countries. Innovative
structures that managed both down-side and up-side carbon price risk and reduced delivery

No. 369, 2008
TONY BECK 79
risk began to emerge, which aligned purchases of carbon with an interest in the underlying
project, through equity, debt, mezzanine finance, technology or operating agreements. The
City of London developed as a sort of hub for many of these activities and a vibrant new climate
services industry developed.
Carbon funds have augmented this private market fund-raising activity. They are
usually established with contributions from both government and public sources, and invest
in abatement projects that can generate tradable credits through CDM and JI. Over 10 such
funds have been established, assembling over $5 billion for investment through the Kyoto
mechanisms.
AP6 potential. It is too early yet to judge how the AP6 will develop or how effective it will
be in abating emissions. Initial reaction has been mixed. Generally, it is seen as positive that
the development and transfer of new low-emission technologies is being encouraged, but the
level of funding and the lack of a commercial incentive for private sector involvement have
raised questions about its potential effectiveness. A number of commentators have pointed
out that an emissions trading scheme would probably provide a better incentive for necessary
R&D investment.
For example, a leading Australian economist and Reserve Bank of Australia director,
Professor Warwick McKibbin, warned that the AP6 was making a mistake by delaying a
carbon trading system. He indicated that ‘there is very little evidence that government
subsidies ever directly lead to breakthrough technology, with companies more likely to be
inspired by high prices for commodities’.12 The head of Global Renewables and chair of the
Australia Uranium Industry Taskforce, Dr John White, indicated that, while the AP6 meeting
should improve accountability and boost R&D, ‘proper pricing’ was the missing factor. Using
market instruments would lead to existing technologies being widely adopted while emerging
ones are ‘proved up’, he said.13
More recently Zhang (2006) compared the AP6 approach and that of the CDM. He
questioned the effectiveness of a voluntary scheme to deliver abatement on the scale required.
In particular, he questioned ‘the extent to which the Asia Pacific Partnership is going to
facilitate the transfers of low emission technologies, once they become available, to developing
partners like China and India, beyond what is already being achieved through the Kyoto
flexibility mechanisms like the clean development mechanism (CDM)’.
Zhang (2006) points out that such transfers require ‘some kind of market incentives,
given that most advanced technologies are commercially valuable and held by private
companies’. He says:

Asia Pacific Economic Papers
80 MANAGING THE ENVIRONMENTAL IMPACT OF EAST ASIAN ENERGY USE
‘It is true that the Asia Pacific Partnership views the private sector as critical to its efforts. But
for now at least, I do not see such market incentives there. Without such incentives,
governments can do little to ensure the transfers of these technologies to the scale we need
in order to have a real impact on the emissions of these two countries. This will undermine
the effectiveness of the APP.’
Technology development. One could also question what incentives and funding for
technology development the AP6 provide beyond that already being provided by the market
schemes currently in place, in particular the European Union Emission Trading Scheme (EU
ETS) and the CDM. As with Zhang’s technology transfer question, it is too early to make
a judgment, but some circumstantial evidence may be relevant with respect to carbon capture
and storage (CCS).
A key focus of the AP6 action plans is likely to be clean coal technologies – and carbon
capture and storage in particular. carbon capture and storage has rapidly emerged as a
technology that could achieve substantial emission reductions from fossil fuel fired power
stations and other large point sources. Potential geological sinks for CO2 are widespread
globally, including in China.
Re-injection of CO2 is already used to enhance oil recovery, but the first substantial
application of the technology in coal power generation is likely to be in conjunction with
integrated gasification combined cycle (IGCC) coal fired power stations, which can deliver
a relatively pure stream of CO2 for sequestration. The last two years has seen a significant
increase in the number of IGCC+ carbon capture and storage projects being proposed, and
this appears to be largely a result of the market incentives being offered under the EU ETS.
Of the 10 substantial (more than 200 megawatt) ‘zero emission’ stations that have been
publicly announced, eight are in Europe, one is in the United States and one is in Canada.
The CDM is also generating interest in carbon capture and storage technology. In
August 2005, Mitsubishi UFJ Securities submitted the White Tiger Oil Field carbon capture
and storage proposal to the CDM Executive Board. It involves the use of carbon capture and
storage to store CO2 from combined cycle natural gas power plants in Vietnam. A second
CDM proposal involving carbon capture and storage has also been received; it involves
sequestering the CO2 from a liquefied natural gas complex in Sarawak, Malaysia.
More generally, the World Bank (2006a) found:
‘The evidence from the market, documented in our report, is that price signals in the carbon
markets have stimulated innovation, especially in developing countries. A new urgency
enveloped business managers in developing countries last year who had an incentive to reduce
emissions.’

No. 369, 2008
TONY BECK 81
Beyond Kyoto
As a part of the Kyoto Protocol, the CDM has a finite time horizon of 2012. What form the
international policy regime will take after 2012 is the subject of multilateral negotiation under
the UN Framework Convention on Climate Change and is not likely to be resolved for several
years. This medium-term uncertainty is already an issue for investors in both developed and
developing countries.
To address this uncertainty for its member states and also declare its support for a
market based approach beyond Kyoto, the European Union has indicated that the EU ETS
will continue to 2020. It is also supportive of a continuing project-based mechanism involving
developing countries, but the ultimate outcome of international negotiations is uncertain.
In these negotiations the relationship between the abatement efforts required of
developed and developing countries remains a contentious issue. The conditions under which
the Kyoto Protocol’s differentiated commitments were adopted are clear. Developed
industrialised countries are largely responsible for the elevated levels of greenhouse gases in
the atmosphere today. Equity considerations dictated that those developed industrialised
countries should take the lead in abating emissions while helping to build capacity in
developing countries to do the same in the future. At the same time the CDM provided a
market incentive structure for developed countries to invest in abatement projects in
developing countries.
These conditions continue, but it is clear that if progress is to be made towards global
emission control, developing countries must be brought more effectively into the emission
management regime. Early experience with CDM would suggest that this would be best done
utilising market mechanisms and incentives, but developing countries are understandably
reluctant to accept inflexible binding targets.
Ward (2005) has looked at the role of emissions trading in future climate change policies
in the light of concerns about the existing Kyoto framework—in particular, wider participation
through greater flexibility of commitment forms and getting beyond the CDM project-based
model for developing countries. He concluded that a policy framework does not need to be
as constrained as the Kyoto Protocol in terms of how emission commitments are framed. He
suggested that it could be much more flexible, with a mix of the following:
• binding fixed emission limits for industrialised countries [potentially combined with price
caps]
• for industrialised countries not able to agree to the above, binding fixed or dynamic emission
limits for some sectors in some regional groupings—or possibly economy-wide binding
dynamic emission limits

Asia Pacific Economic Papers
82 MANAGING THE ENVIRONMENTAL IMPACT OF EAST ASIAN ENERGY USE
• binding transnational sectoral emission limits (fixed or dynamic) for some key sectors
represented by multinational ‘operators’ such as cement, steel and aluminium (with these
sources excluded from any national or regional emission limits)
• for developing countries, individually customised voluntary ‘no lose’ sectoral crediting
baselines in sectors for which these countries seek to attract major investment in clean
technology consistent with national sustainable development priorities, and for which [the
scope of] a project-based mechanism is inadequate
• a project-based crediting mechanism to provide coverage of emission reduction/sink en-
hancement activities not already covered by other market based mechanisms.
Conclusions
The management of the environmental impacts of East Asian energy use is an issue of global
significance. A market-based multilateral approach is being tested through the Kyoto
Protocol and the CDM and early responses appear encouraging in terms of both technical
innovation and capital market response. The question remains, however, whether the CDM
and other market mechanisms can evolve to provide the basis for an effective, comprehensive,
long-term policy regime beyond Kyoto.
The technology-focused plurilateral approach being promoted through the AP6 is still
in the early stages of development. There is no doubt that technology will play a fundamental
role in future emission abatement, and an ongoing R&D effort will be important. However,
we are yet to see whether the AP6 will stimulate additional technological innovation and, if
so, what incentive there will be for it to be deployed.
The need for deeper emission cuts beyond Kyoto brings these policy choices into a
situation where common ground must be found. New technology is needed but so is an
effective incentive mechanism for research, development and deployment, especially in
relation to developing countries. Few would dispute that ultimately market mechanisms need
to play a key role in future emission management. It remains a question of when and how.
Notes
1 Intergovernmental Panel on Climate Change (2005): <www.ipcc.ch>.
2 For more details see <www.unfccc.int>.
3 CDM Executive Board; see <http://cdm.unfccc.int>.

No. 369, 2008
TONY BECK 83
4 Clean Development Mechanism in China site: <http://cdm.ccchina.gov.cn/english/>.See also <http://info.worldbank.org/etools/ChinaCDM/>, which is supported by theWorld Bank.
5 See World Bank (2006a: 41).
6 Radio Interview, Radio 3AW, Melbourne, 7 April 2007.
7 Radio Interview, 3AW Melbourne, 7 April 2006.
8 Charter of the Asia-Pacific Partnership on Clean Development and Climate, Article 2,January 2006; see <www.dfat.gov.au/environment/climate/ap6/charter.html>.
9 See Charter of the Asia-Pacific Partnership on Clean Development and Climate, Article 4.
10 See <http://www.dfat.gov.au/environment/climate/ap6/work_plan.html>.11 See World Bank (2006b).
12 Australian, 14–15 January 2006.
13 Environment Business Australia Forum, 6 February 2006.
References
Asia Pacific Partnership on Clean Development and Climate, 2006. Charter available at <http://www.ap6.gov.au/>
Beck, A. and M. Gray, 2005. ‘International supplies of energy for China: developments andprospects’, Pacific Economic Papers, No. 361, Australia–Japan Research Centre, Canberra.
Ward, M., 2005. ‘Role of emission trading in future climate change policies’; see <www.ieta.org/ieta/www/pages/download.php?docID=1258>.
World Bank, 2006a. State and Trends in the Carbon Market: 2006, World Bank, Washington DC.——, 2006b. Clean Energy and Development: Towards an Investment Framework, Development
Committee (April), Washington DC.Zhang, Z.X., 2006. ‘Energy, environmental and climate issues in Asia’; Social Science Research
Network; available at <http://ssrn.com/abstracts=920756>.

Asia Pacific Economic Papers
84 MANAGING THE ENVIRONMENTAL IMPACT OF EAST ASIAN ENERGY USE

5 GROWTH, ENERGY USE AND GREENHOUSE GAS
EMISSIONS IN CHINA
WARWICK J. MCKIBBIN
Energy is a key issue for the Chinese economy, now and in future decades. The need for
expanding sources of energy as an input into a rapidly growing economy and the
environmental implications of rising energy use are well understood within China. Chinese
energy use is also becoming an increasingly important issue for the global economy because
of the scale of China’s energy requirements and because of the implications for global climate
change of quickly rising greenhouse emissions from China.
With roughly 20 per cent of the world’s population and economic growth in the range
of 10 per cent per annum, China is already having a significant impact on global energy
demand. By 2002, China was the world’s third largest energy producer and the second largest
energy consumer.1 Although China has large reserves of energy and rising capacity it shifted
from being a net energy exporter to a net energy importer in 1998 (Figure 5.1). This massive
increase in the use of energy has had important implications for local environmental problems
such as air quality, public health problems and local climate change. Energy generation and
its related emissions of sulphur dioxide from coal use, has caused local and regional problems
with acid rain.2 The large and growing emissions of greenhouse gases (particularly carbon
Figure 5.1 China’s total energy consumption and supply, 1980–2003 (quadrillion Btu)
10
20
30
40
50
1980 1983 1986 1989 1992 1995 1998 2001
Ene
rgy
cons
umpt
ion
and
supp
ly(q
uadr
illio
n B
tu)
Total primary energyconsumptionTotal primary energy production
Source: Energy Information Agency, 2006b. International Energy Outlook 2006, Department ofEnergy, Washington, DC.

Asia Pacific Economic Papers
86 GROWTH, ENERGY USE AND GREENHOUSE GAS EMISSIONS IN CHINA
Table 5.1 China’s share of global energy consumption and carbon dioxide emissions,1990–2030
1990 2002 2003 2010 2015 2020 2025 2030
Energy consumptionChina 7.8 10.3 10.8 15.1 16.3 17.4 18.3 19.3India 2.3 3.4 3.3 3.8 4.0 4.2 4.4 4.5Other non-OECD 33.1 29.9 30.2 30.8 31.8 32.5 33.1 33.4South Korea 1.1 2.0 2.0 2.1 2.2 2.2 2.2 2.1Japan 5.3 5.4 5.3 4.5 4.2 3.8 3.6 3.4United States 24.4 23.9 23.3 21.2 20.3 19.7 19.1 18.6Other OECD 26.1 25.2 25.0 22.5 21.3 20.2 19.4 18.7World total 100.0 100.0 100.0 100.0 100.0 100.0 100.0 100.0
CO2 emissionsChina 10.6 13.5 14.1 19.3 20.8 22.2 23.3 24.5India 2.7 4.2 4.1 4.5 4.7 4.9 5.0 5.0Other non-OECD 33.1 29.1 29.2 29.3 29.9 30.2 30.3 30.4South Korea 1.1 1.9 1.9 2.0 2.0 2.0 2.0 1.9Japan 4.8 4.9 4.8 4.0 3.6 3.3 3.0 2.8United States 23.5 23.6 23.2 21.0 20.0 19.4 18.9 18.6Other OECD 24.3 22.8 22.7 20.0 19.0 18.1 17.4 16.8World total 100.0 100.0 100.0 100.0 100.0 100.0 100.0 100.0
Source: Energy Information Agency, 2006b. International Energy Outlook 2006, Department of Energy,Washington DC.
dioxide emissions from burning coal) are a critical input into the global issue of climate
change.3
In 1990 China accounted for 7.8 per cent of world energy use, which was roughly 1.5
times the energy use of Japan and seven times that of South Korea (Table 5.1). By 2002,
China’s share of global energy use had risen to 10.3 per cent. The United States Energy
Information Administration predicts that by 2030, China will account for more than 19 per
cent of global energy use, or more than five times the energy use of Japan and nine times that
of South Korea. China is already the world’s largest coal producer, accounting for 28 per cent
of world coal production and 27 per cent of world coal consumption by 2002 (Table 5.2).
China’s share of world coal consumption is projected to rise to a massive 44 per cent by 2030
(Table 5.2), and at the time will be more than 2.5 times the coal consumption of the United
States. China’s share of world oil consumption in 1990 was 3.5 per cent, but it is projected
to rise to 12.7 per cent by 2030 (Table 5.2).
Until recently, the focus of policy in China has been on sustaining economic growth
and energy needs rather than the environmental consequences of rapid industrialisation. This

No. 369, 2008
WARWICK J. MCKIBBIN 87
is beginning to change as rising income levels in China make the environment a more
important issue and as environmental quality continues to deteriorate.
This chapter summarises the recent history of energy use in China and presents some
estimates of future projections of energy use. Although there is a range of environmental
issues associated with energy, this chapter focuses primarily on the emissions of carbon
dioxide—a critical driver of global climate change.4 Although economic growth is still a
priority in China, environmental policy is emerging as an important issue.5 Indeed, China has
shown a commitment to tackle local environmental problems with encouraging outcomes.6
For example, Jiang and McKibbin (2002) find that Chinese policy has been effective in
reducing environmental problems in a number of areas, relative to what otherwise would be
Table 5.2 China’s shares of global consumption of fossil fuel energy components,1990–2030 (per cent)
1990 2002 2003 2010 2015 2020 2025 2030
Coal consumptionChina 21.3 26.9 28.1 36.4 39.1 40.8 42.3 44.0India 4.9 8.2 7.9 8.4 8.8 9.0 8.8 8.4Other non-OECD 25.4 18.4 18.4 16.6 16.5 16.2 15.7 15.1South Korea 0.9 1.5 1.5 1.7 1.7 1.6 1.7 1.7Japan 2.4 3.3 3.2 2.5 2.3 2.0 1.8 1.6United States 17.2 20.3 20.1 17.7 16.4 16.1 16.7 16.9Other OECD 28.0 21.4 20.7 16.5 15.2 14.2 13.1 12.4World total 100.0 100.0 100.0 100.0 100.0 100.0 100.0 100.0
Oil consumptionChina 3.5 6.6 7.0 9.5 10.2 11.2 11.9 12.7India 1.8 2.9 2.9 3.2 3.4 3.6 3.7 3.8Other non-OECD 32.7 29.6 29.6 30.9 31.7 32.0 32.5 32.8South Korea 1.5 2.7 2.7 2.8 3.0 2.9 2.9 3.0Japan 7.8 7.0 7.0 5.9 5.6 5.2 5.0 4.6United States 25.5 25.2 25.1 24.2 23.9 23.8 23.6 23.4Other OECD 27.2 25.9 25.7 23.5 22.4 21.2 20.4 19.7World total 100.0 100.0 100.0 100.0 100.0 100.0 100.0 100.0
Natural gas consumptionChina 0.7 1.2 1.3 2.6 2.9 3.4 3.7 3.8India 0.5 1.0 1.0 1.3 1.3 1.5 1.9 2.5Other non-OECD 48.5 44.2 45.1 48.0 49.3 50.6 51.7 52.9South Korea 0.1 0.9 0.9 0.9 0.9 0.9 0.8 0.7Japan 2.6 3.1 3.2 2.7 2.6 2.4 2.2 2.1United States 26.2 24.9 23.4 20.1 19.3 17.9 16.3 14.8Other OECD 21.3 24.8 25.0 24.5 23.8 23.3 23.3 23.2World total 100.0 100.0 100.0 100.0 100.0 100.0 100.0 100.0
Source: Energy Information Agency, 2006b. International Energy Outlook 2006, Department of Energy,Washington DC.

Asia Pacific Economic Papers
88 GROWTH, ENERGY USE AND GREENHOUSE GAS EMISSIONS IN CHINA
the case. However, many environmental problems continue to worsen despite policy
intervention, due to other factors driven by strong economic growth.
The remainder of this chapter is structured as follows. The second section presents a
brief overview of energy use and carbon dioxide emissions in China. It also summarises
projections from the United States Energy Information Administration’s International
Energy Outlook (2006b) of energy use and carbon dioxide emissions in China until 2030. The
third section summarises the current policy debate on climate change and the implications for
future Chinese energy. The fourth section focuses on the sensitivity of projections of energy
use and carbon dioxide emissions to assumptions about the sources of economic growth. This
analysis is based on projections from the G-cubed multi-country model under different
assumptions about the sources of economic growth in China. Finally, the sensitivity of
projections to the price of carbon is assessed in the fifth section. A conclusion appears in the
final section. Appendix Table A5.1 summarises the G-cubed multi-country model that forms
the basis of some of the analysis in this paper.
Energy use and carbon dioxide emissions in China
History. The importance of China in world energy use and the projected increases in this
importance are summarised in Table 5.1. In 2003, China accounted for 10.8 per cent of world
energy use (compared with the United States at 23.3 per cent) and 14.1 per cent of global
carbon dioxide emissions from fossil fuel use (compared with the United States at 23.3 per
cent). Chinese GDP (in 2003) was estimated in PPP terms to be roughly 59 per cent of the
size of that of the United States.7 This implies that although carbon emissions per unit of
energy use are higher in China than in the United States, energy use per unit of GDP (in PPP
terms) is slightly lower in China than in the United States.
China has roughly 9.4 per cent of the world’s installed electricity generation capacity
(second only to the United States) and in the next three decades it is predicted to be responsible
for up to 25 per cent of the increase in global energy generation. China’s size and the
composition of its energy use, with a large reliance on coal, are reflected in carbon dioxide
emissions. China is estimated to have emitted 14.1 per cent of global carbon emissions from
fossil fuels in 2003 (second only to the United States in terms of individual countries) and this
share is projected to rise to 24.5 per cent by 2030 (Table 5.1). In an attempt to move away
from reliance on fossil fuels, China has plans for another 30 nuclear power plants in the next
two decades to supplement its nine existing nuclear reactors.8 It is estimated that China has
the largest hydroelectric capacity in the world (largely in the southwest of the country),
currently generating 20 per cent of Chinese electricity. The Three Gorges hydroelectric dam
on the Yangtze River will be the world’s largest power plant when completed about 2009. The

No. 369, 2008
WARWICK J. MCKIBBIN 89
National Development and Reform Commission (NDRC) approved the largest wind farm
in Asia in March 2005, to begin construction in 2006. There is projected to be a rapidly rising
share of nuclear energy and renewable energy (particularly hydro) in Chinese energy
production in coming years (Table 5.3). Despite the impressive scale of this expansion, the
emergence of renewable energy will dent only slightly the overall dominance of coal in the
foreseeable future in China, at least under current relative energy prices. The large rise in coal
as a source of primary energy implies that China will need to respond to a range of
environmental problems resulting from burning fossil fuels, including air quality (including
black carbon emissions), acid rain (from emissions of sulphur dioxide and nitrogen oxides)
and climate change (from carbon dioxide emissions).
Figure 5.1 gives another perspective on the recent history of energy production and
consumption in China. Energy demand and supply in China has been rising quickly—more
than doubling between 1980 and 1996. In 1998, Chinese energy consumption began to
outstrip production, with China becoming a net energy importer.
Table 5.3 Shares in global consumption of non-fossil fuel energy components, 1990–2030 (per cent)
1990 2002 2003 2010 2015 2020 2025 2030
Nuclear energy consumptionChina 0.0 1.0 1.7 2.9 4.4 5.5 7.1 9.2India 0.3 0.7 0.6 2.0 2.6 3.2 3.3 3.4Other non-OECD 14.0 12.8 13.1 13.5 15.0 17.0 18.3 17.5South Korea 2.6 4.4 4.9 5.2 6.0 6.4 6.7 7.2Japan 10.1 11.0 9.4 10.0 9.8 10.2 10.8 11.2United States 30.2 30.6 30.3 29.5 28.2 27.9 26.9 26.4Other OECD 42.7 39.5 40.1 36.8 34.0 29.8 36.8 25.0World total 100.0 100.0 100.0 100.0 100.0 100.0 100.0 100.0
Hydroelectricity and other renewable energy consumptionChina 4.9 8.7 8.9 13.5 13.8 13.4 12.6 12.2India 2.7 2.2 2.1 2.9 2.6 2.8 3.1 3.5Other non-OECD 31.6 34.5 35.5 35.8 38.1 39.5 41.5 43.1South Korea 0.0 0.0 0.3 0.4 0.6 0.6 0.5 0.5Japan 4.2 3.4 4.3 3.1 3.1 2.8 2.6 2.6United States 23.2 18.3 17.4 15.9 15.3 15.3 15.1 14.6Other OECD 33.1 32.9 31.2 28.5 26.5 25.6 24.6 23.6World total 100.0 100.0 100.0 100.0 100.0 100.0 100.0 100.0
Source: Energy Information Agency, 2006b. International Energy Outlook 2006, Department of Energy,Washington DC.
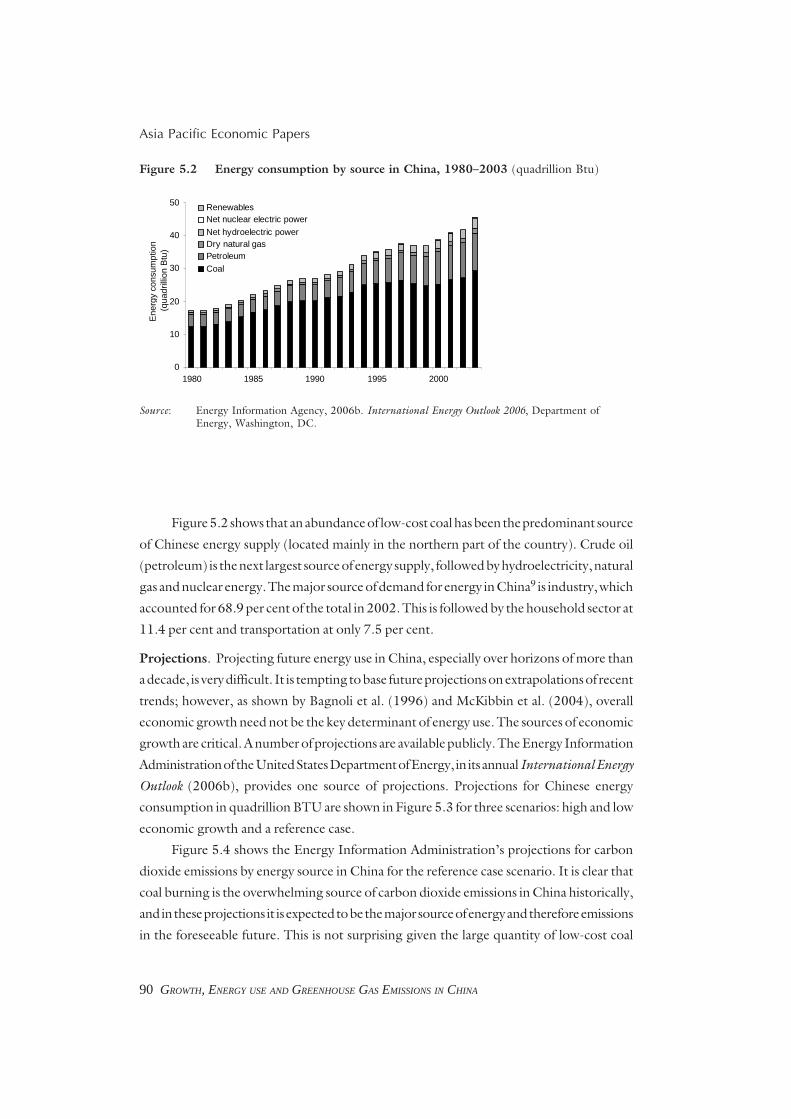
Asia Pacific Economic Papers
90 GROWTH, ENERGY USE AND GREENHOUSE GAS EMISSIONS IN CHINA
Figure 5.2 shows that an abundance of low-cost coal has been the predominant source
of Chinese energy supply (located mainly in the northern part of the country). Crude oil
(petroleum) is the next largest source of energy supply, followed by hydroelectricity, natural
gas and nuclear energy. The major source of demand for energy in China9 is industry, which
accounted for 68.9 per cent of the total in 2002. This is followed by the household sector at
11.4 per cent and transportation at only 7.5 per cent.
Projections. Projecting future energy use in China, especially over horizons of more than
a decade, is very difficult. It is tempting to base future projections on extrapolations of recent
trends; however, as shown by Bagnoli et al. (1996) and McKibbin et al. (2004), overall
economic growth need not be the key determinant of energy use. The sources of economic
growth are critical. A number of projections are available publicly. The Energy Information
Administration of the United States Department of Energy, in its annual International Energy
Outlook (2006b), provides one source of projections. Projections for Chinese energy
consumption in quadrillion BTU are shown in Figure 5.3 for three scenarios: high and low
economic growth and a reference case.
Figure 5.4 shows the Energy Information Administration’s projections for carbon
dioxide emissions by energy source in China for the reference case scenario. It is clear that
coal burning is the overwhelming source of carbon dioxide emissions in China historically,
and in these projections it is expected to be the major source of energy and therefore emissions
in the foreseeable future. This is not surprising given the large quantity of low-cost coal
Figure 5.2 Energy consumption by source in China, 1980–2003 (quadrillion Btu)
Source: Energy Information Agency, 2006b. International Energy Outlook 2006, Department ofEnergy, Washington, DC.
Ene
rgy
cons
umpt
ion
(qua
drill
ion
Btu
)
0
10
20
30
40
50
1980 1985 1990 1995 2000
RenewablesNet nuclear electric power
Net hydroelectric powerDry natural gasPetroleum
Coal

No. 369, 2008
WARWICK J. MCKIBBIN 91
available in China and the assumptions of unchanging relative energy prices in these
projections. Over time, the share of emissions from petroleum is projected to rise as greater
use of motor vehicles and other non-stationary energy uses rise. It will be shown in the next
section that these types of projections are contingent on assumptions about the price of energy
relative to other goods and the relative price of alternative energy sources.
Figure 5.3 Projections of energy consumption in China, 1990–2030 (quadrillion (1015)Btu)
0
40
80
120
160
200
1990 1995 2000 2005 2010 2015 2020 2025 2030
History Projection
Reference case
High economic growth case
Low economic growth caseEne
rgy
cons
umpt
ion
Source: Energy Information Agency, 2006b. International Energy Outlook 2006, Department ofEnergy, Washington, DC.
Figure 5.4 Projections of carbon dioxide emissions by fuel type in China, 1990–2030(million metric tonnes)
Source: Energy Information Agency, 2006b. International Energy Outlook 2006, Department ofEnergy, Washington, DC.
CO
2 em
issi
ons
(mill
ion
met
ric to
nnes
)
0
2,000
4,000
6,000
8,000
10,000
12,000
1990 1995 2000 2005 2010 2015 2020 2025 2030
History Projection
Consumption of natural gas
Consumption of petroleum
Consumption of coal

Asia Pacific Economic Papers
92 GROWTH, ENERGY USE AND GREENHOUSE GAS EMISSIONS IN CHINA
Figure 5.5 shows the global sources of carbon dioxide from burning fossil fuels, by
region, in 1990 and those projected for 2030 in the 2006 International Energy Outlook. Not
only is China currently an important source of carbon dioxide emissions, its share is expected
to grow quickly. Its absolute size (Figure 5.5) and its share of global emissions (Table 5.1),
suggest that China is a critical country in the debate over policies to deal with potential climate
change. These projections assume business as usual, and therefore incorporate global Kyoto
Protocol commitments.
Carbon emissions and climate change
China has begun to take action to address local environmental problems. There has been
direct action to substitute non-fossil fuel energy sources such as wind, hydro and thermonu-
clear energy for fossil fuels in energy generation. China has also attempted to reduce the
emissions of sulphur dioxide from burning fossil fuels by implementing a range of policies,
from closing high-sulphur coalmines to developing markets for trading sulphur dioxide
emission rights. As argued in McKibbin (2006a), a greater focus is required to address the
emissions of black carbon. From a global perspective, the discussion above on future carbon
emissions suggests that a critical area where China will need to take greater action is in the
emissions of carbon dioxide.
Figure 5.5 Global carbon dioxide emissions from fossil fuels, 1990 and 2030(million metric tonnes)
Source: Energy Information Agency, 2006b. ‘Reference case’, in International Energy Outlook2006, Department of Energy, Washington, DC.
0
2,000
4,000
6,000
8,000
10,000
12,000
14,000
China India OtherNon-
OECD
SouthKorea
Japan UnitedStates
OtherOECD
CO
2 em
issi
ons
(mill
ion
met
ric to
nnes
) 1990
2030

No. 369, 2008
WARWICK J. MCKIBBIN 93
The most important cause of human-induced climate change is the accumulation of
greenhouse gases in the atmosphere over many decades. The most important greenhouse gas
is carbon dioxide. The global community has been struggling for several decades with how
to respond effectively to the threat of climate change. The United Nations Earth Summit in
Rio de Janeiro in 1992 produced a landmark treaty on climate change that undertook to
stabilise greenhouse gas concentrations in the atmosphere. The agreement, signed and
ratified by more than 186 countries, including the United States and China (the world’s largest
carbon dioxide emitters), spawned numerous subsequent rounds of climate negotiations
aimed at rolling back emissions from industrialised countries to the levels that prevailed in
1990. Unfortunately, the negotiations have had little effect on greenhouse gas emissions and
have not produced a detectable slowing in the rate of emissions growth.10 The treaty’s
implementing protocol, the 1997 Kyoto agreement, was diluted heavily at subsequent
negotiations in Bonn and Marrakesh.11 The Kyoto Protocol entered into force on 16 February
2005 after ratification by Russia, yet there are still many problems to be faced before it will
be evident that Kyoto is reducing emissions. More than a decade of negotiations has produced
a policy that is likely to be ineffective in practice.
The difficulty at the international level is worse than it appears from the troubled process
of Kyoto ratification. The Kyoto Protocol places restrictions only on industrial economies,
excluding the world’s largest greenhouse emitter, the United States. Developing countries,
including China, have ratified the agreement but have not taken on any responsibilities for
reducing emissions except those that emerge from mechanisms such as the Clean Develop-
ment Mechanism (CDM) and joint implementation. That developing countries are not taking
on targets as commitments is one of the reasons given by the United States and Australia for
not ratifying the Kyoto Protocol. Because there have been no binding commitments by the
key developing countries of China, India, Brazil and Indonesia (among others), effective
action against possible climate change is still largely a hypothetical debate.
Developing countries have argued legitimately that while they are prepared to be part
of a regime to tackle climate change, they should not be required to bear a disproportionate
part of the costs of taking action. Current concentrations of greenhouse gases in the
atmosphere are primarily the result of economic activities in the industrial economies since
the Industrial Revolution. Because it is the stock of carbon in the atmosphere that matters
for temperature changes, any climate change in the near future will be largely the result of
the historical activities of industrial economies. One of the main dilemmas for developing
countries is not just the reality that at some stage they will need to make some form of
commitment to curbing greenhouse gas emissions, but the fact that most estimates of the
damages from climate change are borne by developing countries.12

Asia Pacific Economic Papers
94 GROWTH, ENERGY USE AND GREENHOUSE GAS EMISSIONS IN CHINA
It is worth clarifying several important facts about the costs and benefits of climate policy
and exploring whether there are approaches available to China and other developing countries
that are being delayed by countries clinging to the Kyoto Protocol. Given the uncertainties
of climate change and the decisions on energy systems being made in the rapidly growing
regions of the developing world, this delay in providing clear incentives for moving away from
fossil fuel-based systems might ultimately prove to be extremely costly.
Fossil fuel combustion is one of the largest sources of anthropogenic greenhouse gas
emissions. Given the cost of changing existing energy systems substantially in the short term,
one of the cheapest means of making the global energy system less reliant on fossil fuels is
to remove these carbon emissions from future energy systems. As was shown in the second
section, China is heavily reliant on coal for energy production and is likely to be so for many
decades into the future. Technology will ultimately be the source of reductions in emissions,
whether through the development of alternative sources of energy or through sequestration
of carbon released from burning fossil fuels. Developing countries have a huge potential to
avoid the pitfalls in terms of carbon intensities experienced by industrialised economies in their
development process. The key issue is how to encourage the emergence of energy systems
in developing countries that are less carbon-intensive over time. Ultimately, if climate change
does emerge as a serious problem, developing countries will have to move towards a less
carbon-intensive future. It is likely to be significantly cheaper to do this over time than to face
a massive restructuring at some future period—the sort of problems being faced within
industrialised economies today.
The current state of global climate policy is that the United States (the largest emitter
of greenhouse gases) has rejected Kyoto and is arguing for policies that directly or indirectly
reduce emissions through technological change; the European Union is committed to
emission targets (assuming Russia provides a great deal of the reductions required through
selling emission permits) and on 1 January 2005 it implemented a Europe-wide emissions
trading scheme (which exempts key sectors such as aluminium, motor vehicles and
chemicals), but with caps that appear to bind only by the end of 2008; Japan is considering
what it can do given current emissions are 16 per cent above targets in an economy recovering
from a decade of recession; and developing countries have refused to discuss taking on
commitments officially.
Given this background, there are a number of ways a country such as China could begin
to address carbon emissions and make a major contribution to a global response. One policy
would be to move energy prices closer to world levels by removing energy subsidies. The
second would be to raise the price of energy further to reflect the true economic and
environmental cost of burning fossil fuels. A further approach could be direct importation of

No. 369, 2008
WARWICK J. MCKIBBIN 95
less carbon-intensive technologies provided by the CDM. This latter outcome is possible but
not likely, as already outlined above.
Economic theory provides guidance about the structure of a possible climate change
policy for China.13 Since greenhouse gases are emitted by a vast number of highly
heterogeneous sources, minimising the cost of abating a given amount of emissions requires
that all sources clean up amounts that cause their marginal cost of abatement to be equated.
To achieve this, the standard economic policy prescription would be a market-based
instrument, such as a tax on emissions or a tradable permit system for emission rights. These
types of market-based incentives for environmental pollution are already being undertaken
in China through pollution charges and permit trading in sulphur dioxide. Cooper (2005) has
advocated a carbon tax for China. Garbaccio et al. (1999) and McKibbin and Wilcoxen (2004)
find that a price signal would be effective in changing China’s future emission profiles. Given
the advantages and disadvantages of the standard economic instruments, McKibbin and
Wilcoxen (2002a, 2002b) show that it is possible to combine the attractive features of both
systems into a single approach. They also show that it is possible to develop a system that is
common in philosophy across industrialised and developing economies but in which
developing economies do not incur the short-term costs to the economy in the form of higher
energy prices until they have reached a capacity to pay. McKibbin and Wilcoxen (2002) have
argued for a hybrid approach in which the short-term and long-term prices of carbon are
changed in order to give incentives to move away from carbon-emitting energy sources. The
implications of this hybrid approach for China are discussed in detail in McKibbin (2006a,
2006b).
Sensitivity of energy projections to growth assumptions in China
In this section, emission projections are presented from the G-cubed multi-country model14
to show how sensitive the projections are to assumptions about the sources of economic
growth in China. Two scenarios are considered: one in which all sectors have the same
productivity growth and one in which sectors experience differential productivity growth
similar to the experience of the United States in the past 30 years.
A summary of the approach is provided here but further details on the technique used
in the G-cubed model can be found in McKibbin et al. (2004). In the following discussion,
the source of economic growth is labour-augmenting technical change and population
growth. The population growth assumptions are the same across both scenarios and are based
on the 2004 United Nations population projections (Mid scenario). In order to simplify the
discussion, labour-augmenting technical change is referred to as ‘productivity growth’
throughout the remainder of this chapter.

Asia Pacific Economic Papers
96 GROWTH, ENERGY USE AND GREENHOUSE GAS EMISSIONS IN CHINA
In the G-cubed model, productivity growth by sector and by country is assumed to be
driven by a productivity catch-up model. The United States is assumed to be the technological
leader in each sector. Other countries are allocated an initial productivity gap by sector and
a rate at which this gap is closed. For industrial countries and China, this is assumed to be
closed at the rate of 2 per cent per annum. For other developing countries, it is assumed to
be closed at 1 per cent per annum, reflecting the empirical literature. In this chapter, Chinese
productivity is assumed to be 20 per cent of productivity in the equivalent sector in the United
States. In the first scenario, the United States is assumed to have the same productivity growth
across all sectors. This is the typical assumption in models where aggregate GDP drives
energy use and therefore emissions. This scenario is labelled ‘uniform productivity growth’.
The implications for growth are shown in Figure 5.6. Productivity growth in all Chinese
sectors is the same given the same initial gaps to the United States and the same catch-up rate
across sectors.
In the second scenario, it is assumed that the differential productivity growth across
sectors in the United States is similar to that experienced in the past 30 years. The growth
rates are adjusted so that the aggregate GDP growth rate for the United States is similar to
GDP growth generated in the first scenario, and the main difference between the scenarios
is the composition of growth. It is not possible to target GDP growth exactly.
Figures 5.6 and 5.7 show the productivity growth assumptions for each sector in the
United States and the implications for the equivalent sector in China under the assumptions
of the same initial gaps and rates of convergence. Although the initial productivity gaps are
Figure 5.6 Labour-augmentative technical change for uniform productivity scenario,2002–2100 (all sectors)
Source: G-cubed model version 63E.
0
2
4
6
8
10
12
14
2002
2008
2014
2020
2026
2032
2038
2044
2050
2056
2062
2068
2074
2080
2086
2092
2098
Per
cen
t per
ann
um
China
USA

No. 369, 2008
WARWICK J. MCKIBBIN 97
the same, note that in Figure 5.7, different sectors in China experience different rates of
productivity growth. This is important because capital accumulation is endogenous in the G-
cubed model, responding to changes in real and expected rates of return to capital.
The results from the G-cubed model for Chinese carbon dioxide emissions and GDP
growth under two scenarios are shown in Figures 5.8 and 5.9 for the period from 2003 to
2030. By 2020, emissions under the uniform productivity scenario are 20 per cent higher than
under the differential productivity growth scenario, even though GDP growth is slightly
higher under the latter. Part of the difference is due to differential sectoral demand for energy
as an input as well as considerably different relative energy prices under the two scenarios.
These results suggest that future projections of carbon emissions and energy use in China
need to be interpreted carefully.
Despite this warning on the importance of structural change in energy projections, it
is difficult to see a major shift in trends away from coal under current energy prices.
Interestingly, there is also little change in the real price of oil or any fossil fuels throughout
the projection period in the International Energy Outlook results presented earlier, yet there
are significant changes in the projections from the G-cubed model, depending on assumptions
about the sources of growth.
Under most scenarios, the emergence of China as a key supplier and producer of
energy is one of the most important issues in the debate over global energy use for the
foreseeable future. This is also critical for environmental issues in China, Asia and globally.
Sensitivity of carbon emissions to price changes
The above scenarios considered differences in emission projections due to different growth
assumptions. Due to the endogeniety of relative prices in the modelling framework used,
some of the differences in energy use and emissions are due to changing relative prices due
to changes in demand and supply of energy and other goods in the global economy. In this
section, the focus is on the sensitivity of emission projections to relative carbon prices, by
considering a carbon tax in China. This result can also be translated approximately into the
responsiveness of Chinese emissions to a conventional permit-trading system in China or a
McKibbin and Wilcoxen hybrid system, except that there will be differential income and wealth
effects of the latter system due to revenue going to the permit holders rather than to the
government via a tax.
Figures 5.10 and 5.11 contain results from the G-cubed model of a tax of US$10 (in
2002 constant prices) per tonne of carbon, for the United States and China. Results are shown
from 2007 to 2055. The short-term response of emissions in China is much larger than in
the United States. The initial price of energy in China is much lower than in the United States

Asia Pacific Economic Papers
98 GROWTH, ENERGY USE AND GREENHOUSE GAS EMISSIONS IN CHINA
Electric utilities
0
2
4
6
8
10
12
14
2002
2010
2018
2026
2034
2042
2050
2058
2066
2074
2082
2090
2098
Per
cen
t per
ann
um
China
USA
Gas utilities
0
2
4
6
8
10
12
14
2002
2010
2018
2026
2034
2042
2050
2058
2066
2074
2082
2090
2098
Per
cen
t per
ann
um
China
USA
Petroleum refining
0
2
4
6
8
10
12
14
2002
2010
2018
2026
2034
2042
2050
2058
2066
2074
2082
2090
2098
Per
cen
t per
ann
um
China
USA
Coal mining
0
2
4
6
8
10
12
14
2002
2010
2018
2026
2034
2042
2050
2058
2066
2074
2082
2090
2098
Per
cen
t per
ann
um
China
USA
Oil and gas extraction
0
2
4
6
8
10
12
14
2002
2010
2018
2026
2034
2042
2050
2058
2066
2074
2082
2090
2098
Per
cen
t per
ann
um
China
USA
Mining
0
2
4
6
8
10
12
14
2002
2010
2018
2026
2034
2042
2050
2058
2066
2074
2082
2090
2098
Per
cen
t per
ann
um
China
USA
Figure 5.7 Labour-augmentative technical change by sector in differentialproductivity scenario, 2002–2100
Source: G-cubed model version 63E.

No. 369, 2008
WARWICK J. MCKIBBIN 99
Figure 5.7 Labour-augmentative technical change by sector in differentialproductivity scenario, 2002–2100, continued
Source: G-cubed model version 63E.
Agriculture
0
2
4
6
8
10
12
14
2002
2011
2020
2029
2038
2047
2056
2065
2074
2083
2092
Per
cen
t per
ann
um
China
USA
Forestry and wood products
0
2
4
6
8
10
12
14
2002
2011
2020
2029
2038
2047
2056
2065
2074
2083
2092
Per
cen
t per
ann
um
China
USA
Durable manufacturing
0
2
4
6
8
10
12
14
2002
2011
2020
2029
2038
2047
2056
2065
2074
2083
2092
Per
cen
t per
ann
um
China
USA
Non-durable manufacturing
0
2
4
6
8
10
12
14
2002
2011
2020
2029
2038
2047
2056
2065
2074
2083
2092
Per
cen
t per
ann
um
China
USA
Transportation
0
2
4
6
8
10
12
14
2002
2011
2020
2029
2038
2047
2056
2065
2074
2083
2092
Per
cen
t per
ann
um
China
USA
Services
0
2
4
6
8
10
12
14
2002
2011
2020
2029
2038
2047
2056
2065
2074
2083
2092
Per
cen
t per
ann
um
China
USA

Asia Pacific Economic Papers
100 GROWTH, ENERGY USE AND GREENHOUSE GAS EMISSIONS IN CHINA
so the tax (on a per unit basis) causes a much larger proportional rise in the price of carbon-
intensive energy in China than in the United States. The response in the short term reflects
substitution and conservation by households and industry as well as a significant contraction
in economic activity in China relative to the baseline. GDP falls by 0.9 per cent relative to the
baseline in the initial year, compared with 0.2 per cent in the United States. Over time,
Figure 5.8 Projection of Chinese carbon emissions, 2002–2026
Source: G-cubed model version 63E.
0
500
1000
1500
2000
2500
3000
3500
4000
2002
2004
2006
2008
2010
2012
2014
2016
2018
2020
2022
2024
Em
issi
ons
(mill
ion
met
ric to
nnes
)
uniform productivity
differential productivity
Source: G-cubed model version 63E.
Figure 5.9 Projection of Chinese real GDP growth, 2002–2026 (per cent perannum)
0
1
2
3
4
5
6
7
8
2002
2004
2006
2008
2010
2012
2014
2016
2018
2020
2022
2024
GD
P g
row
th
(per
cen
t per
ann
um)
uniform productivity
differential productivity

No. 369, 2008
WARWICK J. MCKIBBIN 101
substitution in production and the use of energy allows a larger carbon reduction with less
impact on GDP. GDP initially falls in both countries and in the longer term it is higher in China
due to efficiency gains from more efficient use of energy. These results indicate that in the
G-cubed model energy prices—in particular, the price of carbon—are important in changing
the future emissions profile.
Figure 5.10 Response of emissions to a carbon tax in each country, 2007–2058(US$10 per tonne of carbon)
-35
-30
-25
-20
-15
-10
-5
0
2007
2010
2013
2016
2019
2022
2025
2028
2031
2034
2037
2040
2043
2046
2049
2052
2055
Dev
iatio
n fr
om b
asel
ine
(per
cen
t)
US Carbon emissions
China Carbon Emissions
Source: G-cubed model version 63E.
Figure 5.11 Response of GDP to a carbon tax in each country, 2007–2055 (US$10 pertonne of carbon)
Source: G-cubed model version 63E.
-1
-0.8
-0.6
-0.4
-0.2
0
0.2
2007
2010
2013
2016
2019
2022
2025
2028
2031
2034
2037
2040
2043
2046
2049
2052
2055
Dev
iatio
n fr
om b
asel
ine
(per
cen
t)
US carbon emissions
China carbon emissions

Asia Pacific Economic Papers
102 GROWTH, ENERGY USE AND GREENHOUSE GAS EMISSIONS IN CHINA
Conclusion
China currently faces a number of important problems related to energy use. At the forefront
is the issue of how to deal with the desire for sustained economic growth at the same time as
tackling serious environmental issues caused by energy generation. This issue is likely to
become more important in coming years, especially as energy demand soars, environmental
problems worsen and incomes rise. It is likely, under current global energy price structures,
that future energy in China will be generated largely by the use of coal. Under current
technologies in China, this is likely to have serious environmental consequences. Current
plans to increase the use of nuclear and renewable energy such as hydroelectric and wind
power are impressive but will likely have little impact in a rapidly expanding energy sector
unless there is a significant change in the expected relative price of carbon. Other
technologies—such as carbon sequestration, which is showing great potential—are also an
option, although this technology will be more economically viable more quickly with a change
in Chinese and global carbon prices.
For some time, China has been taking action on local environmental issues. This has
been particularly true in dealing with air and water quality as well as sulphur dioxide emissions.
Action is already under way to reduce emissions of sulphur dioxide by moving away from high-
sulphur coal, by closing small, high-sulphur coalmines, with direct controls on sulphur dioxide
emissions, implementation of pilot schemes for sulphur dioxide emission charges and pilot
schemes for sulphur dioxide emissions trading. These are having an impact on emissions of
sulphur, although the impact on acid rain in China and across Northeast Asia has been less
clear.15
I have argued (McKibbin 2006a) that black carbon and its direct health, economic and
environmental consequences are promising areas for close attention and direct policy
intervention within China. This is not an issue of technological change at the power utilities
as might usually be the focus of energy policy. A reduction in the emissions of black carbon
will require a technology shift in the way households generate energy for heating and cooking
and in the way farmers clear their land after harvest. Black carbon is a good candidate for
consideration under the Asia Pacific Partnership for Clean Development and Climate
(APPCDC) announced on 28 July 2005, which includes the United States, Japan, Australia,
South Korea, China and India.
A critical issue facing China and the global community directly related to energy use
in China is the emission of carbon dioxide. China and most other countries are yet to take
effective action on reducing greenhouse gas emissions. Even if rapid action were possible, the
lags between emissions and climate change are so long that benefits are unlikely for many
decades. Although some researchers believe that global responses, such as through the CDM

No. 369, 2008
WARWICK J. MCKIBBIN 103
in the Kyoto Protocol, are a way to proceed,16 it is doubtful that much can be achieved through
this approach alone. A strong case can be made for responses to be developed within China,
Korea, Japan and other economies in the Asia Pacific region for dealing with carbon dioxide
emissions. This has already begun to emerge within the APPCDC. The current idea within
this group of countries of technology transfer without a carbon price signal is unlikely to be
as effective as a way forward as a system based on clear long-term price signals that give
incentives for reducing carbon dioxide emissions. One estimate of the sensitivity of carbon
emissions to price changes has been presented in this paper. Within the APPCDC framework,
there is potential to experiment with hybrid market–government control schemes such as the
McKibbin–Wilcoxen blueprint, in which important institutions are created to begin a long
process of reduced carbonisation of the Chinese economy. This would allow China to
continue to grow but would put in place a pricing mechanism for future carbon emissions as
an incentive to shift Chinese energy systems gradually to low carbon-emitting technologies.
The creation of institutions for environmental management based on market incentives
together with appropriate pricing of consequences of current energy generation technologies
are important for long-range energy planning in China.
China and other countries in the Asia Pacific region are at a critical juncture in
determining the nature of energy use in the global economy and the potential global
environmental impact of a rapidly growing China. Addressing this problem effectively is not
easy, as shown by the reality that many of the potential solutions to environmental problems
related to energy use are not yet implemented in other Asia Pacific economies. The form of
future energy systems and the problem of reducing global carbon dioxide emissions cannot
be resolved seriously without the complete participation of China in any strategies. But these
strategies need to be determined domestically within a framework of multilateral cooperation
rather than being imposed from the outside. The preliminary results in this chapter suggest
that, given appropriate use of markets and pricing energy—in particular, carbon pricing—
China can sustain high economic growth with less environmental damage from energy use
and a smaller contribution to global carbon dioxide emissions than an extrapolation of recent
trends would predict.
Acknowledgments
This chapter extends earlier research funded by the China Economic Research and Advisory
Program (CERAP). The author thanks Yan Yang for excellent research assistance. The views
expressed in the paper are those of the author and should not be interpreted as reflecting the
views of the institutions with which the author is affiliated, including the trustees, officers or
other staff of the ANU, the Lowy Institute and the Brookings Institution.

Asia Pacific Economic Papers
104 GROWTH, ENERGY USE AND GREENHOUSE GAS EMISSIONS IN CHINA
Appendix 5.1 The G-cubed model for projecting energy use andgreenhouse emissions in China
The G-Cubed model is an intertemporal general equilibrium model of the world economy.
The theoretical structure is outlined in McKibbin and Wilcoxen (1998).17 A number of
studies—summarised in McKibbin and Vines (2000)—show that the G-cubed modelling
approach has been useful in assessing a range of issues across a number of countries since
the mid 1980s.18 Some of the principal features of the model are as follows.
The model is based on explicit intertemporal optimisation by the agents (consumers and
firms) in each economy.19 In contrast with static CGE models, time and dynamics are of
fundamental importance in the G-cubed model. The MSG-cubed model is known as a
Dynamic Stochastic General Equilibrium (DSGE) model in the macroeconomics literature
and as a Dynamic Intertemporal General Equilibrium (DIGE) model in the computable
general equilibrium literature.
In order to track the macro time series, the behaviour of agents is modified to allow
for short-term deviations from optimal behaviour due either to myopia or to restrictions on
the ability of households and firms to borrow at the risk-free bond rate on government debt.
For households and firms, deviations from intertemporal optimising behaviour take the form
of rules of thumb, which are consistent with an optimising agent that does not update
predictions based on new information about future events. These rules of thumb are chosen
to generate the same steady-state behaviour as optimising agents so that in the long term there
is only a single intertemporal optimising equilibrium of the model. In the short term,
behaviour is assumed to be a weighted average of the optimising and the rule-of-thumb
assumptions. Therefore, aggregate consumption is a weighted average of consumption based
on wealth (current asset valuation and expected future after-tax labour income) and
consumption based on current disposable income. Similarly, aggregate investment is a
weighted average of investment based on Tobin’s ‘q’ (a market valuation of the expected
future change in the marginal product of capital relative to the cost) and investment based
on a backward-looking version of ‘Q’.
There is an explicit treatment of the holding of financial assets, including money. Money
is introduced into the model through a restriction that households require money to purchase
goods.
The model also allows for short-term nominal wage rigidity (by different degrees in
different countries) and therefore allows for significant periods of unemployment depending
on the labour-market institutions in each country. This assumption, when taken together with
the explicit role for money, is what gives the model its macroeconomic characteristics. (Here
No. 369, 2008
WARWICK J. MCKIBBIN 105
again, the model’s assumptions differ from the standard market-clearing assumption in most
CGE models.)
The model distinguishes between the stickiness of physical capital within sectors and
within countries and the flexibility of financial capital, which immediately flows to where
expected returns are highest. This important distinction leads to a critical difference between
the quantity of physical capital that is available at any time to produce goods and services, and
the valuation of that capital as a result of decisions about the allocation of financial capital.
As a result of this structure, the G-cubed model contains rich dynamic behaviour, driven
on the one hand by asset accumulation and, on the other, by wage adjustment to a neoclassical
steady state. It embodies a wide range of assumptions about individual behaviour and
empirical regularities in a general equilibrium framework. The interdependencies are solved
using a computer algorithm that solves the rational expectations of equilibrium of the global
economy. It is important to stress that the term ‘general equilibrium’ is used to signify that
as many interactions as possible are captured, not that all economies are in a full market-
clearing equilibrium at each point in time. Although it is assumed that market forces eventually
drive the world economy to a neoclassical steady-state growth equilibrium, unemployment
does emerge for long periods due to wage stickiness, to an extent that differs between
countries due to differences in labour-market institutions.
Notes
1 All data, unless specifically indicated otherwise, are sourced from Energy InformationAgency, 2006b. International Energy Outlook 2006, Department of Energy, WashingtonDC.
2 These issues are discussed more extensively in McKibbin 2006. See also China Council forInternational Cooperation on Environment and Development 2001; Panayotou andZheng 2000; Streets 2004; and Wang and Smith 1999.
3 See Jiang 2002; and Zhang 1998.
4 There are many other environmental problems in China caused by a large population andrapid economic growth, such as water and air quality problems caused by deforestation anddesertification. China’s demand for resources also has a large impact on the environment ofother countries. These important problems are not the subject of this paper, but for anoverview see Liu and Diamond 2005.
5 China’s Environmental Protection Law was promulgated in 1979 — a nationwide levysystem on pollution began in 1982. The collection of fees for sulphur dioxide pollution fromcoal began in 1992. See Jiang 2003 for an overview.
6 See Jiang 2003; and Panayatou 1998 for an overview of China’s environmental problems.
7 2004 UNDP Human Development Report.
8 DOE 2005.

Asia Pacific Economic Papers
106 GROWTH, ENERGY USE AND GREENHOUSE GAS EMISSIONS IN CHINA
9 See National Bureau of Statistics of China, China Statistical Yearbooks for 1990–2005.
10 See McKibbin and Wilcoxen 2002 for a summary of the negotiations and critique of theapproach.
11 Earlier estimates of the cost of Kyoto can be found in Weyant 1999. Direct comparisons ofthe COP3 and COP7 versions of the protocol can be found in Bohringer 2001; Buchneret al. 2001; Kemfert 2001; Löschel and Zhang 2002; and McKibbin and Wilcoxen 2004.
12 See Intergovernmental Panel on Climate Change 2001.
13 See McKibbin and Wilcoxen 2002a for a survey; and Pezzey 2003 for a comparison of taxesand permits.
14 See McKibbin and Wilcoxen 1998, and documentation at http://www.gcubed.com
15 Nakada and Ueta 2004 point out that there are likely to be gains for other economies in theregion, such as Japan and Korea, to cooperate with China in controlling sulphur emissionssince these economies are also directly affected by acid rain emanating from China.
16 See Ueta et al. 2005.
17 Full details of the model, including a list of equations and parameters, can be found onlineat www.gcubed.com
18 These issues include: Reaganomics in the 1980s; German reunification in the early 1990s;fiscal consolidation in Europe in the mid 1990s; the formation of the North American FreeTrade Agreement (NAFTA); the East Asian financial crisis; and the productivity boom in theUnited States.
19 See Blanchard and Fischer 1989; and Obstfeld and Rogoff 1996.


![Asian architecture [hindu & china] - Art Appreciation](https://static.fdocuments.net/doc/165x107/55a61d181a28ab714c8b45e4/asian-architecture-hindu-china-art-appreciation.jpg)