
Arvind Limited -...
26
11 th May 2017 | Ahmedabad FASHIOINING POSSIBILITIES Arvind Limited Investor Review Note
Transcript of Arvind Limited -...

11th May 2017 | Ahmedabad
FASHIOINING POSSIBILITIES
Arvind LimitedInvestor Review Note
2
Safe harbour statement
Certain statements contained in this document may be statements of future expectations and
other forward looking statements that are based on management‘s current view and
assumptions and involve known and unknown risks and uncertainties that could cause actual
results, performance or events to differ materially from those expressed or implied in such
statements. None of Arvind Limited or any of its affiliates, advisors or representatives shall have
any liability whatsoever (in negligence or otherwise) for any loss howsoever arising from any use
of this document or its content or otherwise arising in connection with this document. This
document does not constitute an offer or invitation to purchase or subscribe for any shares and
neither it nor any part of it shall form the basis of or be relied upon in connection with any
contract or commitment whatsoever.
3
Financial Performance - Consolidated
4
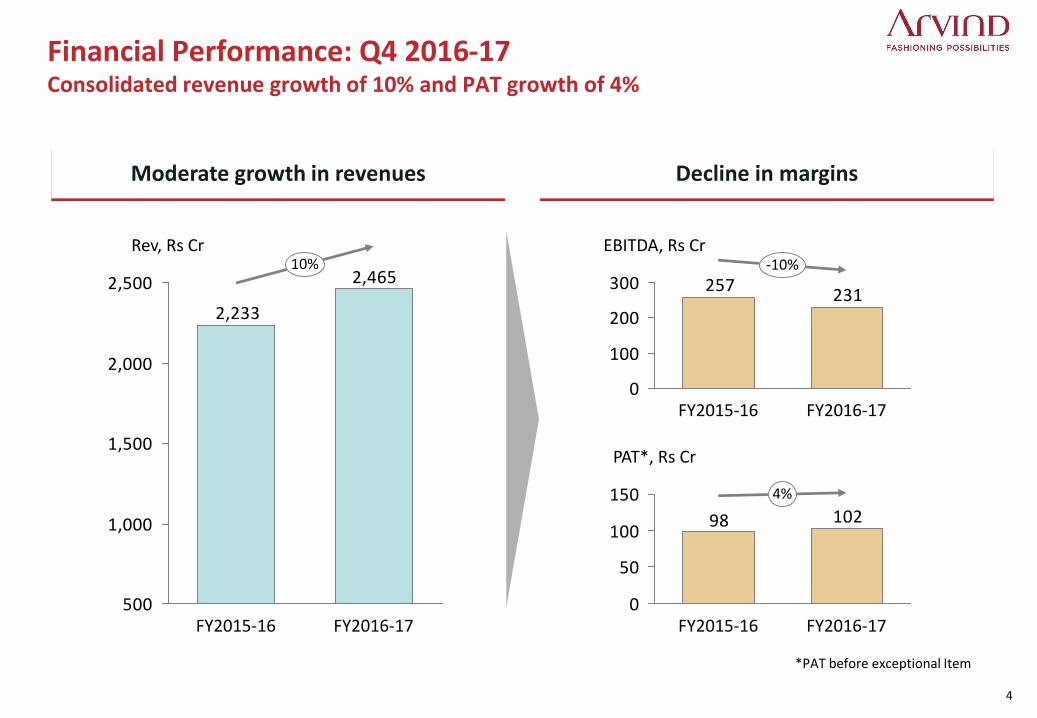
2,465
2,233
500
1,000
1,500
2,000
2,50010%
FY2016-17FY2015-16
Rev, Rs Cr
231257
0
100
200
300
EBITDA, Rs Cr-10%
FY2016-17FY2015-16
10298
0
50
100
150
PAT*, Rs Cr
FY2016-17
4%
FY2015-16
Financial Performance: Q4 2016-17Consolidated revenue growth of 10% and PAT growth of 4%
Moderate growth in revenues Decline in margins
*PAT before exceptional Item
5
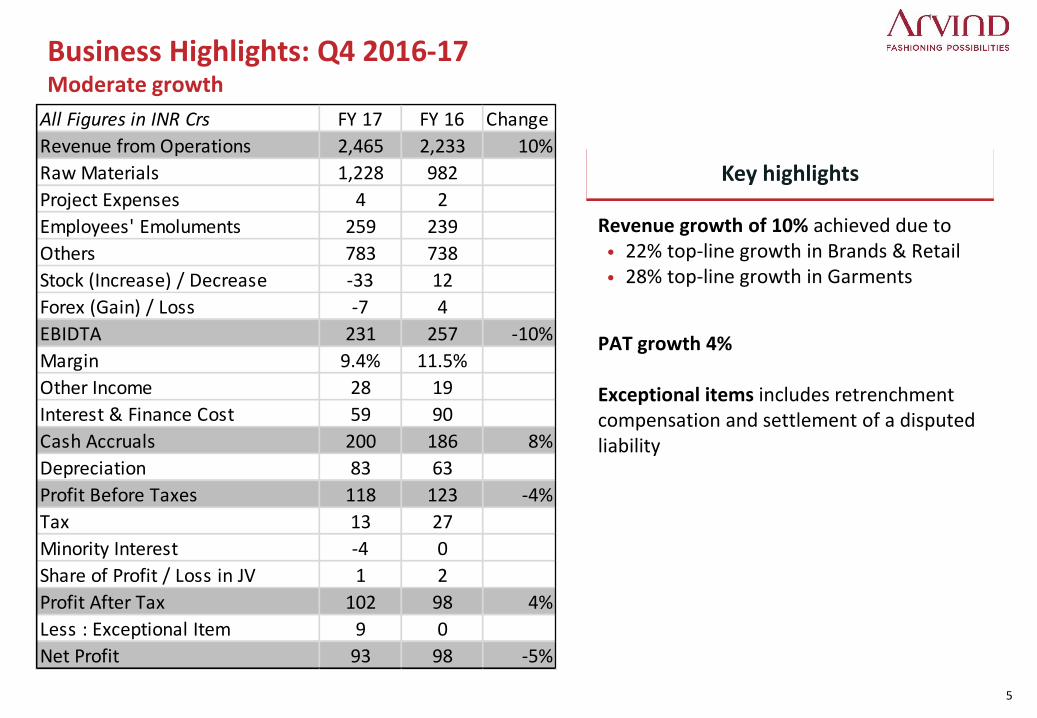
Business Highlights: Q4 2016-17Moderate growth
Key highlights
Revenue growth of 10% achieved due to• 22% top-line growth in Brands & Retail• 28% top-line growth in Garments
PAT growth 4%
Exceptional items includes retrenchment compensation and settlement of a disputed liability
All Figures in INR Crs FY 17 FY 16 Change
Revenue from Operations 2,465 2,233 10%
Raw Materials 1,228 982
Project Expenses 4 2
Employees' Emoluments 259 239
Others 783 738
Stock (Increase) / Decrease -33 12
Forex (Gain) / Loss -7 4
EBIDTA 231 257 -10%
Margin 9.4% 11.5%
Other Income 28 19
Interest & Finance Cost 59 90
Cash Accruals 200 186 8%
Depreciation 83 63
Profit Before Taxes 118 123 -4%
Tax 13 27
Minority Interest -4 0
Share of Profit / Loss in JV 1 2
Profit After Tax 102 98 4%
Less : Exceptional Item 9 0
Net Profit 93 98 -5%
6
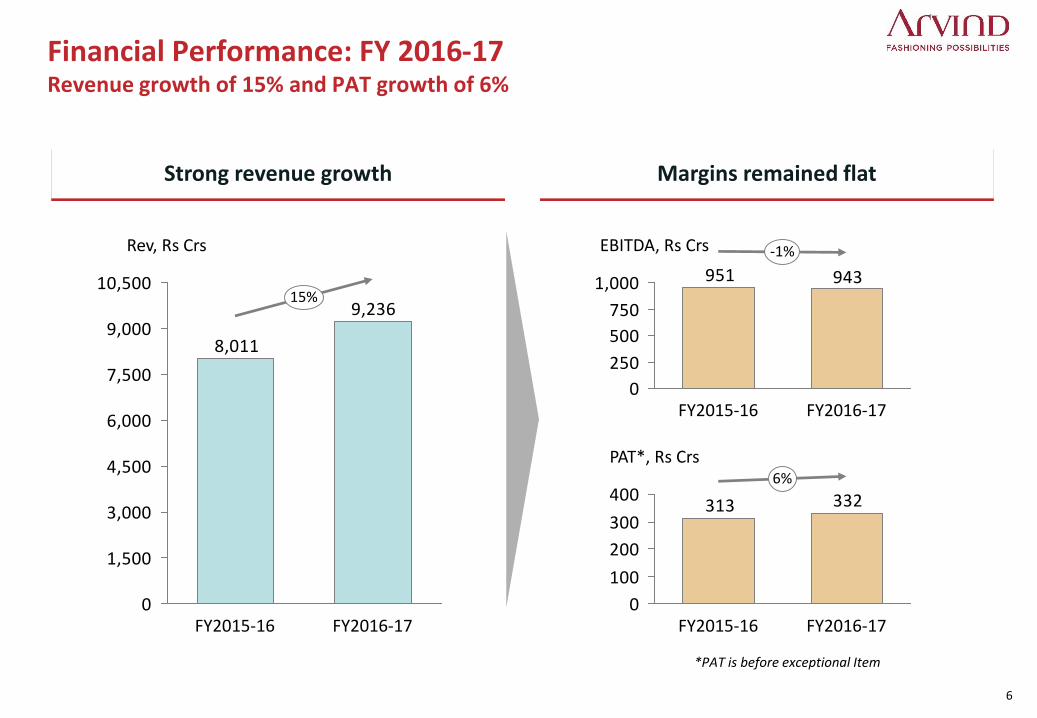
Financial Performance: FY 2016-17Revenue growth of 15% and PAT growth of 6%
*PAT is before exceptional Item
Strong revenue growth Margins remained flat
9,236
8,011
0
1,500
3,000
4,500
6,000
7,500
9,000
10,500
Rev, Rs Crs
15%
FY2016-17FY2015-16
943951
0
250
500
750
1,000
EBITDA, Rs Crs
FY2015-16
-1%
FY2016-17
332313
0
100
200
300
400
PAT*, Rs Crs
FY2016-17FY2015-16
6%
7
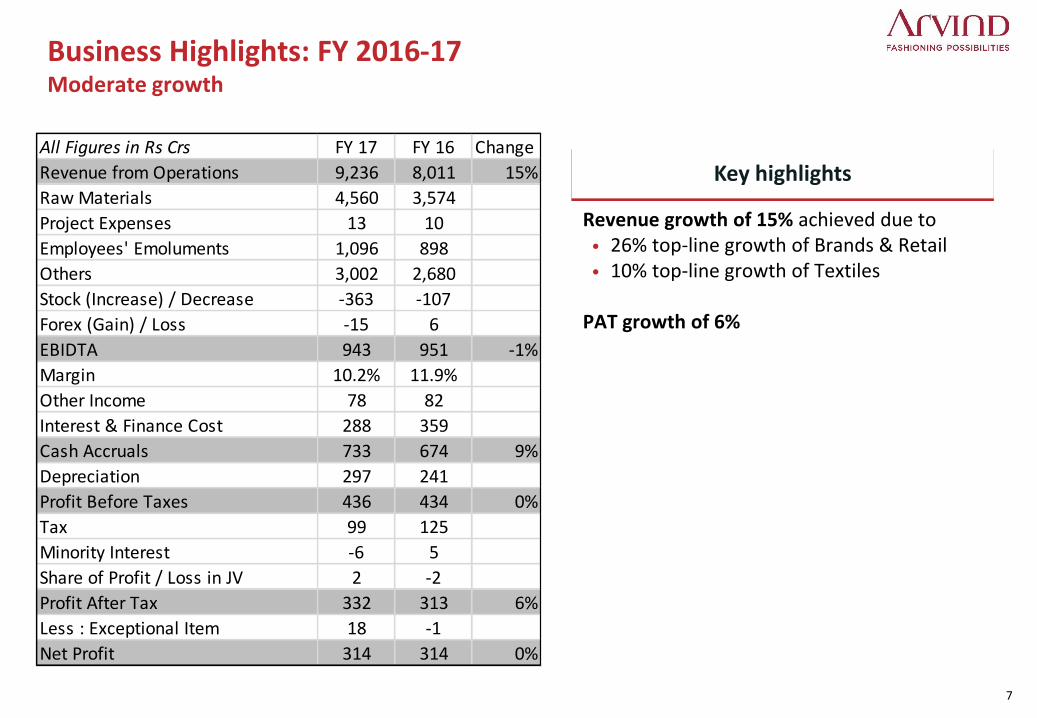
Business Highlights: FY 2016-17Moderate growth
Key highlights
Revenue growth of 15% achieved due to• 26% top-line growth of Brands & Retail• 10% top-line growth of Textiles
PAT growth of 6%
All Figures in Rs Crs FY 17 FY 16 Change
Revenue from Operations 9,236 8,011 15%
Raw Materials 4,560 3,574
Project Expenses 13 10
Employees' Emoluments 1,096 898
Others 3,002 2,680
Stock (Increase) / Decrease -363 -107
Forex (Gain) / Loss -15 6
EBIDTA 943 951 -1%
Margin 10.2% 11.9%
Other Income 78 82
Interest & Finance Cost 288 359
Cash Accruals 733 674 9%
Depreciation 297 241
Profit Before Taxes 436 434 0%
Tax 99 125
Minority Interest -6 5
Share of Profit / Loss in JV 2 -2
Profit After Tax 332 313 6%
Less : Exceptional Item 18 -1
Net Profit 314 314 0%
8
10
15
20
FY 2015-16
EBITDA %
FY 2016-17
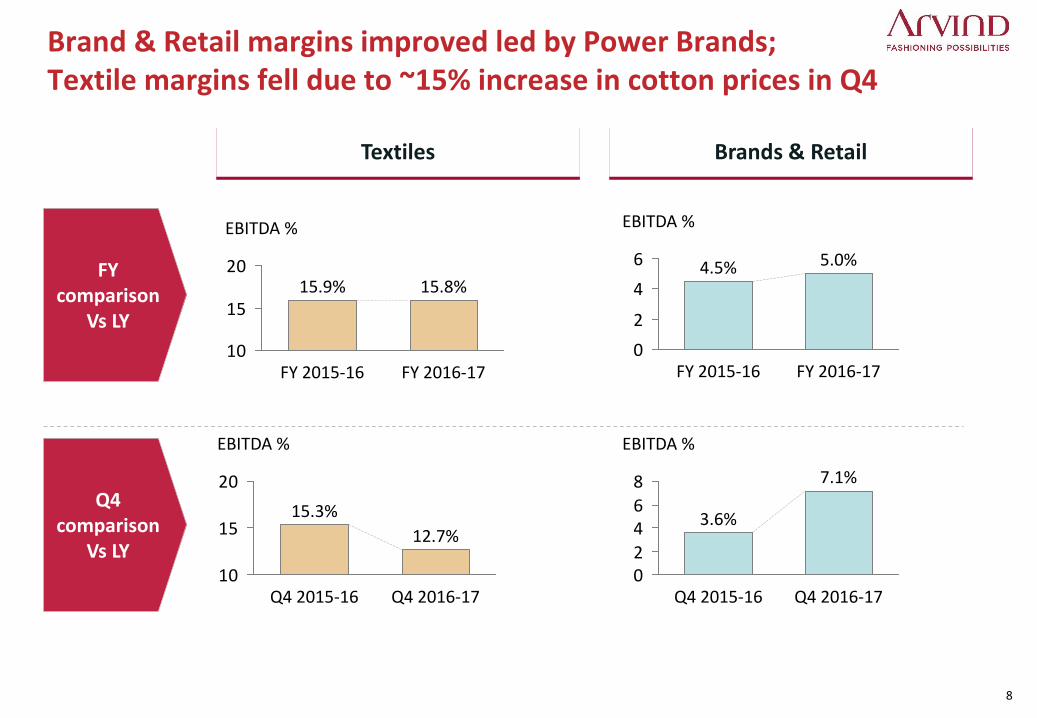
15.8%15.9%
10
15
20
EBITDA %
Q4 2015-16
15.3%
12.7%
Q4 2016-1702
46
8
Q4 2016-17
EBITDA %
7.1%
Q4 2015-16
3.6%
Brand & Retail margins improved led by Power Brands; Textile margins fell due to ~15% increase in cotton prices in Q4
0
2
4
6
FY 2015-16 FY 2016-17
5.0%4.5%
EBITDA %
Textiles Brands & Retail
FY comparison
Vs LY
Q4 comparison
Vs LY
9
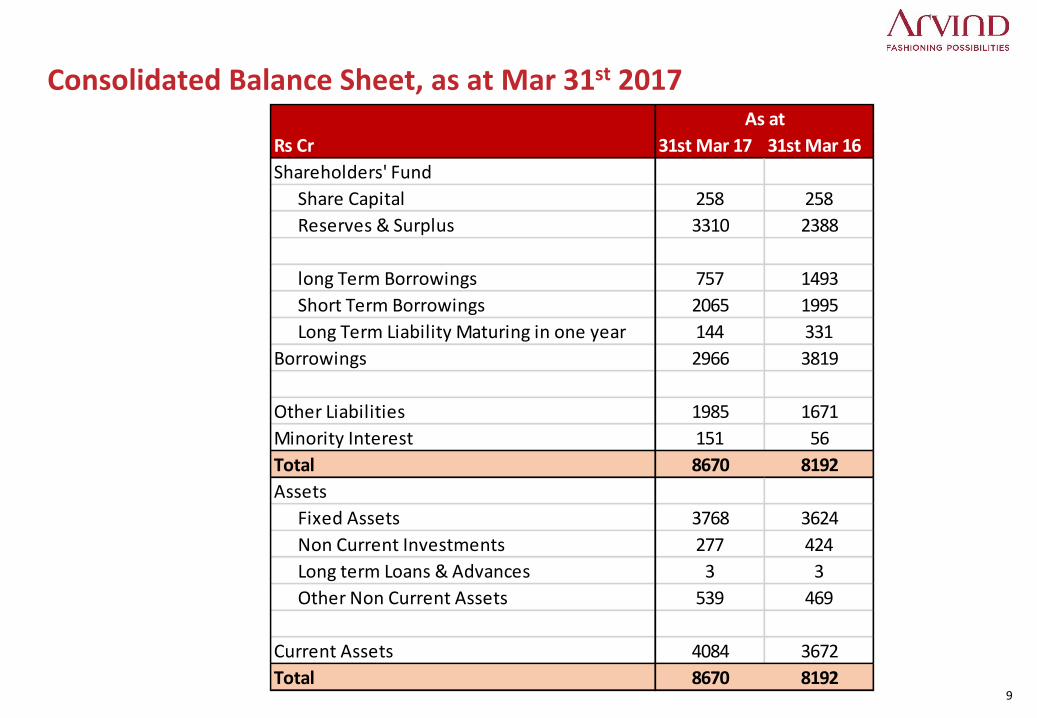
Consolidated Balance Sheet, as at Mar 31st 2017
Rs Cr 31st Mar 17 31st Mar 16
Shareholders' Fund
Share Capital 258 258
Reserves & Surplus 3310 2388
long Term Borrowings 757 1493
Short Term Borrowings 2065 1995
Long Term Liability Maturing in one year 144 331
Borrowings 2966 3819
Other Liabilities 1985 1671
Minority Interest 151 56
Total 8670 8192
Assets
Fixed Assets 3768 3624
Non Current Investments 277 424
Long term Loans & Advances 3 3
Other Non Current Assets 539 469
Current Assets 4084 3672
Total 8670 8192
As at
10
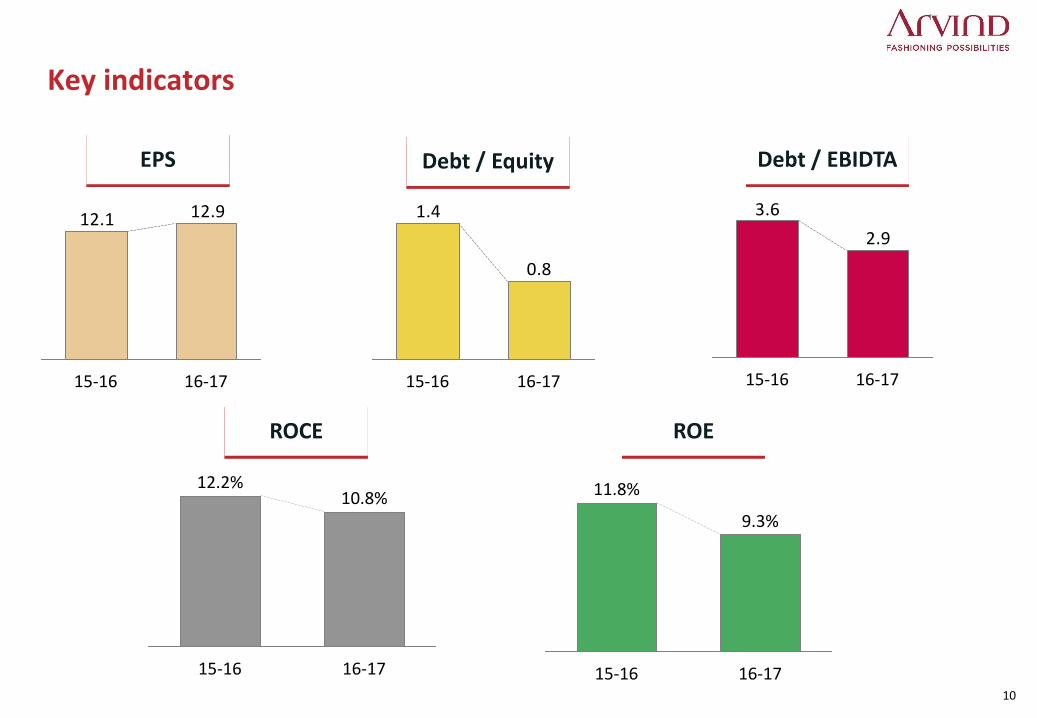
Key indicators
EPS
12.912.1
16-1715-16
Debt / Equity
0.8
1.4
15-16 16-17
Debt / EBIDTA
2.9
3.6
16-1715-16
10.8%
15-16 16-17
12.2%
ROCE
11.8%
16-17
9.3%
15-16
ROE
11
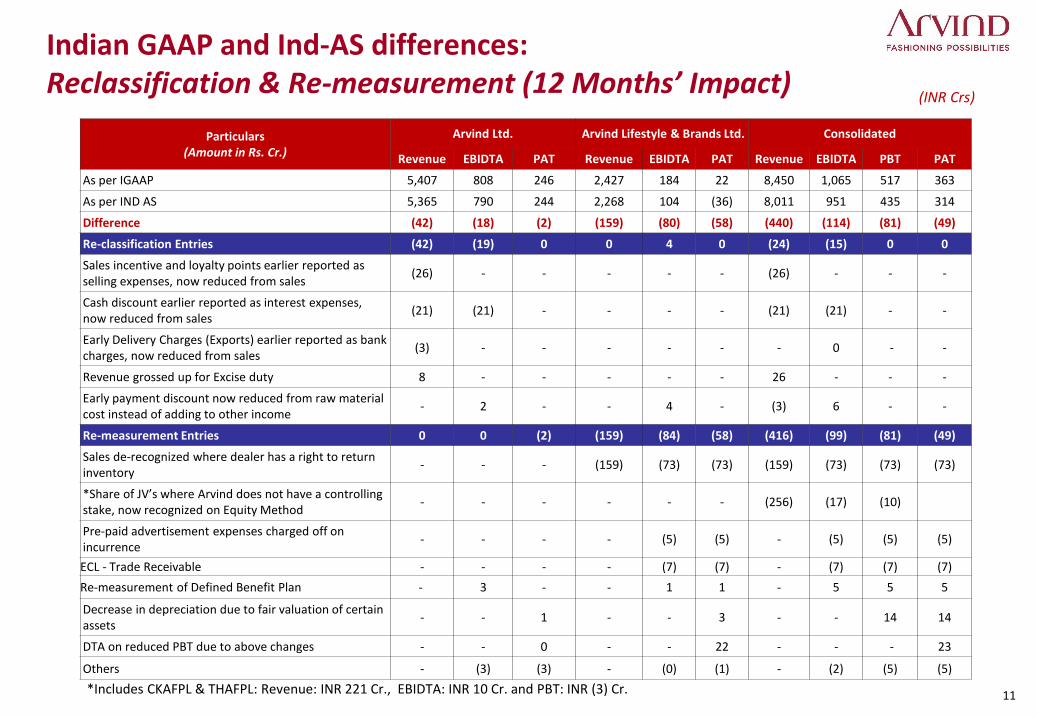
Indian GAAP and Ind-AS differences: Reclassification & Re-measurement (12 Months’ Impact)
(INR Crs)
*Includes CKAFPL & THAFPL: Revenue: INR 221 Cr., EBIDTA: INR 10 Cr. and PBT: INR (3) Cr.
Particulars(Amount in Rs. Cr.)
Arvind Ltd. Arvind Lifestyle & Brands Ltd. Consolidated
Revenue EBIDTA PAT Revenue EBIDTA PAT Revenue EBIDTA PBT PAT
As per IGAAP 5,407 808 246 2,427 184 22 8,450 1,065 517 363
As per IND AS 5,365 790 244 2,268 104 (36) 8,011 951 435 314
Difference (42) (18) (2) (159) (80) (58) (440) (114) (81) (49)
Re-classification Entries (42) (19) 0 0 4 0 (24) (15) 0 0
Sales incentive and loyalty points earlier reported as selling expenses, now reduced from sales
(26) - - - - - (26) - - -
Cash discount earlier reported as interest expenses, now reduced from sales
(21) (21) - - - - (21) (21) - -
Early Delivery Charges (Exports) earlier reported as bank charges, now reduced from sales
(3) - - - - - - 0 - -
Revenue grossed up for Excise duty 8 - - - - - 26 - - -
Early payment discount now reduced from raw materialcost instead of adding to other income
- 2 - - 4 - (3) 6 - -
Re-measurement Entries 0 0 (2) (159) (84) (58) (416) (99) (81) (49)
Sales de-recognized where dealer has a right to return inventory
- - - (159) (73) (73) (159) (73) (73) (73)
*Share of JV’s where Arvind does not have a controlling stake, now recognized on Equity Method
- - - - - - (256) (17) (10)
Pre-paid advertisement expenses charged off on incurrence
- - - - (5) (5) - (5) (5) (5)
ECL - Trade Receivable - - - - (7) (7) - (7) (7) (7)
Re-measurement of Defined Benefit Plan - 3 - - 1 1 - 5 5 5
Decrease in depreciation due to fair valuation of certain assets
- - 1 - - 3 - - 14 14
DTA on reduced PBT due to above changes - - 0 - - 22 - - - 23
Others - (3) (3) - (0) (1) - (2) (5) (5)
12
Financial Performance - Standalone
13
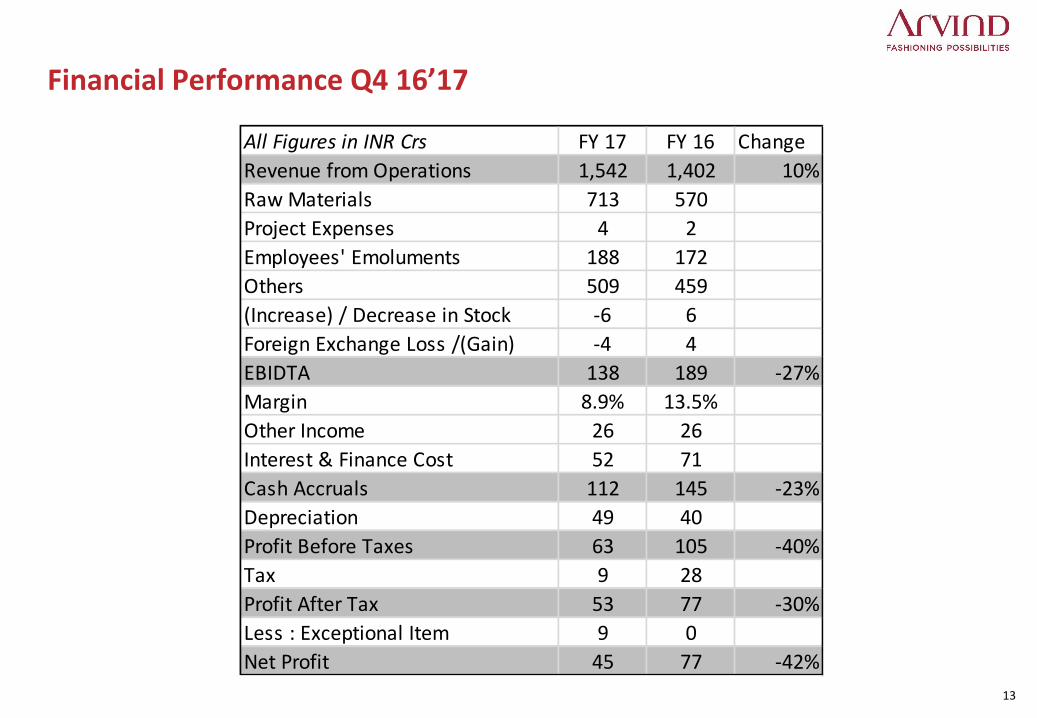
Financial Performance Q4 16’17
All Figures in INR Crs FY 17 FY 16 Change
Revenue from Operations 1,542 1,402 10%
Raw Materials 713 570
Project Expenses 4 2
Employees' Emoluments 188 172
Others 509 459
(Increase) / Decrease in Stock -6 6
Foreign Exchange Loss /(Gain) -4 4
EBIDTA 138 189 -27%
Margin 8.9% 13.5%
Other Income 26 26
Interest & Finance Cost 52 71
Cash Accruals 112 145 -23%
Depreciation 49 40
Profit Before Taxes 63 105 -40%
Tax 9 28
Profit After Tax 53 77 -30%
Less : Exceptional Item 9 0
Net Profit 45 77 -42%
14
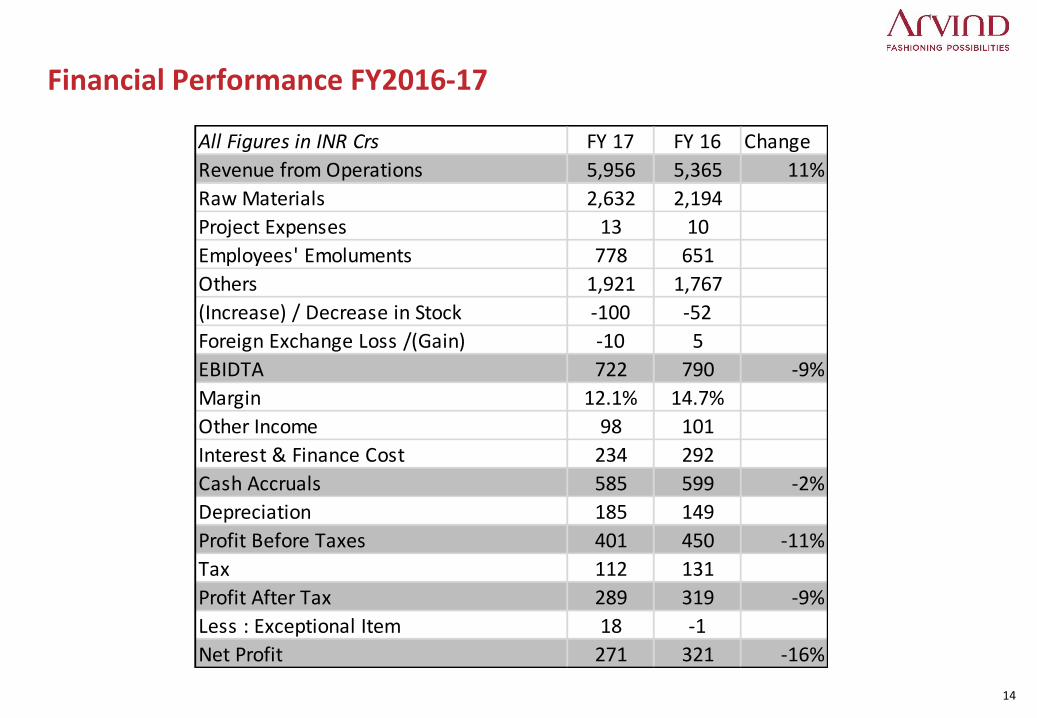
Financial Performance FY2016-17
All Figures in INR Crs FY 17 FY 16 Change
Revenue from Operations 5,956 5,365 11%
Raw Materials 2,632 2,194
Project Expenses 13 10
Employees' Emoluments 778 651
Others 1,921 1,767
(Increase) / Decrease in Stock -100 -52
Foreign Exchange Loss /(Gain) -10 5
EBIDTA 722 790 -9%
Margin 12.1% 14.7%
Other Income 98 101
Interest & Finance Cost 234 292
Cash Accruals 585 599 -2%
Depreciation 185 149
Profit Before Taxes 401 450 -11%
Tax 112 131
Profit After Tax 289 319 -9%
Less : Exceptional Item 18 -1
Net Profit 271 321 -16%
15
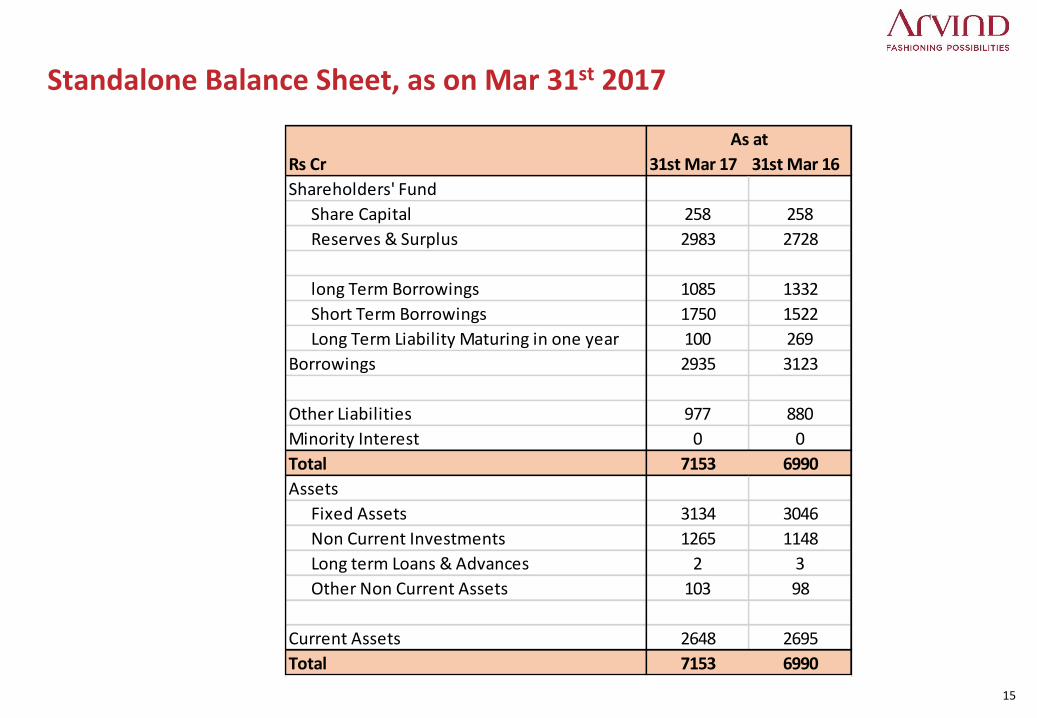
Standalone Balance Sheet, as on Mar 31st 2017
Rs Cr 31st Mar 17 31st Mar 16
Shareholders' Fund
Share Capital 258 258
Reserves & Surplus 2983 2728
long Term Borrowings 1085 1332
Short Term Borrowings 1750 1522
Long Term Liability Maturing in one year 100 269
Borrowings 2935 3123
Other Liabilities 977 880
Minority Interest 0 0
Total 7153 6990
Assets
Fixed Assets 3134 3046
Non Current Investments 1265 1148
Long term Loans & Advances 2 3
Other Non Current Assets 103 98
Current Assets 2648 2695
Total 7153 6990
As at
16
Business Analysis
17
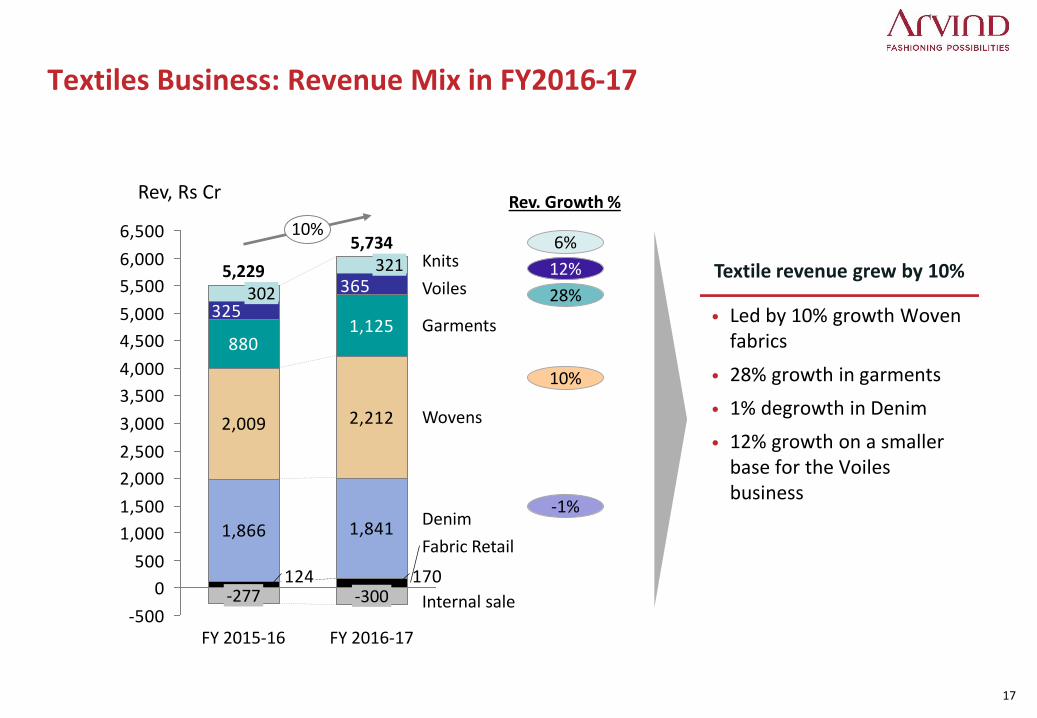
Textile revenue grew by 10%
Textiles Business: Revenue Mix in FY2016-17
1,866 1,841
1,125
170124
2,2122,009
880
365
325
-500
0
500
1,000
1,500
2,000
2,500
3,000
3,500
4,000
4,500
5,000
5,500
6,000
6,500
Voiles
Rev, Rs Cr
Wovens
Garments
5,73410%
Internal sale
Denim
Knits
FY 2016-17
-300
321
-277
302
FY 2015-16
Fabric Retail
5,229
• Led by 10% growth Woven fabrics
• 28% growth in garments
• 1% degrowth in Denim
• 12% growth on a smaller base for the Voiles business
6%
12%
28%
10%
-1%
Rev. Growth %
18
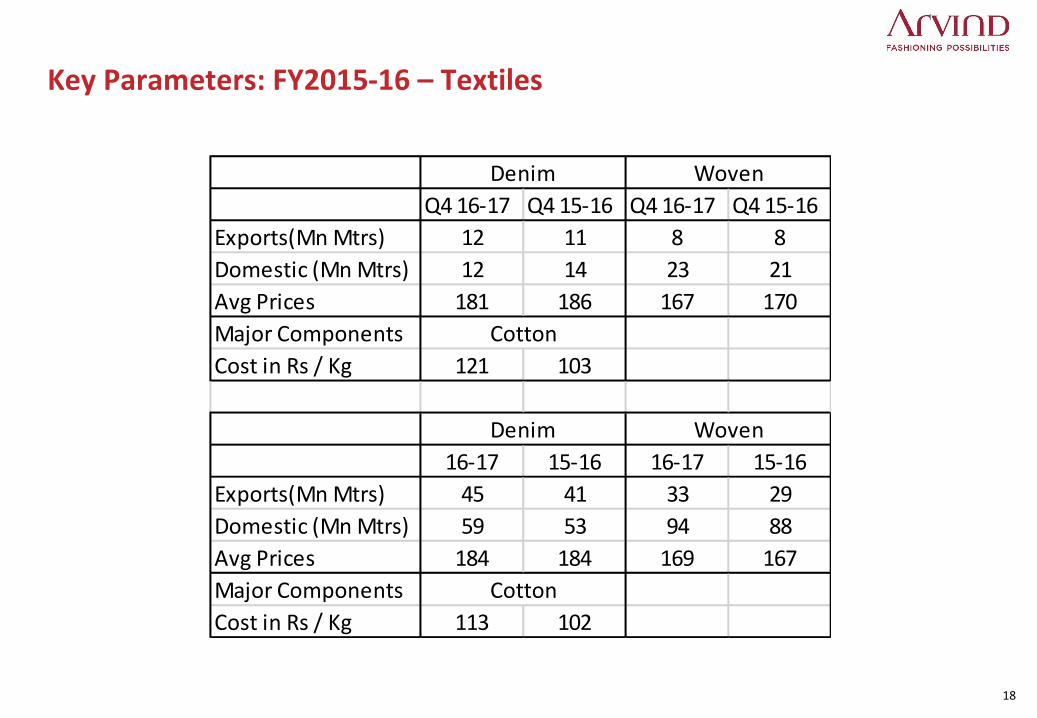
Key Parameters: FY2015-16 – Textiles
Q4 16-17 Q4 15-16 Q4 16-17 Q4 15-16
Exports(Mn Mtrs) 12 11 8 8
Domestic (Mn Mtrs) 12 14 23 21
Avg Prices 181 186 167 170
Major Components
Cost in Rs / Kg 121 103
16-17 15-16 16-17 15-16
Exports(Mn Mtrs) 45 41 33 29
Domestic (Mn Mtrs) 59 53 94 88
Avg Prices 184 184 169 167
Major Components
Cost in Rs / Kg 113 102
Cotton
Denim Woven
Cotton
Denim Woven

19
Brands & Retail business
20
Brands and Retail delivered an industry leading performance in a challenging quarter
Q4 FY17 highlights
• 22% topline growth even though the effect of demonetization continued through January and February
• EBITDA grew ~2.5x over Q4 in FY16
FY17 highlights
• 26% growth in top-line
• 50 bps improvement in EBIDTA
21
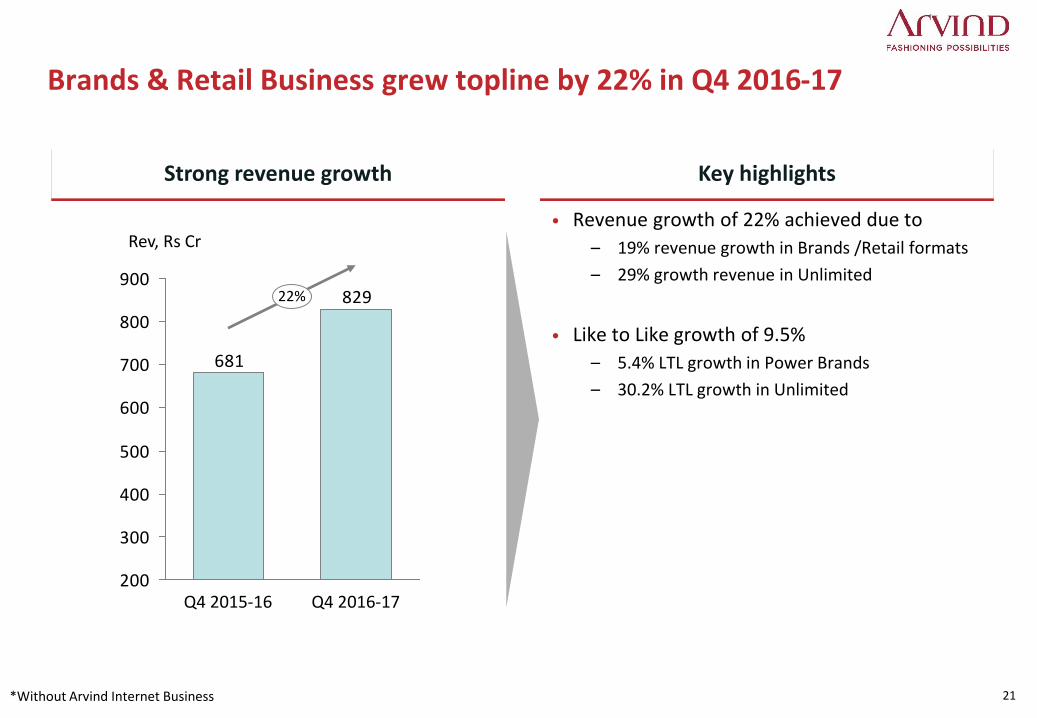
Brands & Retail Business grew topline by 22% in Q4 2016-17
829
681
200
300
400
500
600
700
800
900
Q4 2016-17
Rev, Rs Cr
22%
Q4 2015-16
Strong revenue growth Key highlights
*Without Arvind Internet Business
• Revenue growth of 22% achieved due to
– 19% revenue growth in Brands /Retail formats
– 29% growth revenue in Unlimited
• Like to Like growth of 9.5%
– 5.4% LTL growth in Power Brands
– 30.2% LTL growth in Unlimited
22
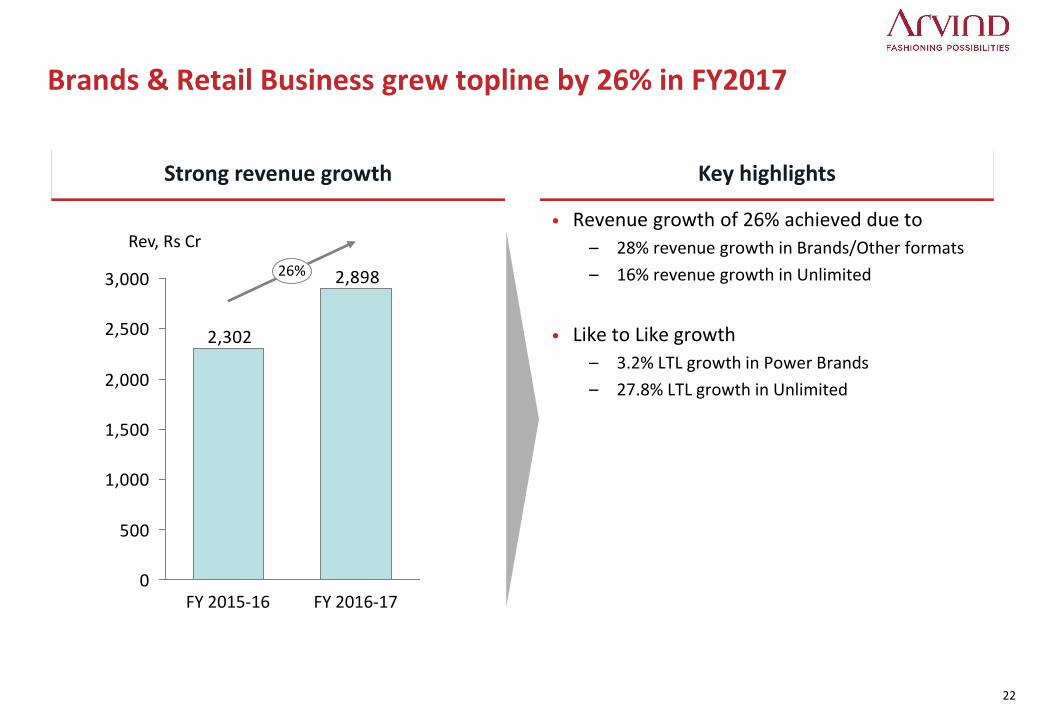
Brands & Retail Business grew topline by 26% in FY2017
Strong revenue growth Key highlights
• Revenue growth of 26% achieved due to
– 28% revenue growth in Brands/Other formats
– 16% revenue growth in Unlimited
• Like to Like growth
– 3.2% LTL growth in Power Brands
– 27.8% LTL growth in Unlimited
2,898
2,302
0
500
1,000
1,500
2,000
2,500
3,000
FY 2015-16
26%
Rev, Rs Cr
FY 2016-17

23
Power Brands ‘powered’ the top-line and margins for Brands & Retail
4266
0
20
40
60
80
0
5
10
15
EBITDA %EBITDA Rs Cr
Q4 2016-17
12.7%
Q4 2015-16
9.9%
515427
0
200
400
600
Revenues Rs Cr+21%
Q4 2016-17Q4 2015-16
1,6781,369
0
500
1,000
1,500
2,000
Revenues Rs Cr
+23%
FY 2016-17FY 2015-16
154210
0
100
200
300
0
5
10
15
EBITDA %EBITDA Rs Cr
FY 2016-17
12.5%
FY 2015-16
11.3%
Revenue Rs CrEBITDA Rs CrEBITDA %
Q4 performance FY 2016-17
24
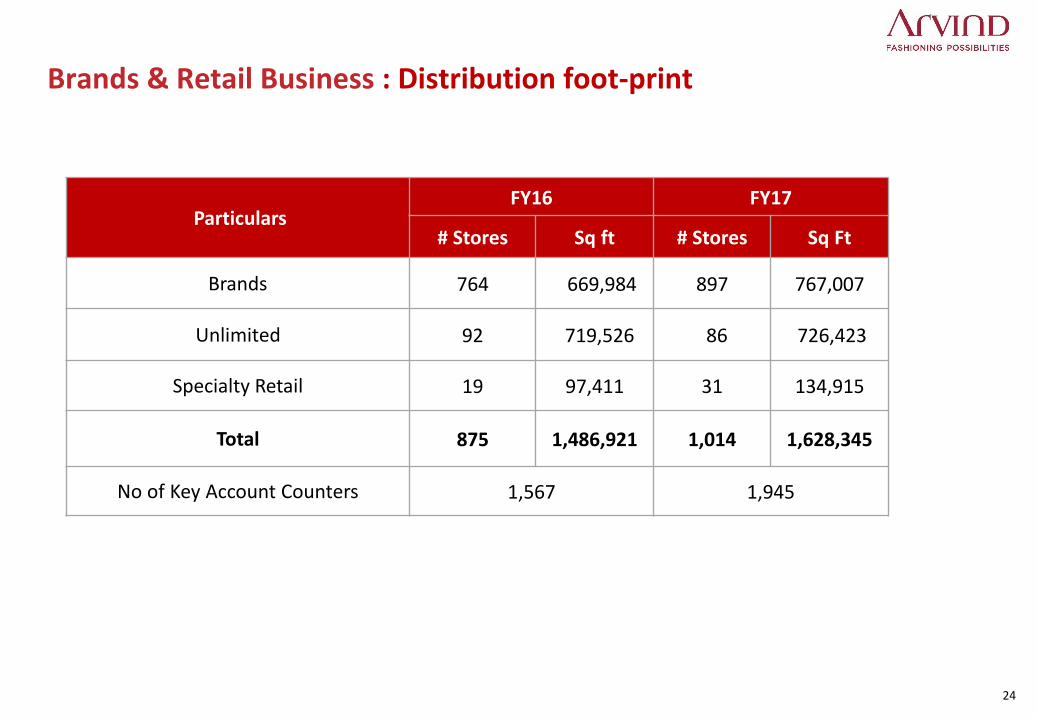
Brands & Retail Business : Distribution foot-print
Particulars FY16 FY17
# Stores Sq ft # Stores Sq Ft
Brands 764 669,984 897 767,007
Unlimited 92 719,526 86 726,423
Specialty Retail 19 97,411 31 134,915
Total 875 1,486,921 1,014 1,628,345
No of Key Account Counters 1,567 1,945
25
Outlook for full year FY2018
• Expect revenue growth of ~ 13%
– Revenue growth in Textiles 8%
– Revenue growth in Branded Apparel at 22-24%
• Overall EBIDTA margin likely to be lower due to mix change
– Textile Margin will be impacted due to currency appreciation and cotton price increases
– Brand and Retail Margin to sharply go up: Expect about 150 basis improvement in margins
• GST
– There is considerable uncertainty regarding GST rates, transition provisions and drawback rates
– Once these clarity emerges, we will revise our outlook for the year
Thank You!