Arvind Limited Review Note Q4 &...
18
Arvind Limited – Review Note Q4 & 2012-13 16 th May 2013, Ahmedabad
Transcript of Arvind Limited Review Note Q4 &...

Arvind Limited – Review Note Q4 & 2012-13
16th May 2013, Ahmedabad
Moderate revenue growth Strong profitability improvement
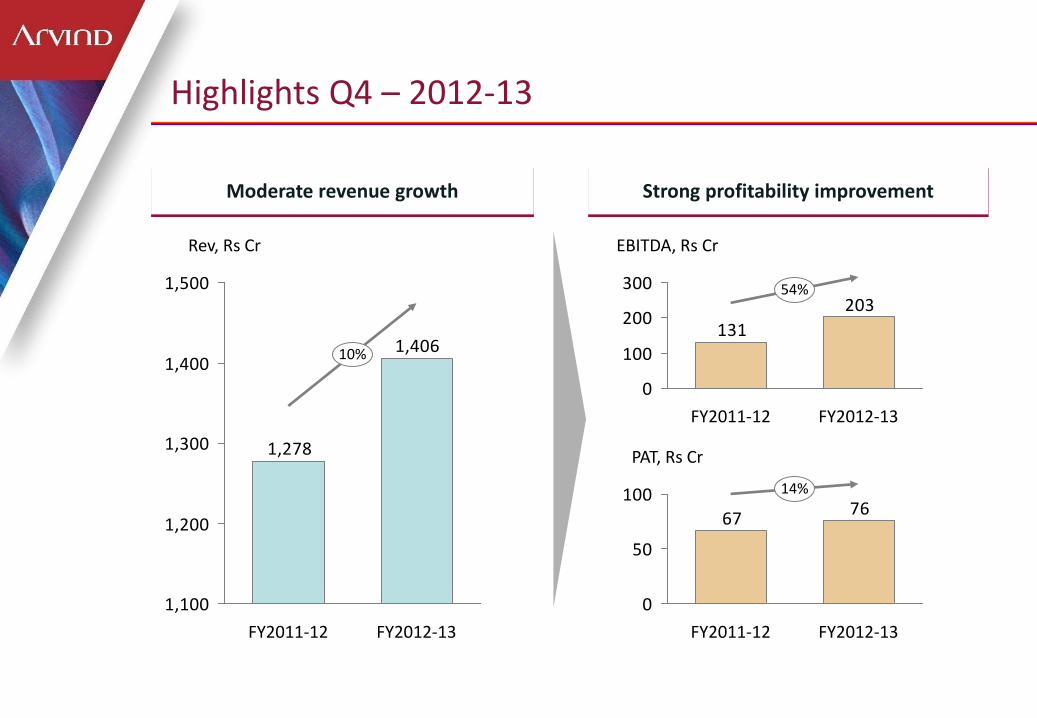
Highlights Q4 – 2012-13
1,406
1,278
1,100
1,200
1,300
1,400
1,500
Rev, Rs Cr
10%
FY2012-13 FY2011-12
203
131
0
100
200
300 54%
FY2012-13 FY2011-12
EBITDA, Rs Cr
7667
0
50
100
PAT, Rs Cr
14%
FY2012-13 FY2011-12

Revenue Growth of 10% achieved due to • 29% volume growth in shirting/khaki
textiles business • 17% topline growth in Brands & Retail
business • 15% price growth in Denim leading to 4%
topline growth despite 10% volume decline
EBIDTA Margin • EBIDTA margin improvement across all
textiles as well as brand & retail verticals One-time Depreciation charge Rs 7.6 Cr • As company decided to increase
depreciation from about 7% to 15% in Brands & Retail assets
Rs Cr
Q4FY13 Q4FY12 Change
Revenues 1,406 1,278 10%
Raw Materia l Consumed 610 594
Project Expenses 47 49
Employees ' Emoluments 149 116
Others 481 412
(Increase) / Decrease in Stock -83 -24
EBIDTA 203 131 54%
Margin 14.4% 10.3%
Other Income 20 41
Finance Cost 82 66
Cash Accruals 141 106 33%
Depreciation 64 41
Profi t Before Tax 76 65 17%
Net Profi t a fter Minori ty Interest 76 67 14%
Financial Performance Q4 – 2012-13
Key highlights
Moderate revenue growth Strong improvement in operating margins
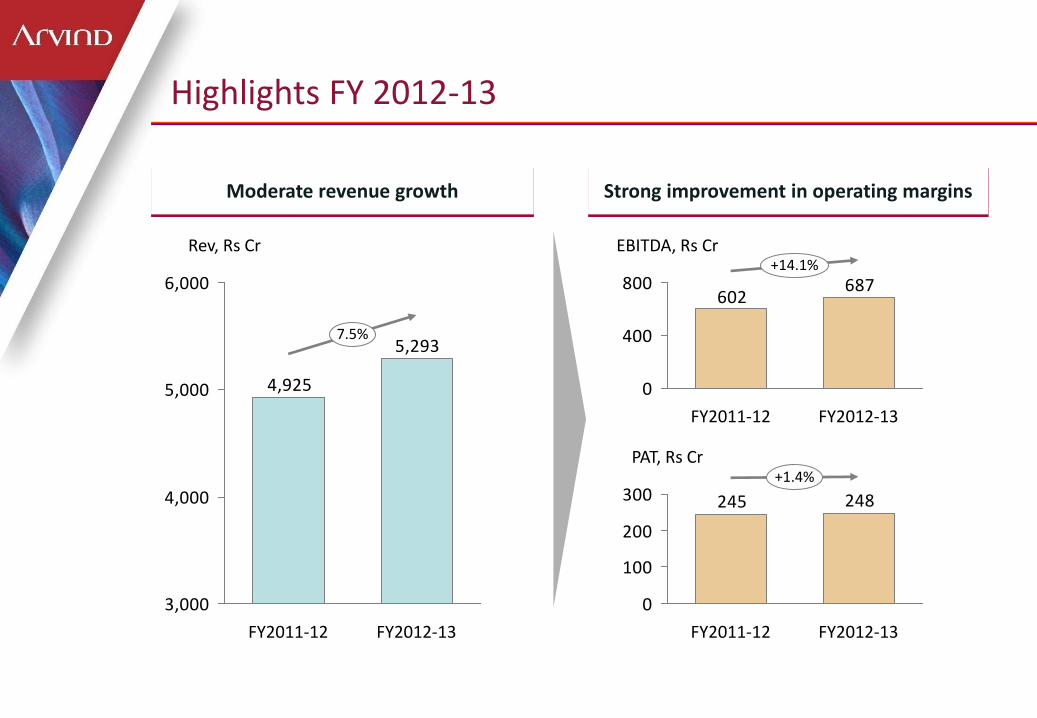
Highlights FY 2012-13
5,293
4,925
3,000
4,000
5,000
6,000
Rev, Rs Cr
7.5%
FY2012-13 FY2011-12
687602
0
400
800+14.1%
FY2012-13 FY2011-12
EBITDA, Rs Cr
248245
0
100
200
300
PAT, Rs Cr +1.4%
FY2012-13 FY2011-12

Revenue growth of 7% despite impact of strike and economic slow down • 28% volume growth in shirting/khaki
textiles business • 25% topline growth in Brands & Retail
business • 2% increase in revenues of MegaMart • 7% drop in denim volume and 4%
drop in revenues, largely caused by Strike during Q1
Financial Performance – FY2012-13
Key highlights
**Extra ordinary income in the last year was on account of sale of shares of VF Arvind Brands Pvt Limited
2012-13 2011-12 Change
Revenue from Operations 5293 4925 7%
RawMaterials 2512 2349
Project Expenses 110 100
Employees' Emoluments 566 451
Others 1687 1458
(Increase) / Decrease in Stock -285 -55
Foreign Exchange Loss /(Gain) 15 19
EBIDTA 687 602 14%
Margin 13.0% 12.2%
Other Income 81 117
Interest Cost 315 309
Cash Accruals 453 410 10%
Depreciation 204 161
Profit Before Taxes 248 248
Profit After Tax 248 245 1%
Extra Ordinary Item** 0 191
Net Profit 248 436
Rs Cr
EB
IDTA
m
arg
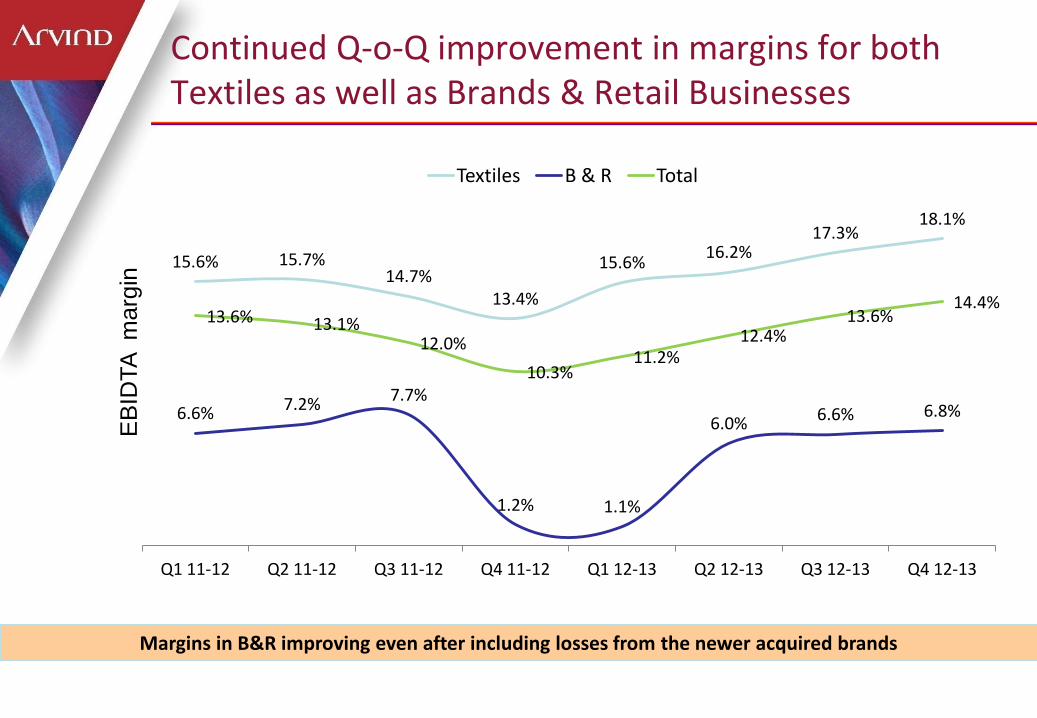
in 15.6% 15.7%
14.7% 13.4%
15.6% 16.2%
17.3% 18.1%
6.6% 7.2% 7.7%
1.2% 1.1%
6.0% 6.6% 6.8%
13.6% 13.1% 12.0%
10.3% 11.2%
12.4% 13.6%
14.4%
Q1 11-12 Q2 11-12 Q3 11-12 Q4 11-12 Q1 12-13 Q2 12-13 Q3 12-13 Q4 12-13
Textiles B & R Total
Margins in B&R improving even after including losses from the newer acquired brands
Continued Q-o-Q improvement in margins for both Textiles as well as Brands & Retail Businesses
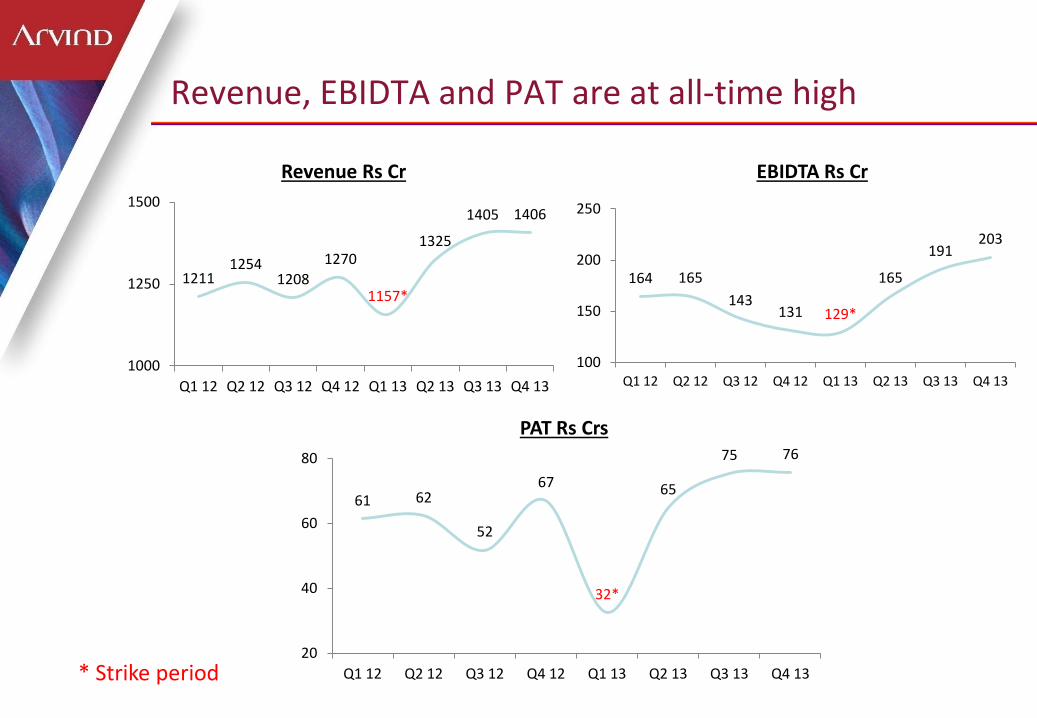
1211 1254
1208
1270
1157*
1325
1405 1406
1000
1250
1500
Q1 12 Q2 12 Q3 12 Q4 12 Q1 13 Q2 13 Q3 13 Q4 13
Revenue Rs Cr
61 62
52
67
32*
65
75 76
20
40
60
80
Q1 12 Q2 12 Q3 12 Q4 12 Q1 13 Q2 13 Q3 13 Q4 13
PAT Rs Crs
164 165
143 131 129*
165
191 203
100
150
200
250
Q1 12 Q2 12 Q3 12 Q4 12 Q1 13 Q2 13 Q3 13 Q4 13
EBIDTA Rs Cr
* Strike period
Revenue, EBIDTA and PAT are at all-time high
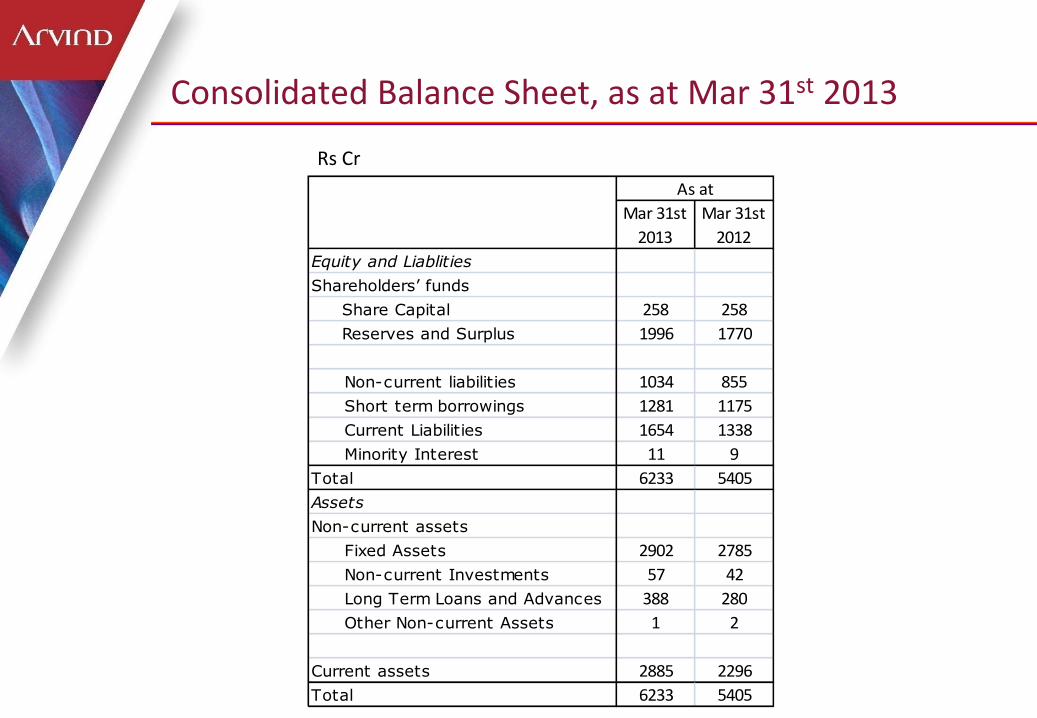
Mar 31st
2013
Mar 31st
2012
Equity and Liablities
Shareholders’ funds
Share Capital 258 258
Reserves and Surplus 1996 1770
Non-current liabilities 1034 855
Short term borrowings 1281 1175
Current Liabilities 1654 1338
Minority Interest 11 9
Total 6233 5405
Assets
Non-current assets
Fixed Assets 2902 2785
Non-current Investments 57 42
Long Term Loans and Advances 388 280
Other Non-current Assets 1 2
Current assets 2885 2296
Total 6233 5405
As at
Consolidated Balance Sheet, as at Mar 31st 2013
Rs Cr
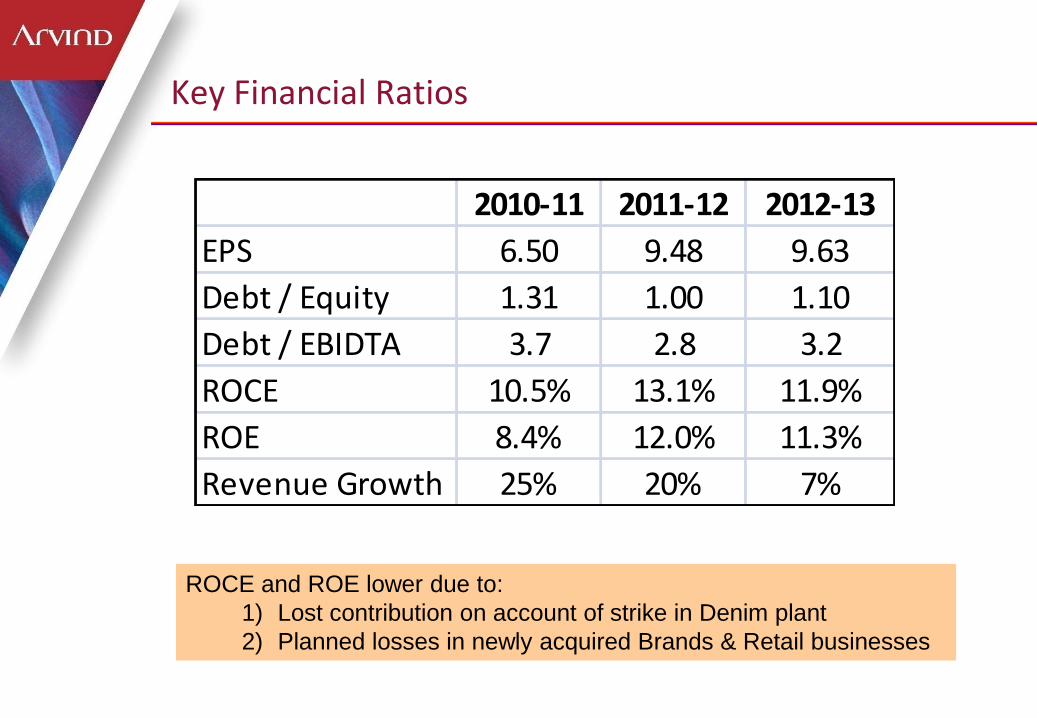
ROCE and ROE lower due to:
1) Lost contribution on account of strike in Denim plant
2) Planned losses in newly acquired Brands & Retail businesses
Key Financial Ratios
2010-11 2011-12 2012-13
EPS 6.50 9.48 9.63
Debt / Equity 1.31 1.00 1.10
Debt / EBIDTA 3.7 2.8 3.2
ROCE 10.5% 13.1% 11.9%
ROE 8.4% 12.0% 11.3%
Revenue Growth 25% 20% 7%
Business Analysis All numbers in this section are consolidated unless specified otherwise
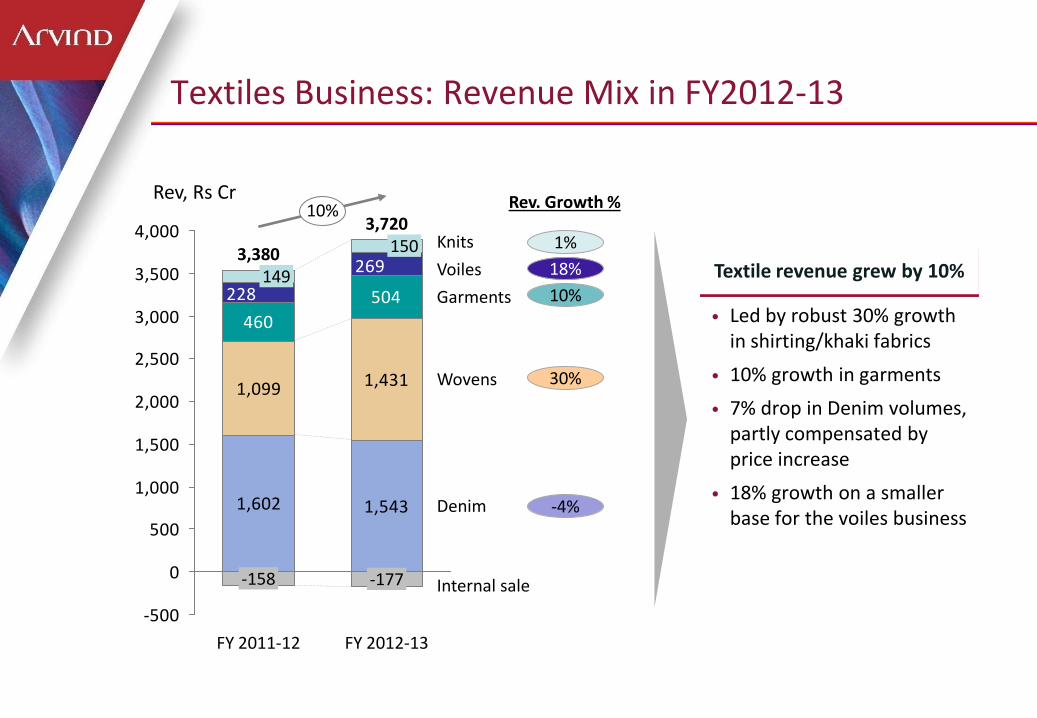
Textile revenue grew by 10%
Textiles Business: Revenue Mix in FY2012-13
1,602 1,543
1,099 1,431
460
504
269
228
-500
0
500
1,000
1,500
2,000
2,500
3,000
3,500
4,000
FY 2012-13
150
Wovens
Knits
Denim
Rev, Rs Cr
Internal sale -177
3,720
Garments
Voiles
FY 2011-12
3,380
-158
149
10%
• Led by robust 30% growth in shirting/khaki fabrics
• 10% growth in garments
• 7% drop in Denim volumes, partly compensated by price increase
• 18% growth on a smaller base for the voiles business
1%
18%
10%
30%
-4%
Rev. Growth %
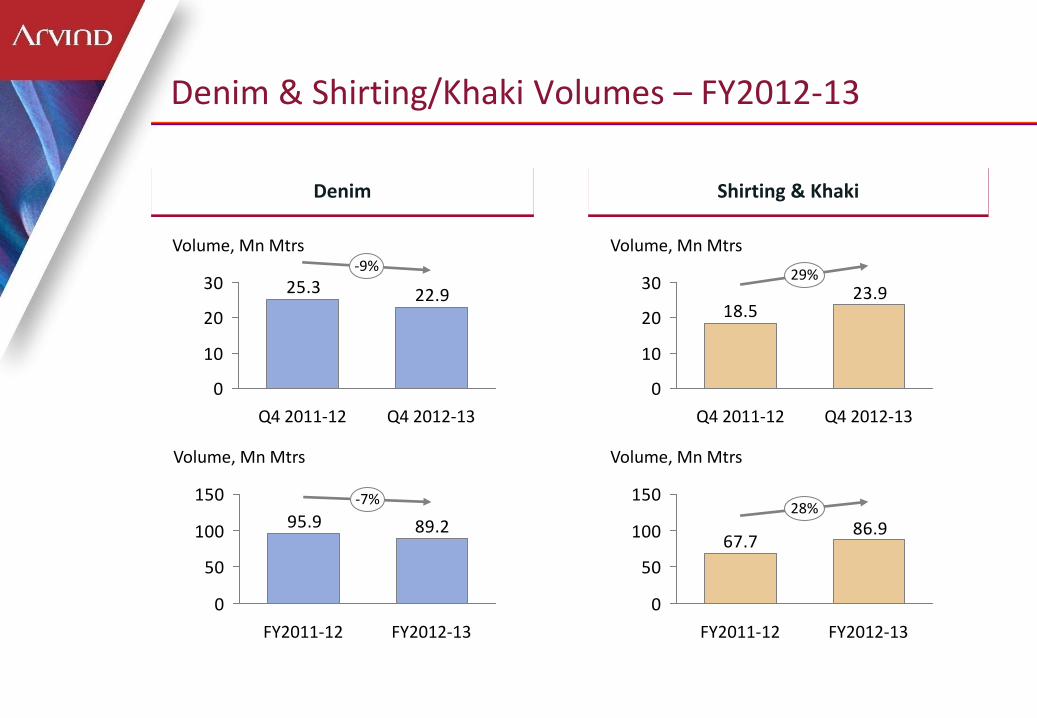
Denim Shirting & Khaki
Denim & Shirting/Khaki Volumes – FY2012-13
23.918.5
0
10
20
30
Volume, Mn Mtrs
29%
Q4 2012-13 Q4 2011-12
86.967.7
0
50
100
150
Volume, Mn Mtrs
FY2011-12 FY2012-13
28%
22.925.3
0
10
20
30
Volume, Mn Mtrs -9%
Q4 2012-13 Q4 2011-12
89.295.9
0
50
100
150
Volume, Mn Mtrs
-7%
FY2012-13 FY2011-12
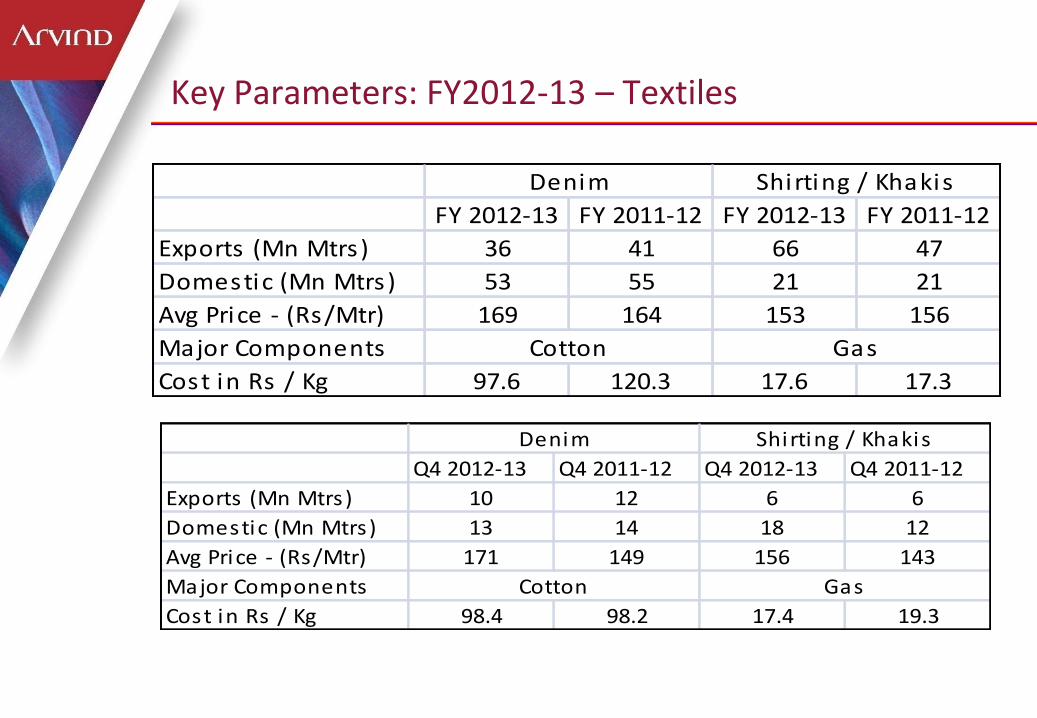
FY 2012-13 FY 2011-12 FY 2012-13 FY 2011-12
Exports (Mn Mtrs) 36 41 66 47
Domestic (Mn Mtrs) 53 55 21 21
Avg Price - (Rs/Mtr) 169 164 153 156
Major Components
Cost in Rs / Kg 97.6 120.3 17.6 17.3
Cotton Gas
Denim Shirting / Khakis
Q4 2012-13 Q4 2011-12 Q4 2012-13 Q4 2011-12
Exports (Mn Mtrs) 10 12 6 6
Domestic (Mn Mtrs) 13 14 18 12
Avg Price - (Rs/Mtr) 171 149 156 143
Major Components
Cost in Rs / Kg 98.4 98.2 17.4 19.3
Shirting / Khakis
Cotton Gas
Denim
Key Parameters: FY2012-13 – Textiles
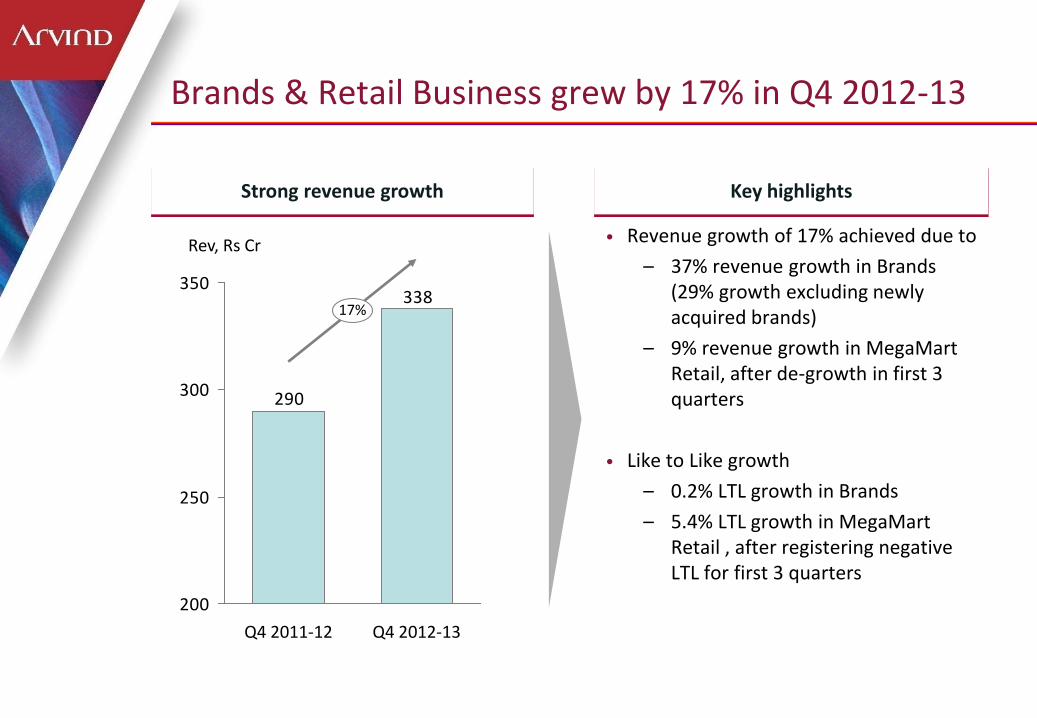
Strong revenue growth Key highlights
Brands & Retail Business grew by 17% in Q4 2012-13
338
290
200
250
300
350
Rev, Rs Cr
17%
Q4 2012-13 Q4 2011-12
• Revenue growth of 17% achieved due to
– 37% revenue growth in Brands (29% growth excluding newly acquired brands)
– 9% revenue growth in MegaMart Retail, after de-growth in first 3 quarters
• Like to Like growth
– 0.2% LTL growth in Brands
– 5.4% LTL growth in MegaMart Retail , after registering negative LTL for first 3 quarters
Strong revenue growth Key highlights
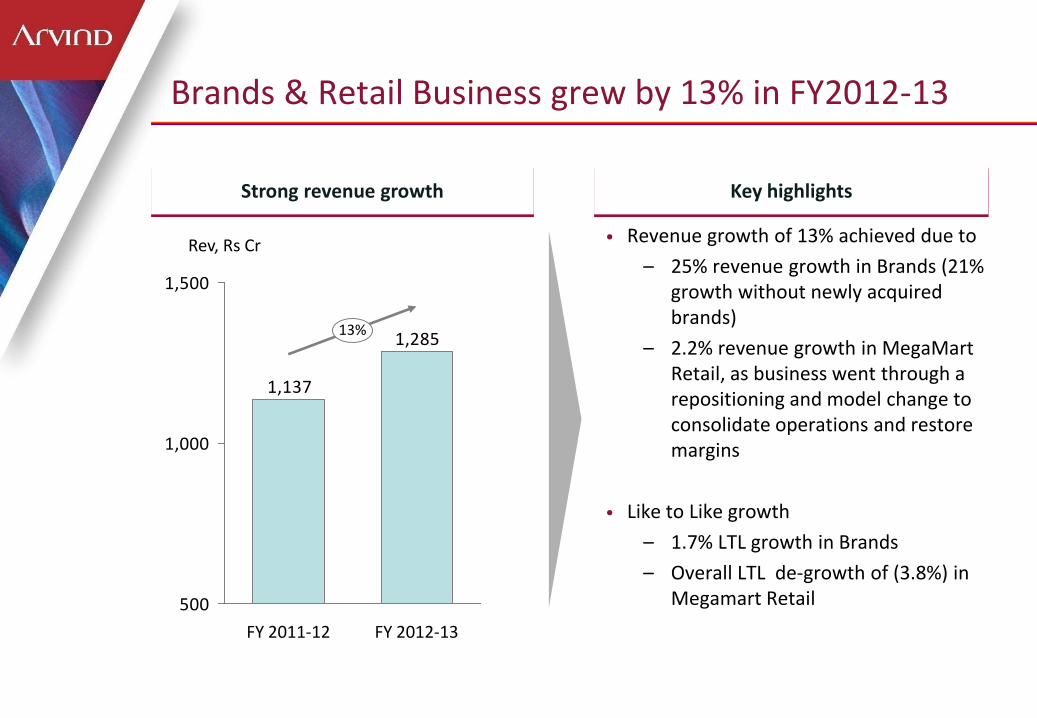
Brands & Retail Business grew by 13% in FY2012-13
1,285
1,137
500
1,000
1,500
Rev, Rs Cr
13%
FY 2012-13 FY 2011-12
• Revenue growth of 13% achieved due to
– 25% revenue growth in Brands (21% growth without newly acquired brands)
– 2.2% revenue growth in MegaMart Retail, as business went through a repositioning and model change to consolidate operations and restore margins
• Like to Like growth
– 1.7% LTL growth in Brands
– Overall LTL de-growth of (3.8%) in Megamart Retail

• Sales Increase in Key Account Counters: Growth of 32%
Particulars
FY11-12 FY12-13
# Stores Sq.ft # Stores Sq.ft
Brands 352 330,943 487 504,015
MM 216 691,770 197 710,133
Total 568 1,022,713 684 1,214,148
No of KA Exclusive Counters 327 376
Total KA Counters with Sub Brands
481 576
Brands & Retail Business – Distribution
Outlook for FY2013-14
• Revenue growth expected to be over 20% on account of volume growth in both Textiles and Brands & Retail
– Textiles: 12-15%
– Brands & Retail: 25%+
• International demand for textiles strong: Indian retail demand sluggish
• Company expects that margins for the coming year will be maintained – Margin for the Textiles businesses may improve marginally
– Margins for the Brands & Retail businesses may fall marginally due to higher investments in marketing and distribution for the newly acquired brands
Thank You