Management, protection and depopulation in the Biosphere ...
DOCUMENT RESUME
ED 066 250 RC 006 368
AUTHOR Drudy, P. J.; Wallace, D. B.TITLE The Causes and Consequences of Rural Depopulation:
Case Studies of Declining Communities.PUB DATE Aug 72NCrE 25p.; Paper prepared for the Third World Congress for
Rural Sociology, Baton Rouge, Louisiana, August1972
EDRS PRICE MF-$0.65 HC-$3.29DESCRIPTORS *Case Studies; Community Attitudes; History;
*Migration; *Population Trends; *Rural Population;Socioeconomic Influences; Tables (Data); *UrbanAreas
IDENTIFIERS *Great Britain
ABSTRACTIn this paper, the rural depopulation process in
Great Britain over the last 20 years is examined. The causes andconsequences of rural depopulation were examined in 4 fairly typicalrural communities; these 4 communities and their present populationsare (1) the Highlands and Islands of Scotland, 283,000; (2)Mid-Wales, 174,000; (3) North Norfolk in Eastern England, 29,000; and(4) North Mayo in Western Ireland, 32,000. All of these communitieshave registered a decline in population during the last 20 years,with the Scottish area showing some recovery during the last 10years. This paper also examines economic and social factorsassociated with migration in North Norfolk. Findings suggest that theconsiderable realignment of the structure and organization ofagriculture is the basis for migration from these areas. Otherpossible reasons for migration include entry into an occupation otherthan agriculture, individual levels of occupational aspiration, anddegree of satisfaction with the local community. The consequences ofdepopulation include unbalanced age structures and sex ratios in therural population and a decline in demand of such seririces as publictransportation; considered a most serious consequence, the effectsbecome causes in themselves. Data are presented in tabular form.(NQ)

U.S. DEPARTMENT OF HEALTH.EDUCATION & WELFAREOFFICE OF EDUCATION
THIS DOCUMENT HAS SEEM REPRO-DUCED EXACTLY AS RECEIVED FROMTHE PERSON OR ORGANIZATION ORIG-INATING IT. POINTS OF VIEW OR OPIN-IONS STATED DO NOT NECESSARILYREPRESENT OFFICIAL OFFICE OF EDU-CATION POSITION OR POLICY.
THE CAUSE AND CONSOMME OF RURAL DEPOPULATION
CASE STUDDS OF DECLINING COMMUNITIM.
P. J. Drudy and D. B. Wallace
Deportment of Land Economy
University of Cambridge.
Paper to Third World Congress for Rural Socioloff
Baton Rouge
Louisiana.
August 1972

THE CAUSES AND CONSEQUENCIS OF RURAL DEPOPUIATION
CASE STUMM OF DECLINING COMMUNITIES.
P. J. Drudy and D. B. Wallace
Department of Land Econow
University of Cambridge.
Paper to Third World Congress for Rural Sociolopy
Baton Rouge
Louisiana.
Augus t 1972
2

3
The Causes and Consequences of Rural Depopulation:
Case Studies of Declining Communities.
P. J. Drudy and D. B. Wallace
Department of Land Economy
University of Cambridge.
Introduction
The movement of population to urban areas is not a new phenomenon in
Britain. Rural depopulation has been a demographic reality for more than
120 years. The overall population of ibgland and Wales increased from 18
millions in 1851 to 44 millions in 1951. However, in 1851 the proportion
was 50 per cent urban and 50 per cent rural while in 1951 it was 81 per cent
urban and 19 per cent rural.
Since early in the present century the question of exodus of population
from rural areas has received considerable attention. In 1914, A.L. Howley
published his pioneering study in the Statistical Journal.' He showed that
the only rural counties which increased in population between 1861 and 1911
were Sussex, Kent and Surrey because of their closeness to London, Cheshire
and Worcester because of proximity to industrial centres and Flint and
Caernarvon because of mining developments.
In the twenties and thirties, the debate on rural decline continued
and reached its culmination in the early 1940's with the setting up of a
Government Committee to examine and report on the problems of rural communities.
That Committee published what is now known as the Scott Report.2
This Report
adopted a rather preservationist view of rural areas and its recommendations
were preservationist rather than developmental. Agriculture was regarded as
having the almost sole right to land in rural areas and it was suggested that
industrialisation was desirable only to a limited degree.
A comprehensive study by Saville showed that the depopulation of

Introduction
The movement of population to urban areas is not a new phenomenon in
Britain. Rural depopulation has been a demographic reality for more than
120years. The averall population of thgland and Wales increased from 18
millions in 1851 to 44 millions in 1951. However, in 1851 the proportion
was 50 per cent urban and 50 per cent rural while in 1951 it was 81 per cent
urban and 19 per cent rural.
Since early in the present century the question of exodus of population
from rural areas has received considerable attention. In 1914, A.L. Bowley
published his pioneering study in the Statistical Journal). He showed that
the only rural counties which increased in population between 1861 and 1911
were Sussex, Kent and Surrey because of their closeness to London, Cheshire
and Worcester because of proximity to industrial centres and Flint and
Caernarvon because of mining developments.
In the twenties and thirties, the debate on rural decline continued
and reached its cuLmination in the early 1940's with the setting up of a
Government Committee to extunine and report on the problems of rural communities.
That Committee published what is now known as the Scott Report.2
This Report
adopted a rather preservationist view of rural areas and its recommendations
were preservationist rather than developmental. Agriculture was regarded as
having the almost sole right to land in rural areas and it was suggested that
industrialisation was desirable only to a limited degree.
A comprehensive study by Saville shawed that the depopulation of
rural areas had not abated, as was thought to be the case, by the 1950's.3
Saville illustrated his point with the counties of Rutland and Warwickshire
Rutland increased in population until 1850 but since then it had shown decline.
1 Bewley A.L., "Rural Population in zhgland andWales, A Study of the Changesof Density, Occupations and Ages", Journal of the Royal StatisticalSociety, Vol. INIVII, May 1914, pp. 597-645.
2 Report of the Committee on Land Utilization in Ih]ral Areas, under the Chairman-ship of Sir Leslie Scott, Onnd 6378, H.N.S.O., London, 1942.
3 Saville J., Rural Depopulation in &gland and Wales 1851-1951, Routledge andKegan Paul, London, 1957.
4

paris,des wiLa a population of less than lUGO had declined sharply and this
decline was continuing. In the case of Warwickshire, an industrial county
around Birmingham, total population had increased sharply since 1850 but the
more remote parishes and particularly those with populations of less than 500
had again declined. Saville concluded that rural depopulation in England and
Wales had continued as far as the remoter rural areas and smaller villages were
concerned.1
During the period 1951 to 1971 the proportion of the population living in
rural areas increased from 19 per cent to 22 per cent. This hange might be
taken to be an indication of stabilisation or even reverse in the rural-urban
drift but closer examination does not confirm this. Many places classified
as rural areas for Census purposes are on the fringes of urban areas and it is
in these areas that the main population increases have taken place.2
In fact,
the predominantly agricultural counties and remoter areas continued to lose
population between 1951 and 1971. Rural depopulation has operated in similar
areas in Scotland and Ireland although both of these countries have become
better known for their large-scale emigration. In the present paper, the
depopulation process is examined in one rural community each from Ehgland,
Wales, Scotland and Ireland over the last 20 year period.
The Selected Rural Communities3
The four communities examined are the Hielands and Islands of Scotland,
Hid-Wales, North Norfolk in Eastern England and North Mayo in Western Ireland.
The Scottish area comprises the counties of Caithness, Argyll, Ross and Cromarty,
I Saville J., op. cit., pp. 73-88.2 See Lind H., "Internal Migration in Britain", in Jr:.cissah J.A. (Ed.), Migration,
The University Press, Cambridge, 1969, pp. 80-82 for discussion on thispoint.
3 In this paper we follow the definition of "community" given by Parsons,because of its spatial and geographical connotations, i.e. "A. communityis that collectivity the members of which have a common territorial areaas their base of operations for daily activities". See Talcott Parsons,The Social System, Routledge and Kegan Paul, London, 1967, p. 91.The rural-urban dichotomy is now meaningless to some extent. For our
purposes, the term 'rural community' eMbraces a geographical regionwhere agriculture is pursued on the main land nrea and where there isno large urban complex, but rather a number of small market towns andvillages.

(,)
3
Inverness, Orkney, Sutherland and Shetland and has a population of about 283,000.
The main urban area is Inverness with a population of around 30,000. The
region is mainly a mountainous one and sheep is the most important farm enter-
prise with cattle as r. subsidiary in some areas. About 80 per cent of all
holdings (or crofts as they are termed) are less than 30 acres in size.
Mid-Wales includes the cOunties of Cardigan, Merioneth, part of Breconshire,
Montgomery and Radnorshire and has a total population of about 174,000. The
largest town is Aberystwyth with a population of 10,000. This area is also a
mountainous one and sheep is also the predominant farm enterprise although
cattle production is more important in some lowland areas. About 33 per cent
of the holdings are under 30 acres. North Mayo and North Norfolk contrast
with the above areas in land area, population size and farming type. North
Mayo has a total population of almost 32,000, the main town having 0000
persons. The main population is accommodated in small villages or on single
farms. Like the two larger communities, this area is predominantly a livestock
one but the main enterprises here are cattle production and dairy farming.
There is little emphasis on cereals or root crops. Almost 70 per cent of the
holdings are under 30 acres.
North Norfolk has a total population of about 29,000. The largest town
has 4,000 population with two others at the 2,000 level. The remaining
population live in settlements under 300 population or on single farms throughout
the countryside. In contrast to the other communities, the area is one of rich
arable farming, the major crops being barley, wheat and sugar beet. Agriculture
is also mmre highly mechanized than in any of the other areas. Although some
40 per cent of the farms nre under 30 acres the main acreage and production is
accounted for by 15 per cent which are over 500 acres. Like the other areas,
agriculture is the predominant occupation, 33 per cent of the employed population

holdings (or crofts as they are termed) are less than 30 acres in size.
Mid-Wales includes the counties of Cardigan, Merioneth, part of Breconshire,
Montgomery and Radnorshire and has a total population of about 174,000. The
largest town is Aberystwyth with a population of 10,000. This area is also a
mountainous one and sheep is also the predominant farm enterprise although
cattle production is more important in some lowland areas. About 33 per cent
of the holdings are under 30 acres. North Mayo and North Norfolk contrast
with the above areas in land area, population size and farming type. North
Mayo has a total population of almost 32,000, the nmin town having 6000
persons. The main population is accommodated in small villages or on single
farms. Like the two larger communities, this area is predominantly a livestock
one but the main enterprises here are cattle production and dairy farming.
There is little emphasis on cereals or root crops. Almost 70 per cent of the
holdings are under 30 acres.
North Norfolk has a total population of about 29,000. The largest town
has 4,000 population with two others at the 2,000 level. The remaining
population live in settlements under 300 population or on single farms throughout
the countryside. In contrast to the other comamnities, the area is one of rich
arable farming, the major crops being barley, wheat and sugar beet. Agriculture
is also more highly mechanized than in any of the other areas. Although some
40 per cent of the farms are under 30 acres the main acreage and production is
accounted for by 15 per cent which are over 500 acres. Like the other areas,
agriculture is the predominant occupation, 33 per cent of the employed population
being still employed in this sector.
The pattern of population change over the period 1951-1971 is now
considered for each of the above areas and material collected in the North
Norfolk community is used to examine a number of hypotheses relating to
migration.
Population Change in Selected Communities 1951-1971.
In Table I population figures are presented for each intercensal
period from 1951 to 1971 for the areas under study.

84
Table I PopUlatima change in selected communities 1951-1971.
Area 1951 1961 1971Actual Change1051 - 1971
% Change1951 - 1971
Highlands & Islandsof Scotland
277,948 282,901 -2885 -1.0
Mid-Wales 185,729 178,546 174,089 -11,640 -6.3
North Norfolk 35,518 32,141 29,385 -6,133 -17.3
North Mayo 40,030 35,126 31,638 -8,392 -20.9
Sources: Censuses of Population.
All areas have registered a decline during the period under review, although
the Scottish area did show some recovery during the last ten years. The
statistics for both Scotland and Mid-Wales as presented here conceal a number
of wide inter-county variations. A decline of 1.0 per cent would appear to
be a tolerable figure for the Scottish area as a whole but this is accounted
for solely by an increase of 22.2 per cent in Caithness and 5.4 per cent in
Inverness. In fact the other 5 counties in the area recorded declines ranging
from 3.7 per cent for Ross and Cromarty to 19.7 per cent for Orkney. In the
Mid-Wales area, the only county to record an increase was Cardiganshire (2.9
per cent) and this was due almost entirely to the growth of Aberystwyth and
its hinterland. All the uther counties registered declines ranging from 7,0
per cent for Montgomeryshire to 14.9 per cent for Merionethshire. Such inter-
county variation is one argument for examining smaller statistical units
such as North Norfolk where the true trends are more clearly discernible.
The Determinants of MisTation.
One of the first attempts at formulating a theory of migration was that
of Ravenstein on "The laws of Migration".1
These 'b ags' postulated demographic
and economic variables especially in relation to the distance factor. However,
of mirration and the personal

North Norf olk 35,518 32,141 29,385 -6,133 -17.3
North Mayo 40 , 030 35,126 31,638 -8, 392 -20.9
Sources: Censuses of Population.
All areas have registered a decline during the period under review, although
the Scottish area did show some recovery during the last ten years. The
statistics for both Scotland and Md-Wales as presented here conceal a number
of wide inter-county variations. A decline of 1.0 per cent would appear to
be a tolerable figure for the Scottish area as a whole but this is accounted
for solely by an increase of 22.2 per cent in Caithness and 5.4 per cent in
Inverness. In fact the other 5 counties in the area recorded declines ranging
from 3.7 per cent for Ross and Cromarty to 19.7 per cent for Orkney. In the
Mid-Wales area, the only county to record an increase was Cardiganshire (2.9
per cent) and this was due almost entirely to the growth of Aberystwyth and
its hinterland. All the other counties registered declines ranging from 7.0
per cent for Montgomeryshire to 14.9 per cent for Merionethshire. Such inter-
county variation is one argument for examining smaller statistical units
such as North Norfolk where the true trends are raore clearly discernible.
The Determinants of Migration.
One of the first attempts at formulating a theory of migration was that
of Ravenstein on "The Laws of Migration".1 These 'laws postulated demographic
and economic variables especially in relation to the distance factor. However,
it has since beconie evident that botL the causes of migration and the personal
characteristics of migrants vary considerably from place to place and from
time to time. In an essay om internal migration Bogue observes that "one
of the most important findings of empirical research on internal migration to
date is that, like so many other events in the realm of human behaviour, there
are no "laws" of When an individual person or family
1 Ravenstein E.G. , "The Laws of Migration", Journal of the Royal StatisticalSociety, Vol. XIXIII, June 1885, pp. 167-227.

5
changes residence, the move is made for certain reasons, and the destination of
the move is selected for the same and other reasons. These reasons may be
looked upon as objeutive situations or as subjective responses to prejudices
or values of which the persons involved may not be aware; reasons for
migration are not necessarily known to the migrant, and his rationalization
of his move may not be valid or logical".1
At the same time a number of
general factors can be said to motivate migrants. Beyer2 divides this
motivation into four categories as follows:
(1) ambition, for better job opportunities;
(2) hope, for a better future for the children;
(3) courage, for a beginning or a zest of adventure; and
(4) better economic opportunities.
Beijer repeatedly emphasizes the importance of the economic factor. Indeed
the vast majority of studies concerning the motivation of migrants in Europe
and the United States stress the great importance of economic and social
mobility motives in migration.3
For the purposes of this paper, we examine factors associated with
migration in the North Norfolk survey area under two main headings economic
factors and social factors:
Economic Factors.
Major changes have taken place in agricultural production in North Norfolk
over the last 20 years. These changes have been observed in rural areas across
England, and it is common to find that the number of workers in agriculture
today are less than 40 per cent of the numbers so employed in 1950. The
1 Bogue D.J., "Internal Migration" in Hauser P.M., and Duncan D.T. (Edn.).The Study of Population, The University of Chicago Press, 1959, p. 499.
2 Beijer 0., "Modern Patterns of International Migratory Movements", in JacksonJ.A. (Ed.). Mipration, Cambridge University Press, 1969, pp. 11-59,
3 See for example Rural Migration, Papers and Proceedings of the FirstCongress of the Ettropean Society for Rural Sociology, Bonn, 1959.
Geographic and Occupational Mobility of Rural ManpowerDocumentation in Aviculture and Food, Report No. 75, 0.E.C.D., 1964.
Hannan D.F., Rural bcodus, Geoffrey Chapman, London andDublin, 1970.
14)

greatest single cause has been the adoption of new technology in agricultural
production, along with streamlined farming systems, which have reduced together
the demand for manual labour.
For the area under study, the most significant new technologies have
been the introduction of large combine harvesters, mechanisation of the sugar-
beet crop and the use of herbicides to control weed infestation. Together
with simpler farming systems, which have allowed the farmer to concentrate
his capital, managerial ability and labour force on a much 'stalller range of
products, these have led to a dependence on cereals and sugar-beet, whose
labour demands are now complementary, at the expense of grassland
pastoral stock.
The grass acreage in the area has dropped by over one-third in the ten
years froi 1958 to 1968 and the number of cattle by nearly one quarter in the
same period. Dairy cattle, which form the bulk of these mothers, are very
labour intensive, and require supervision daily, even at weekends so that
with the existence of profitable alternatives, it is not surprising that
nyvibers have declined, and with them the demand for labour.
Indeed, on particular farm it is not always easy to decide whether
the decision to drop cattle was an active managerial response arising from
the high opportunity costs and the availability of other systems, or a passive
one resulting from the sudden departure of the cow-man and the great difficulty
of getting a suitable replacement. In many cases it is likely to be the
latter but it is very probable that the farmer was contemplating this decision,
and the exodus of the cow-man lias been the catalyst that has initiated the
change.
In any case, the process has resulted in a decline in the farm labour
force in the survey area. During the period 1960-1968 the total number
employed in agriculture dropped by 899 or 24.7 per cent. In the same period
an increase of 457 jobs took place in manufacturing employment but this was
counteracted to a large extent by a decline in service and miscellaneous
employment._ re _increase in employment other than in agriculture was only

bven Lite inlroduction of large combine harvesters, mechanisation of the sugar-
beet crop and the use of herbicides to control weed infestation. Together
with simpler farming systems, which have allowed the farmer to concentrate
his capital, managerial ability and labour force on a much smaller range of
products, these have led to a dependence on cereals and sugar-beet, whose
labour demands are now complementary, at the expense of grassland
pastoral stock.
The grass acreage in the area has dropped by aver one-third in the ten
years from 1958 to 1968 and the number of cattle by nearly one quarter in the
same period. Dairy cattle, wldch form the bulk pf these numbers, are very
labour intensive, and require supervision daily, even at weekends so that
wlth the existence of profitable alternatives, it is not surprising that
numbers have declined, and with them the demand for labour.
Indeed, on particular farum it is not alwnys easy to decide whether
the decision to drop cattle was an active managerial response arising from
the high opportunity costs and the availability of other systems, or a passive,
one resulting fromthe sudden departure of the cow-man and the great difficulty
of getting a suitable replacement. In many cases it is likely to be the
latter but it is very probable that the farmer was contemplating this decision,
and the exodus of the cow-man has been the catalyst that has initiated the
change.
In any case, the process has resulted in a decline in the farm labour
force in the survey area. During the period 1960-1968 the total number
employed in agriculture dropped by 899 or 24.7 per cent. In the same period
an increase of 457 jobs took place in manufacturing employment but this was
counteracted to a large extent by a decline in service and mdscellaneous
employment. The increase in employment other than in agriculture was only
187 and overall employment actually declined by 712. The lack of employment
alternative to agriculture is obviously an important motive for migration.
A survey carried out on 153 farms in the study area during 1970/71 helps
further to illustrate the importance of the economic factor in migration
1 2

7
behaviour. Details were obtained on all workers leaving the farms during the
period 1960-1970, whether they mdgrated or not and the occupations they entered
on leaving.1
An attempt is made in Tables II and III to outline the actual
pattern of movement and its relationship to subsequent employmont of the workers.
Of the active workers, a total of 118 or 25 per cent left the area entirely.
See Table II. This is a high percentage decline when compared to a total
population decline of 17.3 per cent recorded for the area during 1951-1971.
Table II. Migratory Patterns and Subsequent EMployment of Active Workers.a
Occupation takenNumberRemaining
% of TotalRemaining
Number % ofTotal
Migrating TotalMigrating
% ofTotal
Agriculture 192 54.2 43 36.5 235 49.8
General Labourer 27 7.6 4 3.4 31 6.6
Industrial khployment 42 11.9 2T 22.9 69 14.6
Driving 19 5.4 15 12.7 34 7.2
Building Industry 19 5.4 5 4.2 24 5.1
Unemployed 28 7.9 1 0.8 29 6.1
Other Occupationsb
27 7.6 23 19.5 50 10.6
Total 354 100.0 118 100.0 472 100.0
aBetired workers omitted.bThe 'other' category includes such jobs as army, navy, airforce, retail
electrical and distribution trades.
If we disregard the unemployed wrkers it can be shown that there is a close
relationship between migration and subsequent employment type. See Table III.
Table III. Migration and Subsequent EMplayment of EMplayed W4kers.
Number % of Total NuMber % of % of
Remaining Remaining Migrating Total Total Total
Migrating
Agriculture
Employment otherthan Agriculture
192 58.9 43 36.8 235 53.1
134 41.1 74 63.2 208 46.9

See Table II. This is a high percentage decline when compared to a total
population decline of 17.3 per cent recorded for the area during 1951-1971.
Table II. Migratory Patterns and Subsequent Employment of Active Workers.a
Occupation takenNumber
Remaining% of TotalRemaining
Number % ofTotal
Migrating TotalMigrating
% of
Total
Agriculture 192 54.2 43 36.5 235 49.8
General Labourer 27 7.6 4 3.4 31 6.6
Industrial Employment 42 11.9 27 22.9 69 14.6
Driving 19 5.4 15 12.7 34 7.2
Building Industry 19 5.4 5 4.2 24 5.1
Unemployed 28 7.9 1 0.8 29 6.1
Other Occupationsb
27 7.6 23 19.5 50 10.6
Total 354 100.0 118 100.0 472 100.0
alletired workers omitted.
bThe 'other' category includes such jobs as army, navy, airforce, retail
electrical and distribution trades.
If we disregard the unemployed workers it can be shown that there is a close
relationship between migration and subsequent employment type. See Table III.
Table III. Migration and Subsequent EMployment of EMployed Workers.
Number % of Total Number % of % of
Remaining Remaining Migrating Total Total TotalMigrating
Agriculture
Employment otherthan Agriculture
Total
192 58.9 43 36.8 235 53.1
134 41.1 74 63.2 208 46.9
326 100.0 117 100.0 443 100.0
It appears that if one remains in the survey area the chances of becoming
employed outside agriculture are much smaller. For example, of those who
1 These details were given au accurately as possible by each farmer interviewedand not by the workers who would be very difficult to trace.
14

815
remained in the area 58.9 per cent took an agricultural job. This of course
may merely reflect the fact that those workers wished to stay in agriculture
but it also emphasizes the fact mentioned earlier that little other employment
is available locally. When workers leave the area a snuffler proportion (36.8
per cent) enter agriculture and a larger proportion (63.2 per cent) enter
anployment other than agriculture. This differential is particularly marked
in the case of the 'industrial' and 'other' employment categories. (See Table
II). In short, these figures indicate that if a worker wishes to enter a job
other than agriculture, he would have a much better chance of obtaining it if
he left the area.
The foregoing section has examined the actual migratory pattern of one
sector of rural society and the hypothesis that migration is related to entry
to a non-agricultural job is accepted.
A further survey attempted to assess the propensity to migrate of young
people who had not yet entered the work force but were on the point of doing so.
Here, it is hypothesized that in the case of school-leavers, migration decision-
making is related to level of occupational aspiration. This survey covered 392
respondents (189 females and 203 males) from 9 post-primary schools catering for
the survey area. Table IV indicates that 23.5 per cent of the respondents
intended to migrate, 30.8 per cent were undecided, while 45.7 per cent intended
to remain in the local community.
Table ry. Migratory Intentions and Occupational Aspirations of Post-Primary School-Leavers in 114)rth Norfolk (lc m 392).
OccupationalAspiration *
Remain Undecided Migrate Total
High
Medium
43(31.4)
93
(51.7)
51
(37.2)
48(26.7)
43
(31.4)
39
(21.6)
137
(100.0)
180
(100.0)
70

per cent) enter agriculture and a larger proportion (63.2 per cent) enter
employment other than agriculture. This differential is particularly marked
in the case of the 'industrial' and 'other' employment categories. (See Table
II). In short, these figures indicate that if a worker wishes to enter a job
other than agriculture, he would have a much better chance of obtaining it if
he left the area.
The foregoing section has exmaned the actual migratory pattern of one
sector of rural society and the lorpothesis that migration is related to entry
to a non-agricultural job is accepted.
A further survey attempted to assess the propensity to migrate of young
people who had not yet entered the work force but were on the point of doing so.
Here, it is hypothesized that in the case of school-leavers, migration decision-
Making is related tolevel of occupational aspiration. This survey covered 392
respondents (189 feziales and 203 males) from 9 post-primary schools catering for
the survey area. Table IV.indicates that 23.5 per cent of the respondents
intended to migrate, 30.8 per cent were undecided, while 45.7 per cent intended
to remain in the local community.
Table 1V. Migratory Intentions and Occupational Aspirations of Post-Primary School-Leavers in North Norfolk (N m 392).
Occupational Remain Undecided Migrate Total
Aspiration *
43 51 43 137High (31.4) (37.2) (31.4) (100.0)
93 48 39 180Medium (51.7) (26.7) (21.6) (100.0)
40 21 9 70Low
(57.1) (30.0) (12.9) (100.0)
Don't know 3 1 1 5
Total179(45.7)
121(30.8)
92
(23.5)392
(100.0)
= 19.6 Significant at .01 level.
*The classification of occupations is that used by the Register General. See
Classification of Occupations 1970, H.M.S.O. London. Five categories were used:1-Professional, II-Intermediate, III-Skilled (manual and non-manual), IV-Partly-
skilled, V-Unskilled. Categories I & II constitute a "High" aspiration, category
III a medium aspiration, and IV &V a low aspiration.
16

1.79
The selective nature of migration is well exemplified in the above data: the
lower the occupational aspiration, the more likely is one to renain; the
higher the occupational aspiration, the greater is the tendency to migrate.
Of those with la4,job aspirations, 57.1 per cent hope to remain, while only
31.4 per cent of the high aspirants wish to do so. In the case of the low
aspirants only 12.9 per cent plan to migrate, but 31.4 per cent of the high
aspirants wish to do so. The hypothesis thatmigration decision-making
is related to level of occupational aspiration, must be accepted. As
educational facilities improve this tendency is likely to be emphasized even
more and as the opportunities to achieve high occupational aspirations are
extremely limited in the area under study migration must become a necessity
for the greater proportion of the school-leaver population.
Social Factors.
A number of social factors determining migration are naw considered.
Under this heading it is hypothesized that satisfaction with the local
community is inversely related to the intention to migrate. In order to
measure cannunity attachment the respondents were asked to reply to a variety
of 8 statements according to degree of agreement ranging from "strongly agree"
to "strongly disagree".. These were scored 4,3,2,1,0 on a positive (4.) item
and 0,1,2,3,4 on a negative item so that a high score indicated high community
attachment. The results of this exercise are set out in Tablelr.
Table V. Level of Community Attachment and its relationship to MigratoryDecisions.
Community Attachment DecisionLevel to Remain
UndecidedDecisionto Leave
Total
Low
Medium
High
3 19 31 53(5.6) (35.9) (58.5) (100.0)
113 93 60 266
(42.5) (34.9) (22.6) (100.0)
63 9 1 73(86.3) (12.3) (1.4) (100.0)

31.4 per cent of the high aspirants wish to do so. In the case of the low
aspirants only 12.9 per cent plan to migrate, but 31.4 per cent of the high
aspirants wish to do so. The hypothesis that migration decision-naking
is related to level of occupational aspiration, must be accepted. As
educational facilities improve this tendency is likely to be emphasized even
more and as the opportunities to achieve high occupational aspirations are
extremely limited in the area under study migration must become a necessity
for the greater proportion of the school-leaver population.
Social Factors.
A number of social factors determining migration are now considered.
Under this heading it is hypothesized that satisfaction with the local
community is inversely related to the intention to migrate. In order to
measure community attachment the respondents were asked to reply to a variety
of 8 statements according to degree of agreement ranging from "strongly agree"
to "strongly disagree".' These were scored 4,3,2,1,0 on a positive (+) item
and 0,1,2,3,4 on a negative item so that a high score indicated high community
attachnent. The results of this exercise are set out in Table V.
Table V. Level of Community Attachment and its relationship to MigratoryDecisions.
Community Attachment Decision DecisionUndecided Total
Level to Remain to Leave
3 19 31 53Low
(5.6) (35.9) (58.5) (100.0)
113 93 60 266Medium
(42.5) (34.9) (22.6) (100.0)
63 9 1 73High
(86.3) (12.3) (1.4) (100.0)
179 121 92 392Total
(45.6) (30.9) (23.5) (100.0)
)(1= 98.8 Significant at .01 level
mIn selecting the statements the authors have been guided by Johnson and Knop.
"Rural-Urban Differentials in Community Satisfaction"Itural Sociology Vol.35,1970 pp. 544-548. The pioneer of the C.S. scale was Vernon Davies - See"The Development of a Scale to rate Attitudes of Community Satisfaction,RUral Sociolemy, Vel. 10, 1945, pp. 246-285.
is
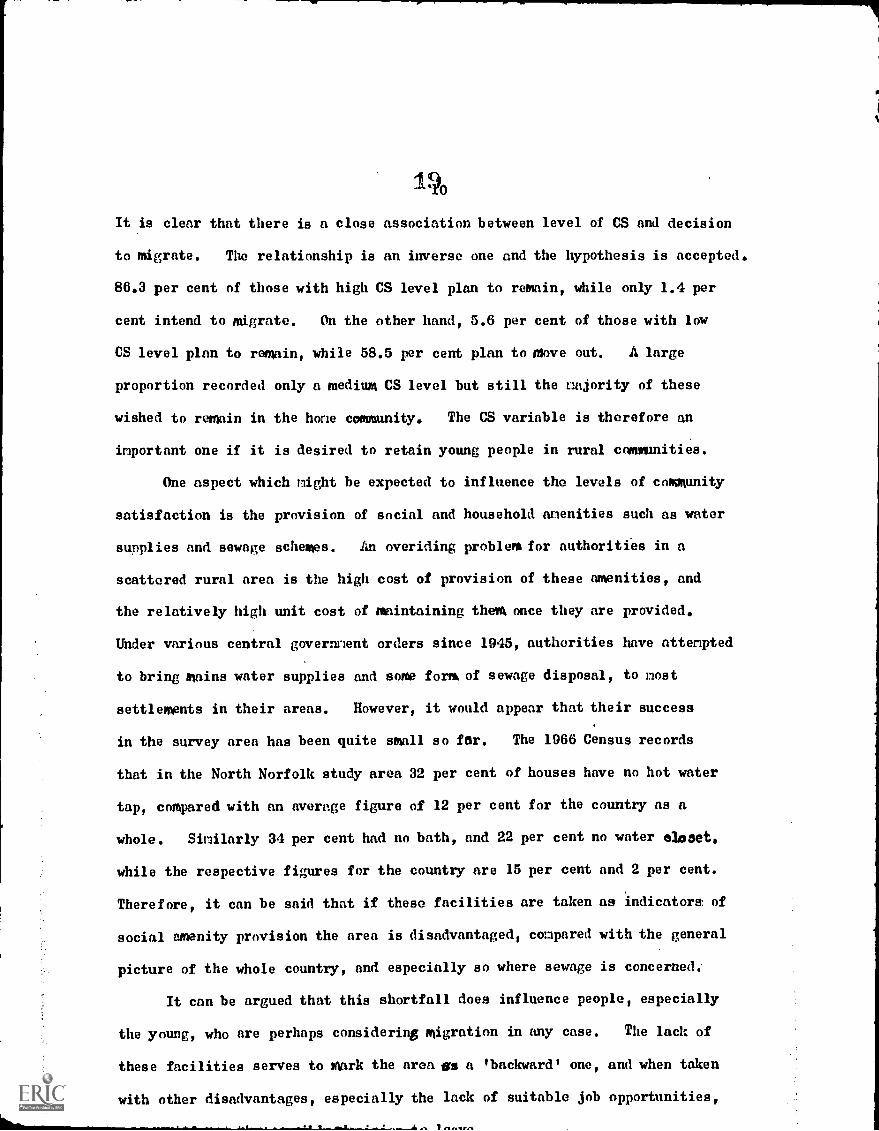
It is clear that there is a close association between level of CS and decision
to migrate. The relationship is an inverse one and the hypothesis is accepted.
86.3 per cent of those with high CS level plan to remain, while only 1.4 per
cent intend to magrate. On the other hand, 5.6 per cent of those with low
CS level plan to remain, while 58.5 per cent plan to Move out. A large
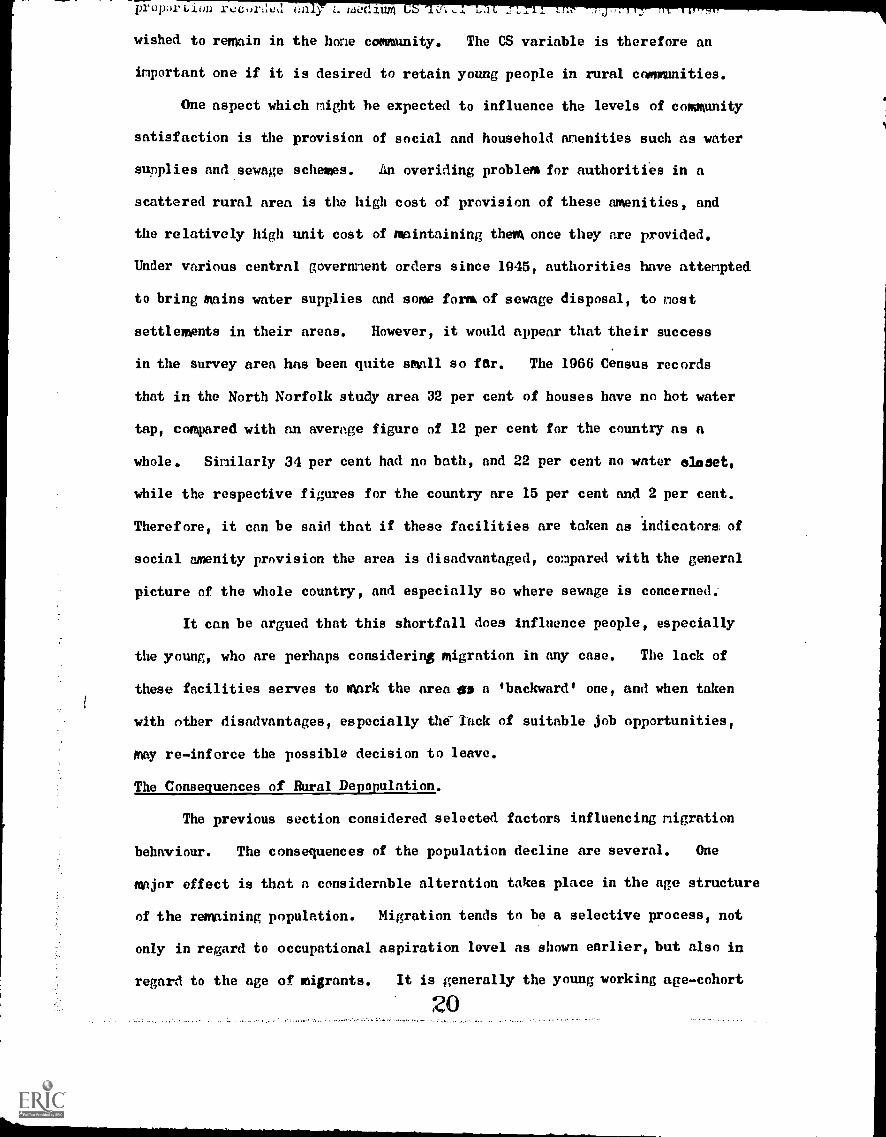
proportion recorded only a medium CS level but still the najority of these
wished to remain in the hone community. The CS variable is therefore an
important one if it is desired to retain young people in rural communities.
One aspect which night be expected to influence the levels of community
satisfaction is the provision of social and household anenities such as water
supplies and sewage schemes. An overiding problem for authorities in a
scattered rural area is the high cost of provision of these amenities, and
the relatively high unit cost of maintaining theM once they are provided.
Under various central governnent orders since 1945, authorities have attenpted
to bring mains water supplies and some form of sewage disposal, to most
settlements in their areas. However, it would appear that their success
in the survey area has been quite small so far. The 1966 Census records
that in the North Norfolk study area 32 per cent of houses have no hot water
tap, compared with an average figure of 12 per cent for the country as a
whole. Similarly 34 per cent had no bath, and 22 per cent no water Onset,
while the respective figures for the country are 15 per cent and 2 per cent.
Therefore, it can be said that if these facilities are taken as indicators of
social amenity provision the area is disadvantaged, compared with the general
picture of the whole country, and especially so where sewage is concerned.
It can be argued that this shortfall does influence people, especially
the young, who are perhaps considering migration in any case. The lack of
these facilities serves to Mark the area es a °backward' one, and when taken
with other disadvantages, especially the lack of suitable job opportunities,
proporiAmn recurLleki on Z.'. meta=
wished to remain in the hone community. The CS variable is therefore an
important one if it is desired to retain young people in rural communities.
One aspect which night be expected to influence the levels of community
satisfaction is the provision of social and household amenities such as water
supplies and sewage schemes. An overiding problem for authorities in a
scattered rural area is the high cost of provision of these amenities, and
the relatively high unit cost of maintaining them once they are provided.
Under various central government orders since 1945, authorities have attenpted
to bring mains water supplies and some form of sewage disposal, to most
settlements in their areas. However, it would appear that their success
in the survey area has been quite small so far. The 1966 Census records
that in the North Norfolk study area 32 per cent of houses have no hot water
tap, compared with an average figure of 12 per cent for the country as a
whole. Similarly 34 per cent had no bath, and 22 per cent no water eloSets
while the respective figures for the country are 15 per cent and 2 per cent.
Therefore, it can be said that if these facilities are taken as indicators of
social amenity provision the area is disadvantaged, compared with the general
picture of the whole country, and especially so where sewage is concerned.
It can be argued that this shortfall does influence people, especia4y
the young, who are perhaps considering migration in any case. The lack of
these facilities serves to Mark the area es a 'backward' one, and when taken
with other disadvantages, especially the-lack of suitable job opportanities,
May re-inforce the possible decision to leave.
The Consequences of &mai Depopulation.
The previous section considered selected factors influencing migration
behaviour. The consequences of the population decline are several. One
mnjor effect is that a considerable alteration takes place in the age structure
of Om rmmaining population. Migration tends to be a selective process, not
only in regard to occupational aspiration level as shown earlier, but also in
regard to the age of migrants. It is generally the young working age-cohort
20
2111
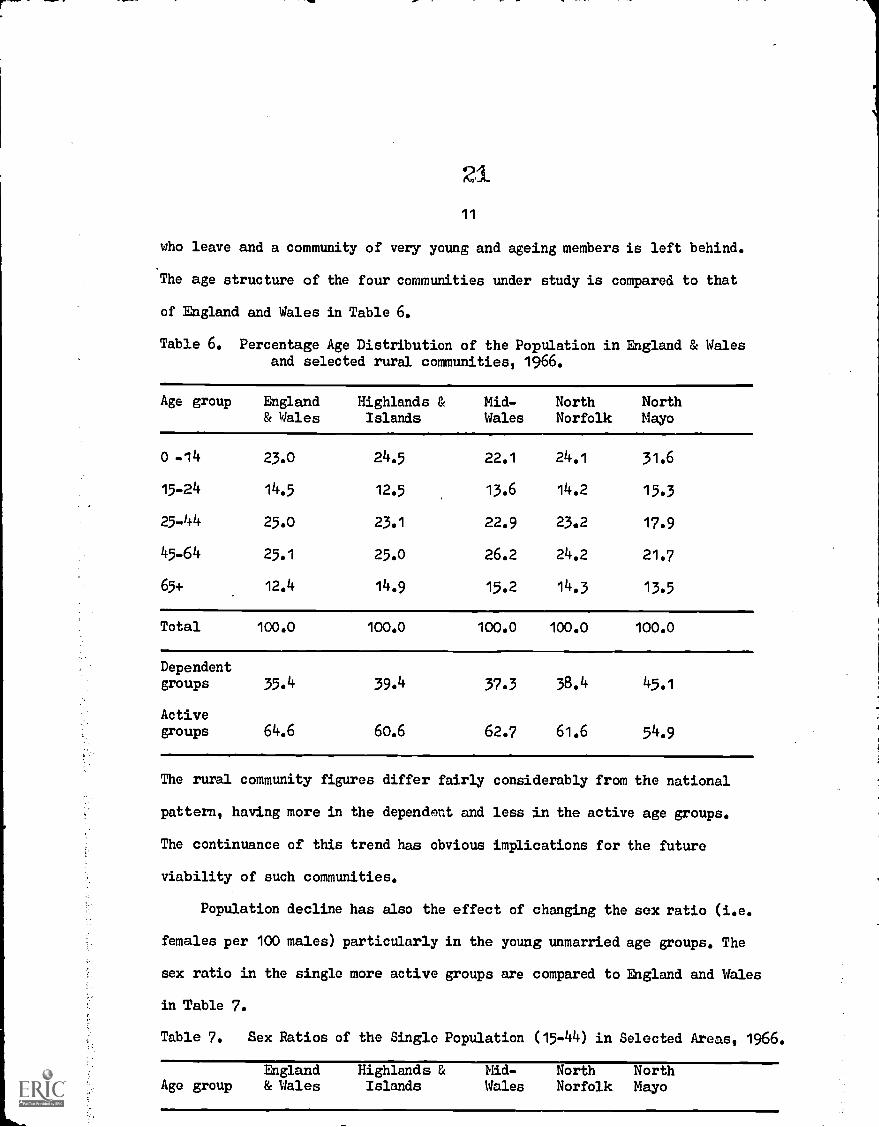
who leave and a community of very young and ageing members is left behind.
The age structure of the four commmnities under study is compared to that
of Ehgland and Wales in Table 6.
Table 6. Percentage Age Distribution of the Population in England & Walesand selected rural communities, 1966.
Age group England& Wales
Highlands &Islands
Mid-Wales
NorthNorfolk
NorthMayo
0 -14 23.0 24.5 22.1 24.1 31.6
15-24 14.5 12.5 13.6 14.2 15,3
25-44 25.0 23.1 22.9 23.2 17.9
45-64 25.1 25.0 26.2 24,2 21.7
65+ 12.4 14.9 15.2 14.3 13,5
Total 100.0 100.0 100.0 100.0 100.0
Dependentgroups 35.4 39.4 37.3 38.4 45.1
Activegroups 64.6 60.6 62.7 61.6 54.9
The rural community figures differ fairly considerably from the national
pattern, having more in the deparidnnt and less in the active age groups.
The continuance of this trend has obvious implications for the future
viability of such communities.
Population decline has also the effect of changing the sex ratio (i.e.
females per 100 males) particularly in the young unmarried age groups. The
sex ratio in the single more active groups are compared to England and Wales
in Table 7.
Table 7. Sex Ratios of the Single Population (15-44) in Selected Areas, 1966,
England Highlands & Mid- North NorthAge group & Wales Islands Wales Norfolk Mayo

& qa1es Islands -
o -14 23.0 24.5 22.1 24.1 31.6
15-24 14.5 12.5 13.6 14.2 15.3
25-44 25.0 23.1 22.9 23.2 17.9
45-64 25.1 25.0 26.2 24.2 21.7
65+ 12.4 14.9 15.2 14.5 13.5
Total 100.0 100.0 100.0 100.0 100.0
Dependentgroups 35.4 39.4 37.3 38.4 45
Activegroups 64.6 60.6 62.7 61.6 549
The rural community figures differ fairly considerably from the national
pattern, having more in the dependent and less in the active age groups.
The continuance of this trend has obvious implications for the future
viability of such communities.
Population decline has also the effect of changing the sex ratio (i.e.
females per 100 males) particularly in the young unmarried age groups. The
sex ratio in the single more active groups are compared to England and Wales
in Table 7.
Table 7. Sex Ratios of the Single Population (15-44) in Selected Areas, 1966.
Age groupEngland& Wales
Highlands &Islands
Mid-Wales
NorthNorfolk
NorthMayo
15-19 90.7 86.4 93.3 56.8 86.0
20-24 61.4 62.4 54.9 48.1 55.8
25-29 50.2 540 46.6 40.0 48.9
30-34 58.8 63.7 49.3 30.0 35.2
35-39 67.2 63.3 42.1 42.9 39.3
4o-44 80.1 91.9 64.7 36.4 40.1
Total (15-44) 75.0 73.7 68.9 49.7 62.9
Ns,
12
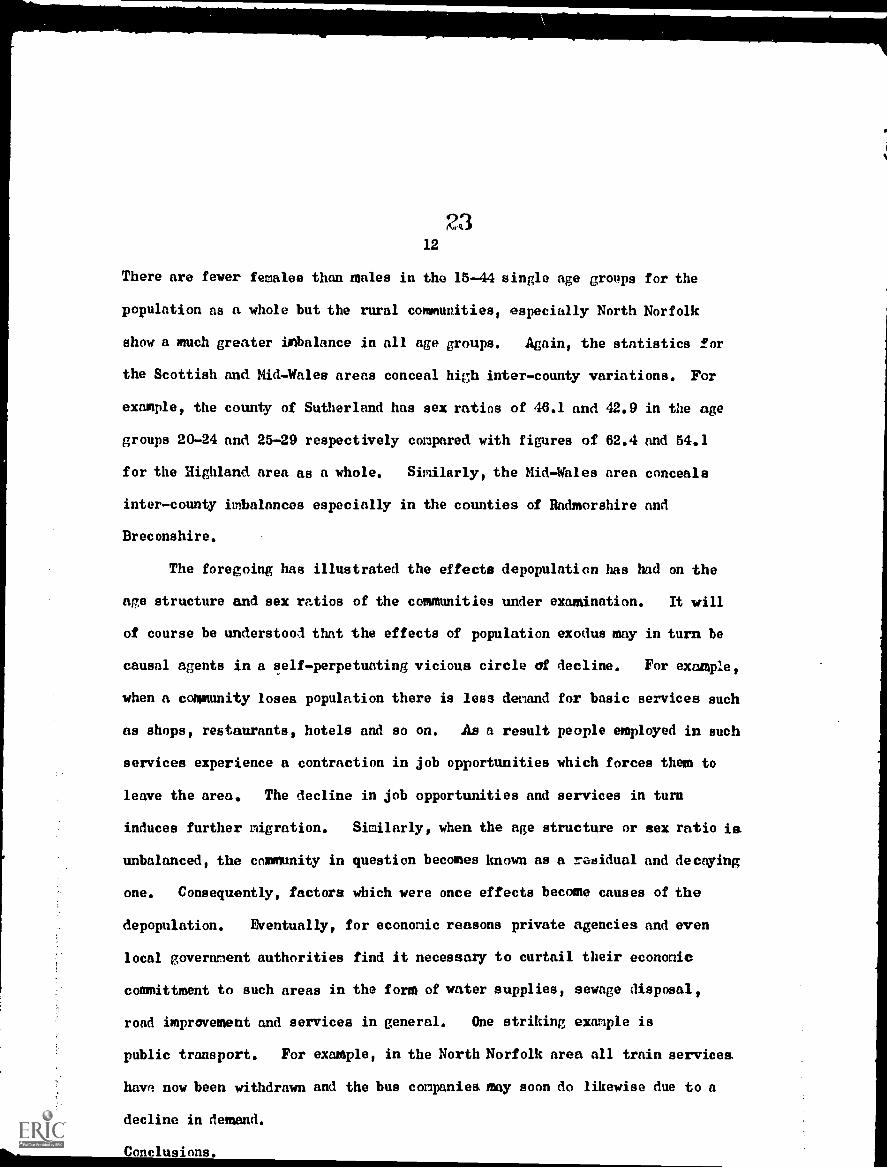
There are fewer females than males in the 15-44 single age groups for the
population as a whole but the rural commuvities, especially North Norfolk
show a much greater iMbalance in all age groups. Again, the statistics for
the Scottish and Mid-Wales areas conceal high inter-county variations. For
example, the county of Sutherland has sex ratios of 46.1 and 42.9 in the age
groups 20-24 and 25-29 respectively compared with figures of 62.4 and 54.1
for the Highland area as a whole. Similarly, the Mid-Wales area conceals
inter-county imbalances especially in the counties of Hadmorshire and
Breconshire.
The foregoing has illustrated the effects depopulation has had on the
age structure and sex ratios of the communities under examanation. It mill
of course be understood that the effects of population exodus may in turn be
causal agents in a self-perpetuating vicious circle of decline. For example,
when a community loses population there is less demand for basic services such
as shops, restaurants, hotels and so on. As a result people employed in such
services experience a contraction in job opportunities which forces them to
leave the area. The decline in job opportunities and services in turn
induces further migration. Similarly, when the age structure or sex ratio is
unbalanced, the community in question becomes known as a radidual and decaying
one. Consequently, factors which were once effects become causes of the
depopulation. EVentually, for economic reasons private agencies and even
local government authorities find it necessary to curtail their econonic
committment to such areas in the form of water supplies, sewage disposal,
road improvement and services in general. One striking example is
public transport. For example, in the North Norfolk area all train services
have now been withdrawn and the bus companies may soon do likewise due to a
decline in demand.
Conclusions.

groups 20-24 and 25-29 respectively compared with figures of 02.4 and 54.1
for the Highland area as a whole. Similarly, the Mid-Wales area conceals
inter-county imbalances especially in the counties of Badmorshire and
Breconshire.
The foregoing has illustrated the effects depopulation has had on the
age structure and sex ratios of the communities under examination. It will
of course be understood that thm effects of population exodus may in turn be
causal agents in a self-perpetuating vicious circle of decline. For exmmpde,
when a community loses population there is less demand for basic services such
as shops, restaurants, hotels and so on. As a result people employed in such
services experience a contraction in job opportunities which forces them to
leave the area. The decline in job opportunities and services in turn
induces further rdgration. Similarly, when the age structure or sex ratio is
unbalanced, the community in qumstion becomes known as a residual and decaying
one. Consequently, factors which were once effects become causes of the
depopulation. Eventua4y, for economic reasons private agencies and even
local governnent authorities find it necessary to curtail their economic
committment to such areas in the forM of writer supplies, sewage disposal,
road improvement and services in general. One striking example is
public transport. For exaMple, in the North Norfolk area all train services
have now been withdrawn and the bus companies may soon do likewise due to a
decline in demand.
Conclusions.
This paper set out to exanine the causes and consequences of rural
depopulation in a number of fairly typical rural communities. The North
Norfolk community of Ehstern England was adopted as a field study area and
somm results of two surveys carried out-there were presented.
It is surgested that the considerable re-alignment of the structure and
organisation of agriculture is the basis of ndgration from the survey area.
A survey carried out on 153 farms supports the hypothesis that entry to an
occupation other than agriculture is ejomeky associated with migration.

13
Two hypotheses were also formulated in relation to 392 schoolleavers.
Firstly, it was hypothesized that Migration decisionawking was related to
level of occupational aspiration. This was accepted. Secondly, it was
hypothesized that satisfaction with the local community was inversely
related to the intention to migrate. This was also accepted. Therefore,
the apparent reluctance of alternative employment to base itself in rural
areas leads to occupational frustration. Coupled with increased mobility on
the part of the rural population and dissatisfaction with social facilities
and amenities a continuous decline in total population has been inevitable.
The effects have been several. The movement has resulted in unbalanced
age structures and sex ratios in the rural population. A decline in demand
has rendered such services as public transport uneconomical and has resulted
in the complete closure of rail services in the Norfolk community. Prdbably
the most serious result of depopulation is that in turn the effects of it
eventually become causes in an unending vicious circle.
It is not within the scope of this paper to consider what night be done
to stop or reverse depopulation trends or whether such a policy is worthwhile
at all. The writers have argued elsewhere on social and economic grounds for
a rural developnent policy and suggested broad outlines for a development
programme.1
However, it is only fair to say that until more detailed cost
benefit estinates of alternative strategies for rural areas are available,
neither government authorities nor private agencies will have a firmbasis for
locating economic activity there. Such estimates should be a high research
priority. What is certain is that the process of rural depopulation is
continuing and selfperpetrating.
1 Drudy P.J. and Wallace D.B., "Towards aDural Areas: A. Case Study in Nor%No. 4, 1971, pp. 281-288.
Development Programme for RemoteNorfolk", Regional Studies, Vol. 5,