Biomass energy systems Renewable energy from biomass direct burning.
APPENDIX XII
MATES V
DRAFT REPORT
Biomass Burning Contribution to PM2.5 (Levoglucosan Data Analysis)
MATES V Draft Report
Appendix XII-2
Appendix XII
Biomass Burning Contribution to PM2.5 (Levoglucosan Data Analysis)
XII.1. Introduction
MATES is a study that focuses on the measurement and modeling of ambient air toxics for the
primary purpose of evaluating health risks due to air pollution. As part of MATES V,
levoglucosan, a key tracer of wood smoke, was measured alongside other particulate species at
all ten fixed monitoring sites. The addition of levoglucosan measurements provided insight into
pollution sources that influence both basin-wide and localized health risks and also allowed for
improvement to pollution forecast models to help residents minimize their exposures to air
pollution.
Wood smoke from residential wood burning is an important source of wintertime fine particulate
matter (PM2.5) in the South Coast Air Basin (South Coast Air Quality Management District,
2008) and concentrations are influenced by both meteorology and human behavior.
Levoglucosan is a component of PM2.5 produced during wood burning (Fine, et al., 2001) and
was measured in the months leading up to and throughout the MATES V campaign from January
2018 to April 2019. The acquisition of levoglucosan data provided staff with the opportunity to
create a forecasting tool specifically tailored to residential wood burning patterns in the Basin.
Machine learning techniques were used to create a forecasting model for residential wood smoke
based on levoglucosan observations during the MATES V period. The levoglucosan observations
are referred to as the ‘training data’ for the model. The influence of meteorology on wood smoke
concentrations is represented in the model by meteorological forecast data from the North
American Mesoscale (NAM) model (National Centers for Environmental Information, 2020).
The influence of human behavior on wood smoke concentrations is represented in the model by
calendar-based patterns such as day of week and holidays. Levoglucosan concentrations are
modeled with these predictor variables and then conversion factors are used to estimate the
PM2.5 concentrations due to wood smoke.
This forecast tool can be used to both estimate wood smoke concentrations on days without
MATES V measurements and to predict concentrations on any day with NAM meteorological
forecast data—up to three days into the future. South Coast AQMD staff issue a daily air quality
forecast for the entirety of Los Angeles, Orange, San Bernardino, and Riverside counties, which
takes into account forecasted concentrations of ozone, PM2.5, PM10, carbon monoxide, and
nitrogen dioxide. Air quality forecasting models used by South Coast AQMD staff to issue the
daily forecast do not completely account for the strong dependence of wood smoke PM2.5 on
calendar and meteorological parameters. However, the levoglucosan model can be used to
improve PM2.5 predictions during the winter months in the Basin as part of the daily air quality
forecast.

MATES V Draft Report
Appendix XII-3
XII.2. Background
Levoglucosan (1,6-anhydro-β-D-glucopyranose), a thermal degradation product of cellulose and
hemicellulose, is a widely used tracer of biomass burning contributions to atmospheric
particulate loading (Simoneit, 2002). Levoglucosan has been shown to be present at very high
concentrations in fine particulate (PM2.5) emissions from both residential wood combustion
(Schauer, et al., 2001; Fine, et al., 2002) and wildland biomass combustion (Sullivan, et al.,
2008; Hosseini, et al., 2013), making it a robust indicator for key biomass burning processes in
the Basin. Although particulate levoglucosan concentrations may be reduced by photochemical
oxidation (Hennigan, et al., 2010; Hennigan, et al., 2011; Hoffmann, et al., 2010), this effect is
mitigated by the dominance of local pollution sources and relatively short distances between
monitors within the Basin (South Coast Air Quality Management District, 2016). Additionally,
levoglucosan is more stable at cooler temperatures observed in winter (Pratap, et al., 2019) when
residential wood burning is most common (South Coast Air Quality Management District, 2008).
To date, several studies have incorporated levoglucosan into receptor modeling studies to better
characterize the contribution of biomass burning/wood smoke to total PM2.5 mass or PM2.5
organic carbon in the Basin (South Coast Air Quality Management District, 2008; Heo, et al.,
2013; Shirmohammadi, et al., 2016).
In addition to levoglucosan, other minor monosaccharide anhydrides produced during
hemicellulose pyrolysis can provide further insight into the predominant biomass fuel type. The
relative yields of levoglucosan and its isomers mannosan (1,6-anhydro-β-D-mannopyranose) and
galactosan (1,6-anhydro-β-D-galactopyranose) have been shown to be characteristic of burns of
different vegetation types (e.g., hardwood, softwood, grass, etc.) (Sullivan, et al., 2008; Fine, et
al., 2004). Metrics such as the levoglucsoan/mannosan ratio in particulates can thus be used to
distinguish different biomass burning sources provided sources are derived from sufficiently
distinct vegetation types.
XII.3. Levoglucosan Measurement Methods
Levoglucosan and other monosaccharide anhydrides were analyzed using a method adapted from
procedures described in (California Air Resources Board, 2015; Cordell, et al., 2014; Schauer &
Sioutas, 2012). Fine particulate matter (PM2.5) for levoglucosan analysis was collected by
ambient air filtration onto quartz fiber filters on a dedicated channel of a speciated air sampling
system (SASS) PM2.5 sampler at each site. Samples were collected on a 1-in-6 day schedule at
all ten fixed MATES V sites except for Central L.A. and Rubidoux, where sampling frequency
was increased to a 1-in-3 day schedule to better characterize temporal variability. Prior to
analysis, filters were spiked with an internal standard (13C6-levoglucosan) and extracted by
ultrasonication in acetonitrile. Extracts were then derivatized with a silanizing reagent to convert
monosaccharide anhydrides to trimethylsilyl (TMS) derivatives suitable for gas chromatography-
mass spectrometry (GC-MS) analysis. Samples were analyzed by GC-MS using a simultaneous
selective ion monitoring (SIM)/full scan method and quantified by comparison to authenticated
MATES V Draft Report
Appendix XII-4
standards for each compound of interest. Further sampling and analytical details can be found in
Appendix III.
XII.4. Levoglucosan Observations
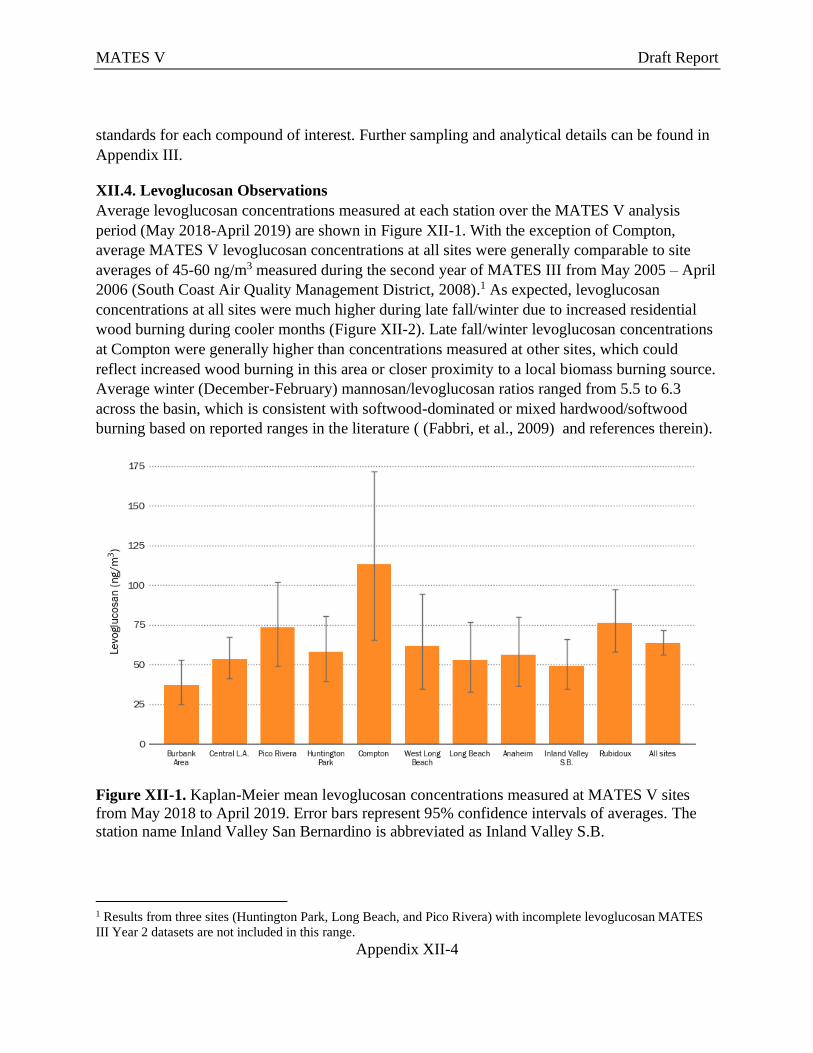
Average levoglucosan concentrations measured at each station over the MATES V analysis
period (May 2018-April 2019) are shown in Figure XII-1. With the exception of Compton,
average MATES V levoglucosan concentrations at all sites were generally comparable to site
averages of 45-60 ng/m3 measured during the second year of MATES III from May 2005 – April
2006 (South Coast Air Quality Management District, 2008).1 As expected, levoglucosan
concentrations at all sites were much higher during late fall/winter due to increased residential
wood burning during cooler months (Figure XII-2). Late fall/winter levoglucosan concentrations
at Compton were generally higher than concentrations measured at other sites, which could
reflect increased wood burning in this area or closer proximity to a local biomass burning source.
Average winter (December-February) mannosan/levoglucosan ratios ranged from 5.5 to 6.3
across the basin, which is consistent with softwood-dominated or mixed hardwood/softwood
burning based on reported ranges in the literature ( (Fabbri, et al., 2009) and references therein).
Figure XII-1. Kaplan-Meier mean levoglucosan concentrations measured at MATES V sites
from May 2018 to April 2019. Error bars represent 95% confidence intervals of averages. The
station name Inland Valley San Bernardino is abbreviated as Inland Valley S.B.
1 Results from three sites (Huntington Park, Long Beach, and Pico Rivera) with incomplete levoglucosan MATES
III Year 2 datasets are not included in this range.

MATES V Draft Report
Appendix XII-5
Figure XII-2. Monthly average levoglucosan concentrations during MATES V monitoring
period. Gray lines show monthly averages at individual sites, and bold orange line shows Basin
(ten site) average.
Outside of the winter wood burning season, several peaks in levoglucosan concentrations
coincided with local wildfires or smoke plumes from wildfires outside the Basin, although the
magnitude of these peaks was variable. These events included transport of smoke into the basin
from northern California wildfires on August 24, 2018 and from the Woolsey/Hill Fires in
Ventura County and western Los Angeles County on November 10, 2018. Both events were
marked by higher levoglucosan concentrations at sites in the western and coastal portions of the
Basin, consistent with westerly transport of smoke into the SCAB. The Euclid Fire south of
Chino also may have contributed to an elevated levoglucosan concentration of 108 ng/m3 at
Rubidoux on June 13, 2018 compared to a summer station average of 21 ng/m3.
XII.5. Conversion Factors
Observed and model forecasted levoglucosan concentrations at each station were scaled by a
conversion factor, defined as the ratio of wood smoke PM2.5 to levoglucosan, to estimate total
PM2.5 mass due to wood smoke. This conversion factor is a major source of uncertainty for
wood smoke PM2.5 estimates since it depends on the fuel burned, the characteristics of the burn
(e.g., combustion temperature, combustion efficiency), the age of the smoke, ambient
temperature, and actinic flux (Fine, et al., 2001; Fine, et al., 2002; Fine, et al., 2004; Schauer, et
al., 2001; Sullivan, et al., 2008; Kuo, et al., 2011; Hennigan, et al., 2011; Hoffmann, et al., 2010;
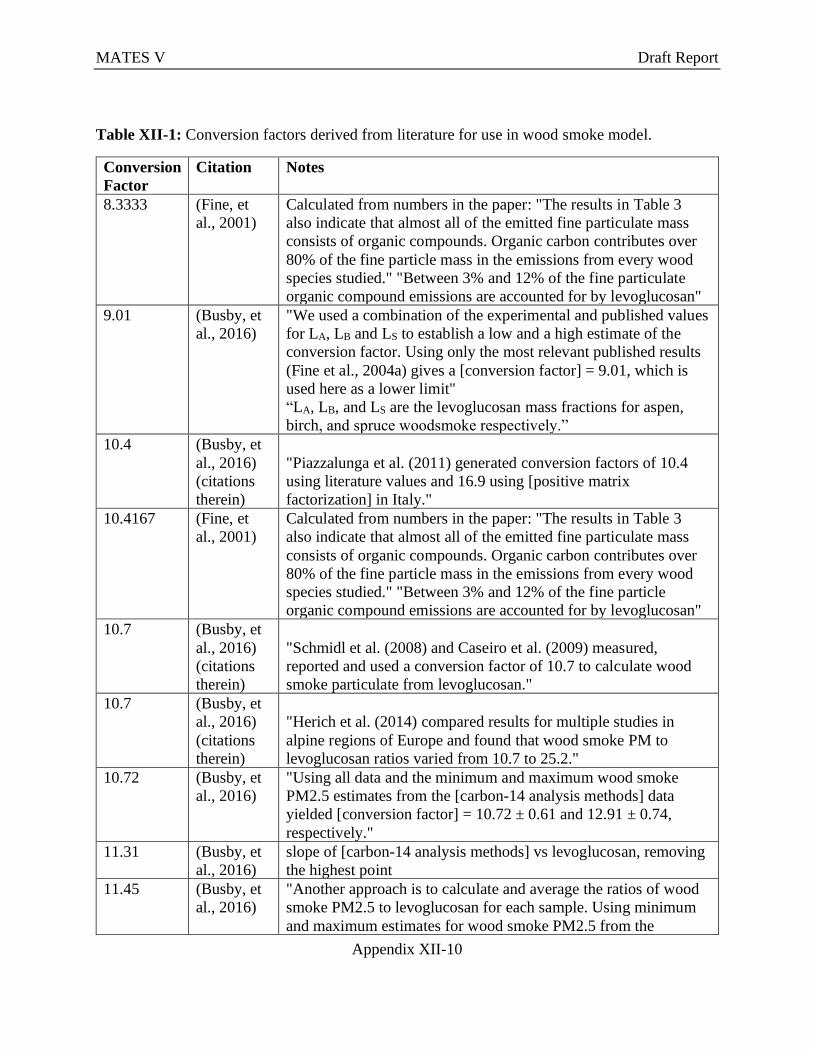
Sang, et al., 2016; Pratap, et al., 2019). This uncertainty is represented in the variety of
conversion factors ranging from 8.33 to 41.7 that were either reported in studies or calculated
from several studies, see

MATES V Draft Report
Appendix XII-6
Table XII-1. To empirically constrain the wide range of conversion factors found in the
literature, levoglucosan observations with co-located speciated PM2.5 data were analyzed.
Several conversion factors reported in the literature produced calculated wood smoke PM2.5
concentrations that were larger than the measured total PM2.5. A maximum empirical
conversion factor could be determined by assuming that all of the PM2.5 mass with the
exception of soil, ammonium nitrate, and ammonium sulfate was wood smoke PM2.5. The
smallest of these empirical conversion factors was used as the new upper-bound estimate of the
conversion factors. The lowest conversion factor from the literature (

MATES V Draft Report
Appendix XII-7
Table XII-1) was used as a lower-bound estimate of the PM2.5 due to wood smoke. The
levoglucosan forecast model outputs a lower-bound estimate of the PM2.5 due to wood smoke
using the smallest conversion factor from the literature (8.33, see
MATES V Draft Report
Appendix XII-8
Table XII-1) and an upper-bound estimate of PM2.5 due to wood smoke using the smallest
empirical conversion factor (16.39).
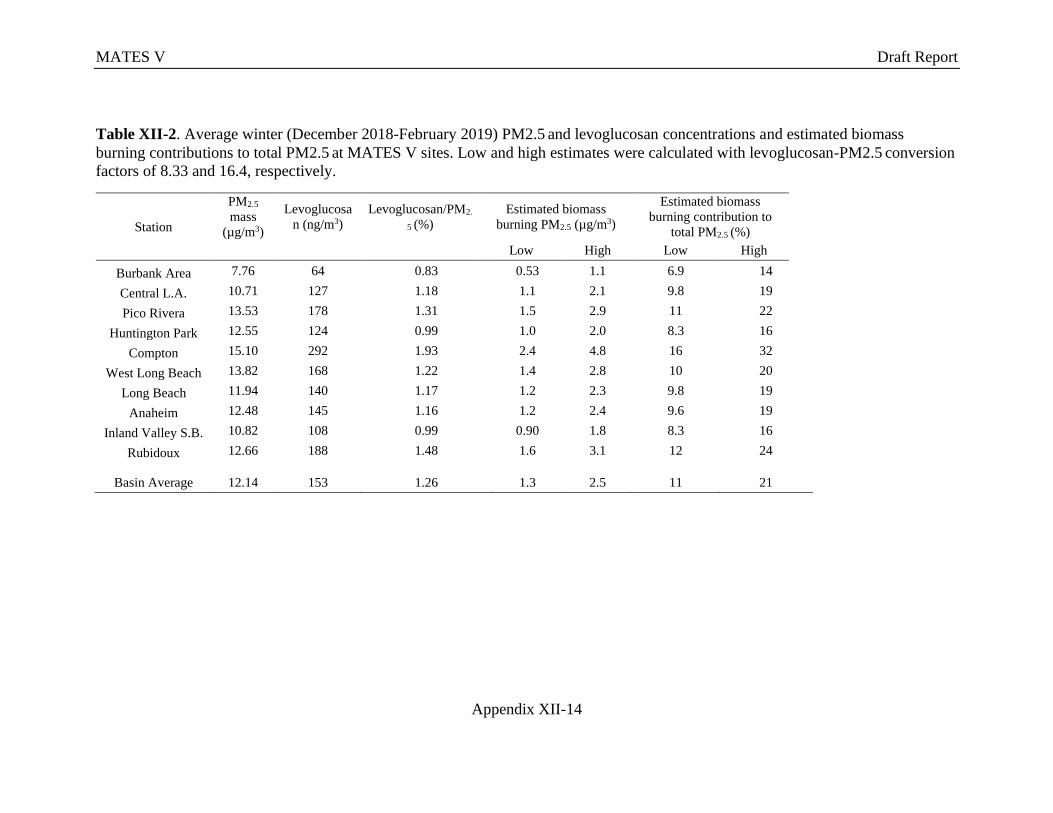
Applying this conversion factor range to measured winter levoglucosan concentrations illustrates
the potential significance of wood smoke contributions to total PM2.5 mass in the SCAB. From
December 2018-February 2019, the period during MATES V when residential wood burning
would be expected to reach peak levels, levoglucosan alone constituted an average of 0.8-1.9%
of total PM2.5 mass measured at each site (
MATES V Draft Report
Appendix XII-9
Table XII-1). Winter levoglucosan/PM2.5 mass ratios did not show any clear spatial trend, with
average levoglucosan concentrations remaining relatively close to 1% of total mass at most sites.
The only exception was at Compton, where levoglucosan represented a larger fraction of average
winter PM2.5 mass (1.9%). After applying the range of conversion factors determined above,
observed levoglucosan concentrations would translate to wood burning contributions ranging
from 7-32% (0.5-4.8 µg/m3) of total winter PM2.5 mass at individual sites, with a basin average
of 11-21% (1.3-2.5 µg/m3). These levoglucosan-based estimates are somewhat higher than
estimated winter biomass burning contributions at Central L.A. and Rubidoux from 2002-2007
determined using a Positive Factorization Matrix (PMF) receptor model (Central L.A.: 1.7
µg/m3/8.3% PM2.5 mass, Rubidoux: 1.0 µg/m3/5.0% PM2.5 mass (Hasheminassab, et al.,
2014)). However, this finding is consistent with a decrease in emissions from non-wood smoke
PM2.5 sources relative to wood smoke PM2.5 sources.
MATES V Draft Report
Appendix XII-10
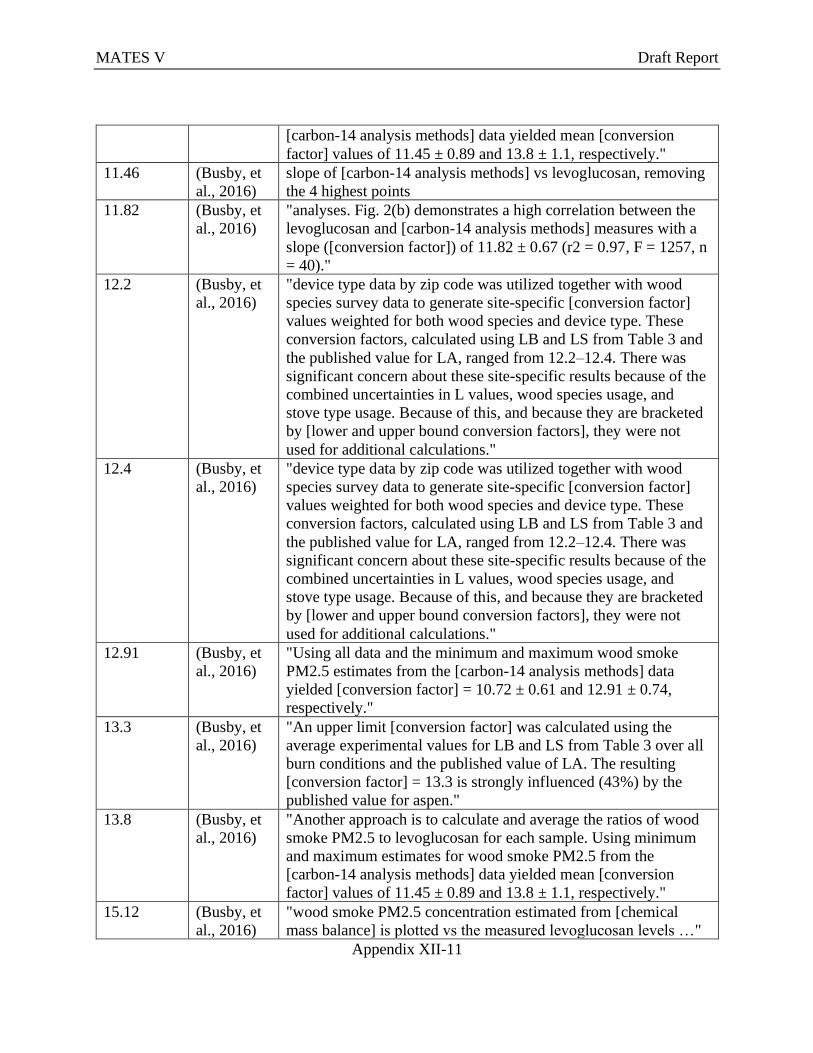
Table XII-1: Conversion factors derived from literature for use in wood smoke model.
Conversion
Factor
Citation Notes
8.3333 (Fine, et
al., 2001)
Calculated from numbers in the paper: "The results in Table 3
also indicate that almost all of the emitted fine particulate mass
consists of organic compounds. Organic carbon contributes over
80% of the fine particle mass in the emissions from every wood
species studied." "Between 3% and 12% of the fine particulate
organic compound emissions are accounted for by levoglucosan"
9.01 (Busby, et
al., 2016)
"We used a combination of the experimental and published values
for LA, LB and LS to establish a low and a high estimate of the
conversion factor. Using only the most relevant published results
(Fine et al., 2004a) gives a [conversion factor] = 9.01, which is
used here as a lower limit"
“LA, LB, and LS are the levoglucosan mass fractions for aspen,
birch, and spruce woodsmoke respectively.”
10.4 (Busby, et
al., 2016)
(citations
therein)
"Piazzalunga et al. (2011) generated conversion factors of 10.4
using literature values and 16.9 using [positive matrix
factorization] in Italy."
10.4167 (Fine, et
al., 2001)
Calculated from numbers in the paper: "The results in Table 3
also indicate that almost all of the emitted fine particulate mass
consists of organic compounds. Organic carbon contributes over
80% of the fine particle mass in the emissions from every wood
species studied." "Between 3% and 12% of the fine particle
organic compound emissions are accounted for by levoglucosan"
10.7 (Busby, et
al., 2016)
(citations
therein)
"Schmidl et al. (2008) and Caseiro et al. (2009) measured,
reported and used a conversion factor of 10.7 to calculate wood
smoke particulate from levoglucosan."
10.7 (Busby, et
al., 2016)
(citations
therein)
"Herich et al. (2014) compared results for multiple studies in
alpine regions of Europe and found that wood smoke PM to
levoglucosan ratios varied from 10.7 to 25.2."
10.72 (Busby, et
al., 2016)
"Using all data and the minimum and maximum wood smoke
PM2.5 estimates from the [carbon-14 analysis methods] data
yielded [conversion factor] = 10.72 ± 0.61 and 12.91 ± 0.74,
respectively."
11.31 (Busby, et
al., 2016)
slope of [carbon-14 analysis methods] vs levoglucosan, removing
the highest point
11.45 (Busby, et
al., 2016)
"Another approach is to calculate and average the ratios of wood
smoke PM2.5 to levoglucosan for each sample. Using minimum
and maximum estimates for wood smoke PM2.5 from the
MATES V Draft Report
Appendix XII-11
[carbon-14 analysis methods] data yielded mean [conversion
factor] values of 11.45 ± 0.89 and 13.8 ± 1.1, respectively."
11.46 (Busby, et
al., 2016)
slope of [carbon-14 analysis methods] vs levoglucosan, removing
the 4 highest points
11.82 (Busby, et
al., 2016)
"analyses. Fig. 2(b) demonstrates a high correlation between the
levoglucosan and [carbon-14 analysis methods] measures with a
slope ([conversion factor]) of 11.82 ± 0.67 (r2 = 0.97, F = 1257, n
= 40)."
12.2 (Busby, et
al., 2016)
"device type data by zip code was utilized together with wood
species survey data to generate site-specific [conversion factor]
values weighted for both wood species and device type. These
conversion factors, calculated using LB and LS from Table 3 and
the published value for LA, ranged from 12.2–12.4. There was
significant concern about these site-specific results because of the
combined uncertainties in L values, wood species usage, and
stove type usage. Because of this, and because they are bracketed
by [lower and upper bound conversion factors], they were not
used for additional calculations."
12.4 (Busby, et
al., 2016)
"device type data by zip code was utilized together with wood
species survey data to generate site-specific [conversion factor]
values weighted for both wood species and device type. These
conversion factors, calculated using LB and LS from Table 3 and
the published value for LA, ranged from 12.2–12.4. There was
significant concern about these site-specific results because of the
combined uncertainties in L values, wood species usage, and
stove type usage. Because of this, and because they are bracketed
by [lower and upper bound conversion factors], they were not
used for additional calculations."
12.91 (Busby, et
al., 2016)
"Using all data and the minimum and maximum wood smoke
PM2.5 estimates from the [carbon-14 analysis methods] data
yielded [conversion factor] = 10.72 ± 0.61 and 12.91 ± 0.74,
respectively."
13.3 (Busby, et
al., 2016)
"An upper limit [conversion factor] was calculated using the
average experimental values for LB and LS from Table 3 over all
burn conditions and the published value of LA. The resulting
[conversion factor] = 13.3 is strongly influenced (43%) by the
published value for aspen."
13.8 (Busby, et
al., 2016)
"Another approach is to calculate and average the ratios of wood
smoke PM2.5 to levoglucosan for each sample. Using minimum
and maximum estimates for wood smoke PM2.5 from the
[carbon-14 analysis methods] data yielded mean [conversion
factor] values of 11.45 ± 0.89 and 13.8 ± 1.1, respectively."
15.12 (Busby, et
al., 2016)
"wood smoke PM2.5 concentration estimated from [chemical
mass balance] is plotted vs the measured levoglucosan levels …"

MATES V Draft Report
Appendix XII-12
"Separate regression of the results at the three sites yields slopes
of 15.12 ± 0.39 (r2 = 0.96, F = 1470, n = 57), 23.3 ± 2.2 (r2 =
0.89, F = 464, n = 58) and 19.8 ± 2.5 (r2 = 0.84, F = 245, n = 46)
at the North Pole, Peger Rd., and State Building sites,
respectively. The slopes are estimates of the [conversion factor]
values assuming that [chemical mass balance] modeling provides
an accurate estimate of wood smoke PM2.5."
16.9 (Busby, et
al., 2016)
(citations
therein)
"Piazzalunga et al. (2011) generated conversion factors of 10.4
using literature values and 16.9 using [positive matrix
factorization] in Italy."
18.3 (Busby, et
al., 2016)
(citations
therein)
"Zhang et al. (2010a) used [positive matrix factorization] to obtain
a conversion factor of 18.3 for the southeastern US"
19.8 (Busby, et
al., 2016)
"wood smoke PM2.5 concentration estimated from [chemical
mass balance] is plotted vs the measured levoglucosan levels …
"Separate regression of the results at the three sites yields slopes
of 15.12 ± 0.39 (r2 = 0.96, F = 1470, n = 57), 23.3 ± 2.2 (r2 =
0.89, F = 464, n = 58) and 19.8 ± 2.5 (r2 = 0.84, F = 245, n = 46)
at the North Pole, Peger Rd., and State Building sites,
respectively. The slopes are estimates of the [conversion factor]
values assuming that [chemical mass balance] modeling provides
an accurate estimate of wood smoke PM2.5."
23.3 (Busby, et
al., 2016)
"wood smoke PM2.5 concentration estimated from [chemical
mass balance] is plotted vs the measured levoglucosan levels …
"Separate regression of the results at the three sites yields slopes
of 15.12 ± 0.39 (r2 = 0.96, F = 1470, n = 57), 23.3 ± 2.2 (r2 =
0.89, F = 464, n = 58) and 19.8 ± 2.5 (r2 = 0.84, F = 245, n = 46)
at the North Pole, Peger Rd., and State Building sites,
respectively. The slopes are estimates of the [conversion factor]
values assuming that [chemical mass balance] modeling provides
an accurate estimate of wood smoke PM2.5."
25.2 (Busby, et
al., 2016)
(citations
therein)
"Herich et al. (2014) compared results for multiple studies in
alpine regions of Europe and found that wood smoke PM to
levoglucosan ratios varied from 10.7 to 25.2."
33.3333 (Fine, et
al., 2001)
Calculated from numbers in the paper: "The results in Table 3
also indicate that almost all of the emitted fine particulate mass
consists of organic compounds. Organic carbon contributes over
80% of the fine particle mass in the emissions from every wood
species studied." "Between 3% and 12% of the fine particulate
organic compound emissions are accounted for by levoglucosan"
MATES V Draft Report
Appendix XII-13
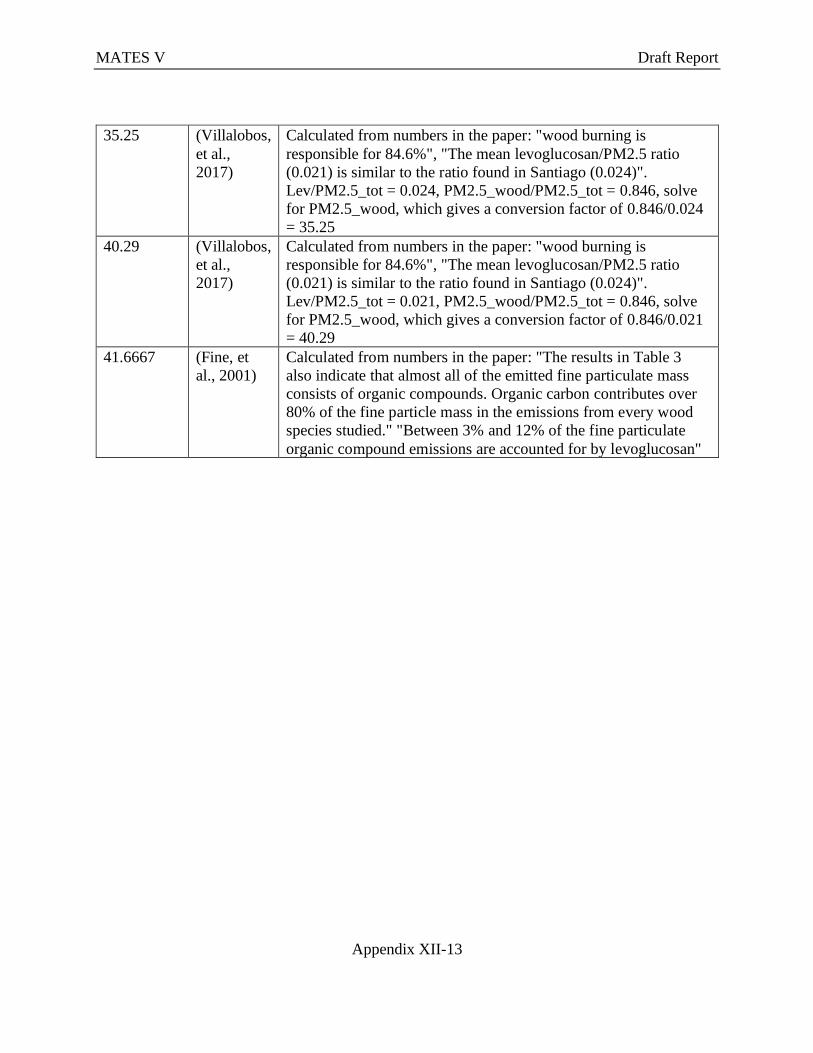
35.25 (Villalobos,
et al.,
2017)
Calculated from numbers in the paper: "wood burning is
responsible for 84.6%", "The mean levoglucosan/PM2.5 ratio
(0.021) is similar to the ratio found in Santiago (0.024)".
Lev/PM2.5_tot = 0.024, PM2.5_wood/PM2.5_tot = 0.846, solve
for PM2.5_wood, which gives a conversion factor of 0.846/0.024
= 35.25
40.29 (Villalobos,
et al.,
2017)
Calculated from numbers in the paper: "wood burning is
responsible for 84.6%", "The mean levoglucosan/PM2.5 ratio
(0.021) is similar to the ratio found in Santiago (0.024)".
Lev/PM2.5_tot = 0.021, PM2.5_wood/PM2.5_tot = 0.846, solve
for PM2.5_wood, which gives a conversion factor of 0.846/0.021
= 40.29
41.6667 (Fine, et
al., 2001)
Calculated from numbers in the paper: "The results in Table 3
also indicate that almost all of the emitted fine particulate mass
consists of organic compounds. Organic carbon contributes over
80% of the fine particle mass in the emissions from every wood
species studied." "Between 3% and 12% of the fine particulate
organic compound emissions are accounted for by levoglucosan"
MATES V Draft Report
Appendix XII-14
Table XII-2. Average winter (December 2018-February 2019) PM2.5 and levoglucosan concentrations and estimated biomass
burning contributions to total PM2.5 at MATES V sites. Low and high estimates were calculated with levoglucosan-PM2.5 conversion
factors of 8.33 and 16.4, respectively.
Station
PM2.5
mass
(µg/m3)
Levoglucosa
n (ng/m3)
Levoglucosan/PM2.
5 (%)
Estimated biomass
burning PM2.5 (µg/m3)
Estimated biomass
burning contribution to
total PM2.5 (%)
Low High Low High
Burbank Area 7.76 64 0.83 0.53 1.1 6.9 14
Central L.A. 10.71 127 1.18 1.1 2.1 9.8 19
Pico Rivera 13.53 178 1.31 1.5 2.9 11 22
Huntington Park 12.55 124 0.99 1.0 2.0 8.3 16
Compton 15.10 292 1.93 2.4 4.8 16 32
West Long Beach 13.82 168 1.22 1.4 2.8 10 20
Long Beach 11.94 140 1.17 1.2 2.3 9.8 19
Anaheim 12.48 145 1.16 1.2 2.4 9.6 19
Inland Valley S.B. 10.82 108 0.99 0.90 1.8 8.3 16
Rubidoux 12.66 188 1.48 1.6 3.1 12 24
Basin Average 12.14 153 1.26 1.3 2.5 11 21
MATES V Draft Report
Appendix XII-15
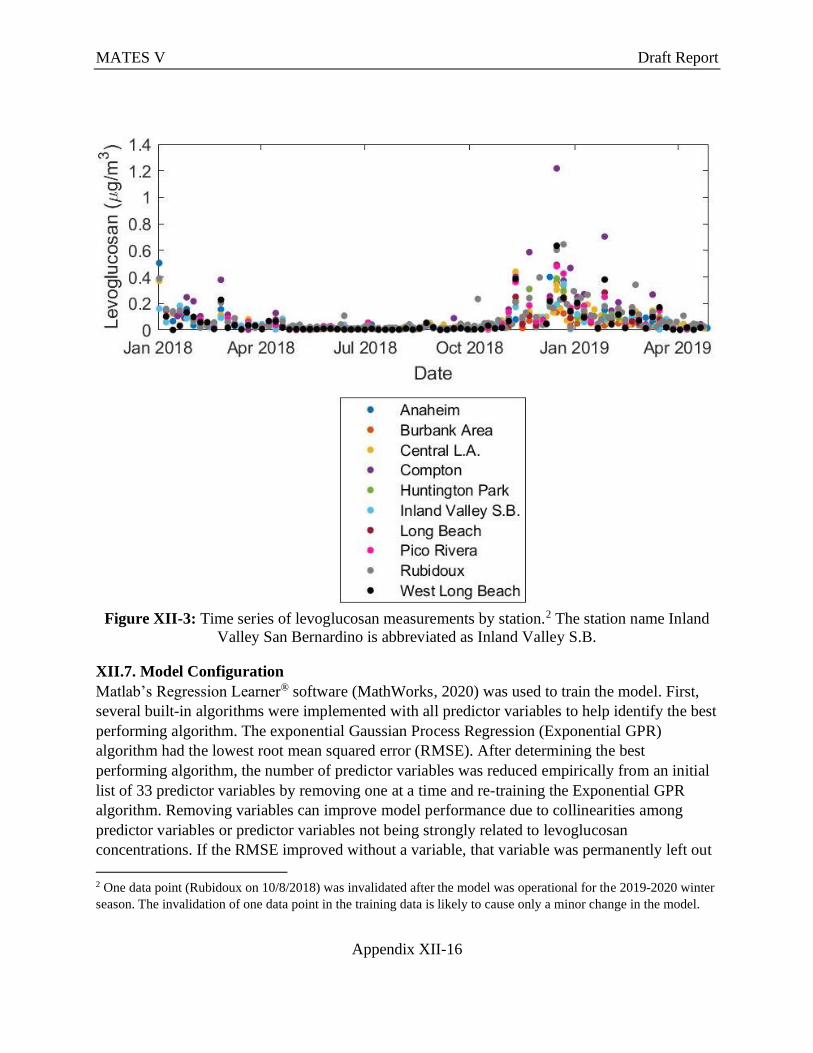
XII.6. Model Training Data
Levoglucosan observations included the measurements made at 10 stations from May 2018
through April 2019, and additional measurements during the lead-up period to MATES V
(January-April 2018). All of these measurements were incorporated into a training set for a new
wood smoke forecasting model. Four levoglucosan observations were removed from the training
set because they were impacted by smoke according to Hazard Mapping System (HMS) smoke
plume data (National Oceanic and Atmospheric Administration Office of Satellite and Product
Operations, 2020; NOAA OSEPO, 2020), and thus not representative of residential wood
burning. Three additional observations were removed due to missing data from the NAM
weather model (National Centers for Environmental Information, 2020). The data for 9% of
randomly-selected dates with observations were separated as a held-out data set to be used for
model verification. The held-out data set contained 57 observations. The final training data set
contained 854 observations. Figure XII-3 shows the time series of levoglucosan measurements
by station.
MATES V Draft Report
Appendix XII-16
Figure XII-3: Time series of levoglucosan measurements by station.2 The station name Inland
Valley San Bernardino is abbreviated as Inland Valley S.B.
XII.7. Model Configuration
Matlab’s Regression Learner® software (MathWorks, 2020) was used to train the model. First,
several built-in algorithms were implemented with all predictor variables to help identify the best
performing algorithm. The exponential Gaussian Process Regression (Exponential GPR)
algorithm had the lowest root mean squared error (RMSE). After determining the best
performing algorithm, the number of predictor variables was reduced empirically from an initial
list of 33 predictor variables by removing one at a time and re-training the Exponential GPR
algorithm. Removing variables can improve model performance due to collinearities among
predictor variables or predictor variables not being strongly related to levoglucosan
concentrations. If the RMSE improved without a variable, that variable was permanently left out
2 One data point (Rubidoux on 10/8/2018) was invalidated after the model was operational for the 2019-2020 winter
season. The invalidation of one data point in the training data is likely to cause only a minor change in the model.

MATES V Draft Report
Appendix XII-17
of the training and the next variable was tried. This process led to a final list of 21 predictor
variables included in the training (see
MATES V Draft Report
Appendix XII-18
Table XII-3).
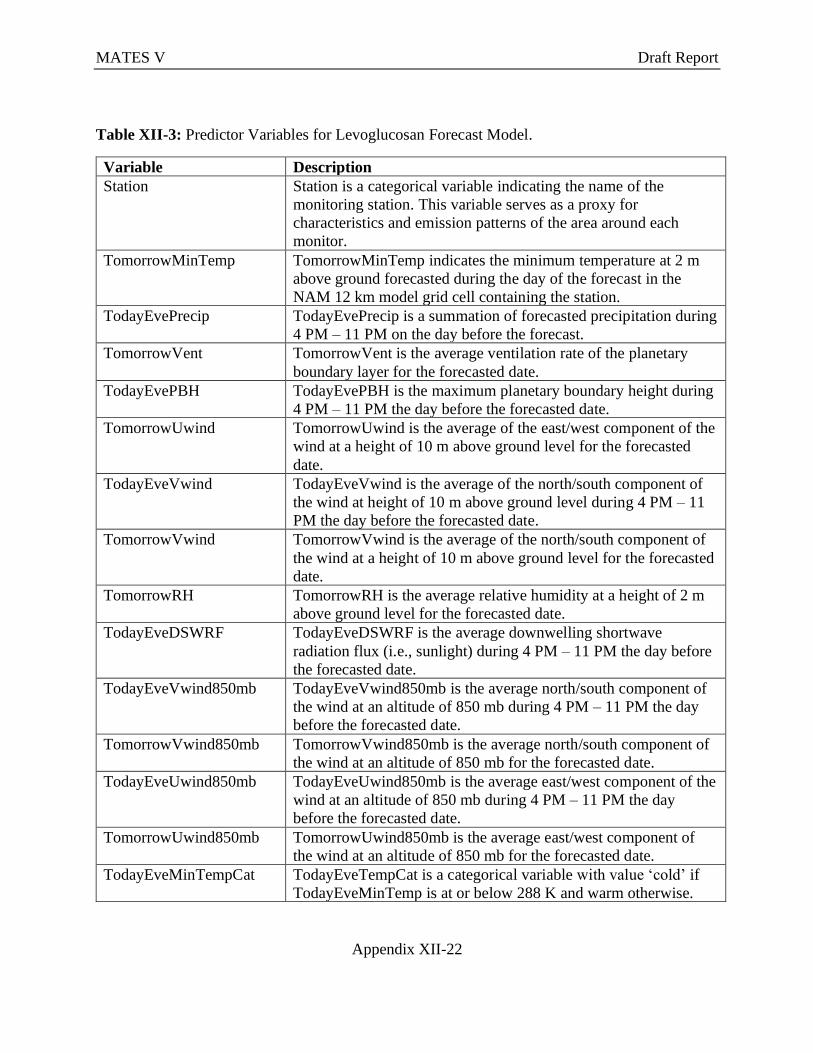
XII.8. Predictor Variables
The model is trained to create forecasts for the 10 stations that were in the training data using 21
predictor variables, see
MATES V Draft Report
Appendix XII-19
Table XII-3 and Figure XII-4 - Figure XII-5. Station is a categorical variable indicating the name
of the monitoring station, and the levoglucosan forecasts are made only at the stations with
levoglucosan measurements. This variable serves as a proxy for characteristics and emission
patterns of the area around each monitor. The remaining predictor variables are either calendar-
based (determined by day of week, proximity to holiday, etc.) or meteorologically-driven, based
on the North American Mesoscale Forecast System at a resolution of 12 km (12 km NAM)
(National Centers for Environmental Information, 2020). Since the 12 km NAM model provides
a forecast out to 84 hours, the levoglucosan model can be used to create a 3-day forecast.
The meteorological forecast data for the station locations were extracted by using data in the grid
cell in which each monitor is located. The naming convention for the meteorological variables is
that “TodayEve” variables describe a summary of the weather during 4 PM – 11 PM of the
evening before the forecasted date. This is because the weather variables that promote an
accumulation of PM2.5 (such as low planetary boundary height and calm winds) the evening
before the forecasted date will promote higher PM2.5 concentrations the next day. “Tomorrow”
in variable names indicates that the variable is a summary of the forecasted weather for the date
of the forecast.
The variables used in the final version of the model and their descriptions are presented in
MATES V Draft Report
Appendix XII-20
Table XII-3. The following variables were empirically removed as predictor variables for the
levoglucosan model: DayOfWeekName, Eve, TodayEveMinTemp, TodayEveMaxTemp,
TodayEveRH, TodayEveUwind, TodayEveVent, TomorrowDSWRF, TomorrowMaxTemp,
TomorrowPBH, TomorrowPrecip, and CumulativePM25Factors. These variables follow the
naming conventions established in

MATES V Draft Report
Appendix XII-21
Table XII-3. The variable “Eve” is a categorical (binary) variable indicating if the date to be
forecasted was December 24 or December 31 (‘Yes’) or any other day (‘No’).
“CumulativePM25Factors” is analogous to “CumulativeFactors,” except that it is based on
PM2.5 instead of levoglucosan.
MATES V Draft Report
Appendix XII-22
Table XII-3: Predictor Variables for Levoglucosan Forecast Model.
Variable Description
Station Station is a categorical variable indicating the name of the
monitoring station. This variable serves as a proxy for
characteristics and emission patterns of the area around each
monitor.
TomorrowMinTemp TomorrowMinTemp indicates the minimum temperature at 2 m
above ground forecasted during the day of the forecast in the
NAM 12 km model grid cell containing the station.
TodayEvePrecip TodayEvePrecip is a summation of forecasted precipitation during
4 PM – 11 PM on the day before the forecast.
TomorrowVent
TomorrowVent is the average ventilation rate of the planetary
boundary layer for the forecasted date.
TodayEvePBH
TodayEvePBH is the maximum planetary boundary height during
4 PM – 11 PM the day before the forecasted date.
TomorrowUwind
TomorrowUwind is the average of the east/west component of the
wind at a height of 10 m above ground level for the forecasted
date.
TodayEveVwind
TodayEveVwind is the average of the north/south component of
the wind at height of 10 m above ground level during 4 PM – 11
PM the day before the forecasted date.
TomorrowVwind
TomorrowVwind is the average of the north/south component of
the wind at a height of 10 m above ground level for the forecasted
date.
TomorrowRH
TomorrowRH is the average relative humidity at a height of 2 m
above ground level for the forecasted date.
TodayEveDSWRF
TodayEveDSWRF is the average downwelling shortwave
radiation flux (i.e., sunlight) during 4 PM – 11 PM the day before
the forecasted date.
TodayEveVwind850mb
TodayEveVwind850mb is the average north/south component of
the wind at an altitude of 850 mb during 4 PM – 11 PM the day
before the forecasted date.
TomorrowVwind850mb
TomorrowVwind850mb is the average north/south component of
the wind at an altitude of 850 mb for the forecasted date.
TodayEveUwind850mb
TodayEveUwind850mb is the average east/west component of the
wind at an altitude of 850 mb during 4 PM – 11 PM the day
before the forecasted date.
TomorrowUwind850mb
TomorrowUwind850mb is the average east/west component of
the wind at an altitude of 850 mb for the forecasted date.
TodayEveMinTempCat
TodayEveTempCat is a categorical variable with value ‘cold’ if
TodayEveMinTemp is at or below 288 K and warm otherwise.
MATES V Draft Report
Appendix XII-23
TomorrowMaxTempCat
TomorrowMaxTempCat is a categorical variable with value ‘cold’
if TomorrowMaxTemp is at or below 297 K and warm otherwise.
MonthName
MonthName is a categorical variable indicating the month.
Weekend
Weekend is a categorical variable indicating if a day is a weekday
or part of the weekend.
HolidayType
HolidayType is a categorical variable indicating if a day was a
major holiday, minor holiday, or not a holiday.
ProximityToMajorHoliday
ProximityToMajorHoliday is 0 on major holidays, -1 the day
before and after a major holiday, -2 two days before or after a
major holiday, or -3 three days before or after a major holiday. All
other days are -4 with the assumption that holiday-related
activities only influence residential wood burning patterns within
three days before or after a holiday.
CumulativeFactors CumulativeFactors is an integer variable that indicates how
closely the meteorological conditions resemble aggregate
descriptions of the weather conditions corresponding to the
highest 10% levoglucosan concentrations. For example, if
TomorrowMinTemp for a date of interest was less than the
highest TomorrowMinTemp corresponding to the highest 10% of
levglucosan measurements, CumulativeFactors would be
increased by 1. CumulativeFactors is increased by 1 if
ProximityToMajorHolidays is greater than -4. CumulativeFactors
is also increased by 1 for weekends. The maximum value for
CumulativeFactors would be 22.
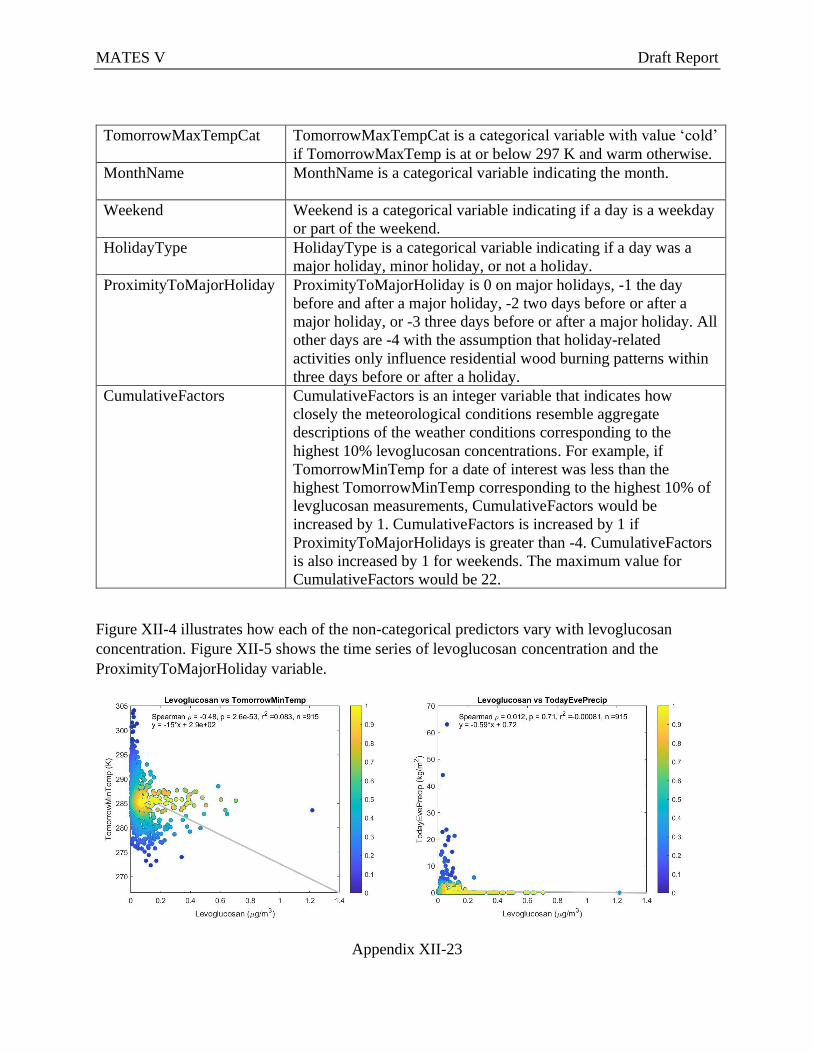
Figure XII-4 illustrates how each of the non-categorical predictors vary with levoglucosan
concentration. Figure XII-5 shows the time series of levoglucosan concentration and the
ProximityToMajorHoliday variable.

MATES V Draft Report
Appendix XII-24

MATES V Draft Report
Appendix XII-25
Figure XII-4: Density scatter plots of levoglucosan and the weather variables in
MATES V Draft Report
Appendix XII-26
Table XII-3. The color bars indicate the relative density of data points next to each other, as data
can be plotted on top of each other in scatter plots.
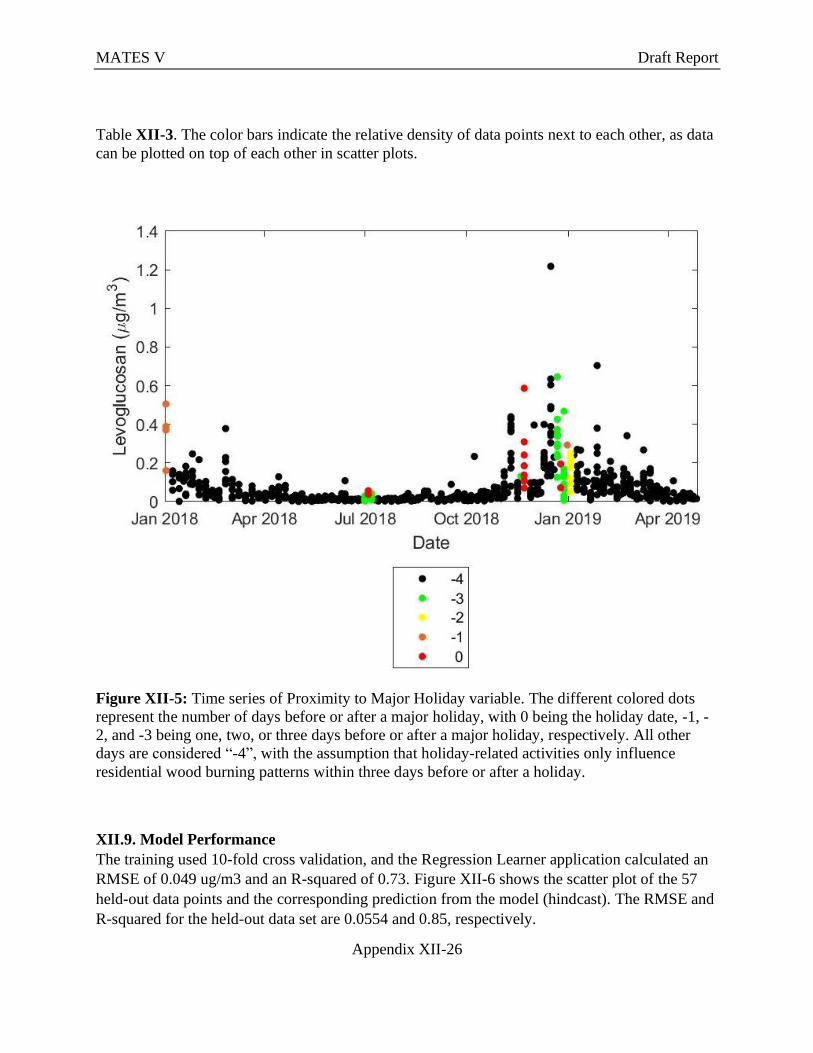
Figure XII-5: Time series of Proximity to Major Holiday variable. The different colored dots
represent the number of days before or after a major holiday, with 0 being the holiday date, -1, -
2, and -3 being one, two, or three days before or after a major holiday, respectively. All other
days are considered “-4”, with the assumption that holiday-related activities only influence
residential wood burning patterns within three days before or after a holiday.
XII.9. Model Performance
The training used 10-fold cross validation, and the Regression Learner application calculated an
RMSE of 0.049 ug/m3 and an R-squared of 0.73. Figure XII-6 shows the scatter plot of the 57
held-out data points and the corresponding prediction from the model (hindcast). The RMSE and
R-squared for the held-out data set are 0.0554 and 0.85, respectively.

MATES V Draft Report
Appendix XII-27
Figure XII-6: Scatter plot of held-out observations and corresponding predictions (hindcast).
The station name Inland Valley San Bernardino is abbreviated as Inland Valley S.B.
XII.10. Application to Daily Air Quality Forecasts
While residential wood smoke may contribute significantly to PM2.5 concentrations on certain
days in the winter months, emission inventories for PM2.5 chemical transport forecasting models
apportion wood smoke based on a static temporal profile that is not dependent on meteorology.
Wood smoke PM2.5 predictions from other forecasting models used by South Coast AQMD
staff to issue daily forecasts also have high levels of uncertainty because of their inability to
capture the human behavioral influence on burning patterns. In order to improve winter-time
predictions of total PM2.5, the midpoint of the upper- and lower-bound estimates of wood smoke
PM2.5 from the levoglucosan model is used in a weighted ensemble of PM2.5 forecast models to
improve predictions of total PM2.5 when widespread residential wood burning occurs.

MATES V Draft Report
Appendix XII-28
XII.11. Multi-Year Time Series
The levoglucosan model predictions can be generated for any day for which the predictor
variables can be calculated, i.e., any day for which the NAM data is available. Residential wood
burning patterns may gradually change over the course of several years, which means that the
model will need to be trained with new levoglucosan measurement data. However, residential
wood burning patterns are unlikely to change substantially over the course of a few years. As
such, staff has run the levoglucosan model backward in time to create retrospective forecasts
starting on January 1, 2017 through the start of the on-going operational model runs, resulting in
a time series from January 1, 2017 through January 1, 2021.
This multi-year time series of levoglucosan model predictions has been used to help guide
outreach efforts for the Check Before You Burn Initiative related to Rule 445 (South Coast Air
Quality Management District, 2013; South Coast Air Quality Management District, 2020). To
achieve this goal, we used levoglucosan model wood smoke PM2.5 predictions during the 2020-
2021 and 2019-2020 Check Before You Burn seasons (November to February) to estimate the
impact of wood burning on the annual mean PM2.5 concentration and the 98th percentile of daily
PM2.5 concentrations—two important statistics for the PM2.5 federal standards. Outreach was
prioritized in communities with higher PM2.5 concentrations along with a larger contribution
from residential wood smoke.
XII.12. Conclusion
Analysis of measured levoglucosan concentrations has provided critical insight into the spatial
and temporal trends of wood smoke throughout the South Coast Air Basin. Development of a
machine learning model with the levoglucosan measurements has improved the accuracy of
wintertime forecasts and allowed for prioritization of outreach for the Check Before You Burn
program in communities most impacted by residential wood smoke.
XII.13. References
Busby, B. D., Ward, T. J., Turner, J. R. & Palmer, C. P., 2016. Comparison and Evaluation of
Methods to Apportion Ambient PM2.5 to Residential Wood Heating in Fairbanks, AK. Aerosol
and Air Quality Research, Volume 16, pp. 492-503.
California Air Resources Board, 2015. Standard operating procedure for the analysis of
levoglucosan, mannosan, and galactosan in ambient air using gas chromatography/mass
spectrometry (SOP MLD073), Sacramento: s.n.
Cordell, R., White, I. & Monks, P., 2014. Validation of an assay for the determination of
levoglucosan and associated monosaccharide anhydrides for the quantification of wood smoke in
atmospheric aerosol.. Analytical and Bioanalytical Chemistry, Volume 406, pp. 5283-5292.
MATES V Draft Report
Appendix XII-29
Fabbri, D. et al., 2009. Levoglucosan and other cellulose and lignin markers in emissions from
burning of Miocene lignites. Atmospheric Environment, Volume 43, pp. 2286-2295.
Fine, P. M., Cass, G. R. & Simoneit, B. R. T., 2001. Chemical Characterization of Fine Particle
Emissions from Fireplace Combustion of Woods Grown in the Northeastern United States.
Environ. Sci. Technol., Volume 35, pp. 2665-2675.
Fine, P. M., Cass, G. R. & Simoneit, B. R. T., 2004. Chemical Characterization of Fine Particle
Emissions from the Wood Stove Combustion of Prevalent United States Tree Species. Environ.
Eng. Sci., Volume 21, pp. 705-721.
Fine, P. M., Cass, G. R., Simoneit & T., B. R., 2002. Organic compounds in biomass smoke
from residential wood combustion: Emissions characterization at a continental scale. J. Geophys.
Res., 107(D21), p. 8349.
Hasheminassab, S. et al., 2014. Spatial and temporal variability of sources of ambient fine
particulate matter (PM2.5) in California. Atmospheric Chemistry and Physics, Volume 14, pp.
12085-12097.
Hennigan, C. J. et al., 2011. Chemical and physical transformations of organic aerosol from the
photo-oxidation of open biomass burning emissions in an environmental chamber. Atmos. Chem.
Phys., Volume 11, pp. 7669-7686.
Hennigan, C. J. et al., 2010. Levoglucosan stability in biomass burning particles exposed to
hydroxyl radicals. Geophys. Res. Lett., Volume 37, p. L09806.
Heo, J. et al., 2013. Source apportionments of PM2.5 organic carbon using molecular marker
Positive Matrix Factorization and comparison of results from different receptor models. Atmos.
Environ., Volume 73, pp. 51-61.
Hoffmann, D., Tilgner, A., Iinuma, Y. & Herrmann, H., 2010. Atmospheric Stability of
Levoglucosan: A Detailed Laboratory and Modeling Study.. Environ. Sci. Technol., Volume 44,
pp. 694-699.
Hosseini, S. et al., 2013. Laboratory characterization of PM emissions from combustion of
wildland biomass fuels. J. Geophys. Res., Volume 118, pp. 9914-9929.
Kuo, L.-J., Louchouarn, P. & Herbert, B. E., 2011. Influence of combustion conditions on yields
of solvent-extractable anhydrosugars and lignin phenols in chars: Implications for
characterizations of biomass combustion residues. Chemosphere, 85(5), pp. 797-805.
MathWorks, 2020. Regression Learner. [Online]
Available at: https://www.mathworks.com/help/stats/regressionlearner-app.html
[Accessed 17 June 2020].

MATES V Draft Report
Appendix XII-30
National Centers for Environmental Information, 2020. North American Mesoscale Forecast
System (NAM). https://www.ncdc.noaa.gov/data-access/model-data/model-datasets/north-
american-mesoscale-forecast-system-nam: s.n.
National Oceanic and Atmospheric Administration Office of Satellite and Product Operations,
2020. Hazard Mapping System Fire and Smoke Product. [Online]
Available at: https://www.ospo.noaa.gov/Products/land/hms.html
[Accessed 23 June 2020].
NOAA OSEPO, 2020. Index of /pub/FIRE/HMS/GIS. [Online]
Available at: https://satepsanone.nesdis.noaa.gov/pub/FIRE/HMS/GIS/
[Accessed 23 June 2020].
Pratap, V. et al., 2019. Investigation of levoglucosan decay in wood smoke smog-chamber
experiments: The importance of aerosol loading, temperature, and vapor wall losses in
interpreting results. Atmospheric Environment, Volume 199, pp. 224-232.
Sang, X. F. et al., 2016. Chemical stability of levoglucosan: An isotopic perspective.
Geophysical Research Letters, Volume 43, pp. 5419-5424.
Schauer, J. J., Kleeman, M. J., Cass, G. R. & Simoneit, B. R. T., 2001. Measurement of
Emissions from Air Pollution Sources. 3. C1-C29 Organic Compounds from Fireplace
Combustion of Wood. Environ. Sci. Technol., Volume 35, pp. 1716-1728.
Schauer, J. & Sioutas, C., 2012. Source apportionment of carbonaceous aerosols using
integrated multi-variant and source tracer techniques and a unique molecular marker data set,
Sacramento: s.n.
Shirmohammadi, F. et al., 2016. Fine and Ultrafine Particulate Organic Carbon in the Los
Angeles Basin: Trends in Sources and Composition. Sci. Total Environ., Volume 541, pp. 1083-
1096.
Simoneit, B. T., 2002. Biomass burning – a review of organic tracers for smoke from incomplete
combustion. Applied Geochemistry, Volume 17, pp. 129-162.
South Coast Air Quality Management District, 2008. Final Environmental Assessment: Proposed
Rule 445 - Wood Burning Devices. [Online]
Available at: http://www.aqmd.gov/docs/default-source/ceqa/documents/aqmd-
projects/2008/final-environmental-assessment-for-proposed-rule-445.pdf
[Accessed 18 June 2020].
South Coast Air Quality Management District, 2008. MATES III Appendix VII PM2.5 Source
Apportionment for the South Coast Air Basin Using Chemical Mass Balance Receptor Model.
[Online]
Available at: http://www.aqmd.gov/docs/default-source/air-quality/air-toxic-studies/mates-

MATES V Draft Report
Appendix XII-31
iii/mates-iii-final-report-(september-2008)/appendix-vii-pm2-5-source-apportionment-for-the-
south-coast-air-basin-using-chemical-mass-balance-receptor-model.pdf?sfvrsn=10
[Accessed 22 September 2020].
South Coast Air Quality Management District, 2008. Multiple Air Toxics Exposure Study in the
South Coast Air Basin: MATES III. [Online]
Available at: http://www.aqmd.gov/home/air-quality/air-quality-studies/health-studies/mates-
iii/mates-iii-final-report
[Accessed 24 November 2020].
South Coast Air Quality Management District, 2013. Rule 445 – Wood Burning Devices.
[Online]
Available at: http://www.aqmd.gov/docs/default-source/rule-book/rule-iv/rule-445.pdf
[Accessed 19 June 2020].
South Coast Air Quality Management District, 2016. 2016 Air Quality Management Plan
Appendix II Current Air Quality. [Online]
Available at: https://www.aqmd.gov/docs/default-source/clean-air-plans/air-quality-
management-plans/2016-air-quality-management-plan/final-2016-aqmp/appendix-
ii.pdf?sfvrsn=4
[Accessed 22 September 2020].
South Coast Air Quality Management District, 2020. Check Before You Burn - Frequently Asked
Questions. [Online]
Available at: https://www.aqmd.gov/home/programs/community/cbyb---faq
[Accessed 19 June 2020].
Sullivan, A. P. et al., 2008. A method for smoke marker measurements and its potential
application for determining the contribution of biomass. J. Geophys. Res., Volume 113, p.
D22302.
Villalobos, A. M., Barraza, F., Jorquera, H. & Schauer, J. J., 2017. Wood burning pollution in
southern Chile: PM2.5 source apportionment using CMB and molecular markers. Environmental
Pollution, Volume 225, pp. 514-523.