“The role of LEF1 and the WNT signaling pathway in B cell ... · The WNT signaling pathway...
156
“The role of LEF1 and the WNT signaling pathway in B cell development and leukemia” Inaugural-Dissertation zur Erlangung des Doktorgrades Dr. rer. nat. der Fakultät für Biologie an der Universität Duisburg-Essen vorgelegt von Simon Jonas Poll-Wolbeck aus Gronau (Westfalen) vorgelegt im April 2014
Transcript of “The role of LEF1 and the WNT signaling pathway in B cell ... · The WNT signaling pathway...
“The role of LEF1 and the WNT signaling pathway in B cell development and leukemia”
Inaugural-Dissertation
zur
Erlangung des Doktorgrades
Dr. rer. nat.
der Fakultät für
Biologie
an der
Universität Duisburg-Essen
vorgelegt von
Simon Jonas Poll-Wolbeck
aus Gronau (Westfalen)
vorgelegt im April 2014

II
Die der vorliegenden Arbeit zugrunde liegenden Experimente wurden von April 2009 bis September 2014 im Labor für Molekulare Hämatologie und Onkologie der Klinik I für Innere Medizin der Universität zu Köln durchgeführt. 1. Gutachter: Prof. Dr. Verena Jendrossek 2. Gutachter: Prof. Dr. Ralf Küppers 3. Gutachter: * Vorsitzender des Prüfungsausschusses: Prof. Dr. Bertram Opalka Tag der mündlichen Prüfung: 16.10.2014

III
„Wat den Eenen sin Uhl, is den Annern sin Nachtigall“
Plattdeutsches Sprichwort
IV
Table of content Table of content ............................................................................................................ IV
Abbreviations ............................................................................................................... VII Figures............................................................................................................................ X
Tables ............................................................................................................................ XI 1 Short summary ....................................................................................................... 1
2 Introduction ............................................................................................................ 3
2.1 The WNT signaling pathway ............................................................................... 3
2.2 WNTs, Receptors, Regulators and Pathways .................................................... 5
2.2.1 WNT proteins ............................................................................................... 6
2.2.2 WNT receptors ............................................................................................. 7
2.2.3 Disheveled ................................................................................................... 7
2.2.4 Extracellular WNT modulation ...................................................................... 8
2.3 Non-canonical WNT signaling ............................................................................ 8
2.4 β-catenin dependent WNT signaling ................................................................ 10
2.4.1 The transcription factor LEF1 ..................................................................... 17
2.4.2 WNT pathway crosstalk ............................................................................. 20
2.4.3 WNT Signaling in Stem cells ...................................................................... 22
2.5 Hematopoiesis .................................................................................................. 23
2.6 B cell development ........................................................................................... 23
2.6.1 WNT signaling in B cell development ......................................................... 26
2.6.2 LEF1 expression during B cell development .............................................. 26
2.7 Chronic lymphocytic leukemia (CLL) ................................................................ 27
2.7.1 Etiology ...................................................................................................... 27
2.7.2 Epidemiology ............................................................................................. 27
2.7.3 Diagnosis ................................................................................................... 28
2.7.4 Disease progression .................................................................................. 28
2.7.5 Treatment .................................................................................................. 28
2.7.6 Pathogenesis ............................................................................................. 29
2.7.7 WNT signaling in CLL ................................................................................ 30
2.8 NO-ASAs .......................................................................................................... 32
2.9 Goals of the project .......................................................................................... 34
V
3 Materials ................................................................................................................ 35
3.1 Chemicals ......................................................................................................... 35
3.2 NO-ASA derivatives .......................................................................................... 35
3.3 Media, Buffers & Solutions ............................................................................... 36
3.4 Recombinant proteins ....................................................................................... 38
3.5 Antibodies ......................................................................................................... 39
3.6 Kits ................................................................................................................... 40
3.7 Miscellaneous ................................................................................................... 41
3.8 Instrumentation ................................................................................................. 42
3.9 Animal housing ................................................................................................. 42
3.10 Cell lines ........................................................................................................... 43
3.11 Software ........................................................................................................... 43
4 Methods ................................................................................................................. 45
4.1 Protein electrophoresis & Immunoblotting ........................................................ 45
4.2 Immunofluorescence ........................................................................................ 45
4.3 Cell culture ....................................................................................................... 46
4.4 Primary Cell isolation ........................................................................................ 46
4.5 Proliferation assay ............................................................................................ 48
4.6 Transgenic mice ............................................................................................... 48
4.6.1 Generation of LEF1 knock-in strain ............................................................ 48
4.7 Transgenic mouse strains ................................................................................ 50
4.7.1 Genotyping ................................................................................................ 52
4.8 Analysis of murine peripheral blood.................................................................. 53
4.8.1 Blood counts .............................................................................................. 53
4.8.2 FACS ......................................................................................................... 54
4.9 SCID beige Xenograft mouse model ................................................................ 55
4.10 mRNA Expression array ................................................................................... 56
4.11 Declarations ..................................................................................................... 56
5 Results .................................................................................................................. 57
5.1 The R26lef1 mouse strain .................................................................................. 57
5.1.1 Development and founder mouse .............................................................. 57
5.1.2 Cre activity induces LEF1 overexpression ................................................. 57
5.1.3 WNT activation leads to increases number of cells with nuclear Axin2 ...... 62
VI
5.2 Phenotype of R26lef1 CD19wt/cre mice ................................................................ 63
5.2.1 No differences in cell morphology .............................................................. 66
5.2.2 R26lef1 CD19wt/cre mice show normal leucocyte counts ............................... 67
5.2.3 Decreased percentage of B cells in the PB of R26lef1 CD19wt/cre mice ........ 68
5.2.4 The percentage of B cells is reduced in the spleen and in the BM............. 69
5.2.5 WNT signaling inhibits the proliferation of B cells from the spleen ............. 71
5.2.6 No significant impact of LiCl treatment in vivo............................................ 75
5.3 The R26lef1 CMV-cre strain ............................................................................... 76
5.3.1 Trend towards reduced percentage of B cells in the peripheral blood ....... 78
5.3.2 Skull deformations ..................................................................................... 79
5.4 Phenotype R26lef1 Cr2-cre ................................................................................ 80
5.4.1 General description .................................................................................... 81
5.5 Influencing the WNT signaling in CLL cells ...................................................... 83
5.5.1 WNT library in CLL ..................................................................................... 83
5.5.2 NO-ASA as WNT inhibitors in CLL cells .................................................... 85
5.5.3 New derivatives .......................................................................................... 87
6 Discussion ............................................................................................................ 91
6.1 The role of WNT signaling in hematopoiesis .................................................... 91
6.2 The LEF1 mouse models ................................................................................. 92
6.2.1 Proof of principle of the R26lef1 mouse model ............................................ 93
6.2.2 Effects of LEF1 expression ........................................................................ 95
6.3 Comparison of LEF1 dependent mouse models .............................................. 98
6.4 Advantages and drawbacks of the R26lef1 mouse model ................................ 101
6.5 WNT signaling in CLL ..................................................................................... 103
6.6 Targeting the WNT signaling pathway in CLL ................................................ 106
6.6.1 NO-ASAs ................................................................................................. 107
6.7 Outlook ........................................................................................................... 112
7 Literature ............................................................................................................. 116
8 Additional Information ....................................................................................... 133
8.1 Supplemental data.......................................................................................... 133
9 Acknowledgements ............................................................................................ 139
10 Declarations ........................................................................................................ 140

VII
Abbreviations
AA Amino acid
ALL Acute lymphoblastic leukemia
AML Acute myeloid leukemia
APC Adenomatous polyposis coli
B220 Protein tyrosine phosphatase, receptor type restricted (220 kDa)
BCR B cell receptor
BM Bone marrow
BSA Bovine serum albumin
Ca2+ Calcium
CBP CREB-binding protein
CD19 B-lymphocyte antigen CD19
CD23 Low affinity immunoglobulin epsilon Fc receptor
CD38 ADP-ribosyl cyclase 1
CD5 T-cell surface glycoprotein CD5
cDNA Complementary DNA
CLL Chronic lymphocytic leukemia
CLP Common lymphoid progenitor
CMV Cytomegalovirus
CRD Cystein rich domain
Cy3 Cyanine 3
DAVID Database for Annotation, Visualization and Integrated Discovery
DMSO Dimethylsulfoxide
DN Dominant negative
DNA Deoxyribonucleic acid
DSMZ German Collection of Microorganisms and Cell Cultures GmbH
EA Ethacrynic acid
ECM Extracellular matrix
EDTA Ethylenediaminetetraacetic acid
ER Endoplasmatic reticulum
FACS Fluorescence-activated cell sorting
FCS Fetal calf serum
FZD Frizzled
GFP Green fluorescent protein

VIII
GSK Glycogensynthase
HMG High mobility group
HSC Hematopoietic stem cell
HSP Heat shock protein
Ig Immunoglobulin
IgVH Immunoglobulin variable heavy chain region
int Integration site
IP3 inositol 1,4,5-trisphosphate
K14 Keratinocyte 14
kDa Kilo Dalton
KO Knock-out
LEF1 Lymphoid enhancer-binding factor 1
LiCl Lithium chloride
LPS Lipopolysaccharide
LRP Low-density lipoprotein receptor-related protein
MEF Murine embryonic fibroblast
MFI Mean fluorescent intensity
mRNA Messenger RNA
NEAA Non-essential amino acids
NEO Neomycin
NES Nuclear export signal
NLC Nurse-like cell
NLK Nemo-like kinase
NLS Nuclear localization signal
NO-ASA Nitric oxide donating Aspirin
PB Peripheral blood
PBMC Peripheral blood mononuclear cell
PBS Phosphate-buffered saline
PCP Planar cell polarity
PCR Polymerase chain reaction
PFA Paraformaldehyde
PIP2 Phosphatidylinositol 4,5-bisphosphate
PKC Protein kinase C
PM Plasma membrane
R26 Rosa26 locus
RNA Ribonucleic acid

IX
SC Stem cell
SEM Standard error of means
sFRP Secreted frizzled-related protein
SHH Sonic hedgehog
TBS Tris-buffered saline
V(D)J Variable, Diverse and Joining
WBC White blood cell count
WIF WNT inhibitory factor
WNT Wingless-related integration site
WRE WNT response element
ZAP70 Tyrosine-protein kinase ZAP-70
X
Figures Figure 1 Amino acid sequence conservation of LEF1. .................................................................................. 4
Figure 2 The WNT signaling network on receptor level. depicted. ............................................................... 5
Figure 3 The non-canonical WNT signaling .................................................................................................. 9
Figure 4 WNT/β-catenin pathway ................................................................................................................ 11
Figure 5 Axin2 negative feedback loop ....................................................................................................... 13
Figure 6 LEF1 general structure .................................................................................................................. 17
Figure 7 Exemplary WNT/β-catenin pathway crosstalk .............................................................................. 21
Figure 8 Schematic overview of hematopoiesis .......................................................................................... 23
Figure 9 B cell development ........................................................................................................................ 25
Figure 10 Cloning strategy. ......................................................................................................................... 49
Figure 11 Gating strategy ............................................................................................................................ 55
Figure 12 GFP is expressed in peripheral blood B cells of R26lef CD19wt/cre mice ...................................... 58
Figure 13 Exemplary reporter GFP expression remains stable over 48 weeks .......................................... 59
Figure 14 LEF1 expression in murine B cells .............................................................................................. 60
Figure 15 LEF1 expression in MEFs ........................................................................................................... 61
Figure 16 LEF1 and Axin2 expression in R26lef1 CMV-cre MEFs treated with 20 mM LiCl for 16 h ........... 62
Figure 17 Analysis of Axin2 subcellular localization in MEFs ..................................................................... 63
Figure 18 Kaplan-Meyer curve of R26lef1 and R26lef1 CD19wt/cre mice ......................................................... 65
Figure 19 Exemplary peripheral blood and bone marrow smears .............................................................. 66
Figure 20 Number of leucocytes in the peripheral blood. ............................................................................ 67
Figure 21 Percentage of B cells in the lymphocyte fraction of the peripheral blood of males and females 68
Figure 22 Percentage of B cells in the lymphocyte fraction of the peripheral blood combined sexes ........ 69
Figure 23 Percentage of B cells in spleen and bone marrow ...................................................................... 70
Figure 24 Annexin V negative B cells from the bone marrow ..................................................................... 71
Figure 25 Influence of WNT modulation on proliferation of B cells from the spleen ................................... 72
Figure 26 Influence of WNT modulation on survival of B cells from the spleen .......................................... 73
Figure 27 Influence of WNT modulation on proliferation of B cells from the bone marrow ......................... 74
Figure 28 In vivo LiCl treatment .................................................................................................................. 75
Figure 29 Exemplary GFP expression in leucocytes from the peripheral blood ......................................... 76
Figure 30 Percentage of GFP positive cells in peripheral blood subpopulations ........................................ 77
Figure 31 Number of leucocytes in the peripheral blood ............................................................................. 78
Figure 32 Percentage of B cells in the peripheral blood of R26lef1 CMV-cre and control mice ................... 79
Figure 33 Skull deformation of R26lef1 CMV-cre mice ................................................................................. 80
Figure 34 GFP expression in R26lef1 Cr2-cre mice is restricted to B220 positive B cells............................ 81
Figure 35 Number of leucocytes in the peripheral blood of R26lef1 Cr2-cre mice ....................................... 82
Figure 36 Percentage of B cells in the peripheral blood of R26lef1 Cr2-cre and control mice ..................... 82
Figure 37 Viability of CLL cells treated with WNT activators ....................................................................... 83
Figure 38 Viability of CLL cells treated with WNT inhibitors ........................................................................ 84

XI
Figure 39 Heatmap of array based genome wide mRNA expression analysis ........................................... 86
Figure 40 Chemical structures of pNO-ASA, NOBA and NO-Naphtyl ........................................................ 88
Figure 41 JVM3 xenograft model ................................................................................................................ 89
Tables Table 1 WNT target genes (modifed after Roel Nusse) .............................................................................. 16
Table 2 LEF1 interaction partners ............................................................................................................... 18
Table 3 Chemicals ....................................................................................................................................... 35
Table 4 NO-ASA derivatives........................................................................................................................ 35
Table 5 Buffers & Solutions ......................................................................................................................... 36
Table 6 Cell culture media ........................................................................................................................... 37
Table 7 Recombinant proteins .................................................................................................................... 38
Table 8 Unconjugated antibodies ................................................................................................................ 39
Table 9 Conjugated antibodies .................................................................................................................... 39
Table 10 Nucleic acid isolation .................................................................................................................... 40
Table 11 Cell isolation ................................................................................................................................. 40
Table 12 Miscellaneous ............................................................................................................................... 40
Table 13 Competent bacteria ...................................................................................................................... 41
Table 14 Plasmids ....................................................................................................................................... 41
Table 15 Enzymes ....................................................................................................................................... 41
Table 16 Instruments ................................................................................................................................... 42
Table 17 Cell lines ....................................................................................................................................... 43
Table 18 Software ....................................................................................................................................... 43
Table 19 Stimulants for B cells .................................................................................................................... 48
Table 20 Genotyping Mastermix ................................................................................................................. 52
Table 21 Primer Genotyping........................................................................................................................ 52
Table 22 Protocol Thermocycling ................................................................................................................ 53
Table 23 Population statistics and disease related deaths ......................................................................... 64
1
1 Short summary The WNT signaling pathway regulates many different cellular processes, among them
lymphopoiesis. Especially its influence on B cell maturation is not well understood, but it
is clear that abnormal pathway activity is one of the hallmarks of B cell neoplasia like
chronic lymphocytic leukemia (CLL). As one of the downstream effectors of the WNT
signaling cascade, LEF1 (Lymphoid enhancer-binding factor 1) was suggested to play a
pivotal role in B maturation as well as in the development and in sustaining of neoplasia
like CLL. The goal of this project was to develop an easily adaptable LEF1 dependent
mouse model to elucidate the effects of LEF1 overexpression in B cells and other tissues.
Furthermore, it was designed to test whether the LEF1 overexpression, which is common
in several cancers, has oncogenic potential. The secondary goal of this project is to test
if newly developed NO-ASA derivates, a known class of WNT inhibitors, might provide a
feasible strategy for experimental treatment of chronic lymphocytic leukemia. The
substances were tested for their efficacy, selectivity and bioavailability.
The newly developed R26lef1 mouse model is highly adaptable, by using the Cre-loxP-
system, and allows specific transgene expression in different tissues, cell types or
developmental stages. The expression is stable and allows long-term experiments. The
induction of expression by CD19 controlled Cre expression resulted in transgene
expression in 76% of all B cells. The overexpression of LEF1 in the murine B cells leads
to increased WNT signaling, which results in 3-6% less B cells in the lymphocytes of the
peripheral blood, bone marrow and spleen when compared to control mice. Neither
phenotypical differences of the lymphocytes nor a leukemia induction were detected in an
average monitoring period of over 12 month. The overall survival was also not significantly
altered, but LEF1 expressing mice developed more often cancers, which possibly reflects
a reduced immune surveillance. The induction of LEF1 expression by a Cr2-cre construct
revealed no significant differences to control mice. A CMV dependent Cre expression led
to an abnormal skull formation resulting in a shortened snout. This phenotype is highly
similar to Axin2 knock-out mice, which represent a strain with abnormally active WNT
signaling. In a nutshell, the experiments show that the R26lef1 mouse model is functional
and allows stable transgene expression in different tissues in long term experiments. The

2
LEF1 overexpression in B cells seems not to hamper maturation, but rather affects
proliferation. Overall LEF1 overexpression failed to induce neoplasia.
In several studies, including this one, NO-ASAs, which were reported to inhibit WNT
signaling, proved to be an effective and selective substances to drive chronic lymphocytic
leukemia cells into apoptosis. mRNA analysis of CLL cells treated with the para isomere
of NO-ASA, revealed an increased expression of heat-shock proteins and other stress
related genes, which hint to an regulation by the NFκB signaling pathway. No association
with WNT signaling pathway was found in this study. In order to further increase efficacy
and selectivity, several derivatives of para-NO-ASA were developed. Experiments with
the new NO-ASA derivatives, conducted in parallel to this study, showed an increase in
selectivity and efficacy especially for two candidate substances (B9 & B12). These
substances were used in in vivo experiments. B9 significantly inhibited the growth of JVM3
tumors, with a maximum inhibition ratio of 65% in a xenograft mouse model and was well
tolerated (8 mg/kg, every 2nd day, intraperitoneal). B12 failed to inhibit tumor growth
compared to the control group. Overall, B9 is superior to its parent compound and shows
promise for a future use as a drug in the treatment of chronic lymphocytic leukemia.
3
2 Introduction
2.1 The WNT signaling pathway In the year 1982 Roel Nusse and Harold Varnus discovered the first WNT gene, at that
time called int1, which proved to be the starting point for the discovery of a whole signaling
network as we know it today (Nusse and Varmus, 1982). First striking evidence for
functional activity of this gene came from mice which overexpressed int1 in their mammary
glands and developed corresponding tumors (Tsukamoto et al., 1988). These
experiments proved the oncogenic potential of the gene. More insight into the function of
this pathway came from experiments with Drosophila melanogaster, which soon became
one of the most important models for WNT research. In this model organism int1 was
identified as a segment polarity gene during embryo development (Rijsewijk et al., 1987).
A mutant of this gene resulted in flies without wings and was hence named wingless. In
1990 Thomas and Capecchi generated the first int1 deficient mice (Thomas and
Capecchi, 1990). Their work showed that these null mice died prenatal with severe
disturbances in the development of the midbrain and cerebellum. Around the 1990s the
known int genes were renamed to WNT (Wingless-related integration site), with int1 now
designated as wnt1. In human 19 WNT genes are known, which can be subdivided into
12 families of highly similar members. The gap between the WNTs, which are extracellular
signaling molecules, to intracellular signaling cascade was closed in the early 90s. In 1993
it was shown that a truncated form of APC (adenomatous polyposis coli) induces tumors
in the gut and interacts with a protein called β-catenin (Rubinfeld et al., 1993; Su et al.,
1993). The β-catenin proved to be a homologue of a Drosophila gene named armadillo.
This gene also belongs to the group of segment polarity genes, which led the way back
to wnt1. The circle was closed by identifying GSK3 (Glycogen Synthase Kinase 3) as an
interaction partner of Armadillo, which was negatively regulated by WNT/Wingless
(Siegfried et al., 1992). These findings subsequently led to the theory of a destruction
complex that regulates β-catenin levels via phosphorylation in a WNT dependent manner.
Together with the observation that β-catenin can enter the nucleus and its levels are
commonly increased by WNT stimulation, it became clear that the protein is the central
messenger of the signaling pathway (Funayama et al., 1995; Riggleman et al., 1990). In
1996 another important step was made, as β-catenin was shown to interact with
transcription factors from the TCF/LEF1 family (Behrens et al., 1996; Huber et al., 1996;
4
Molenaar et al., 1996). This finalized the signal transduction from the extracellular WNT
to the regulation of gene expression. Today our picture from the WNT signaling pathway
is much more complex and numerous modulators and functions have been identified.
The great complexity of the pathway alone speaks of an early development in the history
of life. The current view determines appearance of WNT genes to about 650 Million years
ago. Wnt genes have been identified in cnidarians, chordates, echinoderms, mollusks,
annelids, nematodes and arthropods. No wnt genes were found in unicellular eukaryotes,
cellular slime molds or choanoflagellates (Guder et al., 2006).
Despite the early origin the wnt genes, several other important pathway members, like the
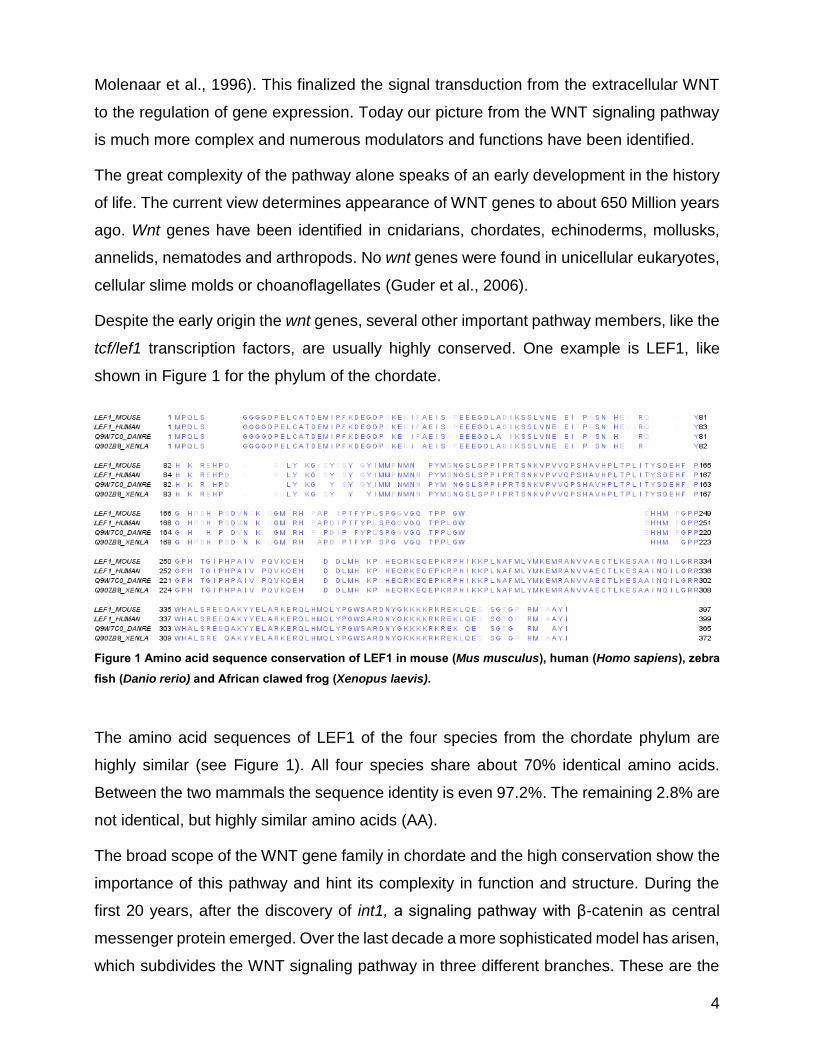
tcf/lef1 transcription factors, are usually highly conserved. One example is LEF1, like
shown in Figure 1 for the phylum of the chordate.
Figure 1 Amino acid sequence conservation of LEF1 in mouse (Mus musculus), human (Homo sapiens), zebra fish (Danio rerio) and African clawed frog (Xenopus laevis).
The amino acid sequences of LEF1 of the four species from the chordate phylum are
highly similar (see Figure 1). All four species share about 70% identical amino acids.
Between the two mammals the sequence identity is even 97.2%. The remaining 2.8% are
not identical, but highly similar amino acids (AA).
The broad scope of the WNT gene family in chordate and the high conservation show the
importance of this pathway and hint its complexity in function and structure. During the
first 20 years, after the discovery of int1, a signaling pathway with β-catenin as central
messenger protein emerged. Over the last decade a more sophisticated model has arisen,
which subdivides the WNT signaling pathway in three different branches. These are the
5
WNT/PCP and the WNT/Ca2+ (Calcium) signaling pathways, which are also referred to as
non-canonical pathways, and the canonical or WNT/β-catenin pathway. Each branch of
this WNT signaling network has different functions and key players, which often integrate
information in direct interaction, but usually share up-stream components like receptors
and extracellular regulators.
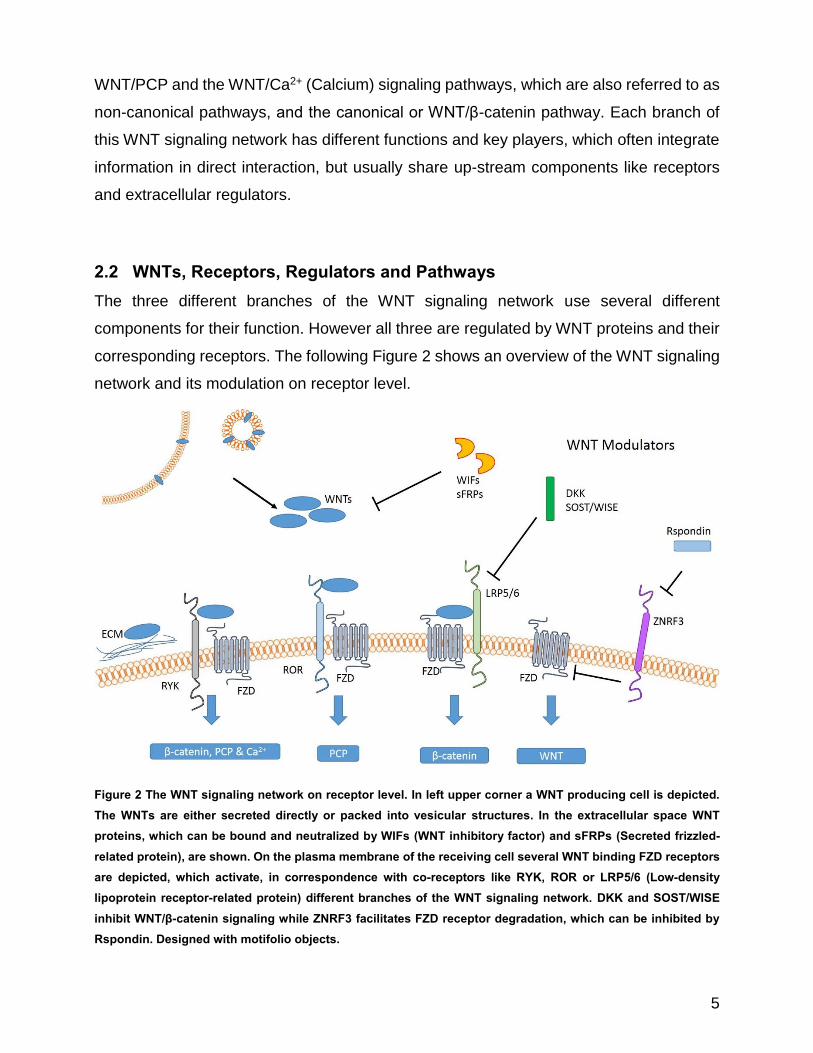
2.2 WNTs, Receptors, Regulators and Pathways The three different branches of the WNT signaling network use several different
components for their function. However all three are regulated by WNT proteins and their
corresponding receptors. The following Figure 2 shows an overview of the WNT signaling
network and its modulation on receptor level.
Figure 2 The WNT signaling network on receptor level. In left upper corner a WNT producing cell is depicted. The WNTs are either secreted directly or packed into vesicular structures. In the extracellular space WNT proteins, which can be bound and neutralized by WIFs (WNT inhibitory factor) and sFRPs (Secreted frizzled-related protein), are shown. On the plasma membrane of the receiving cell several WNT binding FZD receptors are depicted, which activate, in correspondence with co-receptors like RYK, ROR or LRP5/6 (Low-density lipoprotein receptor-related protein) different branches of the WNT signaling network. DKK and SOST/WISE inhibit WNT/β-catenin signaling while ZNRF3 facilitates FZD receptor degradation, which can be inhibited by Rspondin. Designed with motifolio objects.

6
2.2.1 WNT proteins The proteins after which the whole network is designated, are small secreted signaling
proteins of about 40 kDa (Kilo Dalton) (Cheyette and Moon, 2003; Guder et al., 2006).
WNTs in general carry a signal peptide sequence that marks them for secretion, as well
as glycosylation and lipidation sites. These sites are of high importance for the activity and
therefore highly conserved (Cheyette and Moon, 2003). For example human WNT1
carries as much as four N-glycosilation sites and two sites for lipid modification (Cysteine
93 and Serine 224). The glycosylation appears not to be mandatory for, but promotes
activity and secretion (Tang et al., 2012). Additionally, the lipidation of WNT proteins
influences the activity, the secretion and their ability to interact with the extracellular matrix
(ECM) (Doubravska et al., 2011). While acetylation and subsequent palmitoylated of the
serine influences WNT3a activity, the lipidation on the cysteine residue proved to be
important for its intracellular transport (Takada et al., 2006).
Intracellular transport and secretion
WNT proteins are translated at the rough endoplasmatic reticulum (ER) and transported
via the Golgi apparatus to the plasma membrane (PM). A central element of intracellular
WNT transport appears to be the lipidation. This post-translational modification is primed
by Porcn, an acetyl transferase localized in the ER. The importance of this step is
underlined by in vivo experiments performed by Biechele et al., where porcn mutants led
to developmental defects in mice. These effects appeared to be similar to a defective WNT
signaling (Biechele et al., 2011).
How WNT proteins travel through the tissue after their release is not well understood.
Multiple vectors like lipoprotein particles and exosomes have been described (Gross et
al., 2012; Neumann et al., 2009; Panáková et al., 2005). Also interactions with the ECM
influence WNT transport and activity (Lin and Perrimon, 2000). Despite earlier
assumptions WNT signaling can also occur over long distances, as shown 2008 by
Katanaev et al. (Katanaev et al., 2008).

7
2.2.2 WNT receptors As we know today WNT proteins are recognized by a variety of different receptors. The
largest group is the Frizzled (FZD) receptor family. All members of this family share a
large conserved cysteine-rich domain (CRD), which binds WNT proteins with a high
affinity (Janda et al., 2012). The Frizzled receptors are central proteins for all three
branches of the WNT signaling network. Together with the co-receptor LRP5/6 (Low-
density lipoprotein receptor-related protein 5/6) Frizzled receptors regulate the β-catenin
dependent signaling, whereas they influence WNT/Ca2+ and WNT/PCP signaling by
associating with tyrosine kinases like ROR or RYK (Macheda et al., 2012; Sato et al.,
2010; Yoshikawa et al., 2003). It has to be noted that WNT signaling via ROR and RYK
seems not to require Frizzled receptors. The interaction of all these receptors and co-
receptors determines the outcome of the WNT signaling event and they’re therefore tightly
controlled. One example is ZNFR3 expression, which controls the amount of available
Frizzled receptors by its E3 ubiquitin ligase activity (see Figure 2) (Hao et al., 2012).
2.2.3 Disheveled Downstream of the Frizzled receptors act the Disheveled proteins, which play an
important role in signal transduction from Frizzled receptors. These proteins regulate the
canonical as well as non-canonical signaling cascades and have great influence on signal
integration. The Disheveled proteins share three highly conserved domains in their
structure, an amino terminal PIX domain, a central PDZ and a carboxy terminal DEP
domain (Wharton, 2003). At the level of Disheveled Frizzled dependent WNT signaling
splits into its branches, the non-canonical (WNT/Ca2+ and WNT/PCP) and the canonical
WNT-signaling (WNT/β-catenin). Signaling through WNT/β-catenin signaling cascade
dependents on the PIX and PDZ domains of Disheveled, while non-canonical WNT
signaling utilizes the PDZ and the DEP domains (Habas and Dawid, 2005). As a general
mechanism Disheveled is recruited to the Frizzled receptor upon WNT binding, where it
interacts with the downstream effectors like Axin, Rho or Rac. The outcome of frizzled
dependent WNT signaling appears to be rather triggered than by receptor context than
regulation of Disheveled, as it is crucial for all WNT signaling branches (Habas and Dawid,
2005).

8
2.2.4 Extracellular WNT modulation The WNT signaling network is tightly controlled on all levels to ensure homeostasis of this
important signaling pathway. In the extracellular space a great variety of WNT modulators
is present to achieve this goal. Few agonistic extracellular WNT modulators are known,
one example is R-spondin. R-spondin decreases the ubiquitin ligase activity of ZNRF3,
which leads to a stabilization of Frizzled and subsequent to increased β-catenin
dependent WNT signaling (see Figure 2) (Hao et al., 2012).
Of the antagonistic extracellular WNT modulators the most prominent protein families are
the WIF, the sFRP, the DKK and the cysteine knot family proteins SOST and WISE (see
Figure 2). The WIF and sFRP family members can bind WNT proteins directly and thereby
neutralize their activity (Hsieh et al., 1999; Jaspard et al., 2000). The binding affinity of the
individual inhibitory protein to different WNT protein differs, which allows fine tuning of
WNT activity in different tissues. DKK proteins interact with the LRP6 co-receptor and
together with the DKK receptors of the Kremen family lead to its internalization (Mao et
al., 2002; Mishra et al., 2012).
2.3 Non-canonical WNT signaling Non-canonical WNT signaling summarizes signal transduction independent of β-catenin.
The first evidence for the existence of an alternative outcome for WNT signaling came
from experiments with Xenopus leavis. Injection of WNT5a into Xenopus embryos lead to
developmental defects in head and tail, which resulted from perturbed cellular movements
(Moon et al., 1993). Later experiments identified WNT5a as a major regulator of the two
distinct branches of non-canonical WNT signaling, the WNT/Ca2+ and the WNT/PCP
pathway (see Figure 3).
The WNT/PCP pathway is named after its crucial role in forming planar cellular polarity
(PCP) during embryogenesis. Cell polarity is important for many cell types, for epithelial
cells with their apical-basal orientation or for directed movement of cells along a gradient
of a morphogen. Probably due to the regulation of the cell polarity, the signaling cascade
regulates many biological processes linked to this topic, like mitotic spindle orientation,
convergent extension, neural tube closure or hair orientation (Bellaïche et al., 2001; Guo
et al., 2004; Myers et al., 2002).

9
Figure 3 The non-canonical WNT signaling. WNT proteins bind to the FZD receptor which activates via DVL either the WNT/PCP pathway via RAC/MAPK or RHO/ROCK signaling. The small GTPases can also be bypassed by ROR dependent signaling, which independently activates JNK. The second alternative, the WNT/Ca2+ pathway, the activation signal is transduced from DVL via heterotrimeric G-proteins to PLC, which transforms PIP2 to IP3 and increases the intracellular calcium by release from the ER controlled by the IP3R. Intracellular Ca2+ in term activates PKC or CamKII. The third alternative is Src kinase activation facilitated by RYK signaling.
The activation of the WNT/PCP pathway (see Figure 3) is usually associated to WNT5A,
WNT5B and WNT11, this however cannot be generalized and is also depend on receptor
regulation (Dabdoub et al., 2003; Heisenberg et al., 2000; Kilian et al., 2003). The WNT
proteins can bind either to the Frizzled receptor or to alternative WNT receptors like ROR2
(see Figure 3). If WNT bind to the Frizzled receptor Disheveled is recruited and relays the
signal via small GTPases (Boutros et al., 1998; Yamanaka et al., 2002). These small
GTPases regulate JNK dependent gene expression via ROCK or the MAPK cascade.
The WNT/Ca2+ signaling is the second major outcome of non-canonical WNT signaling
that we know today (see Figure 3). In this branch of WNT cascade the signal is transduced
from the Frizzled receptor via heterotrimeric G proteins. These G proteins regulate several
targets, among them Phospholipase C (PLC), which leads to an increased transformation
of phosphatidylinositol 4,5-bisphosphate (PIP2) to inositol-1,4,5-triphosphate (IP3). IP3 in
term induces the release of calcium from the endoplasmatic reticulum (ER). This increase

10
of cytosolic Ca2+ can activate CaMKII (Kühl et al., 2000). This Ca2+ dependent kinase
regulates the Nemo-like kinase (NLK), which can induce β-catenin phosphorylation and
subsequently inhibits WNT/β-catenin signaling (Ishitani et al., 2003; Saneyoshi et al.,
2002).
2.4 β-catenin dependent WNT signaling The WNT/β-catenin is the historically first described branch of the WNT signaling network
and it is named after its central messenger protein β-catenin. When the pathway is inactive
a so called destruction complex consisting of Axin, APC and GSK3β assembles and
phosphorylates β-catenin. The phosphorylation marks β-catenin for ubiquitin ligation by
β-TrCP, which leads to its degradation in proteasomes (see Figure 4). In this off-state no
β-catenin is found in the nucleus and WNT dependent gene expression is repressed.
When WNT proteins bind to their corresponding Frizzled, the LRP5/6 co-receptors are
recruited and the cascade is switched on. The ligand binding iduces the phosphorylation
of the intracellular domain of LRP. This phosphorylation is performed by GSK3β or CK1
activity. The phosphorylated LRP recruits Axin in a Disheveled dependent manner, which
thereby is no longer available for the formation of the destruction complex. This allows β-
catenin to escape phosphorylation and subsequent degradation. The protein accumulates
in the cytoplasm. The β-catenin stabilization initiates its transport into the nucleus, where
it interacts with the transcription factors of the LEF1/TCF family. β-catenin forms a
complex with the transcription factors and CBP (CREP-binding protein) which induces
WNT/β-catenin dependent gene expression (see Figure 4).

11
Figure 4 WNT/β-catenin pathway. In the OFF state (left), the WNT proteins are not bound to the receptor. The destruction complex consisting of Axin, GSK3, CK1, APC and β-catenin can form in the absence of active WNT signaling. β-catenin is phosphorylated, ubiquitinated and subsequently degraded in the proteasome. In the nucleus TCF/LEF1 transcription factors bind DNA Deoxyribonucleic acid) and recruit TLE and HDAC to repress gene expression. In the ON state (right) WNT proteins bind to the FZD receptor and LRP5/6 is recruited and phosphorylated by GSK3 and CK1. Axin is recruited to the receptor complex and is no longer available to stabilize the destruction complex. The central messenger β-catenin is no longer degraded and accumulates in the cytoplasm. It translocates to the cytoplasm, where it transactivates TCF/LEF1 transcription factors. The complex recruits CBP and enhances expression of WNT target genes. Designed with motifolio objects.
Like other pathways, the WNT/β-catenin pathway is tightly regulated on all levels. The
following chapters will give insight into some of these mechanisms on the level of the
receptor complex, the destruction complex and in the nucleus.

12
The receptor complex
The receptor complex for WNT/β-catenin signaling consists of a Frizzled receptor,
Disheveled and a LRP5/6 co-receptor. The co-receptor LRP5/6 is an essential part, as it
is required to recruit Axin to the complex (Tamai et al., 2000). The docking site of Axin on
LRP5/6 is located on the cytoplasmatic tail, which consist of five PPPS/TP motifs.
Phosphorylation of this motifs allows Axin binding to LRP5/6 (Tamai et al., 2004). In the
phosphorylation of the PPPS/TP motifs GSK3β appears to play an important role, as it
can mediate serine/threonine phosphorylation in all five motifs (Zeng et al., 2005). Other
kinases, like CK1γ, can induce LRP5/6 phosphorylation, too (Davidson et al., 2005).
Despite the growing knowledge of the function and regulation of LRP phosphorylation the
whole process is not well understood.
The β-catenin destruction complex
For the activity of the destruction complex the regulation of Axin localization and stability
is of outmost importance. In the destruction complex Axin acts as scaffold protein and is
indispensable for its function. Compared to other components the expression of Axin is
extremely low and it was identified as cellular rate limiting component for canonical WNT
signaling (Lee et al., 2003). A well-established regulation mechanism is the stabilization
of Axin by GSK3β mediated phosphorylation, which overall inhibits WNT signaling
(Yamamoto et al., 1999). Vice versa, Willert and colleagues demonstrated that WNT
induced dephosphorylation of Axin released β-catenin from the destruction complex
(Willert et al., 1999). Another Axin dependent regulation mechanism was discovered by
screening for WNT inhibitors. Substances like JW55 and XAV939 stabilize Axin1 or Axin2
and therefore act as a negative regulator for canonical WNT signaling. XAV939 and JW55
inhibit the tankyrase enzymes, which enhances the PARsylation of the scaffold protein
and thereby inhibit its proteosomal degradation (Franch-Marro et al., 2008; Waaler et al.,
2012). This is often associated with the expression of Axin2, which is part of a
physiological negative feedback loop and can replace Axin1 in its function (see Figure 5).
The activation of the WNT signaling pathway induces Axin2 expression, which in term can
serve as scaffold protein in the destruction complex, replacing Axin1. Due to its WNT

13
dependent expression pattern Axin2 commonly is used to detect WNT activity in vitro and
in vivo (Jho et al., 2002; Lustig et al., 2002).
Figure 5 Axin2 negative feedback loop. The central messenger protein β-catenin transactivates the transcription factors TCF/LEF1 and the CBP is recruited to the complex. Target gene expression is enhanced, which includes Axin2. Axin2 is translated in the cytoplasm and stabilizes the destruction complex of Axin2, GSK3, CK1 and APC. Formation of the destruction complex leads to a rapid decrease in cytosolic β-catenin. Designed with motifolio objects.
GSK3 is the second important member of the multiprotein destruction complex, as it is
responsible for β-catenin phosphorylation (Peifer et al., 1994). As mentioned before, Axin
can be protected from degradation by GSK3 dependent phosphorylation, thus stabilizing
the whole destruction complex (Yamamoto et al., 1999). Together with APC the kinases
CK1 and GSK3 are bound to Axin and form the destruction complex. β-catenin binds
predominantly to APC and Axin and is primed by phosphorylation of Ser-45 by CK1α.
Subsequently GSK3 adds phosphorylation of Thr-41, Ser-37 and Ser-33, which marks the
messenger protein for the ligation with Ubiquitin by β-TrCP and thereby for degradation
(Kimelman and Xu, 2006; Wu and Pan, 2010). In order to induce β-catenin dependent
WNT signaling the inhibition of GSK3 is an often used strategy. Several inhibitors like LiCl
14
(Lithium chloride) or SB216763 were shown to activate canonical WNT signaling by
inhibition of β-catenin phosphorylation through GSK3 (Klein and Melton, 1996; Meijer et
al., 2004). A great disadvantage of GSK3 inhibition to induce WNT signaling is the
widespread function of GSK3 kinases, as they also are central parts of NFAT, mTOR or
insulin signaling (Beals et al., 1997; Ding et al., 2000; Inoki et al., 2006).
Additional to the above mentioned major players, several other proteins are important for
the function of the destruction complex. For example, Sox9 can affect the subcellular
localization of several members of the destruction complex. Sox9 is able to induce
relocalization of β-TrCP, Axin, CK1α and GSK3 to the nucleus which leads to an enhanced
phosphorylation of β-catenin and thereby inhibits its transcriptional activity (Topol et al.,
2009). Together with proteasomes present in the nucleus, the nuclear destruction
complex is able to degrade β-catenin, too (Reits et al., 1997; Topol et al., 2009).
The central messenger protein β-catenin
Before β-catenin was identified to be the central messenger protein for the canonical WNT
signaling, it was known as an integral part of adherens junctions. The general structure of
the protein consists of three domains, an N terminal domain, a large central armadillo
repeat domain and a C terminal transactivation domain. While the N terminal domain
carries the phosphorylation sites for GSK3 and other kinases, the armadillo repeat domain
acts as a binding site for multiple interaction partners like α-catenin. The C terminal
domain is important for the transcriptional activity of β-catenin, as it transactivates for
example the transcription factors from the TCF/LEF1 family (Daniels et al., 2001). Up
today 27 binary interactions of β-catenin have been described, which reflects its central
role and high regulation.
In most cell types β-catenin is present in two distinct pools, the cytosolic and in the
cytoskeleton, for example in cell-cell junctions bound to cadherins. The cytosolic pool is
subjected to a constant turnover, as newly translated β-catenin is rapidly degraded by the
destruction machinery in absence of WNT signaling. Upon WNT ligand binding the
cytosolic amount of the messenger proteins increases. To subsequently exercise its
transcriptional activity, the messenger protein has to shuttle from the cytosol into the
nucleus.
15
β-catenin itself carries no nuclear localization signal and the mechanisms underlying its
transport into the nucleus are still somewhat elusive. Early experiments showed that the
overexpression of LEF1 somehow led to an nuclear localization (Huber et al., 1996). It
was suggested that the transcriptionfactor, which carries a NLS, plays a role in the nuclear
import mechanism of β-catenin, possibly by transporting the messenger protein piggyback
into the nucleus (Kim and Hay, 2001). Also APC and Axin have been suggested to
participate in the import/export of β-catenin from the nucleus. Both proteins can directly
interact with the messenger protein and carry a NLS as well as a nuclear export signal
(NES). They were shown to regulate the import and the export of nuclear β-catenin (Cong
and Varmus, 2004; Henderson, 2000).
The TCF/LEF1 family of transcription factors
In the nucleus β-catenin can interact with the transcription factors from TCF/LEF1 family
to regulate WNT dependent gene expression. While non-vertebrates like Drosophila
melanogaster or Caenorrhabditis elegans have only one transcriptionfactor ortholog,
chordates carry at least four. In homo sapiens these are TCF7 (Transcription factor 7,
formerly known as TCF1), TCF7L1 (Transcription factor 7-like, formerly known as TCF3),
TCF7L2 (formerly known as TCF4) and LEF1. The four transcription factors share a 53-
72 amino acids long N-terminal β-catenin binding domain, a central cysteine rich domain
(CRD), a high mobility group domain (HMG) and a NLS. There is however one exception,
TCF7L2-N a shorter isoform of TCFL2 lacks the HMG and the NLS. The TCF/LEF1
transcription factors bind to the nuclear DNA (Deoxyribonucleic acid) via their highly
conserved HMG domain. The binding sequence, the so-called WNT response element
(WRE) (CCTTTGWWW), is conserved within the protein family. Several experiments
concluded that specific mutations in the HMG domain dramatically decreased the DNA
binding capacities of TCF/LEF1 transcription factors (Giese et al., 1991).
DNA bound TCF/LEF transcription factors can have an activating or repressing function
on their target genes. In the absence of β-catenin the co-repressor TLE can bind to the
CRD domains and recruit HDACs which silence the gene expression (see Figure 4)
(Brantjes et al., 2001; Cavallo et al., 1998; Chen et al., 1999). In the presence of β-catenin
TLE is displaced from the transcription factor and co-activators like the histone
16
acetyltransferase CBP are recruited to induce target gene expression (Hecht et al., 2000).
Until today a great variety of regulators of the TCF/LEF transcription complex have been
identified. The NLK, for example, phosphorylates TCFs and hampers their ability to bind
β-catenin (Ishitani et al., 1999, 2003).
The diversity of function between all members of the TCF/LEF1 protein family is large,
despite the fact that they’re highly conserved and share a common DNA binding
sequence. Experiments with Xenopous leavis, for example, have shown that LEF1 and
TCFL1 have tissue specific functions downstream of the canonical WNT signaling (Roël
et al., 2002). This individual functions are attributed to structural differences, different
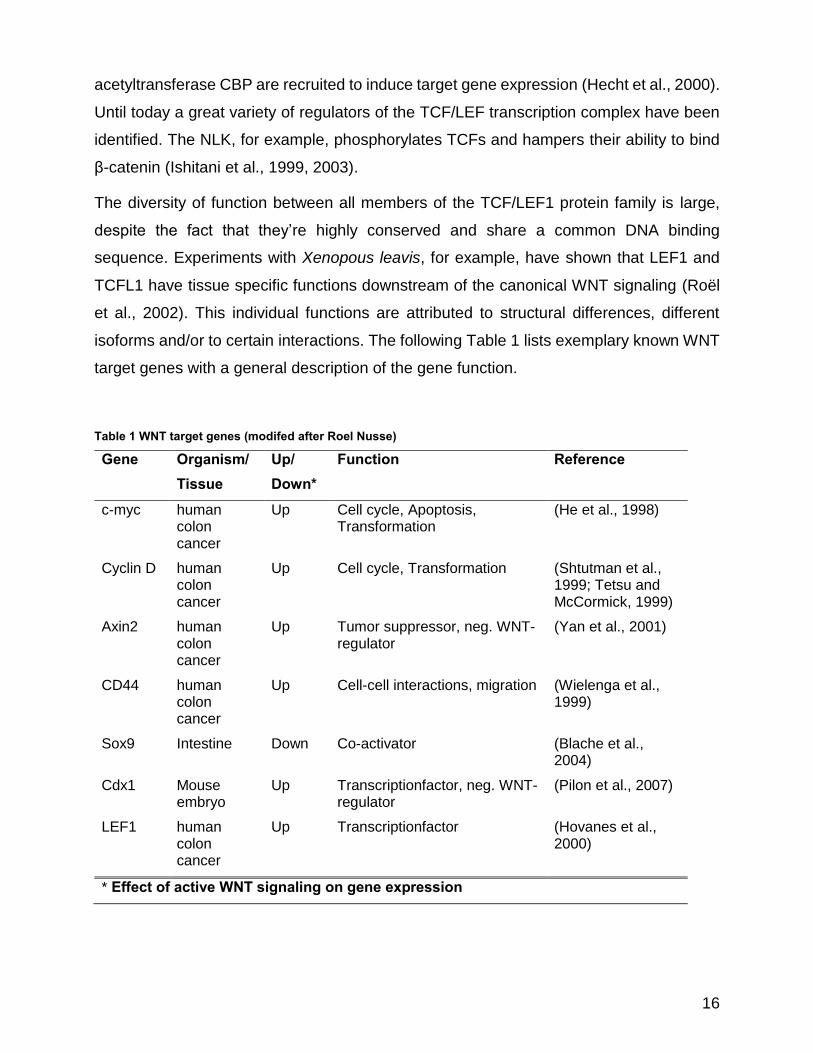
isoforms and/or to certain interactions. The following Table 1 lists exemplary known WNT
target genes with a general description of the gene function.
Table 1 WNT target genes (modifed after Roel Nusse)
Gene Organism/ Tissue
Up/ Down*
Function Reference
c-myc human colon cancer
Up Cell cycle, Apoptosis, Transformation
(He et al., 1998)
Cyclin D human colon cancer
Up Cell cycle, Transformation (Shtutman et al., 1999; Tetsu and McCormick, 1999)
Axin2 human colon cancer
Up Tumor suppressor, neg. WNT-regulator
(Yan et al., 2001)
CD44 human colon cancer
Up Cell-cell interactions, migration (Wielenga et al., 1999)
Sox9 Intestine Down Co-activator (Blache et al., 2004)
Cdx1 Mouse embryo
Up Transcriptionfactor, neg. WNT-regulator
(Pilon et al., 2007)
LEF1
human colon cancer
Up Transcriptionfactor (Hovanes et al., 2000)
* Effect of active WNT signaling on gene expression

17
2.4.1 The transcription factor LEF1 Of the four human TCF/LEF family members LEF1 is of special interest for this work. The
gene lef1 was discovered in 1991 in murine lymphocytes and was identified to propagate
expression in the TCRα enhancer (Travis et al., 1991). In humans four relevant different
isoforms have been described and three in mice. Figure 6 depicts a general LEF1
structure.
Figure 6 LEF1 general structure. The canonical LEF1 sequence (top) includes a β-catenin binding domain, a CRD domain, an HMG domain and a NLS sequence. Several different isoforms are known (indicated by boxes), the LEF1ΔN isoform misses the β-catenin binding domain. C-terminal B and N sequences exist in certain isoforms.
Apart from the LEF1 canonical sequence, which codes for a 44 kDa protein, also a shorter
isoform without β-catenin binding domain has been described (Hovanes et al., 2000). This
isoform is also called LEF1ΔN or LEF1DN (DN=dominant negative) and lacks the β-
catenin binding domain (see Figure 6). It is thought to inhibit LEF1 dependent expression
in most cases (Li et al., 2006). The β-catenin/LEF1 interaction was first shown in 2004, by
precipitation of murine β-catenin with a human LEF1 bait (Hamada and Bienz, 2004).
Apart from the interaction with β-catenin several other regulators are known to interact
with the transcription factor. The following table lists some of these and their effect on
LEF1 dependent gene expression (see Table 2).
Together with its interaction partners LEF1 regulates a plethora of genes and this
regulation largely depends on the context of the transcription factor. Only few LEF1
specific genes like CDX1 were identified (Hecht and Stemmler, 2003). Nevertheless, the
transcriptionfactor plays a pivotal role in many biological processes like cell differentiation.
One example comes from osteoblasts. When LEF1 is artificially over-expressed in pre-
osteoblasts, these cells do not undergo differentiation (Kahler et al., 2006).

18
Table 2 LEF1 interaction partners
Protein Specificity Domain Function Reference
β-catenin TCF/LEF1 β-catenin Activator (Behrens et al., 1996)
γ-catenin TCF/LEF1 β-catenin Activator (Maeda et al., 2004)
TLE1 TCF/LEF1 CRD Inhibtior (Levanon et al., 1998)
PIXT2 TCF/LEF1 Outside β-catenin domain
Activator (Vadlamudi et al., 2005)
RUNX2 LEF1 unknown Repressed by LEF1
(Kahler and Westendorf, 2003)
NOTCH1 LEF1 HMG Activator (Ross and Kadesch, 2001)
SMADs TCF/LEF1 HMG Inhibitor/Activator (Cui et al., 2005; Labbé et al., 2000)
LEF1 mouse models
To study the function of LEF1 in mammals several mouse models have been devised.
First insight into the importance of LEF1 for mammalian development came from knock-
out (KO) experiments in 1994. Van Genderen and colleagues showed that a homozygous
KO of LEF1 caused postnatal death in mice (van Genderen et al., 1994). The mice were
deficient of teeth, body hair and mammary glands. Additionally the mice showed
abnormalities in neurons derived in the neuronal crest. These were devoid of the
mesencephalic nucleus. From this experiments it was clear that LEF1 is important for hair
development and in 1995 Zhou and colleagues used knock-in methods to introduce the
human LEF1 gene downstream of the K14 (keratinocyte 14) promoter. The promoter is
active in basal epidermis and the outer root sheath of hair follicles. K14 driven LEF1
expression disrupted the normally uniform orientation of hair and whiskers (Zhou et al.,
1995). The mice also developed abnormal tooth and hair growth in their mouth and gums.
In 2002 Kratochwil and colleagues showed, again using a loss-of function model, that
FGF4, which is a direct target of LEF1 dependent gene expression, is able to rescue the
arrest of tooth organogenesis known from homozygous LEF1 null mice (Kratochwil et al.,
2002). However the LEF1 null mice did not show comparable phenotypes to WNT null
mice. In 1999 Galceran and colleagues showed that this might be due to functional
19
redundancy between LEF1 and TCF7 as only a double null mutant could copy the
phenotype of WNT3a null mice (Galceran et al., 1999). Additional insight into LEF1
function in mammalian development came from experiments with mice expressing a
LEF1-β-galactosidase fusion protein. The β-galactosidase herby disrupts the ability of the
protein to bind to DNA, but its β-catenin binding domain remains functional. Mice with
homozygous LEF1-β-gal transgene showed several developmental abnormalities, like
strong deformation of the rib cage bone structure, as well as defects in the hippocampus
that are also described for the LEF null mutants (Galceran et al., 2004). The knock-out
experiments also showed an influence of LEF1 on lymphopoiesis. During B cell
development LEF1 is only expressed in an early stadium in the bone marrow (BM), the
absence of LEF1 in this stadium decreased the sensitivity of the cells towards WNT
stimulation, which reduced their survival and proliferation (Reya et al., 2000).
LEF1 in disease
The transcription factor is suggested to play an important role in several diseases,
especially in several neoplasia. The first report of LEF1 contributing to mammalian cell
transformation came from experiments with different β-catenin mutants in colon cancer
cell lines like 293. These experiments showed that LEF1 contributes to the oncogenic
effect of constitutive activation of the WNT/β-catenin pathway (Porfiri et al., 1997). Later
studies revealed LEF1 to be overexpressed in many different tumors like brain cancer,
testicular cancer or breast cancer (Wang et al., 2005). Apart from the carcinomas also
hematologic diseases are often reported for deregulated expression of LEF1, for example
in ALL (Acute Lymphoblastic Leukemia), AML (Acute Myeloid Leukemia) and CLL
(Chronic Lymphocytic leukemia). For example in AML LEF1 expression appears to be a
tumor driver, as transduced hematopoietic stem cells (HSCs) expressing LEF1, induce a
AML or an ALL like neoplasia in mice (Petropoulos et al., 2008). Surprisingly, the survival
of mice transduced with a fusion protein of LEF1 and β-catenin, which can be described
as a constitutive active mutant, was 60 days longer when compared to animals
transplanted with HSCs expressing full length LEF1 (310d vs 377d). This indicates that
the aggressiveness is not completely dependent on WNT/β-catenin activity. Additionally
Petropoulos and co-workers were able to transplant leukemic cells to wild type mice,
which again led to a leukemic disease (Petropoulos et al., 2008). This showed that the

20
intrinsic alterations of the leukemic cells are self-sufficient. An example for a B cell
leukemia associated with LEF1 is the chronic lymphocytic leukemia (CLL). Microarray
studies revealed a strong up-regulation of lef1 in leukemic cells compared to healthy
counterparts (Klein et al., 2001). Additionally Lu and colleagues showed that CLL cell
survival can be enhanced by β-catenin stabilization (Lu et al., 2004b). Also in regard of
this knowledge, Felix Erdfelder and co-workers analyzed the expression of lef1 in 112 CLL
samples. They were able to show that lef1 expression is up-regulated by a factor of 80 in
CLL cells and that its expression correlates with the disease progression and poor
prognosis (Erdfelder et al., 2010). Later in 2010 lef1 knock-out experiments in CLL cells
confirmed the survival enhancing properties of the transcription factor (Gutierrez et al.,
2010a). In this work, it was reported that LEF1 is also overexpressed in monoclonal B cell
lymphocytosis, which is a preleukemic disease that can evolve into CLL. This indicates
that increased LEF1 expression might be an early event in CLL leukemonogenesis.
Recent meta-analysis of genome wide searches also revealed the LEF1 loci as an
additional risk associated loci for the disease (Berndt et al., 2013).
2.4.2 WNT pathway crosstalk Signaling pathway crosstalk is a frequent event since multiple pathways are often needed
to integrate information. The WNT/β-catenin pathway is the focus of this work and the
following chapter will describe the most important interactions with other pathways or WNT
signaling branches.
As already mentioned, several examples are known for inhibition of the WNT/β-catenin
signaling by non-canonical WNT signaling. For example binding of WNT5a to ROR2 can
inhibit β-catenin dependent WNT signaling (Mikels and Nusse, 2006). The concepts of
this inhibition are unknown, but seems to rely on receptor context. Better established is
the inhibition of WNT/β-catenin signaling by WNT/Ca2+. Upon stimulation with WNT5a the
signal is transduced via the MAPK pathway member TAK1. This activates the NLK which
subsequently inhibits the WNT/β-pathway by phosphorylation of its downstream
transcription factors (see Figure 7) (Ishitani et al., 2003).

21
Figure 7 Exemplary WNT/β-catenin pathway crosstalk. On the left side the WNT/Ca2+ is activated, which in term leads to MAPK signaling. Subsequently NLK becomes activated and inhibits the WNT downstream transcription factors. In the center NOTCH1 binds to a ligand and the NOTCH1 intracellular domain is truncated from the receptor. This NOTCH ICD enters the nucleus and transactivates the LEF1&TCF transcriptionfactors. WNT/β-catenin signaling leads to expression of GLI3, which can inhibit sonic hedgehog signaling. Designed with motifolio objects.
Another important pathway closely associated with the WNT/β-catenin signaling pathway
is the sonic hedgehog pathway (SHH) (see Figure 7). This pathway is, among other
functions, essential for mammalian organogenesis. In a model developed by Ulloa and
Marti WNT antagonizes the morphogenic effect of Shh by inducing Gli3 expression during
dorso-ventral patterning of the vertebrate neural tube (reviewed in Ulloa and Martí, 2010).
Direct interaction between WNT/β-catenin signaling is described for the Notch signaling
pathway. The intracellular domain of Notch1 was shown to directly interact with LEF1
(Ross and Kadesch, 2001). This interaction induced LEF1 dependent expression of target
genes. The interaction between the two pathways is especially important for stem cell
(SC) renewal and cancer. Experiments have shown that overexpression of Notch1 in
hematopoietic progenitor cells leads to a multipotent cell line, which can give rise to
lymphocytes as well as myelocytes (Varnum-Finney et al., 2000). The WNT signaling
22
pathway is also involved in hematopoietic stem cell renewal and necessary for maintaining
an undifferentiated state (Reya et al., 2003). Both signaling pathways are linked as in vivo
and in vitro experiments revealed in 2005. Duncan and colleagues generated mice with
WNT and Notch activity reporter and isolated HSCs from these mice. Analysis showed an
overlapping activity for most HSCs. Additionally, they were able to show that stimulation
by WNT3a also increased Notch dependent target gene expression in this model (Duncan
et al., 2005).
2.4.3 WNT Signaling in Stem cells As already indicated in the previous chapter, the WNT signaling pathway is a major player
in stem cells (SC). This chapter will combine the physiological function of WNT signaling
in SCs with their role in cancer, as these are often similar. Experiments with murine SCs
showed that WNT stimulation in combination with the cytokine LIF is able to maintain SC
pluripotency without additional co-factors, while inhibition of the pathway inhibited growth
(ten Berge et al., 2011). Interestingly β-catenin appears not to be required for evasion of
differentiation (Lyashenko et al., 2011). In human stem cells the WNT/β-catenin signaling
pathway appears to play a quite different role. The activation of the pathway rather leads
to differentiation, therefore inhibition by OCT4 is needed for stem cell renewal (Davidson
et al., 2012). Another group of pluripotent stem cells controlled by WNT signaling are the
hematopoietic stem cells. These cells give rise to all blood cells and the WNT/β-catenin
pathway controls their self-renewal and differentiation. The hematopoiesis with special
regard to the development of B cells is the topic of the following chapters.

23
2.5 Hematopoiesis Hematopoiesis describes the process of differentiation and expansion of blood cells like
erythrocytes or B cells. The development of all blood cells starts with the pluripotent
hematopoietic stem cells (HSCs) which reside in the bone marrow (BM). The cells have
the ability for self-renewal and to differentiate into many different specialized cell types. In
the hematopoietic system two different lineage choices are discerned, the myeloid and
the lymphoid. The myeloid lineage gives rise to cells like erythrocytes, thrombocytes, mast
cells, neutrophils and monocytes (see Figure 8).
Figure 8 Schematic overview of hematopoiesis. All blood cells originate from hematopoietic stem cells, these follow either the path of the myeloid or the lymphoid lineage. Each lineage gives rise to distinct cell types. NK
= Natural Killer, E = Eosinophilic, N = Neutrophilic, B = Basophilic (modified after Motifolio)
The lymphoid lineage leads to natural killer cells (NK), T cells and B cells. This work will
focus on the development of the B cells.
2.6 B cell development The B cell development starts with the HSC, which differentiates in a common lymphoid
progenitor (CLP). During this process the stem cells gradually lose their ability for self-

24
renewal and are more and more committed to their specific lineage (Link et al., 2010). The
common lymphoid progenitor still can differentiate into B, T and NK cells. Under the
influence of cytokines like SDF-1 and especially Interleukin-7 the CLPs can differentiate
into pro-B cells (see Figure 9). At this stage the B cells already carry the surface marker
CD19 (B-lymphocyte antigen 19), which is a marker for the B cell lineage. The pro-B cells
undergo V(D)J rearrangement, a process in which the variability of the immunoglobulin
(Ig) heavy chain is determined (Ramsden et al., 2010). Out of several (V)ariable, (D)iverse
and (J)oining segments a new gene is rearranged that determines the heavy chain of the
cell specific immunoglobulin. In the next stage of development, the now called pre-B cells
start to express the pre-B cell receptor (pre-BCR) on their plasma membrane (see Figure
9). In this phase the immunoglobulin light chain (LC) genes also undergo a rearrangement
of their variable (V) and joining (J) segments (Ramsden et al., 2010). This process adds
to the great diversity of B cell receptor (BCR) specificity. During rearrangement surrogate
light chains are expressed to form an immature B cell receptor. The BCR maturation is
continued and the surrogate LCs are replaced by κ or λ light chains. These immature B
cells now carry the surface marker CD19, B220R (protein tyrosine phosphatase, receptor
type restricted (220 kDa)), IgM, MHCII, the light chains and leave the bone marrow to
either become transitional B cells of the B1 or the B2 type. B1 B cells reside in the
peritoneum and can be subdivided into B1a (CD5+) (T-cell surface glycoprotein CD5) and
B1b (CD5-). B1a cells produce antibody products that participate in the innate immune
defense, while B1b cell function in a long-term response against bacterial
lipopolysaccharides (LPS). The majority of B cells belong to the B2 subpopulation, which
predominantly enter secondry lymphoid tissues like the spleen. Upon entering the
follicular zone of the spleen, the B cells undergo an Ig class switch as they now express
IgD class immunoglobulin on their surface (see Figure 9).

25
Figure 9 B cell development. The B cell development starts in the bone marrow with the common lymphoid progenitor (CLP). The cells mature into pre B cells and express CD19 and a pre B cell receptor (BCR). To the next stage the cell undergo V(D)J rearrangement, start to express a pro BCR. The naive b cells undergo VJ rearrangement and express IgM. The cells leave the bone marrow to become either B1 B cells or B2 B cells, the latter enter the spleen. In the spleen they undergo Ig class switch from IgMhigh IgDlow to IgDhigh IgMlow. The naïve B cells enter secondary lymphoid tissues where they are challenged with an antigen by an antigen presenting cell (APC). This induces somatic hypermutation and an isotype switch, the activated B cells either become memory B cells or plasma cells. Designed with motifolio objects.
The cells are mature but still naïve and the follicular B cells can undergo the so called
germinal center reaction in the secondary lymphoid tissues (see Figure 9). In this process
the B cells are activated by antigen presenting cells (APCs) like dendritic cells. These
activate the B cells and they undergo rapid proliferation. In a process called somatic
hypermutation the B cells variable regions of the B cell receptor show an extremely
increased mutation rate, which can change the affinity of the BCR to its antigen (Maul and
Gearhart, 2010). An increased affinity in term increases the survival and by this process
the B cells are selected. The surviving cells either become memory B cells or differentiate
further into antibody producing plasma cells.
26
2.6.1 WNT signaling in B cell development Most scientific publications about the influence of WNT signaling on B cell development
deal with the early stages from HSCs to pre-B cells (see Figure 9). Early experiments
observed that WNT1, WNT5a and WNT10b can induce proliferation in hematopoietic
progenitor cells in vitro (Austin et al., 1997). Similar results were obtained when human
progenitor cells were stimulated by feeder cells transduced with WNT5a, WNT2b or
WNT10b (Van Den Berg et al., 1998). In later experiments WNT3a was identified to
promote self-renewal, while WNT5a increased proliferation and lineage commitment
(Malhotra et al., 2008). If active WNT/β-catenin signaling promotes self-renewal as
general mechanism remains unclear. When constitutive active β-catenin was transduced
to HSCs their proliferation was extremely increased (Reya et al., 2003). Similar
experiments in vivo led to an complete bone marrow failure (Kirstetter et al., 2006).
However the expression of constitutive active β-catenin in HSCs makes a long-term
culture possible while the cells still retain their pluripotency (Baba et al., 2006).
Additional interesting insights were gained from WNT and Frizzled knock-out mouse
models. HSCs from WNT3a defective mice, that were transplanted to wildtype mice,
proved to be defective in their capacity for self-renewal (Luis et al., 2009). The knock-out
of WNT5a in mice also affects the lymphopoiesis. Liang and colleagues observed in mice
with a heterozygous WNT5a knock-out an increased proliferation of B cells (Liang et al.,
2003). The WNT5a heterozygous mice developed myeloid leukemia and B cell
lymphomas, indicating that WNT5a acts as a tumorsuppressor in murine hematopoiesis.
Also the knock-out of FZD9 causes severe disturbance of the B cell development.
Ranheim and colleagues observed the depletion of pre-B cells from the bone marrow and
an abnormal high number of plasma cells in the spleen (Ranheim et al., 2005).
2.6.2 LEF1 expression during B cell development While we have some knowledge about the presence of WNT proteins, little is known about
their downstream transcriptionfactors. Studies in mice and men indicate that at least
TCF7L2 and LEF1 are differentially expressed during B cell development. Studies on
mRNA (messenger RNA) and protein level revealed that LEF1 is only expressed in the
early B cell stages in the bone marrow (Døsen et al., 2006; Reya et al., 2000). The work
from Døsen and colleagues showed that LEF1 is expressed in pro- and pre-B cells, but
27
neither in progenitor nor in immature B cells. TCF7L2 in contrast is expressed in progenitor
cells and pro-B cells, but not in later developmental stages (Døsen et al., 2006). LEF1
expression in B cells with a mature phenotype is only reported from B cell leukemia like
chronic lymphocytic leukemia (CLL).
2.7 Chronic lymphocytic leukemia (CLL) The disease chronic lymphocytic leukemia is caused by an accumulation of mature but
immunoincompetent B cells in the peripheral blood (PB) and the secondary lymphoid
tissue of the patients. The current WHO classification states as criteria for diagnosis
lymphocyte counts of more than 5000 cells/µl and the presence of CD5+, CD19+ and
CD23+ (Low affinity immunoglobulin epsilon Fc receptor) B cells in the peripheral blood.
The disease is still considered incurable and the patients often die of infections, due to
their impaired immune system.
2.7.1 Etiology Up-today no bona fide factor for CLL induction has been identified, but the disease
appears to have a genetic component. Several studies showed that there can be an
inherited risk for CLL induction (Goldin et al., 2004). The disease is only common in North
America and Europe (Pan et al., 2002).
2.7.2 Epidemiology CLL occurrence depends on the age, sex and as already mentioned the ethnical
background. The median age at diagnosis is rather high with 65 years with a rising
frequency in the later years (Dighiero et al., 1991; Montserrat and Rozman, 1995; Rozman
and Montserrat, 1995). Women are less prone to develop the leukemia and they also have
an overall better prognosis (Bhayat et al., 2009; Catovsky et al., 1989; Mandelli et al.,
1987). Another a risk factor is a Caucasian background, while Africans and Asians rarely
develop CLL (Dores et al., 2007).
28
2.7.3 Diagnosis Frequently the first indication for CLL are unusually high lymphocyte counts in the
peripheral blood of the patients. In blood smears these lymphocytes appear monomorphic
with a small basophilic cytoplasma and a dense nucleus. Another hint are artefacts in the
blood smears, caused by fractured CLL cells. To discern CLL from other malignancies
FACS (Fluorescence-activated cell sorting) analysis are performed. CLL cells express the
markers CD5, CD19, CD23 (Hallek et al., 2008).
2.7.4 Disease progression The progression of CLL is quite diverse. While some patients survive several years without
the need for treatment others die within months. Over the decades physicians have
identified several risk factors that allow assessment of the severity of the disease. Based
blood parameters and infiltrated organs Rai and Binet developed basic schemes for risk
stratification. They include factors like lymphocytosis, number of lymphatic areas involved,
anemia, thrombocytopenia and organomegalia (usually spleen and/or liver) (Binet et al.,
1981; Rai et al., 1975). These two systems usually form the basis for the prognosis.
Additional important risk factor are the expression of CD38 (ADP-ribosyl cyclase 1) and
ZAP70 (Tyrosine-protein kinase ZAP-70), mutational status of the major tumor supressor
TP53, IgVH (Immunoglobulin variable heavy chain region) mutational status,
chromosomal aberrations and proliferation indicators like Thymidinkinase activity.
2.7.5 Treatment The current first-line therapy is based on the combination of the cytostatics fludarabine
and cyclophosphamide with the monoclonal antibody against CD20 (rituximab). Several
other cytostatics like bendamustin or chlorambucil are frequently implemented in the
therapeutic regimen, but this depends largely on the aggressiveness of the disease as
well as the fitness of the patient (Hallek, 2013). As a new treatment option the tyrosine
kinase inhibitors emerged in the last years. The best example is ibrutinib, which primarily
targets the bruton tyrosine kinase. The drug was successfully tested on refractory and
relapsed CLL (Byrd et al., 2013).
29
The only curative approach for CLL is the allogenic stem cell transplantation (Gladstone
and Fuchs, 2012). Due to high risks the treatment is only suitable for young and fit patients
with otherwise very poor prognosis.
2.7.6 Pathogenesis Chromosomal Aberrations
Chromosomal aberrations are a common feature and are detectable in more than 80% of
all CLL cases. The most frequent are the deletions on 13q (55%), deletions on 11q (18%),
trisomy of chromosome 12 (16%) and the deletion on 17p (7%). Compared to a normal
karyotype the del(13q) is the only one with a favorable diagnosis. All other chromosomal
aberrations, as well as complex karyotypes, are associated with a poor prognosis (Döhner
et al., 2000). The biggest impact have the deleltions 11q and 17p. The deletion of
chromosome 11q affects multiple genes. The most important one appears to be ATM, an
activator of the p53 tumor suppressor. Under physiological conditions ATM and p53
mediate DNA repair and induction of apoptosis due to DNA damage (Austen et al., 2005).
The deletion of 17p affects the TP53 gene directly. The loss of TP53 leads to immensely
increased resistance to treatment and rapid disease progression. Mutations of the
remaining allele are common, which further protects the cells from apoptosis. Patients
with mutated or deleted TP53 genes have very poor prognosis and usually die within two
years after diagnosis, despite extensive treatment (Döhner et al., 2000; Zenz et al., 2008).
The B cell receptor
New results in the last years have underlined the importance of the B cell receptor (BCR)
for CLL. The B cell receptor is composed of immunoglobulin and the CD17a/b heterodimer
(Van Noesel et al., 1992). By antigen binding the receptor activates several intracellular
signaling cascades, which induce the proliferation and selection of the B cell (Burger,
2012). In addition is the diversity of the BCR repertoire reduced in CLL, when compared
to normal B cells. Frequently these BCRs in CLL are polyreactive and resemble in their
characteristics inflammation factors. The expression of autoreactive antigens appears to
increase the survival of the malignant cells (Caligaris-Cappio and Hamblin, 1999).
30
2.7.7 WNT signaling in CLL One of the hallmarks of CLL cells is the abnormal expression of LEF1. This was first
discovered by array based screens of CLL cell mRNA (Klein et al., 2001). Three years
later Lu and colleagues took a closer look and found that most key components of the
WNT signaling cascade are expressed in CLL cells (Lu et al., 2004a). The work identified
WNT3, WNT5b, WNT6, WNT10a, WNT14, WNT16 and FZD3 to be overexpressed in CLL
cells when compared to healthy B cells. The working group also inhibited the GSK3 activity
in primary CLL cells by SB216763, which is known to activate β-catenin dependent WNT
signaling. This resulted in an increase of CLL cell survival in vitro, while the inhibition of
WNT signaling by R-etodalac had the opposite effect. Over the next years evidence for
an abnormal WNT signaling in CLL cells increased. Three studies showed abnormal
promoter methylation of WNT inhibitors like sFRP, DKK or WIF1 (Chim et al., 2006, 2008;
Liu et al., 2006). Another aspect might be the evasion of CLL cells from WNT inhibitors.
Filipovich and colleagues showed that inhibitors like DKK1 are not functional due to
changes in the expression of its interaction partner LRP6 in CLL cells (Filipovich et al.,
2010). Over the last years many studies tested the impact WNT inhibitors on primary CLL
cells. After their initial success in inducing apoptosis in CLL cells with R-etodalac Lu and
colleagues also tested the WNT inhibitor Ethacrynic acid (EA). As expected, the
substance was able to induce apoptosis in primary CLL cells, too (Lu et al., 2009).
Nevertheless it remains unclear if EA inhibits only WNT signaling in CLL cells, so
experiments with more specificity were needed. In 2010 Gandhirajan and colleagues
published their study which used two small molecules to inhibit β-catenin-TCF/LEF1
interaction (Gandhirajan et al., 2010). Both substances selectively induced apoptosis in
primary CLL cells in low micromolar concentrations, while healthy B cells remained fairly
untouched. This study is interesting due to the higher specificity of the small molecules,
which limits the off-target events. Razavi and co-workers tested another class of WNT
inhibitors. The so called NO-ASAs are derivatives of the Aspirin, which were shown to
inhibit the WNT signaling pathway (Gehrke et al., 2011b; Nath et al., 2003; Razavi et al.,
2011). The studies tested two isomers, the mNO-ASA and the pNO-ASA. The para-
isomere (pNO-ASA) effectively induced apoptosis in primary CLL cells and was
significantly less toxic to healthy control cells. In 2011 the WNT inhibitor Salinomycin was
31
tested on primary CLL cells. This compound inhibits the phosphorylation of LRP6 and was
shown to selectively induce apoptosis in primary CLL cells (Lu et al., 2011). The results
from the inhibition studies show a common outcome, the inhibition of the WNT signaling
pathway reduces the survival of primary CLL cells in vitro, which again hints to the
importance of the WNT/β-catenin signaling for CLL cell survival. Additional evidence was
gained from animal experiments. The Emu-TCL1 overexpresses the enhancer of BCR
signaling TCL1 in a B cell specific manner and induces a CLL like disease in mice (Bichi
et al., 2002). With the progression of the disease some WNT components are upregulated
by malignant cells, like WNT16, WNT10alpha and FZD6 (Wu et al., 2009). Most
interestingly, the disease onset is significantly postponed in a FZD6 deficient background
in this study, which indicates that WNT signaling plays at least a supportive role in the
disease. The first direct indication of active WNT/β-catenin signaling came from Gutierrez
and colleagues in 2010 (Gutierrez et al., 2010b). The working group transfected primary
CLL and healthy B cells with a WNT reporter plasmid, which revealed an abnormally
increased activity of the pathway. This was further underlined as the expression of the
effector transcription factor LEF1 was shown to correlate with the disease progression
(Erdfelder et al., 2010). However the idea that the WNT/β-catenin signaling is active in
CLL is not undisputed. In an intriguing work Tendon and colleagues stained over 50 CLL
samples by immunohistochemistry and only detected nuclear β-catenin in 12% of the
samples (Tandon et al., 2011). The role of LEF1, which might be the most important
WNT/β-catenin down-stream transcription factor in CLL, is also not well understood.
Knock-down experiments revealed a high heterogeneity in response. Shalek and co-
workers defined three groups dependent on the impact of a lef1 knock-down on the
survival (Shalek et al., 2012). The CLL cells most sensitive to lef1 knock-down showed an
up-regulation of myc associated genes, while polycomb and embryonic stem cell genes
were down-regulated. In CLL cells with low sensitivity to the silencing, the effect on the
different gene groups was found to be inversed. New data suggests that the activation by
β-catenin might be dispensable in many leukemia and that other transactivators like ATF2
might fill this gap (Grumolato et al., 2013).

32
2.8 NO-ASAs Acetylsalicylic acid (ASA) is the most famous compound in modern medicine. Additionally
to its use as painkiller, it is also reported to have an anti-cancer effect (Kashfi and Rigas,
2005). Unfortunately is the application of ASA limited by the induction of severe side-
effects, mostly gastrointestinal, which occur when it is given for long-term and in large
quantities. To overcome these problems NO-donating acetylsalicylic acids were
developed. These drugs are composed of a traditional acetylsalicylic acid molecule that
is linked via a spacer to an NO-donating moiety, which has a gastroprotective effect.
Surprisingly, NO-ASAs proved far more effective in preventing growth of tumor cell lines
than ASA itself, implying that either the NO donating group or the spacer possesses anti-
cancer properties. However, a limitation in all studies dealing with NO-ASA is the
determination of the "active" part of the compound which is responsible for the
antineoplastic effect. During metabolisation, the NO-group, the spacer and the ASA
substructure are disconnected and can thus individually be biologically active. In the
following sections, we will focus on the para- and the meta-isomers since only very little
is known about oNO-ASA.
Very important for the effect of each NO-ASA isoform is their metabolization which
releases the effector substances. The metabolization of NO-ASA follows a general
mechanism. Upon entering the organism, the NO-moiety of p- and mNO-ASA is rapidly
released, and esterases cleave the traditional acetylsalicylic acid from the spacer
molecule (Carini et al., 2004; Dunlap et al., 2008). The released nitric oxide was shown to
have gastroprotective properties in vivo, while the ASA maintains its normal functionality
as a PTGS1 inhibitor (Gresele and Momi, 2006). Additional studies showed a different
mode of action. Depending on the position of the NO-moiety, the linker also appears to
have a critical influence on the efficiency of the drug. Of these NO-ASA isomers, only the
para-derivative forms quinone methides upon metabolisation (Dunlap et al., 2007).
The different metabolisation appears to be important, since quinone forming isoforms
were reported to be the far more potent drugs in inhibiting growth of tumor cell-lines in
multiple studies (Dunlap et al., 2008; Nath et al., 2003, 2009). This effect is thought to be
closely related to the quinone methides that appear to have a considerable cytotoxic
effect, which arises from complexation of glutathiones (GSH). This can deplete the cellular
33
GSH, which is an important defence mechanism of the cells against oxidative stress and
is critical for survival of many different types of cancers (Dunlap et al., 2008).
Another key player in NO-ASA induced apoptosis of cancer cells might be the WNT-
signaling pathway. Several studies report that NO-ASA is capable of inhibiting TCF/β-
catenin dependent expression of target genes in colon, prostate and breast cancer cell
lines (Kashfi and Rigas, 2005; Nath et al., 2003, 2009). Interestingly the para-isomer
proved to be the more powerful drug when compared to mNO-ASA in suppressing the
formation of the TCF/β-catenin complex, which might contribute to its higher efficacy (Nath
et al., 2009). Additionally, it was shown that NO-ASAs nitrosylate the central protein of the
WNT-cascade, β-catenin, as well as NF-κB and p53 in colon carcinoma cell lines (Williams
et al., 2011). This posttranslational modification might explain in some part the inhibitory
functions of the drug on the WNT- and the NF-κB signaling pathway.
Information about pharmacokinetics, toxicity from pre-clinical and clinical studies is
predominantly available for the meta-isomer (NCX4016). The drug proved to be safe in
animal and human studies and caused no gastrointestinal side effects like traditional ASA
(Fiorucci et al., 2003; Gresele and Momi, 2006). Additionally, high plasma levels were
achieved in rats and humans (161 ng/ml after a single dose in rats). The meta-isomer was
tested in clinical trial phase II as a protective drug against colorectal carcinomas, but the
trials were stopped because of possible genotoxicity of its metabolite NCX4015 (Dunlap
et al., 2008).
The para- as well as the ortho-isomer, to our knowledge, were never put forward for
clinical trials. Nevertheless the drug was successfully tested in several xenograft mouse
model studies, including our own experiments, and showed no severe side-effects (Razavi
et al., 2011; Rosetti et al., 2006).
34
2.9 Goals of the project This study is based on the hypotheses that (a) the transcriptionfactor LEF1 is an important
factor in B cell maturation and can induce B cell neoplasia when overexpressed in B cells
and (b) that newly developed NO-ASA derivatives effectively and selectively induce
apoptosis in CLL cells with special regard to their usability in vivo. To test these
hypotheses a targeted LEF1 overexpression mouse model is to be developed and tested
for changes in the blood. The effect of the NO-ASA derivates is to be tested by in vitro
and in vivo, the latter by a xenograft mouse model.
The goals of this project are:
1. Development of a new mouse model for targeted LEF1 overexpression
a. Assessment of the oncogenic potential of LEF1
b. Assessment of the impact of LEF1 overexpression in murine B cells on their
development
2. Development of new experimental drugs for CLL treatment
a. Analysis if the toxicity, selectivity and their bioavailability
b. Analysis of the mode of action

35
3 Materials
3.1 Chemicals If not indicated all chemicals were purchased from Carl Roth GmbH, Karlsruhe or Sigma-
Aldrich, St. Louis, USA in per analysis quality.
Table 3 Chemicals
Chemical Company
Dimethylsulfoxid (DMSO) for molecular biology Carl Roth GmbH, Karlsruhe
Ampicillin Carl Roth GmbH, Karlsruhe
Kanamycin Carl Roth GmbH, Karlsruhe
Sesame oil Sigma-Aldrich, St. Louis, USA
Bovine serum albumin (BSA) for molecular biology Carl Roth GmbH, Karlsruhe
Gelatin from cold water fish skin
TritonX-100
Sigma-Aldrich, St. Louis, USA
Carl Roth GmbH, Karlsruhe
TWEEN20 Carl Roth GmbH, Karlsruhe
Mitomycin C Sigma-Aldrich, St. Louis, USA
3.2 NO-ASA derivatives Table 4 NO-ASA derivatives Name Structure IUPAC Source
mNO-ASA
O
O
OAc ONO2
3-
[(nitrooxy)methyl]phenyl
2-(acetyloxy)benzoate
Cayman Chemical
Company, Ann Arbor,
USA
pNO-ASA
O
ONO2O
OAc
4-
[(nitrooxy)methyl]phenyl
2-(acetyloxy)benzoate
Organic chemistry,
University of Cologne*
NOBA (B9)
O
ONO2O
4-
[(nitrooxy)methyl]phenyl
benzoate
Organic chemistry,
University of Cologne*
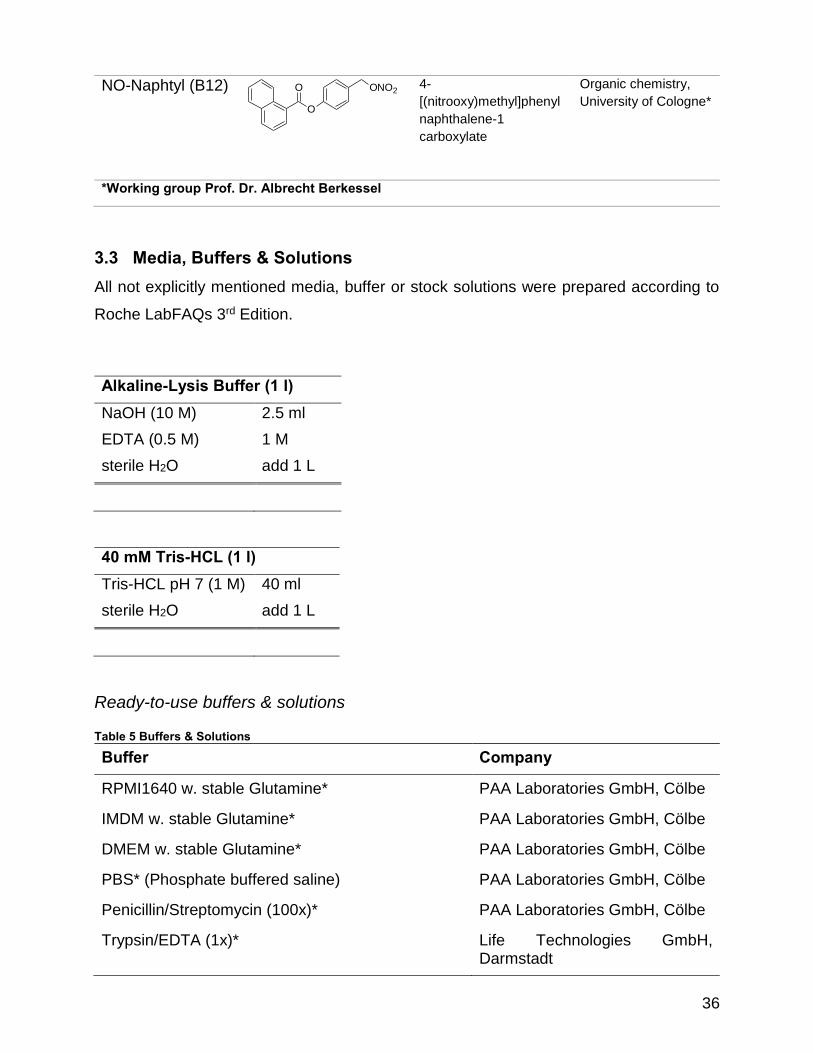
36
NO-Naphtyl (B12)
O
ONO2O
4-
[(nitrooxy)methyl]phenyl
naphthalene-1
carboxylate
Organic chemistry,
University of Cologne*
*Working group Prof. Dr. Albrecht Berkessel
3.3 Media, Buffers & Solutions All not explicitly mentioned media, buffer or stock solutions were prepared according to
Roche LabFAQs 3rd Edition.
Alkaline-Lysis Buffer (1 l) NaOH (10 M) 2.5 ml
EDTA (0.5 M) 1 M
sterile H2O add 1 L
40 mM Tris-HCL (1 l) Tris-HCL pH 7 (1 M) 40 ml
sterile H2O add 1 L
Ready-to-use buffers & solutions
Table 5 Buffers & Solutions
Buffer Company
RPMI1640 w. stable Glutamine* PAA Laboratories GmbH, Cölbe
IMDM w. stable Glutamine* PAA Laboratories GmbH, Cölbe
DMEM w. stable Glutamine* PAA Laboratories GmbH, Cölbe
PBS* (Phosphate buffered saline) PAA Laboratories GmbH, Cölbe
Penicillin/Streptomycin (100x)* PAA Laboratories GmbH, Cölbe
Trypsin/EDTA (1x)* Life Technologies GmbH, Darmstadt
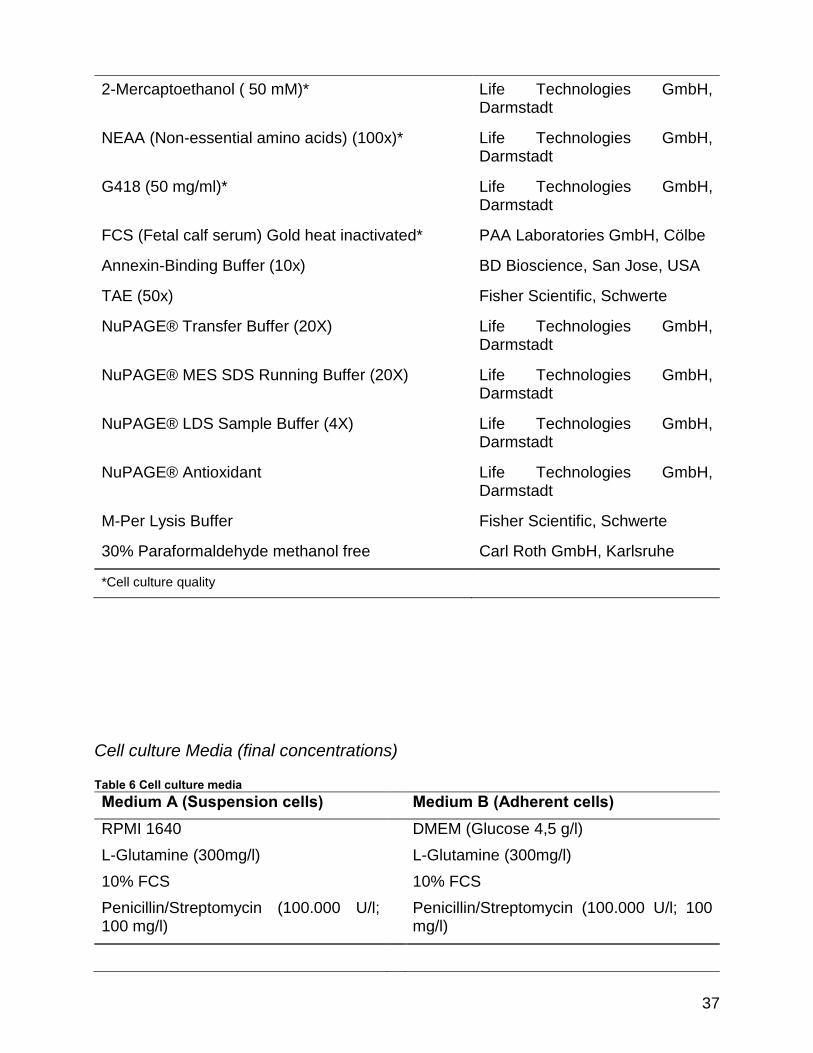
37
2-Mercaptoethanol ( 50 mM)* Life Technologies GmbH, Darmstadt
NEAA (Non-essential amino acids) (100x)* Life Technologies GmbH, Darmstadt
G418 (50 mg/ml)* Life Technologies GmbH, Darmstadt
FCS (Fetal calf serum) Gold heat inactivated* PAA Laboratories GmbH, Cölbe
Annexin-Binding Buffer (10x) BD Bioscience, San Jose, USA
TAE (50x) Fisher Scientific, Schwerte
NuPAGE® Transfer Buffer (20X) Life Technologies GmbH, Darmstadt
NuPAGE® MES SDS Running Buffer (20X) Life Technologies GmbH, Darmstadt
NuPAGE® LDS Sample Buffer (4X) Life Technologies GmbH, Darmstadt
NuPAGE® Antioxidant Life Technologies GmbH, Darmstadt
M-Per Lysis Buffer Fisher Scientific, Schwerte
30% Paraformaldehyde methanol free Carl Roth GmbH, Karlsruhe
*Cell culture quality
Cell culture Media (final concentrations)
Table 6 Cell culture media Medium A (Suspension cells) Medium B (Adherent cells) RPMI 1640 DMEM (Glucose 4,5 g/l)
L-Glutamine (300mg/l) L-Glutamine (300mg/l)
10% FCS 10% FCS
Penicillin/Streptomycin (100.000 U/l; 100 mg/l)
Penicillin/Streptomycin (100.000 U/l; 100 mg/l)
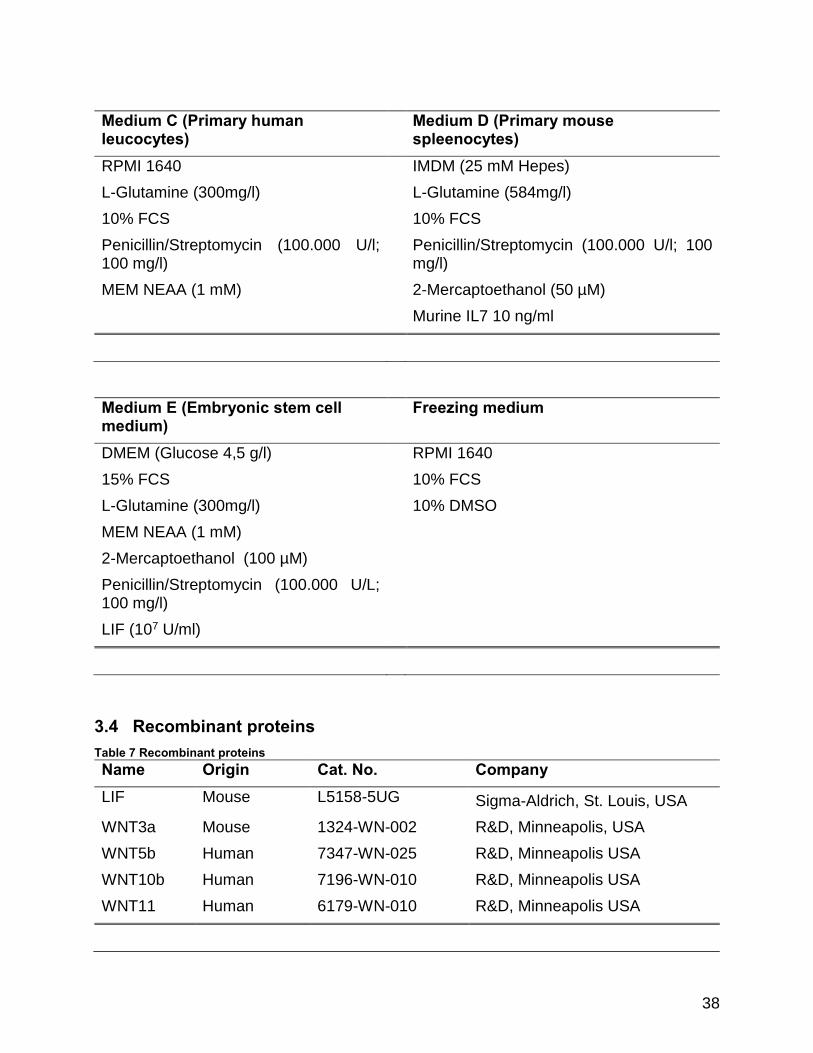
38
Medium C (Primary human leucocytes)
Medium D (Primary mouse spleenocytes)
RPMI 1640 IMDM (25 mM Hepes)
L-Glutamine (300mg/l) L-Glutamine (584mg/l)
10% FCS 10% FCS
Penicillin/Streptomycin (100.000 U/l; 100 mg/l)
Penicillin/Streptomycin (100.000 U/l; 100 mg/l)
MEM NEAA (1 mM) 2-Mercaptoethanol (50 µM)
Murine IL7 10 ng/ml
Medium E (Embryonic stem cell medium)
Freezing medium
DMEM (Glucose 4,5 g/l) RPMI 1640
15% FCS 10% FCS
L-Glutamine (300mg/l) 10% DMSO
MEM NEAA (1 mM)
2-Mercaptoethanol (100 µM)
Penicillin/Streptomycin (100.000 U/L; 100 mg/l)
LIF (107 U/ml)
3.4 Recombinant proteins Table 7 Recombinant proteins Name Origin Cat. No. Company LIF Mouse L5158-5UG Sigma-Aldrich, St. Louis, USA
WNT3a Mouse 1324-WN-002 R&D, Minneapolis, USA
WNT5b Human 7347-WN-025 R&D, Minneapolis USA
WNT10b Human 7196-WN-010 R&D, Minneapolis USA
WNT11 Human 6179-WN-010 R&D, Minneapolis USA
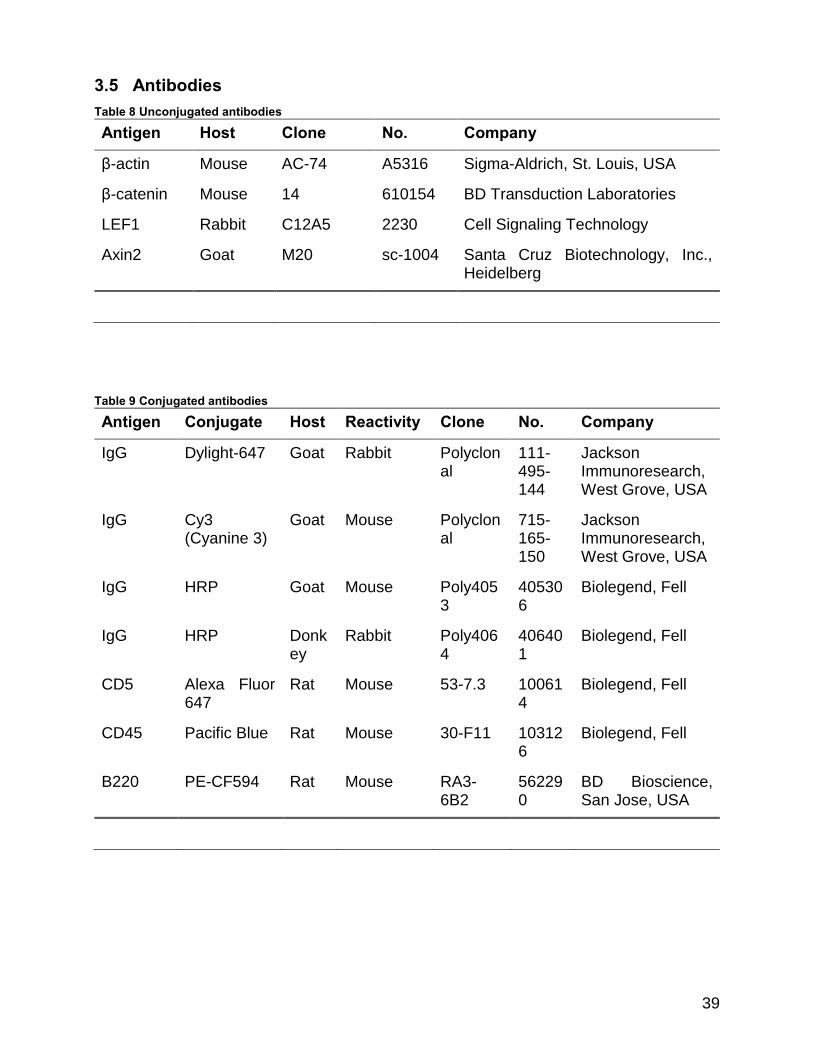
39
3.5 Antibodies Table 8 Unconjugated antibodies
Antigen Host Clone No. Company
β-actin Mouse AC-74 A5316 Sigma-Aldrich, St. Louis, USA
β-catenin Mouse 14 610154 BD Transduction Laboratories
LEF1 Rabbit C12A5 2230 Cell Signaling Technology
Axin2 Goat M20 sc-1004 Santa Cruz Biotechnology, Inc., Heidelberg
Table 9 Conjugated antibodies
Antigen Conjugate Host Reactivity Clone No. Company
IgG Dylight-647 Goat Rabbit Polyclonal
111-495-144
Jackson Immunoresearch, West Grove, USA
IgG Cy3 (Cyanine 3)
Goat Mouse Polyclonal
715-165-150
Jackson Immunoresearch, West Grove, USA
IgG HRP Goat Mouse Poly4053
405306
Biolegend, Fell
IgG HRP Donkey
Rabbit Poly4064
406401
Biolegend, Fell
CD5 Alexa Fluor 647
Rat Mouse 53-7.3 100614
Biolegend, Fell
CD45 Pacific Blue Rat Mouse 30-F11 103126
Biolegend, Fell
B220 PE-CF594 Rat Mouse RA3-6B2
562290
BD Bioscience, San Jose, USA

40
3.6 Kits Table 10 Nucleic acid isolation
Kit Cat. No. Company
QIAGEN Plasmid Mini Kit (25) 12123 Qiagen N.V., Hilden
QIAGEN Plasmid Midi Kit (25) 12143 Qiagen N.V., Hilden
RNeasy Plus Mini Kit (50) 74134 Qiagen N.V., Hilden
MinElute Gel Extraction Kit (50) 28604 Qiagen N.V., Hilden
Table 11 Cell isolation
Kit Cat. No. Company
CD19 MicroBeads, human 130-050-301 Miltenyi Biotec GmbH, Bergisch-Gladbach
B Cell Isolation Kit II, human 130-091-151 Miltenyi Biotec GmbH, Bergisch-Gladbach
Rosette SepTM Human B
Cell Enrichment Cocktail
15024 STEMCELL Technologies SARL, Köln
CD19 MicroBeads, mouse 130-052-201 Miltenyi Biotec GmbH, Bergisch-Gladbach
CD45R (B220) MicroBeads, mouse 130-049-501 Miltenyi Biotec GmbH, Bergisch-Gladbach
Table 12 Miscellaneous
Kit Cat. No. Company
SuperSignal West Pico Chemiluminescent
Substrate
34087 Fisher Scientific, Schwerte
Mouse ES Cell Nucleofector®Kit VPH-1001 Lonza, Basel, Switzerland
CellTiter-Glo® G7570 Promega, Mannheim
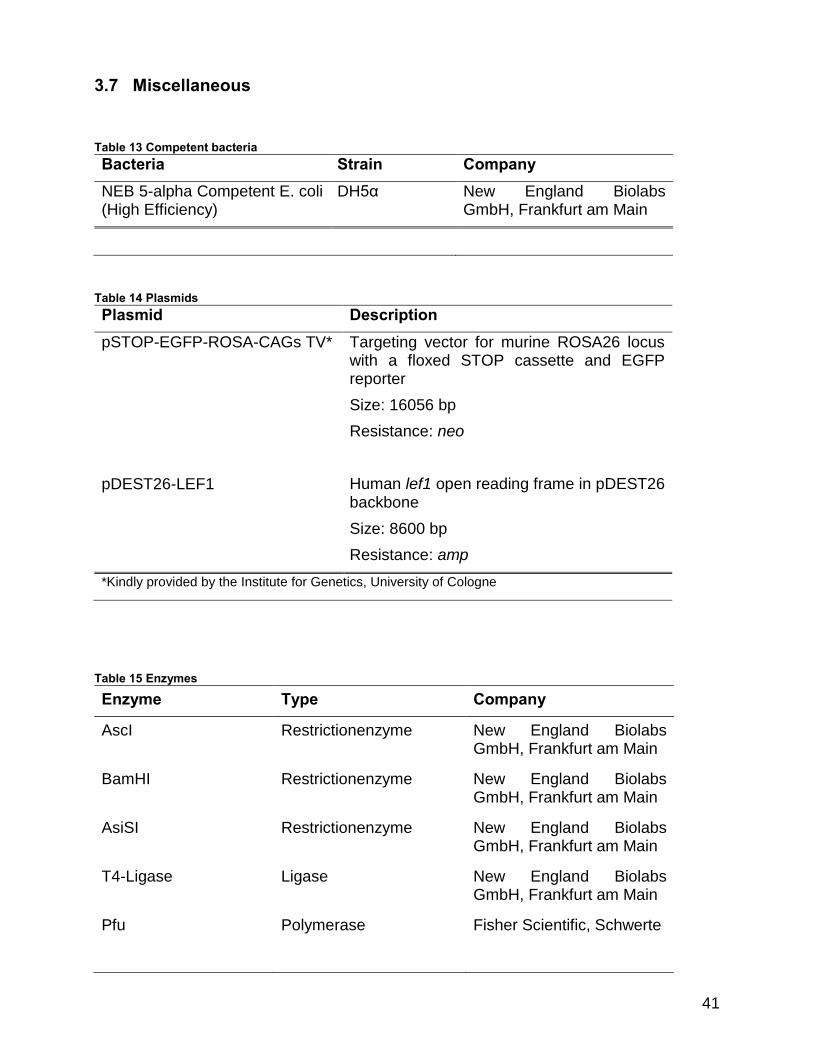
41
3.7 Miscellaneous
Table 13 Competent bacteria Bacteria Strain Company NEB 5-alpha Competent E. coli (High Efficiency)
DH5α New England Biolabs GmbH, Frankfurt am Main
Table 14 Plasmids Plasmid Description pSTOP-EGFP-ROSA-CAGs TV* Targeting vector for murine ROSA26 locus
with a floxed STOP cassette and EGFP reporter
Size: 16056 bp
Resistance: neo
pDEST26-LEF1 Human lef1 open reading frame in pDEST26 backbone
Size: 8600 bp
Resistance: amp
*Kindly provided by the Institute for Genetics, University of Cologne
Table 15 Enzymes
Enzyme Type Company
AscI Restrictionenzyme New England Biolabs GmbH, Frankfurt am Main
BamHI Restrictionenzyme New England Biolabs GmbH, Frankfurt am Main
AsiSI Restrictionenzyme New England Biolabs GmbH, Frankfurt am Main
T4-Ligase Ligase New England Biolabs GmbH, Frankfurt am Main
Pfu Polymerase Fisher Scientific, Schwerte
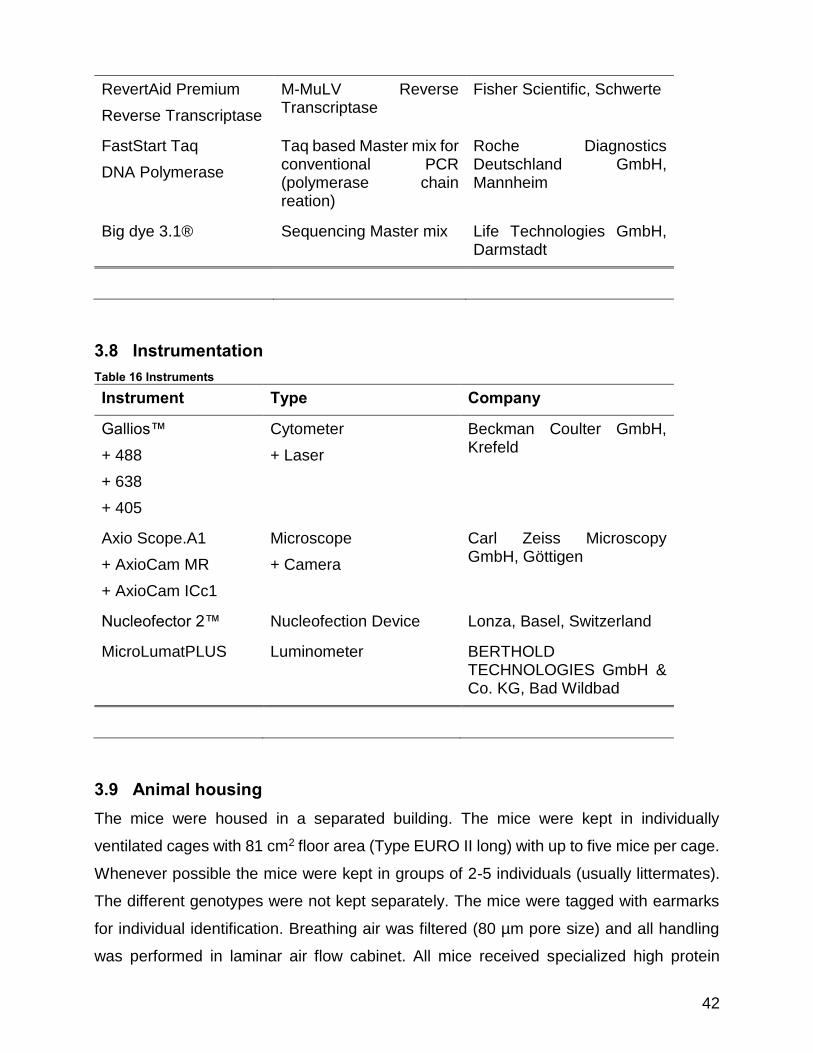
42
RevertAid Premium
Reverse Transcriptase
M-MuLV Reverse Transcriptase
Fisher Scientific, Schwerte
FastStart Taq
DNA Polymerase
Taq based Master mix for conventional PCR (polymerase chain reation)
Roche Diagnostics Deutschland GmbH, Mannheim
Big dye 3.1® Sequencing Master mix Life Technologies GmbH, Darmstadt
3.8 Instrumentation Table 16 Instruments
Instrument Type Company
Gallios™
+ 488
+ 638
+ 405
Cytometer
+ Laser
Beckman Coulter GmbH, Krefeld
Axio Scope.A1
+ AxioCam MR
+ AxioCam ICc1
Microscope
+ Camera
Carl Zeiss Microscopy GmbH, Göttigen
Nucleofector 2™ Nucleofection Device Lonza, Basel, Switzerland
MicroLumatPLUS Luminometer BERTHOLD TECHNOLOGIES GmbH & Co. KG, Bad Wildbad
3.9 Animal housing The mice were housed in a separated building. The mice were kept in individually
ventilated cages with 81 cm2 floor area (Type EURO II long) with up to five mice per cage.
Whenever possible the mice were kept in groups of 2-5 individuals (usually littermates).
The different genotypes were not kept separately. The mice were tagged with earmarks
for individual identification. Breathing air was filtered (80 µm pore size) and all handling
was performed in laminar air flow cabinet. All mice received specialized high protein
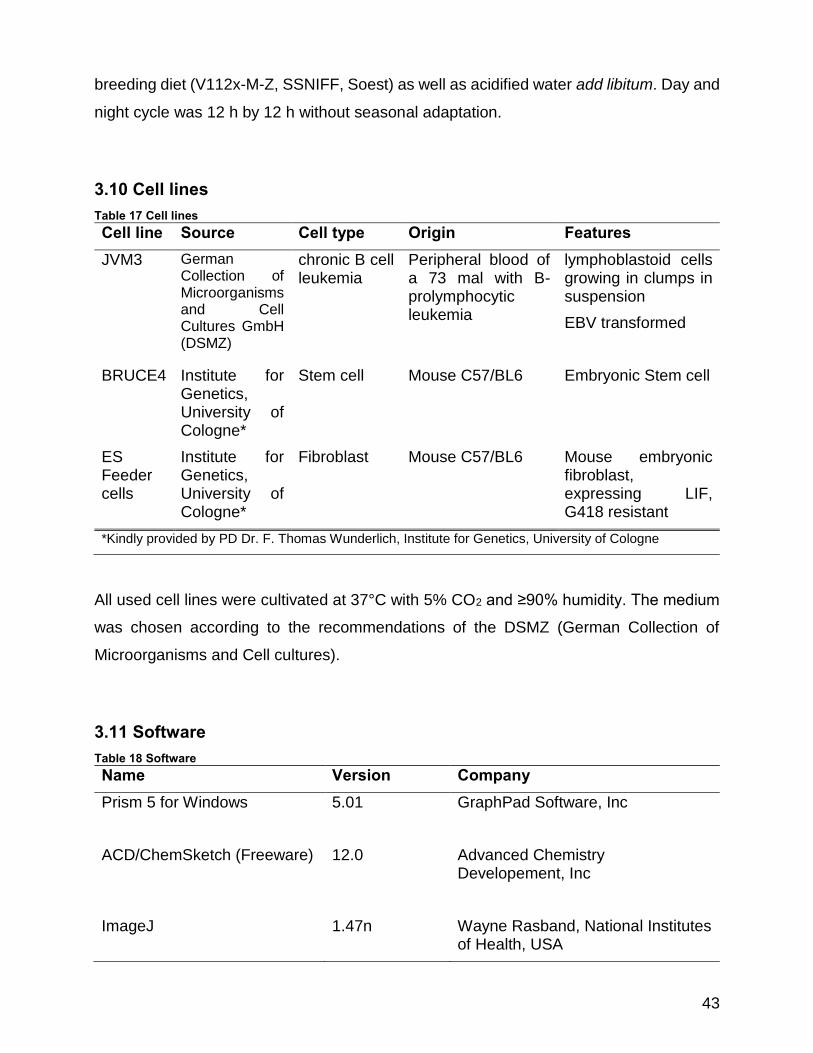
43
breeding diet (V112x-M-Z, SSNIFF, Soest) as well as acidified water add libitum. Day and
night cycle was 12 h by 12 h without seasonal adaptation.
3.10 Cell lines Table 17 Cell lines Cell line Source Cell type Origin Features JVM3 German
Collection of Microorganisms and Cell Cultures GmbH (DSMZ)
chronic B cell leukemia
Peripheral blood of a 73 mal with B-prolymphocytic leukemia
lymphoblastoid cells growing in clumps in suspension
EBV transformed
BRUCE4 Institute for Genetics, University of Cologne*
Stem cell Mouse C57/BL6 Embryonic Stem cell
ES Feeder cells
Institute for Genetics, University of Cologne*
Fibroblast Mouse C57/BL6 Mouse embryonic fibroblast, expressing LIF, G418 resistant
*Kindly provided by PD Dr. F. Thomas Wunderlich, Institute for Genetics, University of Cologne
All used cell lines were cultivated at 37°C with 5% CO2 and ≥90% humidity. The medium
was chosen according to the recommendations of the DSMZ (German Collection of
Microorganisms and Cell cultures).
3.11 Software Table 18 Software Name Version Company Prism 5 for Windows 5.01 GraphPad Software, Inc
ACD/ChemSketch (Freeware) 12.0 Advanced Chemistry Developement, Inc
ImageJ 1.47n Wayne Rasband, National Institutes of Health, USA

44
Kaluza 1.2 Beckman Coulter GmbH, Krefeld

45
4 Methods
4.1 Protein electrophoresis & Immunoblotting All mammalian cells used for protein electrophoresis and western blot experiments were
lysed in M-Per lysis buffer (Thermo Scientific, Schwerte), which was supplemented with
Protease inhibitor cocktail (Complete mini Protease inhibitor cocktail, Roche, Mannheim)
according to manufacturer’s instruction. For all protein gel electrophoresis and western
blot experiments the NuPAGE system of Life Technologies GmbH Darmstadt was used
according to the provided protocols. The antibodies for immunoblotting experiments were
used according to the provided instructions if not indicated otherwise.
The general procedure was as follows:
Wash 1x membrane with TBS (Tris-buffered saline)-T (TBS + 0.1% TWEEN20)
Block membrane with 10% (w/v) non-fat dry milk powder or BSA in TBS-T
Incubate membrane with primary antibody in TBS-T + 5% non-fat dry milk powder
or BSA overnight at 4°C
Wash 3x with TBS-T
Incubate membrane with secondary antibody in TBS-T + 5% non-fat dry milk
powder or BSA for 2 h at RT
Wash 3x with TBS-T
Drench membrane in luminescence substrate solution
Detect luminescence with x-ray film
4.2 Immunofluorescence For Immunofluorescence staining the following protocol for adherent cells was used.
Wash cells 3x with cold PBS
Fix cells with cold 4% PFA in PBS for 20 min at RT
Incubate cells with 0.1% TritonX-100 in PBS for 5 min
Wash cells 2x with PBS
Block with 5% normal goat serum (NGS) in PBS+0.2% Gelatin for 30 min
Incubate with primary antibody in PBS+2% NGS+0.2% Gelatin overnight at 4°C
Wash 3x with PBS+0.2% Gelatin

46
(Optional) Incubate with secondary antibody in PBS+2% NGS+0.2% Gelatin for 2
h at RT
Wash 3x with PBS+0.2% Gelatin
Wash 2x with PBS
Wash 1x with dest. H2O
Cover in appropriate mounting medium
4.3 Cell culture All cell culture work was performed under sterile conditions in laminar-flow workbenches,
which were routinely cleaned and disinfected. The different cell lines were thawed,
cultured and stored according to the recommendations of the DSMZ (Leibniz-Institut
DSMZ-Deutsche Sammlung von Mikroorganismen und Zellkulturen GmbH,
Braunschweig). Primary cells were frozen at 5x10⁶ cells per ml Freezing Medium.
4.4 Primary Cell isolation Murine lymphocytes from spleen (mSPL)
For the isolation of murine spleenocytes the donor mice were sacrificed using cervical
dislocation. Afterwards the spleens were isolated and homogenized by grinding through
a sterile 70 µm mesh and suspended in PBS + 2% FCS. For removal of cellular debris
and red blood cells the suspension is layered on Ficoll suspension (Lymphocyte
Separation Medium 1077 from PAA) and centrifuged at 500 x g for 20 min. The Buffy coat
is retrieved, than washed twice with PBS + 2% FCS and used freshly for experiments. For
cultivation, cells were kept at 37°C with 5% CO2 in medium D unless indicated otherwise.
Murine embryonic fibroblasts (MEFs)
For the isolation of MEFs 13.5 day after conception the mother is sacrificed via cervical
dislocation and the embryos are harvested. Each embryo is transferred to a 6 cm dish
filled with PBS and all maternal tissue is removed. Afterwards it is washed twice in PBS
by repeatedly transferring it to new culture dishes with PBS. After washing the head is cut
of and all red organs are removed. The head can be stored for genotyping. After organ
47
removal the embryo is washed three times with PBS and then ripped apart with forceps.
The tissue mixture is resuspended in Trypsin solution and incubated for 15 minutes at
37°C. The resulting cell suspension is mixed 1:1 with medium B and cleared by passing
through a 40 µM filter. Then the cell mixture can be seeded out (usually 1-2 75m2 tissue
culture flasks).
Human Chronic lymphocytic leukemia cells (CLL)
Primary CLL cells were isolated from peripheral Blood of CLL patients using the Rosette
SepTM Human B Cell Enrichment Cocktail (STEMCELL Technologies SARL, Cologne,
Germany) according to the manufacturer’s recommendations. After isolation all
experiments were started within 12 h. For cultivation cells were kept at 37°C with 5% CO2
in medium C unless indicated otherwise.
Human peripheral blood mononuclear cells (hPBMCs)
PBMCs were isolated from the peripheral blood of healthy volunteers. Blood was collected
and mixed with 1:1 with PBS + 2% FCS. The mixture was layered on a Ficoll suspension
(Lymphocyte Separation Medium 1077 from PAA) and centrifuged at 1200 x g for 20
minutes. The Buffy coat is retrieved, than washed twice with PBS + 2% FCS and used
freshly for experiments. For cultivation cells were kept at 37°C with 5% CO2 in medium C
unless indicated otherwise.
Human B cells (hB cell)
Where isolated from PBMCs or from dispensable cell mixtures derived from human Serum
preparations (healthy donors). The B cells were isolated either with the CD19 microbeads
Kit (positive selection) or the B cell isolation kit II (negative selection) (Miltenyi Biotec
GmbH, Bergisch Gladbach, Germany) according to the manufacturer’s recommendations.
For cultivation cells were kept at 37°C with 5% CO2 in medium C unless indicated
otherwise.
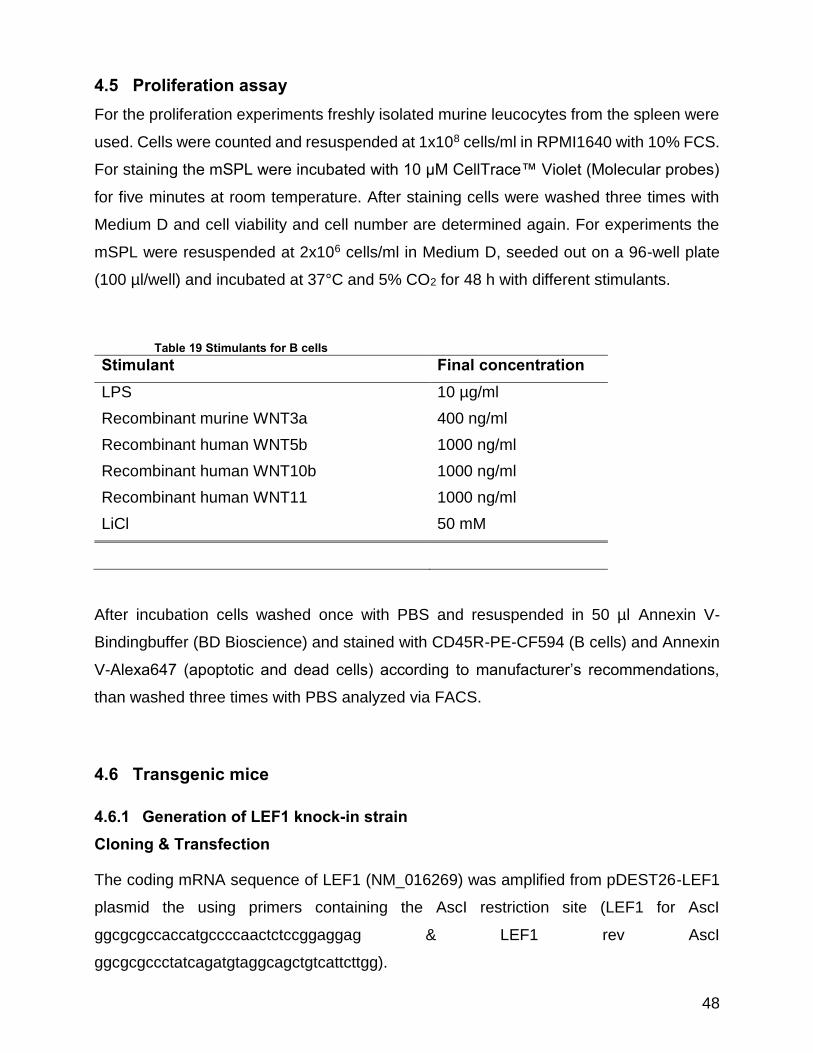
48
4.5 Proliferation assay For the proliferation experiments freshly isolated murine leucocytes from the spleen were
used. Cells were counted and resuspended at 1x10⁸ cells/ml in RPMI1640 with 10% FCS.
For staining the mSPL were incubated with 10 µM CellTrace™ Violet (Molecular probes)
for five minutes at room temperature. After staining cells were washed three times with
Medium D and cell viability and cell number are determined again. For experiments the
mSPL were resuspended at 2x10⁶ cells/ml in Medium D, seeded out on a 96-well plate
(100 µl/well) and incubated at 37°C and 5% CO2 for 48 h with different stimulants.
Table 19 Stimulants for B cells Stimulant Final concentration LPS 10 µg/ml
Recombinant murine WNT3a 400 ng/ml
Recombinant human WNT5b 1000 ng/ml
Recombinant human WNT10b 1000 ng/ml
Recombinant human WNT11 1000 ng/ml
LiCl 50 mM
After incubation cells washed once with PBS and resuspended in 50 µl Annexin V-
Bindingbuffer (BD Bioscience) and stained with CD45R-PE-CF594 (B cells) and Annexin
V-Alexa647 (apoptotic and dead cells) according to manufacturer’s recommendations,
than washed three times with PBS analyzed via FACS.
4.6 Transgenic mice
4.6.1 Generation of LEF1 knock-in strain Cloning & Transfection
The coding mRNA sequence of LEF1 (NM_016269) was amplified from pDEST26-LEF1
plasmid the using primers containing the AscI restriction site (LEF1 for AscI
ggcgcgccaccatgccccaactctccggaggag & LEF1 rev AscI
ggcgcgccctatcagatgtaggcagctgtcattcttgg).

49
Figure 10 Cloning strategy. Full length lef1 without any introns was amplified from the pDEST26-LEF1 Vector. AscI restriction sites were added by primer design. Lef1 was cloned via AscI into the targeting vector STOP-EGFP-ROSA-CAGs TV.
The amplicon was cloned into the Rosa26 targeting vector STOP-EGFP-ROSA-CAGs TV
via the AscI restriction site. The construct was linearized and electroporated into C57/BL6
derived Bruce4 cells with the Amaxa Nucleofector® system after manufacturer’s
instructions.
Embryonic stem cell culture
Bruce4 stem cells depend on feeder cells (FCs) in order to proliferate and keep
pluripotency. Feeder cells were expanded in Medium B and treated with Mitomycin C (10
µg/ml) for 2.5 h, washed and frozen in DMEM + 20% FCS + 10% DMSO. Frozen cells
were recovered one day prior use. The culture dishes were coated with gelatin prior use
and enough FCs were seeded out to form a confluent layer of cells in the culture dish (e.
i. 4*106 per 10 cm dish).
ES cells were expanded prior electroporation on FCs in Medium E. Electroporated ES
cells were again seeded on EF cells and incubated for 48 h to ensure expression of
resistance genes. Twenty-four hours after electroporation, selection of transfected ES
cells was started by addition of G418 (400 ng/ml). The medium was changed daily for two
weeks to maintain pluripotency of the stem cells and selection pressure on untransfected
ES cells. After two weeks of selection remaining ES cell colonies were collected and
50
individually cultivated and tested for transgene insertion into the ROSA26 locus by
southern blot. Cells with insertion were expanded and put forward for injection into
blastocysts.
Injection & Germline transmission
Stably transfected BRUCE4 cells were injected into CB20 Blastocysts (BALB/c
background). The resulting hybrid generation was crossed with C57BL/6 mice to gain
germline transmission with C57BL/6 background. Pups with black coat originate from
BRUCE4 cells and were tested with specific primers for GFP (green fluorescent protein)
and NEO (neomycin) for germline transmission of the transgene. One female was tested
positive for GFP and NEO and founded the new transgenic strain B6;C-
Gt(ROSA26)Sortm1(lef1)Cgn.
4.7 Transgenic mouse strains Strain: B6;C-Gt(ROSA26)Sortm1(lef1)Cgn
Short: R26lef1
Origin: newly established
Features: Targeted knock-in of human lef1 cDNA (complementary DNA) Isoform1 into the
Rosa26 locus (R26). The disruption of the Rosa26 has no known phenotype. The
transgene is headed by a floxed STOP cassette and a CAG promoter. Mice of this strain
do not express LEF1 without Cre recombinase activity. The strain has no obvious
phenotype in the heterozygous or the homozygous condition and is healthy and fertile.
Strain: B6.129P2(C)-Cd19tm1(cre)Cgn
Short: CD19wt/cre
Origin: The Jackson Laboratory
Features: Targeted knock-in of the bacteriophage P1 Cre Recombinase gene into the
CD19 locus. The transgene results in a replacement of CD19 expression in B cells with
Cre recombinase. The expression is specific for B cells starting at the earliest stage of

51
development. Homozygous mice are CD19 deficient and show a reduction of B1 B cells
and IgM Serum levels (Rickert et al., 1995). The ability to respond to T cell antigens is
also impaired. Due to this knowledge only heterozygous (wt/cre) mice were used in this
work, which have no known phenotype.
Strain: B6.C-Tg(CMV-cre)1Cgn
Short: CMV-cre
Origin: The Jackson Laboratory
Features: Carries the cre recombinase gene of the bacteriophage P1 under the control of
the CMV (Cytomegalovirus) promoter. The strain is used as efficient deleter strain for
floxed sequences virtually every tissue starting with early embryogenesis. While the
insertion site is unknown the strain exhibits no known phenotype.
Strain: B6.Cg-Tg(Cr2-cre)3Cgn/J
Short: Cr2-cre
Origin: The Jackson Laboratory
Features: Expression of Cre recombinase under control of Cr2-Promoter. Cr2 dependent
Cre expression is started in transitional B cells. Heterozygous mice have no obvious
phenotype.
Strain: CB17.Cg-PrkdcscidLystbg-J
Short: SCID beige
Origin: Charles River
Features: These strain carry mutations in the Prkdc and the Lyst gene. Homozygous
Prkdc mutation in addition to Lyst gene mutation results in underdeveloped lymphatic
tissue, severe B and T cell dysfunction, NK cell deficiency and lymphopenia. Because of
its impaired lymphatic cells this strain is suited for xenograft experiments. In contrast to
other immunodeficient mouse models this strain is not nude.

52
4.7.1 Genotyping Identification of the different genotypes is essential for analysis. The genetic material of
the pups was retrieved by cutting the tip (1 mm) of the tail. The tail tissue was transferred
to a 1.5 ml reaction tube and covered with 100 µl of Alkaline-Lysis Buffer and incubated
at 95°C for 1 h. After cooling 100 µl 40 mM Tris-HCl were mixed with the reaction.
Afterwards the reaction was centrifuged at 10,000 x g and 2 µl were used for every PCR.
Table 20 Genotyping Mastermix PCR Genotyping mix PCR Master Mix (2x) 10 µl
Forward Primer (10 µM) 1 µl
Reverse Primer (10 µM) 1 µl
Template 2 µl
H2O (PRC grade) 6 µl
Total 20 µl
For each Genotype different primer sets were used:
Table 21 Primer Genotyping Genotype Primer Sequence 5‘-3‘ Target Amplicon
size R26 tm1(lef1)Cgn oIMR8545
* AAAGTCGCTCTGAGTTGTTAT
Common
oIMR8052*
GCGAAGAGTTTGTCCTCAACC
Mutant 340 bp
oIMR8546*
GGAGCGGGAGAAATGGATATG
Wildtype 650 bp
Cd19tm1(cre)Cgn CD19c† AACCAGTCAACACCCTTCC
Common
CD19d† CCAGACTAGATACAGACCAG
Wildtype 452 bp
Cre7† TCAGCTACACCAGAGACG
Mutant ≈ 700 bp
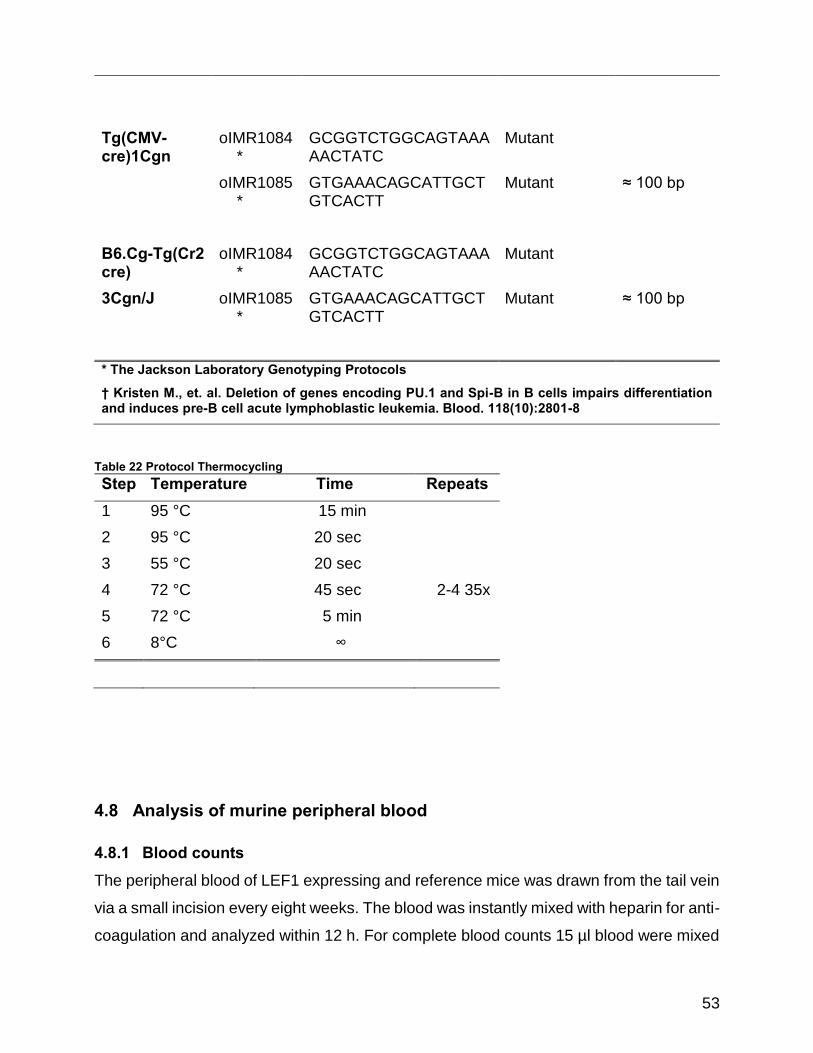
53
Tg(CMV-cre)1Cgn
oIMR1084*
GCGGTCTGGCAGTAAAAACTATC
Mutant
oIMR1085*
GTGAAACAGCATTGCTGTCACTT
Mutant ≈ 100 bp
B6.Cg-Tg(Cr2 cre)
oIMR1084*
GCGGTCTGGCAGTAAAAACTATC
Mutant
3Cgn/J oIMR1085*
GTGAAACAGCATTGCTGTCACTT
Mutant ≈ 100 bp
* The Jackson Laboratory Genotyping Protocols
† Kristen M., et. al. Deletion of genes encoding PU.1 and Spi-B in B cells impairs differentiation and induces pre-B cell acute lymphoblastic leukemia. Blood. 118(10):2801-8
Table 22 Protocol Thermocycling Step Temperature Time Repeats 1 95 °C 15 min
2 95 °C 20 sec
3 55 °C 20 sec
4 72 °C 45 sec 2-4 35x
5 72 °C 5 min
6 8°C ∞
4.8 Analysis of murine peripheral blood
4.8.1 Blood counts The peripheral blood of LEF1 expressing and reference mice was drawn from the tail vein
via a small incision every eight weeks. The blood was instantly mixed with heparin for anti-
coagulation and analyzed within 12 h. For complete blood counts 15 µl blood were mixed

54
1:1 with Diluent, Ac•T PAK (Beckman Coulter GmbH) and subsequently analyzed with the
COULTER® Ac·T diff2™ (Beckman Coulter GmbH).
4.8.2 FACS For FACS analysis the 40 µl of peripheral blood were used. The blood was mixed with the
following antibody combination and incubated in the dark for 15 minutes:
CD45-Pacific Blue (Biolegend)
CD45R (B220)-PE-CF594 (BD Bioscience)
CD5-Alexa647 (Biolegend)
Afterwards the red blood cells were removed with RBC lysis buffer (eBioScience, San
Diego, USA) according to manufacturer’s instructions and washed twice with PBS. The
remaining leucocytes were analyzed with a ten color NAVIOSTM (Beckman Coulter GmbH)
with the following gating strategy (see Figure 11). In the first step CD45 is plotted vs. the
sideward scatter signal to distinguish leucocytes (CD45+) from red blood cells and debris
(CD45-). In a second step the population that contains predominantly lymphocytes
(CD45+, SSlow) is gated [Lymphocytes]. Ongoing from this population the percentage of B
cells (B220++) and the T cells (CD5+) are calculated.
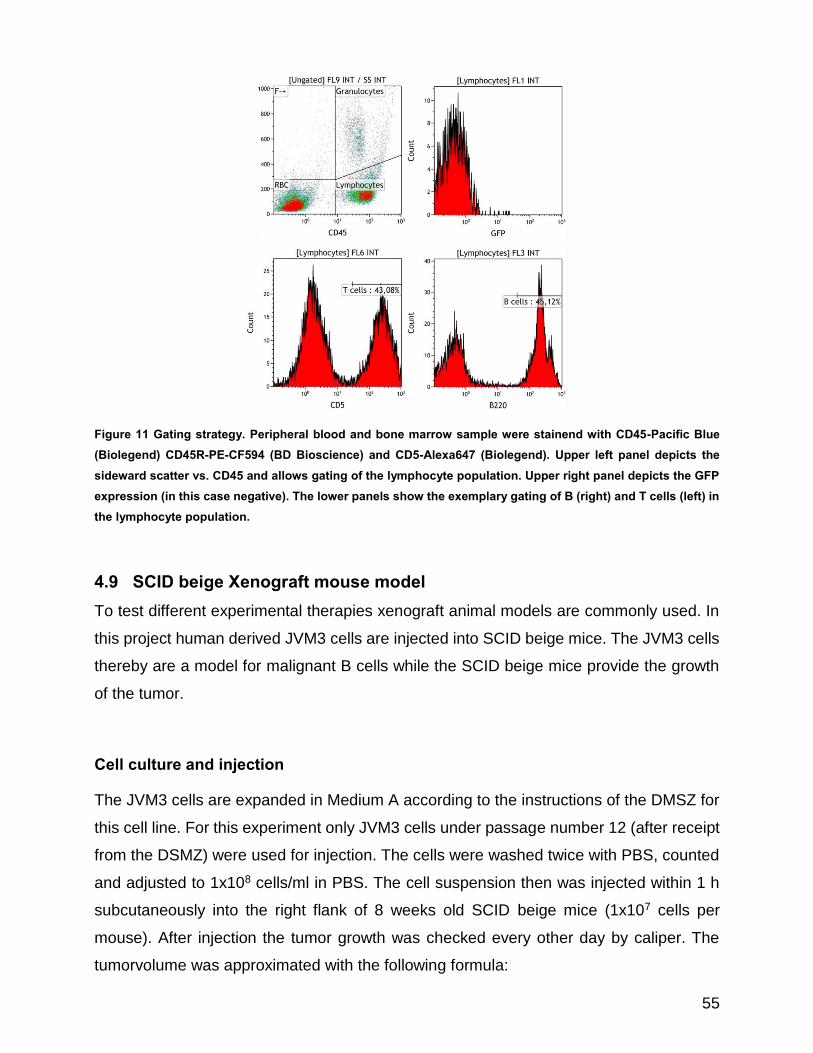
55
Figure 11 Gating strategy. Peripheral blood and bone marrow sample were stainend with CD45-Pacific Blue (Biolegend) CD45R-PE-CF594 (BD Bioscience) and CD5-Alexa647 (Biolegend). Upper left panel depicts the sideward scatter vs. CD45 and allows gating of the lymphocyte population. Upper right panel depicts the GFP expression (in this case negative). The lower panels show the exemplary gating of B (right) and T cells (left) in the lymphocyte population.
4.9 SCID beige Xenograft mouse model To test different experimental therapies xenograft animal models are commonly used. In
this project human derived JVM3 cells are injected into SCID beige mice. The JVM3 cells
thereby are a model for malignant B cells while the SCID beige mice provide the growth
of the tumor.
Cell culture and injection
The JVM3 cells are expanded in Medium A according to the instructions of the DMSZ for
this cell line. For this experiment only JVM3 cells under passage number 12 (after receipt
from the DSMZ) were used for injection. The cells were washed twice with PBS, counted
and adjusted to 1x10⁸ cells/ml in PBS. The cell suspension then was injected within 1 h
subcutaneously into the right flank of 8 weeks old SCID beige mice (1x10⁷ cells per
mouse). After injection the tumor growth was checked every other day by caliper. The
tumorvolume was approximated with the following formula:

56
𝑉𝑜𝑙𝑢𝑚𝑒 ≈ 𝐿𝑒𝑛𝑔𝑡ℎ × (1
2× 𝑊𝑖𝑑𝑡ℎ2 )
Experimental therapy
The experimental treatment for each mouse was started individually when palpable and
evidently growing tumors with a volume of 50-100 mm3 were observed. The separation
into different treatment regimens was achieved by dice until each group contained the
desired number of individuals. For treatment the mice received an experimental drug
solved in sesame oil or the oil alone as vehicle control via intraperitoneal injection every
other day. The growth of the tumor was checked under treatment for 21 days every second
day as described earlier.
4.10 mRNA Expression array Human CLL cells (1x10⁷ cells/ml) were incubated for 24 h with DMSO, pNO-ASA and
mNO-ASA. After incubation the cells were washed and total RNA (Ribonucleic acid) was
isolated with the RNeasy Plus Kit (Qiagen, Hilden) after the manufacturer’s instructions.
The RNA was analyzed by ServiceXS B.V. (Leiden, Netherlands) using the Illumina
Human HT12 chips. Data analysis was performed with dChip software with the following
criteria p ≤ 0.05, foldchange ≤ 2.00 and difference of means ≤ 200.00. Genes considered
to be significantly altered were used for heatmap generation, the results are clustered by
treatment. Data annotation analysis of the significantly altered genes was performed with
the online tool DAVID (Database for Annotation, Visualization and Integrated Discovery)
(http://david.abcc.ncifcrf.gov/home.jsp).
4.11 Declarations All animal experiments were authorized by the local authorities (File No. 8.87-
50.10.37.09.299 &. 87-51.04.2010.A366). All material from human donors was acquired
according to the rules of the World Medical Association Declaration of Helsinki (6th
revision, Seoul, Southkorea, 2008) and were authorized by an ethics committee (No. 11-
319).
57
5 Results
5.1 The R26lef1 mouse strain
5.1.1 Development and founder mouse After transfection and selection of BRUCE4 stem cells the insertion of the target plasmid
into the ROSA26 locus was verified via southern-blot (performed by the Lab of Thomas
Wunderlich) and the inserted transgene LEF1 cDNA was sequenced from gDNA samples.
The results showed positive integration into the ROSA26 locus and 100% sequence
identity to CCDS3679.1. After injection of stem cells into blastocysts a total of six mice
with mixed background (hybrid generation) were born in February 2010. This hybrid
generation was crossed with C57BL/6 mice and transgene transmission was achieved in
one founder mouse in February 2011, confirmed by PCR for gfp, neo and cre. In the
following text R26lef1 refers to homo- or heterozygous mice carrying the transgenic LEF1
allel. Additional transgenic cre recombinase expression are either refered to as CMV-cre,
Cr2-cre or CD19wt/cre, of which only the latter discerns between heterozygous and
homozygous mice. In CD19wt/cre mice the Cre recombinase expression is controlled by the
CD19 promotor (pan-B cell), in Cr2-cre by the CD21 promotor (transitional B cells) and in
CMV-cre by the CMV promotor (ubiquitous).
5.1.2 Cre activity induces LEF1 overexpression To induce transgene expression R26lef1 mice were crossed with CD19wt/cre (pan-B cell),
CMV-cre (ubiquitous) and Cr2-cre (transitional B cells) mice, which express the cre
recombinase gene in different tissues and developmental stages. The activity of the Cre
recombinase was tested in R26lef1 CD19wt/cre mice and was first detected by expression
of the GFP reporter via FACS (see Figure 12). In average about 76% (Range: 94-35%,
n=30; 8 weeks) of the B220 positive cells in the peripheral blood were tested positive for
the reporter protein. This is an about 20% lower efficacy than it was described by Demircik
and coworkers for the CD19-cre strain (Demircik et al., 2013)
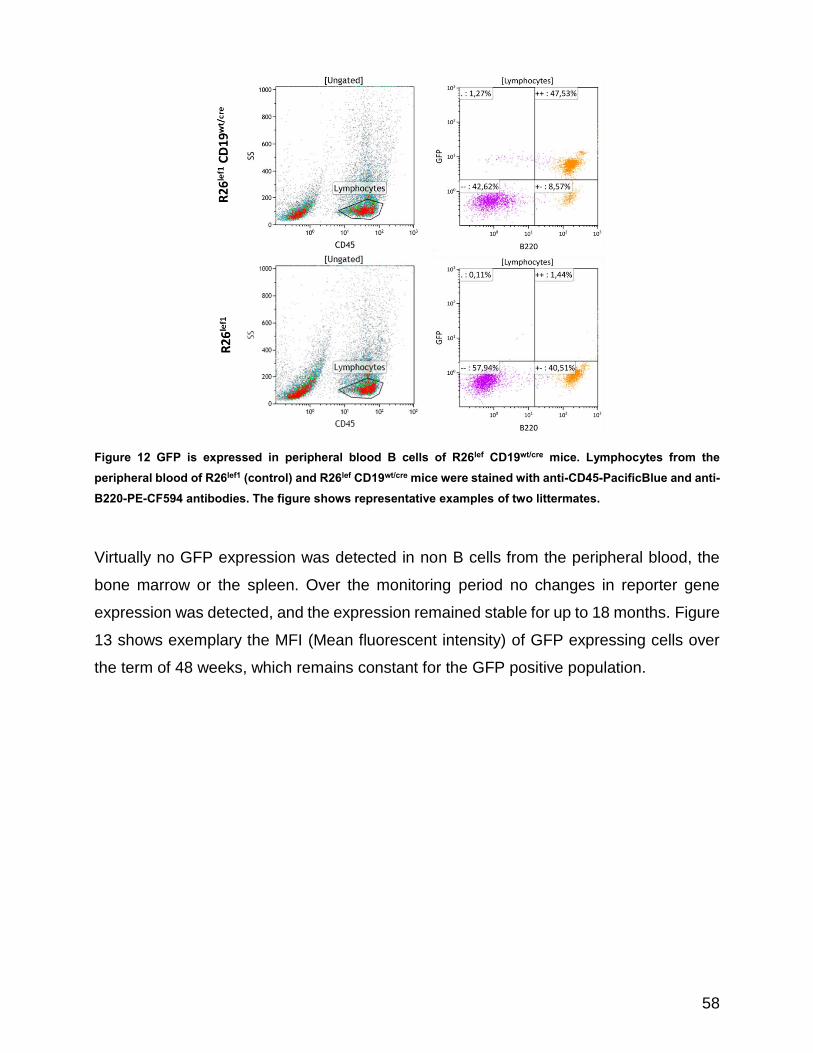
58
Figure 12 GFP is expressed in peripheral blood B cells of R26lef CD19wt/cre mice. Lymphocytes from the peripheral blood of R26lef1 (control) and R26lef CD19wt/cre mice were stained with anti-CD45-PacificBlue and anti-B220-PE-CF594 antibodies. The figure shows representative examples of two littermates.
Virtually no GFP expression was detected in non B cells from the peripheral blood, the
bone marrow or the spleen. Over the monitoring period no changes in reporter gene
expression was detected, and the expression remained stable for up to 18 months. Figure
13 shows exemplary the MFI (Mean fluorescent intensity) of GFP expressing cells over
the term of 48 weeks, which remains constant for the GFP positive population.

59
Figure 13 Exemplary reporter GFP expression remains stable over 48 weeks. The mean fluorescence intensity of GFP expressing cells in lymphocyte population of mouse 678 (R26lef1 CD19wt/cre) was measured via flow cytometry after 16, 32 and 48 weeks.
In R26lef1 CMV-cre mice the pattern of GFP expressing cells was substantially different.
In average 50.7% (Range: 22.0-78.5%, n = 20; 8 weeks) of the lymphocytes expressed
the reporter protein. The average percentage of positive cells in eight week old mice was
60.0% in the B cell (Range: 24.2-97.0%) and 36% in the T cell population (Range: 10.3-
77.4%) (data not shown).
The GFP expression in the peripheral blood of R26lef1 Cr2-cre mice was restricted to B220
positive B cells. Of the B220 positive cells approximately 80% (n = 6; 40 weeks) expressed
GFP.
To test whether Cre activity also induces LEF1 expression in isolated B cells from the
spleen was tested by immunoblot analysis. Figure 14 shows exemplary results for animals
from two different litters at the age of two and five month. In both cases LEF1 was
overexpressed in the R26lef1 CD19wt/cre strain when compared to R26lef1 mice, which
served as control (see Figure 14).
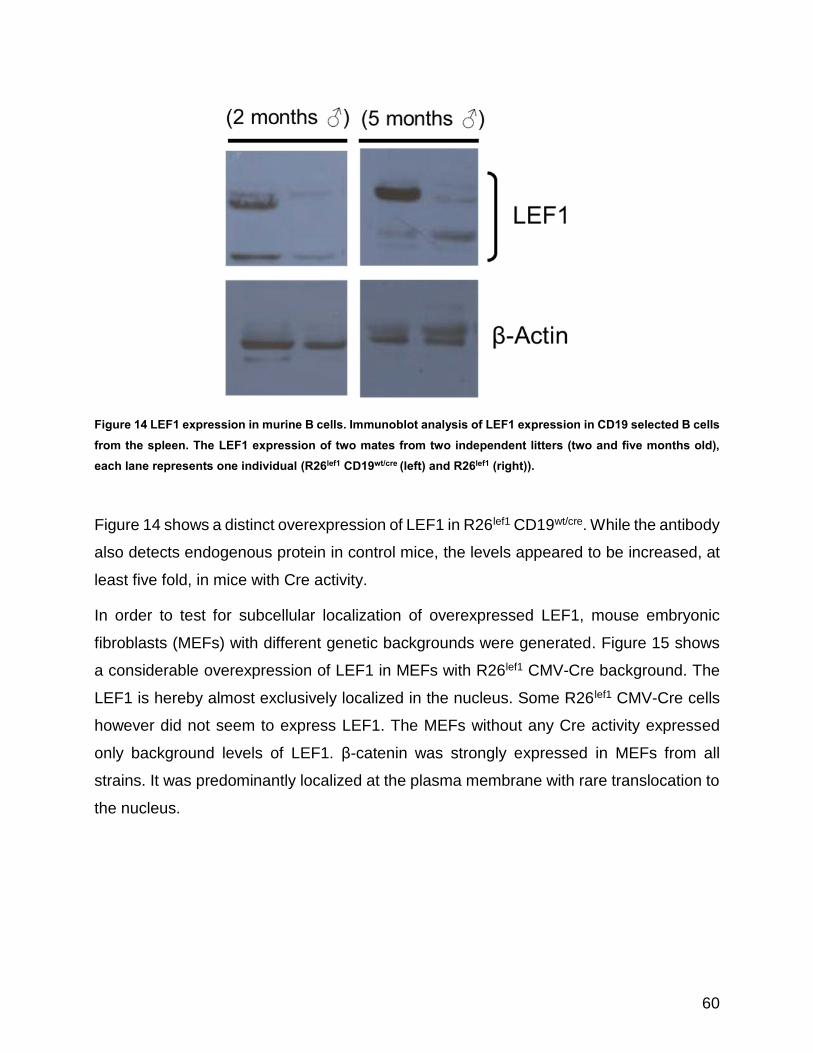
60
Figure 14 LEF1 expression in murine B cells. Immunoblot analysis of LEF1 expression in CD19 selected B cells from the spleen. The LEF1 expression of two mates from two independent litters (two and five months old), each lane represents one individual (R26lef1 CD19wt/cre (left) and R26lef1 (right)).
Figure 14 shows a distinct overexpression of LEF1 in R26lef1 CD19wt/cre. While the antibody
also detects endogenous protein in control mice, the levels appeared to be increased, at
least five fold, in mice with Cre activity.
In order to test for subcellular localization of overexpressed LEF1, mouse embryonic
fibroblasts (MEFs) with different genetic backgrounds were generated. Figure 15 shows
a considerable overexpression of LEF1 in MEFs with R26lef1 CMV-Cre background. The
LEF1 is hereby almost exclusively localized in the nucleus. Some R26lef1 CMV-Cre cells
however did not seem to express LEF1. The MEFs without any Cre activity expressed
only background levels of LEF1. β-catenin was strongly expressed in MEFs from all
strains. It was predominantly localized at the plasma membrane with rare translocation to
the nucleus.

61
Figure 15 LEF1 expression in MEFs. Immunofluorescence analysis of murine embryonic fibroblasts (MEFs). MEFs from an R26lef1 and from an R26lef1 CMV-Cre were fixed and stained for LEF1 (anti-LEF1 (C12A5)) and β-catenin (anti-β-catenin (14)) and with the corresponding secondary antibodies anti-rabbit DyLight647 and anti-mouse Cy3. Pictures show the exemplary results from two siblings.

62
5.1.3 WNT activation leads to increases number of cells with nuclear Axin2 To test whether the transgene influences the WNT signaling pathway
immunofluorescence staining of MEFs with R26lef1CMV-cre background were prepared.
This experiment was conducted to clarify if artificial LEF1 expression affects the
subcellular localization of Axin2. This was tested in unstimulated as well as in MEFs
stimulated with the WNT activator LiCl. Figure 16 shows the exemplary expression of
LEF1 and Axin2 in this model. Cells that were regarded as positive for LEF1 expression
are indicated with arrows.
Figure 16 LEF1 and Axin2 expression in R26lef1 CMV-cre MEFs treated with 20 mM LiCl for 16 h. MEFs with R26lef1 CMV-cre background were cultivated for 24 h on glass slides. Then the cells were treated with 20 mM LiCl for 16 h. After the treatment period cells were fixed with PFA and stained for LEF1 (C12A5) and Axin2 (M20). As secondary antibodies anti-rabbit DyLight647 and anti-mouse Cy3 were used. Arrows indicate LEF1 expressing cells with nuclear Axin2. Arrows indicate two exemplary cells with transgenic LEF1 expression and nuclear localization of Axin2.

63
Figure 16 shows a distinct localization pattern of Axin2 in LEF1 overexpressing cells. In
the absence of any stimulation of the WNT signaling pathway, few cells had detectable
nuclear Axin2. A strong WNT stimulation by LiCl treatment increased the total abundance
of cells with nuclear Axin2. The total difference in number between both genotypes
remained comparable between treated and untreated cells. Figure 17 shows the number
of cells that exhibit nuclear Axin2 in dependence on LiCl treatment and LEF1 expression.
Figure 17 Analysis of Axin2 subcellular localization in MEFs. MEFs from three different individuals with R26lef1 CMV-cre background were cultivated on glass slides for 24 h prior treatment. After 16 h of treatment with 20 mM of LiCl the cells were fixed and stained for LEF1 (C12A5), Axin2 (M20) and DAPI. As secondary antibodies anti-rabbit DyLight647 and anti-mouse Cy3 were used. Nuclei with distinct LEF1 and Axin2 expression like in Figure 16 indicated by arrows were considered as LEF1 positive cells with nuclear Axin2.
As expected LiCl increased WNT stimulation the percentage of cells with nuclear Axin2 in
LEF1 positive and negative cells. The percentage rose in LEF+ cells from 25.4% to 58.3%
and in LEF1- cells from 2.7% to 28.1%. Therefore both groups showed an increase of
about 23%. The percentage of cells with nuclear Axin2 was increased in LEF1
overexpressing cells, with 24.4% vs. 2.7% in untreated and 58.3 vs. 28.1% in LiCl treated
samples.
5.2 Phenotype of R26lef1 CD19wt/cre mice The R26lef1 CD19wt/cre was created by mating the founder mouse of the R26lef1 strain with
CD19wt/cre mice (a gift from Dr. Nina Reinart, University of Cologne) and became the first
Control
LEF1+ LEF-0
50
100n = 59 n = 37
[%]
20 mM LiCl
LEF+ LEF-0
50
100 Nuclear
Non nuclear
n = 187 n = 64

64
strain with transgenic LEF1 expression. For all following experiments heterozygous
CD19wt/cre mice, confirmed by PCR, were used, since homozygous mice have severe
defects in their B cell development (Rickert et al., 1995). The mice for the subsequent
experiments were bred from April 2011 to July 2012. A total of 65 R26lef1 and 58 R26lef1
CD19wt/cre mice were monitored for a mean period of 11.89 and 12.72 months respectively
(see Table 23). The transgene expressing mice population showed a slight bias towards
males, whereas the control population was nearly balanced.
Table 23 Population statistics and disease related deaths (animals sacrifized for experiments excluded) of R26lef1 and R26lef1 CD19wt/cre mice.
During the monitoring period 18.5% of the control and 34.5% R26lef1 CD19wt/cre mice died
of disease (Table 23). While skin and infectious diseases were almost equally distributed,
there appeared to be a bias in neoplastic events for the R26lef1 CD19wt/cre population. Here,
six times more animals showed neoplasia when compared with the control population.

65
These solid tumors occurred mostly in the liver (4 cases), followed by the gut (2 cases)
and one was localized in muscle tissue. Three of these tumors were tested for lymphocyte
infiltration via FACS analysis, which neither showed. Also the deaths with unknown
reasons showed a bias towards R26lef1 CD19wt/cre mice. The majority of these mice most
likely died due to infectious diseases or undetected neoplastic events. During the whole
monitoring period only one leukemic event occurred. Mouse 550 (R26lef1) developed T
cell leukemia with onset after 14 months (see Table 23). Nevertheless both populations
showed comparable survival (see Figure 18).
Survival
0 200 400 600 8000
50
100
150R26
lef1
R26lef1
CD19wt/cre
Time [days]
Perc
ent s
urvi
val
Figure 18 Kaplan-Meyer curve of R26lef1 and R26lef1 CD19wt/cre mice. For this Kaplan-Meyer curve only mice which died from diseases were defined as event of death. R26lef1 CD19wt/cre (n = 58), R26lef1 (n = 65)
The Kaplan-Meyer curve however shows no significant difference in survival between both
populations. Until day 400 the course of both survival curves is nearly identical. In the
remaining period only small differences are visible, with a possible better survival of
control mice, which is however not significant.
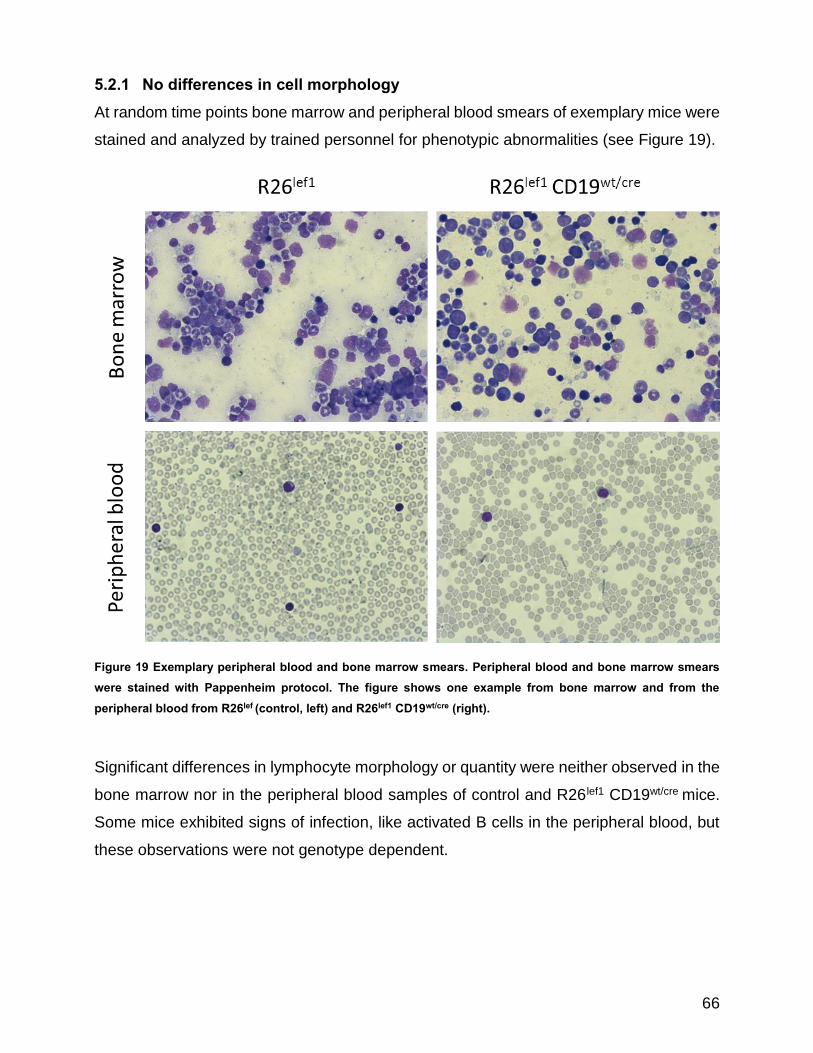
66
5.2.1 No differences in cell morphology At random time points bone marrow and peripheral blood smears of exemplary mice were
stained and analyzed by trained personnel for phenotypic abnormalities (see Figure 19).
Figure 19 Exemplary peripheral blood and bone marrow smears. Peripheral blood and bone marrow smears were stained with Pappenheim protocol. The figure shows one example from bone marrow and from the peripheral blood from R26lef (control, left) and R26lef1 CD19wt/cre (right).
Significant differences in lymphocyte morphology or quantity were neither observed in the
bone marrow nor in the peripheral blood samples of control and R26lef1 CD19wt/cre mice.
Some mice exhibited signs of infection, like activated B cells in the peripheral blood, but
these observations were not genotype dependent.
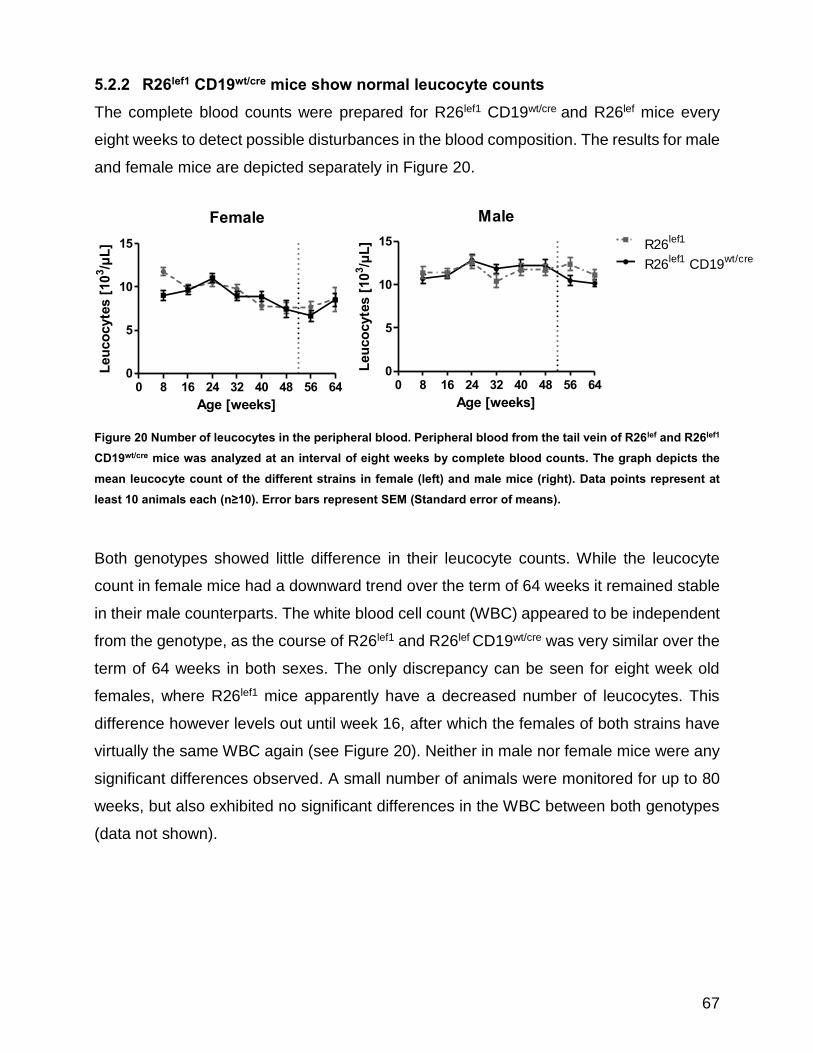
67
5.2.2 R26lef1 CD19wt/cre mice show normal leucocyte counts The complete blood counts were prepared for R26lef1 CD19wt/cre and R26lef mice every
eight weeks to detect possible disturbances in the blood composition. The results for male
and female mice are depicted separately in Figure 20.
Figure 20 Number of leucocytes in the peripheral blood. Peripheral blood from the tail vein of R26lef and R26lef1 CD19wt/cre mice was analyzed at an interval of eight weeks by complete blood counts. The graph depicts the mean leucocyte count of the different strains in female (left) and male mice (right). Data points represent at least 10 animals each (n≥10). Error bars represent SEM (Standard error of means).
Both genotypes showed little difference in their leucocyte counts. While the leucocyte
count in female mice had a downward trend over the term of 64 weeks it remained stable
in their male counterparts. The white blood cell count (WBC) appeared to be independent
from the genotype, as the course of R26lef1 and R26lef CD19wt/cre was very similar over the
term of 64 weeks in both sexes. The only discrepancy can be seen for eight week old
females, where R26lef1 mice apparently have a decreased number of leucocytes. This
difference however levels out until week 16, after which the females of both strains have
virtually the same WBC again (see Figure 20). Neither in male nor female mice were any
significant differences observed. A small number of animals were monitored for up to 80
weeks, but also exhibited no significant differences in the WBC between both genotypes
(data not shown).
Female
0 8 16 24 32 40 48 56 640
5
10
15
Age [weeks]
Leuc
ocyt
es [1
03 /µL]
Male
0 8 16 24 32 40 48 56 640
5
10
15 R26lef1
R26lef1
CD19wt/cre
Age [weeks]
Leuc
ocyt
es [1
03 /µL]

68
5.2.3 Decreased percentage of B cells in the PB of R26lef1 CD19wt/cre mice
While leucocyte counts did not reveal any changes in the blood composition between the
two genotypes, the percentage of B cells in the lymphocyte population in the peripheral
blood appears to be altered. The mean percentage of B cells in the peripheral blood of
R26lef1 CD19wt/cre mice was at all-time points, except one, lower compared to R26lef1 mice.
This trend was more pronounced in male mice where the percentage of B cells was
significantly reduced at 32, 48 and 72 weeks (see Figure 21). In female mice the difference
was only significant at 72 weeks.
Figure 21 Percentage of B cells in the lymphocyte fraction of the peripheral blood of males and females. Every 8 weeks blood was collected from the tail vein of R26lef1 CD19wt/cre and their R26lef1 littermates. Cells were stained for lymphocytes (CD45 subpopulation), B cells (Lymphocytes & B220) and T cells (Lymphocytes & CD5). The figure shows the mean percentage of B cells in the lymphocyte population, each data point represents 3-24 individuals. Error bars represent SEM. *p≤0.05, **p≤0.01, ***p≤0.001 calculated by independent two-sided student’s t-test.
Since the percentage of B cells in the lymphocyte population from the peripheral blood is
not significantly different between male and female mice (data not shown) the following
figure shows the results for the combined results for both sexes each of each strain.
Female
0 8 16 24 32 40 48 56 64 720
20
40
60
80
*
Age [weeks]
B c
ells
[%]
Male
0 8 16 24 32 40 48 56 64 720
20
40
60
80
*** *R26
lef1
R26lef1
CD19wt/cre
*
Age [weeks]

69
0 8 16 24 32 40 48 56 64 720
20
40
60
80
**** ** * *
R26lef1
CD19wt/cre
R26lef1
Age [weeks]
B c
ells
[%]
Figure 22 Percentage of B cells in the lymphocyte fraction of the peripheral blood combined sexes. Every 8 weeks blood was collected from the tail vein of R26lef1 CD19wt/cre and their R26lef1 littermates. Cells were stained for lymphocytes (CD45 subpopulation), B cells (Lymphocytes & B220) and T cells (Lymphocytes & CD5). The figure shows the mean percentage of B cells in the lymphocyte population. Error bars represent SEM. *p≤0.05, **p≤0.01, ***p≤0.001 calculated by independent two-sided student’s t-test. Each data point represents 13-52 individuals.
Figure 22 shows a highly significant trend towards a reduced number of B cells in the
lymphocyte fraction of the peripheral blood in R26lef1 CD19wt/cre mice. The reduction is
significant at 16 (nlef1=14 vs. nlef1 CD19cre=52), 32 (nlef1=44 vs. nlef1 CD19cre=17), 48 (nlef1=35
vs. nlef1 CD19cre=18), 64 (nlef1=37 vs. nlef1 CD19cre=25) and 72 (nlef1=18 vs. nlef1 CD19cre=16)
weeks of age. The mean reduction over the whole monitoring period is 6.73% (95%
confidence limits: 3.23-10.22%).
5.2.4 The percentage of B cells is reduced in the spleen and in the BM Additionally to the percentage of B220 positive cells in the lymphocyte fraction of the
peripheral blood the B cell content of the spleen and the bone marrow was determined by
FACS based analysis. The percentage of B cells in the bone marrow and in the spleen
was significantly different between age and sex matched R26lef1 and R26lef1 CD19wt/cre
mice (see Figure 23).

70
Bone marrow
R26lef1 R26lef1 CD19wt/cre0
10
20
30p=0.028
B22
0 po
sitiv
e ce
lls [%
]Spleen
R26lef1 R26lef1 CD19wt/cre0
20
40
60
80
100p=0.0011
B22
0 po
sitiv
e ce
lls [%
]
Figure 23 Percentage of B cells in spleen and bone marrow. Cells from the spleen and the bone marrow of age and sex matched R26lef1 and R26lef1 CD19wt/cre mice were analyzed via FACS for their percentage of B cells (B220 positive). For the bone marrow percentage of B220 cells is given compared to all CD45 positive cells. In the spleen the percentage of B220 positive cells in the CD45 positive lymphocyte population was analyzed. The scatter plot shows mean and standard error of mean (whiskers). The included samples are age and sex matched individuals (Bone marrow n=15, Spleen n=19), statistical analysis was performed via two-tailed student’s t test. Error bars represent SEM.
The percentage of B cells was reduced in the bone marrow by 2.2% and about 5% in the
spleen (see Figure 23). The differences were significant in both organs. To test whether
these changes were due to induction of apoptosis the percentage of Annexin V negative
B cells was measured in the bone marrow.

71
Bone marrow
R26lef1 R26lef1 CD19wt/cre0
20
40
60
80
100
Anne
xin
V n
egat
ive
B c
ells
[%]
Figure 24 Annexin V negative B cells from the bone marrow. Bone marrow samples were collected from freshly sacrificed R26lef1 and R26lef1 CD19wt/cre mice (each five age and sex matched individuals (n=5)). The samples were stained with CD45, B220 and Annexin V and subsequently analyzed via FACS. The Figure shows mean percentage of Annexin V negative B220 positive cells. Error bars represent SEM
Figure 24 shows the percentage of B cells without the apoptotic marker Annexin V. No
significant difference was detected, but B cells from R26lef CD19wt/cre mice showed less
often Annexin V positive B cells (average Annexin V negative B cells: 58.32% (control)
vs. 64.20% (R26lef1 CD19wt/cre); n =5).
5.2.5 WNT signaling inhibits the proliferation of B cells from the spleen The R26lef1 CD19wt/cre mice showed a significantly reduced percentage of B cells in the
bone marrow, the peripheral blood and in the spleen. It was tested whether this difference
might be due to an inhibition of proliferation. Lymphocytes were isolated and proliferation
was induced by stimulation with LPS, additionally the influence of different WNT proteins
and LiCl were tested. Figure 25 shows the induction of proliferation of the B cells by
genotype after 48 h (R26lef with or without CD19wt/cre). The graph clearly shows a
proliferation of cells which were stimulated with LPS alone (uncolored bars) with a slightly
higher induction in R26lef CD19wt/cre mice. The addition of WNT3a, WNT5b and WNT11
had no visible impact on proliferation of LPS stimulated cells. WNT10b and LiCl however
reduced significantly the proliferation of the B cells both tested genotypes in a similar
range. The addition of LiCl nearly abrogated the proliferation.

72
The induction of proliferation in samples not stimulated with LPS remained low. WNT10b
appeared to induce proliferation, but this might be an artifact since the addition also
reduced survival (see Figure 26).
Figure 25 Influence of WNT modulation on proliferation of B cells from the spleen. Lymphocytes from the spleens of R26lef1 or R26lef1 CD19wt/cre were isolated via Ficoll gradient centrifugation and stained with 5 µM/ml CellTrace Violet™ (Invitrogen) for 5 minutes. Afterwards the cells were washed 3x with RPMI + 10% FCS and seeded out at 2x10⁶/ml. The WNT modulators WNT3a (0.4 µg/ml), WNT5b (1 µg/ml), WNT10b (1 µg/ml), WNT11 (1 µg/ml) and LiCl (50 mM) were added alone or with 10 µg/ml LPS. Analysis was performed after 48 h of incubation via flow cytometry via MFI of B220 positive cells. All results were normalized to untreated control (100%). Figure shows average of four control (R26lef1 n=6) and six (R26lef1 CD19wt/cre n=6) experiments, except for LiCl (n=3). Error bars represent SEM.
The survival of the B cells appeared to be unaffected by stimulation with WNT3a, WNT11
and LiCl in samples without LPS, while WNT5b and WNT10b apparently reduced it. The
reduction of cell survival might in part explain the data of Figure 25, since the used cell
dye (CellTrace violet ®, Invitrogen) appears to have bleached in dead cells. The mean
survival after 48 h without LPS stimulation was 26.5% in control and 35.18% in B cells
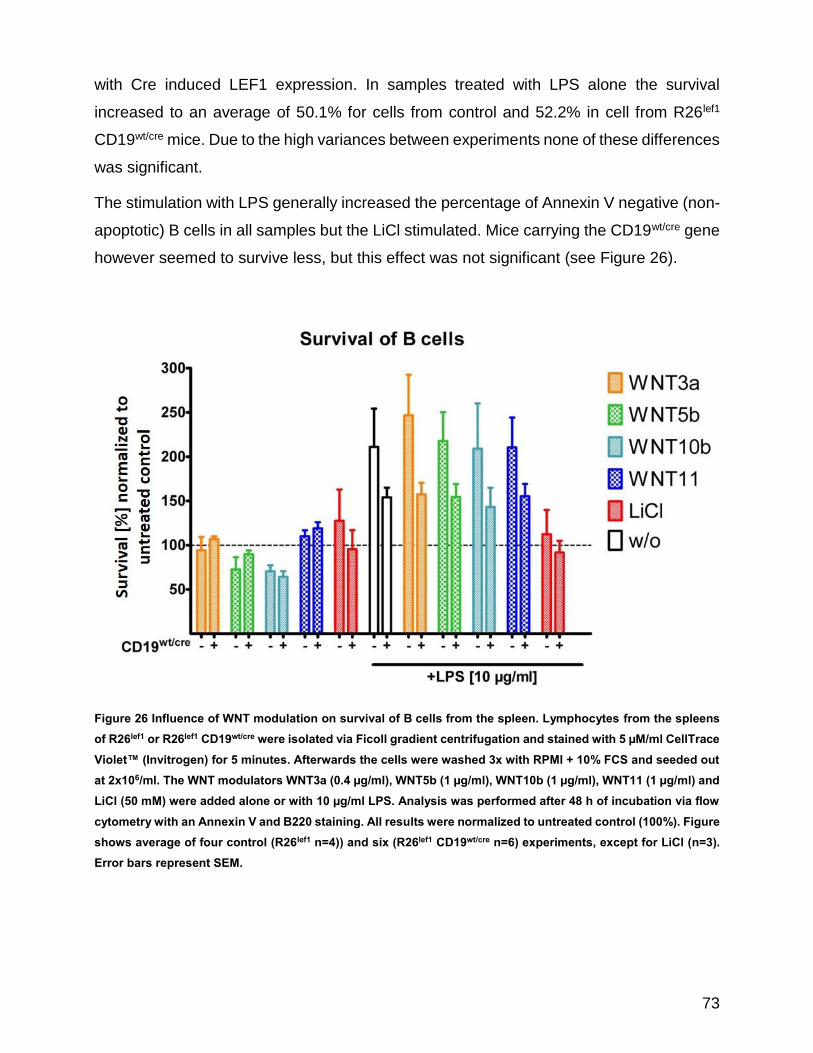
73
with Cre induced LEF1 expression. In samples treated with LPS alone the survival
increased to an average of 50.1% for cells from control and 52.2% in cell from R26lef1
CD19wt/cre mice. Due to the high variances between experiments none of these differences
was significant.
The stimulation with LPS generally increased the percentage of Annexin V negative (non-
apoptotic) B cells in all samples but the LiCl stimulated. Mice carrying the CD19wt/cre gene
however seemed to survive less, but this effect was not significant (see Figure 26).
Figure 26 Influence of WNT modulation on survival of B cells from the spleen. Lymphocytes from the spleens of R26lef1 or R26lef1 CD19wt/cre were isolated via Ficoll gradient centrifugation and stained with 5 µM/ml CellTrace Violet™ (Invitrogen) for 5 minutes. Afterwards the cells were washed 3x with RPMI + 10% FCS and seeded out at 2x10⁶/ml. The WNT modulators WNT3a (0.4 µg/ml), WNT5b (1 µg/ml), WNT10b (1 µg/ml), WNT11 (1 µg/ml) and LiCl (50 mM) were added alone or with 10 µg/ml LPS. Analysis was performed after 48 h of incubation via flow cytometry with an Annexin V and B220 staining. All results were normalized to untreated control (100%). Figure shows average of four control (R26lef1 n=4)) and six (R26lef1 CD19wt/cre n=6) experiments, except for LiCl (n=3). Error bars represent SEM.

74
Also the influence of different WNT modulators on B220 positive cells in the bone marrow
was tested. The results of Figure 27 show an increased proliferation response to LPS
stimulation.
Figure 27 Influence of WNT modulation on proliferation of B cells from the bone marrow. Lymphocytes from the spleens of R26lef1 or R26lef1 CD19wt/cre were isolated via Ficoll gradient centrifugation and stained with 5 µM/ml CellTrace Violet™ (Invitrogen) for 5 minutes. Afterwards the cells were washed 3x with RPMI + 10% FCS and seeded out at 2x10⁶/ml. The WNT modulators WNT3a (0.4 µg/ml), WNT5b (1 µg/ml), WNT10b (1 µg/ml), WNT11 (1 µg/ml) and LiCl (50 mM) were added alone or with 10 µg/ml LPS. Analysis was performed after 48 h of incubation via flow cytometry via MFI of B220 positive cells. All results were normalized to untreated control (=100%). Figure shows average of three control (R26lef1 n=3) and three (R26lef1 CD19wt/cre n=3) age and sex matched individuals. Error bars represent SEM.
Whereas few unstimulated cells proliferated, the LPS treated B220 positive cells of R26lef1
CD19wt/cre mice showed a distinct proliferative response. It was higher in all LPS treated
samples compared with the control animals, but differed only slightly between when
additionally treated with WNT modulators. No significant difference between the
genotypes was detected.

75
5.2.6 No significant impact of LiCl treatment in vivo
In order to test the influence of active WNT signaling on the B cell population in vivo, three
age and sex matched individuals from both genotypes were subjected to LiCl treatment
to inhibit GSK3 and subsequently to activate the WNT signaling pathway. The treatment
of mice with 300 mg/ml LiCl in the drinking water induced no significant changes in the
percentage of B cells (see Figure 28). The normalized results show a slight reduction of
the percentage of B cells in R26lef1 CD19wt/cre mice, but this was not significant. This effect
might be due to a nearly complete lymphopenia (≈7% lymphocytes in WBC) in one
individual of this group. The mouse died after weeks 5 of treatment for unknown reasons.
Figure 28 In vivo LiCl treatment. Ten month old R26lef1 (n=3) and R26lef CD19wt/cre (n=3) mice were treated with 300 mg/L LiCl in the drinking water ad. libitum for four weeks. Four weeks before treatment and after two and four weeks after treatment begin peripheral blood was collected from the tail vein and analyzed via flow cytometry (left) and complete blood count (right). Cells were stained for lymphocytes (CD45 subpopulation), B cells (Lymphocytes & B220) and T cells (Lymphocytes & CD5). The figures show the mean percentage of B cells or leucocyte count for each genotype normalized to pretreatment situation. Error bars represent SEM.
The WBC of the LiCl treated mice in both groups exceeded after two weeks the
pretreatment situation. Since the B cell fraction remains stable, this increase is likely due
to expansion of non B cells. After 4 weeks the mean WBC dropped under the pretreatment
level (see Figure 28). This effect appeared to be genotype independent. In one mouse
(Mouse 660, R26lef1 CD19wt/cre) the lymphocyte population decreased rapidly in the four
weeks of treatment. The mouse became weak, immobile and dehydrated and was
sacrificed for ethical reasons after the fourth week of treatment.
WBC
0
50
100
150
200
2 weeks 4 weeks
Whi
te b
lood
cel
l cou
ntno
rmal
ized
to p
retr
eate
d [1
00%
] Percentage of B cells
0
50
100
150
2 weeks 4 weeks
R26lef1
R26lef1
CD19wt/cre
Perc
enta
ge o
f B c
ells
norm
aliz
ed to
pre
trea
ted
[100
%]
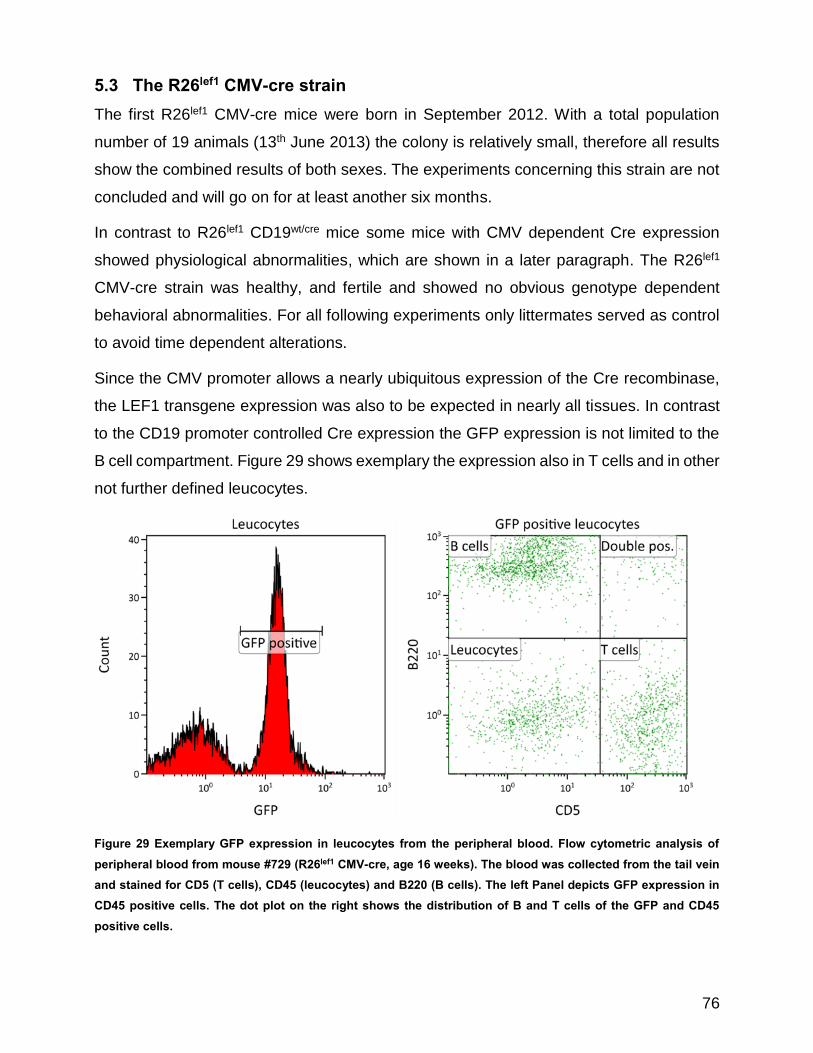
76
5.3 The R26lef1 CMV-cre strain The first R26lef1 CMV-cre mice were born in September 2012. With a total population
number of 19 animals (13th June 2013) the colony is relatively small, therefore all results
show the combined results of both sexes. The experiments concerning this strain are not
concluded and will go on for at least another six months.
In contrast to R26lef1 CD19wt/cre mice some mice with CMV dependent Cre expression
showed physiological abnormalities, which are shown in a later paragraph. The R26lef1
CMV-cre strain was healthy, and fertile and showed no obvious genotype dependent
behavioral abnormalities. For all following experiments only littermates served as control
to avoid time dependent alterations.
Since the CMV promoter allows a nearly ubiquitous expression of the Cre recombinase,
the LEF1 transgene expression was also to be expected in nearly all tissues. In contrast
to the CD19 promoter controlled Cre expression the GFP expression is not limited to the
B cell compartment. Figure 29 shows exemplary the expression also in T cells and in other
not further defined leucocytes.
Figure 29 Exemplary GFP expression in leucocytes from the peripheral blood. Flow cytometric analysis of peripheral blood from mouse #729 (R26lef1 CMV-cre, age 16 weeks). The blood was collected from the tail vein and stained for CD5 (T cells), CD45 (leucocytes) and B220 (B cells). The left Panel depicts GFP expression in CD45 positive cells. The dot plot on the right shows the distribution of B and T cells of the GFP and CD45 positive cells.

77
On average 55.9% of all leucocytes were tested positive for the reporter (n = 16; 8 weeks)
(data not shown). The GFP expression is quite variable in the different subpopulations
(see Figure 30).
Peripheral blood
Leuco
cytes
B cells
T cells
0
20
40
60
80G
FP p
ositi
ve c
ells
[%]
Figure 30 Percentage of GFP positive cells in peripheral blood subpopulations. Peripheral blood from R26lef1 CMV-cre mice (8 weeks old, n = 14) was analyzed via flow cytometry. Cells were stained for leucocytes (CD45), B cells (CD45, B220) and T cells (CD45, CD5). The plot shows the mean percentage of GFP positive cells in each subpopulation. Error bars represent SEM.
The Cre induced recombination and subsequent expression of GFP was reasonably
effective for white blood cells in the R26lef1 CMV-cre strain, however there were
differences between different subpopulations (see Figure 30). The ration of the mean GFP
positive cells was 58.5% for leucocytes, 69.8% for B cells and 45.5% for T cells (n = 16;
8 weeks). Therefore the recombination efficiency was lower in B cells for this strain when
compared to R26lef CD19wt/cre mice (69.8% vs 76.0%).

78
5.3.1 Trend towards reduced percentage of B cells in the peripheral blood Independent of the transgene expression the leucocyte count was not significantly
affected in the peripheral blood of R26lef1 CMV-cre mice when compared to control
littermates (see Figure 31).
Peripheral blood
0 8 16 24 32 400
5
10
15R26
lef1
R26lef1
CMV-cre
Weeks
Leuc
ocyt
es [1
03 /µL]
Figure 31 Number of leucocytes in the peripheral blood. Blood from the tail vein of R26lef1 and R26lef1 CMV-cre mice was collected every 8 weeks and analyzed with COULTER® Ac·T diff2™. The results show mean leucocyte counts for each strain. Each data points represents 3-29 individuals. Error bars represent SEM.
Similar to the R26lef1 CD19wt/cre strain the R26lef1 CMV-cre showed a trend towards
reduced percentage of B cells in the lymphocyte population of the peripheral blood.
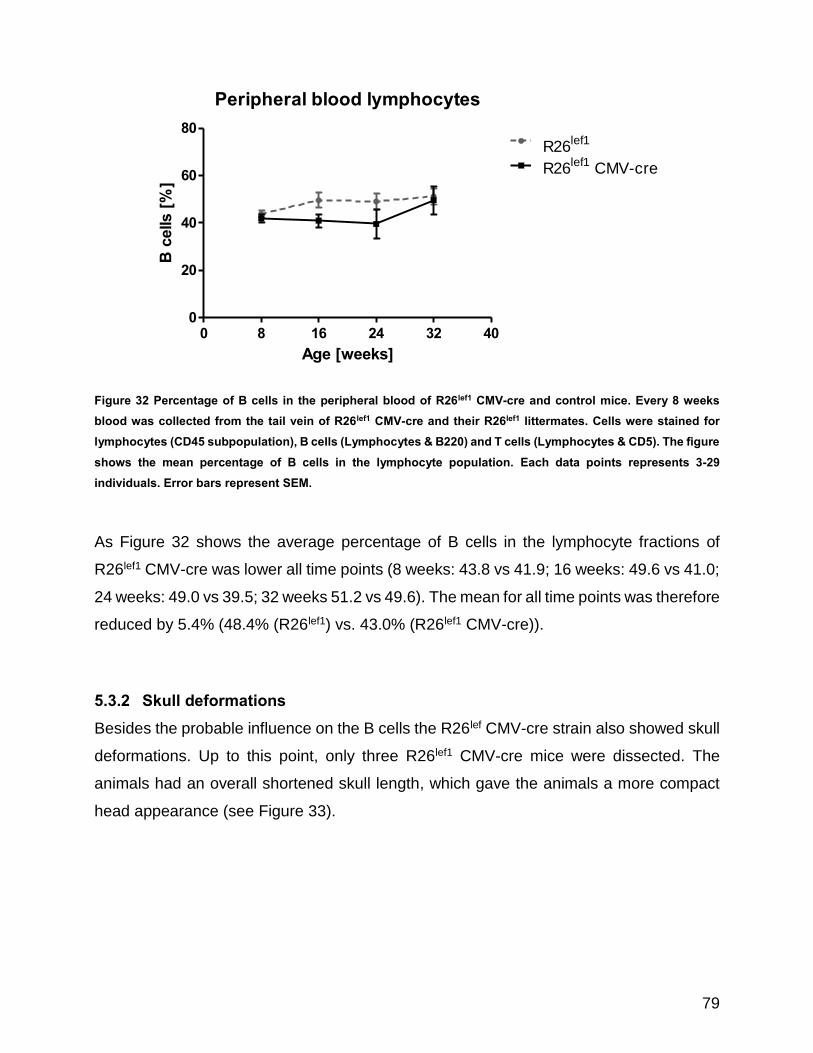
79
Peripheral blood lymphocytes
0 8 16 24 32 400
20
40
60
80R26
lef1
R26lef1
CMV-cre
Age [weeks]
B c
ells
[%]
Figure 32 Percentage of B cells in the peripheral blood of R26lef1 CMV-cre and control mice. Every 8 weeks blood was collected from the tail vein of R26lef1 CMV-cre and their R26lef1 littermates. Cells were stained for lymphocytes (CD45 subpopulation), B cells (Lymphocytes & B220) and T cells (Lymphocytes & CD5). The figure shows the mean percentage of B cells in the lymphocyte population. Each data points represents 3-29 individuals. Error bars represent SEM.
As Figure 32 shows the average percentage of B cells in the lymphocyte fractions of
R26lef1 CMV-cre was lower all time points (8 weeks: 43.8 vs 41.9; 16 weeks: 49.6 vs 41.0;
24 weeks: 49.0 vs 39.5; 32 weeks 51.2 vs 49.6). The mean for all time points was therefore
reduced by 5.4% (48.4% (R26lef1) vs. 43.0% (R26lef1 CMV-cre)).
5.3.2 Skull deformations Besides the probable influence on the B cells the R26lef CMV-cre strain also showed skull
deformations. Up to this point, only three R26lef1 CMV-cre mice were dissected. The
animals had an overall shortened skull length, which gave the animals a more compact
head appearance (see Figure 33).
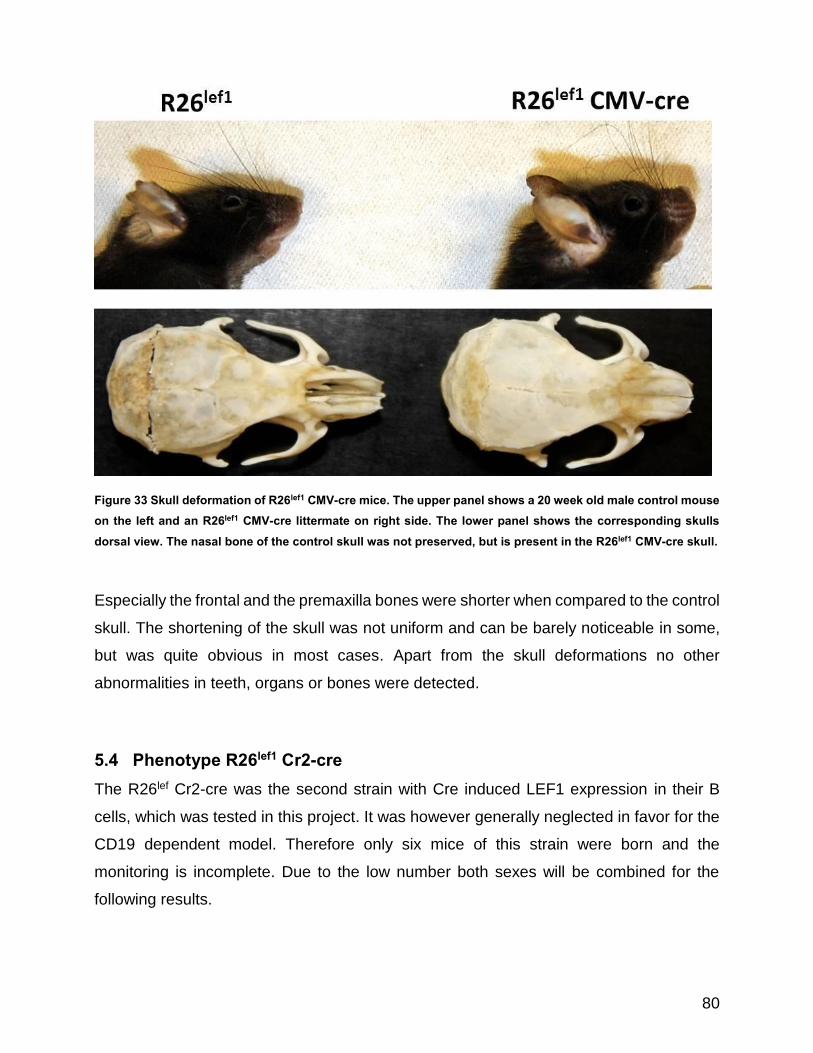
80
Figure 33 Skull deformation of R26lef1 CMV-cre mice. The upper panel shows a 20 week old male control mouse on the left and an R26lef1 CMV-cre littermate on right side. The lower panel shows the corresponding skulls dorsal view. The nasal bone of the control skull was not preserved, but is present in the R26lef1 CMV-cre skull.
Especially the frontal and the premaxilla bones were shorter when compared to the control
skull. The shortening of the skull was not uniform and can be barely noticeable in some,
but was quite obvious in most cases. Apart from the skull deformations no other
abnormalities in teeth, organs or bones were detected.
5.4 Phenotype R26lef1 Cr2-cre The R26lef Cr2-cre was the second strain with Cre induced LEF1 expression in their B
cells, which was tested in this project. It was however generally neglected in favor for the
CD19 dependent model. Therefore only six mice of this strain were born and the
monitoring is incomplete. Due to the low number both sexes will be combined for the
following results.

81
5.4.1 General description The R26lef1 Cr2-cre strain is healthy and fertile. The GFP expression is restricted to B cells
with an average recombination efficiency of 85% (n=6) (see Figure 34).
Figure 34 GFP expression in R26lef1 Cr2-cre mice is restricted to B220 positive B cells. Exemplary flow cytometric analysis of peripheral blood of an R26lef1 Cr2-cre mouse. Blood cells were stained for CD45, CD5 & B220. The figure shows the GFP versus the B220 signal in the lymphocyte fraction of the peripheral blood.
The peripheral blood was only monitored from week 40 to 72 in five animals (see Figure
35 & Figure 36). Cr2 dependent LEF1 expression had no significant impact on leucocyte
number in the peripheral blood.
Peripheral blood
40 48 56 640
5
10
15
R26lef1
Cr2-cre
R26lef1
Age [weeks]
Leuc
ocyt
es [1
03 /µL]

82
Figure 35 Number of leucocytes in the peripheral blood of R26lef1 Cr2-cre mice. Blood from the tail vein of six R26lef1 Cr2-cre mice (n=6) and their R26lef1 (n=6) littermates (sex matched) was collected at the indicated time points and analyzed with COULTER® Ac·T diff2™. The results show mean leucocyte counts for each strain, error bars represent SEM.
The percentage of B cells in the lymphocyte fraction of the peripheral runs parallel to the
R26lef1 control mice (see Figure 36). Overall no significant differences to the control mice
were observed.
Peripheral blood lymphocytes
40 48 56 64 720
20
40
60
R26lef1
Cr2-cre
R26lef1
Age [weeks]
B c
ells
[%]
Figure 36 Percentage of B cells in the peripheral blood of R26lef1 Cr2-cre and control mice. From week 40 to week 72 blood was collected from the tail vein of six R26lef1 Cr2-cre (n=6) and their R26lef1 (n=6) littermates. Cells were stained for lymphocytes (CD45 subpopulation), B cells (Lymphocytes & B220) and T cells (Lymphocytes & CD5). The figure shows the mean percentage of B cells in the lymphocyte population. Error bars represent SEM.
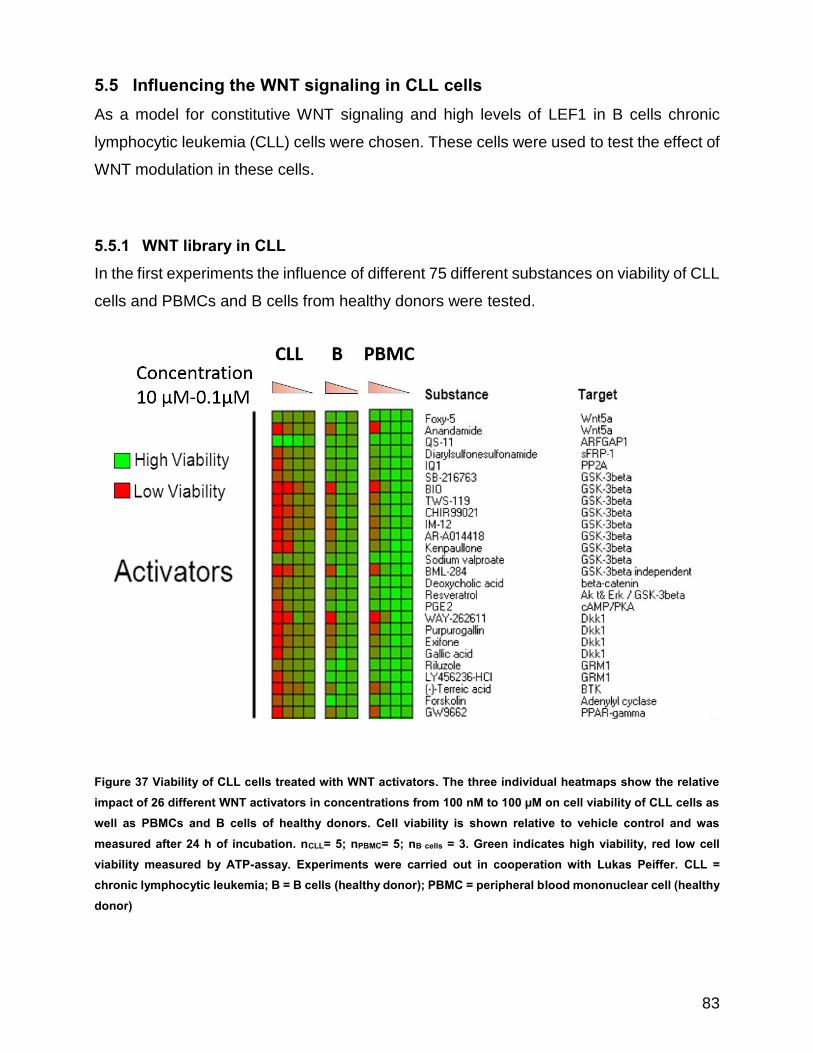
83
5.5 Influencing the WNT signaling in CLL cells As a model for constitutive WNT signaling and high levels of LEF1 in B cells chronic
lymphocytic leukemia (CLL) cells were chosen. These cells were used to test the effect of
WNT modulation in these cells.
5.5.1 WNT library in CLL In the first experiments the influence of different 75 different substances on viability of CLL
cells and PBMCs and B cells from healthy donors were tested.
Figure 37 Viability of CLL cells treated with WNT activators. The three individual heatmaps show the relative impact of 26 different WNT activators in concentrations from 100 nM to 100 µM on cell viability of CLL cells as well as PBMCs and B cells of healthy donors. Cell viability is shown relative to vehicle control and was measured after 24 h of incubation. nCLL= 5; nPBMC= 5; nB cells = 3. Green indicates high viability, red low cell viability measured by ATP-assay. Experiments were carried out in cooperation with Lukas Peiffer. CLL = chronic lymphocytic leukemia; B = B cells (healthy donor); PBMC = peripheral blood mononuclear cell (healthy donor)

84
Of the WNT activators most reduced the cell viability in CLL cells at high concentrations,
with the exception of QS-11 (see Figure 37). The other traditional WNT Activators, which
work via inhibition of GSK3β, were rather toxic for CLL cells at the tested concentrations.
B cells from healthy patients were far less affected by the tested compounds in
comparison. No WNT activator increased the viability of PBMCs or B cells from healthy
patients.
Figure 38 Viability of CLL cells treated with WNT inhibitors. The three individual heatmaps show the relative impact of 50 different WNT inhibitors in concentrations from 100 nM to 100 µM on cell viability of CLL cells as well as PBMCs and B cells of healthy donors. Cell viability is shown relative to vehicle control and was measured after 24 h of incubation. nCLL= 5; nPBMC= 5; nB cells= 3. Green indicates high viability, red low cell viability measured by ATP-assay. Experiments were carried out in cooperation with Lukas Peiffer. CLL = chronic lymphocytic leukemia; B = B cells (healthy donor); PBMC = peripheral blood mononuclear cell (healthy donor)

85
In the panel of WNT inhibitors none of the tested substances appeared to increase cell
survival of CLL, B cells or PBMCs (see Figure 38). Five compounds (TNP-470, NO-ASA,
JS-K, Trichostatin A & Doxorubicin) were specifically toxic for CLL cells. Of special interest
for this work is the NO-ASA, which supposedly inhibits the β-catenin/TCF4 interaction and
thereby inhibits canonical WNT signaling.
5.5.2 NO-ASA as WNT inhibitors in CLL cells Several studies show an inhibition of canonical WNT signaling by NO-ASAs. Therefore
the influence of two different NO-ASA derivatives, pNO-ASA (para-NO-ASA) and mNO-
ASA (meta-NO-ASA), were tested on mRNA expression levels. In the tested
concentration only treatment with 100 µM for 24 h with pNO-ASA had a significant impact
on the expression profile. Figure 39 shows a heatmap of up- and down-regulated genes
that were sorted by their annotation with the Database for Annotation, Visualization and Integrated Discovery (DAVID)*.
* http://david.abcc.ncifcrf.gov/home.jsp

86
Figure 39 Heatmap of array based genome wide mRNA expression analysis. Isolated CLL cells from four patients (n=4) were treated with DMSO (vehicle control), m- or pNO-ASA (100 µM) for 3 h. The total mRNA was isolated and submitted to analysis with Illumina human WG-6 v3 Expression BeadChips. Results were normalized (default settings) and analyzed with dCHIP software using following criteria: Fold change ≥ 2, difference of means ≥ 100, p ≤ 0.05. Significant regulated genes were submitted to the Database for Annotation, Visualization and Integrated Discovery (DAVID) and classified for gene function and clustered by gene annotation. The up-regulated genes were grouped by the gene classification tool (medium stringency, enrichment score ≥ 2) and sorted by their difference of means. The down-regulated genes showed no obvious similarities in gene function and functional annotations, therefore the table lists the 20 genes sorted by the highest changes in the difference of mean signal. Heatmap shows normalized expression. Red indicates high signal, green low signal. HSP = heat shock protein
The genes upregulated by pNO-ASA treatment can be assigned to three groups. The first
group consists of genes that encode several heat-shock-protein interactors, especially
chaperones from the DnaJ family (see Figure 39). In the second group of stress response

87
genes the heat-shock-proteins (HSP) dominate. The last group contains genes, mostly
from the GADD45 family, which are expressed in response to DNA-damage. For genes
downregulated by pNO-ASA treatment no obvious annotation pattern was found. These
expression patterns, especially of the upregulated genes, rather hinted to an involvement
of the NFκB and/or DNA-damage pathway than the WNT signaling pathway. Due to the
high efficacy and selectivity of the NO-ASAs the project was nevertheless continued as a
potential drug for CLL treatment and new NO-ASA derivatives were developed. From a
total of 22 derivatives pNO-ASA, NOBA and NO-Naphtyl proved to be the most selective
and effective derivatives to induce apoptosis in primary CLL cells in vitro (personal
communication with Sylvia Krallmann & Alexandros Liakos, see
Supp. Table 1).
5.5.3 New derivatives The new derivatives were developed on the basis of pNO-ASA. They all share, as
common features, a nitric oxide connected via a benzylic linker to different moieties (pNO-
ASA = acetylsalicylic acid; NOBA = benzoic acid; NO-Naphthyl = naphtoate). All
compounds were synthesized by the organic chemistry in the workgroup of Prof. Dr.
Albrecht Berkessel.
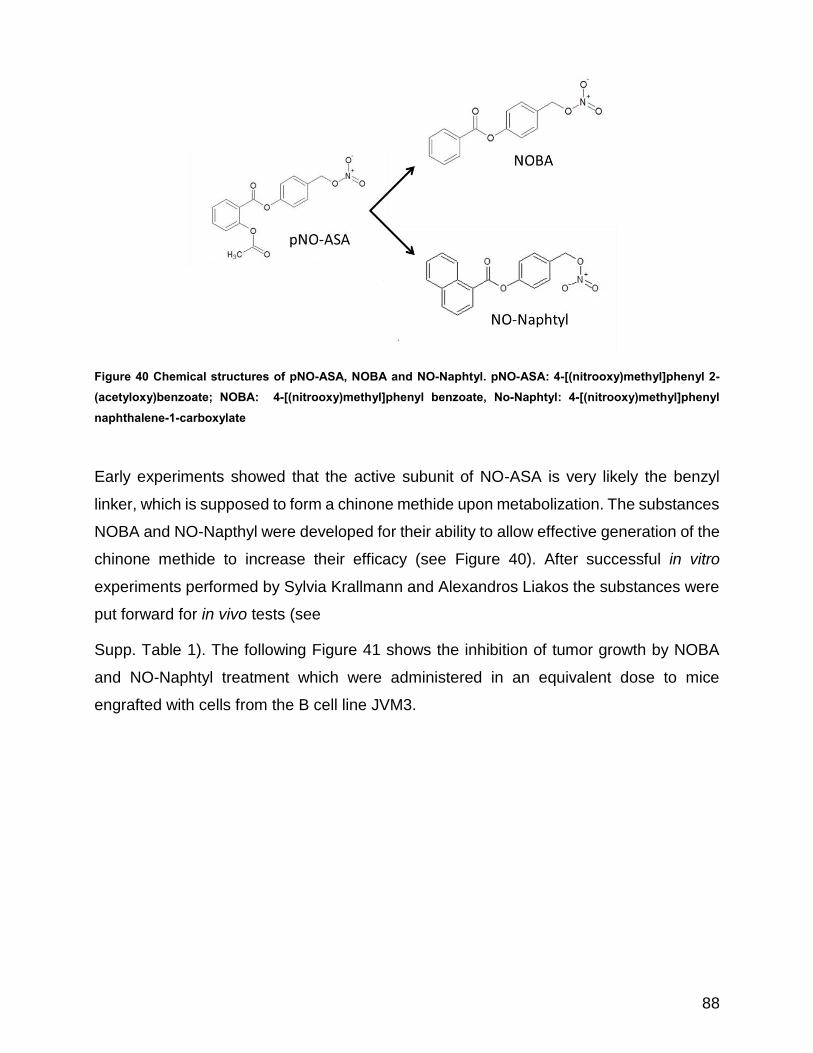
88
Figure 40 Chemical structures of pNO-ASA, NOBA and NO-Naphtyl. pNO-ASA: 4-[(nitrooxy)methyl]phenyl 2-(acetyloxy)benzoate; NOBA: 4-[(nitrooxy)methyl]phenyl benzoate, No-Naphtyl: 4-[(nitrooxy)methyl]phenyl naphthalene-1-carboxylate
Early experiments showed that the active subunit of NO-ASA is very likely the benzyl
linker, which is supposed to form a chinone methide upon metabolization. The substances
NOBA and NO-Napthyl were developed for their ability to allow effective generation of the
chinone methide to increase their efficacy (see Figure 40). After successful in vitro
experiments performed by Sylvia Krallmann and Alexandros Liakos the substances were
put forward for in vivo tests (see
Supp. Table 1). The following Figure 41 shows the inhibition of tumor growth by NOBA
and NO-Naphtyl treatment which were administered in an equivalent dose to mice
engrafted with cells from the B cell line JVM3.
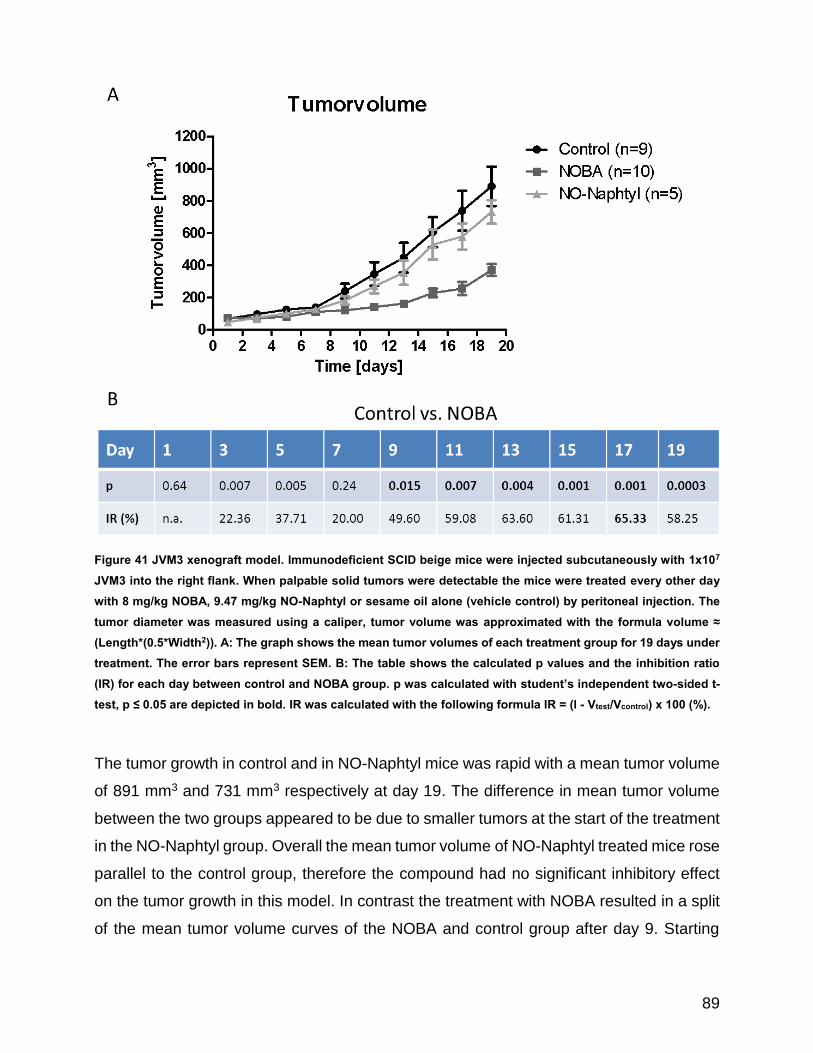
89
Figure 41 JVM3 xenograft model. Immunodeficient SCID beige mice were injected subcutaneously with 1x10⁷ JVM3 into the right flank. When palpable solid tumors were detectable the mice were treated every other day with 8 mg/kg NOBA, 9.47 mg/kg NO-Naphtyl or sesame oil alone (vehicle control) by peritoneal injection. The tumor diameter was measured using a caliper, tumor volume was approximated with the formula volume ≈ (Length*(0.5*Width2)). A: The graph shows the mean tumor volumes of each treatment group for 19 days under treatment. The error bars represent SEM. B: The table shows the calculated p values and the inhibition ratio (IR) for each day between control and NOBA group. p was calculated with student’s independent two-sided t-test, p ≤ 0.05 are depicted in bold. IR was calculated with the following formula IR = (l - Vtest/Vcontrol) x 100 (%).
The tumor growth in control and in NO-Naphtyl mice was rapid with a mean tumor volume
of 891 mm3 and 731 mm3 respectively at day 19. The difference in mean tumor volume
between the two groups appeared to be due to smaller tumors at the start of the treatment
in the NO-Naphtyl group. Overall the mean tumor volume of NO-Naphtyl treated mice rose
parallel to the control group, therefore the compound had no significant inhibitory effect
on the tumor growth in this model. In contrast the treatment with NOBA resulted in a split
of the mean tumor volume curves of the NOBA and control group after day 9. Starting

90
from this day the difference in tumor volume between these groups was highly significant
(Figure 41B). The inhibition ratio reaches its maximum on day 17 with an IR of 65.33%.

91
6 Discussion The WNT signaling pathway plays a pivotal role in many different biological mechanisms
like embryogenesis, cell fate, proliferation, cell migration. It appears to have developed
quite early in evolution and has evolved into a highly complex and tightly regulated
signaling network. The knowledge about this pathway and its functions has expanded
rapidly over the last two decades, especially in regard of stem cell biology. The WNT
signaling is known to control stem cell differentiation, self-renewal and proliferation. In
addition, its influence on hematopoiesis and hematologic malignancies is currently under
investigation. An important role for the integration information through WNT signaling have
the down-stream transcriptionfactors, but their role in hematopoiesis and hematologic
malignancies is poorly understood. Therefore, this project was designed to elucidate the
role of the transcriptionfactor LEF1 in the B cell development and its possible role as
driving factor for B cell leukemia in vivo. In addition to this role, the influence on other
tissues was analyzed in a newly developed mouse model.
6.1 The role of WNT signaling in hematopoiesis The WNT signaling pathway plays an important function during hematopoiesis, especially
for lymphocytes. Most information is hereby available for the early stages of their
development, namely from HSC to pre B cells (see Figure 9). In this phase the activation
of the WNT/β-catenin pathway appears to promote the self-renewal, while non-canonical
WNT signaling induces proliferation and differentiation (Malhotra and Kincade, 2009).
Predominantly the evidence for this effect comes from in vitro experiments in which HSCs
or common lymphoid progenitor (CLP) cells are stimulated with recombinant proteins like
WNT3a, which usually leads to WNT/β-catenin signaling, or WNT5a, which predominantly
activates non-canonical WNT signaling (Van Den Berg et al., 1998; Malhotra et al., 2008).
But these findings are not easily reproduced in mice. Some findings are still in line with
the in vitro experiments, for example that WNT3a deficient HSCs in wild type mice are
defective in their self-renewal, but others are not (Luis et al., 2009). Heterozygous WNT5a
knock-out leads to increased proliferation of myeloid and lymphoid cells in mice and to
corresponding leukemia and lymphomas (Liang et al., 2003). This result appears to be
opposing to the knowledge about WNT stimulation of HSCs in vitro, where WNT5a
induces proliferation (Malhotra et al., 2008). Reasons for this contradiction might be

92
changes in the output of canonical and non-canonical WNT signaling in different cell types,
differentiation stages or in the microenvironment. The changes in the output can be
achieved for example by expression of different co-receptors, modulators or cross-talk
with other pathways.
6.2 The LEF1 mouse models Up to date there are more than 20 different mouse models concerning the WNT pathway,
ranging from knock-out out models of various pathway members to WNT reporters, which
indicate pathway activity (Lustig et al., 2002). With the transcription factor LEF1 deal only
four relevant models. The knockout model from van Genderen established 1994 and a
mutation model published in 2000 deals with dysfunctional LEF1 (Galceran et al., 2000;
van Genderen et al., 1994). The knock-out and the LEF1 mutation model revealed severe
and terminal dysfunctions in organogenesis during the embryonic development. In a
overexpression model driven by the K14 promoter, showed a role of LEF1 in the control
of hair bud stem cells (Zhou et al., 1995). In the latest LEF1 model, the transcriptionfactor
is transduced to HSCs, which then are transplanted to wild type mice pretreated with
chemotherapeutics (Petropoulos et al., 2008). All these models are somewhat restricted
in their use, since the complete knock-out or LEF1 mutation proved to a lethal phenotype
early after birth or are not readily adaptable to other cell types, like the K14 or the LEF1
transduction model. To close this gap the R26lef1 mouse model was developed. This
model is based on a targeted transgene insertion into the ROSA26 locus. This locus is
well known and often used since insertions do not seem to produce any phenotype
(Friedrich and Soriano, 1991). The targeting Vector used, is designed to enable
transcription of any transgene in a Cre dependent manner. If Cre is not present a STOP
cassette represses transcription of the transgene. In the presence of the Cre recombinase
the STOP cassette, which is flanked by loxP sites, is excised, which puts the transgene
under direct control of the CAG promoter and the expression is started. In vivo this means
a start of transgene expression in every cell with targeted insertion (R26x/x) and presence
of Cre recombinase. Nowadays, there is a broad spectrum of mouse strains expressing
Cre in various tissues, cell types or developmental stages are available, the expression
can therefore be restricted to many different target cells or tissues. For this work the cDNA
sequence of full length human LEF1 was cloned into an expression cassette and inserted
93
into the Rosa26 locus. This allows controlled and targeted expression of full length LEF1
in various tissues or cells, as long as according Cre deleter strains are available.
Therefore, it is an easily adaptable model to answer questions whenever transgenic
expression of LEF1 expression is desired in vivo. To be of any use for future scientific
work it is important to know, if the transgene expression is stable and if the expressed
protein is functional.
6.2.1 Proof of principle of the R26lef1 mouse model The insertion into the Rosa26 locus was tested by southern blot using radioactive probes
targeting gfp and the neo resistance cassette, which both are also integral part of the
targeting vector. The southern blot analysis of the embryonic stem cells prior to blastocyst
injection were performed by co-workers of Dr. Thomas Wunderlich. Only stem cells with
correct patterning in the southern blot analysis were put forward for blastocyst injection.
Therefore correct insertion into the Rosa26 locus can be regarded as given.
PCR analysis of gDNA samples of the founder mouse of the R26lef1 strain proved the
presence of the neo, gfp and human lef1 gene in the genome of this strain, which indicates
insertion of the targeting vector (data not show). The founder mouse was crossed
immediately with the CD19wt/cre deleter strain to induce LEF1 expression in B cells (see
Figure 12). Some members of the resulting generation therefore carried the new
transgene and expressed Cre recombinase in their B cells. As expected this led to an
expression of GFP, which is restricted to the B220 positive (B) cells (see Figure 12). The
GFP signal was stable for more than 6 months, indicating a stable and constant transgene
expression (see Figure 13). The depletion efficiency in the R26Ief1 CD19wt/cre strain,
indicated by GFP expressing B cells in the peripheral blood, reached an average of about
76%. This is about 20% lower than it was described by Demircik and coworkers for the
CD19wt/cre strain in an similar experiment (Demircik et al., 2013). Still the large majority of
the B220 positive cells expressed GFP, which is acceptable for most experiments. The
other two used deleter strains also achieved good depletion ratios in the target cells of the
peripheral blood. The CMV-Cre dependent strain had GFP expression in 69.8% of the
B220 positive cells in the peripheral blood, while the Cr2-Cre achieved 85% in average
(see Figure 29 & Figure 34). The high efficiency of the Cr2 driven Cre expression might
be debatable since the sample number is small and the measurements took place after

94
40 weeks, but overall it is obvious that the STOP cassette R26lef1 transgene is efficiently
deleted in B cells in vivo. The efficient depletion is not restricted to B cells as it is shown
for R26lef CMV-Cre mice (see Figure 30), but has to be tested anew for each cell type and
corresponding Cre deleter strain.
Another important point is the resulting the LEF1 expression. While the CAG promoter is
highly efficient at the ROSA26 locus in murine embryonic stem cells, the overall
expression ratio of transgenic LEF1 appears to be moderate (Chen et al., 2011). The
results from the immunoblot analysis of murine B cells from the spleen showed a distinct
overexpression (see Figure 14), this is however unsurprising as wild type B cells virtually
do not express the transcriptionfactor at this stage of their development (Reya et al.,
2000). Intracellular staining of LEF1 in B cells would have been a good alternative to
immunoblotting, but subsequent analysis by FACS or fluorescence based microscopy
were either unsuccessful or not reproducible. A comparison on mRNA level also seemed
not advisable, since this information does not necessarily reflect the protein amount. Other
aspects, like protein stability and other regulating mechanisms, can influence the overall
outcome. Possibly the best information about the strength of the LEF1 expression
provided by the transgene comes from R26lef1 CMV-cre MEFs (see Figure 15). Here the
LEF1 was exclusively detectable in the nucleus, with background signal only in the rest of
the cells. This hints a moderate expression in these cells with high metabolic activity, since
high expression ratios would implement relevant quantities of the protein outside of the
nucleus. At least newly translated protein, as well as LEF1 not yet imported into the
nucleus, would be present in detectable amounts in the ER. Moreover, the fact that the
reporter GFP is only detectable by FACS and not by immunofluorescence, in MEFs as
well as in murine B cells, speaks for a rather low expression ratio. The functionality of the
transgenic LEF1 was shown in MEFs, where a distinct difference between LEF1 positive
and negative cells was detectable. MEFs without Cre recombinase activity, for example
with R26lef1 background, have no detectable LEF1 expression (see Figure 17). Therefore,
all LEF1 positive cells can be regarded as cells with successful depletion of the stop
cassette. These cells also have far more often Axin2 in their nucleus. This suggests that
the transgenic LEF1 induced WNT signaling, as nuclear Axin2 can be regarded as sign
for the activity of the pathway and of an active negative feedback loop in these cells (see
Figure 15) (Topol et al., 2009).

95
6.2.2 Effects of LEF1 expression For this study R26lef1 mice were crossed with three different Cre deleter strains. The
CD19wt/cre strain which restricts the expression of the transgenic LEF1 to the B cells,
starting with the earliest B cells, is the best analyzed. This strain shows a reduction of B
cells, which was detectable in the bone marrow, the spleen as well as the peripheral blood
(see Figure 22, Figure 23). This reduction was neither associated with changes of the
lymphocyte phenotype, overall survival or sex (see Figure 18, Figure 19, Figure 21).
Interestingly the difference in the percentage of B cells remained relatively stable between
the bone marrow (3%), spleen (5%) and the peripheral blood (6%) (see Figure 22 & Figure
23). This rather speaks for a stable B cell population, at least in the spleen and the
peripheral blood and against an ongoing toxicity. Therefore, it seems like the effect of the
LEF1 expression on the number of the B cells is restricted to the bone marrow and
transitional B cells. In the bone marrow, the percentage of apoptotic B cells was measured
in fresh samples and showed no difference between R26lef1 and control mice (see Figure
24). This suggests that the upcoming reduction of B cells in the bone marrow is not due
to increased apoptosis, which again speaks against transgene toxicity. Therefore the
proliferation rate of B220 is most likely reduced in R26lef1 CD19wt/cre mice. It has to be
noted that B220 not only detects B cells in the bone marrow, but also lymphoid progenitor
cells, which still can differentiate into B, T and NK cells. However the expression of CD19
and thereby of the Cre recombinase is usually thought to mark a high commitment to the
B cell lineage. It is also the starting point of the LEF1 expression in this model, therefore
only future B cells should be affected. In contrast to their progenitors HSCs and CLPs,
active WNT/β-catenin signaling appears to be a mitogenic signal for pre-B cells (Reya et
al., 2000). Therefore the meaning of active WNT/β-catenin seems to shift from induction
of self-renewal in HSCs and CLPs towards a proliferative signal (Luis et al., 2009;
Malhotra et al., 2008). It appears to be in direct opposition to the results of this study, since
it might be deduced from the experiments with MEFs (see Figure 15), that additional LEF1
increases the WNT/β-catenin dependent signaling, which therefore should increase the
proliferation of the B cells. However, it cannot be excluded that the transgenic LEF1
expression has the opposite effect in B cells, since all members if the TCF/LEF1 family
can act as suppressors without transactivation by β-catenin or other factors. Therefore, it

96
is still to be determined if WNT/β-catenin activity is increased in B cells that express
additional LEF1. Recommendation to answer this question will be discussed in a later
paragraph (see paragraph 6.7).
Interestingly, in later stages of developing B cells the stimulation of the WNT signaling
pathway especially by WNT10b and LiCl inhibits the LPS induced proliferation of B cells
from the spleen significantly (see Figure 25). LiCl strongly activates the WNT/β-catenin
signaling pathway by inhibiting GSK3 Kinase activity. Since GSK3 is an integral part of
several signaling pathways it cannot be excluded that the inhibition is due to off-target
events. WNT10b is reported to stimulate the WNT/β-catenin signaling pathway in human
hepatoma cell lines (Yoshikawa et al., 2007). Together with the strong reduction of B cell
proliferation by LiCl it is a logical assumption that active WNT/β-catenin signaling reduces
proliferation of LPS stimulated B cells from the spleen of R26lef1 CD19wt/cre mice in vitro.
This appears to be true for both genotypes, which indicates that it is a general mechanism,
which did not seem to be affected by expression of transgenic LEF1. Interestingly
WNT10b seemed to stimulate growth also in the absence of LPS, but this was however
more likely to be due to the reduction in cell survival of WNT10b treated B cells, which
caused an artificial proliferation signal (see Figure 25 & Figure 26). Overall it has to be
noted that no WNT stimulation whatsoever induced significantly different reactions
between B cells from the spleen of R26lef1 CD19wt/cre and control mice. This implies that
LEF1 function is either not needed for proliferation and survival or is compensated by
other mechanisms at this developmental stage. The stimulation of B220 positive cells from
the bone marrow, however, reveals an unexpected picture. Figure 27 shows a higher
induction of proliferation in R26lef1 CD19wt/cre mice, which again is not significant, but can
easily be identified as trend. This is in opposition with the overall result of reduced B cell
numbers in the bone marrow, spleen and peripheral blood. LPS however also stimulates
cells without B cell receptor which were present in the cell mix used for this experiments.
The mitogen can, for example, induce proliferation of HSCs by TLR dependent signaling,
which results in expansion of stem cells (Nagai et al., 2006). Therefore it is unclear,
whether the expansion of B220 positive cells in R26lef1 CD19wt/cre by LPS stimulation was
only due to proliferation of cells that are committed to the B cell lineage. Since the in vitro
results of the proliferation assays do not readily explain the significant differences between
the two genotypes, in vivo proliferation assay should by conducted in the future. In this
97
regard, it is unfortunate that the in vivo stimulation of the WNT signaling pathway by LiCl
treatment of control and R26lef1 CD19wt/cre remained inconclusive (see Figure 28). Neither
strain showed a significant difference in hematopoiesis, which might be due to inadequate
LiCl dosage or monitoring period. The abortion of the experiments was caused by a death
of an R26lef1 CD19wt/cre mouse, in which the lymphocyte population in the peripheral blood
was depleted. If this was due to the treatment, to pathogens or to a combination of both
remains unclear (see Figure 28 & Supp. Fig. 7). Also interesting in this regard, are the
results from R26lef1 Cr2-cre mice. Despite the fact that the sample number and the
monitoring period are too small for definite results Figure 36 shows a nearly identical
percentage of B cells in the peripheral blood of test and control mice. The results from the
CMV-cre induced strain in contrast show a not significant reduction (see Figure 32). Taken
together the experiments with the R26lef1 mouse model support the results from Reya and
colleagues, who postulated a restriction of LEF1 activity to B cells in the bone marrow
(Reya et al., 2000).
Next to the regulation of lymphopoiesis, LEF1 plays apparently also an important role in
bone formation. Figure 33 shows typical skull deformations of an R26lef1 CMV-cre mice,
which occur frequently in this strain. In contrast to the other two strains expressing
transgenic LEF1, the transgene expression is started in this model during embryogenesis
and is not restricted to a special tissue or cell type. This probably includes cells acting
during bone formation, which in term express transgenic LEF1. Since LEF1 is already
known to control osteoblast differentiation and proliferation it is not surprising that the bone
formation is affected by the constitutive LEF1 expression (Kahler et al., 2006). The
importance of the transcription factor in this process is further underlined by in vivo
experiments with a mouse strain expressing mutated LEF1 with disrupted HMG domain
(Galceran et al., 2004). This prohibited binding of LEF1 to the DNA and caused severe
deformations of rib-cage bones. Interestingly the phenotype of the R26lef1 CMV-cre strain
is highly similar to one observed in Axin2 null mice, in which the negative WNT regulator
protein Axin2 is knocked-out (Yu et al., 2005). Axin2 null mice have a more compact skull,
too. This is due to increased proliferation of osteoprogenitors and lead to fusion of cranial
sutures at early postnatal stages (Yu et al., 2005). This very similar phenotype supports
the theory that overexpression of LEF1 increases the WNT dependent signaling, since
also the deletion of the negative WNT regulator Axin2 increases WNT/β-catenin signaling
98
in the Axin2 model. This activation in turn leads to the expansion of osteoblasts and
premature fusion of the skull sutures, which can be observed in both models (Yu et al.,
2005).
Concluding from all three LEF1 expressing strains it is clear that the influence on
hematopoiesis is relatively small. This can be deduced from the complete blood counts,
where no significant differences where observed (see Figure 20, Figure 31 & Figure 35).
The differences in the blood counts are more likely due to pathogens. The health status
of the animal facility was compromised several times by different pathogens during the
monitoring period and the mice were treated, if possible, accordingly (see Supp. Fig. 7).
Due to the long monitoring period and the mixing of genotypes in each cage, it can be
more or less excluded that the significant differences are due to extrinsic factors. The
same is true for the results of the B cell content of the bone marrow and the spleen (see
Figure 23). However, the question remains if the relatively small impact of LEF1 on
lymphopoiesis is due to the experimental setup or mechanisms of compensation, for
example by Axin2 expression (see Figure 5 & Figure 16). The skull deformations, which
highly resemble the phenotype observed in Axin2 null mice, hint that the expression of
LEF1 most likely induces WNT/β-catenin dependent signaling. It remains unclear how
strong this activation is, especially compared to the physiological WNT signaling (Yu et
al., 2005).
6.3 Comparison of LEF1 dependent mouse models Up today four major LEF1 dependent mouse models have been generated, the LEF1
knock-out (KO) by van Genderen, the LEF1β-gal model by Galceran, the K14-LEF1 model
by Zhou and the LEF1 transduced HSC model by Petropoulos (Galceran et al., 2000; van
Genderen et al., 1994; Petropoulos et al., 2008; Zhou et al., 1995). In this chapter these
models are compared to the R26lef1 strains to integrate the gained knowledge and to
discuss advances and drawbacks of the new model.
LEF1 knock out
The LEF1KO was the first LEF1 dependent mouse model. It is based on a disruptive
introduction of a neo resistance gene into the second exon of the HMG domain. This
99
abrogated any protein LEF1 expression, which resulted in an plethora of developmental
defects in homozygous null mice (van Genderen et al., 1994). Especially the formation of
teeth, hair, whiskers and the mammary glands were disturbed. Neither of these organs
were affected in one of the new LEF1 expressing mouse strains. This is not unlikely as
KOs of genes often create more severe phenotypes when compared to their
overexpression models. Interestingly, no defects in the lymphoid compartment, especially
in pre-B cells were detected in LEF1 null mice, which hints that the loss of LEF1 can be
compensated. But is has to be noted that homozygous KO mice died in few weeks after
birth. This prevents any long-term study of their hematopoietic system (van Genderen et
al., 1994). Some observations appear to be quite the opposite from our R26lef1 CMV-cre
model. While LEF1 KO mice developed a elongate and pointy snout, the snout of R26lef1
CMV-cre is often shortened (van Genderen et al., 1994). If this reflects the opposite nature
of the two model, or is a side-effect remains unknown.
LEF1β-gal
The LEF1β-gal model distinguishes itself from the knock-out model by the expression of
a LEF1 β-galactosidase fusion protein. The β-galactosidase protein replaces the HMG
domain of the LEF1, which results in a stable protein that can bind β-catenin but not to
DNA (Galceran et al., 2000). This model showed severe disruption in brain development
as well as in bone formation (Galceran et al., 2000, 2004). Especially the abnormalities in
bone formation are partly due to the LEF1 dependent control of the dll1 gene, which is
part of the Notch signaling cascade. This model is interesting since it only focuses on the
transcriptional activity of LEF1 and to the fact that the integrated β-gal gene allows to
detect cells and tissues with active LEF1 expression. Also noteworthy is the fact that the
dll1 gene expression is controlled by LEF1 in vivo, a factor which blocks differentiation in
B cells (Jaleco et al., 2001). Overall the phenotype is not as severe as known from the
knock-out model. As recurrent feature the bone formation is affected, which is also the
case in R26lef1 CMV-cre mice (Galceran et al., 2004).
100
K14-LEF1
The K14-LEF1 model is the first model, which is based on LEF1 overexpression. In this
model LEF1 is expressed under control of the K14 promoter. This resulted in atypical hair
growth and tooth formation (Zhou et al., 1995). It was also the first model to prove the
activity of human LEF1 in a murine system. Unfortunately, the observations from this
model could not be reproduced in the R26lef1 CMV-cre model, in which also human LEF1
should be overexpressed nearly ubiquitously, including cells with K14 promoter activity.
The mice of the R26lef1 CMV-cre neither showed disoriented hairs or whiskers nor tooth
deformation, which occur in the K14 model (Zhou et al., 1995). The differences are most
likely due to inefficient cre recombinase activity in the corresponding cells, which failed to
induce LEF1 expression in all cells, like it is shown for B and T cells (see Figure 29, Figure
30). Another aspect is the activity of the CAG promotor, which might be inadequate in
certain cell types. Additionally there might be strain specific differences as Zhou and
colleagues used a not further defined mouse strain, which has a fair coat, whereas the
R26lef1 mice have a C57BL/6 background (Zhou et al., 1995).
LEF1 HSC
The LEF1 transduced HSC model is the most similar model to the R26lef1 CD19wt/cre &
Cr2-cre strains. In this model the LEF1 cDNA is transduced and expressed before any
lineage decision during hematopoiesis. This actually can explain some of the differences
to the LEF1 HSC model of Petropoulos et. al., where the target cells were transduced with
a construct based on the MSCV (Murine Stem Cell Virus) LTR (Long Terminal Repeat),
which allows for high expression ratios in murine stem cells and other cell types
(Petropoulos et al., 2008). It is reasonable to expect that the MSCV based system leads
to higher expression of transgenic LEF1, when compared to the R26lef1 based strains.
This might, at least to some extent, explain the high leukemogenic potential in model of
Petropoulos when compared to the newly developed model (compare Table 23,
(Petropoulos et al., 2008). The publication of Petropoulos does not state which isoform or
which species of LEF1 was transduced into the HSCs. This might be another reason for
the difference between the two mouse models. The R26lef1 model uses human full-length
cDNA without introns, therefore the β-catenin domain is present in the expressed protein.

101
It is likely that Petropoulos and colleagues used murine cDNA for their transduction
experiments. Murine and human LEF1, however, share a very high identity (see Figure 1)
and it was proven that murine β-catenin can interact with human LEF1 and is active in
vivo (Hamada and Bienz, 2004; Zhou et al., 1995). In addition, the increased translocation
of Axin2 in to the nucleus of LEF1 positive MEFs with R26lef1 CMV-cre background
suggests that the human LEF1 functions as expected and increases WNT signaling (see
Figure 16). Therefore it appears highly unlikely that the differences of the two models are
due to inter-species issues. The transduction of HSCs however bears some risks in the
regard of unspecific leukemia induction by uncontrolled virus integration. Petropoulos and
co-workers neither tested for the number of integrations nor for the integrations sites
(Petropoulos et al., 2008). Their study was also performed using only three control mice,
which received an EGFP expressing transgene. Two of these mice were sacrificed rather
early, therefore the mean monitoring period for the control mice was about 100 days less
compared to the mice which received HSCs transduced with wild type LEF1. Overall the
necessary work in LEF1 HSC model to transduce and transplant HSCs is quite high when
compared to the simple mating of the R26lef1 based model. Also no targeted expression
was implemented into LEF1 HSC model from Petropoulos and co-workers, which is
probably responsible for the inconsistent type of leukemia that arise and decreases its
uses as a murine disease model significantly (Petropoulos et al., 2008). Additionally, by
the transduction of LEF1 and the necessary chemotherapy, the model bears the risk of
unwanted off-target events, which are not foreseeable.
6.4 Advantages and drawbacks of the R26lef1 mouse model The R26lef1 mouse model might prove as a powerful tool to analyze the function of LEF1
in vivo. Compared by the clarity of the phenotype it seems to fall behind the other models.
The LEF1KO and LEF1β-gal model produce strong defects in embryogenesis, which
renders them unfit for analysis of postnatal LEF1 dependent regulation. The two knock-in
models (LEF1 HSC & K14-LEF1) produce easily detectable phenotypes, too. This is
probably due to the mediocre expression of LEF1 based on the CAG promoter in R26lef1
mice. The CAG promoter is well suited for expression in stem cells, but appears to be
inefficient in B cells. The assumption that the mild phenotype of the R26lef1 based model
is due to the introduction of human LEF1 cDNA can be excluded since the K14-LEF1

102
model also uses human full length cDNA (Zhou et al., 1995). The necessary expression
of the Cre recombinase and the GFP reporter gene might be regarded as a drawback of
the new model, since both proteins are known to be toxic. The GFP expression in this
model is only detectable by highly sensitive methods like flow cytometry and can therefore
be regarded as very low. This renders any relevant toxicity unlikely. The Cre recombinase
however can mediate toxicity by its ability to cleave DNA, which causes genetic instability
(Silver and Livingston, 2001). The Cre-deleter strains used for this work are frequently
used and no effect by Cre mediated toxicity was ever described. Additionally, the rather
stable decrease in B cells from the bone marrow to the peripheral blood speaks against
such a toxicity (see Figure 22 & Figure 23). Future experiments should nevertheless use,
if possible, Cre deleter strains, with the ability for cre self-excision (Silver and Livingston,
2001).
Overall the R26lef1 models advantages are high adaptability, which will be further
addressed in the outlook, and easy handling. The model also allows fast and easy
production of high sample numbers, which even makes small effects detectable, like it is
the case for the reduction of B cells in the R26lef1 CD19wt/cre strain (see Figure 21). The
R26lef1 also has the potential to shed some light onto the role of the transcriptionfactor in
the WNT signaling pathway in general and in several cancers and leukemia.
R26lef1 in cancer models
The LEF1 expression of R26lef1 mice showed no detectable oncogenic potential up today,
independent of the used Cre-deleter strain. The observed increase in solid cancers in
R26lef1 CD19wt/cre mice can be traced back to a decrease of surveillance by the immune
system, since all available tumors were devoid of GFP expressing cells (see Table 23). A
similar analysis would also be interesting for the R26lef1 CMV-cre, but this strain is not yet
monitored for an adequate period of time. Nevertheless the R26lef1 based transgenic LEF1
expression might offer some interesting options in different cancer models that are linked
to the WNT signaling pathways, especially for leukemia models. One example is the Eµ-
TCL1 mouse model for CLL. In this model the leukemia is driven by the expression of an
enhancer of the B cell receptor signaling. Surprisingly the induction of leukemia is
postponed in Frizzled 6 deficient Eµ-TCL1 mice (Wu et al., 2009). This proves a link

103
between the WNT signaling and the leukemogenesis in this strain. A crossbreeding with
the R26lef1 strain might have an opposite effect, which would implement strong ties
between WNT signaling and the BCR signaling of leukemic cells, which is also suggested
for the human disease (Lu et al., 2004a). Overall the number of possible combinations of
different murine cancer models with R26lef1 strain is vast and cannot be discussed in detail,
but additional promising options, with special regard to CLL, are presented in the outlook.
6.5 WNT signaling in CLL One of the hallmarks of chronic lymphocytic, where the leukemic B cells usually have a
mature phenotype, is the LEF1 expression (Erdfelder et al., 2010). The expression is
already detectable during monoclonal B cell lymphocytosis (MBL), a state with many
similarities to CLL like the monoclonal expansion of B cells, but without malignant
proliferation. MBL, however, can advance to a CLL accompanied by rising LEF1 levels
(Gutierrez et al., 2010b). This observation seems to fit the model first proposed by Lu and
co-coworkers, which suggested that the WNT/β-catenin signaling pathway is constitutively
activated and supports the survival of the leukemic B cells (Lu et al., 2004a). This led to
the idea that the WNT signaling and its downstream transcriptionfactor LEF1 might not
only be important for CLL cell survival, but also for the induction of the disease since LEF1
apparently can drive leukemia induction (Petropoulos et al., 2008). In opposition to this
hypothesis is the lack of leukemia cases in the R26lef1 mouse model. Neither the CD19wt/cre
nor the CMV-cre induced LEF1 expression caused leukemia up to this date, which
induction might even have been supported by cre induced genetic instability (see Table
23). Furthermore, the LEF1 HSC model, while it shows leukemogenesis driven by LEF1,
has a bias to myeloid leukemia and no case of a CLL like disease was reported
(Petropoulos et al., 2008). All this data hint to the fact that LEF1 overexpression, while it
appears to be highly important for CLL cells, probably needs other co-factors to induce a
CLL like leukemia. There are most likely β-catenin independent processes at work, since
activation of the WNT/β-catenin signaling pathway rather seems to inhibit the proliferation
of B cells (see Figure 22 & Figure 25). This theory is also supported by the fact, that
nuclear β-catenin is only detectable in few CLL cases (Tandon et al., 2011). Also in line
with these results are stimulation experiments with WNT3a and WNT5a on CLL cells
performed by Francesca Tettamanzi (see Supp. Fig. 1 & Supp. Fig. 2). In both cases, one

104
aiming on WNT/β-catenin activation and one on activation non-canonical WNT signaling,
no supportive effect on CLL cell survival was detectable. A similar observation was made
with more than 25 different activators of the WNT signaling pathways. This included eight
different GSK3 inhibitors, which potently induce WNT/β-catenin in different cell types, but
failed to support the viability of primary CLL cells (see Figure 37). But these substances
not only failed to support the viability but many of them even proved to decrease CLL cell
viability. The only drug able to increase CLL cell viability was QS-11, a substance reported
as WNT3a co-activator of the WNT signaling (Zhang et al., 2007). Interestingly QS-11
seemed to support CLL cell viability in a WNT3a independent mechanism in CLL cells
(Supp. Fig. 3). Taken together it appears more and more likely that the β-catenin
independent activation of LEF1 and the other TCFs in CLL is more important than the
transactivation by β-catenin itself. This raises the question which other factors play a
significant role in this regard.
β-catenin independent transactivation of LEF1
In many cancers and leukemia stem cell signaling pathways are exceptionally active and
support survival and proliferation of the malignant cell. This is also the case in CLL. Next
to the WNT signaling pathway also TGF-β, hedgehog and the NOTCH signaling cascades
are aberrantly regulated in primary CLL cells (Desch et al., 2010; Douglas et al., 1997;
Rosati et al., 2009). Surprisingly CLL cells express and secrete the TGF-β, a ligand with
apoptosis inducing properties in B cells. CLL cells are resistant to TGF-β induced
apoptosis, as Douglas and colleagues showed in 1997 (Douglas et al., 1997). In regard
to WNT signaling, TGF-β was shown to be able to transactivate LEF1 via SMADs (Labbé
et al., 2000). This pathway crosstalk is quite common and known to take place for example
in stem cells and osteoblast (Cai et al., 2013; Letamendia et al., 2001). This could be a
potential source for LEF1 transactivation in primary CLL cells. Apart from TGF-β the
hedgehog signaling pathway might play a role in apoptosis resistance of CLL cells.
Especially the transcriptionfactor GLI appears to be important to mediate this effect
(Desch et al., 2010; Hegde et al., 2008). The HH and the WNT signaling pathway often
work in concert to regulate cell differentiation and proliferation for example in pluripotent
stem cells (Cerdan and Bhatia, 2010). The pathway crosstalk between the HH and WNT
signaling pathway appears not to be as direct as for the TGF-β signaling cascade, but it
105
is highly likely to play a role for CLL (Seke Etet et al., 2012). Out of the three above-
mentioned pathways, the NOTCH signaling pathway most likely plays an outstanding role
in LEF1 transactivation in CLL. First evidence about active NOTCH signaling in CLL
emerged in 2002 as Hubmann and colleagues showed the regulation of CD23 on primary
CLL cells by NOTCH2 (Hubmann et al., 2002). Later studies revealed a constitutive
activation of pathway in the majority of CLL cases, which apparently also mediates cell
survival of the leukemic cells (Rosati et al., 2009). In a whole genome sequencing
approach, NOTCH1 mutations belonged to the most frequent mutations in CLL (Puente
et al., 2011). Most of these mutations occur in the PEST domain of the ICD (intracellular
domain) of NOTCH1 and are associated with an unfavorable outcome (Willander et al.,
2013). Interestingly the ICD domain of NOTCH1, which is cleaved from the receptor upon
ligand binding, is also able to physically interact with LEF1 and to induce LEF1 dependent
transcription in a β-catenin independent manner (Ross and Kadesch, 2001). Ross and
Kadesh also postulated that the transactivation of LEF1 by the NOTCH1 ICD also
regulates different genes when compared to the transactivation by β-catenin. It is obvious
that the LEF1/NOTCH interaction is independent from the β-catenin binding domain of
LEF1, as the interaction site was mapped to the HMG domain (Ross and Kadesch, 2001).
This additionally allows for transactivation of LEF1ΔN, which is also expressed in CLL,
but is regarded as inhibitor of the WNT/β-catenin signaling (Wang et al., 2005).
Unfortunately, the focus of the major publications about LEF1 expression in CLL is on the
full length LEF1 isoforms and leaves out ΔN isoforms or do not distinguish between both,
therefore little is known about their ratio (Erdfelder et al., 2010; Gutierrez et al., 2010b).
The only work dealing with the expression of the other isoforms has a too limited sample
number for significant results, but suggests that the ΔN isoform is rather highly expressed
in CLL compared to the full length sequence (Wang et al., 2005). The activation by
NOTCH1 therefore becomes even more interesting as it has the potential to make use of
the complete LEF1 pool in CLL.
Taken together, it is obvious that LEF1 expression and NOTCH1 activation appear jointly
in many CLL cases. A high LEF1 expression and NOTCH1 ICD mutations are associated
with worse prognosis and the NOTCH1 ICD can transactivate LEF1 independent of its β-
catenin binding domain. All this evidence rather highlights the importance of
LEF1/NOTCH interaction in CLL, which should be addressed in future in vivo experiments.

106
6.6 Targeting the WNT signaling pathway in CLL Since the first publication in 2004 about the activity of the WNT signaling pathway in CLL,
several approaches have been used to inhibit WNT/β-catenin signaling in order to induce
apoptosis in CLL cells. In the term of these experiments the WNT signaling pathway was
proven to be a quite selective target, since most mature cells do not express it
(Gandhirajan et al., 2010; Razavi et al., 2011). This effect can also be observed in Figure
38, in which the influence of 50 different WNT inhibitors on the viability of CLL cells as
well as on PBMCs and B cells from healthy patients was tested. Most inhibitors, if not
generally toxic like pyrvinium pamoate or completely ineffective, proved to be more or less
selective on CLL cells (see Figure 38). Interestingly, the majority of WNT inhibitors, with
few exceptions like JS-K and NO-ASA, which target either β-catenin or the β-catenin/TCF
complex directly, had little impact on CLL viability. These results suggest that β-catenin
dependent signaling plays only a minor role in in vitro CLL cell survival, but there is also
evidence for the opposite. Gandhiranjan and co-workers used two small molecules which
inhibit complexation of β-catenin with TCF/LEF1 transcriptionfactors. They were able to
show that this substances can selectively drive CLL cells into apoptosis (Gandhirajan et
al., 2010). However, it is unclear if both small molecules are truly specific to the inhibition
of the transcription complex. The situation for JS-K, one of the effective substances of the
inhibitor screen that targets β-catenin, is quite similar (see Figure 38). While originally
reported to selectively inhibit the WNT/β-catenin pathway, later publications rather
focused on its ability to inhibit androgen-receptor signaling (Laschak et al., 2012; Nath et
al., 2010). These two processes are clearly not independent but it cannot be excluded that
the impact of JS-K on CLL cells is rather due to the inhibition of androgen receptor
signaling (see Figure 38). Also the second example of a substance, the NO-ASA, which
targets β-catenin and effectively and selectively drives CLL cells into apoptosis, offers
some doubts about its role as a selective WNT inhibitor. NO-ASAs, especially the potent
para-isomer, were regarded as effective WNT inhibiting drugs for experimental treatment
of CLL (Kashfi and Rigas, 2005; Razavi et al., 2011). However, also other pathways seem
to be affected by this group of compounds. Para and meta-NO-ASA are reported to affect
especially the NF-κB, the Jun and Akt signaling pathways (Chattopadhyay et al., 2010;
Rigas, 2009). The changes in the mRNA expression pattern induced by pNO-ASA and
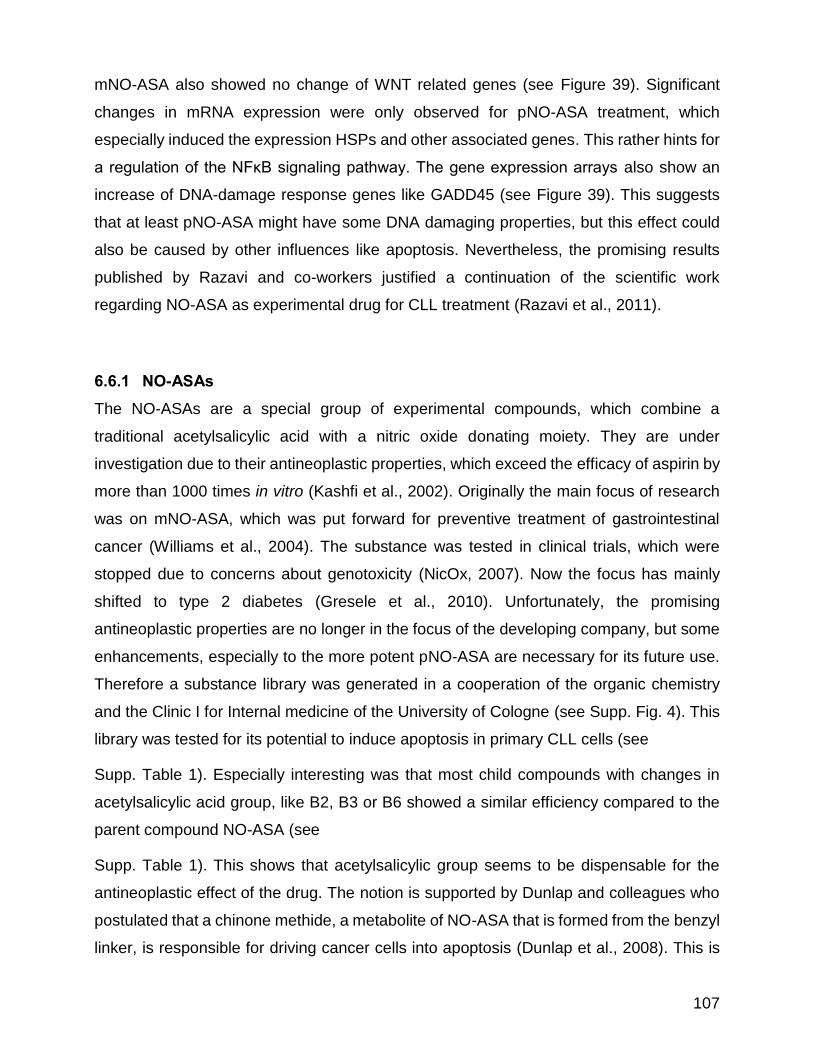
107
mNO-ASA also showed no change of WNT related genes (see Figure 39). Significant
changes in mRNA expression were only observed for pNO-ASA treatment, which
especially induced the expression HSPs and other associated genes. This rather hints for
a regulation of the NFκB signaling pathway. The gene expression arrays also show an
increase of DNA-damage response genes like GADD45 (see Figure 39). This suggests
that at least pNO-ASA might have some DNA damaging properties, but this effect could
also be caused by other influences like apoptosis. Nevertheless, the promising results
published by Razavi and co-workers justified a continuation of the scientific work
regarding NO-ASA as experimental drug for CLL treatment (Razavi et al., 2011).
6.6.1 NO-ASAs The NO-ASAs are a special group of experimental compounds, which combine a
traditional acetylsalicylic acid with a nitric oxide donating moiety. They are under
investigation due to their antineoplastic properties, which exceed the efficacy of aspirin by
more than 1000 times in vitro (Kashfi et al., 2002). Originally the main focus of research
was on mNO-ASA, which was put forward for preventive treatment of gastrointestinal
cancer (Williams et al., 2004). The substance was tested in clinical trials, which were
stopped due to concerns about genotoxicity (NicOx, 2007). Now the focus has mainly
shifted to type 2 diabetes (Gresele et al., 2010). Unfortunately, the promising
antineoplastic properties are no longer in the focus of the developing company, but some
enhancements, especially to the more potent pNO-ASA are necessary for its future use.
Therefore a substance library was generated in a cooperation of the organic chemistry
and the Clinic I for Internal medicine of the University of Cologne (see Supp. Fig. 4). This
library was tested for its potential to induce apoptosis in primary CLL cells (see
Supp. Table 1). Especially interesting was that most child compounds with changes in
acetylsalicylic acid group, like B2, B3 or B6 showed a similar efficiency compared to the
parent compound NO-ASA (see
Supp. Table 1). This shows that acetylsalicylic group seems to be dispensable for the
antineoplastic effect of the drug. The notion is supported by Dunlap and colleagues who
postulated that a chinone methide, a metabolite of NO-ASA that is formed from the benzyl
linker, is responsible for driving cancer cells into apoptosis (Dunlap et al., 2008). This is
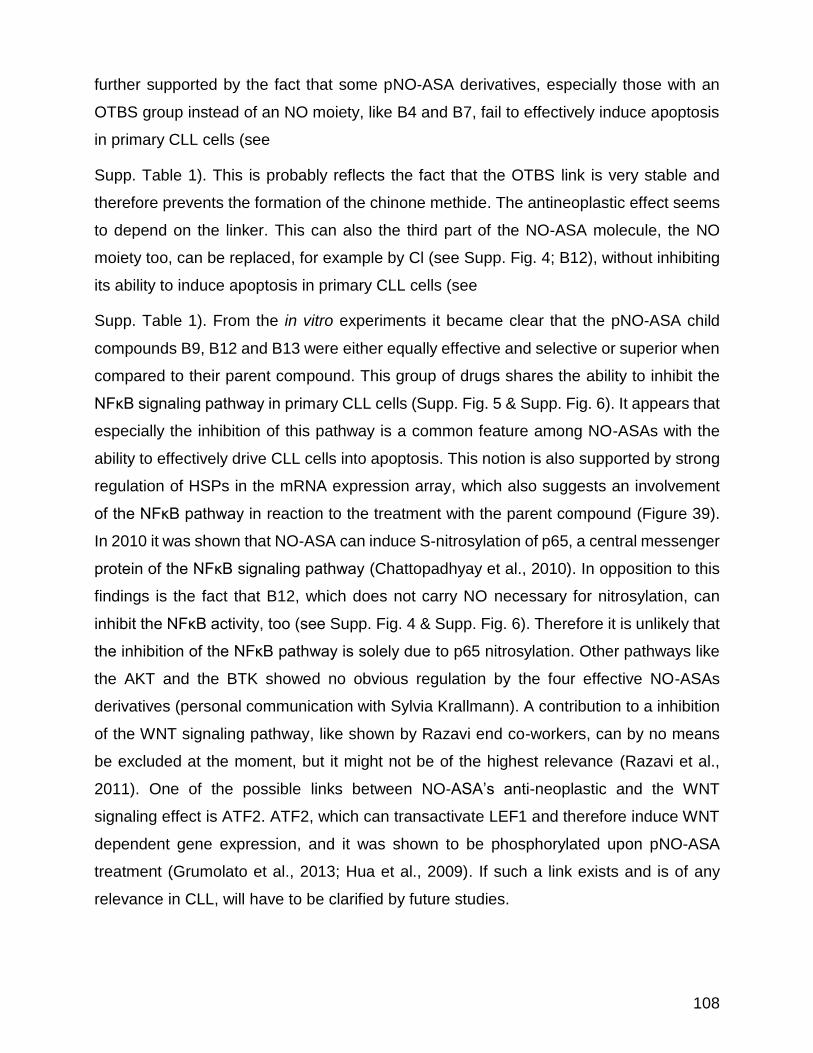
108
further supported by the fact that some pNO-ASA derivatives, especially those with an
OTBS group instead of an NO moiety, like B4 and B7, fail to effectively induce apoptosis
in primary CLL cells (see
Supp. Table 1). This is probably reflects the fact that the OTBS link is very stable and
therefore prevents the formation of the chinone methide. The antineoplastic effect seems
to depend on the linker. This can also the third part of the NO-ASA molecule, the NO
moiety too, can be replaced, for example by Cl (see Supp. Fig. 4; B12), without inhibiting
its ability to induce apoptosis in primary CLL cells (see
Supp. Table 1). From the in vitro experiments it became clear that the pNO-ASA child
compounds B9, B12 and B13 were either equally effective and selective or superior when
compared to their parent compound. This group of drugs shares the ability to inhibit the
NFκB signaling pathway in primary CLL cells (Supp. Fig. 5 & Supp. Fig. 6). It appears that
especially the inhibition of this pathway is a common feature among NO-ASAs with the
ability to effectively drive CLL cells into apoptosis. This notion is also supported by strong
regulation of HSPs in the mRNA expression array, which also suggests an involvement
of the NFκB pathway in reaction to the treatment with the parent compound (Figure 39).
In 2010 it was shown that NO-ASA can induce S-nitrosylation of p65, a central messenger
protein of the NFκB signaling pathway (Chattopadhyay et al., 2010). In opposition to this
findings is the fact that B12, which does not carry NO necessary for nitrosylation, can
inhibit the NFκB activity, too (see Supp. Fig. 4 & Supp. Fig. 6). Therefore it is unlikely that
the inhibition of the NFκB pathway is solely due to p65 nitrosylation. Other pathways like
the AKT and the BTK showed no obvious regulation by the four effective NO-ASAs
derivatives (personal communication with Sylvia Krallmann). A contribution to a inhibition
of the WNT signaling pathway, like shown by Razavi end co-workers, can by no means
be excluded at the moment, but it might not be of the highest relevance (Razavi et al.,
2011). One of the possible links between NO-ASA’s anti-neoplastic and the WNT
signaling effect is ATF2. ATF2, which can transactivate LEF1 and therefore induce WNT
dependent gene expression, and it was shown to be phosphorylated upon pNO-ASA
treatment (Grumolato et al., 2013; Hua et al., 2009). If such a link exists and is of any
relevance in CLL, will have to be clarified by future studies.
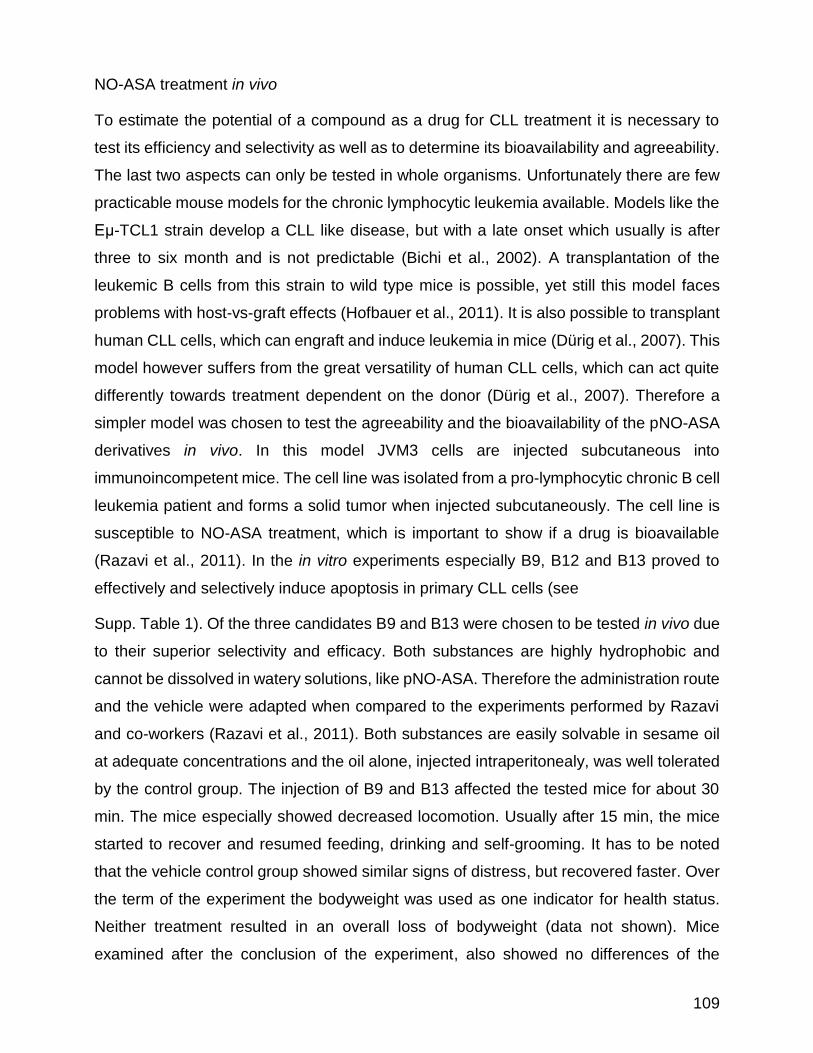
109
NO-ASA treatment in vivo
To estimate the potential of a compound as a drug for CLL treatment it is necessary to
test its efficiency and selectivity as well as to determine its bioavailability and agreeability.
The last two aspects can only be tested in whole organisms. Unfortunately there are few
practicable mouse models for the chronic lymphocytic leukemia available. Models like the
Eμ-TCL1 strain develop a CLL like disease, but with a late onset which usually is after
three to six month and is not predictable (Bichi et al., 2002). A transplantation of the
leukemic B cells from this strain to wild type mice is possible, yet still this model faces
problems with host-vs-graft effects (Hofbauer et al., 2011). It is also possible to transplant
human CLL cells, which can engraft and induce leukemia in mice (Dürig et al., 2007). This
model however suffers from the great versatility of human CLL cells, which can act quite
differently towards treatment dependent on the donor (Dürig et al., 2007). Therefore a
simpler model was chosen to test the agreeability and the bioavailability of the pNO-ASA
derivatives in vivo. In this model JVM3 cells are injected subcutaneous into
immunoincompetent mice. The cell line was isolated from a pro-lymphocytic chronic B cell
leukemia patient and forms a solid tumor when injected subcutaneously. The cell line is
susceptible to NO-ASA treatment, which is important to show if a drug is bioavailable
(Razavi et al., 2011). In the in vitro experiments especially B9, B12 and B13 proved to
effectively and selectively induce apoptosis in primary CLL cells (see
Supp. Table 1). Of the three candidates B9 and B13 were chosen to be tested in vivo due
to their superior selectivity and efficacy. Both substances are highly hydrophobic and
cannot be dissolved in watery solutions, like pNO-ASA. Therefore the administration route
and the vehicle were adapted when compared to the experiments performed by Razavi
and co-workers (Razavi et al., 2011). Both substances are easily solvable in sesame oil
at adequate concentrations and the oil alone, injected intraperitonealy, was well tolerated
by the control group. The injection of B9 and B13 affected the tested mice for about 30
min. The mice especially showed decreased locomotion. Usually after 15 min, the mice
started to recover and resumed feeding, drinking and self-grooming. It has to be noted
that the vehicle control group showed similar signs of distress, but recovered faster. Over
the term of the experiment the bodyweight was used as one indicator for health status.
Neither treatment resulted in an overall loss of bodyweight (data not shown). Mice
examined after the conclusion of the experiment, also showed no differences of the

110
internal organs. The treatments neither resulted in lesions at the gastrointestinal tract, the
kidney or the liver. The liver was not abnormally enlarged in mice of the treatment groups
(data not shown). Therefore the drugs seemed overall quite agreeable, even if the
administration and the used vehicle definitively have great potential for improvement.
Of the two tested substances only B9 had a significant effect on the tumor growth (see
Figure 41). A significant difference between the B9 treated and control mice is obvious
after day 9. From day 9 to the end of the experiment the effect of B9 becomes highly
significant and reaches the maximum inhibition ratio of 65% on day 17. This is lower when
compared to the results which were achieved by Regina Razavi and colleagues for the
parent compound (Razavi et al., 2011). Their experiments showed a maximum inhibition
of the tumor growth of 83.4%, but it has to be noted that they used a far higher dosage
and administered their drug orally (Razavi: 100 mg/kg per day vs. B9: 8 mg/kg every 2nd
day). In consideration of the different molar mass of pNO-ASA and B9, only 1/20 of the
dosage was used in the current study (compare Razavi et al., 2011). Therefore, it cannot
be deduced that B9 is less effective, when compared to pNO-ASA. The experiment also
showed that B13 was not effective in the used concentration or not bioavailable (see
Figure 41). It is obvious that tumors of the B13 treated mice grow as fast as tumors of the
control group. It is unlikely that this effect is due to dosage issues, as B13 was comparable
effective in driving primary CLL cells into apoptosis (see
Supp. Table 1). Therefore the drug was either not bioavailable, detoxified or instable.
Since sections of treated mice revealed not enlargement of the liver, it is reasonable to
assume that the failure of the drug is most likely due to availability or stability issues.
Benefits and drawbacks
From the beginning of the development of NO-ASA, especially mNO-ASA as a more
tolerable form of aspirin, the scientific focus has changed dramatically. Starting with their
potential as painkillers, they have been under investigation for their anti-neoplastic
properties and are now in clinical trials for type 2 diabetes mellitus treatment (NicOx,
2011). It appears that their promising features as anti-cancers drug have been somewhat
neglected in the recent years. One symptom of this trend is that only mNO-ASA has
entered clinical trials until now, whereas pNO-ASA which appears to be more potent in

111
cancer cell killing was never put forward. This might be due to the rather unspecific
process, which most likely is responsible for the cytotoxic effect of the drug. The
postulated generation of quinone methide and subsequent depletion of GSH will take
place in healthy cells as well as in cancer cells (Dunlap et al., 2008). The same is true for
the S-nitrosylation of p53, p65 and β-catenin (Williams et al., 2011). This raises the
question why some of the NO-ASAs have such a high selectivity towards their target cells
and are quite agreeable in vivo (see
Supp. Table 1 & Figure 41). For this effect several explanations are possible. First, the
substances preferentially enter the target cells, which could be triggered by their chemical
characteristics like size or hydrophobicity. A second explanation is the presence or
amount of special enzymes, which are needed to metabolize the compound and release
the cytotoxic moieties in the target cells. The last and probably most likely explanation is
based on the possible target structures involved. For example CLL cells rely for survival
on tonic signaling of several pathways like the NFκB signaling pathway, sensitive towards
oxidative stress (Cuní et al., 2004; Shanafelt et al., 2005). Since NO-ASA probably affects
both this aspects, the CLL cells are hit at two sensitive points, whereas B cells from
healthy patients are not as sensitive to oxidative stress and do not depend on tonic NFκB
signaling in order to survive. This might also include several other pathways, like for
example the WNT signaling cascade. This can lead to a higher susceptibility of CLL cells
towards the drug. Overall the mechanism behind the antineoplastic effect of NO-ASAs
remains unclear.
Nevertheless, pNO-ASA and B9 have proven to be efficient in vitro and in vivo. The EC50
of pNO-ASA (5.8 µM) and B9 (1.8 µM) on primary CLL cells is acceptable, as well are the
therapeutic windows in the in vitro assays (see
Supp. Table 1). Especially B9 appears to be superior in this aspect. The cytotoxic effect
on CLL is in both cases due to apoptosis induction, which was demonstrated by caspase
3/7 activity assays (Personal communication Sylvia Krallmann). Also both substances
reduce NFκB activity, which likely contributes to the cytotoxic effect (Supp. Fig. 5 & Supp.
Fig. 6). If the WNT signaling or the redox status is affected in the CLL cells remains
unclear. Interestingly, especially B9 was shown by Sylvia Krallmann, to exhibit its cytotoxic
effect independently p53 and is still efficient in heavily pretreated patients (personal
communications). Future scientist will have to weigh the apparently unspecific mode of

112
action and broad spectrum of target structures against the antineoplastic effect. However,
it seems likely that, apart from CLL, also other cancers and leukemia might be susceptible
to this kind of drug. It might prove to be a good alternative to alkylating agents, which still
are the backbone of many therapeutic regimens. Until then, the administration of the
drugs, especially B9, will need improvement before it can be used efficiently.
6.7 Outlook R26lef1 mouse model
The R26lef1 has great potential for future studies of the WNT signaling in vivo, but first the
final proof of the LEF1 functionality should be acquired. For this a rescue experiment
should be conducted, where the LEF1 KO model is combined with R26lef1 CMV-cre model.
Apart from this prove of principle it would be helpful to cross the R26lef1 CD19wt/cre model
with a WNT reporter strain like the Tg(Fos-lacZ)34Efu, which expresses the β-galactosidase
when the WNT signaling pathway is active. With this crossbreeding it would be possible
to determine if the WNT signaling pathway is more active in B cells with transgenic LEF1
expression compared to control cells and at which stages of their development the effect
occurs. This is especially interesting since the present and work from others suggest, that
LEF1 is only active in the bone marrow residing B cells and their progenitors. Another
part, which was largely neglected so far, is to what extent, if at all, the LEF1 expression
also influences B cell maturation and response to pathogens. An additional fact about the
R26lef1 mouse model is the lack of leukemic events, which was shown for the LEF1 HSC
model (Petropoulos et al., 2008). This might be due to the WNT signaling activity, which
might be below a certain threshold in this model. To further unbalance the WNT signaling,
with special regard to B cell leukemia, a combination with KO models of WNT inhibitors
or transgenic expression of β-catenin are feasible strategies. Most promising would be
crossbreeding with Axin2 null mice or with Gt(ROSA)26Sortm1(Ctnnb1)Kem, a strain which
expresses full length β-catenin in presence of the Cre recombinase. Both strategies,
would lead to a tremendous increase of the activity of the WNT signaling pathway in the
target cells. If surplus activation of the WNT signaling pathway will have any additional
impact on the B cell development is unclear, but it would increases the possibility of a
leukemogenic event considerably.

113
Apart from these more basic studies several other questions might be answered with the
R26lef1 model. Especially with regard to the question of the leukemic potential of the WNT
signaling pathways several options arise with the R26lef1 model. If the hyperactivation of
the WNT signaling pathway, like described before, is not able to induce leukemic events
combinations with known leukemia mouse models are thinkable.
This allows to analyze if the LEF1 is supporting factor for leukemia like CLL in vivo. This
question can easily be answered by combination of existing leukemia models like the Eµ-
TCL1 strain, which develops a CLL like disease, with the R26lef1 CD19wt/lef1 strain. This
combination should shift the disease onset significantly. If the transgenic LEF1 expression
supports the diseases, Eµ-TCL1 R26lef1 CD19wt/cre mice will develop the diseases earlier,
most likely with a more aggressive course. This model is not restricted to Eµ-TCL1 mouse,
but can be combined with other leukemia developing strains as well.
However, more interesting remains the question what other, by themselves not
leukemogenic factors, are necessary to induce leukemia in combination with the R26 lef1
model. Most likely candidate is a combination with the NOTCH pathway. There are already
adequate commercially available strains, like the Gt(ROSA)26Sortm1(Notch1)Dam/J strain. This
strain does not produce B cell leukemia, even when the transgene expression is activated
in lymphocytes. However a CD19wt/cre restricted expression of LEF1 and the NOTCH1 ICD
will most likely activate LEF1/NOTCH1 dependent gene expression, which probably has
a leukemogenic potential. A small drawback would be the complicated mating schemes
since the NOTCH1 fragment and the LEF1 are both inserted in the Rosa26 locus. The
R26NOTCH1/lef1 CD19-Cre model would closely simulate the conditions known from chronic
lymphocytic leukemia and might result in an interesting disease model. It would also be
possible to show LEF1 dependent transactivation by the NOTCH1 ICD in vivo, by
crossbreeding with NOTCH and WNT reporter strains. For the WNT signaling pathway
the Tg(Fos-lacZ)34Efu developed by Elaine Fuchs or the Axin2 promoter driven Axin2tm1Wbm
model are options. For NOTCH pathway signaling the Tg(Cp-HIST1H2BB/Venus)47Hadj is a
possible reporter strain. It has to be noted that the latter reporter strain is based on Venus
expression, a fluorescent protein, which cannot be easily distinguished from the GFP
expression produced by the NOTCH1 and the LEF1 strain for expression control. It is still
possible that no leukemia will be induced in R26NOTCH1/lef1 CD19wt/cre mice, but at least a
significant impact on B cell development is to be expected. Corresponding to the
114
R26NOTCH1/lef1 model, the R26lef1 strain enables future scientists to test crosstalk with many
other signaling pathways in distinct tissues, which sets the model apart from all other LEF1
dependent mouse models.
NO-ASA
The NO-ASA derivatives, especially B9 have shown to be promising compounds for the
treatment of chronic lymphocytic leukemia, but there are still several questions to be
addressed. The first remains the original target affected by B9, since it is unlikely that, for
example protein nitrosylation, is responsible for all the signaling pathway modulation
observed in primary CLL cells. Therefore precipitation experiments, for example using the
click chemistry, with subsequent analysis by mass spectrometry should be conducted.
Also comparative analysis between the different NO-ASA derivatives should be
performed, in order to describe family specific modulations. This will help to assess their
potential as anti-cancer drugs. Additionally, the pharmacokinetics are more or less
unknown and need to be analyzed. Experiments with labeled B9 should be conducted in
vitro and in vivo. For the latter in vivo imaging, possibly in combination with a xenograft
tumor model, would be advisable as strategy. Also more basic questions should be
addressed in future experiments. So far B9 was solved in sesame oil for in vivo
experiments and injected intraperitoneal. Neither the used vehicle nor the application
procedure is suited for leukemia patients. Most convenient would be an oral administration
or an intravenous injection. These routes would largely depend on the used vehicle. One
option would be packaging of the drug, for example into liposomes. Another possibility are
further structural changes of B9, for example at the benzoate group, which appears to be
dispensable for the anti-neoplastic effect, to decrease the lipophilic character. But these
changes always bear the risk to reduce the overall performance of the drug. So far the
spectrum of tested neoplasia is still very restricted. Future experiments should also
include other cancers, since it is to be expected that they will prove sensitive towards the
compound, too. It would also be advisable to check other properties of the new derivatives,
apart from cancer treatment. Since mNO-ASA is under investigation for its ability to
improve the insulin sensitivity of diabetes type 2 patients, similar properties are also
thinkable for other NO-ASAs. Overall future experiments are needed to address the

115
administration, pharmacokinetics, molecular target structures and possible side effects.
Additionally an extension of experiments to other cancers and diseases is desirable.
116
7 Literature Austen, B., Powell, J.E., Alvi, A., Edwards, I., Hooper, L., Starczynski, J., Taylor, A.M.R., Fegan, C., Moss, P., and Stankovic, T. (2005). Mutations in the ATM gene lead to impaired overall and treatment-free survival that is independent of IGVH mutation status in patients with B-CLL. Blood 106, 3175–3182.
Austin, T.W., Solar, G.P., Ziegler, F.C., Liem, L., and Matthews, W. (1997). A role for the Wnt gene family in hematopoiesis: expansion of multilineage progenitor cells. Blood 89, 3624–3635.
Baba, Y., Yokota, T., Spits, H., Garrett, K.P., Hayashi, S.-I., and Kincade, P.W. (2006). Constitutively active beta-catenin promotes expansion of multipotent hematopoietic progenitors in culture. J. Immunol. Baltim. Md 1950 177, 2294–2303.
Beals, C.R., Sheridan, C.M., Turck, C.W., Gardner, P., and Crabtree, G.R. (1997). Nuclear export of NF-ATc enhanced by glycogen synthase kinase-3. Science 275, 1930–1934.
Behrens, J., von Kries, J.P., Kühl, M., Bruhn, L., Wedlich, D., Grosschedl, R., and Birchmeier, W. (1996). Functional interaction of beta-catenin with the transcription factor LEF-1. Nature 382, 638–642.
Bellaïche, Y., Gho, M., Kaltschmidt, J.A., Brand, A.H., and Schweisguth, F. (2001). Frizzled regulates localization of cell-fate determinants and mitotic spindle rotation during asymmetric cell division. Nat. Cell Biol. 3, 50–57.
Ten Berge, D., Kurek, D., Blauwkamp, T., Koole, W., Maas, A., Eroglu, E., Siu, R.K., and Nusse, R. (2011). Embryonic stem cells require Wnt proteins to prevent differentiation to epiblast stem cells. Nat. Cell Biol. 13, 1070–1075.
Berndt, S.I., Skibola, C.F., Joseph, V., Camp, N.J., Nieters, A., Wang, Z., Cozen, W., Monnereau, A., Wang, S.S., Kelly, R.S., et al. (2013). Genome-wide association study identifies multiple risk loci for chronic lymphocytic leukemia. Nat. Genet.
Bhayat, F., Das-Gupta, E., Smith, C., McKeever, T., and Hubbard, R. (2009). The incidence of and mortality from leukaemias in the UK: a general population-based study. BMC Cancer 9, 252.
Bichi, R., Shinton, S.A., Martin, E.S., Koval, A., Calin, G.A., Cesari, R., Russo, G., Hardy, R.R., and Croce, C.M. (2002). Human chronic lymphocytic leukemia modeled in mouse by targeted TCL1 expression. Proc. Natl. Acad. Sci. 99, 6955–6960.
Biechele, S., Cox, B.J., and Rossant, J. (2011). Porcupine homolog is required for canonical Wnt signaling and gastrulation in mouse embryos. Dev. Biol. 355, 275–285.
Binet, J.L., Auquier, A., Dighiero, G., Chastang, C., Piguet, H., Goasguen, J., Vaugier, G., Potron, G., Colona, P., Oberling, F., et al. (1981). A new prognostic classification of chronic lymphocytic leukemia derived from a multivariate survival analysis. Cancer 48, 198–206.

117
Blache, P., van de Wetering, M., Duluc, I., Domon, C., Berta, P., Freund, J.-N., Clevers, H., and Jay, P. (2004). SOX9 is an intestine crypt transcription factor, is regulated by the Wnt pathway, and represses the CDX2 and MUC2 genes. J. Cell Biol. 166, 37–47.
Boutros, M., Paricio, N., Strutt, D.I., and Mlodzik, M. (1998). Dishevelled activates JNK and discriminates between JNK pathways in planar polarity and wingless signaling. Cell 94, 109–118.
Brantjes, H., Roose, J., van De Wetering, M., and Clevers, H. (2001). All Tcf HMG box transcription factors interact with Groucho-related co-repressors. Nucleic Acids Res. 29, 1410–1419.
Burger, J.A. (2012). Inhibiting B-cell receptor signaling pathways in chronic lymphocytic leukemia. Curr. Hematol. Malig. Rep. 7, 26–33.
Byrd, J.C., Furman, R.R., Coutre, S.E., Flinn, I.W., Burger, J.A., Blum, K.A., Grant, B., Sharman, J.P., Coleman, M., Wierda, W.G., et al. (2013). Targeting BTK with ibrutinib in relapsed chronic lymphocytic leukemia. N. Engl. J. Med. 369, 32–42.
Cai, J., Schleidt, S., Pelta-Heller, J., Hutchings, D., Cannarsa, G., and Iacovitti, L. (2013). BMP and TGF-β pathway mediators are critical upstream regulators of Wnt signaling during midbrain dopamine differentiation in human pluripotent stem cells. Dev. Biol. 376, 62–73.
Caligaris-Cappio, F., and Hamblin, T.J. (1999). B-cell chronic lymphocytic leukemia: a bird of a different feather. J. Clin. Oncol. Off. J. Am. Soc. Clin. Oncol. 17, 399–408.
Carini, M., Aldini, G., Orioli, M., Piccoli, A., Tocchetti, P., and Facino, R.M. (2004). Chemiluminescence and LC-MS/MS analyses for the study of nitric oxide release and distribution following oral administration of nitroaspirin (NCX 4016) in healthy volunteers. J. Pharm. Biomed. Anal. 35, 277–287.
Catovsky, D., Fooks, J., and Richards, S. (1989). Prognostic factors in chronic lymphocytic leukaemia: the importance of age, sex and response to treatment in survival. A report from the MRC CLL 1 trial. MRC Working Party on Leukaemia in Adults. Br. J. Haematol. 72, 141–149.
Cavallo, R.A., Cox, R.T., Moline, M.M., Roose, J., Polevoy, G.A., Clevers, H., Peifer, M., and Bejsovec, A. (1998). Drosophila Tcf and Groucho interact to repress Wingless signalling activity. Nature 395, 604–608.
Cerdan, C., and Bhatia, M. (2010). Novel roles for Notch, Wnt and Hedgehog in hematopoesis derived from human pluripotent stem cells. Int. J. Dev. Biol. 54, 955–963.
Chattopadhyay, M., Goswami, S., Rodes, D.B., Kodela, R., Velazquez, C.A., Boring, D., Crowell, J.A., and Kashfi, K. (2010). NO-releasing NSAIDs suppress NF-κB signaling in vitro and in vivo through S-nitrosylation. Cancer Lett. 298, 204–211.

118
Chen, C., Krohn, J., Bhattacharya, S., and Davies, B. (2011). A Comparison of Exogenous Promoter Activity at the ROSA26 Locus Using a PhiC31 Integrase Mediated Cassette Exchange Approach in Mouse ES Cells. PLoS ONE 6, e23376.
Chen, G., Fernandez, J., Mische, S., and Courey, A.J. (1999). A functional interaction between the histone deacetylase Rpd3 and the corepressor groucho in Drosophila development. Genes Dev. 13, 2218–2230.
Cheyette, B.N.R., and Moon, R.T. (2003). Wnt Protein Family. In Encyclopedia of Hormones, Editors-in-Chief: Helen L. Henry, and Anthony W. Norman, eds. (New York: Academic Press), pp. 665–674.
Cong, F., and Varmus, H. (2004). Nuclear-cytoplasmic shuttling of Axin regulates subcellular localization of ?-catenin. Proc. Natl. Acad. Sci. U. S. A. 101, 2882–2887.
Cui, Q., Lim, S.K., Zhao, B., and Hoffmann, F.M. (2005). Selective inhibition of TGF-beta responsive genes by Smad-interacting peptide aptamers from FoxH1, Lef1 and CBP. Oncogene 24, 3864–3874.
Cuní, S., Pérez-Aciego, P., Pérez-Chacón, G., Vargas, J.A., Sánchez, A., Martín-Saavedra, F.M., Ballester, S., García-Marco, J., Jordá, J., and Durántez, A. (2004). A sustained activation of PI3K/NF-kappaB pathway is critical for the survival of chronic lymphocytic leukemia B cells. Leukemia 18, 1391–1400.
Dabdoub, A., Donohue, M.J., Brennan, A., Wolf, V., Montcouquiol, M., Sassoon, D.A., Hseih, J.-C., Rubin, J.S., Salinas, P.C., and Kelley, M.W. (2003). Wnt signaling mediates reorientation of outer hair cell stereociliary bundles in the mammalian cochlea. Dev. Camb. Engl. 130, 2375–2384.
Daniels, D.L., Eklof Spink, K., and Weis, W.I. (2001). β-catenin: molecular plasticity and drug design. Trends Biochem. Sci. 26, 672–678.
Davidson, G., Wu, W., Shen, J., Bilic, J., Fenger, U., Stannek, P., Glinka, A., and Niehrs, C. (2005). Casein kinase 1 gamma couples Wnt receptor activation to cytoplasmic signal transduction. Nature 438, 867–872.
Davidson, K.C., Adams, A.M., Goodson, J.M., McDonald, C.E., Potter, J.C., Berndt, J.D., Biechele, T.L., Taylor, R.J., and Moon, R.T. (2012). Wnt/β-catenin signaling promotes differentiation, not self-renewal, of human embryonic stem cells and is repressed by Oct4. Proc. Natl. Acad. Sci.
Demircik, F., Buch, T., and Waisman, A. (2013). Efficient B Cell Depletion via Diphtheria Toxin in CD19-Cre/iDTR Mice. PLoS ONE 8, e60643.
Van Den Berg, D.J., Sharma, A.K., Bruno, E., and Hoffman, R. (1998). Role of members of the Wnt gene family in human hematopoiesis. Blood 92, 3189–3202.
Desch, P., Asslaber, D., Kern, D., Schnidar, H., Mangelberger, D., Alinger, B., Stoecher, M., Hofbauer, S.W., Neureiter, D., Tinhofer, I., et al. (2010). Inhibition of GLI, but not

119
Smoothened, induces apoptosis in chronic lymphocytic leukemia cells. Oncogene 29, 4885–4895.
Dighiero, G., Travade, P., Chevret, S., Fenaux, P., Chastang, C., and Binet, J.L. (1991). B-cell chronic lymphocytic leukemia: present status and future directions. French Cooperative Group on CLL. Blood 78, 1901–1914.
Ding, V.W., Chen, R.-H., and McCormick, F. (2000). Differential Regulation of Glycogen Synthase Kinase 3β by Insulin and Wnt Signaling. J. Biol. Chem. 275, 32475–32481.
Döhner, H., Stilgenbauer, S., Benner, A., Leupolt, E., Kröber, A., Bullinger, L., Döhner, K., Bentz, M., and Lichter, P. (2000). Genomic aberrations and survival in chronic lymphocytic leukemia. N. Engl. J. Med. 343, 1910–1916.
Dores, G.M., Anderson, W.F., Curtis, R.E., Landgren, O., Ostroumova, E., Bluhm, E.C., Rabkin, C.S., Devesa, S.S., and Linet, M.S. (2007). Chronic lymphocytic leukaemia and small lymphocytic lymphoma: overview of the descriptive epidemiology. Br. J. Haematol. 139, 809–819.
Døsen, G., Tenstad, E., Nygren, M.K., Stubberud, H., Funderud, S., and Rian, E. (2006). Wnt expression and canonical Wnt signaling in human bone marrow B lymphopoiesis. BMC Immunol. 7, 13.
Doubravska, L., Krausova, M., Gradl, D., Vojtechova, M., Tumova, L., Lukas, J., Valenta, T., Pospichalova, V., Fafilek, B., Plachy, J., et al. (2011). Fatty acid modification of Wnt1 and Wnt3a at serine is prerequisite for lipidation at cysteine and is essential for Wnt signalling. Cell. Signal. 23, 837–848.
Douglas, R.S., Capocasale, R.J., Lamb, R.J., Nowell, P.C., and Moore, J.S. (1997). Chronic lymphocytic leukemia B cells are resistant to the apoptotic effects of transforming growth factor-beta. Blood 89, 941–947.
Duncan, A.W., Rattis, F.M., DiMascio, L.N., Congdon, K.L., Pazianos, G., Zhao, C., Yoon, K., Cook, J.M., Willert, K., Gaiano, N., et al. (2005). Integration of Notch and Wnt signaling in hematopoietic stem cell maintenance. Nat. Immunol. 6, 314–322.
Dunlap, T., Chandrasena, R.E.P., Wang, Z., Sinha, V., Wang, Z., and Thatcher, G.R.J. (2007). Quinone formation as a chemoprevention strategy for hybrid drugs: balancing cytotoxicity and cytoprotection. Chem. Res. Toxicol. 20, 1903–1912.
Dunlap, T., Abdul-Hay, S.O., Chandrasena, R.E.P., Hagos, G.K., Sinha, V., Wang, Z., Wang, H., and Thatcher, G.R.J. (2008). Nitrates and NO-NSAIDs in cancer chemoprevention and therapy: in vitro evidence querying the NO donor functionality. Nitric Oxide Biol. Chem. Off. J. Nitric Oxide Soc. 19, 115–124.
Dürig, J., Ebeling, P., Grabellus, F., Sorg, U.R., Möllmann, M., Schütt, P., Göthert, J., Sellmann, L., Seeber, S., Flasshove, M., et al. (2007). A novel nonobese diabetic/severe combined immunodeficient xenograft model for chronic lymphocytic leukemia reflects important clinical characteristics of the disease. Cancer Res. 67, 8653–8661.

120
Erdfelder, F., Hertweck, M., Filipovich, A., Uhrmacher, S., and Kreuzer, K.-A. (2010). High lymphoid enhancer-binding factor-1 expression is associated with disease progression and poor prognosis in chronic lymphocytic leukemia. Hematol. Rep. 2, e3.
Filipovich, A., Gandhirajan, R.K., Gehrke, I., Poll-Wolbeck, S.J., and Kreuzer, K.-A. (2010). Evidence for non-functional Dickkopf-1 (DKK-1) signaling in chronic lymphocytic leukemia (CLL). Eur. J. Haematol. 85, 309–313.
Fiorucci, S., Santucci, L., Gresele, P., Faccino, R.M., Del Soldato, P., and Morelli, A. (2003). Gastrointestinal safety of NO-aspirin (NCX-4016) in healthy human volunteers: a proof of concept endoscopic study. Gastroenterology 124, 600–607.
Franch-Marro, X., Wendler, F., Griffith, J., Maurice, M.M., and Vincent, J.-P. (2008). In vivo role of lipid adducts on Wingless. J. Cell Sci. 121, 1587–1592.
Friedrich, G., and Soriano, P. (1991). Promoter traps in embryonic stem cells: a genetic screen to identify and mutate developmental genes in mice. Genes Dev. 5, 1513–1523.
Funayama, N., Fagotto, F., McCrea, P., and Gumbiner, B.M. (1995). Embryonic axis induction by the armadillo repeat domain of beta-catenin: evidence for intracellular signaling. J. Cell Biol. 128, 959–968.
Galceran, J., Fariñas, I., Depew, M.J., Clevers, H., and Grosschedl, R. (1999). Wnt3a-/--like phenotype and limb deficiency in Lef1(-/-)Tcf1(-/-) mice. Genes Dev. 13, 709–717.
Galceran, J., Miyashita-Lin, E.M., Devaney, E., Rubenstein, J.L., and Grosschedl, R. (2000). Hippocampus development and generation of dentate gyrus granule cells is regulated by LEF1. Development 127, 469–482.
Galceran, J., Sustmann, C., Hsu, S.-C., Folberth, S., and Grosschedl, R. (2004). LEF1-mediated regulation of Delta-like1 links Wnt and Notch signaling in somitogenesis. Genes Dev. 18, 2718–2723.
Gandhirajan, R.K., Staib, P.A., Minke, K., Gehrke, I., Plickert, G., Schlösser, A., Schmitt, E.K., Hallek, M., and Kreuzer, K.-A. (2010). Small molecule inhibitors of Wnt/beta-catenin/lef-1 signaling induces apoptosis in chronic lymphocytic leukemia cells in vitro and in vivo. Neoplasia N. Y. N 12, 326–335.
Gehrke, I., Razavi, R., Poll-Wolbeck, S.J., Berkessel, A., Hallek, M., and Kreuzer, K.-A. (2011). The Antineoplastic Effect of Nitric Oxide-Donating Acetylsalicylic Acid (NO-ASA) in Chronic Lymphocytic Leukemia (CLL) Cells is Highly Dependent on its Positional Isomerism. Ther. Adv. Hematol. 2, 279–289.
Van Genderen, C., Okamura, R.M., Fariñas, I., Quo, R.G., Parslow, T.G., Bruhn, L., and Grosschedl, R. (1994). Development of several organs that require inductive epithelial-mesenchymal interactions is impaired in LEF-1-deficient mice. Genes Dev. 8, 2691–2703.
Giese, K., Amsterdam, A., and Grosschedl, R. (1991). DNA-binding properties of the HMG domain of the lymphoid-specific transcriptional regulator LEF-1. Genes Dev. 5, 2567–2578.
121
Gladstone, D.E., and Fuchs, E. (2012). Hematopoietic stem cell transplantation for chronic lymphocytic leukemia. Curr. Opin. Oncol. 24, 176–181.
Goldin, L.R., Pfeiffer, R.M., Li, X., and Hemminki, K. (2004). Familial risk of lymphoproliferative tumors in families of patients with chronic lymphocytic leukemia: results from the Swedish Family-Cancer Database. Blood 104, 1850–1854.
Gresele, P., and Momi, S. (2006). Pharmacologic profile and therapeutic potential of NCX 4016, a nitric oxide-releasing aspirin, for cardiovascular disorders. Cardiovasc. Drug Rev. 24, 148–168.
Gresele, P., Marzotti, S., Guglielmini, G., Momi, S., Giannini, S., Minuz, P., Lucidi, P., and Bolli, G.B. (2010). Hyperglycemia-induced platelet activation in type 2 diabetes is resistant to aspirin but not to a nitric oxide-donating agent. Diabetes Care 33, 1262–1268.
Gross, J.C., Chaudhary, V., Bartscherer, K., and Boutros, M. (2012). Active Wnt proteins are secreted on exosomes. Nat. Cell Biol. 14, 1036–1045.
Grumolato, L., Liu, G., Haremaki, T., Mungamuri, S.K., Mong, P., Akiri, G., Lopez-Bergami, P., Arita, A., Anouar, Y., Mlodzik, M., et al. (2013). β-Catenin-Independent Activation of TCF1/LEF1 in Human Hematopoietic Tumor Cells through Interaction with ATF2 Transcription Factors. PLoS Genet. 9, e1003603.
Guder, C., Philipp, I., Lengfeld, T., Watanabe, H., Hobmayer, B., and Holstein, T.W. (2006). The Wnt code: cnidarians signal the way. Oncogene 25, 7450–7460.
Guo, N., Hawkins, C., and Nathans, J. (2004). Frizzled6 controls hair patterning in mice. Proc. Natl. Acad. Sci. U. S. A. 101, 9277–9281.
Gutierrez, A., Sanda, T., Ma, W., Zhang, J., Grebliunaite, R., Dahlberg, S., Neuberg, D., Protopopov, A., Winter, S.S., Larson, R.S., et al. (2010a). Inactivation of LEF1 in T-cell acute lymphoblastic leukemia. Blood 115, 2845–2851.
Gutierrez, A., Jr, Tschumper, R.C., Wu, X., Shanafelt, T.D., Eckel-Passow, J., Huddleston, P.M., 3rd, Slager, S.L., Kay, N.E., and Jelinek, D.F. (2010b). LEF-1 is a prosurvival factor in chronic lymphocytic leukemia and is expressed in the preleukemic state of monoclonal B-cell lymphocytosis. Blood 116, 2975–2983.
Habas, R., and Dawid, I.B. (2005). Dishevelled and Wnt signaling: is the nucleus the final frontier? J. Biol. 4, 2.
Hallek, M. (2013). Chronic lymphocytic leukemia: 2013 update on diagnosis, risk stratification and treatment. Am. J. Hematol. 88, 803–816.
Hallek, M., Cheson, B.D., Catovsky, D., Caligaris-Cappio, F., Dighiero, G., Döhner, H., Hillmen, P., Keating, M.J., Montserrat, E., Rai, K.R., et al. (2008). Guidelines for the diagnosis and treatment of chronic lymphocytic leukemia: a report from the International Workshop on Chronic Lymphocytic Leukemia updating the National Cancer Institute-Working Group 1996 guidelines. Blood 111, 5446–5456.

122
Hamada, F., and Bienz, M. (2004). The APC tumor suppressor binds to C-terminal binding protein to divert nuclear beta-catenin from TCF. Dev. Cell 7, 677–685.
Hao, H.-X., Xie, Y., Zhang, Y., Charlat, O., Oster, E., Avello, M., Lei, H., Mickanin, C., Liu, D., Ruffner, H., et al. (2012). ZNRF3 promotes Wnt receptor turnover in an R-spondin-sensitive manner. Nature 485, 195–200.
He, T.C., Sparks, A.B., Rago, C., Hermeking, H., Zawel, L., da Costa, L.T., Morin, P.J., Vogelstein, B., and Kinzler, K.W. (1998). Identification of c-MYC as a target of the APC pathway. Science 281, 1509–1512.
Hecht, A., and Stemmler, M.P. (2003). Identification of a promoter-specific transcriptional activation domain at the C terminus of the Wnt effector protein T-cell factor 4. J. Biol. Chem. 278, 3776–3785.
Hecht, A., Vleminckx, K., Stemmler, M.P., van Roy, F., and Kemler, R. (2000). The p300/CBP acetyltransferases function as transcriptional coactivators of beta-catenin in vertebrates. EMBO J. 19, 1839–1850.
Hegde, G.V., Peterson, K.J., Emanuel, K., Mittal, A.K., Joshi, A.D., Dickinson, J.D., Kollessery, G.J., Bociek, R.G., Bierman, P., Vose, J.M., et al. (2008). Hedgehog-induced survival of B-cell chronic lymphocytic leukemia cells in a stromal cell microenvironment: a potential new therapeutic target. Mol. Cancer Res. MCR 6, 1928–1936.
Heisenberg, C.P., Tada, M., Rauch, G.J., Saúde, L., Concha, M.L., Geisler, R., Stemple, D.L., Smith, J.C., and Wilson, S.W. (2000). Silberblick/Wnt11 mediates convergent extension movements during zebrafish gastrulation. Nature 405, 76–81.
Henderson, B.R. (2000). Nuclear-cytoplasmic shuttling of APC regulates beta-catenin subcellular localization and turnover. Nat. Cell Biol. 2, 653–660.
Hofbauer, J.P., Heyder, C., Denk, U., Kocher, T., Holler, C., Trapin, D., Asslaber, D., Tinhofer, I., Greil, R., and Egle, A. (2011). Development of CLL in the TCL1 transgenic mouse model is associated with severe skewing of the T-cell compartment homologous to human CLL. Leukemia 25, 1452–1458.
Hovanes, K., Li, T.W., and Waterman, M.L. (2000). The human LEF-1 gene contains a promoter preferentially active in lymphocytes and encodes multiple isoforms derived from alternative splicing. Nucleic Acids Res. 28, 1994–2003.
Hsieh, J.C., Kodjabachian, L., Rebbert, M.L., Rattner, A., Smallwood, P.M., Samos, C.H., Nusse, R., Dawid, I.B., and Nathans, J. (1999). A new secreted protein that binds to Wnt proteins and inhibits their activities. Nature 398, 431–436.
Hua, A., Mackenzie, G.G., and Rigas, B. (2009). The differential cell signaling effects of two positional isomers of the anticancer NO-donating aspirin. Int. J. Oncol. 35, 837–844.
Huber, O., Korn, R., McLaughlin, J., Ohsugi, M., Herrmann, B.G., and Kemler, R. (1996). Nuclear localization of beta-catenin by interaction with transcription factor LEF-1. Mech. Dev. 59, 3–10.
123
Hubmann, R., Schwarzmeier, J.D., Shehata, M., Hilgarth, M., Duechler, M., Dettke, M., and Berger, R. (2002). Notch2 is involved in the overexpression of CD23 in B-cell chronic lymphocytic leukemia. Blood 99, 3742–3747.
Inoki, K., Ouyang, H., Zhu, T., Lindvall, C., Wang, Y., Zhang, X., Yang, Q., Bennett, C., Harada, Y., Stankunas, K., et al. (2006). TSC2 integrates Wnt and energy signals via a coordinated phosphorylation by AMPK and GSK3 to regulate cell growth. Cell 126, 955–968.
Ishitani, T., Ninomiya-Tsuji, J., Nagai, S., Nishita, M., Meneghini, M., Barker, N., Waterman, M., Bowerman, B., Clevers, H., Shibuya, H., et al. (1999). The TAK1-NLK-MAPK-related pathway antagonizes signalling between beta-catenin and transcription factor TCF. Nature 399, 798–802.
Ishitani, T., Ninomiya-Tsuji, J., and Matsumoto, K. (2003). Regulation of lymphoid enhancer factor 1/T-cell factor by mitogen-activated protein kinase-related Nemo-like kinase-dependent phosphorylation in Wnt/beta-catenin signaling. Mol. Cell. Biol. 23, 1379–1389.
Jaleco, A.C., Neves, H., Hooijberg, E., Gameiro, P., Clode, N., Haury, M., Henrique, D., and Parreira, L. (2001). Differential effects of Notch ligands Delta-1 and Jagged-1 in human lymphoid differentiation. J. Exp. Med. 194, 991–1002.
Janda, C.Y., Waghray, D., Levin, A.M., Thomas, C., and Garcia, K.C. (2012). Structural basis of Wnt recognition by Frizzled. Science 337, 59–64.
Jaspard, B., Couffinhal, T., Dufourcq, P., Moreau, C., and Duplàa, C. (2000). Expression pattern of mouse sFRP-1 and mWnt-8 gene during heart morphogenesis. Mech. Dev. 90, 263–267.
Jho, E., Zhang, T., Domon, C., Joo, C.-K., Freund, J.-N., and Costantini, F. (2002). Wnt/beta-catenin/Tcf signaling induces the transcription of Axin2, a negative regulator of the signaling pathway. Mol. Cell. Biol. 22, 1172–1183.
Kahler, R.A., and Westendorf, J.J. (2003). Lymphoid enhancer factor-1 and beta-catenin inhibit Runx2-dependent transcriptional activation of the osteocalcin promoter. J. Biol. Chem. 278, 11937–11944.
Kahler, R.A., Galindo, M., Lian, J., Stein, G.S., van Wijnen, A.J., and Westendorf, J.J. (2006). Lymphocyte enhancer-binding factor 1 (Lef1) inhibits terminal differentiation of osteoblasts. J. Cell. Biochem. 97, 969–983.
Kashfi, K., and Rigas, B. (2005). Molecular targets of nitric-oxide-donating aspirin in cancer. Biochem. Soc. Trans. 33, 701–704.
Kashfi, K., Ryan, Y., Qiao, L.L., Williams, J.L., Chen, J., Del Soldato, P., Traganos, F., Rigas, B., and Ryann, Y. (2002). Nitric oxide-donating nonsteroidal anti-inflammatory drugs inhibit the growth of various cultured human cancer cells: evidence of a tissue type-independent effect. J. Pharmacol. Exp. Ther. 303, 1273–1282.
124
Katanaev, V.L., Solis, G.P., Hausmann, G., Buestorf, S., Katanayeva, N., Schrock, Y., Stuermer, C.A.O., and Basler, K. (2008). Reggie-1/flotillin-2 promotes secretion of the long-range signalling forms of Wingless and Hedgehog in Drosophila. EMBO J. 27, 509–521.
Kilian, B., Mansukoski, H., Barbosa, F.C., Ulrich, F., Tada, M., and Heisenberg, C.P. (2003). The role of Ppt/Wnt5 in regulating cell shape and movement during zebrafish gastrulation. Mech. Dev. 120, 467–476.
Kim, K., and Hay, E.D. (2001). New evidence that nuclear import of endogenous beta-catenin is LEF-1 dependent, while LEF-1 independent import of exogenous beta-catenin leads to nuclear abnormalities. Cell Biol. Int. 25, 1149–1161.
Kimelman, D., and Xu, W. (2006). β-Catenin destruction complex: insights and questions from a structural perspective. Oncogene 25, 7482–7491.
Kirstetter, P., Anderson, K., Porse, B.T., Jacobsen, S.E.W., and Nerlov, C. (2006). Activation of the canonical Wnt pathway leads to loss of hematopoietic stem cell repopulation and multilineage differentiation block. Nat. Immunol. 7, 1048–1056.
Klein, P.S., and Melton, D.A. (1996). A molecular mechanism for the effect of lithium on development. Proc. Natl. Acad. Sci. U. S. A. 93, 8455–8459.
Klein, U., Tu, Y., Stolovitzky, G.A., Mattioli, M., Cattoretti, G., Husson, H., Freedman, A., Inghirami, G., Cro, L., Baldini, L., et al. (2001). Gene expression profiling of B cell chronic lymphocytic leukemia reveals a homogeneous phenotype related to memory B cells. J. Exp. Med. 194, 1625–1638.
Kratochwil, K., Galceran, J., Tontsch, S., Roth, W., and Grosschedl, R. (2002). FGF4, a direct target of LEF1 and Wnt signaling, can rescue the arrest of tooth organogenesis in Lef1(-/-) mice. Genes Dev. 16, 3173–3185.
Kühl, M., Sheldahl, L.C., Malbon, C.C., and Moon, R.T. (2000). Ca2+/Calmodulin-dependent Protein Kinase II Is Stimulated by Wnt and Frizzled Homologs and Promotes Ventral Cell Fates in Xenopus. J. Biol. Chem. 275, 12701–12711.
Labbé, E., Letamendia, A., and Attisano, L. (2000). Association of Smads with lymphoid enhancer binding factor 1/T cell-specific factor mediates cooperative signaling by the transforming growth factor-beta and wnt pathways. Proc. Natl. Acad. Sci. U. S. A. 97, 8358–8363.
Laschak, M., Spindler, K.-D., Schrader, A.J., Hessenauer, A., Streicher, W., Schrader, M., and Cronauer, M.V. (2012). JS-K, a glutathione/glutathione S-transferase-activated nitric oxide releasing prodrug inhibits androgen receptor and WNT-signaling in prostate cancer cells. BMC Cancer 12, 130.
Lee, E., Salic, A., Krüger, R., Heinrich, R., and Kirschner, M.W. (2003). The roles of APC and Axin derived from experimental and theoretical analysis of the Wnt pathway. PLoS Biol. 1, E10.
125
Letamendia, A., Labbé, E., and Attisano, L. (2001). Transcriptional regulation by Smads: crosstalk between the TGF-beta and Wnt pathways. J. Bone Joint Surg. Am. 83-A Suppl 1, S31–39.
Levanon, D., Goldstein, R.E., Bernstein, Y., Tang, H., Goldenberg, D., Stifani, S., Paroush, Z., and Groner, Y. (1998). Transcriptional repression by AML1 and LEF-1 is mediated by the TLE/Groucho corepressors. Proc. Natl. Acad. Sci. U. S. A. 95, 11590–11595.
Li, T.W.-H., Ting, J.-H.T., Yokoyama, N.N., Bernstein, A., Wetering, M. van de, and Waterman, M.L. (2006). Wnt Activation and Alternative Promoter Repression of LEF1 in Colon Cancer. Mol. Cell. Biol. 26, 5284–5299.
Liang, H., Chen, Q., Coles, A.H., Anderson, S.J., Pihan, G., Bradley, A., Gerstein, R., Jurecic, R., and Jones, S.N. (2003). Wnt5a inhibits B cell proliferation and functions as a tumor suppressor in hematopoietic tissue. Cancer Cell 4, 349–360.
Lin, X., and Perrimon, N. (2000). Role of heparan sulfate proteoglycans in cell-cell signaling in Drosophila. Matrix Biol. J. Int. Soc. Matrix Biol. 19, 303–307.
Link, K.A., Chou, F.-S., and Mulloy, J.C. (2010). Core Binding Factor at the Crossroads: Determining the Fate of the HSC. J. Cell. Physiol. 222, 50–56.
Lu, D., Zhao, Y., Tawatao, R., Cottam, H.B., Sen, M., Leoni, L.M., Kipps, T.J., Corr, M., and Carson, D.A. (2004a). Activation of the Wnt signaling pathway in chronic lymphocytic leukemia. Proc. Natl. Acad. Sci. U. S. A. 101, 3118–3123.
Lu, D., Liu, J.X., Endo, T., Zhou, H., Yao, S., Willert, K., Schmidt-Wolf, I.G.H., Kipps, T.J., and Carson, D.A. (2009). Ethacrynic acid exhibits selective toxicity to chronic lymphocytic leukemia cells by inhibition of the Wnt/beta-catenin pathway. PloS One 4, e8294.
Lu, D., Choi, M.Y., Yu, J., Castro, J.E., Kipps, T.J., and Carson, D.A. (2011). Salinomycin inhibits Wnt signaling and selectively induces apoptosis in chronic lymphocytic leukemia cells. Proc. Natl. Acad. Sci. U. S. A. 108, 13253–13257.
Lu, W., Yamamoto, V., Ortega, B., and Baltimore, D. (2004b). Mammalian Ryk is a Wnt coreceptor required for stimulation of neurite outgrowth. Cell 119, 97–108.
Luis, T.C., Weerkamp, F., Naber, B.A.E., Baert, M.R.M., de Haas, E.F.E., Nikolic, T., Heuvelmans, S., De Krijger, R.R., van Dongen, J.J.M., and Staal, F.J.T. (2009). Wnt3a deficiency irreversibly impairs hematopoietic stem cell self-renewal and leads to defects in progenitor cell differentiation. Blood 113, 546–554.
Lustig, B., Jerchow, B., Sachs, M., Weiler, S., Pietsch, T., Karsten, U., van de Wetering, M., Clevers, H., Schlag, P.M., Birchmeier, W., et al. (2002). Negative feedback loop of Wnt signaling through upregulation of conductin/axin2 in colorectal and liver tumors. Mol. Cell. Biol. 22, 1184–1193.
126
Lyashenko, N., Winter, M., Migliorini, D., Biechele, T., Moon, R.T., and Hartmann, C. (2011). Differential requirement for the dual functions of β-catenin in embryonic stem cell self-renewal and germ layer formation. Nat. Cell Biol. 13, 753–761.
Macheda, M.L., Sun, W.W., Kugathasan, K., Hogan, B.M., Bower, N.I., Halford, M.M., Zhang, Y.F., Jacques, B.E., Lieschke, G.J., Dabdoub, A., et al. (2012). The Wnt receptor Ryk plays a role in mammalian planar cell polarity signaling. J. Biol. Chem. 287, 29312–29323.
Maeda, O., Usami, N., Kondo, M., Takahashi, M., Goto, H., Shimokata, K., Kusugami, K., and Sekido, Y. (2004). Plakoglobin (gamma-catenin) has TCF/LEF family-dependent transcriptional activity in beta-catenin-deficient cell line. Oncogene 23, 964–972.
Malhotra, S., and Kincade, P.W. (2009). Wnt-Related Molecules and Signaling Pathway Equilibrium in Hematopoiesis. Cell Stem Cell 4, 27–36.
Malhotra, S., Baba, Y., Garrett, K.P., Staal, F.J.T., Gerstein, R., and Kincade, P.W. (2008). Contrasting responses of lymphoid progenitors to canonical and noncanonical Wnt signals. J. Immunol. Baltim. Md 1950 181, 3955–3964.
Mandelli, F., De Rossi, G., Mancini, P., Alberti, A., Cajozzo, A., Grignani, F., Leoni, P., Liso, V., Martelli, M., and Neri, A. (1987). Prognosis in chronic lymphocytic leukemia: a retrospective multicentric study from the GIMEMA group. J. Clin. Oncol. Off. J. Am. Soc. Clin. Oncol. 5, 398–406.
Mao, B., Wu, W., Davidson, G., Marhold, J., Li, M., Mechler, B.M., Delius, H., Hoppe, D., Stannek, P., Walter, C., et al. (2002). Kremen proteins are Dickkopf receptors that regulate Wnt/beta-catenin signalling. Nature 417, 664–667.
Maul, R.W., and Gearhart, P.J. (2010). AID and somatic hypermutation. Adv. Immunol. 105, 159–191.
Meijer, L., Flajolet, M., and Greengard, P. (2004). Pharmacological inhibitors of glycogen synthase kinase 3. Trends Pharmacol. Sci. 25, 471–480.
Mikels, A.J., and Nusse, R. (2006). Purified Wnt5a protein activates or inhibits beta-catenin-TCF signaling depending on receptor context. PLoS Biol. 4, e115.
Mishra, S.K., Funair, L., Cressley, A., Gittes, G.K., and Burns, R.C. (2012). High-affinity Dkk1 receptor Kremen1 is internalized by clathrin-mediated endocytosis. PloS One 7, e52190.
Molenaar, M., van de Wetering, M., Oosterwegel, M., Peterson-Maduro, J., Godsave, S., Korinek, V., Roose, J., Destrée, O., and Clevers, H. (1996). XTcf-3 transcription factor mediates beta-catenin-induced axis formation in Xenopus embryos. Cell 86, 391–399.
Montserrat, E., and Rozman, C. (1995). Chronic lymphocytic leukemia: present status. Ann. Oncol. Off. J. Eur. Soc. Med. Oncol. ESMO 6, 219–235.
127
Moon, R.T., Campbell, R.M., Christian, J.L., McGrew, L.L., Shih, J., and Fraser, S. (1993). Xwnt-5A: a maternal Wnt that affects morphogenetic movements after overexpression in embryos of Xenopus laevis. Dev. Camb. Engl. 119, 97–111.
Myers, D.C., Sepich, D.S., and Solnica-Krezel, L. (2002). Convergence and extension in vertebrate gastrulae: cell movements according to or in search of identity? Trends Genet. TIG 18, 447–455.
Nagai, Y., Garrett, K.P., Ohta, S., Bahrun, U., Kouro, T., Akira, S., Takatsu, K., and Kincade, P.W. (2006). Toll-like receptors on hematopoietic progenitor cells stimulate innate immune system replenishment. Immunity 24, 801–812.
Nath, N., Kashfi, K., Chen, J., and Rigas, B. (2003). Nitric oxide-donating aspirin inhibits beta-catenin/T cell factor (TCF) signaling in SW480 colon cancer cells by disrupting the nuclear beta-catenin-TCF association. Proc. Natl. Acad. Sci. U. S. A. 100, 12584–12589.
Nath, N., Vassell, R., Chattopadhyay, M., Kogan, M., and Kashfi, K. (2009). Nitro-aspirin inhibits MCF-7 breast cancer cell growth: effects on COX-2 expression and Wnt/beta-catenin/TCF-4 signaling. Biochem. Pharmacol. 78, 1298–1304.
Nath, N., Chattopadhyay, M., Pospishil, L., Cieciura, L.Z., Goswami, S., Kodela, R., Saavedra, J.E., Keefer, L.K., and Kashfi, K. (2010). JS-K, a nitric oxide-releasing prodrug, modulates ß-catenin/TCF signaling in leukemic Jurkat cells: evidence of an S-nitrosylated mechanism. Biochem. Pharmacol. 80, 1641–1649.
Neumann, S., Coudreuse, D.Y.M., van der Westhuyzen, D.R., Eckhardt, E.R.M., Korswagen, H.C., Schmitz, G., and Sprong, H. (2009). Mammalian Wnt3a is released on lipoprotein particles. Traffic Cph. Den. 10, 334–343.
NicOx (2007). NCI ends colon cancer trial with NicOx’s NCX 4016. Reuters.
NicOx (2011). NicOx to Move NCX 4016 Forward in Phase 2 for Diabetes.
Van Noesel, C.J., Brouns, G.S., van Schijndel, G.M., Bende, R.J., Mason, D.Y., Borst, J., and van Lier, R.A. (1992). Comparison of human B cell antigen receptor complexes: membrane-expressed forms of immunoglobulin (Ig)M, IgD, and IgG are associated with structurally related heterodimers. J. Exp. Med. 175, 1511–1519.
Nusse, R., and Varmus, H.E. (1982). Many tumors induced by the mouse mammary tumor virus contain a provirus integrated in the same region of the host genome. Cell 31, 99–109.
Pan, J.W.Y., Cook, L.S., Schwartz, S.M., and Weis, N.S. (2002). Incidence of leukemia in Asian migrants to the United States and their descendants. Cancer Causes Control CCC 13, 791–795.
Panáková, D., Sprong, H., Marois, E., Thiele, C., and Eaton, S. (2005). Lipoprotein particles are required for Hedgehog and Wingless signalling. Nature 435, 58–65.
128
Peifer, M., Pai, L.M., and Casey, M. (1994). Phosphorylation of the Drosophila adherens junction protein Armadillo: roles for wingless signal and zeste-white 3 kinase. Dev. Biol. 166, 543–556.
Petropoulos, K., Arseni, N., Schessl, C., Stadler, C.R., Rawat, V.P.S., Deshpande, A.J., Heilmeier, B., Hiddemann, W., Quintanilla-Martinez, L., Bohlander, S.K., et al. (2008). A novel role for Lef-1, a central transcription mediator of Wnt signaling, in leukemogenesis. J. Exp. Med. 205, 515–522.
Pilon, N., Oh, K., Sylvestre, J.-R., Savory, J.G.A., and Lohnes, D. (2007). Wnt signaling is a key mediator of Cdx1 expression in vivo. Dev. Camb. Engl. 134, 2315–2323.
Porfiri, E., Rubinfeld, B., Albert, I., Hovanes, K., Waterman, M., and Polakis, P. (1997). Induction of a beta-catenin-LEF-1 complex by wnt-1 and transforming mutants of beta-catenin. Oncogene 15, 2833–2839.
Puente, X.S., Pinyol, M., Quesada, V., Conde, L., Ordóñez, G.R., Villamor, N., Escaramis, G., Jares, P., Beà, S., González-Díaz, M., et al. (2011). Whole-genome sequencing identifies recurrent mutations in chronic lymphocytic leukaemia. Nature 475, 101–105.
Rai, K.R., Sawitsky, A., Cronkite, E.P., Chanana, A.D., Levy, R.N., and Pasternack, B.S. (1975). Clinical staging of chronic lymphocytic leukemia. Blood 46, 219–234.
Ramsden, D.A., Weed, B.D., and Reddy, Y.V.R. (2010). V(D)J recombination: Born to be wild. Semin. Cancer Biol. 20, 254–260.
Ranheim, E.A., Kwan, H.C.K., Reya, T., Wang, Y.-K., Weissman, I.L., and Francke, U. (2005). Frizzled 9 knock-out mice have abnormal B-cell development. Blood 105, 2487–2494.
Razavi, R., Gehrke, I., Gandhirajan, R.K., Poll-Wolbeck, S.J., Hallek, M., and Kreuzer, K.-A. (2011). Nitric oxide-donating acetylsalicylic acid induces apoptosis in chronic lymphocytic leukemia cells and shows strong antitumor efficacy in vivo. Clin. Cancer Res. Off. J. Am. Assoc. Cancer Res. 17, 286–293.
Reits, E.A.J., Benham, A.M., Plougastel, B., Neefjes, J., and Trowsdale, J. (1997). Dynamics of proteasome distribution in living cells. EMBO J. 16, 6087–6094.
Reya, T., O’Riordan, M., Okamura, R., Devaney, E., Willert, K., Nusse, R., and Grosschedl, R. (2000). Wnt signaling regulates B lymphocyte proliferation through a LEF-1 dependent mechanism. Immunity 13, 15–24.
Reya, T., Duncan, A.W., Ailles, L., Domen, J., Scherer, D.C., Willert, K., Hintz, L., Nusse, R., and Weissman, I.L. (2003). A role for Wnt signalling in self-renewal of haematopoietic stem cells. Nature 423, 409–414.
Rickert, R.C., Rajewsky, K., and Roes, J. (1995). Impairment of T-cell-dependent B-cell responses and B-1 cell development in CD19-deficient mice. Nature 376, 352–355.

129
Rigas (2009). The differential cell signaling effects of two positional isomers of the anticancer NO-donating aspirin. Int. J. Oncol. 35.
Riggleman, B., Schedl, P., and Wieschaus, E. (1990). Spatial expression of the Drosophila segment polarity gene armadillo is posttranscriptionally regulated by wingless. Cell 63, 549–560.
Rijsewijk, F., Schuermann, M., Wagenaar, E., Parren, P., Weigel, D., and Nusse, R. (1987). The Drosophila homolog of the mouse mammary oncogene int-1 is identical to the segment polarity gene wingless. Cell 50, 649–657.
Roël, G., Hamilton, F.S., Gent, Y., Bain, A.A., Destrée, O., and Hoppler, S. (2002). Lef-1 and Tcf-3 transcription factors mediate tissue-specific Wnt signaling during Xenopus development. Curr. Biol. CB 12, 1941–1945.
Rosati, E., Sabatini, R., Rampino, G., Tabilio, A., Di Ianni, M., Fettucciari, K., Bartoli, A., Coaccioli, S., Screpanti, I., and Marconi, P. (2009). Constitutively activated Notch signaling is involved in survival and apoptosis resistance of B-CLL cells. Blood 113, 856–865.
Rosetti, M., Tesei, A., Ulivi, P., Fabbri, F., Vannini, I., Brigliadori, G., Amadori, D., Bolla, M., and Zoli, W. (2006). Molecular characterization of cytotoxic and resistance mechanisms induced by NCX 4040, a novel NO-NSAID, in pancreatic cancer cell lines. Apoptosis Int. J. Program. Cell Death 11, 1321–1330.
Ross, D.A., and Kadesch, T. (2001). The notch intracellular domain can function as a coactivator for LEF-1. Mol. Cell. Biol. 21, 7537–7544.
Rozman, C., and Montserrat, E. (1995). Chronic lymphocytic leukemia. N. Engl. J. Med. 333, 1052–1057.
Rubinfeld, B., Souza, B., Albert, I., Müller, O., Chamberlain, S.H., Masiarz, F.R., Munemitsu, S., and Polakis, P. (1993). Association of the APC gene product with beta-catenin. Science 262, 1731–1734.
Saneyoshi, T., Kume, S., Amasaki, Y., and Mikoshiba, K. (2002). The Wnt/calcium pathway activates NF-AT and promotes ventral cell fate in Xenopus embryos. Nature 417, 295–299.
Sato, A., Yamamoto, H., Sakane, H., Koyama, H., and Kikuchi, A. (2010). Wnt5a regulates distinct signalling pathways by binding to Frizzled2. EMBO J. 29, 41–54.
Seke Etet, P.F., Vecchio, L., and Nwabo Kamdje, A.H. (2012). Interactions between bone marrow stromal microenvironment and B-chronic lymphocytic leukemia cells: any role for Notch, Wnt and Hh signaling pathways? Cell. Signal. 24, 1433–1443.
Shalek, A.K., Gaublomme, J.T., Wang, L., Yosef, N., Chevrier, N., Andersen, M.S., Robinson, J.T., Pochet, N., Neuberg, D., Gertner, R.S., et al. (2012). Nanowire-Mediated Delivery Enables Functional Interrogation of Primary Immune Cells: Application to the Analysis of Chronic Lymphocytic Leukemia. Nano Lett. 12, 6498–6504.
130
Shanafelt, T.D., Lee, Y.K., Bone, N.D., Strege, A.K., Narayanan, V.L., Sausville, E.A., Geyer, S.M., Kaufmann, S.H., and Kay, N.E. (2005). Adaphostin-induced apoptosis in CLL B cells is associated with induction of oxidative stress and exhibits synergy with fludarabine. Blood 105, 2099–2106.
Shtutman, M., Zhurinsky, J., Simcha, I., Albanese, C., D’Amico, M., Pestell, R., and Ben-Ze’ev, A. (1999). The cyclin D1 gene is a target of the beta-catenin/LEF-1 pathway. Proc. Natl. Acad. Sci. U. S. A. 96, 5522–5527.
Siegfried, E., Chou, T.B., and Perrimon, N. (1992). wingless signaling acts through zeste-white 3, the Drosophila homolog of glycogen synthase kinase-3, to regulate engrailed and establish cell fate. Cell 71, 1167–1179.
Silver, D.P., and Livingston, D.M. (2001). Self-excising retroviral vectors encoding the Cre recombinase overcome Cre-mediated cellular toxicity. Mol. Cell 8, 233–243.
Su, L.K., Vogelstein, B., and Kinzler, K.W. (1993). Association of the APC tumor suppressor protein with catenins. Science 262, 1734–1737.
Takada, R., Satomi, Y., Kurata, T., Ueno, N., Norioka, S., Kondoh, H., Takao, T., and Takada, S. (2006). Monounsaturated fatty acid modification of Wnt protein: its role in Wnt secretion. Dev. Cell 11, 791–801.
Tamai, K., Semenov, M., Kato, Y., Spokony, R., Liu, C., Katsuyama, Y., Hess, F., Saint-Jeannet, J.P., and He, X. (2000). LDL-receptor-related proteins in Wnt signal transduction. Nature 407, 530–535.
Tamai, K., Zeng, X., Liu, C., Zhang, X., Harada, Y., Chang, Z., and He, X. (2004). A mechanism for Wnt coreceptor activation. Mol. Cell 13, 149–156.
Tandon, B., Peterson, L., Gao, J., Nelson, B., Ma, S., Rosen, S., and Chen, Y.-H. (2011). Nuclear overexpression of lymphoid-enhancer-binding factor 1 identifies chronic lymphocytic leukemia/small lymphocytic lymphoma in small B-cell lymphomas. Mod. Pathol. Off. J. U. S. Can. Acad. Pathol. Inc 24, 1433–1443.
Tang, X., Wu, Y., Belenkaya, T.Y., Huang, Q., Ray, L., Qu, J., and Lin, X. (2012). Roles of N-glycosylation and lipidation in Wg secretion and signaling. Dev. Biol. 364, 32–41.
Tetsu, O., and McCormick, F. (1999). Beta-catenin regulates expression of cyclin D1 in colon carcinoma cells. Nature 398, 422–426.
Thomas, K.R., and Capecchi, M.R. (1990). Targeted disruption of the murine int-1 proto-oncogene resulting in severe abnormalities in midbrain and cerebellar development. Nature 346, 847–850.
Topol, L., Chen, W., Song, H., Day, T.F., and Yang, Y. (2009). Sox9 inhibits Wnt signaling by promoting beta-catenin phosphorylation in the nucleus. J. Biol. Chem. 284, 3323–3333.
131
Travis, A., Amsterdam, A., Belanger, C., and Grosschedl, R. (1991). LEF-1, a gene encoding a lymphoid-specific protein with an HMG domain, regulates T-cell receptor alpha enhancer function [corrected]. Genes Dev. 5, 880–894.
Tsukamoto, A.S., Grosschedl, R., Guzman, R.C., Parslow, T., and Varmus, H.E. (1988). Expression of the int-1 gene in transgenic mice is associated with mammary gland hyperplasia and adenocarcinomas in male and female mice. Cell 55, 619–625.
Ulloa, F., and Martí, E. (2010). Wnt won the war: Antagonistic role of Wnt over Shh controls dorso-ventral patterning of the vertebrate neural tube. Dev. Dyn. 239, 69–76.
Vadlamudi, U., Espinoza, H.M., Ganga, M., Martin, D.M., Liu, X., Engelhardt, J.F., and Amendt, B.A. (2005). PITX2, beta-catenin and LEF-1 interact to synergistically regulate the LEF-1 promoter. J. Cell Sci. 118, 1129–1137.
Varnum-Finney, B., Xu, L., Brashem-Stein, C., Nourigat, C., Flowers, D., Bakkour, S., Pear, W.S., and Bernstein, I.D. (2000). Pluripotent, cytokine-dependent, hematopoietic stem cells are immortalized by constitutive Notch1 signaling. Nat. Med. 6, 1278–1281.
Waaler, J., Machon, O., Tumova, L., Dinh, H., Korinek, V., Wilson, S.R., Paulsen, J.E., Pedersen, N.M., Eide, T.J., Machonova, O., et al. (2012). A novel tankyrase inhibitor decreases canonical Wnt signaling in colon carcinoma cells and reduces tumor growth in conditional APC mutant mice. Cancer Res. 72, 2822–2832.
Wang, W., Ji, P., Steffen, B., Metzger, R., Schneider, P.M., Halfter, H., Schrader, M., Berdel, W.E., Serve, H., and Müller-Tidow, C. (2005). Alterations of lymphoid enhancer factor-1 isoform expression in solid tumors and acute leukemias. Acta Biochim. Biophys. Sin. 37, 173–180.
Wharton, K.A., Jr (2003). Runnin’ with the Dvl: proteins that associate with Dsh/Dvl and their significance to Wnt signal transduction. Dev. Biol. 253, 1–17.
Wielenga, V.J., Smits, R., Korinek, V., Smit, L., Kielman, M., Fodde, R., Clevers, H., and Pals, S.T. (1999). Expression of CD44 in Apc and Tcf mutant mice implies regulation by the WNT pathway. Am. J. Pathol. 154, 515–523.
Willander, K., Dutta, R.K., Ungerbäck, J., Gunnarsson, R., Juliusson, G., Fredrikson, M., Linderholm, M., and Söderkvist, P. (2013). NOTCH1 mutations influence survival in chronic lymphocytic leukemia patients. BMC Cancer 13, 274.
Willert, K., Shibamoto, S., and Nusse, R. (1999). Wnt-induced dephosphorylation of axin releases beta-catenin from the axin complex. Genes Dev. 13, 1768–1773.
Williams, J.L., Kashfi, K., Ouyang, N., del Soldato, P., Kopelovich, L., and Rigas, B. (2004). NO-donating aspirin inhibits intestinal carcinogenesis in Min (APC(Min/+)) mice. Biochem. Biophys. Res. Commun. 313, 784–788.
Williams, J.L., Ji, P., Ouyang, N., Kopelovich, L., and Rigas, B. (2011). Protein nitration and nitrosylation by NO-donating aspirin in colon cancer cells: Relevance to its mechanism of action. Exp. Cell Res. 317, 1359–1367.

132
Wu, D., and Pan, W. (2010). GSK3: a multifaceted kinase in Wnt signaling. Trends Biochem. Sci. 35, 161–168.
Wu, Q.-L., Zierold, C., and Ranheim, E.A. (2009). Dysregulation of Frizzled 6 is a critical component of B-cell leukemogenesis in a mouse model of chronic lymphocytic leukemia. Blood 113, 3031–3039.
Yamamoto, H., Kishida, S., Kishida, M., Ikeda, S., Takada, S., and Kikuchi, A. (1999). Phosphorylation of axin, a Wnt signal negative regulator, by glycogen synthase kinase-3beta regulates its stability. J. Biol. Chem. 274, 10681–10684.
Yamanaka, H., Moriguchi, T., Masuyama, N., Kusakabe, M., Hanafusa, H., Takada, R., Takada, S., and Nishida, E. (2002). JNK functions in the non-canonical Wnt pathway to regulate convergent extension movements in vertebrates. EMBO Rep. 3, 69–75.
Yan, D., Wiesmann, M., Rohan, M., Chan, V., Jefferson, A.B., Guo, L., Sakamoto, D., Caothien, R.H., Fuller, J.H., Reinhard, C., et al. (2001). Elevated expression of axin2 and hnkd mRNA provides evidence that Wnt/beta -catenin signaling is activated in human colon tumors. Proc. Natl. Acad. Sci. U. S. A. 98, 14973–14978.
Yoshikawa, H., Matsubara, K., Zhou, X., Okamura, S., Kubo, T., Murase, Y., Shikauchi, Y., Esteller, M., Herman, J.G., Wei Wang, X., et al. (2007). WNT10B functional dualism: beta-catenin/Tcf-dependent growth promotion or independent suppression with deregulated expression in cancer. Mol. Biol. Cell 18, 4292–4303.
Yoshikawa, S., McKinnon, R.D., Kokel, M., and Thomas, J.B. (2003). Wnt-mediated axon guidance via the Drosophila Derailed receptor. Nature 422, 583–588.
Yu, H.-M.I., Jerchow, B., Sheu, T.-J., Liu, B., Costantini, F., Puzas, J.E., Birchmeier, W., and Hsu, W. (2005). The role of Axin2 in calvarial morphogenesis and craniosynostosis. Dev. Camb. Engl. 132, 1995–2005.
Zeng, X., Tamai, K., Doble, B., Li, S., Huang, H., Habas, R., Okamura, H., Woodgett, J., and He, X. (2005). A dual-kinase mechanism for Wnt co-receptor phosphorylation and activation. Nature 438, 873–877.
Zenz, T., Kröber, A., Scherer, K., Häbe, S., Bühler, A., Benner, A., Denzel, T., Winkler, D., Edelmann, J., Schwänen, C., et al. (2008). Monoallelic TP53 inactivation is associated with poor prognosis in chronic lymphocytic leukemia: results from a detailed genetic characterization with long-term follow-up. Blood 112, 3322–3329.
Zhang, Q., Major, M.B., Takanashi, S., Camp, N.D., Nishiya, N., Peters, E.C., Ginsberg, M.H., Jian, X., Randazzo, P.A., Schultz, P.G., et al. (2007). Small-molecule synergist of the Wnt/β-catenin signaling pathway. Proc. Natl. Acad. Sci. 104, 7444–7448.
Zhou, P., Byrne, C., Jacobs, J., and Fuchs, E. (1995). Lymphoid enhancer factor 1 directs hair follicle patterning and epithelial cell fate. Genes Dev. 9, 700–713.

133
8 Additional Information
8.1 Supplemental data
Supp. Fig. 1 WNT3a CLL cell survival upon stimulation with increasing concentrations of Wnt3a after 48 h. CLL cells were treated with rhWnt5a or BSA (1 ng/mL, 10 ng/mL, 100 ng/mL, 200 ng/mL and 500 ng/mL). After 48 h cells were collected, stained with Annexin V/7AAD and tested for survival through FACS. Values were normalized to UTR control. Number of experiments n=3. [Performed by Francesca Tettamanzi]
Supp. Fig. 2 WNT5a CLL cell survival upon stimulation with increasing concentrations of Wnt3a after 48 h. CLL cells were treated with rhWnt5a or BSA (1 ng/mL, 10 ng/mL, 100 ng/mL, 200 ng/mL and 500 ng/mL). After 48 h cells were collected, stained with Annexin V/7AAD and tested for survival through FACS. Values were normalized to UTR control. Number of experiments n=3. [Performed by Francesca Tettamanzi]

134
Supp. Fig. 3 Influence of the proposed synergistic action of QS-11 and rhWnt3a on CLL cell survival under normal (A) or serum starved conditions (B). CLL cells were incubated with QS-11 (10 μM), rhWnt3a (100 ng/mL) or a combination of the two molecules under normal or serum starved conditions. DMSO control was also included. After 24h CLL cells were collected, subjected to Annexin V/7AAD staining and tested for viability through FACS. Number of experiments n=6. [Performed by Francesca Tettamanzi]
Supp. Fig. 4 Chemical structure of newly developed NO-ASA derivatives [Sylvia Krallmann]
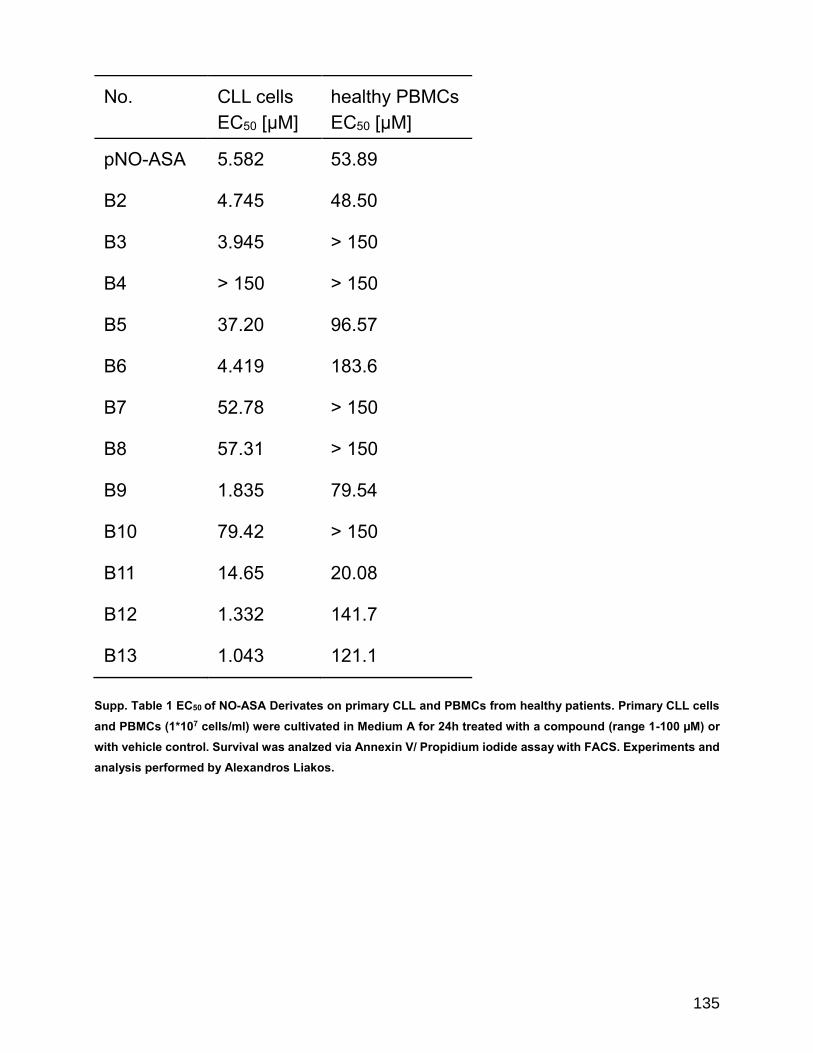
135
No. CLL cells EC50 [µM]
healthy PBMCs EC50 [µM]
pNO-ASA 5.582 53.89
B2 4.745 48.50
B3 3.945 > 150
B4 > 150 > 150
B5 37.20 96.57
B6 4.419 183.6
B7 52.78 > 150
B8 57.31 > 150
B9 1.835 79.54
B10 79.42 > 150
B11 14.65 20.08
B12 1.332 141.7
B13 1.043 121.1 Supp. Table 1 EC50 of NO-ASA Derivates on primary CLL and PBMCs from healthy patients. Primary CLL cells and PBMCs (1*107 cells/ml) were cultivated in Medium A for 24h treated with a compound (range 1-100 µM) or with vehicle control. Survival was analzed via Annexin V/ Propidium iodide assay with FACS. Experiments and analysis performed by Alexandros Liakos.

136
Supp. Fig. 5 NFκB Phosphorylation status. CLL cells were treated for three hours in with the substance indicated or DMSO as vehicle control. Cells were harvested lysed and probed for p- NFκB and total NFκB. GAPDH serves as loading control. Experiment was performed at least three times by Sylvia Krallmann

137
Supp. Fig. 6 NFκB Phosphorylation status. CLL cells were treated for three hours in with the substance indicated or DMSO as vehicle control. Cells were harvested lysed and probed for p- NFκB and total NFκB. GAPDH serves as loading control. Experiment was performed at least three times by Sylvia Krallmann
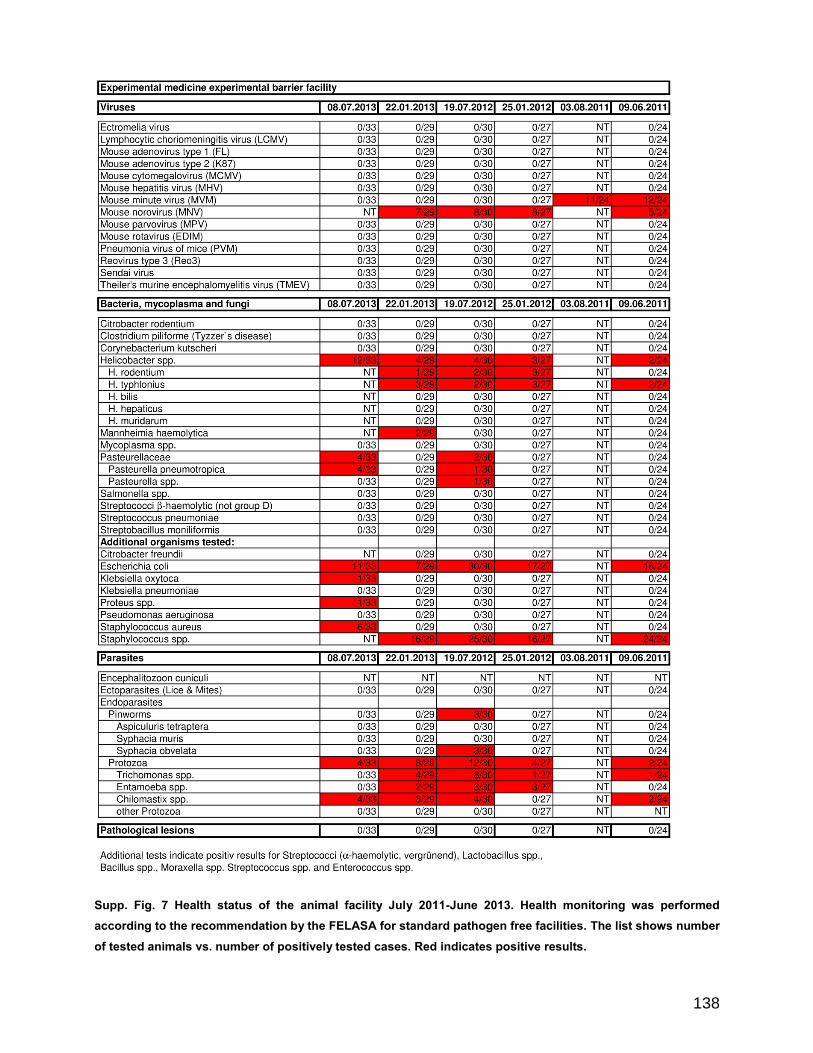
138
Supp. Fig. 7 Health status of the animal facility July 2011-June 2013. Health monitoring was performed according to the recommendation by the FELASA for standard pathogen free facilities. The list shows number of tested animals vs. number of positively tested cases. Red indicates positive results.

139
9 Acknowledgements Für Ihre herrausragende Unterstützung und ihre Liebe danke ich ganz besonders
Magdalena Hertweck und meinen Eltern.
Für den Erhalt meiner geistigen Gesundheit unverzichtbar waren meine Schwester Jana,
ihre beiden Jungs Nils und Thorvid, sowie mein Freund Kian Giahi.
Außerdem danke ich allen die mir in den viereinhalb Jahren beigestanden haben. Das
waren vor allem Alexandros Liakos, Regina Razavi, Lukas Peiffer, Sylvia Krallmann,
Alexandra Filipovich, Felix Erdfelder, Francesca Tettamanzi, Sabrina Uhrmacher, Iris
Gehrke, Julian Paesler, Nils Lilienthal, Mark Krüger, Jörg Kessler & Mirella Stecki.
Ein ganz besonderer Dank geht an Dr. Daniel Kessler ohne den ich keine Doktorarbeit
angefangen hätte.
Ich danke außerdem den Jungs von den Blue-Bowling-Bulls, ohne die mein Leben nicht
so schön, aber meine Leber wesentlich gesünder wäre.
Für die finanzielle und moralische Unterstützung danke ich Herman Arens und Ilse
Neuwald.
Ich danke außerdem Prof. Dr. Michael Hallek, Prof. Dr. Verena Jendrossek und Dr. Karl-
Anton Kreuzer, ohne die diese Arbeit nicht möglich gewesen wäre.
Mein Dank gilt auch Attila, dem besten Mäuserich der Welt. Ruhe in Frieden.
Als letztes danke ich Hanna Flamme, welche meine Arbeit fortführt, für ein paar lustige
Monate im Labor. Ich hoffe sie hat bei mir gerlernt oben und unten zu unterscheiden (ist
manchmal schwierig).

140
10 Declarations Die der vorliegenden Arbeit zugrunde liegenden Experimente wurden von April 2009 bis September 2014 im Labor für Molekulare Hämatologie und Onkologie der Klinik I für Innere Medizin der Universität zu Köln durchgeführt. 1. Gutachter: * 2. Gutachter: * 3. Gutachter: * Vorsitzender des Prüfungsausschusses: * Tag der mündlichen Prüfung:

141
Erklärung: Die Gelegenheit zum vorliegenden Promotionsverfahren ist mir nicht kommerziell vermittelt worden. Insbesondere habe ich keine Organisation eingeschaltet, die gegen Entgelt Betreuerinnen und Betreuer für die Anfertigung von Dissertationen sucht oder die mir obliegenden Pflichten hinsichtlich der Prüfungsleistungen für mich ganz oder teilweise erledigt. Hilfe Dritter wurde bis jetzt und wird auch künftig nur in wissenschaftlich vertretbarem undprüfungsrechtlich zulässigem Ausmaß in Anspruch genommen. Mir ist bekannt, dass Unwahrheiten hinsichtlich der vorstehenden Erklärung die Zulassung zur Promotion ausschließen bzw. später zum Verfahrensabbruch oder zur Rücknahme des Titels führen können
Essen, den _________________ ______________________________
Simon Jonas Poll-Wolbeck
Erklärung: Hiermit erkläre ich, gem. § 7 Abs. 2,d und f der Promotionsordnung der Fakultätfür Biologiezur Erlangung des Dr. rer. nat., dass ich die vorliegende Dissertation selbständig verfasst und mich keiner anderen als der angegebenen Hilfsmittel bedient habe und alle wörtlich oder inhaltlich übernommenen Stellen als solche gekennzeichnet habe
Essen, den _________________ ______________________________
Simon Jonas Poll-Wolbeck
142
Curriculum vitae
Ausbildung
Arbeits- und Forschungserfahrung
Persönliches
Simon Jonas Poll-Wolbeck, Biologe (M. Sc.)
geboren
Staatsangehörigkeit:
Familienstand:
143
Sprechkenntnisse
Patente
Drittmittelförderung
2012 Förderung durch die Deutsche Krebshilfe: “NO-ASA Derivate: neue Substanzen für die experimentelle Therapie der chronischen lymphatischen Leukämie”, 110,000.00 € in zwei Jahren
Antragsteller: Prof. Dr. Karl-Anton Kreuzer
Autor des Antrags: Simon Jonas Poll-Wolbeck
2010 Förderung durch die Else Kröner Fresenius Stiftung: “Influence of constitutively active WNT signaling on the survival of chronic lymphocytic leukemia (CLL) cells and its experimental antagonization”, 192,100.00 € in zwei Jahren (P29/10 // A41/10)
Antragsteller: Prof. Dr. Karl-Anton Kreuzer
Autor des Antrags: Simon Jonas Poll-Wolbeck
Wissenschaftliche Vorträge
2013 Jahrestagung der Deutschen Gesellschaft für Hämatologie und Medizinische Onkologie e.V., Wien, Österreich. “The role of LEF1 in B cell homeostasis: Insights for chronic lymphocytic leukemia (CLL)” [Oktober 2013]
2012 XXXIV Weltkongress der „International Society of Hematology“ in Cancun, Mexiko. “Quinone Methide Releasing Nitric Oxide Acetyl Salicylic Acid (NO-ASA) Derivatives: A Potential New Substance Class for the Treatment of Chronic Lymphocytic Leukemia“ [April 2010]
144
1. Peiffer L, Poll-Wolbeck SJ (shared first author), Hallek M, Kreuzer K-A. The HDAC inhibitor Trichostatin A
induces apoptosis in chronic lymphocytic leukemia cells (CLL) in a highly effective and selective manner. 2014; J Cancer Res Clin Oncol. 2014 140(8):1283-93
2. Krallmann S, Poll-Wolbeck SJ (shared first author), Flamme H, Liakos A, Krüger M, Berkessel A, u. a. Novel
quinone methide precursors: enhanced sensitivity and selectivity towards chronic lymphocytic leukemia (CLL) cells. 2014; [accepted in Blood Cancer Journal]
3. Paesler J, Gehrke I, Poll-Wolbeck SJ, Kreuzer K-A. Targeting the vascular endothelial growth factor in
hematologic malignancies. Eur J Haematol. November 2012;89(5):373–84.
4. Gehrke I, Gandhirajan RK, Poll-Wolbeck SJ, Hallek M, Kreuzer K-A. Bone marrow stromal cell-derived
vascular endothelial growth factor (VEGF) rather than chronic lymphocytic leukemia (CLL) cell-derived VEGF is essential for the apoptotic resistance of cultured CLL cells. Mol Med Camb Mass. 2011;17(7-8):619–27.
5. Razavi R, Gehrke I, Gandhirajan RK, Poll-Wolbeck SJ, Hallek M, Kreuzer K-A. Nitric oxide-donating
acetylsalicylic acid induces apoptosis in chronic lymphocytic leukemia cells and shows strong antitumor efficacy in vivo. Clin Cancer Res Off J Am Assoc Cancer Res. 15. Januar 2011;17(2):286–93.
6. Filipovich A, Gehrke I, Poll-Wolbeck SJ, Kreuzer K-A. Physiological inhibitors of Wnt signaling. Eur J
Haematol. Juni 2011;86(6):453–65.
7. Gehrke I, Razavi R, Poll-Wolbeck SJ, Berkessel A, Hallek M, Kreuzer K-A. The Antineoplastic Effect of Nitric
Oxide-Donating Acetylsalicylic Acid (NO-ASA) in Chronic Lymphocytic Leukemia (CLL) Cells is Highly Dependent on its Positional Isomerism. Ther Adv Hematol. Oktober 2011;2(5):279–89.
8. Uhrmacher S, Schmidt C, Erdfelder F, Poll-Wolbeck SJ, Gehrke I, Hallek M, u. a. Use of the receptor tyrosine
kinase-like orphan receptor 1 (ROR1) as a diagnostic tool in chronic lymphocytic leukemia (CLL). Leuk Res. Oktober 2011;35(10):1360–6.
9. Gandhirajan RK, Poll-Wolbeck SJ, Gehrke I, Kreuzer K-A. Wnt/β-catenin/LEF-1 signaling in chronic
lymphocytic leukemia (CLL): a target for current and potential therapeutic options. Curr Cancer Drug Targets. November 2010;10(7):716–27.
10. Filipovich A, Gandhirajan RK, Gehrke I, Poll-Wolbeck SJ, Kreuzer K-A. Evidence for non-functional Dickkopf-
1 (DKK-1) signaling in chronic lymphocytic leukemia (CLL). Eur J Haematol. Oktober 2010;85(4):309–13.
11. Paesler J, Gehrke I, Gandhirajan RK, Filipovich A, Hertweck M, Erdfelder F, Poll-Wolbeck SJ u. a. The
vascular endothelial growth factor receptor tyrosine kinase inhibitors vatalanib and pazopanib potently induce apoptosis in chronic lymphocytic leukemia cells in vitro and in vivo. Clin Cancer Res Off J Am Assoc Cancer Res. 1. Juli 2010;16(13):3390–8.
Sonstiges
Köln der 26.10.2014 __________________________________
Simon Jonas Poll-Wolbeck
Publikationen

145
Erklärung: Hiermit erkläre ich, gem. § 7 Abs. (2) d) + f) der Promotionsordnung der Fakultäten für Biologie, Chemie und Mathematik zur Erlangung des Dr. rer. nat., dass ich keine anderen Promotionen bzw. Promotionsversuche in der Vergangenheit durchgeführt habe und dass diese Arbeit von keiner anderen Fakultät/Fachbereich abgelehnt worden ist.
Essen, den _________________ ______________________________
Simon Jonas Poll-Wolbeck
Erklärung: Hiermit erkläre ich, gem. § 7 Abs. 2, e und g der Promotionsordnung der Fakultätfür Biologie zur Erlangung des Dr. rer. nat., dass ich keine anderen Promotionen bzw. Promotionsversuche in der Vergangenheit durchgeführt habe, dass diese Arbeit von keiner anderen Fakultät abgelehnt worden ist, und dass ich die Dissertation nur in diesem Verfahren einreiche.
Essen, den _________________ ______________________________
Simon Jonas Poll-Wolbeck
Erklärung: Hiermit erkläre ich, gem. § 6 Abs. 2,g der Promotionsordnung der Fakultätfür Biologie zur Erlangung der Dr. rer. nat., dass ich das Arbeitsgebiet, dem das Thema „The role of LEF1 and the WNT signaling pathway in B cell development and leukemia“ zuzuordnen ist, in Forschung und Lehre vertrete und den Antrag von Simon Jonas Poll-Wolbeck befürworte.
Essen, den __________________ _______________________
Prof. Dr. Verena Jendrossek