Anthropogenic impact on biogenic Si pools
29
BGD 8, 4391–4419, 2011 Anthropogenic impact on biogenic Si pools W. Clymans et al. Title Page Abstract Introduction Conclusions References Tables Figures Back Close Full Screen / Esc Printer-friendly Version Interactive Discussion Discussion Paper | Discussion Paper | Discussion Paper | Discussion Paper | Biogeosciences Discuss., 8, 4391–4419, 2011 www.biogeosciences-discuss.net/8/4391/2011/ doi:10.5194/bgd-8-4391-2011 © Author(s) 2011. CC Attribution 3.0 License. Biogeosciences Discussions This discussion paper is/has been under review for the journal Biogeosciences (BG). Please refer to the corresponding final paper in BG if available. Anthropogenic impact on biogenic Si pools in temperate soils W. Clymans 1 , E. Struyf 2 , G. Govers 1 , F. Vandevenne 2 , and D. J. Conley 3 1 Department of Earth and Environmental Sciences, Catholic University Leuven, Heverlee, Belgium 2 Department of Biology, Ecosystem Management Research Group, University of Antwerp, Wilrijk, Belgium 3 Department of Earth and Ecosystem Sciences, Lund University, Lund, Sweden Received: 25 March 2011 – Accepted: 28 April 2011 – Published: 5 May 2011 Correspondence to: W. Clymans ([email protected]) Published by Copernicus Publications on behalf of the European Geosciences Union. 4391
Transcript of Anthropogenic impact on biogenic Si pools

BGD8, 4391–4419, 2011
Anthropogenicimpact on biogenic Si
pools
W. Clymans et al.
Title Page
Abstract Introduction
Conclusions References
Tables Figures
J I
J I
Back Close
Full Screen / Esc
Printer-friendly Version
Interactive Discussion
Discussion
Paper
|D
iscussionP
aper|
Discussion
Paper
|D
iscussionP
aper|
Biogeosciences Discuss., 8, 4391–4419, 2011www.biogeosciences-discuss.net/8/4391/2011/doi:10.5194/bgd-8-4391-2011© Author(s) 2011. CC Attribution 3.0 License.
BiogeosciencesDiscussions
This discussion paper is/has been under review for the journal Biogeosciences (BG).Please refer to the corresponding final paper in BG if available.
Anthropogenic impact on biogenic Sipools in temperate soilsW. Clymans1, E. Struyf2, G. Govers1, F. Vandevenne2, and D. J. Conley3
1Department of Earth and Environmental Sciences, Catholic University Leuven, Heverlee,Belgium2Department of Biology, Ecosystem Management Research Group, University of Antwerp,Wilrijk, Belgium3Department of Earth and Ecosystem Sciences, Lund University, Lund, Sweden
Received: 25 March 2011 – Accepted: 28 April 2011 – Published: 5 May 2011
Correspondence to: W. Clymans ([email protected])
Published by Copernicus Publications on behalf of the European Geosciences Union.
4391

BGD8, 4391–4419, 2011
Anthropogenicimpact on biogenic Si
pools
W. Clymans et al.
Title Page
Abstract Introduction
Conclusions References
Tables Figures
J I
J I
Back Close
Full Screen / Esc
Printer-friendly Version
Interactive Discussion
Discussion
Paper
|D
iscussionP
aper|
Discussion
Paper
|D
iscussionP
aper|
Abstract
Human land use changes directly affect silica (Si) mobilisation and Si storage in ter-restrial ecosystems and influence Si export from the continents, although the mag-nitudes of the impact are unknown. Yet biogenic silica (BSi) in soils is an under-studied aspect. We have quantified and compared total biogenic (PSia) and eas-5
ily soluble (PSie) Si pools at four sites along a gradient of disturbance in south-ern Sweden. An estimate of the magnitude of change in temperate continental BSipools due to human disturbance is provided. Land use clearly affects BSi poolsand their distribution. Total PSia and PSie for a continuous forested site at Sigga-boda Nature Reserve (66 900±22 800 kg SiO2 ha−1 and 952±16 kg SiO2 ha−1) are10
significantly higher than disturbed land use types from the Rashult Culture Reserveincluding arable land (28 800±7200 kg SiO2 ha−1 and 239±91 kg SiO2 ha−1), pas-ture sites (27 300±5980 kg SiO2 ha−1 and 370±129 kg SiO2 ha−1) and grazed forest(23 600±6370 kg SiO2 ha−1 and 346±123 kg SiO2 ha−1). Vertical PSia and PSie pro-files show significant (p<0.05) variation among the sites. These differences in size and15
distribution are interpreted as the long-term effect of reduced BSi replenishment andincreased mobilisation of the PSia in disturbed soils. In temperate regions, total PSiashowed a 10 % decline since agricultural development (3000BCE). Recent agriculturalexpansion (after 1700CE) has resulted in an average export of 1.1±0.8 Tmol Si yr−1,leading to an annual contribution of ca. 20 % to the global land-ocean Si flux carried by20
rivers. Human activities clearly exert a long-term influence on Si cycling in soils andcontribute significantly to the land-ocean Si flux.
1 Introduction
It is well known that the oceanic biogeochemical cycle of Si is driven by biological pro-cesses. (Treguer et al., 1995). Studies on biogenic silica (BSi) dynamics have focused25
mostly on marine environments (DeMaster, 2002; Ragueneau et al., 2006). In the
4392

BGD8, 4391–4419, 2011
Anthropogenicimpact on biogenic Si
pools
W. Clymans et al.
Title Page
Abstract Introduction
Conclusions References
Tables Figures
J I
J I
Back Close
Full Screen / Esc
Printer-friendly Version
Interactive Discussion
Discussion
Paper
|D
iscussionP
aper|
Discussion
Paper
|D
iscussionP
aper|
oceanic and coastal zone, Si is an essential nutrient for diatom production and con-sequent diatom burial promotes carbon sequestration in the ocean depths (Brzezinski,1985; Dugdale et al., 1995). The terrestrial and marine Si cycle are linked throughthe riverine fluxes of Si, which replenish the BSi lost to the deep oceans after burial ofdiatoms (Laruelle et al., 2009), supporting oceanic primary production.5
In parallel to the biological control on oceanic Si cycling, there is growing evidenceillustrating the importance of biological Si cycling in terrestrial ecosystems (Meunier etal., 1999; Conley, 2002; Van Cappellen, 2003). Large amounts of BSi are stored in ter-restrial soils, primarily in the form of plant siliceous bodies called phytoliths. (Alexandreet al., 1997). BSi in the soil originates from litterfall from vegetation after die-off. Uptake10
of DSi in the vegetation and dissolution of BSi in soils was shown to control DSi exportto rivers from catchments dominated by boreal wetlands (Struyf et al., 2010a), forests(Gerard et al., 2008) and grasslands (Blecker et al., 2006). Due to the terrestrial-oceanlink in the global Si cycle, and the increasing evidence of the importance of anthro-pogenic disturbance on ecosystems in controlling terrestrial Si outputs, the study of15
BSi in terrestrial soils is now considered a crucial yet understudied aspect in our un-derstanding of global Si cycling (Street-Perrott and Barker, 2008; Struyf and Conley,2009).
Recent papers have demonstrated that land use changes can have significant effectson Si mobilization from the continents (Conley, 1997; Struyf et al., 2010b). Struyf et20
al. (2010b) showed that in temperate European watersheds sustained human cultiva-tion led to a two-to threefold decrease in base flow delivery of Si to rivers. A conceptualmodel was proposed relating changes in Si fluxes to long-term soil disturbance. Themodel is based on the short-term (<20 yrs; Conley et al., 2008) and long-term (500–1000 yrs) response of riverine Si fluxes following deforestation and historical agricul-25
tural expansion (Struyf et al., 2010b) and is comprised of four different stages: devel-oping forest, climax forest, recently deforested areas and sustained cultivated areas.The authors suggest that developing forests stimulate mineral weathering. The majorpart of the weathered DSi is taken up by plants and deposited as BSi in biomass. The
4393

BGD8, 4391–4419, 2011
Anthropogenicimpact on biogenic Si
pools
W. Clymans et al.
Title Page
Abstract Introduction
Conclusions References
Tables Figures
J I
J I
Back Close
Full Screen / Esc
Printer-friendly Version
Interactive Discussion
Discussion
Paper
|D
iscussionP
aper|
Discussion
Paper
|D
iscussionP
aper|
amount of BSi annually added to soil is higher than the DSi leaching, creating a strongnet BSi sink. As BSi mobilization through dissolution can be assumed to increase withincreasing soil BSi stock, a near-equilibrium between BSi production and removal mayeventually be reached under climax forest. When deforestation occurs, removal of BSifrom the soil system is increased through different pathways. Vegetation water con-5
sumption is lowered, thereby increasing soil water and groundwater fluxes promotingleaching, which may be further enhanced by organic matter decomposition. Addition-ally, increased soil erosion may lead to the physical removal of BSi. After this initialflush, Si fluxes gradually decrease as crop harvesting and continuous soil disturbanceprevents replenishment of the BSi stock. A new state with a reduced soil Si stock is10
reached in heavily cultivated land. The absence of significant soil BSi stocks result inlow export fluxes of total Si compared to continuous and early deforested areas.
These findings emphasize the differences in biogeochemical Si cycling between var-ious land uses and the impact of management of land use practices on the global Sicycle. Yet, information about the timescales associated with the transitions between15
different deforestation stages in the conceptual model is at present lacking. Key dataneeded to validate the model and to constrain the time scales involved are BSi stocksunder different land uses, preferentially with known dates of deforestation or reforesta-tion. However, no systematic surveys on the distribution of BSi in the soil as a functionof land use and age of disturbance is available. We therefore aim to quantify and com-20
pare the distribution of total biogenic and easily soluble Si pools under different landuses, and compare bio-reactive Si stocks between the land use types. Comparison ofdifferent land use types will allow for assessing the response of BSi stocks to humanimpact. We provide a first evaluation of the concepts introduced by Struyf et al. (2010b)and provide an estimate for the time scale and the magnitude of the changes in con-25
tinental BSi stocks in temperate regions due to cultivation of the landscape. Finally,we assess how this has impacted the total riverine Si flux from the continents to thecoastal zone.
4394

BGD8, 4391–4419, 2011
Anthropogenicimpact on biogenic Si
pools
W. Clymans et al.
Title Page
Abstract Introduction
Conclusions References
Tables Figures
J I
J I
Back Close
Full Screen / Esc
Printer-friendly Version
Interactive Discussion
Discussion
Paper
|D
iscussionP
aper|
Discussion
Paper
|D
iscussionP
aper|
2 Materials and methods
2.1 Study area
Biogenic silica (BSi) pools within soil profiles were assessed under different land usetypes including pastures, arable land and forests. The sites had similar soil proper-ties, geological history, climate and topography, but differed in land cover history and5
anthropogenic influences. All sites were located in southern Sweden: one at Sigga-boda (continuous forest) and three at Rashult (grazed forest, pasture and arable land),located ca. 30 km northwest of Siggaboda.
Siggaboda is a 71 ha nature reserve in Smaland, southern Sweden (56◦27′ N,14◦12′ E) that has been continuously forested for at least 2700 years and is co-10
dominated by beech (Fagus sylvatica) and pine (Picea abies). Evidence for anthro-pogenic impact in the past three millenia is lacking. Deglaciation occurred approxi-mately 14 500 years ago. Rashult is a cultural reserve near Almhult (56◦36′ N, 14◦11′ E)and is best known as Carl Linnaeus’ birth place. The area has a typical infield-outfieldstructure with traditionally tilled crop fields and hay meadows in the vicinity of the home-15
stead (i.e. infields) and grazing areas, both pasture and forest, at a distance (i.e. out-fields) (Lindbladh and Bradshaw, 1998) (Fig. 1). In both areas soils have developedon moraine material overlying granitic to gneissic bedrock and are located within theboreal-nemoral vegetation zone with a mean annual precipitation of ca. 700 mm yr−1.The mean annual temperature is ca. 5 ◦C, with the July mean lying between 15 and20
16 ◦C, and the January mean lying between −2 ◦C and −3 ◦C. Both areas have an un-dulating topography with slope gradients generally below 5 %.
The agricultural system in Rashult has not undergone any major changes since 1545(Sweden Land Registry). The oldest indications of human impact are graves and cairnsdating to the Bronze Age (1000–500BCE). The landnam was an interplay between pe-25
riods of deforestation and agricultural expansion and periods of population decline andreforestation. (Lageras, 2007). The first permanent settlements in southern Swedenwere established during the early Iron Age (500BCE–400CE). Farmers abandoned the
4395
BGD8, 4391–4419, 2011
Anthropogenicimpact on biogenic Si
pools
W. Clymans et al.
Title Page
Abstract Introduction
Conclusions References
Tables Figures
J I
J I
Back Close
Full Screen / Esc
Printer-friendly Version
Interactive Discussion
Discussion
Paper
|D
iscussionP
aper|
Discussion
Paper
|D
iscussionP
aper|
area again in the late Iron Age (400–1000CE) and people resettled the area again inthe 12th and 13th century. From this point on, two major periods of agricultural set-tlement and abandonment can be distinguished (Lageras, 2007). The first coincideswith the trans-European occurrence of the Black Death (14th and 15th century) andthe second is related to depopulation of the countryside and the introduction of forestry5
(19th and 20th century). Two reform acts affected agricultural development in the areabut were of minor importance in Rashult. The Land Division Reform (mid 17th cen-tury), was an unsuccessful attempt to group scattered properties. The Land EnclosureReform, which started in the 19th century and continued in the 20th century, regroupedproperties all over the country. At Rashult , the impact of these reforms was limited to10
administrative aspects such as property rights, while the Land Enclosure Reform cre-ated a strong intensification of agriculture elsewhere in southern Sweden (Lindbladhand Bradshaw, 1995).
2.2 Field sampling
An automatic hammer auger was used to take continuous cores of the soil pedons at15
the different sites. In total, 29 cores were taken at random places within different landuse types including 7 in arable land, 8 in pasture, 8 in grazed forest and 6 in continuousforest. An overview is given in Table 1. Except when stones obstructed augering, coreswere taken until the C-horizon (i.e. parent material).
2.3 Laboratory analysis20
2.3.1 Soil properties
Soil samples were analysed every five centimetres within each horizon. Cores werecut, oven dried at 50 ◦C and stored in a cold room (4 ◦C). Thereafter samples werehomogenized by mortar and pestle and sieved through a 2 mm mesh. Carbon con-tents were measured with a vario MAX CN Macro Elemental Analyzer (Elementar25
4396

BGD8, 4391–4419, 2011
Anthropogenicimpact on biogenic Si
pools
W. Clymans et al.
Title Page
Abstract Introduction
Conclusions References
Tables Figures
J I
J I
Back Close
Full Screen / Esc
Printer-friendly Version
Interactive Discussion
Discussion
Paper
|D
iscussionP
aper|
Discussion
Paper
|D
iscussionP
aper|
Analysensysteme GmbH, Germany). The grain size distribution was determined us-ing a Coulter Counter LS 13 320 (Beckman Coulter, USA). Soil pH was measuredusing a glass electrode in 0.01 M CaCl2 suspensions at a soil-to-solution ratio of 1:5.
2.3.2 Alkali-Extraction: total biogenic silica pool
The Na2CO3 extraction is a weak-base method originating from DeMaster. (1981) who5
found that (1) alumino-silicates release Si linearly over time and (2) that most BSidissolves completely in the first 2 h of the digestion. The alkaline (Na2CO3) extractionprocedure for BSi digests various fractions (i.e. biogenic silica, absorbed silica, non-crystalline amorphous silica); all defined as amorphous silica (Sauer et al., 2006). Wetherefore refer to the extracted Si pool as the alkali-extractable Si, CSia (Cornelis et10
al., in press). The reliability of the method has been shown for forested soils (Sacconeet al., 2007) and wetland soils (Struyf and Conley, 2009). Approximately 30 mg ofdried soil (<2 mm) was mixed in 40 ml of 0.094 M Na2CO3 solution and digested for5 h at 85 ◦C. A 1 ml aliquot was removed from the sample bottle after 3, 4 and 5 h andneutralized with 9 ml of 0.021 M HCl, before DSi determination (CSid) by the automated15
molybdate-blue method (Grasshoff et al., 1983). The total extracted silica concentration(CSit, g SiO2 kg−1) was calculated for each of the aliquots from:
CSit =CSid ·0.04 ·60 ·10
Sample Weight(1)
where 10 is the HCl dilution factor, 60 is the molecular mass of SiO2 and 0.04 (litre) isthe volume of Na2CO3 solution in which the sample is digested. The total CSia is then20
calculated by determining the intercept of the regression between CSit and extractiontime (DeMaster, 1981). Extrapolating the Si release to the intercept is assumed tocorrect for mineral dissolution of Si (Clymans et al., 2011).
The distribution of concentrations, the amount of silica per unit soil, provides informa-tion on the BSi pools within a soil profile, but provides no information about total silica25
4397

BGD8, 4391–4419, 2011
Anthropogenicimpact on biogenic Si
pools
W. Clymans et al.
Title Page
Abstract Introduction
Conclusions References
Tables Figures
J I
J I
Back Close
Full Screen / Esc
Printer-friendly Version
Interactive Discussion
Discussion
Paper
|D
iscussionP
aper|
Discussion
Paper
|D
iscussionP
aper|
pools per horizon. Dry bulk density (ρd, kg m−3) samples were taken at different depths.The alkali-extracted pool (PSia,i, kg SiO2 ha−1) per horizon i was then calculated as:
PSia,i = (CSia,i ·ρd,i ·di) ·10 (2)
with;
– CSia the total alkali-extracted silica concentration (g SiO2 kg−1)5
– ρd,i dry bulk density of horizon i (kg m−3)
– di depth of horizon i (m)
Total pools were calculated by integration of the pool over depth of the core. Themaximum common depth that was reached in field sampling was 0.85 m.
2.3.3 CaCl2-extraction: easily soluble silica10
Easily soluble silica (CSie) is believed to arise from the dissolution of phytoliths in soils(Farmer et al., 2005) and is an estimate of the availability of DSi to plants. (Haysomand Chapman, 1975). Moreover, CSie is a good predictor of the equilibrium Si concen-tration in soil pore water (Zysset et al., 1999). The weakest extractant (after water) isCaCl2, which only extracts the easily soluble Si pool (Berthelsen et al., 2001). In our15
measurements, 2 g of dried soil (<2 mm) was shaken (linear movement) for 16 h with20 ml 0.01 M CaCl2 extractant (1:10 ratio) in a 50 ml Nalgene tube at 20 ◦C. After cen-trifugation at 4000 rpm for 30 min, the supernatant was filtered over 0.45 µm pore size(Chromafil® A-45/25) and analyzed for Si by the automated molybdate-blue method.Total easily soluble pools (PSie) were calculated following the same methodology as20
used for PSia calculations.
4398

BGD8, 4391–4419, 2011
Anthropogenicimpact on biogenic Si
pools
W. Clymans et al.
Title Page
Abstract Introduction
Conclusions References
Tables Figures
J I
J I
Back Close
Full Screen / Esc
Printer-friendly Version
Interactive Discussion
Discussion
Paper
|D
iscussionP
aper|
Discussion
Paper
|D
iscussionP
aper|
3 Results
3.1 Distribution of biogenic silica
Under all land uses the maximum CSia occurred in the top layer, followed by a generaldecreasing trend with depth (Fig. 2), despite small variations in distribution betweenland use types. On arable fields (Fig. 2) the top layer was relatively rich in CSia up to a5
depth of 0.25 m. This depth corresponds with typical plough depths of traditional tillage(Tebrugge and During, 1999). Under continuous forest, grazed forest and pasture theCSia rich top layer extended down to 0.15 m. About 75 % of the profiles at pasture sites,50 % of the profiles in grazed forest, and all profiles in the continuous forest showeda second peak of CSia at intermediate depths (0.3–0.6 m), but after averaging, this10
secondary maximum is only visible for pasture and continuous forest.CSia in the top layer generally followed the trend continuous forest > grazed forest
≥ pasture > arable land. Continuous forest soils were most enriched in CSia at depthsbetween 0.1–0.4 m followed by arable land > grazed forest > pasture soils (Table 1).From 0.4 m downwards, continuous forest soils had considerably higher CSia, than all15
other land uses while grazed forest and pasture soils had slightly higher values thanarable land.
The total PSia (integrated over a depth of 0.85 m) shows a major differ-ence between the continuous forest and all other land uses (Fig. 1). To-tal PSia for the continuous forest site was more than double compared to20
other land uses (66 900±22 800 kg SiO2 ha−1). The total PSia in arable landwas 28 800±7200 kg SiO2 ha−1 and was slightly, but not significantly higher thanthe PSia at the grazed forest (23 600±6370 kg SiO2 ha−1) and pasture sites(27 300±5980 kg SiO2 ha−1).
PSia depends on both dry bulk density (ρd) and CSia. The low ρd in the top layer25
resulted generally in low PSia values for the top layers, although CSia reached theirmaxima at these depths (Fig. 2). This difference was most striking for continuous forest,as this highly humic top layer (>20 % OC) had an extremely low ρd (<200 kg m−3).
4399
BGD8, 4391–4419, 2011
Anthropogenicimpact on biogenic Si
pools
W. Clymans et al.
Title Page
Abstract Introduction
Conclusions References
Tables Figures
J I
J I
Back Close
Full Screen / Esc
Printer-friendly Version
Interactive Discussion
Discussion
Paper
|D
iscussionP
aper|
Discussion
Paper
|D
iscussionP
aper|
For the deeper soil layers, variations in ρd were less important and variations in PSiacoincided with variations in CSia.
The differences in total PSia and its distribution between the different land use typeswere tested using a non-parametric ANOVA analysis (Sas-Institute, 2003). Total PSiawas significantly larger in continuous forests than at grazed forest (p= 0.0019), pas-5
ture (p = 0.0018) and arable (p = 0.0062) sites. Although there were differences inPSia in the top layer (0–0.1 m), these differences were not statistically significant. Bycontrast, PSia between 0.1–0.2 m in arable profiles were significantly larger then inpasture (p= 0.024) and grazed forest (p= 0.0015) profiles. Below 0.2 m PSia was sig-nificantly larger in continuous forest profiles compared to all other land uses (grazed10
forest (p=0.0019), pasture (p=0.0028) and arable land (p=0.0062))
3.2 Distribution of easily soluble silica
In the top layers the distribution of CSie was rather distinct from the CSia (Figs. 3 and4). CSie in the top layer were lower in CSie than below. Most profiles taken on pasture,grazed forest and continuous forest contained only small amounts of CSie at depths15
between 0.1 and 0.2 m. Further down CSie increases again and maximum valueswere reached at depths varying between 0.25–0.6 m (Fig. 3). Deeper in the soil profileCSie decreased again. For arable land CSie monotonously increased with depth. CSievalues were generally lowest in profiles at arable land sites < pasture sites ≤ grazedforest sites � continuous forest sites (Table 1).20
All averaged profiles exhibited similar distribution in PSie with low pools in the toplayer and increasing values at depth with maxima at different levels (Fig. 3). Con-tinuous forest soils contained almost triple (952±16 kg SiO2 ha−1) the PSie than pas-ture (370±129 kg SiO2 ha−1) and grazed forest (346±123 kg SiO2 ha−1) soils, and fourtimes the amount found in arable land soils (239±91 kg SiO2 ha−1) (Fig. 1). Most im-25
portant differences were in the top layer and at depths >0.6 m, where continuous foresthas a significant larger pool then the other land uses (p<0.05).
4400

BGD8, 4391–4419, 2011
Anthropogenicimpact on biogenic Si
pools
W. Clymans et al.
Title Page
Abstract Introduction
Conclusions References
Tables Figures
J I
J I
Back Close
Full Screen / Esc
Printer-friendly Version
Interactive Discussion
Discussion
Paper
|D
iscussionP
aper|
Discussion
Paper
|D
iscussionP
aper|
3.3 Physical and chemical soil properties
Soil properties like OC, pH and texture are given in Table 1. Analogous to CSia dis-tribution there was (1) generally a progressive decrease of OC with depth, (2) an ac-cumulation of OC in the top layer and (3) a decrease in OC pool from continuousforest over grazed forest and pasture towards arable land. A positive trend suggested5
the existence of an important relation between OC and CSia: CSia = 3.4 + 0.4×OC(R2 = 0.45, p< .0001). Good relationships between variables were found mainly forarable land (R2 =0.65), pasture (R2 =0.83) and grazed forest (R2 =0.62).
pH varied between 3.3 and 4.7 with an average of 4.28±0.45 and is within therange for constant Si solubility (2.5–8) (Dove, 1995). The humic soil top layer under10
the continuous forest had the lowest pH values. No relationship was found betweenpH and CSia or CSie. Texture varied between sand and sandy loam. There was nodifferentiation with depth, nor with land use.
4 Discussion
4.1 Human impacts15
4.1.1 BSi pools
Human activities exert a long-term influence on nutrient cycling and concentrations insoils (Foster et al., 2003), including BSi pools. Although total PSia did not changewithin a three year period following forest clearance at the Hubbard Brook Experimen-tal Forest, a clear redistribution of PSia to deeper layers was observed (Saccone et al.,20
2008). We show that the total PSia pool in an undisturbed forest ecosystem, e.g. Sig-gaboda, was more than twice the size of total PSia pools under land uses influencedby human activities for five centuries, e.g. Rashult. The discrepancy between a contin-uously forested and disturbed sites is due to the long-term effects of reduced BSi input
4401

BGD8, 4391–4419, 2011
Anthropogenicimpact on biogenic Si
pools
W. Clymans et al.
Title Page
Abstract Introduction
Conclusions References
Tables Figures
J I
J I
Back Close
Full Screen / Esc
Printer-friendly Version
Interactive Discussion
Discussion
Paper
|D
iscussionP
aper|
Discussion
Paper
|D
iscussionP
aper|
by litterfall and the increased mobilization of the PSia pool in soils with disturbance.Reductions in soil PSia stocks after deforestation supports the conceptual model pre-sented by Struyf et al. (2010b).
We expected significantly lower total PSia in arable land soils because it experiencedthe most intensive human impact through the systematic removal of crop residues with5
harvest and tillage operations. Yet, there were no significant differences in total PSiabetween the three land use types. Deforestation leads to major changes in hydrol-ogy (DeFries and Eshleman, 2004) and organic matter dynamics (Wallace Covington,1981). Larger easily soluble pools (PSie) were found under grazed forest and pastureshowing that arable fields have experienced a greater mobilisation of the labile BSi10
pool. Losses of PSia also occur with soil erosion and prevents the establishment of aBSi rich surface horizon and replenishment of BSi in the deeper horizons. However,due to the limited relief in the arable fields at Rashult, soil erosion was probably not asignificant factor and limited the losses of PSia in soils.
4.1.2 BSi distribution15
Our data show significant differences in the vertical distribution of PSia with distur-bance, although total PSia pools were not different for all three human land use types.Nutrient leaching and biological (re)cycling determines the vertical distribution of soilnutrients (Jobbagy and Jackson, 2001; Sommer et al., 2006). The accumulation in thetop layer and occurrence of a peak at depth (0.25–0.6 m) in CSia indicates the influ-20
ence of both leaching and biological cycling on the Si distribution in our soils. The soilCSia profile under continuous forest cover results from the interaction between bothprocesses. Similar PSia distributions were observed in temperate forest soils (Corneliset al., in press). The large PSia pool in the top layer is the result of biogenic pro-cesses (Blecker et al., 2006). At depth, the increase in CSia results from root phytolith25
input at root depth (Watteau and Villemin, 2001) and pedogenic processes such asthe translocation-accumulation of phytoliths and Si adsorption onto Fe oxides and theformation of pedogenic opal (Cornelis et al., in press). The peak was absent under
4402

BGD8, 4391–4419, 2011
Anthropogenicimpact on biogenic Si
pools
W. Clymans et al.
Title Page
Abstract Introduction
Conclusions References
Tables Figures
J I
J I
Back Close
Full Screen / Esc
Printer-friendly Version
Interactive Discussion
Discussion
Paper
|D
iscussionP
aper|
Discussion
Paper
|D
iscussionP
aper|
arable land and only slightly visible under pasture and grazed forest. The absence of aPSia peak at depth for arable land supports the hypothesis of insufficient BSi replenish-ment. The transition towards arable land limits biological cycling to the upper soil layer,i.e. root depth. At depth, a decrease in PSia has occurred during the last five centuriesof cultivation due to continuous dissolution.5
PSia in the upper 0.25 m of arable land were higher than both grazed forest andpasture, although crop harvest is believed to limit PSia input. However, the Si replen-ishment rate in the topsoil of arable land can be relatively high due to the high rootdensity of crops in this zone. On grazing land, CSia is high in the top layer due to theeffects of above ground biomass decomposing at the surface replenishing PSia pools.10
The lower subsoil (>0.4 m) PSia pool and PSie pool under arable land may indicatethat Si leaching under arable land is indeed more intense compared to grazing land.
4.2 Biogenic silica and organic carbon
Plant-available Si is influenced by several factors, such as pH, clay and organic matter(OM) content, Al and Fe oxides, and parent material (Hohn et al., 2008). In contrast to15
other factors like pH and clay, OC varied between land use types (Table 1). Positive re-lationships between CSia and OC for grazed forest, pasture and arable land confirmedthat OC is a good proxy for BSi content, which has been previously shown in grasslandsoils (Blecker et al., 2006). Nevertheless, variations in CSia with depth in continuouslyforested ecosystems did not reflect variations of soil OC with depth. Several factors20
such as a varying phytolith content of roots with depth and/or variations of phytolithsolubility with depth could create such a profile. Moreover, this indicates a differentia-tion in processes responsible for BSi and OC storage. Phytolith translocation to deeperdepths can occur (Alexandre et al., 1997; Meunier et al., 1999), but translocation ofphytoliths does not necessarily imply translocation of OC through the profile. The per-25
centage OC occluded in phytoliths is limited (Parr and Sullivan, 2005), therefore, OCcould only be used as an indicator for CSia rather than a predictor.
4403

BGD8, 4391–4419, 2011
Anthropogenicimpact on biogenic Si
pools
W. Clymans et al.
Title Page
Abstract Introduction
Conclusions References
Tables Figures
J I
J I
Back Close
Full Screen / Esc
Printer-friendly Version
Interactive Discussion
Discussion
Paper
|D
iscussionP
aper|
Discussion
Paper
|D
iscussionP
aper|
4.3 Historical deforestation: an estimate for temperate regions of the effect onBSi pools
Our data provide an opportunity to estimate historical changes in BSi storage insoils, and the associated Si loss towards the aquatic system, assuming that BSiis converted to DSi and exported from the system. The amount of BSi accumu-5
lated in soils depends upon the input, output and recycling of silica within the soil-vegetation continuum. Measurements of BSi pools in soils are rare, especially fortemperate regions (Blecker et al., 2006; Saccone et al., 2007). Most studies areconstrained to specific vegetation types (forest or grassland), and data for arablelands are lacking. BSi pools typically range between 15 000 and 105 000 kg SiO2 ha−1
10
(Struyf and Conley, 2011). BSi pools were larger in soils under continuous for-est cover (66 900±22 800 kg SiO2 ha−1) and were lower in grazed forest, pastureand arable land (on average 26 600±6520 kg SiO2 ha−1). Our data fall within therange of BSi previously observed. Our study found that PSia was reduced by40 300±23 700 kg SiO2 ha−1, and PSie with 634±199 kg SiO2 ha−1. The first official15
records from Rashult recording human disturbance date back to 1545 and have per-sisted until present, e.g. 465 years (Swedish Land Registry), although there are tracesof agriculture from Medieval time. We assumed a constant annual loss between 1545until present providing an average annual loss of 86.7±51.0 kg SiO2 ha−1 yr−1 fromPSia and 1.4±0.4 kg SiO2 ha−1 yr−1 from the PSie pool. This is higher than the in-20
creased Si export seen after deforestation (16 kg SiO2 ha−1 yr−1) in Hubbard Brook Ex-perimental Forest (Conley et al., 2008).
Historical arable land and pasture distributions were reconstructed based on statis-tics combined with satellite information and specific allocation algorithms covering theperiod 10000BCE to 2000CE (Klein Goldewijk et al., 2011). We assumed that the25
total area available for land use conversion is constant, and equals the sum of theforested area (AreaF) and disturbed area (AreaD) in 2005 (World Bank database –http://data.worldbank.org/, last acces: 22 February 2011). We used only two land use
4404
BGD8, 4391–4419, 2011
Anthropogenicimpact on biogenic Si
pools
W. Clymans et al.
Title Page
Abstract Introduction
Conclusions References
Tables Figures
J I
J I
Back Close
Full Screen / Esc
Printer-friendly Version
Interactive Discussion
Discussion
Paper
|D
iscussionP
aper|
Discussion
Paper
|D
iscussionP
aper|
types: continuous forest cover and disturbed landscapes (pasture and arable lands).We also assumed that a constant annual Si loss rate occurred between both landuse types. Based on these assumptions, total PSia (Fig. 5) and PSie (Fig. 6) poolswere calculated at different time periods in the past in temperate regions covering70 % of the land surface (Table 2). In 2005CE, soils stored approximately 4010±8175
Tmol Si, which represents a decrease of 400 Tmol Si since 3000BCE. Recent landuse conversion, after 1700CE, has resulted in major depletion of PSia and PSie. Intemperate regions from 3000BCE onwards PSia pools have been lost at a rate of0.09±0.06 Tmol Si yr−1 while recent agricultural expansion (after 1700CE) resulted inan average rate of 1.1±0.8 Tmol Si yr−1. Historical land use changes in temperate re-10
gions could annually increase the riverine load by ca. 20 % of the global land-ocean fluxof DSi (estimated on 5.6 Tmol Si yr−1). The net contribution will be lower due to reten-tion within rivers and lakes estimated to range from 1.15 Tmol Si yr−1 to 2.4 Tmol Si yr−1
(Laruelle et al., 2009; Durr et al., 2011). Our estimate shows the importance of contem-porary and historical land use changes on potential Si delivery to the oceans (Conley15
et al., 2008).Uncertainties in the land use data are due to the lack of accurate historical data. Fur-
thermore, high standard deviations on Si pools support the necessity of more data onSi pools in soils. Moreover, our arable land use data are from “traditionally” managedarable lands, while under intense cultivated land use used today in industrial agricul-20
ture, pools could be depleted even more (Struyf et al., 2010b). In order to improvethe estimate special attention needs to be given to variation in land use and land usehistory. Until now research has focussed mostly on natural ecosystems (Alexandre etal., 1997; Blecker et al., 2006) rather than human influenced systems.
Our estimate is the first to consider the potential of land use changes due to agri-25
cultural expansion Si fluxes from the land to the ocean. We show that total PSia poolsare reduced with 10 % in temperate regions with land use changes. Although a consid-erable amount is known regarding the impact of temperature, runoff and land area onsilicate weathering, to date there are no studies that have considered changes in the
4405

BGD8, 4391–4419, 2011
Anthropogenicimpact on biogenic Si
pools
W. Clymans et al.
Title Page
Abstract Introduction
Conclusions References
Tables Figures
J I
J I
Back Close
Full Screen / Esc
Printer-friendly Version
Interactive Discussion
Discussion
Paper
|D
iscussionP
aper|
Discussion
Paper
|D
iscussionP
aper|
contribution of the terrestrial biosphere on Si fluxes (Conley, 2002; Street-Perrott andBarker, 2008). Removal of vegetation may compensate mineral weathering responses.Recently, silicon isotopes and signatures of Ge/Si have been used in an attempt to gaininsight in the dynamics of terrestrial ecosystem pools (Henriet et al., 2008; Derry et al.,2005; Blecker et al., 2006) providing promising tools to track the origin of Si in aquatic5
systems (Struyf and Conley, 2011).
5 Conclusions
We have shown that total PSia in a continuous forest ecosystem was more than twicethe size of total PSia under human disturbed land uses. We believe long-term distur-bance of the vegetation-soil continuum lowered BSi inputs and increased depletion of10
the PSia. These results are consistent with an existing conceptual model describing theeffect of human impact on the terrestrial Si-cycle along a deforestation gradient (Struyfet al., 2010b). The absence of a significant difference in total PSia for the disturbedland use types conflicts with the idea of a more degraded state under arable land.This is explained by the absence of severe soil erosion in the traditional tilled arable15
fields. Nevertheless larger PSie under grazed forest and pasture indicate that arablefields have undergone a larger mobilisation of the labile BSi pool. Significant differ-ences in the vertical PSia and PSie distributions result from the affect of deforestationon biogenic and pedogenic processes responsible for the Si distribution in our soils.Along the gradient, the disappearance of the PSia peak at intermediate depths implies20
that land use conversion limited biological cycling and intensified leaching processesat depth. Furthermore historical land use changes in temperate regions decreased BSistorage in soils by 10 % and could contribute ca. 20 % to the global land-ocean Si fluxcarried by rivers. Despite uncertainties, we clearly show the importance of contempo-rary and historical human perturbations on Si-cycling in soils and potential Si-delivery25
to the ocean.
4406

BGD8, 4391–4419, 2011
Anthropogenicimpact on biogenic Si
pools
W. Clymans et al.
Title Page
Abstract Introduction
Conclusions References
Tables Figures
J I
J I
Back Close
Full Screen / Esc
Printer-friendly Version
Interactive Discussion
Discussion
Paper
|D
iscussionP
aper|
Discussion
Paper
|D
iscussionP
aper|
Acknowledgements. The authors thank Lansstyrelsen in Kronobergslan for consenting to field-work in the nature reserve Siggaboda and culture reserve Rashult. Special acknowledgementsgo to M. Mikaelsson and S. Vandevelde for fieldwork support. Wim Clymans would like to thankthe Flemish Agency for the promotion of Innovation by Science and Technology (IWT) for fund-ing his personal promotion grant and acknowledge FWO (Research Foundation Flanders) for5
funding the project with a travel grant. This work was partially supported by a research grantto D. J. Conley from the Swedish National Science Foundation (VR). Eric Struyf acknowledgesFWO (Flemish Research Foundation) for funding his postdoc grant. We acknowledge the Bel-gian Science Policy (BELSPO, SD/NS/05a) for funding the project “LUSi: land use changesand silica fluxes in the Scheldt river basin” and FWO for funding project “Tracking the biological10
control on Si mobilization in upland ecosystems” (Project nr. G014609N). Floor Vandevennewould like to thank BOF-UA for PhD fellowship funding.
References
Alexandre, A., Meunier, J., Colin, F., and Koud, J.: Plant impact on the biogeochemical cycle ofsilicon and related weathering processes, Geochem. Cosmochim. Ac., 61, 677–682, 1997.15
Berthelsen, S., Noble, A., and Garside, A.: Silicon research down under: Past, present, and fu-ture, in: Silicon in agriculture, edited by: Datnoff, L., Snyder, G., and Korndorfer, G., Elsevier,The Netherlands, 241–256, 2001.
Blecker, S. W., McCulley, R. L., Chadwick, O. A., and Kelly, E. F.: Biologic cycling ofsilica across a grassland bioclimosequence, Global Biogeochem. Cycles, 20, GB3023,20
doi:10.1029/2006gb002690, 2006.Brzezinski, M. A.: The Si:C:N ratio of marine diatoms: Interspecific variability and the
effect of some environmental variables, J. Phycol., 21, 347–357, doi:10.1111/j.0022-3646.1985.00347.x, 1985.
Clymans, W., Govers, G., Van Wesemael, B., Meire, P., and Struyf, E.: Amorphous silica25
analysis in terrestrial runoff samples, Geoderma, in review, 2011.Conley, D.: Riverine contribution of biogenic silica to the oceanic silica budget, Limnol.
Oceanogr., 42, 774–777, 1997.Conley, D.: Terrestrial ecosystems and the global biogeochemical silica cycle, Global Bio-
geochem. Cycles, 16, 1121 pp., doi:10.1029/2002gb001894, 2002.30
4407

BGD8, 4391–4419, 2011
Anthropogenicimpact on biogenic Si
pools
W. Clymans et al.
Title Page
Abstract Introduction
Conclusions References
Tables Figures
J I
J I
Back Close
Full Screen / Esc
Printer-friendly Version
Interactive Discussion
Discussion
Paper
|D
iscussionP
aper|
Discussion
Paper
|D
iscussionP
aper|
Conley, D., Likens, G., Buso, D., Saccone, L., Bailey, S., and Johnson, C.: Deforestation causesincreased dissolved silicate losses in the Hubbard Brook experimental forest, Glob. ChangeBiol., 14, 2548–2554, 2008.
Cornelis, J.-T., Titeux, H., Ranger, J., and Delvaux, B.: Identification and distribution of thereadily soluble silicon pool in a temperate forest soil below three distinct tree species, Plant.5
Soil, 342, 369–378, doi:10.1007/s11104-010-0702-x, 2011.DeFries, R. and Eshleman, N. K.: Land-use change and hydrologic processes: A major focus
for the future, Hydrol. Process, 18, 2183–2186, 2004.DeMaster, D.: The supply and accumulation of silica in the marine-environment, Geochim.
Cosmochim. Ac., 45, 1715–1732, 1981.10
DeMaster, D.: The accumulation and cycling of biogenic silica in the southern ocean: Revisitingthe marine silica budget, Deep-Sea Res. Pt. II, 49, 3155–3167, 2002.
Derry, L., Kurtz, A., Ziegler, K., and Chadwick, O.: Biological control of terrestrial silica cyclingand export fluxes to watersheds, Nature, 433, 728–731, 2005.
Dove, P.: Kinetic and thermodynamic controls on silica reactivity in weathering environments,15
in: Chemical weathering rates of silicate minerals, edited by: White, A. and Brantley, S.,Mineralogical Society of America, Washington D.C., 235–290, 1995.
Dugdale, R., Wilkerson, F., and Minas, H.: The role of a silicate pump in driving new production,Deep-Sea Res. Pt. I, 42, 697–719, 1995.
Durr, H. H., Meybeck, M., Hartmann, J., Laruelle, G. G., and Roubeix, V.: Global spatial dis-20
tribution of natural riverine silica inputs to the coastal zone, Biogeosciences, 8, 597–620,doi:10.5194/bg-8-597-2011, 2011.
Farmer, V. C., Delbos, E., and Miller, J. D.: The role of phytolith formation and dissolution incontrolling concentrations of silica in soil solutions and streams, Geoderma, 127, 71–79,doi:10.1016/j.geoderma.2004.11.014, 2005.25
Foster, D., Swanson, F., Aber, J., Burke, I., Brokaw, N., Tilman, D., and Knapp, A.: The impor-tance of land-use legacies to ecology and conservation, Bioscience, 53, 77–88, 2003.
Gerard, F., Mayer, K., Hodson, M., and Ranger, J.: Modelling the biogeochemical cycle ofsilicon in soils: Application to a temperate forest ecosystem, Geochim. Cosmochim. Ac., 72,741–758, 2008.30
Grasshoff, K., Ehrhardt, M., and Kremling, K.: Methods of sea water analysis, Verslag Chemie,Weinheim, 1983.
Haysom, M. and Chapman, L.: Some aspects of the calcium silicate trial at Mackay, in: Pro-
4408

BGD8, 4391–4419, 2011
Anthropogenicimpact on biogenic Si
pools
W. Clymans et al.
Title Page
Abstract Introduction
Conclusions References
Tables Figures
J I
J I
Back Close
Full Screen / Esc
Printer-friendly Version
Interactive Discussion
Discussion
Paper
|D
iscussionP
aper|
Discussion
Paper
|D
iscussionP
aper|
ceedings Conference Queensland Society Sugar Cane Technologists, 42, 117–122, 1975.Henriet, C., De Jaeger, N., Dorel, M., Opfergelt, S., and Delvaux, B.: The reserve of weather-
able primary silicates impacts the accumulation of biogenic silicon in volcanic ash soils, Bio-geochemistry, 90, 209–223, doi:10.1007/s10533-008-9245-0, 2008.
Hohn, A., Sommer, M., Kaczorek, D., Schalitz, G., and Breuer, J.: Silicon fractions in histosols5
and gleysols of a temperate grassland site, J. Plant. Nutr. Soil Sc., 171, 409–418, 2008.Jobbagy, E. G. and Jackson, R. B.: The distribution of soil nutrients with depth: Global patterns
and the imprint of plants, Biogeochemistry, 53, 51–77, 2001.Klein Goldewijk, K., Beusen, A., van Drecht, G., and de Vos, M.: The HYDE 3.1 spatially explicit
database of human-induced global land-use change over the past 12,000 years, Global Ecol.10
Biogeogr., 20, 73–86, doi:10.1111/j.1466-8238.2010.00587.x, 2011.Lageras, P.: The ecology of expansion and abandonment - medieval land-use and settlement
dynamics in a landscape perspective, Riksantikvarieambetet Och Statens, 2007.Laruelle, G. G., Roubeix, V., Sferratore, A., Brodherr, B., Ciuffa, D., Conley, D. J., Durr, H. H.,
Garnier, J., Lancelot, C., Le Thi Phuong, Q., Meunier, J. D., Meybeck, M., Michalopoulos,15
P., Moriceau, B., Nı Longphuirt, S., Loucaides, S., Papush, L., Presti, M., Ragueneau, O.,Regnier, P., Saccone, L., Slomp, C. P., Spiteri, C., and Van Cappellen, P.: Anthropogenicperturbations of the silicon cycle at the global scale: Key role of the land-ocean transition,Global Biogeochem. Cycles, 23, GB4031, doi:10.1029/2008gb003267, 2009.
Lindbladh, M. and Bradshaw, R.: The development and demise of a medieval forest-meadow20
system at Linnaeus’ birthplace in southern Sweden: Implications for conservation and foresthistory, Veg Hist Archaeobot, 4, 153–160, doi:10.1007/bf00203933, 1995.
Lindbladh, M. and Bradshaw, R.: The origin of present forest composition and pattern in south-ern Sweden, J. Biogeogr., 25, 463–477, doi:10.1046/j.1365-2699.1998.2530463.x, 1998.
Meunier, J., Colin, F., and Alarcon, C.: Biogenic silica storage in soils, Geology, 27, 835–838,25
1999.Parr, J. F. and Sullivan, L. A.: Soil carbon sequestration in phytoliths, Soil Biol. Biochem., 37,
117–124, 2005.Ragueneau, O., Conley, D., Ni Longphuirt, S., Slomp, C., and Leynaert, A.: A review of the si
biogeochemical cycle in coastal waters: I. Diatoms in coastal food webs and the coastal si30
cycle, in: The silicon cycle: Human perturbations and impacts on aquatic systems, edited by:Ittekkot, V., Unger, D., Humborg, C., and Tac An, N., Island Press, Washington DC, 2006.
Saccone, L., Conley, D., Koning, E., Sauer, D., Sommer, M., Kaczorek, D., Blecker, S., and
4409

BGD8, 4391–4419, 2011
Anthropogenicimpact on biogenic Si
pools
W. Clymans et al.
Title Page
Abstract Introduction
Conclusions References
Tables Figures
J I
J I
Back Close
Full Screen / Esc
Printer-friendly Version
Interactive Discussion
Discussion
Paper
|D
iscussionP
aper|
Discussion
Paper
|D
iscussionP
aper|
Kelly, E.: Assessing the extraction and quantification of amorphous silica in soils of forestand grassland ecosystems, Eur. J. Soil Sci., 58, 1446–1459, 2007.
Saccone, L., Conley, D., Likens, G., Bailey, S., Buso, D., and Johnson, C.: Factors that controlthe range and variability of amorphous silica in soils in the Hubbard Brook experimentalforest, Soil Sci. Soc. Am. J., 72, 1637–1644, 2008.5
Sas-Institute: Sas release 9.1.3, in: Sas-Institute, edited by: Cary, N. C., USA, 2003.Sauer, D., Saccone, L., Conley, D., Herrmann, L., and Sommer, M.: Review of methodologies
for extracting plant-available and amorphous Si from soils and aquatic sediments, Biogeo-chemistry, 80, 89–108, 2006.
Sommer, M., Kaczorek, D., Kuzyakov, Y., and Breuer, J.: Silicon pools and fluxes in soils and10
landscapes – a review, J. Plant Nutr. Soil Sc., 169, 310–329, 2006.Street-Perrott, F. A. and Barker, P. A.: Biogenic silica: A neglected component of the coupled
global continental biogeochemical cycles of carbon and silicon, Earth Surf. Proc. Land, 33,1436–1457, 2008.
Struyf, E., and Conley, D.: Silica: An essential nutrient in wetland biogeochemistry, Front Ecol.15
Environ., 7, 88–94, 2009.Struyf, E. and Conley, D.: Emerging understanding of the ecosystem silica filter, Biogeochem-
istry, 1–10, doi:10.1007/s10533-011-9590-2, 2011.Struyf, E., Morth, C. M., Humborg, C., and Conley, D. J.: An enormous amorphous silica stock
in boreal wetlands, J. Geophys. Res.-Biogeosci., 115, 8 pp., doi: 10.1029/2010jg001324,20
2010a.Struyf, E., Smis, A., Van Damme, S., Garnier, J., Govers, G., Van Wesemael, B., Conley, D.
J., Batelaan, O., Frot, E., Clymans, W., Vandevenne, F., Lancelot, C., Goos, P., and Meire,P.: Historical land use change has lowered terrestrial silica mobilization, Nat. Commun., 1,129 pp., 2010b.25
Tebrugge, F. and During, R. A.: Reducing tillage intensity – a review of results from a long-termstudy in Germany, Soil Till Res., 53, 15–28, 1999.
Treguer, P., Nelson, D., Vanbennekom, A., DeMaster, D., Leynaert, A., and Queguiner, B.: Thesilica balance in the world ocean – a reestimate, Science, 268, 375–379, 1995.
Van Cappellen, P.: Biomineralization and global biogeochemical cycles, Rev. Mineral30
Geochem., 54, 357–381, 2003.Wallace Covington, W.: Changes in forest floor organic matter and nutrient content following
clear cutting in northern hardwoods, Ecology, 62, 41–48, 1981.
4410
BGD8, 4391–4419, 2011
Anthropogenicimpact on biogenic Si
pools
W. Clymans et al.
Title Page
Abstract Introduction
Conclusions References
Tables Figures
J I
J I
Back Close
Full Screen / Esc
Printer-friendly Version
Interactive Discussion
Discussion
Paper
|D
iscussionP
aper|
Discussion
Paper
|D
iscussionP
aper|
Watteau, F. and Villemin, G.: Ultrastructural study of the biogeochemical cycle of silicon in thesoil and litter of a temperate forest, Eur. J. Soil Sci., 52, 385–396, 2001.
Zysset, M., Blaser, P., Luster, J., and Gehring, A. U.: Aluminum solubility control in differenthorizons of a podzol, Soil Sci. Soc. Am. J., 63, 1106–1115, 1999.
5
4411
BGD8, 4391–4419, 2011
Anthropogenicimpact on biogenic Si
pools
W. Clymans et al.
Title Page
Abstract Introduction
Conclusions References
Tables Figures
J I
J I
Back Close
Full Screen / Esc
Printer-friendly Version
Interactive Discussion
Discussion
Paper
|D
iscussionP
aper|
Discussion
Paper
|D
iscussionP
aper|
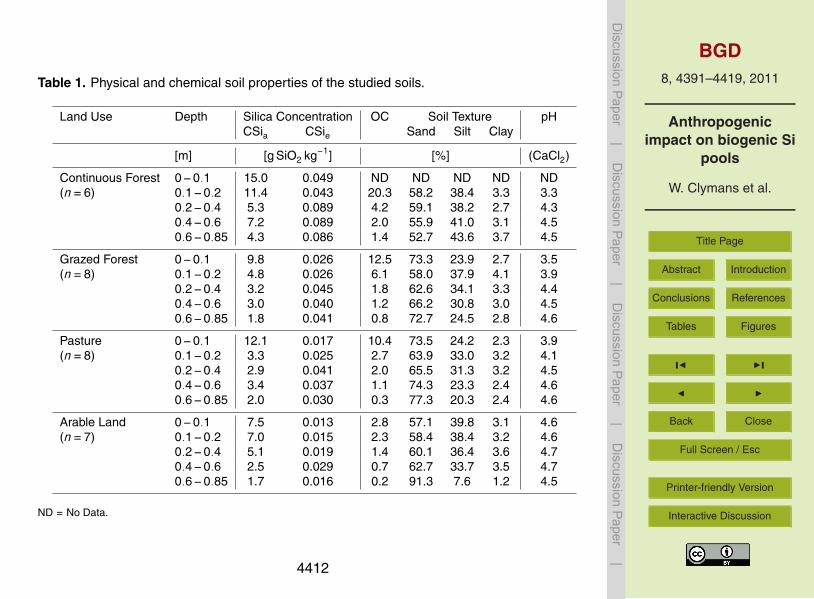
Table 1. Physical and chemical soil properties of the studied soils.
Land Use Depth Silica Concentration OC Soil Texture pHCSia CSie Sand Silt Clay
[m] [g SiO2 kg−1] [%] (CaCl2)
Continuous Forest 0−0.1 15.0 0.049 ND ND ND ND ND(n=6) 0.1−0.2 11.4 0.043 20.3 58.2 38.4 3.3 3.3
0.2−0.4 5.3 0.089 4.2 59.1 38.2 2.7 4.30.4−0.6 7.2 0.089 2.0 55.9 41.0 3.1 4.50.6−0.85 4.3 0.086 1.4 52.7 43.6 3.7 4.5
Grazed Forest 0−0.1 9.8 0.026 12.5 73.3 23.9 2.7 3.5(n=8) 0.1−0.2 4.8 0.026 6.1 58.0 37.9 4.1 3.9
0.2−0.4 3.2 0.045 1.8 62.6 34.1 3.3 4.40.4−0.6 3.0 0.040 1.2 66.2 30.8 3.0 4.50.6−0.85 1.8 0.041 0.8 72.7 24.5 2.8 4.6
Pasture 0−0.1 12.1 0.017 10.4 73.5 24.2 2.3 3.9(n=8) 0.1−0.2 3.3 0.025 2.7 63.9 33.0 3.2 4.1
0.2−0.4 2.9 0.041 2.0 65.5 31.3 3.2 4.50.4−0.6 3.4 0.037 1.1 74.3 23.3 2.4 4.60.6−0.85 2.0 0.030 0.3 77.3 20.3 2.4 4.6
Arable Land 0−0.1 7.5 0.013 2.8 57.1 39.8 3.1 4.6(n=7) 0.1−0.2 7.0 0.015 2.3 58.4 38.4 3.2 4.6
0.2−0.4 5.1 0.019 1.4 60.1 36.4 3.6 4.70.4−0.6 2.5 0.029 0.7 62.7 33.7 3.5 4.70.6−0.85 1.7 0.016 0.2 91.3 7.6 1.2 4.5
ND = No Data.
4412
BGD8, 4391–4419, 2011
Anthropogenicimpact on biogenic Si
pools
W. Clymans et al.
Title Page
Abstract Introduction
Conclusions References
Tables Figures
J I
J I
Back Close
Full Screen / Esc
Printer-friendly Version
Interactive Discussion
Discussion
Paper
|D
iscussionP
aper|
Discussion
Paper
|D
iscussionP
aper|
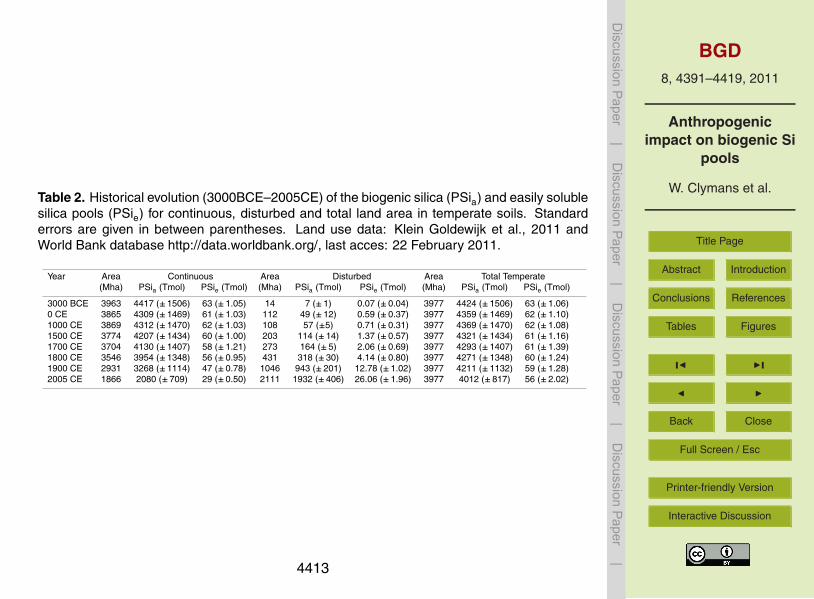
Table 2. Historical evolution (3000BCE–2005CE) of the biogenic silica (PSia) and easily solublesilica pools (PSie) for continuous, disturbed and total land area in temperate soils. Standarderrors are given in between parentheses. Land use data: Klein Goldewijk et al., 2011 andWorld Bank database http://data.worldbank.org/, last acces: 22 February 2011.
Year Area Continuous Area Disturbed Area Total Temperate(Mha) PSia (Tmol) PSie (Tmol) (Mha) PSia (Tmol) PSie (Tmol) (Mha) PSia (Tmol) PSie (Tmol)
3000 BCE 3963 4417 (±1506) 63 (±1.05) 14 7 (±1) 0.07 (±0.04) 3977 4424 (±1506) 63 (±1.06)0 CE 3865 4309 (±1469) 61 (±1.03) 112 49 (±12) 0.59 (±0.37) 3977 4359 (±1469) 62 (±1.10)1000 CE 3869 4312 (±1470) 62 (±1.03) 108 57 (±5) 0.71 (±0.31) 3977 4369 (±1470) 62 (±1.08)1500 CE 3774 4207 (±1434) 60 (±1.00) 203 114 (±14) 1.37 (±0.57) 3977 4321 (±1434) 61 (±1.16)1700 CE 3704 4130 (±1407) 58 (±1.21) 273 164 (±5) 2.06 (±0.69) 3977 4293 (±1407) 61 (±1.39)1800 CE 3546 3954 (±1348) 56 (±0.95) 431 318 (±30) 4.14 (±0.80) 3977 4271 (±1348) 60 (±1.24)1900 CE 2931 3268 (±1114) 47 (±0.78) 1046 943 (±201) 12.78 (±1.02) 3977 4211 (±1132) 59 (±1.28)2005 CE 1866 2080 (±709) 29 (±0.50) 2111 1932 (±406) 26.06 (±1.96) 3977 4012 (±817) 56 (±2.02)
4413

BGD8, 4391–4419, 2011
Anthropogenicimpact on biogenic Si
pools
W. Clymans et al.
Title Page
Abstract Introduction
Conclusions References
Tables Figures
J I
J I
Back Close
Full Screen / Esc
Printer-friendly Version
Interactive Discussion
Discussion
Paper
|D
iscussionP
aper|
Discussion
Paper
|D
iscussionP
aper|
Fig. 1. Representation of the land use sequence in the study area, southern Sweden. Valuesindicate measured means (±standard errors) for total biogenic silica pool (PSia) and easilysoluble silica pool (PSie) in the soils.
4414

BGD8, 4391–4419, 2011
Anthropogenicimpact on biogenic Si
pools
W. Clymans et al.
Title Page
Abstract Introduction
Conclusions References
Tables Figures
J I
J I
Back Close
Full Screen / Esc
Printer-friendly Version
Interactive Discussion
Discussion
Paper
|D
iscussionP
aper|
Discussion
Paper
|D
iscussionP
aper|
Fig. 2. Average distribution of alkaline (Na2CO3) extracted silica (CSia, g SiO2 kg−1 dry soil)and total CSia-pools (PSia, kg SiO2 ha−1) by depth under various land uses in southern Swedensoils. N = number of profiles analysed under specific land use. Scale x-axis not constant.
4415

BGD8, 4391–4419, 2011
Anthropogenicimpact on biogenic Si
pools
W. Clymans et al.
Title Page
Abstract Introduction
Conclusions References
Tables Figures
J I
J I
Back Close
Full Screen / Esc
Printer-friendly Version
Interactive Discussion
Discussion
Paper
|D
iscussionP
aper|
Discussion
Paper
|D
iscussionP
aper|
Fig. 3. Average distribution of easily (CaCl2) soluble silica (CSie, g SiO2 kg−1 dry soil) and totalCSie -pools (PSie, kg SiO2 ha−1) by depth under various land uses in southern Swedish soils.N = number of profiles analysed under specific land use. Scale x-axis not constant.
4416

BGD8, 4391–4419, 2011
Anthropogenicimpact on biogenic Si
pools
W. Clymans et al.
Title Page
Abstract Introduction
Conclusions References
Tables Figures
J I
J I
Back Close
Full Screen / Esc
Printer-friendly Version
Interactive Discussion
Discussion
Paper
|D
iscussionP
aper|
Discussion
Paper
|D
iscussionP
aper|
Fig. 4. Average distribution of alkaline extracted silica (CSia) and easily soluble silica (CSie) ing SiO2 kg−1 dry soil in soils under various land uses in southern Sweden.
4417

BGD8, 4391–4419, 2011
Anthropogenicimpact on biogenic Si
pools
W. Clymans et al.
Title Page
Abstract Introduction
Conclusions References
Tables Figures
J I
J I
Back Close
Full Screen / Esc
Printer-friendly Version
Interactive Discussion
Discussion
Paper
|D
iscussionP
aper|
Discussion
Paper
|D
iscussionP
aper|
Fig. 5. Historical evolution (3000BCE–2005CE) of the biogenic silica pool (PSia, Tmol) forcontinuous, disturbed and total land area in temperate soils.
4418

BGD8, 4391–4419, 2011
Anthropogenicimpact on biogenic Si
pools
W. Clymans et al.
Title Page
Abstract Introduction
Conclusions References
Tables Figures
J I
J I
Back Close
Full Screen / Esc
Printer-friendly Version
Interactive Discussion
Discussion
Paper
|D
iscussionP
aper|
Discussion
Paper
|D
iscussionP
aper|
Fig. 6. Historical evolution (3000BCE–2005CE) of the easily soluble silica pool (PSie, Tmol) forcontinuous, disturbed and total land area in temperate soils.
4419


![Carbon Dioxide Biogenic vs Anthropogenic Sectoral ...reports and estimates. Examples of these are Salt Lake City [3], Houston [4], Paris [5], Los Angeles [6] and Indianapolis (INFLUX;](https://static.fdocuments.net/doc/165x107/60fe10c0a6f95f16ac397d42/carbon-dioxide-biogenic-vs-anthropogenic-sectoral-reports-and-estimates-examples.jpg)