
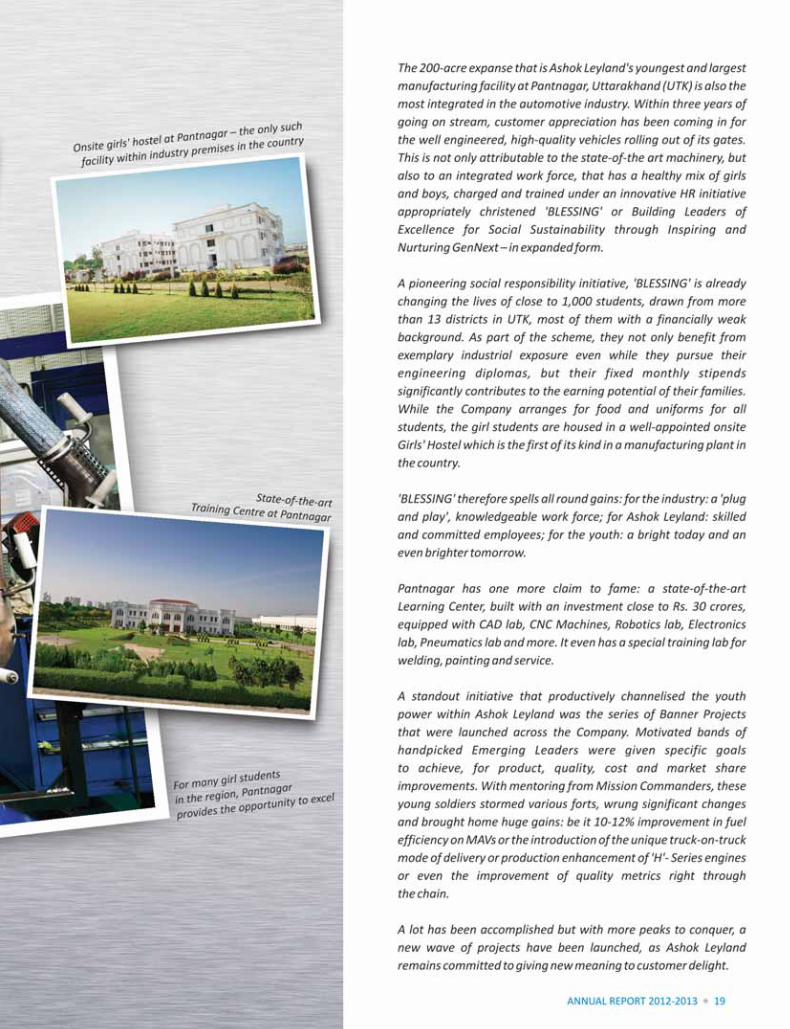
annualreport2012_13
108
Transcript of annualreport2012_13


Ashok Leyland Limited22
CHAIRMAN EMERITUS R J Shahaney
CHIEF FINANCIAL OFFICER K Sridharan
COMPANY SECRETARY S Venkatasubramanian
EXECUTIVE DIRECTORS Anup BhatAnuj KathuriaA K JainN V BalachandarC G BelsareNitin SethP G NilssonRajive SahariaSam BurmanSundar Rajan RB Venkat Subramaniam
AUDITORS M S Krishnaswami & RajanDeloitte Haskins & Sells
COST AUDITORS Geeyes & Co.
BANKERS Bank of AmericaBank of BarodaCanara BankCentral Bank of IndiaCiti Bank N.A.Credit Agricole Corporate and Investment BankDeutsche Bank A.G.HDFC Bank LtdICICI Bank LtdIDBI BankIndian BankPunjab National BankStandard Chartered BankState Bank of IndiaState Bank of PatialaThe Bank of Tokyo - Mitsubishi UFJ LtdThe Hongkong and Shanghai Banking Corporation LtdThe Royal Bank of Scotland N.V.Vijaya Bank
REGISTERED OFFICE 1, Sardar Patel Road, Guindy, Chennai 600 032
PLANTS Chennai (Ennore & Ambattur) and Hosur, (Tamil Nadu);Bhandara, (Maharashtra); Alwar, (Rajasthan);Pantnagar, (Uttarakhand).
WEBSITE www.ashokleyland.com

ANNUAL REPORT 2012-2013 23
FINANCIALS
A Historical Perspective ........................................................................................................................................................................ 24
Directors’ Report .................................................................................................................................................................................. 25
MD / CFO Certification ......................................................................................................................................................................... 50
Independent Auditors’ Report to the Members ................................................................................................................................... 51
Balance Sheet ....................................................................................................................................................................................... 54
Statement of Profit and Loss ................................................................................................................................................................ 55
Cash Flow Statement ............................................................................................................................................................................ 56
Statement on Significant Accounting Policies....................................................................................................................................... 58
Notes annexed to and forming part of the Financial Statements......................................................................................................... 61

Ashok Leyland Limited24
A HISTORICAL PERSPECTIVE
` Lakhs
Particulars 2003-04 2004-05 2005-06 2006-07 2007-08 2008-09 2009-10 2010-11 2011-12 2012-13 Sales VolumeVehicles (numbers) 48,654 54,740 61,655 83,094 83,307 54,431 63,926 94,106 1,01,990 1,14,611 Engines (numbers) 5,085 6,254 7,171 8,202 11,757 21,447 19,050 17,377 16,170 21,757 Spare parts and others 44,680 54,600 78,380 54,684 79,124 79,969 88,506 1,06,194 1,55,400 1,81,458
Revenue (Gross sales) 3,92,730 4,81,080 6,05,310 8,30,472 8,94,715 6,66,664 7,87,260 12,15,300 13,72,081 13,29,856 Profit before tax 28,646 35,501 45,230 60,451 63,815 20,845 54,477 80,180 68,998 47,071 Profit after tax 19,358 27,141 32,732 44,129 46,931 19,000 42,367 63,130 56,598 43,371
Assets Fixed assets 92,110 97,900 1,08,470 1,54,452 2,05,479 4,39,741 4,81,103 4,99,176 5,46,171 5,97,081 Non-Current Investments 14,660 22,919 36,818 22,109 60,990 26,356 32,615 1,23,000 1,53,448 2,33,763 Long term loans and advances
2,852 3,161 5,690 17,021 13,550 10,020 20,145 38,463 60,824 47,970
Other non-current assets 2,692 1,482 420 2,330 2,076 823 363 316 743 1,203 Non-Current Assets 1,12,314 1,25,462 1,51,398 1,95,912 2,82,095 4,76,940 5,34,226 6,60,955 7,61,186 8,80,017 Inventories 50,694 56,808 90,256 1,07,032 1,22,391 1,33,001 1,63,824 2,20,890 2,23,063 1,89,602 Trade Receivables 40,562 45,876 42,434 52,288 37,583 95,797 1,02,206 1,16,450 1,23,076 1,41,941 Cash and Bank balances 32,497 79,668 60,288 43,494 45,137 8,808 51,892 17,953 3,256 1,394 Short Term loans and Advances
19,761 30,213 24,573 49,937 68,864 68,934 75,901 33,439 72,657 89,098
Other current assets 540 452 310 112 154 146 155 9,644 8,337 7,618 Current assets 1,44,054 2,13,017 2,17,861 2,52,863 2,74,129 3,06,686 3,93,978 3,98,376 4,30,389 4,29,653 Total 2,56,368 3,38,479 3,69,259 4,48,775 5,56,224 7,83,626 9,28,204 10,59,331 11,91,575 13,09,670 Financed byShare capital 11,893 11,893 12,216 13,239 13,303 13,303 13,303 13,303 26,607 26,607 Reserves and surplus 93,286 1,04,894 1,29,029 1,76,218 2,01,595 3,34,470 3,52,327 3,82,993 3,94,626 4,18,904 Shareholders funds 1,05,179 1,16,787 1,41,245 1,89,457 2,14,898 3,47,773 3,65,630 3,96,296 4,21,233 4,45,511 Long term borrowings 38,264 76,528 60,641 46,152 70,632 1,85,826 2,11,819 2,34,813 2,29,335 2,73,784 Deferred tax liability - Net 18,029 17,084 17,969 19,693 25,382 26,344 38,454 44,389 49,037 52,737 Long-term provisions and Liabilities
3,998 6,197 7,113 8,860 9,286 9,410 11,421 7,846 7,656 8,028
Non-current liabilities 60,291 99,809 85,723 74,705 1,05,300 2,21,580 2,61,694 2,87,048 2,86,028 3,34,549 Short-term borrowings 207 138 69 14,328 - - - - 10,175 76,698 Trade payables 60,411 86,189 1,04,595 1,43,368 1,73,511 1,77,129 2,33,168 2,30,851 2,57,097 2,48,537 Other current liabilities 19,575 21,305 18,578 25,354 37,278 19,746 42,264 1,03,442 1,75,005 1,73,506 Short-term provisions 10,704 14,251 19,049 1,563 25,237 17,398 25,448 41,694 42,037 30,869 Current liabilities 90,897 1,21,883 1,42,291 1,84,613 2,36,026 2,14,273 3,00,880 3,75,987 4,84,314 5,29,610 Total 2,56,368 3,38,479 3,69,259 4,48,775 5,56,224 7,83,626 9,28,204 10,59,331 11,91,575 13,09,670 Basic Earnings Per Share (`) 1.63 2.28 2.74 3.38 3.53 1.43 3.18 2.37* 2.13* 1.63* Dividend per share (` ) (Face value ` 1 each)*
0.75 1.00 1.20 1.50 1.50 1.00 1.50 2.00 1.00 0.60
Employees (numbers) 12,007 12,178 11,845 12,125 13,304 11,938 13,662 15,812 15,734 14,668
*Post Bonus Issue
Note: Though Figures for the periods prior to 2010-11 have been reclassified / rearranged / regrouped, wherever material, as per Revised Schedule - VI to the Companies Act, 1956 it may not be strictly comparable with figures for Financial Years 2010-11 to 2012-13.

ANNUAL REPORT 2012-2013 25
DIReCtoRS’ RepoRt
Part I - Performance / OperationsThe Directors have pleasure in presenting the Annual Report of the Company, together with the audited Financial Statements, for the year ended March 31, 2013.FINANCIAL RESULTS (` lakhs)
2012-13 2011-12Profit before tax 47,070.67 68,997.66Less: Tax Expense 3,700.00 12,400.00Profit after tax 43,370.67 56,597.66Balance profit from last year 90,793.13 75,118.52Transfers:a) From Debenture
Redemption Reserve to Statement of Profit and Loss - 3,750.00
b) From Statement of Profit and Loss to Debenture Redemption Reserve - (3,750.00)
c) From Statement of Profit and Loss to General Reserve (5,000.00) (10,000.00)
Profit available for appropriation 1,29,163.80 1,21,716.18Appropriations:
Proposed dividend 15,964.06 26,606.77Corporate dividend tax thereon 2,713.09 4,316.28
Balance profit carried to balance sheet 1,10,486.65 90,793.13Earnings per Share (Face value ` 1/-) – Basic and Diluted (in `) 1.63 2.13
DividendThe Directors recommend a dividend of 60% (` 0.60 per equity share of ` 1/-) for the year ended March 31, 2013. Company PerformanceThe year under review saw a slowdown in the Indian economy with a consequent adverse impact on the commercial vehicle industry. Whilst the overall volume declined by 2% year over year, the medium & heavy duty segment clocked a 25% drop. Despite the above, your Company increased its market share from 23.5% to 26.5% in the M&HCV segment.In the Light Commercial Vehicle (LCV) segment, ‘Dost’ continued to grow in volumes. The performance of Power Solution Business and Spares have been very encouraging. Export volumes dropped primarily due to the setback
in Sri Lanka which could not be fully recouped in other geographies.Highlights of performance are discussed in detail in the Management Discussion and Analysis Report attached as Annexure-D to this Report.Research and Development (R&D), technology absorption, energy conservation etc.Your Company continues to focus on Research and Development activities with particular reference to development of competitive products with accent on performance, fuel efficiency, emission and ride comfort.Expenditure incurred by way of capital and revenue on these activities are shown separately. The particulars prescribed by the Companies (Disclosure of Particulars in the Report of Board of Directors) Rules,1988 relating to Conservation of Energy, Technology Absorption, Foreign Exchange are furnished in Annexure-A to this Report.Long Term Borrowings:Secured Non-Convertible DebenturesDuring the year, your Company issued Secured Non-convertible Debentures to the tune of ` 350 Crores for a tenor of 3 years (NCD Series AL 17 for ` 200 Crores and NCD Series AL 19 for ` 150 Crores) and ` 250 Crores for a tenor of 5 years (NCD Series AL 18 for ` 100 Crores and NCD Series AL 20 for ` 150 Crores) aggregating to ` 600 Crores for FY 2012-13. During the year, no Secured Non-Convertible Debenture had fallen due for redemption.External Commercial Borrowings (ECBs)Your Company contracted ECBs in Japanese Yen, equivalent to USD 60 Mn, during FY 2011-12 and USD 115 Mn in 2012-13 from Banks for an average tenor of 5 to 5.6 years (Door to door of 6 to 7 years) on unsecured basis and USD 110 Mn was utilized during FY 2012-13. The funds drawn under ECBs were utilized to fund capital expenditure programme of the Company and other approved end uses as per extant RBI guidelines and the terms of the loan. Your Company repaid ECB loan instalments that fell due, in Japanese yen, equivalent to USD 81.66 Mn and USD 16.66 Mn during FY 2012-13.Part II - Corporate mattersHuman Resources Your Company values the human resources, their contribution and potential, as one of the foundational pillars for achieving the organisational vision.Your Company’s flagship scheme for seeding internal leadership pipeline has been re-christened as the ‘Emerging Leaders Programme’ with a renewed focus to identify and nurture internal leaders. Banner projects involving cross-functional teams have benefitted the organisation in product initiatives, process efficiency and market share improvements.

Ashok Leyland Limited26
DIReCtoRS’ RepoRt
Your Company has sustained the status as the ‘Most Preferred Employer’ on Premier Engineering Institutes, which has facilitated induction of a creamy layer of talent.Your Company developed vibrant Industry-Institute collaborative initiatives, leading to creation of a talent pool, skill and capabilities enhancement.Shop floor engagement initiatives like ‘Blessing’, Knowledge Academy / career development for associates, have gained momentum, promoting a collaborative work culture.Your Company sustained harmonious and healthy industrial relations in all manufacturing plants.Corporate GovernanceYour Company is fully compliant with the Corporate Governance guidelines, as laid out in Clause 49 of the Listing Agreement. All the Directors (and also the members of the Senior Management – of the rank of General Managers and above) have confirmed in writing their compliance with and adherence to the Code of Conduct adopted by the Company. The details of the Code of Conduct are furnished in Annexure-B to this Report. The Managing Director has issued certificate of compliance with the Code of Conduct, as required by SEBI guidelines. Many of the Corporate Governance Voluntary Guidelines 2009 issued by Ministry of Corporate Affairs are being followed by your Company.The Statutory Auditors of the Company have examined the requirements of Corporate Governance with reference to Clause 49 of the Listing Agreement, and have certified the compliance, as required under SEBI guidelines. The certificate is reproduced as Annexure-C to this Report.The Directors’ Responsibility Statement as required under Section 217(2AA) of the Companies Act, 1956 is furnished in Annexure-E to this Report.The information required under Section 217(2A) of the Companies Act, 1956 and the Rules made thereunder is provided in Annexure forming part of the Report. In terms of Section 219(1)(b)(iv) of the Act, the Report and Financial Statements are being sent to the shareholders excluding the aforesaid Annexure. Any shareholder interested in obtaining copy of the same may write to the Company Secretary. The MD / CFO certification as required under the SEBI guidelines is attached as Annexure-F to this Report. Related Party disclosures/transactions are detailed in Note 3.5 of the Notes to the Financial Statements. DirectorsMr Anil Harish, Mr Sanjay K Asher and Mr Jean Brunol, Directors, retire at the forthcoming Annual General Meeting and are eligible for re-appointment. Mr R Seshasayee steps down as Executive Vice Chairman at the expiry of his term as on 31.03.2013. However, he continues to be a Director and becomes eligible for
retirement by rotation. He retires at the forthcoming Annual General Meeting and is eligible for reappointment.
Mr R Seshasayee was appointed as Non-Executive Vice Chairman effective 01.04.2013.
Dr Andreas H Biagosch was appointed as an Additional Director at the Board Meeting held on May 10, 2013. His term of office expires at the end of the ensuing Annual General Meeting. The Company has received Notice under Section 257 of the Companies Act proposing him for appointment as Director of the Company.
Necessary resolutions are being placed before the shareholders for approval.
Cost Auditors
The Government has stipulated Cost Audit of the Company’s records in respect of motor vehicles as well as engineering industries (diesel engines). M/s Geeyes & Co., (Regn. No. 00044) Cost Auditors have carried out these audits. Their findings have been satisfactory. The Audit Committee of the Board has recommended their re-appointment for the year 2013-14.
Cost Audit Reports for the financial year 2011-12 were filed on January 28, 2013 (due date – February 28, 2013).
Auditors
M/s M S Krishnaswami & Rajan, Chartered Accountants and M/s Deloitte Haskins & Sells, Chartered Accountants, retire at the close of this Annual General Meeting and are eligible for re-appointment. The Company has received confirmation from both the firms that their appointment will be within the limits prescribed under Section 224(1B) of the Companies Act, 1956. The Audit Committee of the Board has recommended their re-appointment for the year 2013-14. The necessary resolution is being placed before the shareholders for approval.
Acknowledgement
The Directors wish to express their appreciation of the continued co-operation of the Central and State Governments, bankers, financial institutions, customers, dealers and suppliers and also the valuable assistance and advice received from the joint venture partners, the major shareholders Hinduja Automotive Limited, the Hinduja Group and all the shareholders. The Directors also wish to thank all the employees for their contribution and continued commitment, support and co-operation through the year.
On behalf of the Board of Directors
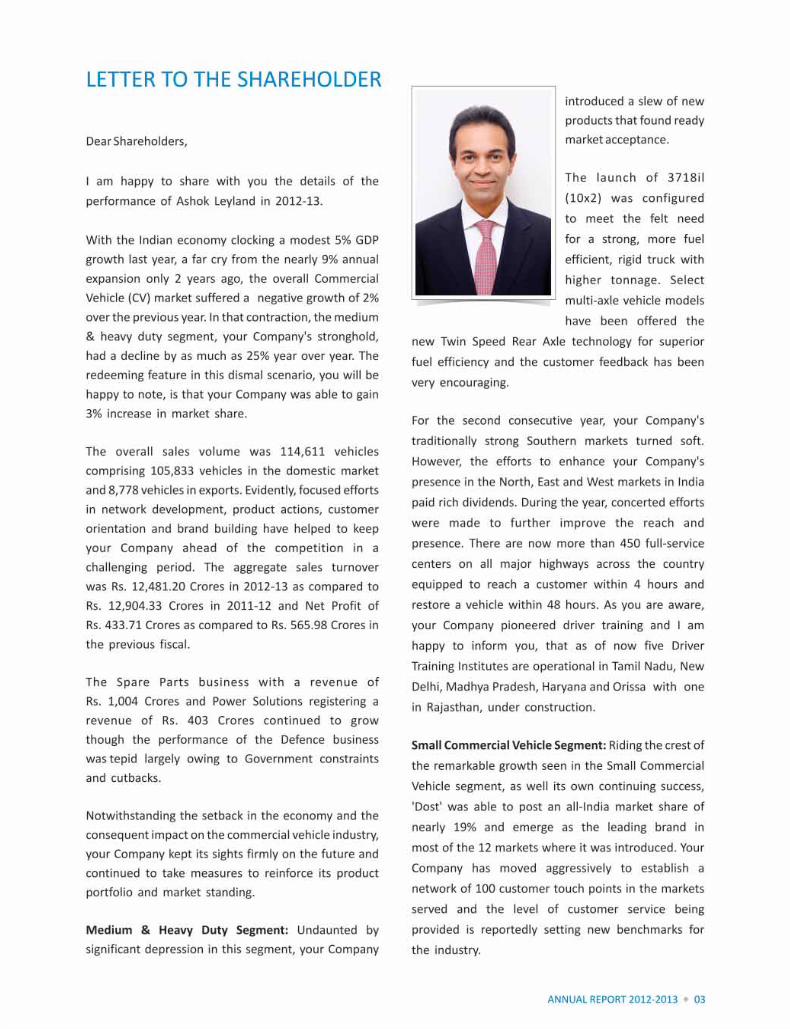
Chennai Dheeraj G Hinduja May 10, 2013 Chairman

ANNUAL REPORT 2012-2013 27
ANNeXURe A to DIReCtoRS’ RepoRtPARTICULARS OF CONSERVATION OF ENERGY, TECHNOLOGY ABSORPTION AND FOREIGN ExCHANGE(A) CONSERVATION OF ENERGY
- All manufacturing plants continued their efforts in conserving energy.
- About 10.4 Mn electrical units (2.3 times increase from 2011-12) have been saved leading to significant savings in energy costs in 2012-13.
This was possible due to the high degree of awareness and intensive focus on energy-saving avenues through the Mission Gemba Cost Management Initiatives.
- Besides, phenomenal savings were realised by the recurring benefits from energy savings projects to the tune of ` 80.5 lakhs in 2012-13 as per the recommendations of PCRA through their audits at all manufacturing plants in 2011-12 and implementation of the pending projects as well.
Significant Initiatives:
- 62.2% of total savings in cost was through wind power.
- 12% of total savings through systematic monitoring and controlling.
- Maintenance of Power factor throughout the year through optimum use of capacitor banks.
- Augmentation of Solar Energy at plants.
On Grid interactive Solar Power Plant introduced at our Technical Centre, Vellivoyalchavadi, Chennai.
- Use of natural lighting & ventilation and less energy consuming lights (CFL, LED etc.).
- Use of Indian Energy Exchange (IEx) power has resulted in savings of ` 121.7 lakhs.
- Concept of energy saving per machine introduced.
Awards and recognition:
- Alwar Plant won 2nd Position in the National Energy Conservation Award (NECA-2012) from the President of India on December 14, 2012 for the Automobile sector in the Minor Consumer category.
- Pantnagar Plant won 2nd Position in the National Energy Conservation Award (NECA-2012) from the President of India on December 14, 2012 for the Automobile manufacturing sector category.
B) TECHNOLOGY ABSORPTION
1. Specific areas in which R&D was carried out by the Company
Engines & Aggregates
- Production rampup readiness of ‘Neptune’ series of engines completed after extensive engine and vehicle durability trials.
- Development of engine and exhaust systems to meet OBD-II (On Board Diagnostics) requirements.
- Technology readiness to meet emerging Bharat Stage V and VI emission norms.
- Development of new Front Axles for the Intermediate Commercial (ICV) range of vehicles.
- Development of Multiplexed Electrical Architecture for buses & trucks.
Vehicle models
- Introduction of New 5-axle haulage vehicle with lift axle, for improved payload, carrying capacity and superior value.
- Launch of several U-Truck tractor and tipper models and variants, building upon the successful introduction of the platform in 2011-12.
- Launch of several buses and trucks that meet Bharat Stage IV regulations.
- First commercial vehicle manufacturer in the country to meet the OBD-II requirements.
- New Global Bus Program initiated to develop transport solutions on a fully modular and cost efficient platform.
- Launch of various models for the Indian Army.
2. Benefits derived as a result of R&D:
Market introduction of new engine families with improved performance and fuel economy compared to competition, package protected for Euro-6 emission standards.
- New vehicle introductions in the LCV segment and export markets, thereby delivering incremental volumes.

Ashok Leyland Limited28
- New vehicles launched with superior price-performance value propositions.
- Improved market penetration of new platforms and models creating critical momentum for further growth.
- More than 15 provisional patents filed.
3. Future plan of action:
- Introduction of the world’s first front engine, single step entry, fully flat low floor bus, the JanBus.
- New range of Intermediate Commercial Vehicle (ICV) trucks with completely new styling is ready for launch.
- Next generation of cab with all-new styling is ready for launch.
4) Expenditure on R&D
` Lakhs
2012-13
Capital 6,594.50
Revenue (excluding depreciation) 24,503.09
Less: Amount received by R & D Facilities 711.42
Total 30,386.17
Total R & D Expenditure as a % of total turnover 2.28%
(C) FOREIGN EXCHANGE EARNINGS AND OUTGO
Details of earnings accrued and expenditure incurred in foreign currency are given in Note 3.2.1, 3.2.2 and 3.2.3 of the Financial Statements. The Company continues to strive to improve its earnings from exports.
ANNExURE - A TO DIRECTORS’ REPORTPARTICULARS OF CONSERVATION OF ENERGY, TECHNOLOGY ABSORPTION AND FOREIGN ExCHANGE

ANNUAL REPORT 2012-2013 29
ANNExURE - B TO DIRECTORS’ REPORTREPORT ON CORPORATE GOVERNANCE
of Insider Trading) Regulations, 1992. All the Directors, employees at senior management level and other specified employees who could have access to the unpublished price sensitive information of the Company are governed by the Code. During the year under review, there has been due compliance with SEBI (Prohibition of Insider Trading) Regulations, 1992.
2. Board of Directors:
Your Company has a broad based Board comprising 50% Non-Executive Independent Directors.
a) Composition: As at March 31, 2013, the strength of the Board was 12 members with Mr. Dheeraj G Hinduja as Non-Executive Chairman. The composition of the Board is as follows:
Name % to the total number of Directors
i) Non-Executive Independent Directors:
Mr. Anil Harish
50.00
Mr. D J Balaji Rao
Mr. Jean Brunol
Mr. Jorma Antero Halonen
Mr. Sanjay K Asher
Mr. Shardul S Shroff
ii) Other Non-Executive Directors
Mr. D G Hinduja,Chairman(Alternate: Mr Y M Kale)
33.33Mr. A K Das
Mr. F Sahami
Dr. V Sumantran,Non-ExecutiveVice Chairman
iii) Executive Directors:
Mr. R Seshasayee,Executive Vice Chairman*
16.67Mr. Vinod K Dasari,Managing Director
None of the above Directors are related to each other.
Board appointments are made by the issue of formal letters of appointment.
* Mr. R. Seshasayee - ceased to be the Executive Vice Chairman on the expiry of his term on 31.03.2013 and has been appointed as Non-Executive Vice-Chairman with effect from 01.04.2013.
Your Company is committed to good Corporate Governance, based on an effective independent Board, separation of supervisory role from the executive management and the constitution of Committees to oversee critical areas. The Board meets in February/March every year to formulate corporate plans for the next five years, revisits/reviews strategy adopted and suggest corrections if any required to the operating team.
1. Philosophy on Corporate Governance
Ashok Leyland’s Corporate Governance philosophy encompasses not only regulatory and legal requirements but also strives to enhance shareholders’ value through
– good strategic direction
– sound business decisions
– prudent financial management
– high standards of ethics throughout the organisation
– ensuring transparency and professionalism in all decision making processes relating to transactions of the Company and
– achieving excellence in Corporate Governance through:
– conforming to the prevalent mandatory stipulations/guidelines on Corporate Governance
– regular review of the Board processes and the management systems for further improvement
– following Voluntary Guidelines 2009 issued by the Ministry of Corporate Affairs
Your Company has adopted a Code of Conduct for members of the Board and senior management. The Code aims at ensuring consistent standards of conduct and ethical business practices across the Company. Your Company has received confirmations from all concerned regarding their adherence to the said Code.
Pursuant to Clause 49 of the Listing Agreement, a confirmation from the Managing Director of the Company regarding compliance with the Code by all members of the Board and senior management is given on Page 40 of the Annual Report. The full text of the Code is furnished at the end of this Report, and is also displayed on the Company’s website www.ashokleyland.com.
Your Company has adopted a Code of Conduct for Prevention of Insider Trading as per SEBI (Prohibition

Ashok Leyland Limited30
b) Attendance at Board Meetings and last Annual General Meeting (AGM) and details of memberships of Directors in other Boards and Board Committees
Name of Director
No. of Board meetings attended
during the year 2012-13
Whether attended last A.G.M. held on July 24,
2012
No. of Directorship in other Public Companies registered
under Companies Act (#)
No. of Committee position in other Public Companies
registered under Companies Act (**)
as Member
as Chairman
as Member
as Chairman
Mr. D G Hinduja 6 yes 5 - - -
Mr. Anil Harish 4 yes 13 - 6 3
Mr. D J Balaji Rao 6 yes 9 1 4 4
Mr. A K Das 5 yes 7 2 2 -
Mr. Jean Brunol 5 yes 1 - - -
Mr. Jorma Antero Halonen 5 yes 1 - - -
Mr. F Sahami 6 yes 1 - 1 -
Mr. Sanjay K Asher 6 yes 14 - 5 3
Mr. Shardul S Shroff 3 yes 6 - 2 -
Dr. V Sumantran 5 yes 4 3 2 2
Mr. R Seshasayee 5 yes 4 5 1 2
Mr. Vinod K Dasari 5 yes 6 - - -
Alternate Director
Mr. Y M Kale Nil Not applicable
2 - 1 1
(#) Excludes Alternate Directorships
(**) Represents memberships in Audit Committee and Shareholders/Investors Grievance Committee of Public Companies governed by the Companies Act, 1956
‘Public Companies’ excludes Foreign Companies
Video Conferencing facilities are also used to facilitate Directors not present at location where the meeting is held, to participate in the meetings
ANNExURE - B TO DIRECTORS’ REPORTREPORT ON CORPORATE GOVERNANCE
ANNUAL REPORT 2012-2013 31
During the year under review, none of the Directors of the Company was a member of more than 10 specified Committees or Chairman of more than 5 such Committees in companies in which he was a Director.
Details of Directors seeking re-appointment at the ensuing Annual General Meeting have been furnished in the Notice convening the meeting of the Shareholders.
Non-Executive Directors are entitled to a Sitting Fee of ` 20, 000/- for attending to each of the Board/Committee Meeting(s).
Pursuant to the approval of the shareholders at the 62nd Annual General Meeting of the Company held on July 19, 2011, Commission is payable for the financial year 2012-13 to the Non-Executive Directors at a rate not exceeding 1% of the Net profits of the Company computed in accordance with the provisions of Section 198 and 309 of the Companies Act, 1956. The amount of commission payable to each director is decided by the Board of Directors on the following criteria.
• Number of Board meetings attended
• Role and responsibility as Chairman / Member of the Board
• Role and responsibility as Chairman / Member of the Committee(s)
• Overall contribution and role outside the meetings.
The details of shares held by the Directors of the Company are furnished below:
Name of the Director No. of equity shares heldMr. R Seshasayee 22,472Mr. Vinod K Dasari 60,000
Your Company does not have any outstanding instruments for conversion into shares.
Board Meetings held during the year 2012-13
Date of Meeting Total no. of Directors
No. of Directors present
May 14, 2012 12 12June 12, 2012 12 7July 24, 2012 12 12November 8, 2012 12 11January 24, 2013 12 10February 27 – March 1, 2013
12 9
The time gap between any two meetings did not exceed four months.
The last Annual General Meeting was held on July 24, 2012.
Secretarial Standards
The Institute of Company Secretaries of India (ICSI) has published Standards on secretarial practices relating to meetings of the Board / Committees, General Meetings, Dividends, etc. The Secretarial and the operating practices of the Company are in line with the above Secretarial Standards. Information required as per Annexure-I to Clause 49 of the Listing Agreement with Stock Exchanges is provided to the Board at every meeting.
3. Audit Committee:
The Audit Committee of the Company has been in existence from July 1987.
a) Terms of Reference:
The Audit Committee is responsible for overseeing the Company’s financial reporting process by providing direction to audit function and monitor the scope and quality of internal and statutory audits.
The Head of Internal Audit function reports to the Audit Committee. The Committee acts as a link between the management, external and internal auditors and the Board of Directors of the Company.
Before submission to the Board for approval, the Committee reviews the quarterly/half-yearly/annual financial statements with reference to changes, if any, in accounting policies and reasons for the same, major accounting entries involving estimates based on exercise of judgment by management, adjustments, if any, arising out of audit findings, disclosure of related party transactions, compliance with listing and legal requirements relating to financial statements, qualifications, if any, in the draft audit report and above all adequacy of internal control systems.
The Committee holds discussions with external auditors before the audit commences regarding the nature and scope of audit and post audit discussions to ascertain any area of concern. It also reviews the Company’s financial and risk management policies especially enterprise level risks.
The Committee also looks into the matters as are specifically referred to it by the Board of Directors besides looking into the mandatory requirements of Clause 49 of the Listing Agreement and provisions of Section 292A of the Companies Act, 1956.
ANNExURE - B TO DIRECTORS’ REPORTREPORT ON CORPORATE GOVERNANCE

Ashok Leyland Limited32
b) Composition, Names of Members and Chairman
The Audit Committee consists of Mr. Anil Harish, Independent Director as Chairman, Mr. D J Balaji Rao, Mr. Sanjay K Asher, Independent Directors as Members and Mr. F Sahami, a Non-independent Director as Member.
All the members of the Audit Committee have expertise in financial and general management.
Mr. Anil Harish is a Partner of a renowned firm of Advocates, specialized in Corporate Law and Taxation matters, Real Estate, International Investments, etc. He was Executive Vice President of the Society of Indian Law Firms and was a member of the Managing Committee of the Income-tax Appellate Tribunal, Bar Association and Managing Council of the Chamber of Income Tax Consultants.
Mr. D J Balaji Rao was the Deputy Managing Director of the then ICICI Ltd., (now ICICI Bank Ltd.) and Managing Director of Infrastructure Development Finance Company Ltd.
Mr. F Sahami was a senior partner in a leading firm of Chartered Accountants.
Mr. Sanjay K Asher, a Commerce and Law Graduate and a Fellow member of the Institute of Chartered Accountants of India has been a Practising Advocate since 1989 with M/s Crawford Bayley & Co., which is a leading law firm. Mr. Sanjay K Asher is a leading authority in Mergers & Acquisitions, legal and tax related matters.
c) Meetings and Attendance
Audit Committee Meetings held during the year 2012-13 and attendance details
Date of Meeting No. of members present
May 14, 2012 4
July 24, 2012 4
November 8, 2012 4
January 24, 2013 3
l Mr. A R Chandrasekharan, Executive Director and Company Secretary was the Secretary to the Committee upto September 30, 2012.
With effect from October 1, 2012, Mr. S Venkatasubramanian, Company Secretary is the Secretary to the Committee.
l The Managing Director, Chief Financial Officer and Head – Internal Audit attended all the meetings of the Committees as invitees.
The Statutory Auditors of the Company and the Cost Auditors were invited to attend the meetings of the Audit Committee.
4. Nomination and Compensation Committee
a) The Nomination and Compensation Committee consists of Independent Directors viz., Mr. D J Balaji Rao, as the Chairman of the Committee, Mr. Anil Harish, as member and Non-Independent Directors viz., Mr. A K Das and Mr. D G Hinduja as the other members.
Mr. A R Chandrasekharan, Executive Director and Company Secretary, was the Secretary, to the Committee upto September 30, 2012.
With effect from October 1, 2012, Mr. S Venkatasubramanian, Company Secretary, is the Secretary to the Committee.
The Terms of Reference of this Committee are:
l Search for, evaluate, shortlist and recommend the incumbent for the position of Managing Director and the Whole-time Director and their engagement terms.
l Evaluate and approve for appointment of candidates recommended by the Managing Director for positions of Executive Directors and above.
l Design and administer processes for evaluating the effectiveness [i.e., Performance Management System] of the Managing Director, the Whole-time Director and senior management.
l Review the succession plan for critical positions and suggest actions.
b) The Remuneration Policy of the Company is summarized as follows:
The remuneration is governed by the external competitive environment, track record, potential, individual performance, Company’s performance and industry standards. Remuneration of the then Executive Vice Chairman and the Managing Director is recommended by Nomination and Compensation Committee and are subject to the approval of the Board of Directors and shareholders and consists of fixed and variable component and are in line with
ANNExURE - B TO DIRECTORS’ REPORTREPORT ON CORPORATE GOVERNANCE

ANNUAL REPORT 2012-2013 33
Company’s Policy and Rules as applicable to senior management personnel. The variable components include commission linked to individual performance. They are not entitled to any sitting fees for attending the Board / Committee meetings.
For Non-Executive Directors, in addition to a sitting fee of ` 20,000/- for each meeting attended, all Directors are also reimbursed actual travel costs and incidental expenses incurred for attending such meetings or in connection with the Company’s business. There are no pecuniary relationships or transactions between any of the Non-executive Directors and the Company.
The Non-Executive Directors are also entitled to a commission not exceeding 1% of the net profits of the Company as approved by the shareholders.
c) Nomination and Compensation Committee Meetings held during the year 2012-13 and attendance details
Date of Meeting No. of members presentMay 13, 2012 4November 8, 2012 4January 24, 2013 3February 28, 2013 2March 22, 2013 4
ANNExURE - B TO DIRECTORS’ REPORTREPORT ON CORPORATE GOVERNANCE
d) The details of remuneration paid/payable to the Directors for the year 2012-13 are:
i) Non-executive Directors - Sitting Fees: (excluding reimbursement of travel and other expenses incurred for the Company’s business).
` `
Mr. D G Hinduja 3,00,000 Mr. F Sahami 2,00,000Mr. Anil Harish 2,00,000 Mr. Sanjay K Asher 2,80,000Mr. D J Balaji Rao 3,80,000 Mr. Shardul S Shroff 60,000Mr. A K Das 1,80,000 Dr. V Sumantran 2,60,000Mr. Jean Brunol 2,60,000Mr. Jorma Antero Halonen 1,00,000
ii) Commission
` `
Mr. Anil Harish 8,80,000 Mr. F Sahami 7,90,000Mr. D J Balaji Rao 13,20,000 Mr. Sanjay K Asher 7,40,000Mr. A K Das 7,40,000 Mr. Shardul S Shroff 2,60,000Mr. Jean Brunol 21,50,000 Dr. V Sumantran 92,00,000Mr. Jorma Antero Halonen 31,00,000
iii) Executive Directors:
Mr. R SeshasayeeExecutive Vice Chairman
(`)
Mr. Vinod K DasariManaging Director
(`)a) Fixed Component (i) Salary 69,33,600 63,36,000 (ii) Special Allowance 69,33,600 63,36,000 (iii) Perquisites & Other Allowance (**) 1,00,85,017 55,29,121b) Variable Component - Commission 76,08,000 69,73,200c) Contribution to Provident Fund and Superannuation Fund 30,12,072 27,56,320 Total 3,45,72,289 2,79,30,641
(**) Certain perquisites are valued as per the Income Tax Rules.
Ashok Leyland Limited34
Mr. R. Seshasayee and Mr. Vinod K Dasari are under contract of employment with the Company for 2 years and 3 years respectively from April 1, 2011.
Mr. R. Seshasayee ceased to be the Executive Vice Chairman on the expiry of his term on March 31, 2013.
The Company has no Employee Stock Options Scheme in force at present.
5. Shareholders/Investors Grievance Committee
a) The Shareholders/Investors Grievance Committee was constituted in 2000. The Committee consists of Mr. Sanjay K Asher, as Chairman, Mr. D J Balaji Rao and Mr. R Seshasayee as members.
b) This Committee approves issue of new share certificates and looks into investor complaints/grievances on a periodical basis.
c) The Committee also reviews the performance of the Company’s Registrar & Transfer Agent (R&TA) and their system of dealing with and responding to correspondence from all categories of shareholders. The manner and timeliness of dealing with complaint letters received from Stock Exchanges / SEBI / Ministry of Corporate Affairs etc., and the responses thereto are reviewed by this Committee.
d) Based on the delegated powers of the Board of Directors, Executive Vice Chairman / Managing Director approves the share transfers / transmissions on a regular basis and the same is reported to at the next meeting of the Committee, normally held every quarter.
e) Mr. A R Chandrasekharan, Executive Director and Company Secretary, was the Secretary to the Committee and was also the Compliance Officer appointed for the compliance of capital market related laws till September 30, 2012.
With effect from October 1, 2012 Mr. S Venkatasubramanian, Company Secretary, is the Secretary to the Committee and is also the Compliance Officer appointed for the compliance of capital market related laws.
f) Meetings and Attendance during the year 2012-13:
Date of Meeting No. of members present
May 14, 2012 3
July 24, 2012 3
November 8, 2012 3
January 24, 2013 3
During the year, 2,388 complaints/correspondence letters were received from investors (including 30 letters from SEBI / Stock Exchanges / MCA and 2,358 letters were received on routine matters); all these were dealt with satisfactorily. The very few letters, which occasionally remained pending beyond the normal time limits were cases of inadequate documentation or clarifications being awaited, which have since been resolved. 2 unresolved complaints as at March 31, 2013 have since been resolved by April 5, 2013.
ANNExURE - B TO DIRECTORS’ REPORTREPORT ON CORPORATE GOVERNANCE
g) Nature of Correspondence/Complaints
Subject Matter of Correspondence Pending as on 31.03.2012
Letters Received Letters replied/ completed
Pending as on 31.03.2013
Non-receipt of Share Certificates - 73 73 -Non-receipt of Debenture Redemption - 27 27 -Non-receipt of Dividend 2 288 288 2Non-receipt of Annual Report - 134 134 -Other Correspondence - Regulatory - 1 1 -Revalidation of Dividend 1 486 487 -Issue of Duplicate Share Certificates - 38 38 -Loss of Share Certificate - 59 59 -Issue of Duplicate Dividend 2 242 244 -Procedure for Transmission - 135 135 -Change of Address / Bank Mandate - 454 454 -Other Correspondence - 205 204 1Unclaimed Share certificate - 246 246 -Total 5 2,388 2,390 3

ANNUAL REPORT 2012-2013 35
h) As on March 31, 2013, there were 6 share transfers pending which have since been resolved on April 3, 2013.
6) General body meetings
a) Details of location and time of holding the last three AGMs.
Year Location Date & Time
63rd AGM – 2012
The Music Academy Madras, 168 TTK Road, Royapettah, Chennai 600 014
July 24, 2012
2.45 p.m.
62nd AGM – 2011
The Music Academy Madras, 168 TTK Road, Royapettah, Chennai 600 014
July 19, 2011
2.45 p.m.
61st AGM – 2010
Tamil Isai Sangam, Rajah Annamalai Mandram, 5, Esplanade Road, Chennai 600 108
July 27, 2010
2.45 p.m.
The Chairman of the Audit Committee was present at all the above AGMs.
No EGM was held in the last three years.
b) No Special Resolutions were placed before the shareholders requiring approval through Postal Ballot.
7. Disclosures
There have been no materially significant related party transactions with the Company’s Promoters, Directors, the Management, their Subsidiaries or relatives which may have potential conflict with the interests of the Company. The necessary disclosures regarding the transactions with related parties are given in the Notes to the Financial Statements for the year 2012-13.
There have been no instances of non-compliance by the Company on any matters related to the capital markets, nor have any penalty/strictures been imposed on the Company by the Stock Exchanges or SEBI or any other statutory authority on such matters during the last three years. The Company had no subsidiary company as on March 31, 2013.
8. Means of Communication
a) Investor mailer is being sent since 2001 as an enclosure to the half-yearly results and the same is available on the Company’s website www.ashokleyland.com.
b) The quarterly results have been published in one leading national (English) business newspaper and in one vernacular (Tamil) newspaper. The quarterly results are also displayed on the Company’s website www.ashokleyland.com.
c) The Company’s website also displays several other details / information of interest to various stakeholders, including press releases.
d) A Management Discussion and Analysis Report is being presented as a part of the Annual Report.
e) Green Initiative: Pursuant to “Green Initiative” proposed by Ministry of Corporate Affairs (MCA) vide its Circular dated 21.04.2011, in response to the suggestions made by many shareholders in the past and to contribute towards improved environment, the Company has already taken action for sending communication / Annual Report and other documents through electronic mode to shareholders. It is hoped that with wide acceptance of the Green Initiative by the shareholders, the Company would be able to successfully implement the same, thereby contributing its mite to a greener environment.
ANNExURE - B TO DIRECTORS’ REPORTREPORT ON CORPORATE GOVERNANCE
9) General shareholder information
a. 64th Annual General Meeting— Day, Date and Time Tuesday, July 16, 2013 – 2.45 p.m.— Venue The Music Academy Madras, 168 TTK Road, Royapettah,
Chennai 600 014b. Financial Calendar
Annual General Meeting July 16, 2013Unaudited results for the quarter ending June 30, 2013 July 16, 2013Unaudited results for the quarter/half-year ending September 30, 2013
2nd week of November 2013
Unaudited results for the quarter ending December 31, 2013 4th week of January 2014Audited Results for the year ending March 31, 2014 Before end of May 2014

Ashok Leyland Limited36
c. Book Closure Date From July 6, 2013 to July 16, 2013 (both days inclusive)d. Dividend payment date Commencing July 17, 2013 – to be completed on or
before July 25, 2013e. a) Listing of Equity Shares Madras Stock Exchange Limited
BSE Limited National Stock Exchange of India Limited
b) Listing of Global Depository Receipts (GDRs) London Stock Exchangec) Listing of privately placed Debentures National Stock Exchange Ltd.The Listing Fees have been paid upto date, to all the Stock Exchanges
f. Stock Codea) Trading Symbol at Madras Stock Exchange Ltd. ALL
BSE Limited(Physical) 477(Demat) 500477
National Stock Exchange of India Ltd ASHOKLEYb) Demat ISIN Numbers in NSDL & CDSL Equity Shares INe208A01029c) Demat ISIN Numbers in NSDL &CDSL Privately placed Debentures Ashok Leyland 8.20% 2013 (Sr-AL13) INe208A07281 Ashok Leyland 8.20% 2014 (Sr-AL14) INe208A07299 Ashok Leyland 8.20% 2015 (Sr-AL15) INe208A07307 Ashok Leyland 10.25% 2016 (Sr-AL16) INe208A07315 Ashok Leyland 10.10% 2015 (Sr-AL17) INe208A07323 Ashok Leyland 10.20% 2017 (Sr-AL18) INe208A07331 Ashok Leyland 10.05% 2015 (Sr-AL19) INe208A07349 Ashok Leyland 10.15% 2017 (Sr-AL20) INe208A07356
g. Stock Market Data
Month
Bombay Stock Exchange National Stock Exchange
Share Price Sensex Points Share Price CNx Nifty Points
High (`) Low (`) High Low High (`) Low (`) High Low
April 2012 32.55 28.70 17664.10 17010.16 33.00 28.70 5378.75 5154.30
May 2012 32.90 23.70 17432.33 15809.71 33.50 23.55 5279.60 4788.95
June 2012 29.00 24.30 17448.48 15748.98 27.75 24.30 5286.25 4770.35
July 2012 26.15 21.15 17631.19 16598.48 26.15 21.05 5348.55 5032.40
Aug 2012 23.50 20.25 17972.54 17026.97 23.95 20.25 5448.60 5164.65
Sep 2012 24.85 20.55 18869.94 17250.80 24.90 18.75 5735.15 5215.70
oct 2012 25.00 22.90 19137.29 18393.42 24.95 21.85 5815.35 4888.20
Nov 2012 28.65 23.30 19372.70 18255.69 28.65 23.30 5885.25 5548.35
Dec 2012 28.70 26.35 19612.18 19149.03 29.00 26.30 5965.15 5823.15
Jan 2013 27.90 22.25 20203.66 19508.93 27.90 22.15 6111.80 5935.20
Feb 2013 25.50 22.05 19966.69 18793.97 25.50 21.55 6052.95 5671.90
Mar 2013 24.20 21.80 19754.66 18568.43 24.20 21.60 5971.20 5604.85
ANNExURE - B TO DIRECTORS’ REPORTREPORT ON CORPORATE GOVERNANCE

ANNUAL REPORT 2012-2013 37
h) Share Price performance in comparison to broad based indices – BSE Sensex and NSE Nifty Share Price Movement (BSE and NSE) - See Table above and Chart on Page 99.
i) Registrar and Transfer Agents
M/s Integrated Enterprises (India) Ltd., 2nd Floor, Kences Towers, 1 Ramakrishna Street, North Usman Road, T. Nagar, Chennai 600 017, deal with all aspects of investor servicing relating to shares in both physical and demat form.
j) Share Transfer System
The authority relating to transfer of shares and allied work relating to servicing of investors has been delegated by the Board to the Shareholders/ Investors Grievance Committee which consists of Mr. Sanjay K Asher (Chairman), Mr. D J Balaji Rao and Mr. R Seshasayee.
In order to further improve and speed up investor servicing, the Board has authorized the Executive Vice Chairman/Managing Director to approve all routine transfers, transmissions, etc., of shares. Such approval is being given by the Executive Vice
ANNExURE - B TO DIRECTORS’ REPORTREPORT ON CORPORATE GOVERNANCE
Chairman / Managing Director at frequent intervals (41 times during 2012-13). Transfers, transmissions, etc., were generally approved within 15 days; requests for dematerialization were confirmed within 7 days (as against the norm of 15 days). In addition, the Committee met 4 times during the year 2012-13 for approving transfers, transmissions, issue of duplicate shares etc. and reviewing investor grievances.
k) Unclaimed Shares 30,23,811 shares were lying outstanding as Unclaimed
shares at the beginning of the year pertaining to 3,039 shareholders;
234 shareholders approached the Company for transfer of 2,84,360 shares from the Unclaimed shares during the year and the same were effected;
27,39,451 shares were lying as unclaimed pertaining to 2805 shareholders as on March 31, 2013.
As per SEBI directive, unclaimed shares lying outstanding as on March 31, 2013 were transferred to Ashok Leyland Limited - Unclaimed Suspense Account and that the voting rights on these shares shall remain frozen till the rightful owner of such shares claims the shares.
l. (i) Distribution of Shareholding as on March 31, 2013
No. of Shares Shareholders No. of shares
Number % Number %
Upto 50 47,565 15.56 12,22,107 0.05
51-100 41,472 13.56 38,63,645 0.15
101-200 58,951 19.29 1,10,03,409 0.41
201-500 58,172 19.02 2,23,79,543 0.84
501-1000 45,268 14.80 3,81,41,174 1.43
1001-2000 26,703 8.73 4,41,28,003 1.66
2001-5000 18,769 6.14 6,28,14,686 2.36
5001-10000 5,753 1.88 4,20,01,266 1.58
10001 & above 3,134 1.02 243,51,22,801 91.52
Total 3,05,787 100.00 266,06,76,634 100.00
No. of shares
Physical - 3,15,20,760
Electronic Mode
NSDL - 2,56,81,98,769
CDSL - 6,09,57,105

Ashok Leyland Limited38
(ii) Pattern of Shareholding as on March 31, 2013
Sl No. Category No. of Holders No. of Shares %
1 Promoter - Hinduja Automotive Ltd. (Includes 32,92,00,140 shares in GDR Form)
1 135,64,37,564 50.98
2 Residents (Individuals / Clearing Members) 2,99,999 28,17,49,983 10.58
3 Financial Institutions/Insurance Co. / State Govt./Govt. Companies/UTI
29 32,34,02,032 12.15
4 Foreign Institutional Investors 157 44,93,62,458 16.89
5 Non-Resident Indians/ OCB / Corporate Bodies - Foreign / Bank - Foreign / Foreign Nationals
3,794 2,73,54,648 1.03
6 Corporate Bodies/ Limited Liability Partnership 1,718 16,77,95,079 6.31
7 Mutual Funds 24 2,46,97,822 0.93
8 Trusts 27 5,74,494 0.02
9 Banks 36 12,05,054 0.05
10 Others - GDR 2 2,80,97,500 1.06
TOTAL 3,05,787 266,06,76,634 100.00
m. Dematerialisation of shares and liquidity
Shares of the Company can be held and traded in electronic form. As stipulated by SEBI, the shares of the Company are accepted in the Stock Exchanges for delivery only in dematerialisation form.
Status of Dematerialisation of Shares - as on March 31, 2013
Physical Demat Total
Holders No. of Shares % to paid-up capital
No. of Shares (**)
% to paid-up capital
No. of Shares (**)
% to paid-up capital
Hinduja Automotive Limited (**) -- -- 135,64,37,564 50.98 135,64,37,564 50.98
Others 3,15,20,760 (***) 1.18 127,27,18,310 47.84 130,42,39,070 49.02
** including in GDR Form
*** held by 16,517 holders
Your Company confirms that the entire Promoter’s holdings were converted into electronic form and the same is in line with the direction issued by SEBI.
Equity Share of the Company are regularly traded in the Bombay and National Stock Exchanges, and hence have good liquidity.
n. Outstanding GDR/ Warrants and Convertible Notes, Conversion date and likely impact on the equity
No GDR is outstanding as on March 31, 2013 having an impact on equity.
ANNExURE - B TO DIRECTORS’ REPORTREPORT ON CORPORATE GOVERNANCE
ANNUAL REPORT 2012-2013 39
o. Plant Locations
EnnoreKathivakkam High Road Ennore Chennai 600 057Tamil Nadu
Hosur – Unit I175 Hosur Indl. ComplexHosur 635 126Tamil Nadu
Hosur – Unit II77 Electronic ComplexPerandapalli VillageHosur 635 109 Tamil Nadu
Hosur – Unit IIACab Panel Press ShopSIPCOT Industrial ComplexMornapalli villageHosur 635 109 Tamil Nadu
BhandaraPlot No.1 MIDC Industrial AreaVillage Gadegaon,Sakoli Taluk, Bhandara 441 904Maharashtra
Alwarplot No.SpL 298Matsya Indl. AreaAlwar 301 030Rajasthan
Ambattur3A/A&2 North PhaseSidco Industrial EstateAmbattur Chennai 600 098Tamil Nadu
Technical CentreVellivoyalchavadiVia Manali New TownChennai 600 103Tamil Nadu
Pantnagarplot No.1, Sector XIIII E, Pantnagar,Pin -263 153Uttarakhand
p. Address for CorrespondenceTo contact R&TA for all matters relating to Shares, Dividends, Annual Reports
M/s Integrated Enterprises(India) Limited2nd Floor, Kences Towers1, Ramakrishna Street North Usman Road T. Nagar, Chennai 600 017
Tel : 91-44 – 2814 0801 / 03Fax : 91-44 – 28142479e-mail : [email protected]
For any other general matters or in case of any difficulties/ grievances
Secretarial DepartmentAshok Leyland LimitedNo.1 Sardar Patel RoadGuindy, Chennai 600 032
Tel. : 91-44-2220 6000Fax : 91-44-2230 4410e-mail : [email protected]@integratedindia.in
Website address www.ashokleyland.com
Email ID of Investor Grievances Section
Name of the Compliance Officer S VenkatasubramanianCompany Secretary
Non mandatory requirements1. Chairman The Company maintains the office of the Chairman and reimburses expenses incurred in the performance of his duties.2. Nomination and Compensation Committee The Company has constituted a Nomination and Compensation Committee; full details are furnished under Item 4 of
this Report.3. Shareholder Rights The statements of quarterly and half yearly results are being published in the Press. The Company has been mailing half-
yearly reports to shareholders from October 2001, along with a letter from the Managing Director highlighting significant events. For the year 2012-13, half-yearly reports were despatched to shareholders in the month of November 2012.
4. postal Ballot The Company has had no occasion to use the postal ballot during the year.5. Whistle Blower Policy The Company does not have a Whistle Blower Policy, but has an Ombudsman.
ANNExURE - B TO DIRECTORS’ REPORTREPORT ON CORPORATE GOVERNANCE

Ashok Leyland Limited40
ANNExURE - B TO DIRECTORS’ REPORTREPORT ON CORPORATE GOVERNANCE
Code of Conduct
Members of the Board and the Senior Management, shall
a) Always act in the best interests of the Company and its stakeholders.
b) Adopt the highest standards of personal ethics, integrity, confidentiality and discipline in dealing with all matters relating to the Company.
c) Apply themselves diligently and objectively in discharging their responsibilities and contribute to the conduct of the business and the progress of the Company and not be associated simultaneously with competing organisations either as a Director or in any managerial or advisory capacity, without the prior approval of the Board.
d) Always adhere and conform to the various statutory and mandatory regulations/guidelines applicable to the operations of the Company, avoiding violations or non-conformities.
e) Not derive personal benefit or undue advantages (financial or otherwise) by virtue of their position or relationship with the Company, and for this purpose
i) shall adopt total transparency in their dealings with the Company
ii) shall disclose full details of any direct or indirect personal interests in dealings/transactions with the Company
iii) shall not be party to transactions or decisions involving conflict between their personal interest and the Company’s interest.
f) Conduct themselves and their activities outside the Company in such manner as not to adversely affect the image or reputation of the Company.
g) Inform the Company immediately if there is any personal development (relating to his/her business/professional activities) which could be incompatible with the level and stature of his position and responsibility with the Company.
h) Bring to the attention of the Board, Chairman or the Managing Director as appropriate, any information or development either within the Company (relating to its employees or other stakeholders) or external, which could impact the Company’s operations and which in the normal course, may not have come to the knowledge of the Board/Chairman or Managing Director.
i) Always abide by the above Code of Conduct, and be accountable to the Board for their actions/violations/defaults.
Code of Conduct for the Senior Management
This is to confirm that for the financial year ended March 31, 2013 all members of the Senior Management have affirmed in writing their adherence to the Code of Conduct adopted by the Company.
May 10, 2013 Vinod K DasariChennai Managing Director

ANNUAL REPORT 2012-2013 41
To the Members of Ashok Leyland Limited
1. We have examined the compliance with the conditions of Corporate Governance by Ashok Leyland Limited (the Company) for the year ended March 31, 2013 as stipulated in Clause 49 of the Listing Agreement of the said Company with the stock exchanges in India, with the relevant records and documents maintained by the Company and furnished to us and the report on Corporate Governance as approved by the Board of Directors.
2. The compliance of conditions of Corporate Governance is the responsibility of the management. Our examination has been limited to procedures and implementation
thereof, adopted by the Company for ensuring the said compliance. It is neither an audit nor is this certificate an expression of opinion on the financial statements of the Company.
3. Based on the aforesaid examination and according to the information and explanations given to us, we certify that the Company has complied with the said conditions of Corporate Governance as stipulated in the above mentioned Listing Agreement.
4. We further state that such compliance is neither an assurance as to the future viability of the Company nor the efficiency or effectiveness with which the management has conducted the affairs of the Company.
ANNExURE - C TO DIRECTORS’ REPORTAUDITORS’ CERTIFICATE ON COMPLIANCE WITH THE CONDITIONS OF CORPORATE GOVERNANCE UNDER CLAUSE 49 OF THE LISTING AGREEMENTS
For M.S. KRISHNASWAMI & RAJAN For DELOITTE HASKINS & SELLSChartered Accountants Chartered AccountantsRegistration No: 01554S Registration No: 117366W
M. S. MURALI A. SIDDHARTHPartner PartnerMembership No. 26453 Membership No. 31467
May 10, 2013Chennai

Ashok Leyland Limited42
ANNExURE - D TO DIRECTORS’ REPORT MANAGEMENT DISCUSSION AND ANALYSIS REPORT
A. Market trends
Economy
During FY 2012-13, the Indian economy experienced a low growth rate of about 5-5.5%. Year-on-year GDP growth rate in the 3rd quarter touched 4.5%, the second lowest in recent years.
Agricultural growth at 1.8% year-on-year was lower compared to 3.6% of the previous fiscal because of the delayed onset of monsoon that resulted in food grain production contracting by about 3.5%.
Industrial sectors, too, continued to reel under the severe slowdown. The general IIP index contracted for 6 months out of 11, the manufacturing index for 5 months out of 11 and the mining index for 10 months out of 11. The general index, therefore, grew by a low 0.9% during the period April to February. The manufacturing index demonstrated a mere 1% growth during the same period. The mining index showed a de-growth of 2.5%. As a result, CSO has estimated manufacturing GDP growth of just 1.9% for the full year (2.7% last fiscal) and a mining growth of 0.4% for the full year (-0.6% last fiscal).
Going ahead, most market analysts expect FY 2013-14 GDP to be around 6%, assuming a normal monsoon. The Reserve Bank of India remains focused on containing inflation, and is expected to continue following a conservative policy on interest rates. Some positive movement is visible in the mining policy while the manufacturing slowdown appears to be slowly bottoming out. Lower crude prices are also expected to help the government meet its fiscal targets. However, much work remains to be done to free up core sectors and restart growth, and recovery is expected to be slow. Long term prospects for the Indian economy, however, continue to remain bright, given the favourable demographics and the directional commitment towards liberalisation.
In 2012, the global economy continued to perform weakly. World output was down from 4% in 2011 to 3.2% in 2012. Emerging and developing economies touched a low of 5.1%, reflecting a sharp drop from 6.4% in the previous year. Apart from the Middle East, Africa and ASEAN, most economies shrank significantly. The Euro zone shrank by 0.6%.
Going forward, outlook for the global economy has both areas of concern as well as some bright spots. IMF expects emerging and developing economies to grow relatively strongly at 5.3% and 5.7% for 2013 and 2014 respectively. While US is recovering faster and is expected to clock 1.9% & 3% for the same period, the Euro zone is expected to continue lagging, with bleak scenarios of -0.3% & 1.1% for
2013 & 2014 respectively. Even the stronger economies in Europe, such as Germany and France, have poor growth forecasts. Against this background, the overall global economic growth will remain muted.
Commercial Vehicle industry
Contrary to predictions made last year, the Commercial Vehicle (CV) industry fell despite the Light Commercial Vehicle (LCV) category performing well. The industry also saw the entry of new players into the market.
The overall CV market registered a de-growth of 2% in April-March 2013 as compared to the corresponding period last year. The overall volumes went down from 809,499 vehicles to 793,150, vehicles. The Medium & Heavy Commercial Vehicles (M&HCVs) segment declined by 23% to an overall volume of 268,623 vehicles while the LCV segment grew at 14% to reach 524,887 vehicles.
The LCV segment has been one of the growing segments in the entire automobile space. The 2 - 3.5 T GVW segment, within LCVs, is driving growth with a year-on-year increase of 72% in volumes. This is on the back of strong demand for transportation of consumer goods within cities and replacement demand from upper-end three wheelers.
Reflecting the downtrend in the economy, multi-axle rigid trucks fell by over 32% compared to the previous year to reach 96,424 vehicles. These vehicles are used to transport a wide range of goods such as agricultural produce, cement, other materials used in construction and industrial goods. This drop was due to an overall slowdown in industrial and construction activity and the resultant caution among transporters. It was also in part due to the shift to rigid vehicles with higher capacity (8x2) for greater operating efficiencies. This trend was reflected in the tractor-trailer segment as well which registered a drop of 35% to reach 18,593 vehicles. The ICV (Intermediate Commercial Vehicle) trucks which are in the 10-12 tonne capacity range, also fell from 67,104 vehicles to 57,571 vehicles, a drop of over 14%. Sale of tippers also fell by 28%, mainly due to poor economic activity and the ban on mining in Karnataka and Goa.
The segment level drop was also reflected consistently across the four regions of the country. Among them, the Eastern region recorded the steepest fall of almost 35% in M&HCV sales over last year. This could be attributed mainly due to lack of mining activity across the region.
2012-13 was also a poor year for Indian exports, with sale of commercial vehicles dropping by 13% from 92,258 vehicles to 79,944 vehicles with key markets like Sri Lanka dropping drastically and procuring more from China.

ANNUAL REPORT 2012-2013 43
ANNExURE - D TO DIRECTORS’ REPORT MANAGEMENT DISCUSSION AND ANALYSIS REPORT
The Total Industry Volumes registered in 2011-12 and 2012-13 are provided below:
DoMeStIC eXpoRtS
2012-13 2011-12 Change(%)
2012-13 2011-12 Change(%)
M & HCV Passenger 46,553 49,882 (6.7) 7,110 9,209 (22.8)
M & HCV Truck 221,710 299,334 (25.9) 11,909 19,286 (38.3)
LCV Passenger 48,153 48,868 (1.5) 3,477 4,206 (17.3)
LCV Truck 476,734 411,415 15.9 57,448 59,557 (3.5)
total Cv 793,150 809,499 (2.0) 79,944 92,258 (13.4)
The tepid economic environment and the high base, are bound to have an impact on Total Industry Volume (TIV) in the coming fiscal. Several industry analysts have projected growth rates at 4-8%. SIAM has projected an annual growth rate of 3-5% for medium & heavy duty vehicles and about 12-14% for light vehicles.
B. Ashok Leyland - The year (2012-13) in brief
Medium and Heavy Commercial Vehicles
Against a backdrop of a major slump in the CV market, Ashok Leyland grew its share in the domestic market in 2012-13 by 3%. Your Company sold 70,916 M&HCVs in the domestic market which was 13% less than the
previous year. This included 18,976 M&HCV buses and 51,940 M&HCV trucks, 10% less and 14% less respectively, compared to previous year.
Your Company grew market share across most segments and regions. One of the biggest gains was in the ICV goods segment with your Company increasing its sales volumes by nearly 55%, resulting in 5% gain in market share. It must be noted that ICV goods, in the long term, remains one of the fastest growing segments.
The financial crunch and slowdown of economy witnessed in Sri Lanka, as well as the overall global economic situation, impacted Ashok Leyland’s international volumes this year. Your Company exported 8,778 vehicles in 2012-13, 32% lower than the previous year. Sri Lanka, a key overseas market, fell by over two-thirds compared to last year. However, your Company grew in other regions across the world, notably in the Middle East, where it registered a growth of 15%.
The Power Solutions Business earned revenues of `403 Crores in the year 2012-13, achieving a 27% increase compared to the previous year.
Spare Parts business grew by a healthy 18% in 2012-13, with an all time high turnover of `1,004 Crores.
The Defence business suffered due to cut-backs and budget constraints of the government resulting in sales of 275 vehicles and 2,463 kits reflecting a drop of 26% and 17% respectively.
2002-03
9743
23517
2003-04 2004-05 2005-06 2006-07 2007-08 2008-09 2009-10 2010-11 2011-12 2012-13
Truck Bus
1102510422
13149
11674
17629
16026
16405
20425 21033
18976
3334637137
42064
65062
57778
3107040728
62673 60512 51940
Ashok Leyland Limited44
ANNExURE - D TO DIRECTORS’ REPORT MANAGEMENT DISCUSSION AND ANALYSIS REPORT
In FY 2012-13, your Company produced 112,163 vehicles (including 35,401 nos. of LCV ‘Dost’), a 9% growth compared to the previous year. Your Company significantly expanded its dealer network especially in areas where hitherto it had only limited coverage. Full service outlets grew to over 400 and, for the first time, the number of outlets in North exceeded the number in South.
To address the challenges faced in the domestic market, your Company laid considerable emphasis on product development and marketing efforts, targeted at the fastest growing segments and regions which resulted in promising growth in the last quarter of the fiscal. Your Company has lined up several ground-breaking products for core segments in the upcoming fiscal, in the ICV as well as MDV segments apart from the Neptune engine that will be launched on multi-axle haulage vehicles.
Substantial focus has been given to improving customer satisfaction levels with targeted initiatives across all hubs that included better organisation of the sales force, customer lifecycle management and enhancement of service levels.
Finally, your Company remains committed to build capabilities in the identified five focus areas wherein it chose to invest heavily – quality, people, brand, innovation and efficiency. Your Company has taken on challenging targets in each of these areas and has kicked off several initiatives to achieve them.
In summary, your Company has prepared well for the challenging economic scenario expected next year as well as increasing competition in the M&HCV space.
Light Commercial Vehicles Business
In 2012-13, your Company completed its first full year of participation in the fast-growing LCV segment in India. The first product, Ashok Leyland ‘Dost’, has contributed to transforming the SCV segment, by shifting the market emphasis from sub 2 tonnes to 2-3.5 tonnes GVW. In FY 2012-13, your Company sold close to 35,000 ‘Dost’ vehicles. Today, ‘Dost’ is the second largest selling product in its segment, with a pan India market share of 18.5%, despite being launched only in 11 States. In States where it is present, ‘Dost’ enjoys market leadership across most, and a market share of 25.6%. Your Company has also just started exporting ‘Dost’ to SAARC countries. To support the sale and service of LCVs, your Company has built a new LCV-oriented network of 100 touch points within 18 months.
In the upcoming financial year, your Company is planning to launch several variants of ‘Dost’ including a CNG version, the ‘Partner’ range of trucks and buses in the 4-6T segment, and the ‘Stile’ – a Multi-Functional Vehicle for commercial applications.
The Joint Venture Company, in which your Company is an equal partner with Nissan, is preparing for a new manufacturing facility near Chennai dedicated for LCV. Through these efforts, your Company would have a complete LCV product portfolio by the end of 2013-14 to meet a variety of evolving customer requirements.
Hinduja Leyland Finance Limited
The Non-banking Finance Company (NBFC), Hinduja Leyland Finance Limited (HLFL) promoted by Ashok Leyland commenced their operations in March 2010. HLFL now has operations in 602 locations with an employee strength of 2350 (that has increased from 1199 in the year 2011-12).
In 2012-13, HLFL continued to grow rapidly and made a disbursement of `2,100 Crores across a wide range of segments, including M&HCVs, LCVs and 3-wheelers.
Ashok Leyland - John Deere Construction Equipment Company Limited
This 50:50 joint venture with John Deere was started to tap into the growing demand for construction equipment in the country. 2012-13 was the first full year of operations for this company. Notwithstanding the economic downturn, this JV sold over 660 Backhoe Loaders crossing the 5 percent market share in the Southern region. The product range is expected to grow in this fiscal with the introduction of other variants of the Backhoe Loader and also a new Wheel Loader machine next year. All products embody the best combination of pedigree designs and high degree of localisation. The Company has also achieved ‘best-in-class’ service benchmarks, which is key to productivity and customer profitability.
Albonair GmbH
Albonair GmbH, Germany was established with a vision of being a complete solution provider for reducing automotive diesel emissions for Medium and Heavy Commercial Vehicles. In FY 2012-13, your Company made investments in Albonair to address the dual objectives of acquiring competence and cost-efficiency in the critical area of future emission technologies and to use it to generate business opportunities in advanced technology components in an increasingly strategic area.
Albonair has already obtained orders from large European firms in the face of stiff competition from established global players. It is expanding its reach to other large automotive players in the international market and is on its way to becoming a significant global automotive supplier.
Automotive Infotronics Limited
This Joint Venture Company (JVC) was formed in 2007 with equal equity holding by Continental AG and Ashok Leyland for designing, developing and adapting cost-efficient electric/electronics automotive products and customer specific applications specifically for India and India-like

ANNUAL REPORT 2012-2013 45
ANNExURE - D TO DIRECTORS’ REPORT MANAGEMENT DISCUSSION AND ANALYSIS REPORT
markets. The Company has developed various products like Instrument Clusters and Body Control units, Engine Control Panels for genset engines, on-board diagnostic and sensors for a variety of applications.
Ashley Alteams India Limited
Ashley Alteams India Limited (AAIL), manufacturer of High Pressure Die Castings, caters to the needs of customers in the Automotive, Telecom and Industrial spaces. AAIL has increased its supplies to existing customers like Ashok Leyland Limited, Delphi TVS, NSN, SFLAutolec and has attracted many new customers like Andrew, Poona Shims, etc. The Company has been facing challenges as a result of the downturn in the Telecom and Auto sectors, and seeks to re-orient its business to remain viable.
Avia Ashok Leyland Motors s.r.o
AVIA Ashok Leyland Motors s.r.o in Prague, has been producing trucks in the total weight class of 7.5 to 12 tonnes. In 2012, the company produced 1003 trucks for the markets of Europe, the United States, and Asia. The economy in Europe continues to be bearish and continues to put severe strain on Avia.
Defiance Technologies Limited
With a vision to be a world-class business solutions company, the focus of Defiance is to provide Engineering, Manufacturing and Enterprise solutions predominantly to the Manufacturing industry, by offering a comprehensive range of consulting, technology and outsourcing solutions and services to global customers. The company has gained a significant customer base in the Engineering, ERP and IT service spaces both in India and abroad. to enhance its competency, the company plans to further build on its focus areas such as SAP solutions, Automotive, Aerospace and Defence Engineering solutions, Enterprise Mobility solutions, Social Media solutions and Cloud-based Enterprise solutions.
C. Risk Management
Your Company had foreseen the drop in the demand of commercial vehicles both in India as well as overseas and had mitigated the risk to an extent by enhancing network coverage, especially in the Northern parts of the country and by developing alternate International Markets other than SAARC during the previous year. Your Company is also addressing this through a continued thrust on non-cyclical businesses such as Spares, Defence and Engines. Further, your Company’s entry into the relatively less volatile LCV business has further de-risked the business. The Company is also continually optimising fixed costs as well as working capital, to stay protected in case of a downturn.
In case of surge in demand, your Company has adequate installed capacity to manufacture the vehicles and engines required for the business. Further, your Company is
reviewing the production plan at regular intervals and has the flexibility to add modules of capacity (if required) at short cycle times to meet the demand.
To mitigate any risks due to material cost increase, your Company continues to work on material cost optimisation through deep dives, value engineering and alternate sourcing to sustain profitability to the extent feasible.
Legislation will continue to put pressure on improving the technology resulting in higher investment and product cost. To address this issue, your Company has proactively launched programs with its strategic partners to develop powertrains to meet upcoming emission norms such as Euro 5 and Euro 6. Your Company has also ensured that all its upcoming products meet all norms expected in the near future, such as the bus body code, safety norms for trucks, etc. Finally, your Company is continually developing and launching new and improved products to stay ahead of competition.
Your Company has an established Enterprise Risk Management function that engages with all the functions for risk assessment, ensures that the risk mitigation plans are in place and validates the risk mitigation status regularly. Action plans are incorporated into the corporate plans of your Company. The Audit Committee reviews the Risk Management processes and the actions to mitigate the key business risks are taken on a quarterly basis.
D. Internal Control Systems and their Adequacy:
Given the nature of business and size of operations, your Company’s internal control system has been designed to provide for:
• Accurate recording of transactions with internal checks and prompt reporting
• Adherence to applicable Accounting Standards and policies
• Compliance with applicable statutes, policies and management policies and procedures
• Effective use of resources and safeguarding of assets
The internal control system provides for well documented policies/guidelines, authorisations and approval procedures. Your Company, through its own Internal Audit Department, carries out periodic audits at all locations and functions based on the plan approved by the Audit Committee and brings out any deviation to internal control procedures. The observations arising out of the audit are periodically reviewed and compliance ensured. The summary of the Internal Audit observations and status of implementation are submitted to the Audit Committee of the Board of Directors. The status of implementation of the recommendations is reviewed by the Committee on a regular basis and concerns, if any, are reported to the Board.

Ashok Leyland Limited46
ANNExURE - D TO DIRECTORS’ REPORT MANAGEMENT DISCUSSION AND ANALYSIS REPORT
Information Security and IPR protection initiatives
Ashok Leyland, among the first auto majors in India to be certified under BS7799 in 2005, strategically decided to expand the scope in a modular manner to critical areas, particularly handling IPR and / or sensitive information. Your Company migrated to ISO 27001 during 2006 and expanded the scope to Business Continuity & Disaster Recovery site in 2010. In 2012, your Company expanded the scope of certification to cover the entire corporate office building at Guindy, regional offices at Chennai & Bangalore and the SAP Center of Excellence at Nandanam. The ISO 27001 certificate is valid till June 2014 subject to yearly surveillance audit. Your Company is planning to expand the scope of certification to other critical locations in a phased manner.
E. Financial Review
Summary of Statement of Profit and Loss is given below.
` Crores
2012-13 2011-12 Inc/(Dec) %
INCOME
Sales (net of excise duty)
12,481.20 12,904.33 (3.3)
Other income 62.35 40.35 54.5
Total 12,543.55 12,944.68 (3.1)
EXPENDITURE
Material Costs 9,123.13 9,461.84 (3.6)
Employee benefits expense
1,075.51 1,020.39 5.4
Other expenses 1,406.09 1,165.99 20.6
Depreciation and amortization expense
380.78 352.81 7.9
Finance costs 376.89 255.25 47.7
Total 12,362.40 12,256.30 0.9
Profit before exceptional items
181.15 688.38 (73.7)
Exceptional items 289.56 1.60 -
Profit before tax 470.71 689.98 (31.8)
Tax expense:
Current tax - 77.52 -
Deferred tax 37.00 46.48 (20.4)
Profit after tax 433.71 565.98 (23.4)
Basic Earnings per Share (`)
1.63 2.13 (23.4)
Revenues:
Your Company’s revenues came through the following streams of business activities:
• Vehicles: Income from vehicles was at `9,503 Crores, a drop of 13% over the previous year level of `10,961 Crores. The decrease in revenue was attributable mainly to a 16% drop in vehicle sale volumes in 2012-13. Considering the increase in cost of inputs and operations, Company revised the prices on three occasions to register an increase of `47,000 per vehicle.
• Engines: Revenue from engines increased to `403 Crores, a 27% increase over the previous year level of `318 Crores, reflecting increase in sale volumes.
• Spare Parts and others: Income from spare parts including sale of kits to Vehicle Factory, Jabalpur, increased to `1,244 Crores, an increase of 6% over the previous year level of `1,178 Crores.
• Other operating income: Other operating income increased to `278 Crores against `201 Crores in the previous year, registering a growth of 38%. This is due to increase in contract manufacturing revenue from `26 Crores the previous year to `118 Crores in current year reflecting a growth of 3.5 times over previous year.
• Revenue from services grew from `83 Crores in previous year to 138 Crores in the current year mainly due to increase in revenue from annual maintenance contracts.
• Revenue from trading operations also went up significantly during the year to `915 Crores from `163 Crores in the previous year primarily due to the sale of ‘Dost’ vehicles.
Costs:
• Material Cost: There were material cost increases experienced in the first two quarters. However, the cost pressures subsided in the second half of FY 12-13, leading to marginal increase of about 0.2% in overall material costs for full year. Your Company did take pricing actions at appropriate times to offset the material cost increases.
• Staff Costs: Employee expenses went up by 5% in 2012-13 primarily due to increase in executive strength.
• Other expenses were higher by 20% primarily due to higher incurrence in power and fuel consumption to cope with higher power cuts / tariff increases,

ANNUAL REPORT 2012-2013 47
ANNExURE - D TO DIRECTORS’ REPORT MANAGEMENT DISCUSSION AND ANALYSIS REPORT
publicity spends and R&D expenditure.
• Depreciation for the year increased to `381 Crores compared to `353 Crores in the previous year primarily due to full year impact of last year additions and higher level of capitalisation in the current year, mainly at Pantnagar and IT infrastructure.
• Finance costs increased to `377 Crores during the year from `255 Crores, in the previous year. to part fund the capital expenditure and investment requirements, your Company borrowed `1,150 Crores (NCD `600 Crores and balance ECB loans) during the year. Interest cost on the fresh loans together with the full year impact of the loans availed by the end of 2011-12 resulted in higher finance charges. In addition, significant increase in working capital during April 2012 to March 2013 due to an uncertain business environment, led to higher level of short term borrowing which contributed to higher interest costs. Your Company’s Treasury Department is active in the money markets to manage the day-to-day investible surplus funds and also to raise short term debts as and when required.
Capital Employed
Total capital employed by your Company increased by 10% from `11,916 Crores to `13,097 Crores, mainly due to investments in joint ventures and facility creation.
Total shareholders’ funds as at March 31, 2013 stood at `4,455 Crores of which equity capital accounted for `266 Crores, compared to the previous year’s total shareholders’ funds of `4,212 Crores.
Summary of Balance Sheet is given below. ` Cr.
31.03.2013 31.03.2012 Inc/(Dec) %
SOURCES OF FUNDS
Shareholders’ Funds 4,455.10 4,212.33 5.8
Non - current liabilities
3,345.50 2,860.28 17.0
Current liabilities 5,296.10 4,843.14 9.4
Total 13,096.70 11,915.75 9.9
APPLICATION OF FUNDS
Fixed Assets 5,970.81 5,461.72 9.3
Investments 2,337.63 1,534.48 52.3
Loans & other Non Current Assets
491.73 615.66 (20.1)
Current assets 4,296.53 4,303.89 (0.2)
Total 13,096.70 11,915.75 9.9
Capital Expenditure and Investments
During the year, your Company incurred `725 Crores towards capital expenditure, mainly towards development of additional infrastructure and other facilities at Pantnagar for setting up integrated manufacturing facilities. Your Company also incurred capital expenditure relating to the manufacturing facility for LCV at Hosur under joint venture with Nissan Motors, Japan. Your Company also incurred capital expenditure towards implementing a new ERP system. The rest of the capital expenditure was towards capacity optimisation programmes in existing plants.
During the year, your Company invested `80 Crores in AL-Nissan JV and `50 Crores in AL-John Deere JV. Your Company invested `90 Crores in Hinduja Leyland Finance Ltd. Further your Company invested 300 Crores in Hinduja Foundries Ltd. and another `187 Crores in Hinduja Energy (India) Ltd. In all, your Company invested `862 Crores by way of investment in Associate / Group / Joint Venture Companies.
Current Assets as at March 31, 2013 was `4,297 Crores compares with previous year level of `4,304 Crores. Short term loans and advances increased by `164 Crores. Inventories decreased to `1,896 Crores as at March 31, 2013 compared to `2,231 Crores as at March 31, 2012 mainly due to decrease in finished vehicle inventory. Trade Receivables increased to `1,419 Crores as at 31st March 2013 from `1,231 Crores as on 31st March 2012 mainly due to higher quantum of vehicles sold to State Transport Undertakings in March 2013.
Liquidity
Your Company continued with the ‘Cash and Carry’ system of sales during the year which has been effective since May 2009. This has enabled your Company to better manage the increased liquidity requirements. During the year, your Company raised ECB loan of USD 110 Mn and placed NCDs to the tune of `600 Crores which are secured by a first pari passu charge on select immovable properties and movable assets. These funds were utilised for capital expenditure and investments described earlier. Your Company manages its liquidity through rigorous weekly monitoring of cash flows.
Profitability
Your Company’s profitability remained subdued due to lower volumes. The general economic slowdown adversely impacted the volumes. In spite of lower volumes, your Company produced 28,870 vehicles from Pantnagar, achieving proportionately increased benefits on account of exemptions from levy of excise duty and income tax.Your Company managed to contain material cost at about the previous year levels and granting increases only for unavoidable reasons like power tariff increases, etc.
Presently, your Company’s debts have been rated by ICRA.

Ashok Leyland Limited48
ANNExURE - D TO DIRECTORS’ REPORT MANAGEMENT DISCUSSION AND ANALYSIS REPORT
The rating agency has reaffirmed the Company’s ratings with a negative outlook
Agency Long Term Short Term Loan
ICRA AA- (negative outlook) A1+ (reaffirmed)
During the year, your Company has serviced all its debt obligations on time.
Results of Operations
Your Company generated an after tax profits from operations of `777 Crores. After meeting the working capital requirements, your Company registered a net cash inflow of `728 Crores from its operations.
Cash outflow for acquisition of assets and investing activities for 2012-13 amounted to `1,164 Crores as against outflow of `1,058 Crores in 2011-12. Fresh loans for `1,150 Crores were raised to meet capital expenditure and investment activities.
Profit before tax and exceptional items stood at `181 Crores. Your Company sold shares of ICICI Bank Ltd., IndusInd Bank Ltd. and Hinduja Leyland Finance Ltd. during the year and booked long term capital gains of `335 Crores which is recognised as an exceptional item in the statement of Profit and Loss Account.
Your Company also provided for impairment in carrying value of investments in Ashley Alteams (`28 Crores) and Automotive Infotronics (` 11 Crores).
After providing for taxes at `37 Crores of deferred tax, Profit after tax for the current year stood at `434 Crores. The earning per share decreased by 23% from `2.13 in 2011-12 to `1.63 in the year under review.
Dividend
The Directors have recommended 60% dividend for the year 2012-13, equivalent to Re.0.60 per share.
Cash flow statement` Crores
31.03.2013 31.03.2012
Profit from Operations after tax 776.82 1,125.48
(Inc) / Dec in Net working capital (48.52) 21.83
Net cash flow from operating activities 728.30 1,147.31
Payment for acquisition of assets - net (643.84) (690.63)
Cash outflow for investing activities (520.48) (366.89)
Cash flow from financing activities 416.98 (241.12)
Net cash inflow / (outflow) (19.04) (151.33)
The Year Ahead
The first half is expected to remain sluggish for the commercial vehicle industry. This is more due to protracted slowdown in India’s mining industry and sluggish industrial output growth. However, the recent initiatives taken by the government, budgetary announcements to spur growth as well as Government’s determination to pursue the reforms agenda announced earlier may revive the economy and demand for commercial vehicles in the second half of the financial year.
In addition, increase in freight rate announced in the Railway Budget on bulk movement such as cement is expected to shift a portion of the short haul segment towards commercial vehicles.
Total industry volume is therefore estimated to grow marginally over previous year. While truck sales will grow, bus sales will remain flat as JnNURM funding is primarily expected to substitute traditional State Government purchases with higher end buses rather than create incremental demand. Within buses, ICV segment is expected to grow while medium duty vehicles will contract marginally.
‘Dost’ is expected to continue its strong run in 2013-14 as well. New products / variants are lined up in the LCV segment.
Competitive intensity is likely to be more pronounced across segments. Despite the increase in competitive intensity, Ashok Leyland will target for increased market share supported by introduction of new products in second half of 2012-13 which are widely accepted in the market.
Your Company will continue to focus on increasing the production from Pantnagar plant to avail of the concessions in excise duty and income tax, which will favourably impact the bottom line.

ANNUAL REPORT 2012-2013 49
ANNExURE - E TO DIRECTORS’ REPORTDIReCtoRS’ ReSpoNSIBILIty StAteMeNt AS PER SECTION 217(2AA) OF THE COMPANIES ACT, 1956Responsibility in relation to financial statements
The financial statements have been prepared in conformity, in all material respects, with the Generally Accepted Accounting principles in India and the Accounting Standards prescribed by the Institute of Chartered Accountants of India in a consistent manner and supported by reasonable and prudent judgments and estimates. The Directors believe that the financial statements reflect true and fair view of the financial position as at March 31, 2013 and of the results of the operations for the year ended March 31, 2013.
The financial statements have been audited by M/s M.S. Krishnaswami & Rajan and M/s Deloitte Haskins & Sells in accordance with generally accepted auditing standards, which include an assessment of the systems of internal controls and tests of transactions to the extent considered necessary by them to support their opinion.
Going Concern
In the opinion of the Directors, the Company will be in a position to carry on its existing commercial vehicles/ engines business and accordingly it is considered appropriate to prepare the financial statements on a ‘going concern’ basis.
Maintenance of accounting records, internal controls and compliances
Your Company has taken proper and sufficient care for the maintenance of adequate accounting records as required by various Statutes.
Directors have overall responsibility for the Company’s internal control system, which is designed to provide a reasonable assurance for safeguarding of assets, reliability of financial records and for preventing and detecting fraud and other irregularities.
The system of internal control is monitored by the internal audit function, which encompasses the examination and evaluation of the adequacy and effectiveness of the system of internal control and quality of performance in carrying out assigned responsibilities. Internal Audit Department interacts with all levels of management, the Statutory Auditors, and reports significant issues to the Audit Committee of the Board.
The Audit Committee supervises the financial reporting process through review of accounting and reporting practices, financial and accounting controls and financial statements. The Audit Committee periodically interacts with the Internal Audit team, and the Statutory Auditors to ensure quality and veracity of Company’s accounts.
The Statutory Auditors, the Internal Auditors and the Audit Committee have full and free access to all the information and records as considered necessary to carry out their responsibilities. All the issues raised by them have been suitably acted upon and followed up.
Proper systems are in place to ensure compliance of all laws applicable to the Company.
Ashok Leyland Limited50
ANNExURE - F TO DIRECTORS’ REPORTCERTIFICATION BY MANAGING DIRECTOR AND ChIeF FINANCIAL oFFICeR to the BoARDWe, Vinod K Dasari, Managing Director and K. Sridharan, Chief Financial Officer of Ashok Leyland Limited, certify that:
1. We have reviewed the financial statements for the year and that to the best of our knowledge and belief:
a) these statements do not contain any materially untrue statement or omit any material fact or contain statements that might be misleading;
b) these statements present a true and fair view of the state of affairs of the Company and of the results of operations and cash flows. The financial statements have been prepared in conformity, in all material respects, with the existing Generally Accepted Accounting Principles including Accounting Standards, applicable laws and regulations.
2. There are, to the best of our knowledge and belief, no transactions entered into by the Company during the year which are fraudulent, illegal or violative of the Company’s Code of Conduct.
3. We accept overall responsibility for establishing and monitoring the Company’s internal control system for
financial reporting and evaluating its effectiveness. The Internal Audit function monitors the internal control system for financial reporting, which encompasses the examination and evaluation of the adequacy and effectiveness. Internal Audit works with all levels of management and Statutory Auditors, and reports significant issues to the Audit Committee of the Board. The Statutory Auditors and Audit Committee are appraised of any corrective action taken or proposed to be taken with regard to significant deficiencies and material weaknesses.
4. We have indicated to the Auditors and to the Audit Committee:
a) significant changes in internal control over financial reporting during the year;
b) significant changes in accounting policies during the year;
c) instances of significant fraud of which we have become aware of and which involve management or other employees who have significant role in the Company’s internal control system over financial reporting. However, there was no such instance.
May 10, 2013 Vinod K Dasari K. Sridharan
Chennai Managing Director Chief Financial Officer

ANNUAL REPORT 2012-2013 51
INDEPENDENT AUDITORS’ REPORT
TO THE MEMBERS OFASHOK LEYLAND LIMITEDReport on the Financial StatementsWe have audited the accompanying financial statements of Ashok Leyland Limited (“the Company”), which comprise the Balance Sheet as at March 31, 2013, the Statement of Profit and Loss and the Cash Flow Statement for the year then ended and a summary of significant accounting policies and other explanatory information.Management’s Responsibility for the Financial StatementsThe Management is responsible for the preparation of these financial statements that give a true and fair view of the financial position, financial performance and cash flows of the Company in accordance with the Accounting Standards referred to in Section 211(3C) of the Companies Act, 1956 (“the Act”) and in accordance with the accounting principles generally accepted in India. This responsibility includes the design, implementation and maintenance of internal control relevant to the preparation and presentation of the financial statements that give a true and fair view and are free from material misstatements, whether due to fraud or error.Auditors’ ResponsibilityOur responsibility is to express an opinion on these financial statements based on our audit. We conducted our audit in accordance with the Standards on Auditing issued by the Institute of Chartered Accountants of India. Those Standards require that we comply with the ethical requirements and plan and perform the audit to obtain reasonable assurance about whether the financial statements are free from material misstatement.An audit involves performing procedures to obtain audit evidence about the amounts and the disclosures in the financial statements. The procedures selected depend on the auditor’s judgment, including the assessment of the risks of material misstatement of the financial statements, whether due to fraud or error. In making those risk assessments, the auditor considers the internal control relevant to the Company’s preparation and fair presentation of the financial statements in order to design audit procedures that are appropriate in the circumstances. An audit also includes evaluating the appropriateness of accounting policies used and the reasonableness of the accounting estimates made by Management, as well as evaluating the overall presentation of the financial statements. We believe that the audit evidence we have obtained is sufficient and appropriate to provide a basis for our audit opinion.
OpinionIn our opinion and to the best of our information and according to the explanations given to us, the financial statements give the information required by the Act in the manner so required and give a true and fair view in conformity with the accounting principles generally accepted in India:(a) in the case of the Balance Sheet, of the state of
affairs of the Company as at March 31, 2013;(b) in the case of the Statement of Profit and Loss, of
the profit of the Company for the year ended on that date; and
(c) in the case of the Cash Flow Statement, of the cash flows of the Company for the year ended on that date.
Report on Other Legal and Regulatory Requirements1. As required by the Companies (Auditor’s Report)
Order, 2003 (“the Order”) issued by the Central Government of India in terms of Section 227(4A) of the Act, we give in the Annexure a statement on the matters specified in paragraphs 4 and 5 of the Order.
2. As required by Section 227(3) of the Act, we report that:
(a) we have obtained all the information and explanations which to the best of our knowledge and belief were necessary for the purposes of our audit;
(b) in our opinion, proper books of account as required by law have been kept by the Company so far as appears from our examination of those books;
(c) the Balance Sheet, Statement of Profit and Loss, and Cash Flow Statement dealt with by this Report are in agreement with the books of account;
(d) in our opinion, the Balance Sheet, Statement of Profit and Loss and Cash Flow Statement comply with the Accounting Standards referred to in Section 211(3C) of the Act.
(e) on the basis of written representations received from the Directors as on March 31, 2013 and taken on record by the Board of Directors, none of the Directors is disqualified as on March 31, 2013 from being appointed as a Director in terms of Section 274(1)(g) of the Act.
For M.S. KRISHNASwAMI & RAjANChartered AccountantsRegistration No. 01554S
For DELOITTE HASKINS & SELLSChartered AccountantsRegistration No. 117366W
M.S. MuRALIPartnerMembership No. 26453
A. SIDDHARTHPartnerMembership No. 31467
May 10, 2013Chennai
Ashok Leyland Limited52
On the basis of such checks as we considered appropriate and according to the information and explanations given to us during the course of our audit, we report that:
1. (i) the Company is maintaining proper records showing full particulars including quantitative details and situation of fixed assets.
(ii) the fixed assets are being physically verified under a phased programme of verification, which, in our opinion, is reasonable having regard to the nature and value of its assets. However, no material discrepancies have been noticed during the year on such verification.
(iii) the Company has not disposed off substantial part of its fixed assets during the year.
2. (i) inventories have been physically verified during the year by the management at reasonable intervals.
(ii) in our opinion, the procedures of physical verification of the inventory followed by the management are reasonable and adequate in relation to the size of the Company and the nature of its business.
(iii) in our opinion, the Company is generally maintaining proper records of its inventories and no material discrepancies were noticed on physical verification.
3. on the basis of our examination of the books of account, the Company has neither granted nor taken any loans, secured or unsecured, to / from companies, firms or other parties covered in the register maintained under section 301 of the Act.
4. in our opinion, there is generally an adequate internal control system commensurate with the size of the Company and the nature of its business, for the purchase of inventories and fixed assets and for sale of goods and services. Further, on the basis of our examination of the books and records of the Company, we have neither come across nor have been informed of any continuing failure to correct major weaknesses in the aforesaid internal control system.
5. a) based on the audit procedures applied by us, the particulars of contracts or arrangements referred to in Section 301 of the Act that needed to be entered into the register, maintained under the said section have been so entered.
ANNEXURE TO INDEPENDENT AUDITORS’ REPORTReferred to in paragraph 1 under ‘Report on Other Legal and Regulatory Requirements’ Section of our Report of even date
b) where each of such transactions is in excess of Rs 5 lakhs in respect of any party, the transactions have been made at prices which are prima facie reasonable having regard to the prevailing market prices at the relevant time.
6. the Company has not accepted any deposits from the public to which the directives issued by the Reserve Bank of India and the provisions of section 58A and 58AA or any other relevant provisions of the Act and the Companies (Acceptance of Deposit) Rules, 1975 apply.
7. in our opinion, the Company has an internal audit system commensurate with its size and nature of its business.
8. We have broadly reviewed the cost records maintained by the Company pursuant to the Companies (Cost Accounting Records) Rules, 2011 prescribed by the Central Government of India under Section 209(1)(d) of the Companies Act, 1956 and are of the opinion that prima facie the prescribed accounts and cost records have been made and maintained. We have, however, not made a detailed examination of the cost records with a view to determine whether they are accurate or complete.
9. (i) the Company is generally regular in depositing undisputed statutory dues including provident fund, investor education and protection fund, employees’ state insurance, income tax, sales tax, wealth tax, service tax, customs duty, excise duty, cess and other material statutory dues as applicable with the appropriate authorities during the year.
(ii) no undisputed amounts payable in respect of statutory dues were outstanding as at March 31, 2013 for a period of more than six months from the date they became payable.
(iii) there are no dues of income tax, wealth-tax, and customs duty which have not been deposited on account of any dispute. Details of dues towards sales tax, excise duty, service tax and cess that have not been deposited on account of dispute are as stated below:

ANNUAL REPORT 2012-2013 53
Rs in lakhs
Nature of dues
Dues Period to which the amount relates
Forum where the dispute is pending
Amount stayed not
included in dues
Income Tax - Assessment years 2005-06, 2006-07 and 2008-09
Commissioner of Income Tax (Appeals)
7,880.91
Sales Tax 8,958.24 Various periods from 1993 – 2012
Appellate Deputy / Additional Commissioner
3,590.44
35.84 Various periods from 1987 – 2007
Tribunal 157.84
- Various periods from 1986 - 2001
High Court 49.09
Excise Duty and cess thereon
31.87 Various periods from 2008 - 2011
Commissioner of Central Excise (Appeals)
-
1,415.09 Tribunal (CESTAT)
4.88
Service tax and cess thereon
- Various periods from 2006 - 2009
Tribunal (CESTAT)
230.31
10. the Company does not have any accumulated losses as at March 31, 2013 and has not incurred any cash losses in the financial year ended on that date or in the immediately preceding financial year.
11. in our opinion, the Company has not defaulted in repayment of dues to any financial institution, bank or debenture holders during the year.
12. the Company has maintained adequate documents and records where it has granted loans and advances on the basis of security by way of pledge of shares, debentures and other securities.
13. the Company is not a chit fund or a Nidhi / mutual benefit fund / society. Accordingly, the provisions of clause 4(xiii) of the CARO are not applicable to the Company.
14. the Company is not dealing or trading in shares, securities, debentures and other investments. Accordingly the provisions of clause 4 (xiv) of the CARO are not applicable to the Company.
15. the terms and conditions of guarantees given by the Company, for loans taken by others from banks or financial institutions, are not prima facie prejudicial to the interest of the Company.
16. the term loans availed by the Company were prima facie, applied for the purpose for which they were obtained.
17. on an overall examination of the financial statements of the Company, funds raised on short-term basis have, prima facie, not been used for long-term investment.
18. the Company has not made any preferential allotment of shares during the year.
19. the Company has created securities / charges in respect of debentures issued.
20. the Company has not raised any money by public issues during the year.
21. based on the audit procedures performed and considering the size and nature of the Company’s operations, no fraud of material significance on or by the Company has been noticed or reported during the year.
For M.S. KRISHNASwAMI & RAjANChartered AccountantsRegistration No. 01554S
For DELOITTE HASKINS & SELLSChartered AccountantsRegistration No. 117366W
M.S. MuRALIPartnerMembership No. 26453
A. SIDDHARTHPartnerMembership No. 31467
May 10, 2013Chennai
ANNEXURE TO INDEPENDENT AUDITORS’ REPORTReferred to in paragraph 1 under ‘Report on Other Legal and Regulatory Requirements’ Section of our Report of even date

Ashok Leyland Limited54
BALANCE SHEET AS AT MARCH 31, 2013Particulars As at March 31, 2013 As at March 31, 2012
Note No. ` Lakhs ` Lakhs ` LakhsEQuITY AND LIABILITIESShareholders’ funds Share capital 1.1 26,606.80 26,606.80 Reserves and surplus 1.2 4,18,903.66 3,94,625.82
4,45,510.46 4,21,232.62Non-current liabilities Long-term borrowings 1.3 2,73,784.18 2,29,335.11 Deferred tax liabilities (Net) 1.4 52,736.69 49,036.69 Other long-term liabilities 1.5 177.85 - Long-term provisions 1.6 7,851.26 7,656.30
3,34,549.98 2,86,028.10Current liabilities Short-term borrowings 1.7 76,698.25 10,175.00 Trade payables 1.8 2,48,536.85 2,57,096.72 Other current liabilities 1.9 1,73,506.34 1,75,004.83 Short-term provisions 1.10 30,868.33 42,037.44
5,29,609.77 4,84,313.99TOTAL 13,09,670.21 11,91,574.71
ASSETSNon-current assets Fixed assets Tangible assets 1.11 4,91,843.42 4,56,571.25 Intangible assets 1.12 36,344.86 34,778.16 Capital work-in-progress 1.11 56,261.83 43,519.06 Intangible assets under development 1.12 12,630.91 11,303.03
5,97,081.02 5,46,171.50
Non-current investments 1.13 2,33,763.19 1,53,447.89 Long-term loans and advances 1.14 47,969.55 60,823.95 Other non-current assets 1.15 1,203.21 742.74
8,80,016.97 7,61,186.08Current assets Inventories 1.16 1,89,602.08 2,23,062.52 Trade receivables 1.17 1,41,941.13 1,23,076.42 Cash and bank balances 1.18 1,394.24 3,255.58 Short-term loans and advances 1.19 89,098.04 72,657.43 Other current assets 1.20 7,617.75 8,336.68
4,29,653.24 4,30,388.63TOTAL 13,09,670.21 11,91,574.71
Statement on Significant Accounting Policies and Notes to theFinancial Statements are an integral part of this Balance Sheet.
For and on behalf of the BoardK. SRIDHARANChief Financial Officer
S VENKATASuBRAMANIANCompany Secretary
DHEERAj G HINDujAChairman
VINOD K DASARIManaging Director
This is the Balance Sheet referred to in our report of even date.
For M.S.KRISHNASwAMI & RAjANChartered Accountants
For DELOITTE HASKINS & SELLSChartered Accountants
M.S. MuRALIPartner
A.SIDDHARTHPartner
May 10, 2013Chennai

ANNUAL REPORT 2012-2013 55
Particulars Year Ended March 31, 2013 Year Ended March 31, 2012
Note No. ` Lakhs ` Lakhs ` Lakhs
Income
Revenue from operations 2.1 13,29,855.89 13,72,080.50
Less: Excise Duty 81,735.89 81,647.85
Revenue from operations (Net) 12,48,120.00 12,90,432.65
Other income 2.2 6,235.15 4,035.03
Total Revenue 12,54,355.15 12,94,467.68
Expenses
Cost of materials consumed 2.3 7,53,941.64 9,12,148.33
Purchases of Stock-in-Trade - Traded goods 2.4 1,31,173.94 50,737.37
Changes in inventories of finished goods, work-in-progress and Stock-in-Trade
2.527,197.69 (16,701.30)
9,12,313.27 9,46,184.40
Employee benefits expense 2.6 1,07,551.34 1,02,039.42
Finance costs 2.7 37,688.57 25,525.32
Depreciation and amortization expense 2.8 38,078.35 35,281.32
Other expenses 2.9 1,40,608.56 1,16,599.34
Total Expenses 12,36,240.09 12,25,629.80
Profit before exceptional items and tax 18,115.06 68,837.88
Exceptional items 2.10 28,955.61 159.78
Profit before tax 47,070.67 68,997.66
Tax expense:
Current tax (Refer Note 3.13 to the Financial Statements)
- 7,752.00
Deferred tax 3,700.00 4,648.00
3,700.00 12,400.00
Profit for the period from continuing operations 43,370.67 56,597.66
Earnings per share (Face value ` 1) - Basic and Diluted (in `) [Refer Note 3.3 to the Financial Statements]
1.63 2.13
Statement on Significant Accounting Policies and Notes to the FinancialStatements are an integral part of this Statement of Profit and Loss.
STATEMENT OF PROFIT AND LOSS FOR THE YEAR ENDEDMARCH 31, 2013
For and on behalf of the BoardK. SRIDHARANChief Financial Officer
S VENKATASuBRAMANIANCompany Secretary
DHEERAj G HINDujAChairman
VINOD K DASARIManaging Director
This is the Statement of Profit and Loss referred to in our Report of even date.
For M.S.KRISHNASwAMI & RAjANChartered Accountants
For DELOITTE HASKINS & SELLSChartered Accountants
M.S. MuRALIPartner
A.SIDDHARTHPartner
May 10, 2013Chennai
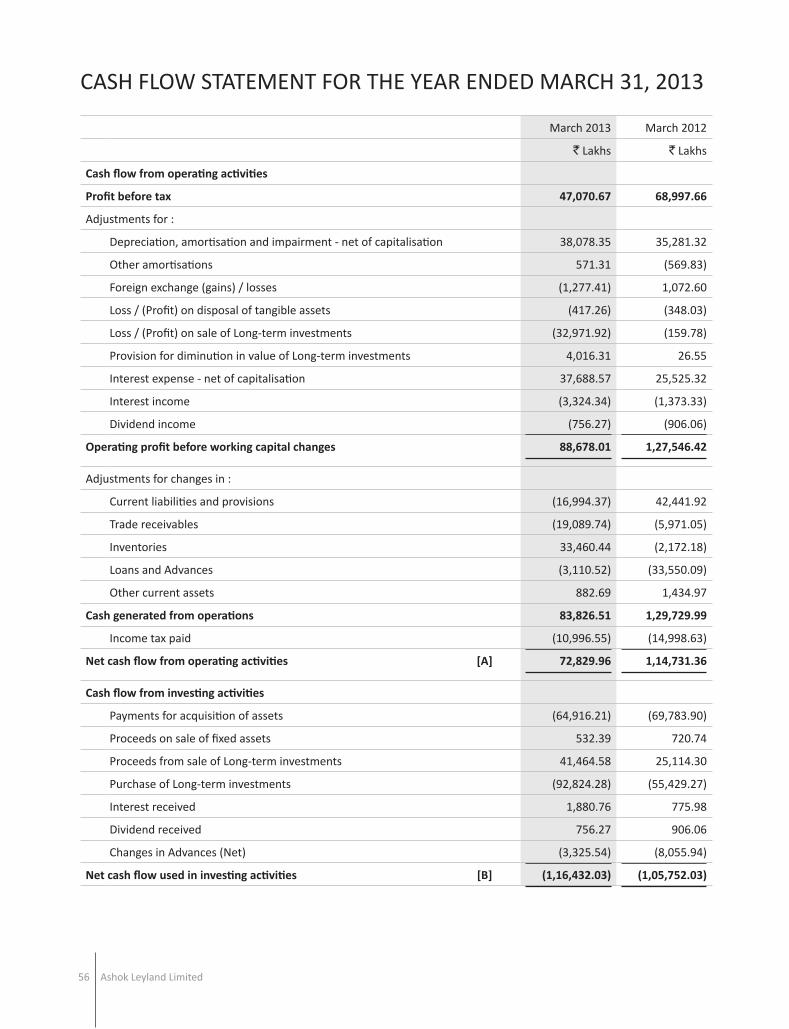
Ashok Leyland Limited56
CASH FLOW STATEMENT FOR THE YEAR ENDED MARCH 31, 2013
March 2013 March 2012
` Lakhs ` Lakhs
Cash flow from operating activities
Profit before tax 47,070.67 68,997.66
Adjustments for :
Depreciation, amortisation and impairment - net of capitalisation 38,078.35 35,281.32
Other amortisations 571.31 (569.83)
Foreign exchange (gains) / losses (1,277.41) 1,072.60
Loss / (Profit) on disposal of tangible assets (417.26) (348.03)
Loss / (Profit) on sale of Long-term investments (32,971.92) (159.78)
Provision for diminution in value of Long-term investments 4,016.31 26.55
Interest expense - net of capitalisation 37,688.57 25,525.32
Interest income (3,324.34) (1,373.33)
Dividend income (756.27) (906.06)
Operating profit before working capital changes 88,678.01 1,27,546.42
Adjustments for changes in :
Current liabilities and provisions (16,994.37) 42,441.92
Trade receivables (19,089.74) (5,971.05)
Inventories 33,460.44 (2,172.18)
Loans and Advances (3,110.52) (33,550.09)
Other current assets 882.69 1,434.97
Cash generated from operations 83,826.51 1,29,729.99
Income tax paid (10,996.55) (14,998.63)
Net cash flow from operating activities [A] 72,829.96 1,14,731.36
Cash flow from investing activities
Payments for acquisition of assets (64,916.21) (69,783.90)
Proceeds on sale of fixed assets 532.39 720.74
Proceeds from sale of Long-term investments 41,464.58 25,114.30
Purchase of Long-term investments (92,824.28) (55,429.27)
Interest received 1,880.76 775.98
Dividend received 756.27 906.06
Changes in Advances (Net) (3,325.54) (8,055.94)
Net cash flow used in investing activities [B] (1,16,432.03) (1,05,752.03)

ANNUAL REPORT 2012-2013 57
CASH FLOW STATEMENT FOR THE YEAR ENDED MARCH 31, 2013
March 2013 March 2012
` Lakhs ` Lakhs
Cash flow from financing activities
Proceeds from long-term borrowings 1,17,138.48 57,731.54
Repayments of long-term borrowings (73,470.92) (34,878.46)
Proceeds from short-term borrowings 10,26,932.92 1,17,832.98
Repayments of short-term borrowings (9,60,561.17) (1,08,291.85)
Debenture / Loan raising expenses paid (1,135.29) (896.44)
Interest paid - Net (36,282.97) (24,686.96)
Dividend paid and tax thereon (30,923.05) (30,923.05)
Net cash flow from financing activities [C] 41,698.00 (24,112.24)
Net cash inflow / (outflow) [A+B+C] (1,904.07) (15,132.91)
Opening cash and cash equivalents 2,746.31 17,537.27
Exchange fluctuation on foreign currency bank balances (61.15) 341.95
Closing cash and cash equivalents 781.09 2,746.31
For and on behalf of the BoardK. SRIDHARANChief Financial Officer
S VENKATASuBRAMANIANCompany Secretary
DHEERAj G HINDujAChairman
VINOD K DASARIManaging Director
This is the Cash Flow Statement referred to in our report of even date.
For M.S.KRISHNASwAMI & RAjANChartered Accountants
For DELOITTE HASKINS & SELLSChartered Accountants
M.S. MuRALIPartner
A.SIDDHARTHPartner
May 10, 2013Chennai

Ashok Leyland Limited58
STATEMENT ON SIGNIFICANT ACCOuNTING POLICIES FORMINGPART OF THE FINANCIAL STATEMENTS FOR THE YEAR ENDEDMARCH 31, 20131. Accounting convention 1.1 Financial statements are prepared in accordance with the generally accepted accounting principles in India
including accounting standards referred to in Section 211 (3C) of the Companies Act 1956, under historical cost convention except so far as they relate to revaluation of certain land and buildings.
1.2 All assets and liabilities have been classified as current or non-current as per the Company’s normal operating cycle and other criteria set out in the revised schedule VI to the Companies Act, 1956. Based on the nature of products and the time between the acquisition of assets for processing and their realisation in cash and cash equivalents, the Company has determined its operating cycle as twelve months for the purpose of current - non current classification of assets and liabilities.
1.3 use of estimates The preparation of the financial statements, in conformity with the generally accepted accounting principles,
requires management to make estimates and assumptions that affect the reported amounts of assets and liabilities on the date of the financial statements, disclosure of contingent liabilities and reported amounts of revenues and expenses for the year. Estimates are based on historical experience, where applicable and other assumptions that management believes are reasonable under the circumstances. Actual results could vary from these estimates and any such differences are dealt with in the period in which the results are known / materialize.
2. Tangible and intangible fixed assets and depreciation / amortisation 2.1 Cost of all civil works (including electrification and fittings) is capitalised with the exception of alterations and
modifications of a capital nature to existing structures where the cost of such alteration or modification is ` 100,000 and below. Other fixed assets, including intangible assets and assets given on lease, where the cost exceeds ` 10,000 and the estimated useful life is two years or more, is capitalised. Cost of initial spares and tools is capitalised along with the respective assets. Cost of fixed assets is net of eligible credits under CENVAT / VAT Scheme. Expenditure directly related and incidental to construction / development and borrowing costs in para 3 below are capitalised upto the date the assets are ready for their intended use. Exchange differences are capitalised to the extent dealt with in para 6.2 below.
2.2 Assets are depreciated / amortised, as below, on straight line basis: a) Leasehold land over the period of lease; b) Leasehold land and buildings subject to revaluation, is calculated on the respective revalued amounts,
over the balance useful life as determined by the valuers in the case of buildings and as per (a) above in the case of land;
c) Buildings, plant and machinery (except assets subject to impairment) and other assets, including assets given on lease and assets in leased premises / customer premises, over their estimated useful lives or lives derived from the rates prescribed in Schedule XIV to the Companies Act, 1956, whichever is lower;
d) Assets subject to impairment, on the asset’s revised carrying amount, over its remaining useful life. e) Intangible assets are amortized over their estimated useful life. 2.3 Depreciation / amortisation is provided on a pro-rata basis from the month the assets are put to use during the
financial year. In respect of assets sold or disposed off during the year, depreciation / amortisation is provided upto the month of sale or disposal of the assets.
3. Borrowing costs Borrowing costs attributable to the acquisition, construction or production of qualifying assets, are added to the cost of
those assets, upto the date when the assets are ready for their intended use. Expenditure incurred on issue of debentures is adjusted against Securities Premium Account. Expenditure incurred on raising loans is amortised over the period of such borrowings. Premium paid on prepayment of borrowing is amortised over the unexpired period thereof or six months, whichever is less. All other borrowing costs are recognised in the Statement of Profit and Loss in the period in which they are incurred.
4. Investments Long term investments are stated at cost. However, provision for diminution is made to recognise a decline, if any, other
than temporary, in the carrying value of the investment. Current investments are valued at lower of cost and fair value.

ANNUAL REPORT 2012-2013 59
STATEMENT ON SIGNIFICANT ACCOuNTING POLICIES FORMINGPART OF THE FINANCIAL STATEMENTS FOR THE YEAR ENDEDMARCH 31, 20135. Inventories
5.1 Inventories are valued at lower of cost and net realisable value; cost being ascertained on the following basis:
- Stores, spares, consumable tools, raw materials and components and work-in-progress: On monthly moving weighted average basis.
In respect of works-made components, cost includes applicable production overheads.
- Finished / trading goods: under absorption costing method.
5.2 Cost includes taxes and duties and is net of eligible credits under CENVAT / VAT Schemes.
5.3 Cost of patterns and dies is amortised over a period of five years.
5.4 Surplus / obsolete / slow moving inventories are adequately provided for.
6. Foreign currency transactions and derivatives
6.1 Foreign currency transactions are recorded at the rates prevailing on the date of the transaction. Monetary assets and liabilities in foreign currency are translated at closing rate. Exchange differences arising on settlement or translation of monetary items other than those mentioned in para 6.2 below are recognised as income or expense in the Statement of Profit and Loss in the period it arises.
6.2 Exchange differences on translation or settlement of long term foreign currency monetary items (i.e. whose term of settlement exceeds twelve months from date of its origination) at rates different from those at which they were initially recorded or reported in the previous financial statements, insofar as it relates to acquisition of depreciable assets are adjusted to the cost of the assets. In other cases, these are accumulated in “Foreign currency monetary item translation difference account” and amortised by recognition as income or expense in each period over the balance term of such items till settlement occurs but not beyond March 31, 2020.
6.3 Gains and losses on certain forward contracts designated as “effective Cash Flow Hedges” are recognised in the “Hedge Reserve Account” till the underlying forecasted transaction occurs.
6.4 Gains and losses on all other derivatives (including forward contracts not designated as Cash Flow hedge) are recognised in the Statement of Profit and Loss in the period it arises. Premium or discount on forward contracts is amortised over the life of the contract.
6.5 Investments in equity capital of companies registered outside India are carried in the Balance Sheet at the rates prevailing on the date of the transaction.
6.6 Income / expenditure of overseas branches are recognised at the average rate prevailing during the month in which transaction occurred.
7. Segment Reporting
The Company’s primary segment is identified as business segment based on nature of product, risks, returns and the internal business reporting system and secondary segment is identified based on geographical location of the customers as per Accounting Standard – 17. The Company is principally engaged in a single business segment viz. commercial vehicles and related components.
8. Revenue recognition
a) Sale of goods
Revenue from sale of products is recognised on despatch or appropriation of goods in accordance with the terms of sale and is inclusive of excise duty. Price escalation claims are recognised to the extent there is reasonable certainty of its realisation.
b) Sale of Services
Revenue from services is recognised in accordance with the specific terms of contract on performance.
c) Other operating revenues
Other operating revenues comprise of income from ancillary activities incidental to the operations of the Company and is recognised when the right to receive the income is established as per the terms of the contract.

Ashok Leyland Limited60
9. Leases Where the Company is a lessor a) Leases in which the Company transfers substantially all the risks and rewards of ownership of the asset are
classified as finance leases. Assets given under finance lease are recognised as a receivable at an amount equal to the net investment in the lease. After the initial recognition, the Company apportions lease rentals between principal repayment and interest income so as to achieve a constant periodic rate of return on the net investment outstanding in respect of the finance lease. The interest income is recognised in the Statement of Profit and Loss. Initial direct costs such as legal costs, brokerage costs, etc., are recognised immediately in the Statement of Profit and Loss.
b) Leases in which the Company does not transfer substantially all the risks and rewards of ownership of the asset are classified as operating leases. Assets subject to operating leases are included in fixed assets. Lease income on an operating lease is recognised in the Statement of Profit and Loss on a straight line basis over the lease terms. Costs, including depreciation, are recognised as an expense in the Statement of Profit and Loss. Initial direct costs such as legal costs, brokerage costs etc. are charged to the Statement of Profit and Loss in the period of incurrence.
10. Government grants Grants in the form of capital / investment subsidy are treated as Capital reserve. Export incentives and incentives in the
nature of subsidies given by the Government are reckoned in revenue in the year of eligibility.11. Research and Development costs Expenditure on the design and production of prototypes is charged to the Statement of Profit and Loss as and when
incurred. Product development costs, including knowhow developed / acquired, incurred on new vehicle / engine platforms, variants on existing platforms and aggregates are recognised as intangible assets and amortised over their estimated useful life.
12. Employee benefits 12.1 Short term employee benefit obligations are estimated and provided for. 12.2 Post-employment benefits and other long term employee benefits - Defined contribution plans: Company’s contribution to provident fund, superannuation fund, employee state insurance and other
funds are determined under the relevant schemes and / or statute and charged to the Statement of Profit and Loss in the period of incurrence.
- Defined benefit plans and compensated absences: Company’s liability towards gratuity, other retirement benefits and compensated absences are actuarially
determined at each balance sheet date using the projected unit credit method. Actuarial gains and losses are recognised in the Statement of Profit and Loss in the period of occurrence.
12.3 Termination benefits Expenditure on termination benefits (including expenditure on Voluntary Retirement scheme) is recognised in
the Statement of Profit and Loss in the period of incurrence.13. Product warranties Provision for product warranties is made for contractual obligations in accordance with the policy in force and is
estimated for the unexpired period.14. Income taxes 14.1 Income tax expenses comprise current and deferred taxes. Current tax is determined on income for the year
chargeable to tax in accordance with the Income Tax Act, 1961 and after considering credit for Minimum Alternate Tax available under the said Act.
14.2 Deferred tax is recognised on timing differences, being the difference between taxable income and accounting income that originate in one period and are capable of reversing in one or more subsequent periods.
Deferred tax asset pertaining to unabsorbed depreciation and carry forward of losses are recognised only to the extent there is a virtual certainty of its realisation.
STATEMENT ON SIGNIFICANT ACCOuNTING POLICIES FORMINGPART OF THE FINANCIAL STATEMENTS FOR THE YEAR ENDEDMARCH 31, 2013

ANNUAL REPORT 2012-2013 61
NOTES ANNEXED TO AND FORMING PARTOF THE FINANCIAL STATEMENTS
As atMarch 31, 2013
As atMarch 31, 2012
1.1 CAPITAL ` Lakhs ` LakhsAuthorised400,00,00,000 (2012: 300,00,00,000) Equity shares of ` 1 (2012: ` 1) each 40,000.00 30,000.00Issueda) 201,45,66,829 (2012: 201,45,66,829) Equity shares of ` 1 (2012: ` 1)
each 20,145.67 20,145.67b) 64,63,14,480 (2012: 64,63,14,480) Equity shares of ` 1 (2012: ` 1) each
issued through Global Depository Receipts 6,463.14 6,463.1426,608.81 26,608.81
Subscribed and fully paid upa) 201,43,62,154 (2012: 201,43,62,154) Equity shares of ` 1 (2012: ` 1)
each 20,143.62 20,143.62b) 64,63,14,480 (2012: 64,63,14,480) Equity shares of ` 1 (2012: ` 1) each
issued through Global Depository Receipts 6,463.14 6,463.1426,606.76 26,606.76
Add: Forfeited shares (amount originally paid up in respect of 760 shares) 0.04 0.0426,606.80 26,606.80
Notes:
1. The Authorised Capital of the Company was enhanced by 10,000 Lakhs pursuant to the approval by the share holders at the Annual General Meeting held on July 24, 2012.
2. Reconciliation of number of Equity Shares subscribed: 2013 2012Balance as at the beginning of the year 266,06,76,634 133,03,38,317Add: Shares issued and allotted as bonus shares in the ratio of 1:1 (Refer Note 1.2 (b) to the Financial Statement)* - 133,03,38,317Balance as at the end of the year 266,06,76,634 266,06,76,634
* Represents the number of shares issued as Bonus shares during last five years
3. Shares held by the Holding Company:
Hinduja Automotive Limited, the holding company, holds 102,72,37,424 (2012: 102,72,37,424) Equity shares and 54,86,669 (2012: 54,86,669) Global Depository Receipts (GDRs) equivalent to 32,92,00,140 (2012: 32,92,00,140) equity shares of ` 1 (2012: ` 1) each aggregating to 50.98% of the total share capital.
4. Shareholders other than the Holding Company holding more than 5% of the total share capital:
Life Insurance Corporation of India holds 25,00,56,674 (2012: 25,93,11,056) Equity shares of ` 1 (2012: ` 1) each aggregating to 9.40% (2012: 9.75%).
5. Rights, preferences and restrictions in respect of equity shares and GDRs issued by the Company
a) The Equity share holders are entitled to receive dividends as and when declared; a right to vote in proportion to holding etc. and their rights, preferences and restrictions are governed by / in terms of their issue under the provisions of the Companies Act, 1956.
b) The rights, preferences and restrictions of the GDR holders are governed by the terms of their issue, and the provisions of the Companies Act, 1956. Each GDR holder is entitled to receive 60 equity shares [ 2012: 60 equity shares ] of ` 1 each, per GDR, and their voting rights can be exercised through the Depository.

Ashok Leyland Limited62
NOTES ANNEXED TO AND FORMING PART OF THE FINANCIAL STATEMENTS
As at March 31, 2013
As at March 31, 2012
1.2 RESERVES AND SuRPLuS ` Lakhs ` Lakhs ` Lakhsa) Capital Reserve as at the beginning and end of the year 89.50 89.50b) Securities Premium Account Balance as at the beginning of the year 75,604.54 89,033.66 Less: utilisation towards issue of fully paid bonus shares - 13,303.38 Expenses incurred on issue of Debentures 127.71 125.74 Balance as at the end of the year 75,476.83 75,604.54c) Debenture Redemption Reserve Balance as at the beginning of the year 9,000.00 9,000.00 Add: Transferred from Surplus in Statement of Profit and Loss - 3,750.00 Less: Transferred to Surplus in Statement of Profit and Loss - 3,750.00 Balance as at the end of the year 9,000.00 9,000.00d) Revaluation Reserve Balance as at the beginning of the year 1,31,335.70 1,30,627.60 Less: Transferred to Statement of Profit and Loss [Refer Note 3.2.9 (b) to the Financial Statements] 1,571.27 1,577.46 Transferred to General reserve on sale of assets - 88.15 Reversal occasioned on extinguishment of assets 99.31 131.38 Add: Transferred from Depreciation / Amortisation Reserve - 2,505.09 Balance as at the end of the year 1,29,665.12 1,31,335.70e) General Reserve Balance as at the beginning of the year 89,341.48 79,253.33 Add: Transferred from Surplus in Statement of Profit and Loss 5,000.00 10,000.00 Transferred from Revaluation reserve on sale of assets - 88.15 Balance as at the end of the year 94,341.48 89,341.48f) Hedge Reserve [Refer note 3.9.2 to the Financial Statements] Balance as at the beginning of the year (1,953.80) (129.82) Add: unrealised gains / (losses) on cash flow hedges-net 1,894.23 (1,823.98) Balance as at the end of the year (59.57) (1,953.80)g) Foreign currency monetary item translation difference [ Refer Note 3.9.1 to the Financial Statements ] Balance as at the beginning of the year 415.27 - Amortisation / adjustments for the year (511.62) 415.27 Balance as at the end of the year (96.35) 415.27h) Surplus in Statement of Profit and Loss Balance as at the beginning of the year 90,793.13 75,118.52 Add: Current year profit 43,370.67 56,597.66 Transferred from Debenture Redemption Reserve - 3,750.00 Less: Transferred to General Reserve 5,000.00 10,000.00 Transferred to Debenture Redemption Reserve - 3,750.00 Proposed Dividend [` 0.60 per share (2012 ` 1.00 per share) ]
15,964.06 26,606.77
Corporate dividend tax thereon 2,713.09 4,316.28 Balance as at the end of the year 1,10,486.65 90,793.13
4,18,903.66 3,94,625.82

ANNUAL REPORT 2012-2013 63
NOTES ANNEXED TO AND FORMING PART OF THE FINANCIAL STATEMENTS
As atMarch 31, 2013
As atMarch 31, 2012
1.3 NON-CuRRENT LIABILITIES - LONG TERM BORROwINGS ` Lakhs ` Lakhsa) Secured Borrowings i. Debentures 89,000.00 36,000.00 ii. Term Loan from banks 33,333.33 60,000.00b) unsecured Borrowings i. Long term monetary item in foreign currency External Commercial Borrowings from banks 1,44,760.00 1,25,491.67 ii. Other loans and advances Interest free sales tax loans 5,714.76 6,692.17 Loans from a Financial institution 976.09 1,151.27
2,73,784.18 2,29,335.11
Security and terms of repayment in respect of the above borrowings are detailed in Note 3.14 to the Financial Statements.
1.4 NON-CuRRENT - DEFERRED TAX LIABILITIES (NET)a) Deferred tax liability due to i. Depreciation / Research and development expenditure 57,540.05 51,033.03 ii. Other timing differences 1,233.50 593.58b) Deferred tax asset arising out of i. Voluntary retirement scheme compensation (16.03) (31.36) ii. Carry forward of Losses - unabsorbed depreciation (2,870.24) - iii. Provision for Leave encashment (2,162.96) (2,064.64) iv. Other timing differences (987.63) (493.92)
52,736.69 49,036.69
1.5 NON CuRRENT LIABILITIES - OTHER LONG TERM LIABILITIESOther payables- Income received in Advance 177.85 -
177.85 -
1.6 NON-CuRRENT LIABILITIES - LONG-TERM PROVISIONSa) Provision for Employee Benefits i. Compensated absences 5,574.64 5,165.73 ii. Post retirement benefits 393.44 377.30 iii. Post retirement medical benefits 123.66 150.19b) Provision for Product warranties 1,759.52 1,963.08
7,851.26 7,656.30
Movement in respect of provision :` Lakhs
Particulars Year Opening balance Net additions / (utilizations)
Closing balance
Provision for product warranties 2013 1,963.08 (203.56) 1,759.522012 2,300.38 (337.30) 1,963.08

Ashok Leyland Limited64
NOTES ANNEXED TO AND FORMING PART OF THE FINANCIAL STATEMENTS
As at March 31, 2013
As at March 31, 2012
1.7 CuRRENT LIABILITIES - SHORT TERM BORROwINGS ` Lakhs ` Lakhs
Secured Borrowings
Loans from Banks 68,012.65 -
(Including Working capital demand loan, Packing credit, etc)
unsecured Borrowings - from Banks
Short term loans (STL)
(i) STL - 1 - 5,087.50
(ii) STL - 2 - 5,087.50
(ii) STL - 3 8,685.60 -
76,698.25 10,175.00
Terms of repayment in respect of the above borrowings are detailed in Note 3.15 to the Financial Statements
1.8 CuRRENT LIABILITIES - TRADE PAYABLES
Trade payables - including acceptances
i. Micro, Small and Medium enterprises [Refer Note 3.11 to the Financial Statements] 291.84 8,829.50
ii. Other Trade Payables 2,48,245.01 2,48,267.22
2,48,536.85 2,57,096.72
1.9 CuRRENT LIABILITIES - OTHER CuRRENT LIABILITIES
a) Current maturities of Long-term debts 85,060.82 70,279.22
b) Interest accrued but not due on borrowings 7,066.00 4,422.17
c) Income received in advance 173.50 34.01
d) unclaimed dividends 613.15 509.27
e) Other payables 80,592.87 99,760.16
1,73,506.34 1,75,004.83
Notes:
1. Details of security and terms of repayment in respect of the current maturities of long term debts are detailed in Note 3.14 to the Financial Statements
2. Other payables include:
- Contribution payable to Gratuity Fund 2,024.50 2,002.48
- Foreign exchange (gain) / loss on Marked-to-Market basis - net 31.22 2,948.75
- Employee benefits 12,589.72 14,297.59
- Capital creditors 16,902.75 12,409.52
- Advance from customers 5,138.66 17,163.01
- Statutory Liabilities 13,965.94 17,394.39
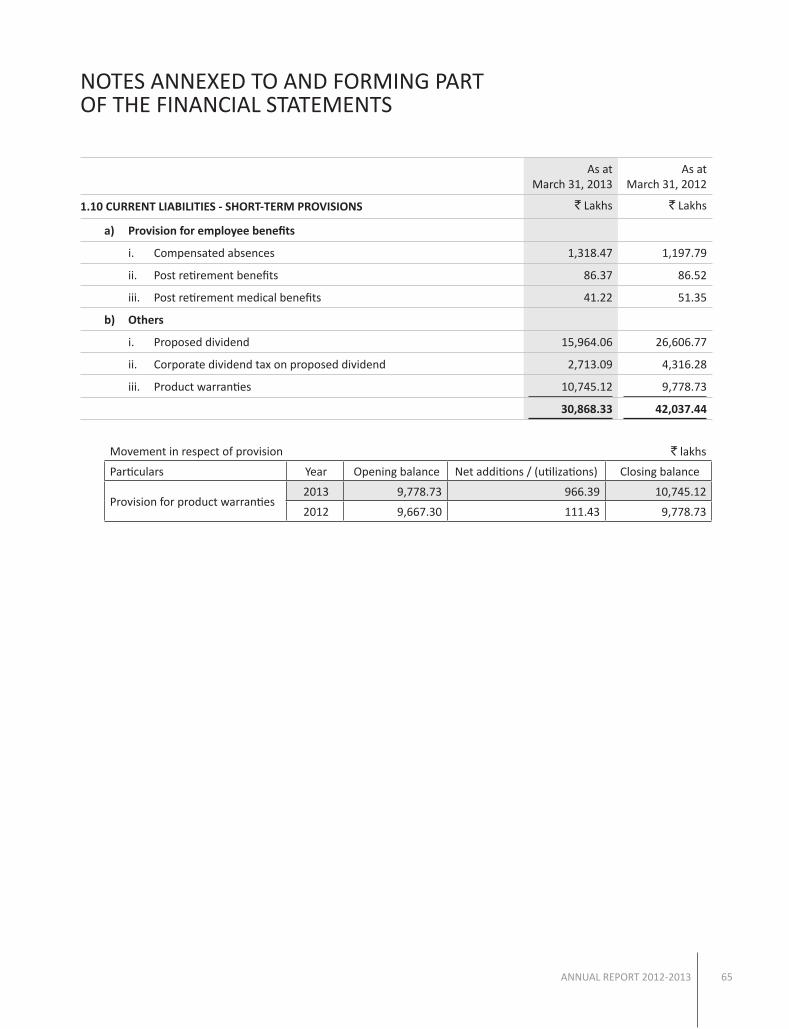
ANNUAL REPORT 2012-2013 65
NOTES ANNEXED TO AND FORMING PART OF THE FINANCIAL STATEMENTS
As at March 31, 2013
As at March 31, 2012
1.10 CuRRENT LIABILITIES - SHORT-TERM PROVISIONS ` Lakhs ` Lakhs
a) Provision for employee benefits
i. Compensated absences 1,318.47 1,197.79
ii. Post retirement benefits 86.37 86.52
iii. Post retirement medical benefits 41.22 51.35
b) Others
i. Proposed dividend 15,964.06 26,606.77
ii. Corporate dividend tax on proposed dividend 2,713.09 4,316.28
iii. Product warranties 10,745.12 9,778.73
30,868.33 42,037.44
Movement in respect of provision ` lakhs
Particulars Year Opening balance Net additions / (utilizations) Closing balance
Provision for product warranties 2013 9,778.73 966.39 10,745.12
2012 9,667.30 111.43 9,778.73

Ashok Leyland Limited66
1.11
NO
N-Cu
RREN
T AS
SETS
- TA
NGIB
LE A
SSET
S AN
D CA
PITA
L wO
RK IN
PRO
GRES
S `
Lakh
sDE
SCRI
PTIO
N
G
ROSS
BLO
CK (C
OST
/ VAL
uATI
ON)
DEPR
ECIA
TION
/ AM
ORTI
SATI
ON /
IMPA
IRM
ENT
NET
BLOC
K
01.
04.2
012
Addi
tions
/ Ad
just
men
tsDi
spos
als
31.0
3.20
13Up
to
31.0
3.20
12
Char
ge
durin
g th
e ye
ar
Disp
osal
s /Ad
just
men
tsUp
to31
.03.
2013
31.0
3.20
1331
.03.
2012
Land - F
reeh
old
land
76,
821.
70
3.7
0 1
8.82
7
6,80
6.58
-
- -
- 7
6,80
6.58
7
6,82
1.70
- L
ease
hold
land
41,
529.
78
585
.81
- 4
2,11
5.59
1
,837
.62
520
.97
0.5
3 2
,358
.06
39,
757.
53
39,
692.
16
- Lea
seho
ld la
nd g
iven
on le
ase
126
.41
- -
126
.41
17.
60
1.2
8 -
18.
88
107
.53
108
.81
Build
ings
1,3
4,04
3.75
9
,506
.79
180
.50
1,43
,370
.04
21,
618.
14
4,5
92.6
8 9
6.61
2
6,11
4.21
1
,17,
255.
83
1,1
2,42
5.61
Bu
ildin
g gi
ven
on le
ase
1,1
40.1
5 -
- 1
,140
.15
90.
18
20.
91
- 1
11.0
9 1
,029
.06
1,0
49.9
7 Pl
ant a
nd e
quip
men
t 3
,77,
032.
96
53,
469.
47
2,8
15.6
7 4,
27,6
86.7
6 1
,68,
125.
45
22,
392.
35
2,7
17.9
4 1
,87,
799.
86
2,3
9,88
6.90
2
,08,
907.
51
Plan
t and
equ
ipm
ent g
iven
on le
ase
6.0
0 -
- 6
.00
1.9
0 0
.39
- 2
.29
3.7
1 4
.10
Furn
iture
and
fitti
ngs
6,9
50.7
4 1
,221
.37
8.3
5 8
,163
.76
3,5
04.1
5 9
96.8
6 2
.87
4,4
98.1
4 3
,665
.62
3,4
46.5
9 Fu
rnitu
re a
nd fi
tting
s give
n on
leas
e 8
8.87
-
- 8
8.87
4
1.31
1
1.11
-
52.
42
36.
45
47.
56
Vehi
cles a
nd a
ircra
ft 1
4,83
3.82
3
18.3
2 1
46.6
0 1
5,00
5.54
5
,929
.60
1,0
59.0
0 1
34.3
6 6
,854
.24
8,1
51.3
0 8
,904
.22
Vehi
cles g
iven
on le
ase
0.2
4 -
- 0
.24
0.2
4 -
- 0
.24
- -
Office
Equ
ipm
ent
18,
730.
04
2,1
38.4
0 2
30.4
1 2
0,63
8.03
1
3,57
3.15
2
,155
.49
233
.30
15,
495.
34
5,1
42.6
9 5
,156
.89
Office
Equ
ipm
ent g
iven
on le
ase
43.
97
- -
43.
97
37.
84
5.9
1 -
43.
75
0.2
2 6
.13
TOTA
L 6
,71,
348.
43
67,
243.
86
3,4
00.3
5 7,
35,1
91.9
4 2
,14,
777.
18
31,
756.
95
3,1
85.6
1 2
,43,
348.
52
4,9
1,84
3.42
4
,56,
571.
25
Less
: Tra
nsfe
r fro
m R
eval
uatio
n Re
serv
e pe
rtain
ing
to B
uild
ing
1,2
37.0
0
Amou
nt co
nsid
ered
as R
ent [
Refe
r Not
e 2.
9 to
the
Fina
ncia
l Sta
tem
ents
] 5
22.2
5 TO
TAL
29,
997.
70
Prev
ious
yea
r 6
,27,
267.
46
49,
715.
55
5,6
34.5
8 6,
71,3
48.4
3 1
,92,
829.
42
30,
507.
55
8,5
59.7
9 2
,14,
777.
18
4,5
6,57
1.25
Capi
tal w
ork
in P
rogr
ess
56,
261.
83
43,
519.
06
1.
Build
ings
incl
ude
serv
ice
inst
alla
tions
of g
ross
val
ue `
14,
772.
56 la
khs
(201
2: `
12,
171.
40 la
khs)
2.
Land
and
Bui
ldin
gs (o
ther
than
thos
e gi
ven
on le
ase
and
inst
alla
tions
) hav
e be
en re
valu
ed a
s at
Mar
ch 3
1, 2
009
after
con
side
ring
dep
reci
ation
/ a
mor
tisati
on u
pto
that
dat
e as
per
ex
tern
al v
alue
r’s
repo
rt, o
n th
e go
vern
ing
prin
cipl
es o
f cur
rent
cos
t. T
he a
mou
nt o
f inc
reas
e on
the
reva
luati
on d
one
on M
arch
31,
200
9 w
as `
1,3
6,48
6.44
lakh
s an
d th
e re
valu
ed
amou
nt s
ubsti
tute
d fo
r hi
stor
ical
cos
t of t
he fi
xed
asse
ts a
s at
that
dat
e w
as `
2,0
3,73
7.92
lakh
s3.
A
por
tion
of th
e bu
ildin
gs in
Bha
ndar
a re
valu
ed a
t ` 9
50 la
khs
is o
n a
land
, the
title
for
whi
ch is
yet
to b
e tr
ansf
erre
d to
the
Com
pany
.4.
Co
st o
f Bui
ldin
gs a
s at
Mar
ch 3
1, 2
013
incl
udes
:
a)
` 3
.42
lakh
s (2
012:
` 3
.42
lakh
s) b
eing
cos
t of s
hare
s in
Hou
sing
Co-
oper
ative
Soc
iety
repr
esen
ting
owne
rshi
p ri
ghts
in re
side
ntial
flat
s an
d fu
rnitu
re a
nd fi
tting
s th
erea
t.
b)
` 1
32.3
8 la
khs
(201
2: `
132
.38
lakh
s) re
pres
entin
g co
st o
f res
iden
tial fl
ats
incl
udin
g un
divi
ded
inte
rest
in la
nd.
5.
Add
ition
s to
Tan
gibl
e A
sset
s an
d Ca
pita
l wor
k in
pro
gres
s in
clud
e:
- Ex
chan
ge (g
ain)
/ lo
ss a
ggre
gatin
g to
` 1
5,57
8.37
lakh
s (2
012:
` 2
0,95
8.42
lakh
s) c
apita
lised
as
unde
r:
La
nd `
644
.04
lakh
s (2
012:
` 1
,396
.41
lakh
s), B
uild
ing
` 1,
465.
50 la
khs
(201
2: `
2,0
04.7
7 la
khs)
, Pla
nt a
nd e
quip
men
t ` 6
,724
.56
lakh
s (2
012:
` 9
,778
.54
lakh
s).
Furn
iture
and
fitti
ngs
316
.15
lakh
s (2
012:
4
20.7
9 la
khs)
, Veh
icle
s an
d ai
rcra
ft
20.
47 la
khs
(201
2:
218
.24
lakh
s), O
ffice
equ
ipm
ent
285
.20
lakh
s (2
012:
4
68.8
2 la
khs)
.
Ca
pita
l wor
k-in
-pro
gres
s `
6,1
22.4
6 la
khs
(201
2: `
6,6
70.8
5 la
khs)
.
- Bo
rrow
ing
cost
cap
italis
ed d
urin
g th
e ye
ar :
` 1,
764.
68 la
khs
(201
2: N
IL)
NOTES ANNEXED TO AND FORMING PART OF THE FINANCIAL STATEMENTS

ANNUAL REPORT 2012-2013 67
1.12
NO
N-C
uRR
ENT
ASS
ETS
- IN
TAN
GIB
LE A
SSET
S A
ND
INTA
NG
IBLE
ASS
ETS
uN
DER
DEV
ELO
PMEN
T
` La
khs
DES
CRIP
TIO
N
G
ROSS
BLO
CK (C
OST
/ V
ALu
ATIO
N)
DEP
RECI
ATIO
N /
AM
ORT
ISAT
ION
/ IM
PAIR
MEN
T N
ET B
LOCK
1.0
4.20
12
Add
ition
s /
Adj
ustm
ents
Dis
posa
ls31
.03.
2013
Upt
o 31
.03.
2012
Char
ge
duri
ng th
e ye
ar
Dis
posa
ls /
Adj
ustm
ents
Upt
o 31
.03.
2013
31.0
3.20
1331
.03.
2012
Com
pute
r so
ftw
are
- Dev
elop
ed 8
,625
.32
6,5
37.1
0 -
15,
162.
42
2,5
53.0
5 8
27.3
5 -
3,3
80.4
0 1
1,78
2.02
6
,072
.27
- Acq
uire
d 9
,285
.58
1,9
62.1
1 -
11,
247.
69
5,9
04.3
5 1
,665
.26
0.3
1 7
,569
.30
3,6
78.3
9 3
,381
.23
Oth
ers
Tec
hnic
al k
now
how
- Dev
elop
ed 2
4,24
9.44
1
06.0
0 -
24,
355.
44
4,0
28.6
9 4
,060
.05
- 8
,088
.74
16,
266.
70
20,
220.
75
- Acq
uire
d 1
2,13
3.57
1
,041
.83
- 1
3,17
5.40
7
,029
.66
1,5
27.9
9 -
8,5
57.6
5 4
,617
.75
5,1
03.9
1
TOTA
L 5
4,29
3.91
9
,647
.04
- 6
3,94
0.95
1
9,51
5.75
8
,080
.65
0.3
1 2
7,59
6.09
3
6,34
4.86
3
4,77
8.16
Prev
ious
Yea
r 4
1,92
1.41
1
2,37
2.50
-
54,
293.
91
12,
980.
28
6,5
35.4
7 -
19,
515.
75
34,
778.
16
Inta
ngib
le a
sset
s un
der
deve
lopm
ent
12,
630.
91
11,
303.
03
Add
ition
s to
Inta
ngib
le a
sset
s an
d In
tang
ible
ass
ets
unde
r de
velo
pmen
t inc
lude
:
a)
Ex
chan
ge (g
ain)
/ lo
ss a
ggre
gatin
g to
` 2
79.9
6 la
khs
(201
2: `
276
.55
lakh
s) c
apita
lised
as
unde
r :
Soft
war
e `
199.
92 la
khs
(201
2: `
229
.04
lakh
s), T
echn
ical
Kno
who
w `
23.
81 la
khs
(201
2: `
47.
51 la
khs)
, Int
angi
ble
asse
ts u
nder
dev
elop
men
t `
56.2
3 la
khs
(201
2: N
il)
b)
Borr
owin
g co
st c
apita
lised
dur
ing
the
year
: ` 8
88.3
9 la
khs
(201
2: 7
8.30
lakh
s) a
nd in
tang
ible
ass
ets
unde
r de
velo
pmen
t ` 4
9.68
lakh
s
(201
2: `
78.
49 la
khs)
c)
O
ther
exp
ense
s ca
pita
lised
` 2
,020
.28
lakh
s (2
012:
` 2
,283
.49
lakh
s) -
Refe
r N
otes
2.6
and
2.9
to th
e Fi
nanc
ial S
tate
men
ts
NOTES ANNEXED TO AND FORMING PART OF THE FINANCIAL STATEMENTS
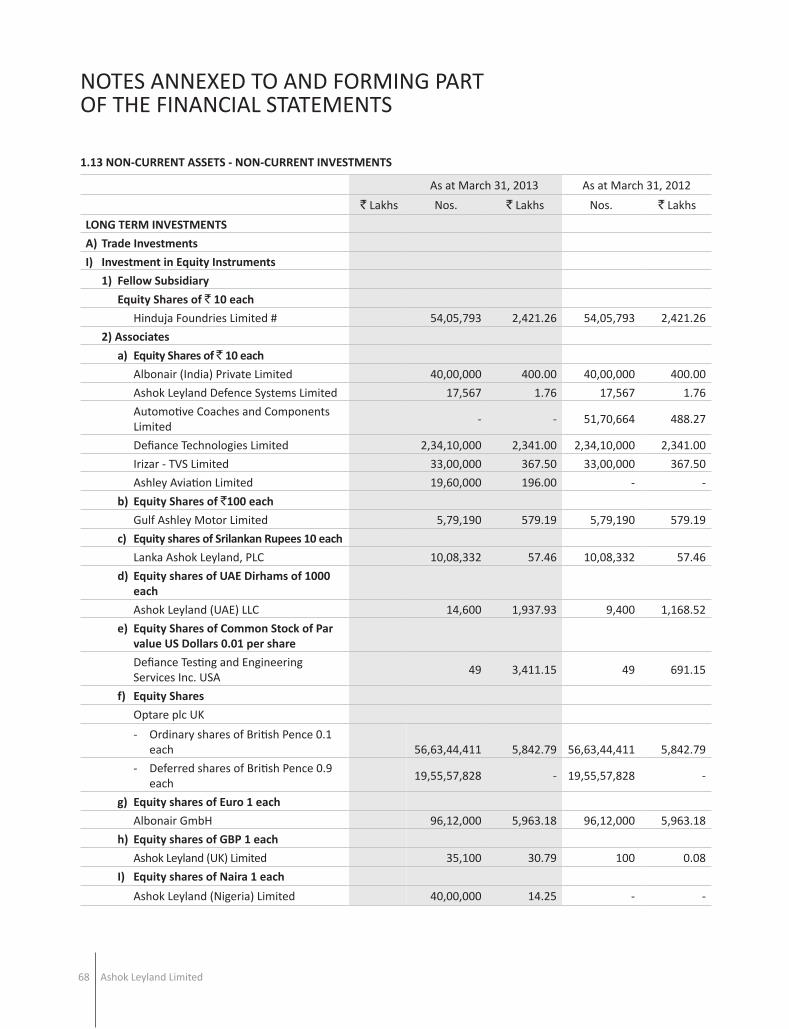
Ashok Leyland Limited68
NOTES ANNEXED TO AND FORMING PART OF THE FINANCIAL STATEMENTS
1.13 NON-CuRRENT ASSETS - NON-CuRRENT INVESTMENTS
As at March 31, 2013 As at March 31, 2012
` Lakhs Nos. ` Lakhs Nos. ` Lakhs
LONG TERM INVESTMENTS
A) Trade Investments
I) Investment in Equity Instruments
1) Fellow Subsidiary
Equity Shares of ` 10 each
Hinduja Foundries Limited # 54,05,793 2,421.26 54,05,793 2,421.26
2) Associates
a) Equity Shares of ` 10 each
Albonair (India) Private Limited 40,00,000 400.00 40,00,000 400.00
Ashok Leyland Defence Systems Limited 17,567 1.76 17,567 1.76
Automotive Coaches and Components Limited
- - 51,70,664 488.27
Defiance Technologies Limited 2,34,10,000 2,341.00 2,34,10,000 2,341.00
Irizar - TVS Limited 33,00,000 367.50 33,00,000 367.50
Ashley Aviation Limited 19,60,000 196.00 - -
b) Equity Shares of `100 each
Gulf Ashley Motor Limited 5,79,190 579.19 5,79,190 579.19
c) Equity shares of Srilankan Rupees 10 each
Lanka Ashok Leyland, PLC 10,08,332 57.46 10,08,332 57.46
d) Equity shares of uAE Dirhams of 1000 each
Ashok Leyland (uAE) LLC 14,600 1,937.93 9,400 1,168.52
e) Equity Shares of Common Stock of Par value uS Dollars 0.01 per share
Defiance Testing and Engineering Services Inc. uSA
49 3,411.15 49 691.15
f) Equity Shares
Optare plc uK
- Ordinary shares of British Pence 0.1 each 56,63,44,411 5,842.79
56,63,44,411 5,842.79
- Deferred shares of British Pence 0.9 each
19,55,57,828 - 19,55,57,828 -
g) Equity shares of Euro 1 each
Albonair GmbH 96,12,000 5,963.18 96,12,000 5,963.18
h) Equity shares of GBP 1 each
Ashok Leyland (uK) Limited 35,100 30.79 100 0.08
I) Equity shares of Naira 1 each
Ashok Leyland (Nigeria) Limited 40,00,000 14.25 - -
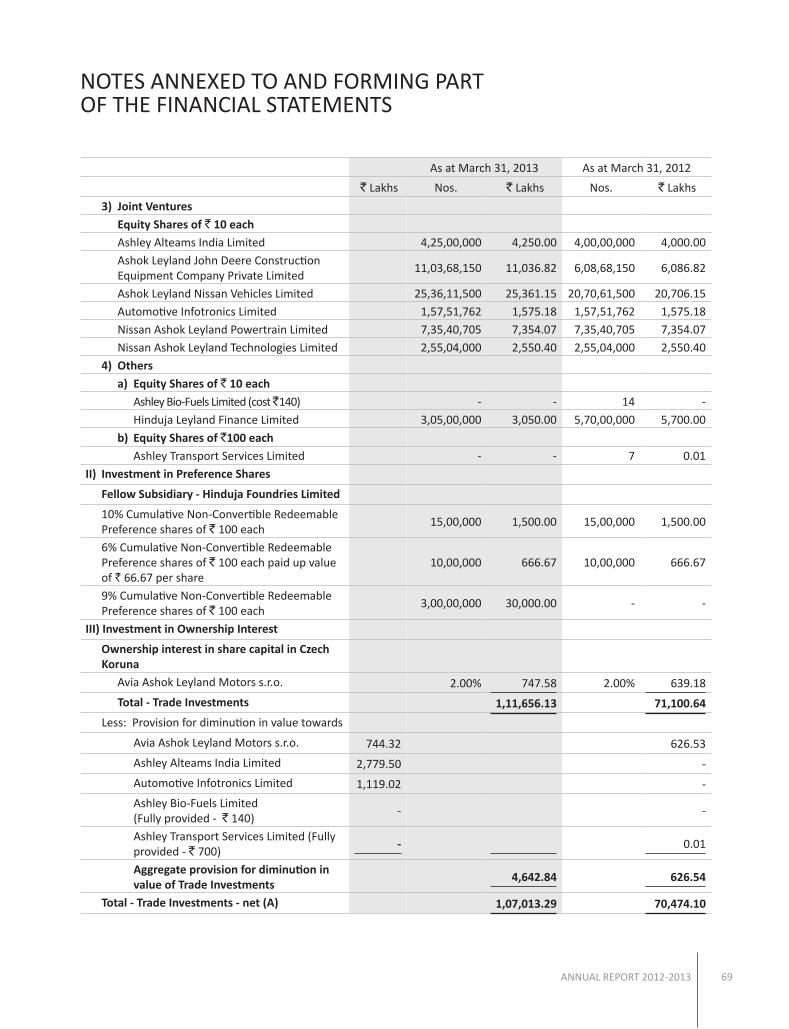
ANNUAL REPORT 2012-2013 69
NOTES ANNEXED TO AND FORMING PART OF THE FINANCIAL STATEMENTS
As at March 31, 2013 As at March 31, 2012
` Lakhs Nos. ` Lakhs Nos. ` Lakhs
3) joint Ventures
Equity Shares of ` 10 each Ashley Alteams India Limited 4,25,00,000 4,250.00 4,00,00,000 4,000.00 Ashok Leyland John Deere Construction Equipment Company Private Limited
11,03,68,150 11,036.82 6,08,68,150 6,086.82
Ashok Leyland Nissan Vehicles Limited 25,36,11,500 25,361.15 20,70,61,500 20,706.15 Automotive Infotronics Limited 1,57,51,762 1,575.18 1,57,51,762 1,575.18 Nissan Ashok Leyland Powertrain Limited 7,35,40,705 7,354.07 7,35,40,705 7,354.07 Nissan Ashok Leyland Technologies Limited 2,55,04,000 2,550.40 2,55,04,000 2,550.40 4) Others
a) Equity Shares of ` 10 each
Ashley Bio-Fuels Limited (cost 140) - - 14 - Hinduja Leyland Finance Limited 3,05,00,000 3,050.00 5,70,00,000 5,700.00
b) Equity Shares of `100 each Ashley Transport Services Limited - - 7 0.01 II) Investment in Preference Shares
Fellow Subsidiary - Hinduja Foundries Limited
10% Cumulative Non-Convertible Redeemable Preference shares of ` 100 each
15,00,000 1,500.00 15,00,000 1,500.00
6% Cumulative Non-Convertible Redeemable Preference shares of ` 100 each paid up value of ` 66.67 per share
10,00,000 666.67 10,00,000 666.67
9% Cumulative Non-Convertible Redeemable Preference shares of ` 100 each
3,00,00,000 30,000.00 - -
III) Investment in Ownership Interest
Ownership interest in share capital in Czech Koruna Avia Ashok Leyland Motors s.r.o. 2.00% 747.58 2.00% 639.18
Total - Trade Investments 1,11,656.13 71,100.64
Less: Provision for diminution in value towards
Avia Ashok Leyland Motors s.r.o. 744.32 626.53
Ashley Alteams India Limited 2,779.50 -
Automotive Infotronics Limited 1,119.02 -
Ashley Bio-Fuels Limited (Fully provided - ` 140)
- -
Ashley Transport Services Limited (Fully provided - ` 700)
- 0.01
Aggregate provision for diminution in value of Trade Investments
4,642.84 626.54
Total - Trade Investments - net (A) 1,07,013.29 70,474.10

Ashok Leyland Limited70
As at March 31, 2013
As at March 31, 2012
Nos. ` Lakhs Nos. ` Lakhs
B) Other Investments
I) Investment in Equity Shares
1) Associates
Equity Shares of ` 10 each
Ashley Airways Limited (under liquidation) 14,70,000 14.70 14,70,000 14.70
Ashley Holdings Limited 47,24,75,000 47,247.50 31,98,77,500 31,987.75
Ashley Investments Limited 47,42,55,000 47,425.50 32,26,57,500 32,265.75
Mangalam Retail Services Limited 24,980 2.50 24,980 2.50
2) Others
a) Equity shares of ` 10 each
Chennai Willingdon Corporate Foundation (Cost ` 900)
100 100
Ashok Leyland Project Services Limited 34,42,400 344.24 34,42,400 344.24
Hinduja Energy (India) Limited 6,11,47,058 18,711.00 - -
Hinduja Global Solutions Limited # 2,029 4.05 2,029 4.05
Hinduja Ventures Limited # 2,029 4.06 2,029 4.06
ICICI Bank Limited # - - 24,231 10.52
IndusInd Bank Limited # 1,30,13,923 9,795.03 2,01,13,923 15,138.90
b) Equity shares of ` 100 each partly paid-up
Adyar Property Holding Co. Limited (` 65 paid up) 400 0.26 400 0.26
II) Investment in Preference Shares
Associates
2% Non-Cumulative Non-Convertible Redeemable Preference shares of ` 10 each
Ashley Holdings Limited 32,50,000 325.00 32,50,000 325.00
Ashley Investments Limited 32,50,000 325.00 32,50,000 325.00
6% Non-Cumulative Non-Convertible Redeemable Preference shares of ` 10 each
Ashley Holdings Limited 1,17,50,000 1,175.00 1,17,50,000 1,175.00
Ashley Investments Limited 1,17,50,000 1,175.00 1,17,50,000 1,175.00
III) Investment in Government Securities
National Savings Certificate of the face value of ` 0.50 lakh 0.50 0.50
IV) Investment in Debentures or Bonds
Non convertible redeemable bonds of ` 10 Lakhs each
ICICI Bank Limited # 20 200.56 20 200.56
Total - Other Investments (B) 1,26,749.90 82,973.79
Grand Total (A + B) 2,33,763.19 1,53,447.89
NOTES ANNEXED TO AND FORMING PART OF THE FINANCIAL STATEMENTS
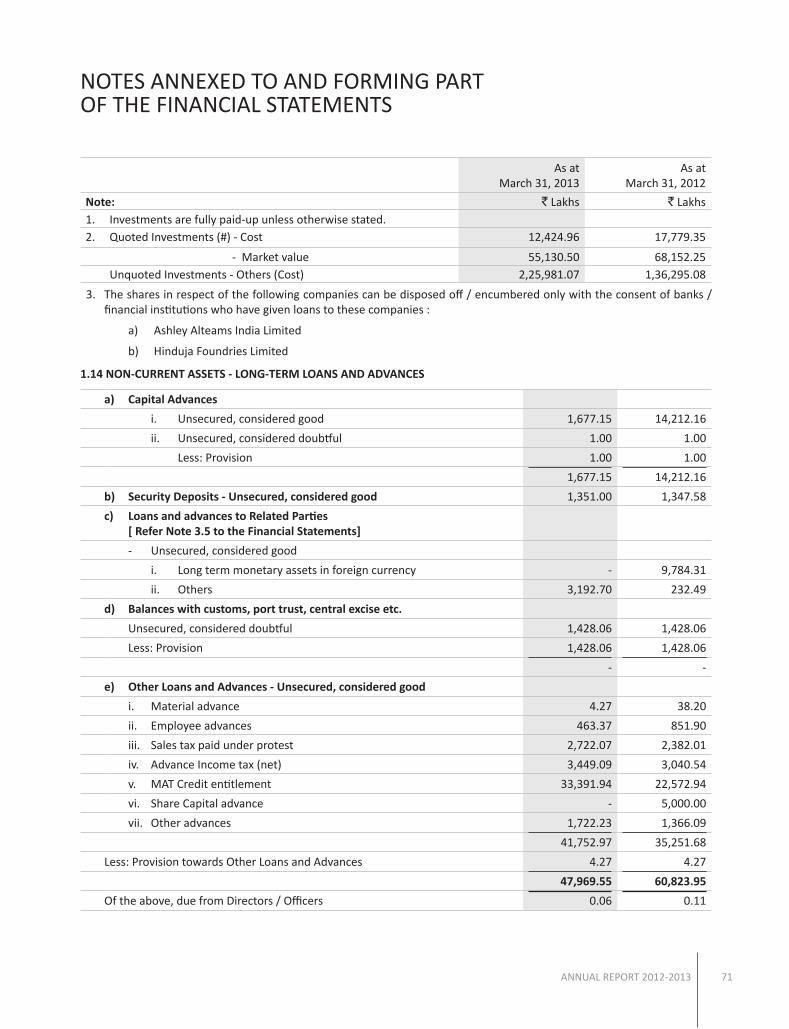
ANNUAL REPORT 2012-2013 71
NOTES ANNEXED TO AND FORMING PART OF THE FINANCIAL STATEMENTS
As at March 31, 2013
As at March 31, 2012
Note: ` Lakhs ` Lakhs 1. Investments are fully paid-up unless otherwise stated.2. Quoted Investments (#) - Cost 12,424.96 17,779.35
- Market value 55,130.50 68,152.25 unquoted Investments - Others (Cost) 2,25,981.07 1,36,295.08
3. The shares in respect of the following companies can be disposed off / encumbered only with the consent of banks / financial institutions who have given loans to these companies :
a) Ashley Alteams India Limited
b) Hinduja Foundries Limited
1.14 NON-CuRRENT ASSETS - LONG-TERM LOANS AND ADVANCES
a) Capital Advances
i. unsecured, considered good 1,677.15 14,212.16
ii. unsecured, considered doubtful 1.00 1.00
Less: Provision 1.00 1.00
1,677.15 14,212.16
b) Security Deposits - unsecured, considered good 1,351.00 1,347.58
c) Loans and advances to Related Parties [ Refer Note 3.5 to the Financial Statements]
- unsecured, considered good
i. Long term monetary assets in foreign currency - 9,784.31
ii. Others 3,192.70 232.49
d) Balances with customs, port trust, central excise etc.
unsecured, considered doubtful 1,428.06 1,428.06
Less: Provision 1,428.06 1,428.06
- -
e) Other Loans and Advances - unsecured, considered good
i. Material advance 4.27 38.20
ii. Employee advances 463.37 851.90
iii. Sales tax paid under protest 2,722.07 2,382.01
iv. Advance Income tax (net) 3,449.09 3,040.54
v. MAT Credit entitlement 33,391.94 22,572.94
vi. Share Capital advance - 5,000.00
vii. Other advances 1,722.23 1,366.09
41,752.97 35,251.68
Less: Provision towards Other Loans and Advances 4.27 4.27
47,969.55 60,823.95
Of the above, due from Directors / Officers 0.06 0.11

Ashok Leyland Limited72
NOTES ANNEXED TO AND FORMING PART OF THE FINANCIAL STATEMENTS
As at March 31, 2013
As at March 31, 2012
1.15 OTHER NON-CuRRENT ASSETS ` Lakhs ` Lakhs ` Lakhs
a) Long term trade receivables - unsecured considered good
6.69 12.13
b) unamortised loan raising expenses 1,196.52 730.61
1,203.21 742.74
1.16 CuRRENT ASSETS - INVENTORIES
(a) Raw materials and Components (including patterns and dies) 74,089.20 78,988.15
(b) Work-in -progress 12,095.13 17,229.95
(c) Finished goods 71,171.61 1,00,557.62
(d) Stock-in-trade - Traded goods
(i) Engines 656.65 210.16
(ii) Light Commercial Vehicles 853.92 40.62
(iii) Spare parts and auto components (including works made) 21,587.79 16,262.42
23,098.36 16,513.20
(e) Stores, spares and consumable tools 9,143.39 9,773.60
(f) Carbon Emmission Rights (CER’s) 4.39 -
1,89,602.08 2,23,062.52
1) Goods in transit included under the above heads are as below:
(a) Raw Materials and components 4,324.69 9,266.97
(b) Stock-in-Trade - Traded goods
(i) Engines 195.11 169.88
(ii) Light Commercial Vehicles - 40.62
(iii) Spares parts and auto components (including works made)
526.99 535.32
(c) Stores, spares and consumable tools 15.14 14.67
2) Carbon Emission Rights
Number of CER's held : 19,600 nos (2012 : Nil)
Number of CER's under certification : 38,385 nos (2012 : 19,600 nos)
1.17 CuRRENT ASSETS - TRADE RECEIVABLES
Trade Receivables - unsecured
(i) Considered good 1,41,941.13 1,23,076.42
(ii) Considered doubtful 39.47 39.47
1,41,980.60 1,23,115.89
Less: Provision 39.47 39.47
1,41,941.13 1,23,076.42
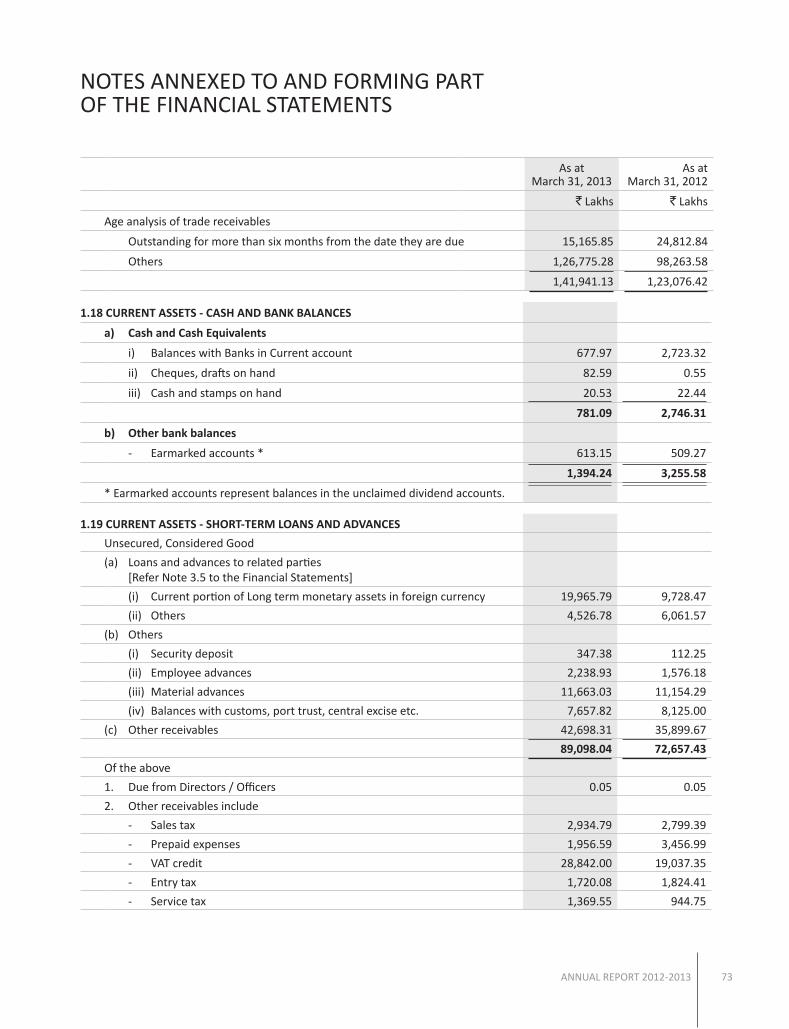
ANNUAL REPORT 2012-2013 73
NOTES ANNEXED TO AND FORMING PART OF THE FINANCIAL STATEMENTS
As at March 31, 2013
As at March 31, 2012
` Lakhs ` Lakhs
Age analysis of trade receivables
Outstanding for more than six months from the date they are due 15,165.85 24,812.84
Others 1,26,775.28 98,263.58
1,41,941.13 1,23,076.42
1.18 CuRRENT ASSETS - CASH AND BANK BALANCES
a) Cash and Cash Equivalents
i) Balances with Banks in Current account 677.97 2,723.32
ii) Cheques, drafts on hand 82.59 0.55
iii) Cash and stamps on hand 20.53 22.44
781.09 2,746.31
b) Other bank balances
- Earmarked accounts * 613.15 509.27
1,394.24 3,255.58
* Earmarked accounts represent balances in the unclaimed dividend accounts.
1.19 CuRRENT ASSETS - SHORT-TERM LOANS AND ADVANCES
unsecured, Considered Good
(a) Loans and advances to related parties [Refer Note 3.5 to the Financial Statements]
(i) Current portion of Long term monetary assets in foreign currency 19,965.79 9,728.47
(ii) Others 4,526.78 6,061.57
(b) Others
(i) Security deposit 347.38 112.25
(ii) Employee advances 2,238.93 1,576.18
(iii) Material advances 11,663.03 11,154.29
(iv) Balances with customs, port trust, central excise etc. 7,657.82 8,125.00
(c) Other receivables 42,698.31 35,899.67
89,098.04 72,657.43
Of the above
1. Due from Directors / Officers 0.05 0.05
2. Other receivables include
- Sales tax 2,934.79 2,799.39
- Prepaid expenses 1,956.59 3,456.99
- VAT credit 28,842.00 19,037.35
- Entry tax 1,720.08 1,824.41
- Service tax 1,369.55 944.75

Ashok Leyland Limited74
NOTES ANNEXED TO AND FORMING PART OF THE FINANCIAL STATEMENTS
As at March 31, 2013
As at March 31, 2012
1.20 CuRRENT ASSETS - OTHER CuRRENT ASSETS ` Lakhs ` Lakhs
a) Interest accrued :
- Loans and advance to Related Parties [Refer Note 3.5 to the Financial Statements]
528.05 688.84
- Others 176.86 48.38
b) Export incentive receivables 6,499.96 7,344.89
c) Current portion of unamortised loan raising expenses 412.88 254.57
7,617.75 8,336.68
Year ended March 31, 2013
Year ended March 31, 2012
2.1 REVENuE FROM OPERATIONS
a) Sale of products
- Commercial Vehicles
Manufactured 10,31,833.53 11,84,618.44
Traded 91,517.14 16,348.06
- Engines and Gensets 48,351.63 34,921.00
- Spare parts and others 1,81,458.13 1,55,399.93
(A) 13,53,160.43 13,91,287.43
b) Revenue from services (B) 13,825.46 8,266.77
c) Other operating revenues
- Contract manufacturing 11,849.87 2,637.88
- Export Incentives 8,286.31 8,945.23
- Scrap sales 7,501.82 7,255.54
- Others 174.18 1,248.42
(C) 27,812.18 20,087.07
(A+B+C) 13,94,798.07 14,19,641.27
Less: Commission, rebate and discounts 64,942.18 47,560.77
13,29,855.89 13,72,080.50
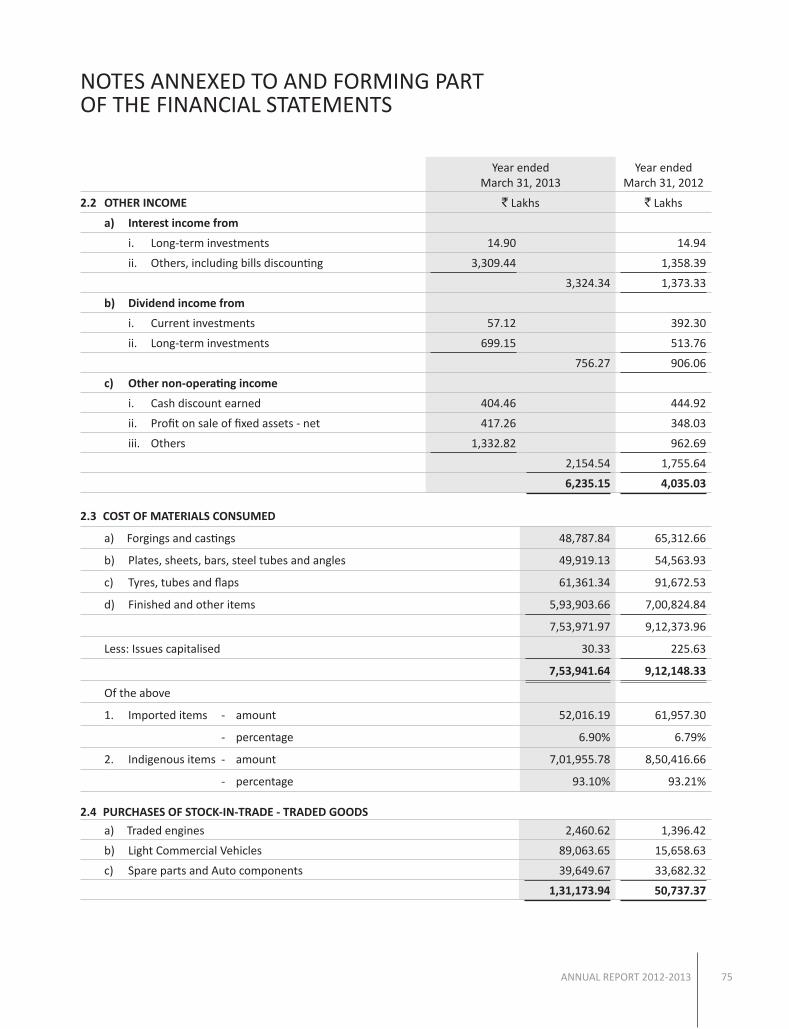
ANNUAL REPORT 2012-2013 75
NOTES ANNEXED TO AND FORMING PART OF THE FINANCIAL STATEMENTS
Year ended March 31, 2013
Year ended March 31, 2012
2.2 OTHER INCOME ` Lakhs ` Lakhs
a) Interest income from
i. Long-term investments 14.90 14.94
ii. Others, including bills discounting 3,309.44 1,358.39
3,324.34 1,373.33
b) Dividend income from
i. Current investments 57.12 392.30
ii. Long-term investments 699.15 513.76
756.27 906.06
c) Other non-operating income
i. Cash discount earned 404.46 444.92
ii. Profit on sale of fixed assets - net 417.26 348.03
iii. Others 1,332.82 962.69
2,154.54 1,755.64
6,235.15 4,035.03
2.3 COST OF MATERIALS CONSuMED
a) Forgings and castings 48,787.84 65,312.66
b) Plates, sheets, bars, steel tubes and angles 49,919.13 54,563.93
c) Tyres, tubes and flaps 61,361.34 91,672.53
d) Finished and other items 5,93,903.66 7,00,824.84
7,53,971.97 9,12,373.96
Less: Issues capitalised 30.33 225.63
7,53,941.64 9,12,148.33
Of the above
1. Imported items - amount 52,016.19 61,957.30
- percentage 6.90% 6.79%
2. Indigenous items - amount 7,01,955.78 8,50,416.66
- percentage 93.10% 93.21%
2.4 PuRCHASES OF STOCK-IN-TRADE - TRADED GOODS
a) Traded engines 2,460.62 1,396.42
b) Light Commercial Vehicles 89,063.65 15,658.63
c) Spare parts and Auto components 39,649.67 33,682.32
1,31,173.94 50,737.37

Ashok Leyland Limited76
Year ended March 31, 2013
Year ended March 31, 2012
2.5 CHANGES IN INVENTORIES OF FINISHED GOODS,wORK - IN-PROGRESS AND STOCK-IN-TRADE
` Lakhs ` Lakhs
a) Changes in Inventories
- Work-in-progress 5,134.82 9,052.08
- Finished / Traded goods 22,800.85 (26,554.85)
Net change 27,935.67 (17,502.77)
b) Movement in Excise duty content in Finished / Traded goods (737.98) 801.47
27,197.69 (16,701.30)
2.6 EMPLOYEE BENEFITS EXPENSE
a) Salaries, wages and bonus 84,251.95 80,464.95
b) Contribution to provident, gratuity and other funds 9,161.61 8,744.45
c) Welfare expenses 15,260.22 14,409.87
1,08,673.78 1,03,619.27
Less: Employee expenses capitalised 1,122.44 1,579.85
1,07,551.34 1,02,039.42
2.7 FINANCE COSTS
a) Interest 35,232.99 22,500.13
b) Other borrowing costs * 5,158.33 3,181.98
40,391.32 25,682.11
Less: Interest cost capitalised 2,702.75 156.79
37,688.57 25,525.32
* Other borrowing costs include:
- Loan raising expenses amortised 383.34 216.97
- Premium on forward contracts amortised 1,120.68 1,081.46
- Bill discounting charges 3,643.79 1,872.31
2.8 DEPRECIATION / IMPAIRMENT
A) Tangible assets
(i) Buildings 4,592.68 4,118.59
(ii) Plant and Machinery 22,392.35 22,137.11
(iii) Furniture and fittings 996.86 837.02
(iv) Vehicles and aircrafts 1,059.00 963.65
(v) Office equipment 2,155.49 1,896.15
NOTES ANNEXED TO AND FORMING PART OF THE FINANCIAL STATEMENTS

ANNUAL REPORT 2012-2013 77
Year ended March 31, 2013
Year ended March 31, 2012
` Lakhs ` Lakhs
(vi) Assets given on lease
- Buildings 20.91 18.84
- Plant and Machinery 0.39 -
- Furniture and fittings 11.11 9.65
- Office equipment 5.91 8.02
31,234.70 29,989.03
Less: Transfer from Revaluation reserve [Refer Note 3.2.9 (b) to the Financial Statements] 1,237.00 1,243.18
Total on Tangible assets (A) 29,997.70 28,745.85
B) Intangible assets
(i) Computer software
- Developed 827.35 106.22
- Acquired 1,665.26 1,354.98
(ii) Technical knowhow
- Developed 4,060.05 3,736.27
- Acquired 1,527.99 1,338.00
Total on Intangible assets (B) 8,080.65 6,535.47
Total (A + B) 38,078.35 35,281.32
Note:
Impairment charge included in the above
- In Plant and Machinery 71.51 200.27
2.9 OTHER EXPENSES
(a) Consumption of stores and tools 7,398.31 7,108.62
(b) Power and fuel 8,599.82 7,766.96
(c) Rent 2,994.48 1,377.98
(d) Repairs and maintenance
- Buildings 2,875.20 2,783.76
- Plant and Machinery 11,033.71 9,967.27
(e) Insurance 665.62 748.90
(f) Rates and taxes, excluding taxes on income 974.49 680.06
(g) Selling and administration expenses - net 35,370.17 30,385.19
(h) Service and product warranties 21,368.83 16,482.15
(i) Packing and forwarding charges 30,361.32 23,221.23
(j) Annual Maintenance Contracts 14,181.76 9,592.67
NOTES ANNEXED TO AND FORMING PART OF THE FINANCIAL STATEMENTS

Ashok Leyland Limited78
Year ended March 31, 2013
Year ended March 31, 2012
` Lakhs ` Lakhs
(k) Research and Development 5,682.69 6,943.65
(l) Diminution in value of investments - 26.54
(m) Bad and doubtful debts / advances provided / written-off (Net of recovery) - 218.00
1,41,506.40 1,17,302.98
Less: Expenses capitalised 897.84 703.64
1,40,608.56 1,16,599.34
1. Rent includes amortisation of cost / value of leasehold land ` 522.25 lakhs
(March 2012: ` 518.52 lakhs) as reduced by transfer of ` 334.27 lakhs (March 2012: ` 334.28 lakhs) from Revaluation reserve. [Refer Note 3.2.9 (b)]
187.98 184.24
2. Selling and administration expenses include:
- Director's sitting fees 22.20 20.60
- Commission to Non Whole-time Directors 191.80 287.24
2.10 EXCEPTIONAL ITEMS:
a) Profit on sale of Long-Term Investments
- Indusind Bank Limited 25,238.31 -
- Hinduja Leyland Finance Limited 7,950.00 14,440.00
- Defiance Technologies Limited - 1,576.00
- ICICI Bank Limited 266.71 -
33,455.02 16,016.00
b) (Loss) on sale of Long-Term Investments
- Automotive Coaches and Components Limited (483.10) -
- AVIA Ashok Leyland Motors s.r.o - (14,513.63)
- Ashley Bio Fuel Limited - (749.74)
- Ashley Transport Services Limited - (592.85)
(483.10) (15,856.22)
c) Diminution in the value of Long-Term investments
- Ashley Alteams Limited (2,779.50) -
- Automotive Infotronics Limited (1,119.02) -
- AVIA Ashok Leyland Motors s.r.o (117.79) -
(4,016.31) -
28,955.61 159.78
NOTES ANNEXED TO AND FORMING PART OF THE FINANCIAL STATEMENTS

ANNUAL REPORT 2012-2013 79
NOTES ANNEXED TO AND FORMING PART OF THE FINANCIAL STATEMENTS
2013 2012
3.1 Information regarding Imports (c.i.f) ` Lakhs ` Lakhs
a) Raw materials 40,391.32 44,039.02
b) Trading goods and others 3,339.31 2,151.80
c) Spares and tools 504.24 1,568.08
d) Capital items 28,063.70 18,421.61
72,298.57 66,180.51
3.2. Other Information (including foreign currency transactions)
3.2.1 Expenditure incurred in foreign currency
a) Royalty 199.51 245.00
b) Professional and consultation fees 1,415.30 654.38
c) Interest and commitment charges 9,136.12 7,986.79
d) Commission on sales 10,672.26 15,434.60
e) Research and development 353.25 1,488.93
f) Travel 515.30 485.99
g) Other expenses
- Freight charges 3,654.59 2,914.63
- Product warranty 375.94 851.85
- Others 3,669.93 1,836.44
7,700.46 5,602.92
29,992.20 31,898.61
3.2.2 Dividend remitted in foreign currency *
a) Number of non-resident shareholders 2 2
b) Number of shares on which dividend was remitted
102,84,37,424 51,42,18,712
c) Dividend remitted during the year relating to the previous year
10,284.37 10,284.37
* Dividend paid to other Non-Resident shareholders is in Indian Rupee.
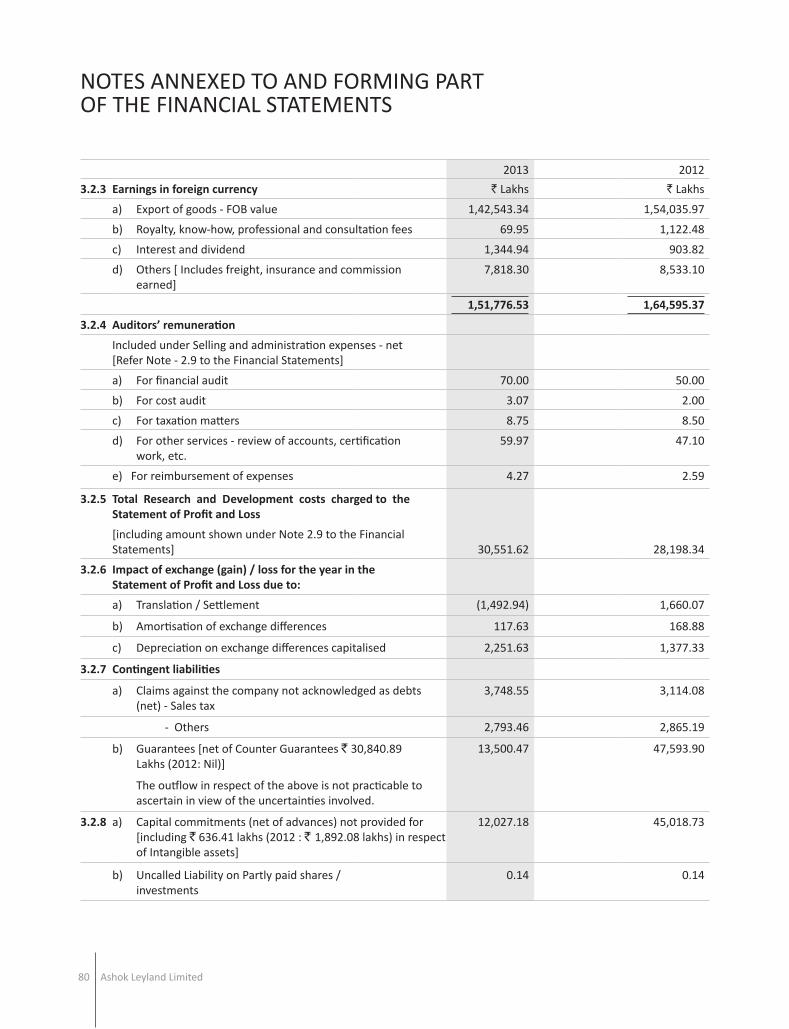
Ashok Leyland Limited80
2013 2012
3.2.3 Earnings in foreign currency ` Lakhs ` Lakhs
a) Export of goods - FOB value 1,42,543.34 1,54,035.97
b) Royalty, know-how, professional and consultation fees 69.95 1,122.48
c) Interest and dividend 1,344.94 903.82
d) Others [ Includes freight, insurance and commission earned]
7,818.30 8,533.10
1,51,776.53 1,64,595.37
3.2.4 Auditors’ remuneration
Included under Selling and administration expenses - net [Refer Note - 2.9 to the Financial Statements]
a) For financial audit 70.00 50.00
b) For cost audit 3.07 2.00
c) For taxation matters 8.75 8.50
d) For other services - review of accounts, certification work, etc.
59.97 47.10
e) For reimbursement of expenses 4.27 2.59
3.2.5 Total Research and Development costs charged to the Statement of Profit and Loss
[including amount shown under Note 2.9 to the Financial Statements] 30,551.62 28,198.34
3.2.6 Impact of exchange (gain) / loss for the year in the Statement of Profit and Loss due to:
a) Translation / Settlement (1,492.94) 1,660.07
b) Amortisation of exchange differences 117.63 168.88
c) Depreciation on exchange differences capitalised 2,251.63 1,377.33
3.2.7 Contingent liabilities
a) Claims against the company not acknowledged as debts (net) - Sales tax
3,748.55 3,114.08
- Others 2,793.46 2,865.19
b) Guarantees [net of Counter Guarantees ` 30,840.89 Lakhs (2012: Nil)]
13,500.47 47,593.90
The outflow in respect of the above is not practicable to ascertain in view of the uncertainties involved.
3.2.8 a) Capital commitments (net of advances) not provided for [including ` 636.41 lakhs (2012 : ` 1,892.08 lakhs) in respect of Intangible assets]
12,027.18 45,018.73
b) uncalled Liability on Partly paid shares / investments
0.14 0.14
NOTES ANNEXED TO AND FORMING PART OF THE FINANCIAL STATEMENTS

ANNUAL REPORT 2012-2013 81
NOTES ANNEXED TO AND FORMING PART OF THE FINANCIAL STATEMENTS
2013 2012
3.2.9 a) useful life of Tangible and Intangible Assets useful life (yrs) useful life (yrs)
(1) useful life lower than that derived from the rates specified in Schedule XIV to the Companies Act, 1956
a) Buildings - Revalued buildings are depreciated over the balance useful life as determined by the valuers.
b) Non-factory service installations
(i) In Customer premises 12 12
(ii) Lease improvements 3 3
c) Plant and Machinery
(i) Assets subject to impairment - revised carrying amount over its remaining useful life
(ii) Windmills 12 12
d) Furniture and fittings 8 8
e) Furniture and fittings - lease improvements 3 3
f) Vehicles
(i) Cars and motorcycles 3 3
(ii) Trucks and buses 5 5
g) Office equipment 8 8
h) Office equipment - Data processing system 5 5
(2) useful life not prescribed in Schedule XIV to the Companies Act, 1956
Intangible assets
a) Computer software
(i) Developed 5 / 10 5 / 10
(ii) Acquired 5 5
b) Technical know-how
(i) Developed 6 6
(ii) Acquired 5 / 6 5 / 6
b) Depreciation for the year computed on assets revalued as on March 31, 2009 over the balance useful life on straight line method includes a net charge of ` 1,571.27 lakhs (2012: ` 1,577.46 lakhs) [` 1,237.00 lakhs (2012: ` 1,243.18 lakhs) in Note 2.8 to the Financial Statements and ` 334.27 lakhs (2012: ` 334.28 lakhs) in Note 2.9 to the Financial Statements respectively] being the excess over the depreciation computed by the method followed by the Company prior to revaluation / period of lease in respect of leasehold land and the same has been transferred from Revaluation Reserve to the Statement of Profit and Loss.
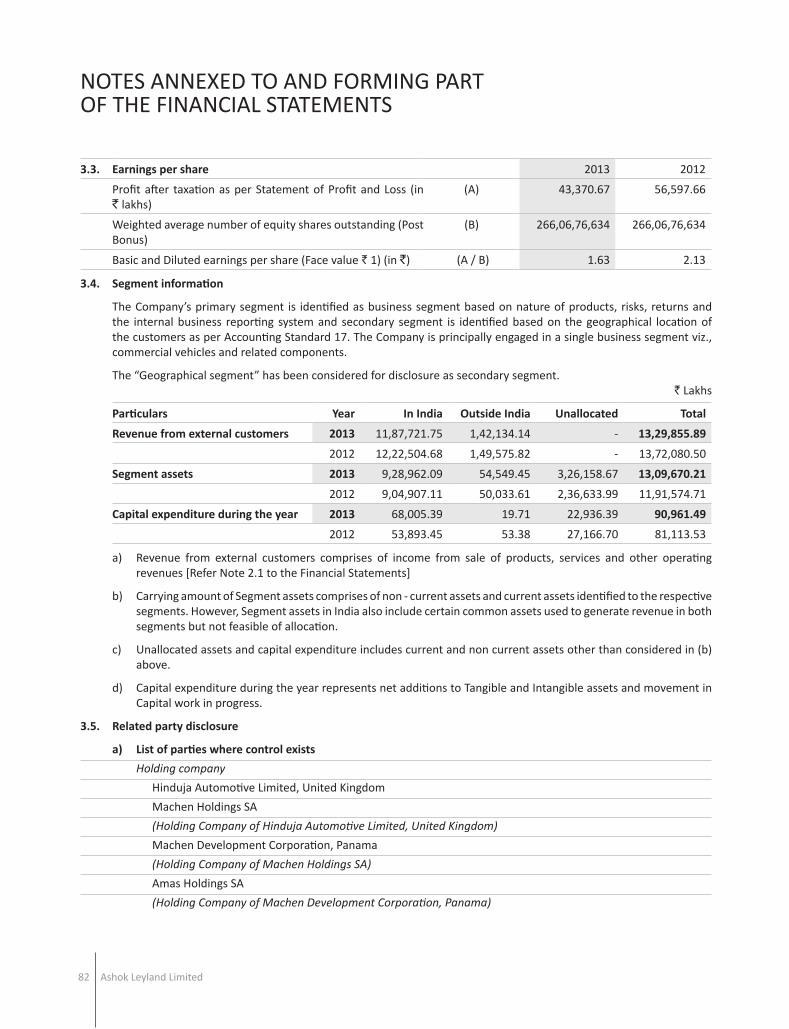
Ashok Leyland Limited82
NOTES ANNEXED TO AND FORMING PART OF THE FINANCIAL STATEMENTS
3.3. Earnings per share 2013 2012
Profit after taxation as per Statement of Profit and Loss (in ` lakhs)
(A) 43,370.67 56,597.66
Weighted average number of equity shares outstanding (Post Bonus)
(B) 266,06,76,634 266,06,76,634
Basic and Diluted earnings per share (Face value ` 1) (in `) (A / B) 1.63 2.13
3.4. Segment information
The Company’s primary segment is identified as business segment based on nature of products, risks, returns and the internal business reporting system and secondary segment is identified based on the geographical location of the customers as per Accounting Standard 17. The Company is principally engaged in a single business segment viz., commercial vehicles and related components.
The “Geographical segment” has been considered for disclosure as secondary segment.` Lakhs
Particulars Year In India Outside India unallocated Total
Revenue from external customers 2013 11,87,721.75 1,42,134.14 - 13,29,855.89
2012 12,22,504.68 1,49,575.82 - 13,72,080.50
Segment assets 2013 9,28,962.09 54,549.45 3,26,158.67 13,09,670.21
2012 9,04,907.11 50,033.61 2,36,633.99 11,91,574.71
Capital expenditure during the year 2013 68,005.39 19.71 22,936.39 90,961.49
2012 53,893.45 53.38 27,166.70 81,113.53
a) Revenue from external customers comprises of income from sale of products, services and other operating revenues [Refer Note 2.1 to the Financial Statements]
b) Carrying amount of Segment assets comprises of non - current assets and current assets identified to the respective segments. However, Segment assets in India also include certain common assets used to generate revenue in both segments but not feasible of allocation.
c) unallocated assets and capital expenditure includes current and non current assets other than considered in (b) above.
d) Capital expenditure during the year represents net additions to Tangible and Intangible assets and movement in Capital work in progress.
3.5. Related party disclosure
a) List of parties where control exists
Holding company
Hinduja Automotive Limited, united Kingdom
Machen Holdings SA
(Holding Company of Hinduja Automotive Limited, United Kingdom)
Machen Development Corporation, Panama
(Holding Company of Machen Holdings SA)
Amas Holdings SA
(Holding Company of Machen Development Corporation, Panama)

ANNUAL REPORT 2012-2013 83
NOTES ANNEXED TO AND FORMING PART OF THE FINANCIAL STATEMENTS
b) Other related parties
Fellow subsidiaries
Hinduja Foundries Limited
Hinduja Auto Components Limited
Hinduja Automotive (uK) Limited
Associates
Albonair GmbH, Germany
Albonair (India) Private Limited
Ashley Airways Limited (under liquidation)
Ashley Aviation Limited………………………………………………………. from November 8, 2012
Ashley Holdings Limited
Ashley Investments Limited
Ashok Leyland Defence Systems Limited
Ashok Leyland (Nigeria) Limited……………………………………………. from March 6, 2013
Ashok Leyland (uAE) LLC, Ras Al Khaimah, uAE
Ashok Leyland (uK) Limited
Automotive Coaches and Components Limited…………………………... upto March 31, 2013
Defiance Technologies Limited
Defiance Testing and Engineering Services, Inc. uSA
Gulf Ashley Motor Limited
Irizar TVS Limited
Lanka Ashok Leyland, PLC
Mangalam Retail Services Limited
Optare plc, uK
Joint Ventures
Ashley Alteams India Limited
Automotive Infotronics Limited
Ashok Leyland John Deere Construction Equipment Company Private Limited
Ashok Leyland Nissan Vehicles Limited
Nissan Ashok Leyland Powertrain Limited
Nissan Ashok Leyland Technologies Limited
Key management personnel
Mr. R Seshasayee, Executive Vice Chairman
Mr. Vinod K Dasari, Managing Director

Ashok Leyland Limited84
NOTES ANNEXED TO AND FORMING PART OF THE FINANCIAL STATEMENTS
3.5
Rela
ted
Part
y di
sclo
sure
- …
.. Co
ntinu
ed
c) R
elat
ed P
arty
Tra
nsac
tions
- su
mm
ary
` L
akhs
Fello
w S
ubsid
iary
*As
soci
ates
Join
t Ven
ture
sHo
ldin
g Co
mpa
ny #
Key
Man
agem
ent
Pers
onne
lTo
tal
2013
2012
2013
2012
2013
2012
2013
2012
2013
2012
2013
2012
Tran
sacti
ons d
urin
g th
e ye
ar e
nded
Mar
ch 3
1
1Pu
rcha
se o
f raw
mat
eria
ls,co
mpo
nent
s and
tr
aded
goo
ds (
net o
f CEN
VAT
/ VAT
) 2
0,33
9.09
2
3,26
9.23
1
2,96
5.47
2
0,99
1.61
8
9,21
3.96
2
1,39
6.04
-
- -
- 1
,22,
518.
52
65,
656.
88
2Sa
les a
nd S
ervi
ces (
net
of e
xcise
duti
es )
- 1
0.45
7
5,06
2.51
1
,14,
224.
43
3,6
97.2
4 1
,859
.59
- -
- -
78,
759.
75
1,1
6,09
4.47
3O
ther
Ope
ratin
g In
com
e 6
52.1
2 1
,068
.92
0.2
9 -
14,
581.
17
3,2
81.0
2 -
- -
- 1
5,23
3.58
4
,349
.94
4O
ther
exp
endi
ture
incu
rred
/ (r
ecov
ered
) 1
17.6
1 2
3.95
1
,954
.64
2,3
38.1
9 1
,773
.85
279
.23
175
.23
139
.71
- -
4,0
21.3
3 2
,781
.08
5Ad
vanc
e / C
urre
nt a
ccou
nts -
Net
incr
ease
/ ( d
ecre
ase)
- -
813
.03
(513
.02)
437
.09
20.
87
- -
(0.0
5) (0
.44)
1,2
50.0
7 (4
92.5
9)
6In
tere
st a
nd o
ther
inco
me
- -
1,2
10.6
2 9
76.1
3 6
52.6
5 5
7.64
-
- -
- 1
,863
.27
1,0
33.7
7
7In
tere
st e
xpen
se -
- -
97.
11
- -
- -
- -
- 9
7.11
8Sa
le o
f ass
ets
- -
- -
- 1
1.60
-
- -
- -
11.
60
9Pu
rcha
se o
f ass
ets
- -
- 7
2.28
-
- -
- -
- -
72.
28
10Di
vide
nd in
com
e -
- 2
51.9
4 1
34.1
9 -
- -
- -
- 2
51.9
4 1
34.1
9
11Di
vide
nd p
aym
ents
- -
- -
- -
10,
272.
37
10,
272.
37
0.8
2 0
.82
10,
273.
19
10,
273.
19
12Re
mun
erati
on to
key
man
agem
ent p
erso
nnel
-
- -
- -
- -
- 6
25.0
3 5
69.3
9 6
25.0
3 5
69.3
9
13Fi
nanc
ial g
uara
ntee
s giv
en -
- 4
87.0
6 1
0,20
5.70
-
- -
- -
- 4
87.0
6 1
0,20
5.70
14Co
unte
r gua
rant
ees r
ecei
ved
- -
30,
840.
89
- -
- -
- -
- 3
0,84
0.89
-
15Ac
quisi
tion
of in
vest
men
ts 3
0,00
0.00
-
34,
149.
88
41,
417.
69
9,8
55.0
0 8
,083
.00
- -
- -
74,
004.
88
49,
500.
69
16Di
spos
al o
f inv
estm
ents
- -
10,
600.
00
24,
202.
52
- -
- -
- -
10,
600.
00
24,
202.
52
17Ad
vanc
e gi
ven
for s
hare
cap
ital
- -
- -
3,1
90.0
0 -
- -
- -
3,1
90.0
0 -
18Lo
ans g
iven
- -
10,
662.
69
22,
621.
12
- -
- -
- -
10,
662.
69
22,
621.
12
19Lo
ans r
epai
d -
- 1
0,59
1.99
1
5,78
3.94
-
- -
- -
- 1
0,59
1.99
1
5,78
3.94
Bala
nces
as o
n M
arch
31
1De
btor
s -
11.
98
19,
343.
14
24,
559.
08
1,7
97.9
6 1
,775
.25
- -
- -
21,
141.
10
26,
346.
31
2Lo
ans a
nd a
dvan
ces (
incl
udin
g in
tere
st
accr
ued)
**
- 2
,375
.92
24,
726.
08
23,
405.
34
296
.15
711
.21
0.7
8 -
0.1
1 0
.16
25,
023.
12
26,
492.
63
3Ad
vanc
e fo
r Sha
re C
apita
l **
- -
0.2
0 3
.06
3,1
90.0
0 -
- -
- -
3,1
90.2
0 3
.06
4Cr
edito
rs fo
r mat
eria
ls an
d ex
pens
es 3
,239
.06
1,0
22.6
4 2
,273
.44
2,9
97.9
3 7
,033
.13
4,1
82.8
7 1
75.2
3 9
7.52
1
67.6
7 1
76.9
9 1
2,88
8.53
8
,477
.95
5Fi
nanc
ial g
uara
ntee
s giv
en
- for
wor
king
cap
ital (
max
imum
lim
it GB
P 2.
36 m
illio
n) -
- 2
,328
.52
991
.53
- -
- -
- -
2,3
28.5
2 9
91.5
3
- oth
ers
3,6
19.0
0 6
,783
.33
12,
617.
84
14,
284.
17
2,7
79.8
0 2
,714
.70
- -
- -
19,
016.
64
23,
782.
20
6Co
unte
r gua
rant
ees r
ecei
ved
- -
30,
840.
89
- -
- -
- -
- 3
0,84
0.89
-
* re
late
s to
Hind
uja
Foun
drie
s Lim
ited
# re
late
s to
Hind
uja
Auto
moti
ve L
imite
d**
Ref
er N
otes
1.1
4, 1
.19
and
1.20
to th
e Fi
nanc
ial S
tate
men
ts

ANNUAL REPORT 2012-2013 85
NOTES ANNEXED TO AND FORMING PART OF THE FINANCIAL STATEMENTS
` Lakhs
Category 2013 2012
d) Significant Related Party Transactions
1 Purchase of raw materials, components and traded goods (net of CENVAT / VAT)
Automotive Coaches and Components Limited Associate 2,290.27 6,814.78
Irizar TVS Limited Associate 10,195.11 12,994.67
Ashley Alteams India Limited Joint Venture 3,783.91 3,445.39
Ashok Leyland Nissan Vehicles Limited Joint Venture 84,905.40 17,420.63
2 Sales and Services (net of taxes)
Ashok Leyland (uAE) LLC Associate 24,541.54 16,057.21
Gulf Ashley Motor Limited Associate 20,885.82 21,156.28
Lanka Ashok Leyland, PLC Associate 29,177.13 73,095.20
Ashok Leyland Nissan Vehicles Limited Joint Venture 2,447.49 705.13
Ashok Leyland John Deere Construction Equipment Company Private Limited
Joint Venture 1,249.75 499.02
Ashley Alteams India Limited Joint Venture - 232.83
Nissan Ashok Leyland Technologies Limited Joint Venture - 323.27
3 Other Operating Income
Defiance Technologies Limited Associate 0.29 -
Ashok Leyland Nissan Vehicles Limited Joint Venture 10,875.71 2,516.24
Nissan Ashok Leyland Powertrain Limited Joint Venture 3,292.25 764.78
4 Other Expenditure incurred / (recovered)
Defiance Technologies Limited Associate 1,637.18 1,174.49
Defiance Testing & Engineering Services Inc., uSA Associate 13.70 640.54
Gulf Ashley Motor Limited Associate 269.60 162.08
Ashok Leyland John Deere Construction Equipment Company Private Limited
Joint Venture - (40.90)
Ashok Leyland Nissan Vehicles Limited Joint Venture 1,660.83 318.57
5 Advance / Current account - Net increase / (decrease)
Ashok Leyland Defence Systems Limited Associate (180.37) -
Ashok Leyland (uAE) LLC Associate 837.12 -
Automotive Coaches and Components Limited Associate - (499.72)
Irizar -TVS Limited Associate (95.00) (13.30)
Optare plc, uK Associate 100.85 -
Ashok Leyland John Deere Construction Equipment Company Private Limited
Joint Venture 139.69 -
Ashley Alteams India Limited Joint Venture 59.42 -
Automotive Infotronics Limited Joint Venture (53.92) -
Ashok Leyland Nissan Vehicles Limited Joint Venture 235.06 20.87

Ashok Leyland Limited86
` Lakhs
Category 2013 20126 Interest and other income
Albonair GmbH Associate 270.77 107.10 Automotive Coaches and Components Limited Associate - 142.51 Defiance Testing & Engineering Services Inc., uSA Associate 293.87 457.91 Defiance Technologies Limited Associate 140.37 50.09 Optare plc, uK Associate 305.18 22.93 Ashley Alteams India Limited Joint Venture 168.56 0.22 Nissan Ashok Leyland Technologies Limited Joint Venture 477.19 57.41
7 Dividend incomeLanka Ashok Leyland, PLC Associate 251.94 134.19
8 Acquisition of InvestmentsAshley Holdings Limited Associate 15,259.75 17,634.00 Ashley Investments Limited Associate 15,159.75 17,808.00 Optare plc, uK Associate - 817.54 Ashok Leyland Nissan Vehicles Limited Joint Venture 4,655.00 3,822.00 Nissan Ashok Leyland Powertrain Limited Joint Venture - 1,911.00 Ashok Leyland John Deere Construction Equipment Company Private Limited
Joint Venture 4,950.00 1,850.00
9 Disposal of InvestmentsAshley Holdings Limited Associate 5,320.00 11,801.27 Ashley Investments Limited Associate 5,280.00 11,801.27 Gulf Ashley Motor Limited Associate - 599.99
10 Loans given by the CompanyAlbonair GmbH Associate 6,055.57 4,835.70 Defiance Technologies Limited Associate 1,527.00 998.00 Optare plc, uK Associate 3,080.12 3,759.24
11 Loans repaid to the CompanyAshok Leyland (uAE) LLC Associate 3,566.38 2,453.63 Defiance Testing & Engineering Services Inc., uSA Associate 5,564.89 - Optare plc,uK Associate 1,460.71 1,161.58
12 Sale of assetAutomotive Infotronics Limited Joint Venture - 11.60
13 Financial guarantees givenOptare plc, uK Associate 487.06 9,696.95
14 Counter Guarantees receivedAshley Holdings Limited Associate 15,148.54 - Ashley Investments Limited Associate 15,692.35 -
15 Remuneration to key management personnelMr. R Seshasayee Executive Vice
Chairman 345.72 321.05
Mr. Vinod K Dasari Managing Director 279.31 248.34
NOTES ANNEXED TO AND FORMING PART OF THE FINANCIAL STATEMENTS
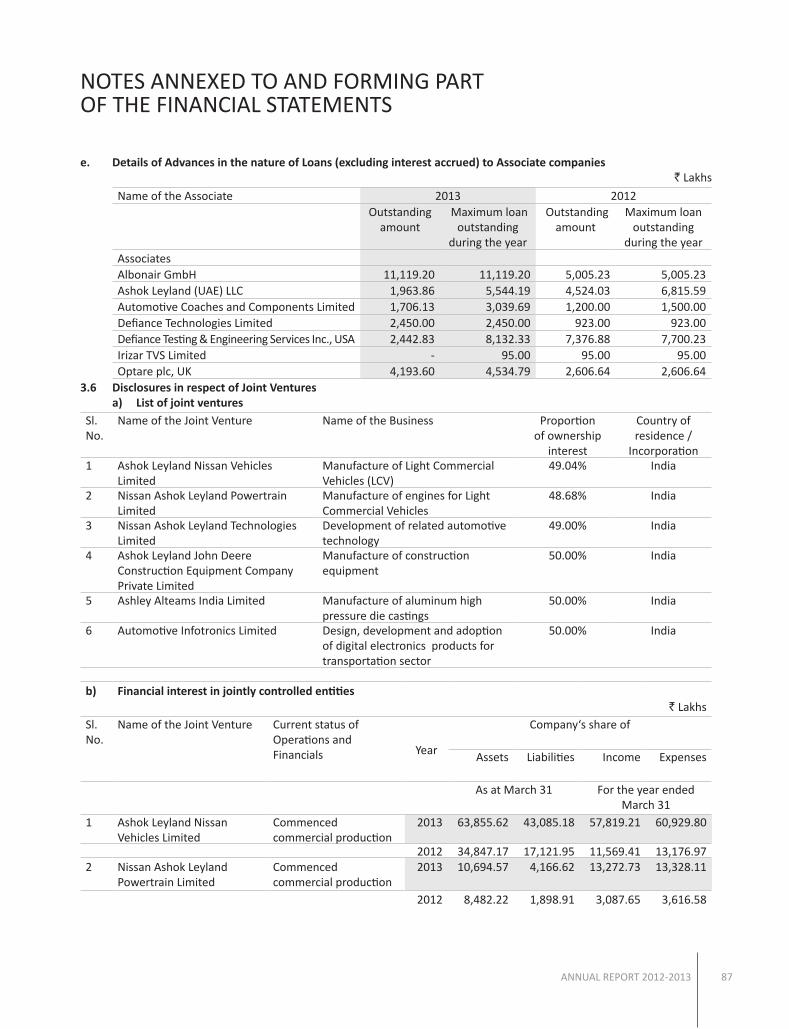
ANNUAL REPORT 2012-2013 87
NOTES ANNEXED TO AND FORMING PART OF THE FINANCIAL STATEMENTS
e. Details of Advances in the nature of Loans (excluding interest accrued) to Associate companies` Lakhs
Name of the Associate 2013 2012Outstanding
amount Maximum loan
outstanding during the year
Outstanding amount
Maximum loan outstanding
during the yearAssociatesAlbonair GmbH 11,119.20 11,119.20 5,005.23 5,005.23 Ashok Leyland (uAE) LLC 1,963.86 5,544.19 4,524.03 6,815.59 Automotive Coaches and Components Limited 1,706.13 3,039.69 1,200.00 1,500.00 Defiance Technologies Limited 2,450.00 2,450.00 923.00 923.00 Defiance Testing & Engineering Services Inc., uSA 2,442.83 8,132.33 7,376.88 7,700.23 Irizar TVS Limited - 95.00 95.00 95.00 Optare plc, uK 4,193.60 4,534.79 2,606.64 2,606.64
3.6 Disclosures in respect of joint Ventures a) List of joint venturesSl. No.
Name of the Joint Venture Name of the Business Proportion of ownership
interest
Country of residence /
Incorporation1 Ashok Leyland Nissan Vehicles
LimitedManufacture of Light Commercial Vehicles (LCV)
49.04% India
2 Nissan Ashok Leyland Powertrain Limited
Manufacture of engines for Light Commercial Vehicles
48.68% India
3 Nissan Ashok Leyland Technologies Limited
Development of related automotive technology
49.00% India
4 Ashok Leyland John Deere Construction Equipment Company Private Limited
Manufacture of construction equipment
50.00% India
5 Ashley Alteams India Limited Manufacture of aluminum high pressure die castings
50.00% India
6 Automotive Infotronics Limited Design, development and adoption of digital electronics products for transportation sector
50.00% India
b) Financial interest in jointly controlled entities` Lakhs
Sl. No.
Name of the Joint Venture Current status of Operations and Financials Year
Company‘s share of
Assets Liabilities Income Expenses
As at March 31 For the year ended March 31
1 Ashok Leyland Nissan Vehicles Limited
Commenced commercial production
2013 63,855.62 43,085.18 57,819.21 60,929.80
2012 34,847.17 17,121.95 11,569.41 13,176.97 2 Nissan Ashok Leyland
Powertrain LimitedCommenced commercial production
2013 10,694.57 4,166.62 13,272.73 13,328.11
2012 8,482.22 1,898.91 3,087.65 3,616.58

Ashok Leyland Limited88
NOTES ANNEXED TO AND FORMING PART OF THE FINANCIAL STATEMENTS
` LakhsSl. No.
Name of the Joint Venture Current status of Operations and Financials
YearCompany‘s share of
Assets Liabilities Income Expenses
As at March 31 For the year ended March 31
3 Nissan Ashok Leyland Technologies Limited
Commenced commercial operation
2013 5,529.71 9,900.20 3,254.35 4,264.51
2012 4,252.40 7,612.72 1,726.01 3,334.34 4 Ashok Leyland John Deere
Construction Equipment Company Private Limited
Commenced commercial production
2013 11,955.97 8,000.63 5,977.98 9,869.66
2012 10,795.63 7,898.62 2,010.17 4,683.43 5 Ashley Alteams India
LimitedOperating company 2013 8,735.93 8,827.14 6,136.83 7,468.72
2012 9,658.76 8,799.37 5,682.49 6,660.64 6 Automotive Infotronics
LimitedOperating company 2013 749.58 294.89 518.60 634.84
2012 905.62 334.02 290.41 526.94
Notes : i) Contingent liabilities, incurred in relation to interest in joint ventures as on March 31, 2013 is ` Nil (2012: ` Nil).ii) Share in contingent liabilities of joint ventures themselves for which the Company is contingently liable as at March 31,
2013 ` 32,943.35 lakhs (2012 : ` 23,068.87 lakhs)iii) Capital commitments in relation to interests in joint ventures as on March 31, 2013 ` Nil (2012: ` Nil)iv) Share in Capital commitments of joint ventures themselves as on March 31, 2013 ` 5,151.15 lakhs (2012: ` 8,701.99
lakhs)v) The information furnished above with regard to the year 2013 is based on unaudited figures made available to the
Company.vi) Figures given above under expenses are excluding taxes.
3.7 The Company has given on finance lease, certain vehicles. The lease is for a fixed period and is terminable with the consent of both the parties. There are no exceptional / restrictive covenants in the lease agreement.
Other financial information relating to the above lease are as under: ` Lakhs
Particulars 2013 2012a) Total of minimum lease payments - Receivable not later than 1 year 1,456.00 805.68 - Receivable later than 1 year and not later than 5 years 1,173.94 1,271.30 - Receivable later than 5 years - - b) unearned Finance income 396.29 440.90 c) Present value of minimum lease payments - Receivable not later than 1 year 1,328.00 680.04 - Receivable later than 1 year and not later than 5 years 904.28 847.74 - Receivable later than 5 years - -d) unguaranteed residual value - - e) Accumulated provision for uncollectible minimum lease payments
receivable - -
f) Contingent rents recognised in Statement of Profit and Loss during the year
- -

ANNUAL REPORT 2012-2013 89
NOTES ANNEXED TO AND FORMING PART OF THE FINANCIAL STATEMENTS
3.8 Derivatives
The Company uses derivative financial instruments such as forward contracts, currency swap to hedge certain currency exposures, present and anticipated, denominated mostly in uS dollars, EuRO, Japanese YEN and Great Britain Pounds. Generally such contracts are taken for exposures materialising in the next twelve months. The Company actively manages its currency / interest rate exposures through a centralized treasury division and uses derivatives to mitigate the risk from such exposures. The use of derivative instruments is subject to limits and regular monitoring by appropriate levels of management. The limits and monitoring systems are periodically reviewed by management and the Board. The market risk on derivatives is mitigated by changes in the valuation of underlying assets, liabilities or transactions, as derivatives are used only for risk management.
The information on derivative instrument is as follows:
A) Derivative instruments outstanding: In. Million
Details Details Currency Amount in foreign currency
2013 2012
Foreign Exchange Contracts
- uSD / INR Sold $ 111.34 138.10
- uSD / INR Bought $ 170.33 116.55
- EuR / uSD Bought € 1.80 2.08
- GBP / uSD Bought £ 1.74 -
- EuRO / uSD Sold € 10.00 1.00
- uSD / JPY Sold $ 1.01 2.17
Currency Swaps
- uSD / JPY Bought $ 298.33 320.00 Refer Item no. 6.4 in significant accounting policies for the accounting treatment of such derivatives
B) Foreign currency exposures not hedged by a derivative instrument
Details Currency Amount (Foreign currency in Million)
Amount ` in Lakhs
2013 2012 2013 2012
Amount receivable on account of sale of goods, loans, deposits, etc.
$ 66.74 116.70 36,229.48 59,370.46
€ 6.50 7.46 4,516.03 5,062.38
£ 5.21 3.22 4,282.72 2,621.89
Amount payable on account of purchase of goods, loans, interest etc.
$ 290.31 371.73 1,57,592.71 1,89,115.75
€ 5.30 10.86 3,686.20 7,370.43
¥ 98.59 1,242.62 568.69 7,699.58
£ 2.43 3.28 1,998.11 2,672.66
CHF - 0.02 - 11.33
SGD 0.09 - 41.26 -

Ashok Leyland Limited90
NOTES ANNEXED TO AND FORMING PART OF THE FINANCIAL STATEMENTS
3.9 Accounting for long term monetary items in foreign currency, forward contracts and advances designated as cash flow hedge.
3.9.1 Exchange difference in Long term monetary items in foreign currency
Exchange difference on translation or settlement of long term foreign currency monetary items at rates different from those at which they were initially recorded or April 1, 2007, in so far as it relates to acquisition of depreciable assets are adjusted to the cost of the assets. In other cases, such exchange differences are accumulated in “Foreign currency monetary item translation difference account” and amortised by recognition as income or expense in each year over the balance term till settlement occurs but not beyond March 31, 2020 (notified earlier as March 31, 2011). The un-amortized net exchange difference in respect of long term monetary items relating to other than acquisition of depreciable assets, is a loss of ` 96.35 lakhs as at March 31, 2013 (March 31, 2012: Net gain of ` 415.27 lakhs). These amounts have now been reflected as part of the “Reserves and Surplus” in line with the guideline issued by the Institute of Chartered Accountants of India.
3.9.2 Forward contracts and advances designated as cash flow hedges
The Company had adopted the principles of Accounting Standard 30 – Financial instruments: Recognition and measurement, issued by the Institute of Chartered Accountants of India, with effect from April 1, 2008, in respect of forward contracts for firm commitments and highly probable forecast transactions meeting necessary criteria for designation as “Cash flow hedges”. The gains and losses on effective Cash flow hedges are recognized in Hedge Reserve Account till the underlying forecast transaction occurs.
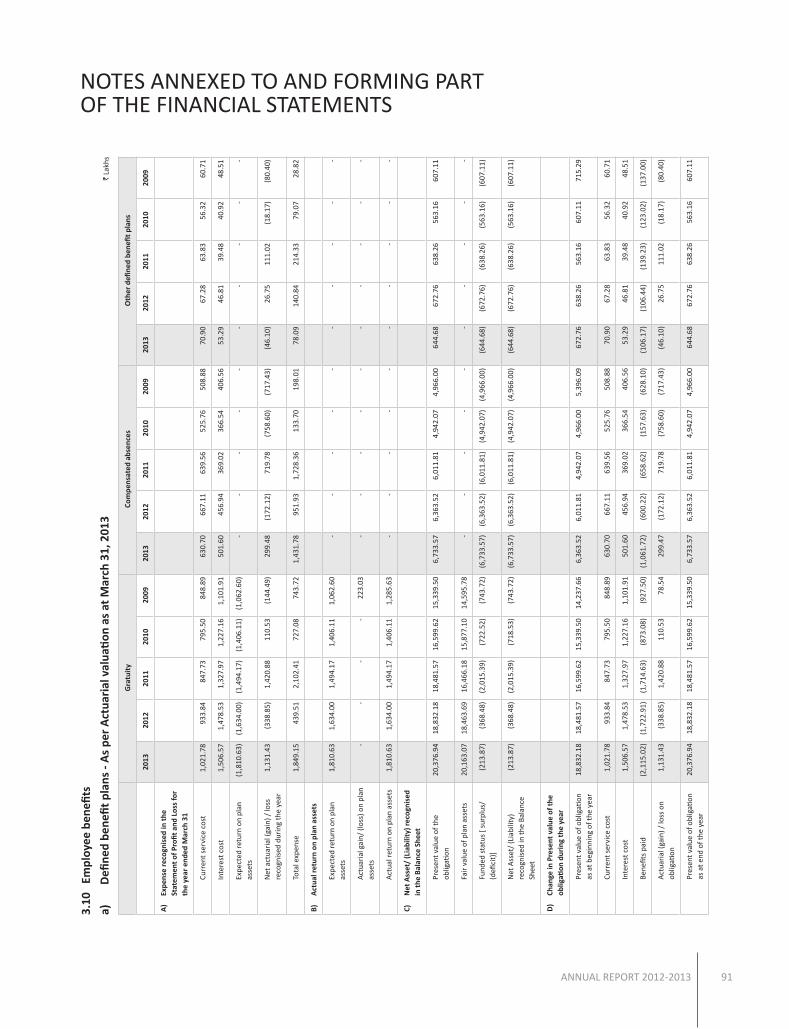
ANNUAL REPORT 2012-2013 91
NOTES ANNEXED TO AND FORMING PART OF THE FINANCIAL STATEMENTS
3.10
Em
ploy
ee b
enefi
ts
a)
D
efine
d be
nefit
pla
ns -
As
per
Act
uari
al v
alua
tion
as
at M
arch
31,
201
3
` La
khs
Gra
tuit
y C
ompe
nsat
ed a
bsen
ces
Oth
er d
efine
d be
nefit
pla
ns
2013
2012
2011
2010
2009
2013
2012
2011
2010
2009
2013
2012
2011
2010
2009
A)
Expe
nse
reco
gnis
ed in
the
Stat
emen
t of P
rofit
and
Los
s fo
r th
e ye
ar e
nded
Mar
ch 3
1
Curr
ent s
ervi
ce c
ost
1,0
21.7
8 9
33.8
4 8
47.7
3 7
95.5
0 8
48.8
9 6
30.7
0 6
67.1
1 6
39.5
6 5
25.7
6 5
08.8
8 7
0.90
6
7.28
6
3.83
5
6.32
6
0.71
Inte
rest
cos
t 1
,506
.57
1,4
78.5
3 1
,327
.97
1,2
27.1
6 1
,101
.91
501
.60
456
.94
369
.02
366
.54
406
.56
53.
29
46.
81
39.
48
40.
92
48.
51
Expe
cted
retu
rn o
n pl
an
asse
ts (1
,810
.63)
(1,6
34.0
0) (1
,494
.17)
(1,4
06.1
1) (1
,062
.60)
- -
- -
- -
- -
- -
Net
act
uari
al (g
ain)
/ lo
ss
reco
gnis
ed d
urin
g th
e ye
ar 1
,131
.43
(338
.85)
1,4
20.8
8 1
10.5
3 (1
44.4
9) 2
99.4
8 (1
72.1
2) 7
19.7
8 (7
58.6
0) (7
17.4
3) (4
6.10
) 2
6.75
1
11.0
2 (1
8.17
) (8
0.40
)
Tota
l exp
ense
1,8
49.1
5 4
39.5
1 2
,102
.41
727
.08
743
.72
1,4
31.7
8 9
51.9
3 1
,728
.36
133
.70
198
.01
78.
09
140
.84
214
.33
79.
07
28.
82
B)
Act
ual r
etur
n on
pla
n as
sets
Expe
cted
retu
rn o
n pl
an
asse
ts 1
,810
.63
1,6
34.0
0 1
,494
.17
1,4
06.1
1 1
,062
.60
- -
- -
- -
- -
- -
Act
uari
al g
ain/
(los
s) o
n pl
an
asse
ts -
- -
- 2
23.0
3 -
- -
- -
- -
- -
-
Act
ual r
etur
n on
pla
n as
sets
1,8
10.6
3 1
,634
.00
1,4
94.1
7 1
,406
.11
1,2
85.6
3 -
- -
- -
- -
- -
-
C)
Net
Ass
et/
(Lia
bilit
y) re
cogn
ised
in
the
Bal
ance
She
et
Pres
ent v
alue
of t
he
oblig
ation
20,
376.
94
18,
832.
18
18,
481.
57
16,
599.
62
15,
339.
50
6,7
33.5
7 6
,363
.52
6,0
11.8
1 4
,942
.07
4,9
66.0
0 6
44.6
8 6
72.7
6 6
38.2
6 5
63.1
6 6
07.1
1
Fair
val
ue o
f pla
n as
sets
20,
163.
07
18,
463.
69
16,
466.
18
15,
877.
10
14,
595.
78
- -
- -
- -
- -
- -
Fund
ed s
tatu
s [ s
urpl
us/
(defi
cit)
] (2
13.8
7) (3
68.4
8) (2
,015
.39)
(722
.52)
(743
.72)
(6,7
33.5
7) (6
,363
.52)
(6,0
11.8
1) (4
,942
.07)
(4,9
66.0
0) (6
44.6
8) (6
72.7
6) (6
38.2
6) (5
63.1
6) (6
07.1
1)
Net
Ass
et/
(Lia
bilit
y)
reco
gnis
ed in
the
Bala
nce
Shee
t
(213
.87)
(368
.48)
(2,0
15.3
9) (7
18.5
3) (7
43.7
2) (6
,733
.57)
(6,3
63.5
2) (6
,011
.81)
(4,9
42.0
7) (4
,966
.00)
(644
.68)
(6
72.7
6) (6
38.2
6) (5
63.1
6) (6
07.1
1)
D)
Chan
ge in
Pre
sent
val
ue o
f the
ob
ligati
on d
urin
g th
e ye
ar
Pres
ent v
alue
of o
blig
ation
as
at b
egin
ning
of t
he y
ear
18,
832.
18
18,
481.
57
16,
599.
62
15,
339.
50
14,
237.
66
6,3
63.5
2 6
,011
.81
4,9
42.0
7 4
,966
.00
5,3
96.0
9 6
72.7
6 6
38.2
6 5
63.1
6 6
07.1
1 7
15.2
9
Curr
ent s
ervi
ce c
ost
1
,021
.78
933
.84
847
.73
795
.50
848
.89
630
.70
667
.11
639
.56
525
.76
508
.88
70.
90
67.
28
63.
83
56.
32
60.
71
Inte
rest
cos
t
1,5
06.5
7 1
,478
.53
1,3
27.9
7 1
,227
.16
1,1
01.9
1 5
01.6
0 4
56.9
4 3
69.0
2 3
66.5
4 4
06.5
6 5
3.29
4
6.81
3
9.48
4
0.92
4
8.51
Bene
fits
paid
(2,1
15.0
2) (1
,722
.91)
(1,7
14.6
3) (8
73.0
8) (9
27.5
0) (1
,061
.72)
(600
.22)
(658
.62)
(157
.63)
(628
.10)
(106
.17)
(106
.44)
(139
.23)
(123
.02)
(137
.00)
Act
uari
al (g
ain)
/ lo
ss o
n ob
ligati
on
1
,131
.43
(338
.85)
1,4
20.8
8 1
10.5
3 7
8.54
2
99.4
7 (1
72.1
2) 7
19.7
8 (7
58.6
0) (7
17.4
3) (4
6.10
) 2
6.75
1
11.0
2 (1
8.17
) (8
0.40
)
Pres
ent v
alue
of o
blig
ation
as
at e
nd o
f the
yea
r 2
0,37
6.94
1
8,83
2.18
1
8,48
1.57
1
6,59
9.62
1
5,33
9.50
6
,733
.57
6,3
63.5
2 6
,011
.81
4,9
42.0
7 4
,966
.00
644
.68
672
.76
638
.26
563
.16
607
.11

Ashok Leyland Limited92
NOTES ANNEXED TO AND FORMING PART OF THE FINANCIAL STATEMENTS
Gra
tuit
y C
ompe
nsat
ed a
bsen
ces
Oth
er d
efine
d be
nefit
pla
ns
2013
2012
2011
2010
2009
2013
2012
2011
2010
2009
2013
2012
2011
2010
2009
E)
Chan
ge in
Ass
ets
duri
ng th
e ye
ar
Fair
val
ue o
f pla
n as
sets
as
at
begi
nnin
g of
the
year
18,
463.
69
16,
466.
18
15,
877.
10
14,
595.
56
13,
253.
45
- -
- -
- -
- -
- -
Expe
cted
retu
rn o
n pl
an
asse
ts
1
,810
.63
1,6
34.0
1 1
,494
.17
1,4
06.1
1 1
,062
.60
- -
- -
- -
- -
- -
Cont
ribu
tions
2,0
03.7
6 2
,086
.42
809
.53
748
.51
983
.98
1,0
61.7
2 6
00.2
2 6
58.6
2 1
57.6
3 -
106
.17
106
.44
139
.23
123
.02
-
Bene
fits
paid
(2,1
15.0
2) (1
,722
.91)
(1,7
14.6
3) (8
73.0
8) (9
27.5
0) (1
,061
.72)
(600
.22)
(658
.62)
(157
.63)
- (1
06.1
7) (1
06.4
4) (1
39.2
3) (1
23.0
2) -
Act
uari
al g
ain
/ (lo
ss) o
n pl
an
asse
ts
-
- -
- 2
23.0
3 -
- -
- -
- -
- -
-
Fair
val
ue o
f pla
n as
sets
as
at
end
of th
e ye
ar 2
0,16
3.07
1
8,46
3.69
1
6,46
6.18
1
5,87
7.10
1
4,59
5.56
-
- -
- -
- -
- -
-
F)
Expe
rien
ce a
djus
tmen
ts in
Plan
liab
ilitie
s - l
oss
/ (g
ain)
1,1
31.4
3 (3
38.8
5) 1
,420
.88
110
.53
78.
54
(475
.60)
(628
.16)
719
.78
(181
.28)
(717
.43)
(8.6
2) (6
.89)
111
.02
(3.7
3) (9
5.57
)
Plan
ass
ets
- (lo
ss) /
gai
n -
- -
- 2
23.0
3 -
- -
- -
- -
- -
-
G)
Maj
or c
ateg
orie
s of
pla
n as
sets
as
a p
erce
ntag
e of
tota
l pla
n10
0% Q
ualif
ying
insu
ranc
e po
licy
unf
unde
d u
nfun
ded
H)
Act
uari
al A
ssum
ption
s20
1320
1220
1120
1020
09
Dis
coun
t rat
e8.
0%8.
0%8.
0%8.
0%8.
0%
Sala
ry e
scal
ation
3.
2%4.
25%
4.0%
5.1%
5.7%
Expe
cted
rate
of r
etur
n on
pl
an a
sset
s8.
0%8.
0%8.
0%8.
0%8.
0%
The
estim
ates
of f
utur
e sa
lary
incr
ease
s ha
ve re
ckon
ed in
flatio
n, s
enio
rity
, pro
moti
on a
nd o
ther
rele
vant
fact
ors.
` La
khs

ANNUAL REPORT 2012-2013 93
NOTES ANNEXED TO AND FORMING PART OF THE FINANCIAL STATEMENTS
b) Gratuity is administered through Group gratuity scheme with Life Insurance Corporation of India. The expected return on plan assets is based on market expectation at the beginning of the year, for the returns over the entire life of the related obligation.
c) During the year, the Company has recognised the following amounts in the Statement of Profit and Loss in Note 2.6 to the Financial Statements
- Salaries and wages include compensated absences ` 1,591.33 lakhs (2012: ` 951.93 lakhs).
- Contribution to provident, gratuity and other funds include Provident fund and family pension ` 4,647.48 lakhs (2012: ` 4,175.98 lakhs), superannuation ` 1,466.89 lakhs (2012: ` 1,263.40 lakhs), gratuity ` 2,024.50 lakhs (2012: ` 2,002.48 lakhs) and other funds ` 1,022.73 lakhs (2012: ` 1,279.50 lakhs).
- Welfare expenses include contribution to employee state insurance plan ` 65.56 lakhs (2012: ` 76.28 lakhs), retirement benefits charged / (reversed) of ` 56.05 lakhs (2012: ` (22.09 lakhs)) and other defined employee benefits ` 12.09 lakhs (2012: ` 100.39 lakhs).
3.11 The information required to be disclosed under the Micro, Small and Medium Enterprises Development Act, 2006 has been determined on the basis of information available with the Company. The amount of principal and interest outstanding during 2012 - 13 is given below:
` lakhs
Particulars 2013 2012
i) Principal Amount paid after appointed date during the year 265.57 5,095.20
ii) Amount of interest due and payable for the delayed payment of Principal amount
64.93 33.97
iii) Principal amount remaining unpaid as at year end (over due) 10.27 715.35
iv) Principal amount remaining unpaid as at year end (not due) 215.90 8,051.91
v) Interest due and payable on principal amount unpaid at the year end 0.74 28.27
vi) Total amount of interest accrued and unpaid as at year end 65.67 62.24

Ashok Leyland Limited94
NOTES ANNEXED TO AND FORMING PART OF THE FINANCIAL STATEMENTS
3.12 Details of expenditure incurred on in-house Research and Development (R & D) facilities:
` lakhs
Approved R&D facilities
R&D facility - approval applied for
Total
Particulars Included in Notes to
the Financial Statements
2013 2012 2013 2012 2013 2012
(i) Capital expenditure
(a) Land
1.11 and 1.12
- 71.63 - - - 71.63
(b) Buildings 1,006.13 1,777.23 - - 1,006.13 1,777.23
1,006.13 1,848.86 - - 1,006.13 1,848.86
(c) Capital equipments 6,536.03 13,808.27 58.47 - 6,594.50 13,808.27
(ii) Revenue expenditure (net)
(a) Salaries / Wages 2.6 11,470.75 10,867.35 470.47 - 11,941.22 10,867.35
(b) Material /Consumables /spares
2.3
5,834.70 7,469.88 139.18 - 5,973.88 7,469.88
(c) utilities 2.9 827.64 514.44 15.47 - 843.11 514.44
(d) Other expenditure directly related to R&D
2.9
5,328.31 3,650.56 416.57 - 5,744.88 3,650.56
(e) Total revenue expenditure (Total of (ii) (a) to (ii) (d)) 23,461.40 22,502.23 1,041.69 - 24,503.09 22,502.23
(iii) Total R&D expenditure
(Total of (i) (c) and (ii) (e)) 29,997.43 36,310.50 1,100.16 - 31,097.59 36,310.50
(iv) Less: Amount received by R & D facilities
2.1 and 2.9 711.42 807.50 - - 711.42 807.50
(v) Net amount of R & D expenditure (iii) - (iv) 29,286.01 35,503.00 1,100.16 - 30,386.17 35,503.00
2013 2012
3.13 Net Current tax expense for the year comprises of:
Minimum Alternate Tax 10,819.00 14,030.00
Less: Minimum Alternate Tax Credit Entitlement 10,819.00 6,278.00
Current Tax - 7,752.00

ANNUAL REPORT 2012-2013 95
NOTES ANNEXED TO AND FORMING PART OF THE FINANCIAL STATEMENTS
3.14 Details of Long Term Borrowings:
March 31, 2013 March 31, 2012
Non Current
Current maturities
Total Particulars of Redemption/ Repayment
Non Current
Current maturities
Total
` Lakhs ` Lakhs ` Lakhs ` Lakhs ` Lakhs ` Lakhs
a. Secured Loans:
i. Debenture Series
10.15% AL 20 15,000.00 - 15,000.00 December 28, 2017 - - -
10.20% AL 18 10,000.00 - 10,000.00 June 28, 2017 - - -
10.25% AL16 15,000.00 - 15,000.00 ` 6,000 lakhs on October 14, 2016 and ` 4,500 lakhs each on October 14, 2015 and 2014
15,000.00 - 15,000.00
10.05% AL 19 15,000.00 - 15,000.00 December 28, 2015 - - -
8.20% AL 15 7,000.00 - 7,000.00 July 22, 2015 7,000.00 - 7,000.00
10.10% AL 17 20,000.00 - 20,000.00 June 28, 2015 - - -
8.20% AL 14 7,000.00 - 7,000.00 July 22, 2014 7,000.00 - 7,000.00
8.20% AL 13 - 7,000.00 7,000.00 July 22, 2013 7,000.00 - 7,000.00
89,000.00 7,000.00 96,000.00 36,000.00 - 36,000.00
ii. Term Loans:
TL - 1 6,666.67 3,333.33 10,000.00 3 equal instalments on February 5, 2016, February 16, 2015, February 17 2014.
10,000.00 - 10,000.00
TL - 2 10,000.00 5,000.00 15,000.00 3 equal instalments on June 1, 2015, 2014, 2013
15,000.00 - 15,000.00
TL - 3 6,666.66 6,666.67 13,333.33 3 equal instalments on March 22, 2015, 2014, 2013
13,333.33 6,666.67 20,000.00
TL - 4 5,000.00 5,000.00 10,000.00 3 equal instalments on November 30, 2014, 2013, 2012
10,000.00 5,000.00 15,000.00
TL - 5 5,000.00 5,000.00 10,000.00 3 equal instalments on November 30, 2014, 2013, 2012
10,000.00 5,000.00 15,000.00
TL - 6 - 1,666.67 1,666.67 3 equal instalments on September 4, 2013, 2012, 2011
1,666.67 1,666.67 3,333.34
33,333.33 26,666.67 60,000.00 60,000.00 18,333.34 78,333.34
Debentures and term loans from banks aggregating ` 1,56,000.00 lakhs (2012: ` 1,14,333.34 lakhs) are secured by a first charge on pari-passu basis on all assets of the Company excluding certain immovable properties (residential buildings and windmill related assets) and movable fixed assets (such as aircraft and windmill) of the Company.

Ashok Leyland Limited96
March 31, 2013 March 31, 2012
Non Current
Current maturities
Total Particulars of Redemption/ Repayment
Non Current
Current maturities
Total
` Lakhs ` Lakhs ` Lakhs ` Lakhs ` Lakhs ` Lakhs
b. unsecured Loans:
i. ECB Loans
ECB -11
16,285.50 - 16,285.50
3 equal instalments on March 25, 2019, 2018 and 2017 - - -
ECB -1 40,713.75 - 40,713.75
3 equal instalments on June 9, 2018, 2017, 2016 7,631.25 - 7,631.25
ECB -2
13,571.25 - 13,571.25
3 equal instalments on October 24, 2017, 2016, 2015 12,718.75 - 12,718.75
ECB -3
27,142.50 - 27,142.50
September 20, 2017 - ` 11,399.85 lakhs, 2016 - ` 10,314.15 lakhs, 2015 and 2014 - ` 2,714.25 lakhs each 25,437.50 - 25,437.50
ECB -10 10,857.00 - 10,857.00
Repayable on 12th July 2015 - - -
ECB -4 36,190.00 36,190.00 72,380.00
3 equal instalments on June 30, 2014, 2013, 2012 67,833.33 33,916.67 1,01,750.00
ECB -5
- 1,809.50 1,809.50
3 equal instalments on August 24, 2013, 2012 and 2011 1,695.83 1,695.83 3,391.66
ECB -6 - 4,523.75 4,523.75
3 equal instalments on July 10, 2013, 2012 and 2011 4,239.59 4,239.58 8,479.17
ECB -7 - 4,523.75 4,523.75
3 equal instalments on June 18, 2013, 2012 and 2011 4,239.59 4,239.58 8,479.17
ECB -8 - 1,809.50 1,809.50
3 equal instalments on May 10, 2013, 2012 and 2011 1,695.83 1,695.83 3,391.66
ECB -9
- - -
3 equal instalments on March 2, 2013, 2012 and 2011 - 4,239.58 4,239.58
1,44,760.00 48,856.50 1,93,616.50 1,25,491.67 50,027.07 1,75,518.74
NOTES ANNEXED TO AND FORMING PART OF THE FINANCIAL STATEMENTS

ANNUAL REPORT 2012-2013 97
NOTES ANNEXED TO AND FORMING PART OF THE FINANCIAL STATEMENTS
March 31, 2013 March 31, 2012
Non Current
Current maturities
TotalParticulars of Redemption / Repayment
Non Current
Current maturities
Total
` Lakhs ` Lakhs ` Lakhs ` Lakhs ` Lakhs ` Lakhs
ii. Interest free sales tax loans
Programme II 5,596.52 150.88 5,747.40 Varying amounts repayable on a monthly basis ending on March 2027.
5,256.40 186.63 5,443.03
Programme I 118.24 1,317.53 1,435.77 Varying amounts repayable on a monthly basis ending on April 2014.
1,435.77 1,181.74 2,617.51
5,714.76 1,468.41 7,183.17 6,692.17 1,368.37 8,060.54
No. of instalments
Instalment Amount (` Lakhs)
Period
iii. Loans from Financial institution
976.09 1,069.24 2,045.33 12 108.99 Quarterly installments starting from 1st August,2012 to 1st May, 2015.
1,151.27 550.44 1,701.71
16 95.63 Two installments every three months starting from November 30, 2012 to October 31, 2014.
8 78.43 Two installments every three months starting from November 30, 2011 to October 31, 2012.
13 46.78 Two installments every three months starting from April 30, 2010 to October 31, 2011.
The above Term loans, External Commercial Borrowings and Loans from Financial institution carry varying rates of interest with the maximum rate of interest going upto 10.25% (2012: 10.75%) per annum. The weighted average rate of interest of these loans is around 6.5% (2012 : 6%) per annum.
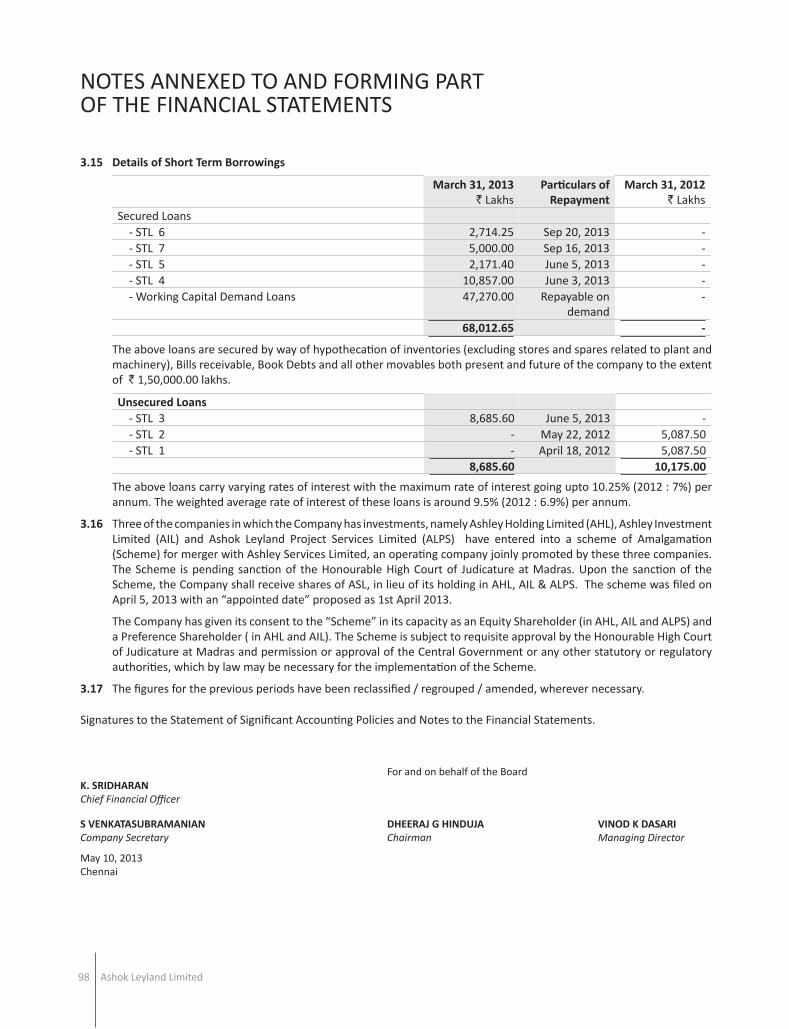
Ashok Leyland Limited98
NOTES ANNEXED TO AND FORMING PART OF THE FINANCIAL STATEMENTS
3.15 Details of Short Term Borrowings
March 31, 2013` Lakhs
Particulars of Repayment
March 31, 2012` Lakhs
Secured Loans - STL 6 2,714.25 Sep 20, 2013 - - STL 7 5,000.00 Sep 16, 2013 - - STL 5 2,171.40 June 5, 2013 - - STL 4 10,857.00 June 3, 2013 - - Working Capital Demand Loans 47,270.00 Repayable on
demand -
68,012.65 -
The above loans are secured by way of hypothecation of inventories (excluding stores and spares related to plant and machinery), Bills receivable, Book Debts and all other movables both present and future of the company to the extent of ` 1,50,000.00 lakhs.
unsecured Loans - STL 3 8,685.60 June 5, 2013 - - STL 2 - May 22, 2012 5,087.50 - STL 1 - April 18, 2012 5,087.50
8,685.60 10,175.00
The above loans carry varying rates of interest with the maximum rate of interest going upto 10.25% (2012 : 7%) per annum. The weighted average rate of interest of these loans is around 9.5% (2012 : 6.9%) per annum.
3.16 Three of the companies in which the Company has investments, namely Ashley Holding Limited (AHL), Ashley Investment Limited (AIL) and Ashok Leyland Project Services Limited (ALPS) have entered into a scheme of Amalgamation (Scheme) for merger with Ashley Services Limited, an operating company joinly promoted by these three companies. The Scheme is pending sanction of the Honourable High Court of Judicature at Madras. upon the sanction of the Scheme, the Company shall receive shares of ASL, in lieu of its holding in AHL, AIL & ALPS. The scheme was filed on April 5, 2013 with an “appointed date” proposed as 1st April 2013.
The Company has given its consent to the “Scheme” in its capacity as an Equity Shareholder (in AHL, AIL and ALPS) and a Preference Shareholder ( in AHL and AIL). The Scheme is subject to requisite approval by the Honourable High Court of Judicature at Madras and permission or approval of the Central Government or any other statutory or regulatory authorities, which by law may be necessary for the implementation of the Scheme.
3.17 The figures for the previous periods have been reclassified / regrouped / amended, wherever necessary.
Signatures to the Statement of Significant Accounting Policies and Notes to the Financial Statements.
For and on behalf of the BoardK. SRIDHARANChief Financial Officer
S VENKATASuBRAMANIANCompany Secretary
DHEERAj G HINDujAChairman
VINOD K DASARIManaging Director
May 10, 2013Chennai

ANNUAL REPORT 2012-2013 99
17318.81
16218.53
17429.98 17236.1817429.56
18762.74
18505.38
19339.9019426.71
19894.98
18861.5418835.77
0
5000
10000
15000
20000
25000Sensex
0
20
40
60
80
Pric
e in
Rup
ees
Num
bers
Apr-12 May-12 Jun-12 Jul-12 Aug-12 Sep-12 Oct-12 Nov-12 Dec-12 Jan-13 Feb-13 Mar-13
28.65 27.90
23.30 22.25
28.70
26.3525.50
22.05
24.20
21.80
32.55
28.70
32.90
23.70
29.00
24.30
26.15
21.15
23.50
20.25
24.85
20.55
25.00
22.90
0
1000
2000
3000
4000
5000
6000
7000
0
20
40
60
80
Apr-12 May-12 Jun-12 Jul-12 Aug-12 Sep-12 Oct-12 Nov-12 Dec-12 Jan-13 Feb-13 Mar-13
33.00
28.70
33.50
23.55
27.75
24.30
26.15
21.05
23.95
20.25
24.90
18.75
24.95
21.85
5248.15
4924.25
5278.90 5229.005258.50
5703.305619.70
5879.855905.10
6034.75
5693.05 5682.55
S&PCNX NIFTY
Pric
e in
Rup
ees
Num
bers
28.65
23.30
29.00
26.30
27.90
22.15
25.50
21.55
24.20
21.60
BSE - April 2012 to March 2013
NSE - April 2012 to March 2013
50.98%
Residents (Individuals / Clearing Members) 10.58%
/Govt. Companies/UTI 12.15%
16.89%
Non-Resident Indians/ OCB / Corporate Bodies - Foreign / 1.03%
Corporate Bodies/ Limited Liability Partnership 6.31%
Mutual Funds 0.93% Trusts 0.02%Banks 0.05%Others - GDR 1.06%
SHAREHOLDING PATTERN AS ON MARCH 31, 2013

NOTES

NOTES

NOTES

NOTES

NOTES


