Annual Report 2016 - NZ Health Partnerships · 2016-11-28 · 8 | © CROWN COPYRIGHT NZ HEALTH...
74
Annual Report 2016 E98
Transcript of Annual Report 2016 - NZ Health Partnerships · 2016-11-28 · 8 | © CROWN COPYRIGHT NZ HEALTH...

Annual Report 2016
E98

2 | © CROWN COPYRIGHT NZ HEALTH PARTNERSHIPS ANNUAL REPORT 2016
Crown copyright © 2016
This copyright work is licensed under the Creative Commons Attribution-Non Commercial-No Derivatives
4.0 International licence. In essence, you are free to copy and distribute the work (including in other media
and formats) for non-commercial purposes, as long as you attribute the work to NZ Health Partnerships,
do not adapt the work and abide by the other licence terms. To view a copy of this licence, visit https://
creativecommons.org/licenses/by-nc-nd/4.0/

3 | © CROWN COPYRIGHT NZ HEALTH PARTNERSHIPS ANNUAL REPORT 2016
ContentsFrom the Chair ........................................................................................................................................ 4
About NZ Health Partnerships
Who We Are ....................................................................................................................................... 7
Our Focus ........................................................................................................................................... 8
Organisational Health .................................................................................................................10
Risk Management .........................................................................................................................12
Board Members .............................................................................................................................13
Statement of Performance
Statement of Responsibility ......................................................................................................16
Our Performance ...........................................................................................................................17
Output Class 1 Programmes .....................................................................................................19
Output Class 2 Services ..............................................................................................................26
Benefits .............................................................................................................................................33
Financial Statements
Statement of Comprehensive Revenue and Expenses ..................................................38
Statement of Financial Position ..............................................................................................39
Statement of Changes in Equity .............................................................................................40
Statement of Cashflows .............................................................................................................41
Notes to Financial Statements .................................................................................................43
Independent Auditor's Report .......................................................................................................69
Directory .................................................................................................................................................72

4 | © CROWN COPYRIGHT NZ HEALTH PARTNERSHIPS ANNUAL REPORT 2016
As a new organisation, in 2015/16 we focused on establishing strong foundations.
Governance structures were embedded and in some cases refreshed. This started with the appointment of
our three independent directors, myself included, who joined the four regionally appointed DHB Chairs as
directors.
We also introduced the NZ Health Partnerships’ Governance Charter across all of our programmes and
services. This included the introduction of DHB Chief Executive Sponsors who have significantly improved
our alignment with key stakeholders. I’d like to thank the Sponsors and many other DHB leaders and subject
matter experts that generously lend their time and expertise to our work.
Megan Main took up the position of Chief Executive in March. Feedback from DHBs has been overwhelmingly
positive, particularly the open style in which Megan engages with stakeholders. Thank you too to Sue Suckling
and Jo Hogan who helped to get the company off to a strong start as interim Chair and Chief Executive
respectively.
In general the Board is pleased to observe a maturing of the relationship between DHBs and NZ Health
Partnerships. In part this is due to NZ Health Partnerships’ early recognition that one-size-fits-all was not
necessarily the best approach for individual DHBs or the collective because of their many differences. The
disestablishment of the Linen and Laundry programme and partial implementation of Food Services are
examples of what we hope is a more flexible approach.
We conducted our first stakeholder engagement survey this year. The results show DHBs and other
stakeholders are starting to see a culture shift in the organisation and areas like communication are
improving. But we have plenty of work left to do. We need to listen more and talk less, improve our reporting
and do it more often, and continue to strengthen relationships with key stakeholders.
Of course, we are also acutely aware of the need to immediately deliver value to our shareholders. That
means ensuring our existing programmes, the National Oracle Solution (NOS) and National Infrastructure
Platform (NIP), are fit for purpose and delivered to the budgets and timeframes provided in our planning
advice.
We have faced some challenges on both fronts due to a combination of legacy issues and vendor
performance. Nonetheless, we continue to focus on solutions so it is pleasing that the build of the core NOS
solution is nearly complete and a consensus is being reached on the best path forward for NIP.
From the Chair

© CROWN COPYRIGHT NZ HEALTH PARTNERSHIPS ANNUAL REPORT 2016 | 5
Delivering value also requires us to tightly manage vendors and commercial contracts on behalf of DHBs
including those for Banking, Insurance and Food Services. Implementing the DHB Procurement Strategy and
ensuring DHBs receive a better return on investment for their procurement dollar is a central focus.
Thank you to our staff, shareholders and other stakeholders for their work, guidance and support in NZ Health
Partnerships’ first year of operations. I’m sure next year we will keep moving forward together.
Peter AndersonChair

6 | © CROWN COPYRIGHT NZ HEALTH PARTNERSHIPS ANNUAL REPORT 2016
PART ONE
About NZ Health Partnerships

© CROWN COPYRIGHT NZ HEALTH PARTNERSHIPS ANNUAL REPORT 2016 | 7
NZ Health Partnerships is part of the New Zealand Health and Disability Sector.
NZ Health Partnerships became operational on
1 July 2015, taking over key areas of work from
Health Benefits Limited (HBL) which ceased
operations on 30 June 2015.
We are a multi-parent Crown-entity subsidiary
that is supported and owned by New Zealand’s 20
District Health Boards (DHBs).
Our Purpose
Established and operated as a co-operative
undertaking, NZ Health Partnerships’ purpose is
to enable DHBs to collectively maximise shared
services opportunities for the national good.
Put another way, our role is to support DHBs
to provide the best possible healthcare to their
communities.
What we do
We are key contributors to the Government’s goals
of having an effective, integrated and innovative
Health and Disability Sector that enables New
Zealanders to live well, stay well and get well.
We collaborate with DHBs as our shareholders,
co-creators and customers. In partnership
we identify, develop, implement and operate
programmes and commercial services for the
sector’s mutual benefit.
With an aging population, increasing cost of new
clinical equipment and rising public demand,
our initiatives are focused on creating financial
efficiencies for DHBs.
By thinking, acting and investing collaboratively
DHBs are able to achieve greater benefits than they
would by operating independently.
However, what we do is about more than cost
reduction. While the company’s primary focus is on
administrative, support and procurement activities,
most of our work has direct or indirect clinical
implications.
Ultimately, patient outcomes are at the heart of the
company and our operations.
Who We Are

8 | © CROWN COPYRIGHT NZ HEALTH PARTNERSHIPS ANNUAL REPORT 2016
On 1 July 2015 NZ Health Partnerships took over
four programmes and three services from HBL.
Programmes
• National Oracle Solution (NOS)
• National Infrastructure Platform (NIP)
• Food Services
• Linen and Laundry.
Services
• National Procurement Service
• Shared Banking
• Collective Insurance.
Doing what we said we would
NZ Health Partnerships’ focus in its first year was
ensuring our portfolio of programmes and services
were fit for purpose, aligned to our shareholders’
expectations and overseen by DHB-agreed
governance and engagement structures. Internally
we focused on building our peoples’ capabilities,
utilising DHB expertise and aligning our culture with
our shareholders.
To achieve our key areas of focus NZ Health
Partnerships grouped its work under three strategic
themes:
THEME ONE: Develop and deliver shared services initiatives to our shareholders
NZ Health Partnerships will:
• continue to develop and implement its current programmes
• implement best practice programme methodology
• support DHBs for local implementation
• manage the services and contracts for the business cases we have implemented.
Update as at 30 June
• The NOS programme successfully met all criteria applied at its November 2015 Stage Gate, the build of the core solution was on track and implementation planning well advanced.
• The NIP programme had been reset because of the non-performance of the contracted service provider.
• The Food Services model had been successfully operationalised at six DHBs, for which we provided implementation support.
• In consultation with DHBs, the Linen and Laundry programme had been disestablished because it became clear DHBs could leverage regional assets to achieve similar financial savings while applying lessons learned and revising
Our Focus

© CROWN COPYRIGHT NZ HEALTH PARTNERSHIPS ANNUAL REPORT 2016 | 9
the national catalogue from the national programme.
• The Prince2 best practice programme management methodology had been implemented and embedded internally.
• A Commercial Services team had been established to manage contracts and operational services.
THEME TWO: Planning and Portfolio Optimisation
NZ Health Partnerships will:
• refocus our current programmes and services to align with our operating model and shareholders’ expectations
• operationalise the National Good Mechanism. This is a set of levers which will provide options to optimise DHB participation in initiatives while catering for the interests of and impacts on individual DHBs
• develop a centralised approach to managing vendor performance and a detailed services catalogue.
Update as at 30 June
• DHBs had tasked NZ Health Partnerships with facilitating the development and implementation of the DHB Procurement Strategy to delivery better value for money.
• The Strategy had been approved by the NZ Health Partnerships Board and DHB Chief Executives.
• The Linen and Laundry programme had been disestablished.
• The Commercial Services team had established formal quarterly performance review meetings with vendors, and had initiated Key Performance Indicator reporting with Food Services provider, Compass Group NZ.
THEME THREE: Building joint capability in the sector
NZ Health Partnerships will:
• draw on sector expertise for the delivery of its programmes and services
• utilise DHB expertise in the design and implementation of shared services initiatives.
Update as at 30 June
• NZ Health Partnerships’ Governance Charter had been approved and implemented, including the appointment of DHB Chief Executive Sponsors for each programme and service.
• NZ Health Partnerships had continued to embed collaboration as a way of working through the involvement of DHB leaders and subject matter experts on our programme and service advisory and governance groups.
• A number of these groups included representatives from other organisations with which we collaborate including healthAlliance NZ, PHARMAC, Ministry of Health (MoH), Ministry of Business, Innovation and Employment (MBIE) and the Department of Internal Affairs (DIA).
• The NOS programme in particular continued to benefit from the part or full-time secondment of DHB technical experts.
Note: Please see Part Two, Statement of
Performance for more detailed status reports by
programme and service.

10 | © CROWN COPYRIGHT NZ HEALTH PARTNERSHIPS ANNUAL REPORT 2016
Good Employer
To ensure the company meets
its Good Employer obligations
prescribed in the Crown Entities
Act Part 3 section 118, NZ Health
Partnerships provides equal
employment opportunities to:
• enhance the abilities of
individual employees
• recognise the aims,
aspirations and
employment for women,
and the cultural differences
of ethnic or minority
groups
• recognise the employment
requirements of people
with disabilities.
Our Values
Our values underpin how we work together and engage with our
stakeholders. They are central to our collective culture, and as
individuals, we strive to live these values every day in the decisions
we make, our planning, processes and behaviours.
Stakeholder Engagement and Alignment
The findings of our first ever stakeholder engagement survey
established a baseline score of 66 per cent.
With few exceptions all DHB Chairs, Chief Executives and CFOs
gave up their time to be interviewed, with a further 60 DHB senior
managers, vendors, government officials and other stakeholders
completing online surveys.
Stakeholders feel we are making progress in some areas such as
communications and stakeholder engagement, and demonstrating
a positive cultural change. It is equally clear that we need to listen
more and act on the advice we are given, report thoroughly and
more often, and genuinely understand DHBs and the pressures and
circumstances that are unique to each.
In our first 12 months we put a lot of focus on engaging with DHB
Chairs and Chief Executives. We will continue to do this, while
ensuring we engage better and build relationships with a wider group
of stakeholders.
Organisational Health
Our Values
• Accountability• Commitment• Respect• Transparency

© CROWN COPYRIGHT NZ HEALTH PARTNERSHIPS ANNUAL REPORT 2016 | 11
Our People
To deliver value to DHBs we need to attract, develop and retain skilled and motivated people who are focused
on the needs of our shareholders.
Engagement of our people
In October 2015 we conducted a staff engagement survey to better understand staff perceptions of the new
organisation. The survey established a baseline engagement score of 55 per cent which reflected the period
of significant change the organisation and its people had recently been through.
We conducted a follow-up engagement survey in May 2016, with our overall engagement score increasing to
70 per cent.
We continue to focus on building our culture, people and business processes. While ostensibly these are
internally focused priorities they are ultimately about delivering a better return to shareholders.
Optimising our workforce
Due to the highly technical nature of some of our programmes and services, and the need to optimise
workforce capacity, NZ Health Partnerships engages consultants and contractors in addition to its core team.
As at 30 June, 33 people worked at NZ Health Partnerships.
We have also strived to create a workplace where people are treated fairly and with respect, are supported,
and are well managed.
This year we established a Health & Safety Committee and consistently reported to the Board on our
performance. The organisation is aware of its responsibilities under the Health and Safety at Work 2015 and
the need to keep its people and visitors healthy and safe.
55%Male
Figure 1: Workforce composition by gender as at 30 June
Female45%

12 | © CROWN COPYRIGHT NZ HEALTH PARTNERSHIPS ANNUAL REPORT 2016
NZ Health Partnerships has a formal Risk Management Framework to support risk-based decision-making
across our programmes and services.
NZ Health Partnerships has identified the following four strategic risks:
NZ Health Partnerships: Strategic Risks
1 2 3 4
RiskScale and
complexity of activities
Multiple delivery partners
Resource pressure
Shareholder constraints
Description Our programmes and services are being, and have been, implemented nationally. These national programmes and services touch all parts of the NZ health system.
Our programmes and services have many delivery partners spanning both the public and private sectors.
Our programmes and services must be delivered within agreed budgets and to agreed quality criteria.
DHBs are facing many challenges and are also managing a large number of complex change programmes at any one time.
Mitigation To mitigate risks during design and implementation, NZ Health Partnerships works closely with DHBs, their subsidiaries and the service providers to put in place proactive and detailed change plans.
NZ Health Partnerships engages with the sector to build collaborative programme teams, including seconding and embedding DHB subject matter experts in our work. This approach also helps build capability in the sector.
NZ Health Partnerships aligns and integrates its resource planning cycle with DHBs to help alleviate resource pressures and improve financial forecasting.
Risk Management
Figure 2: NZ Health Partnerships Strategic Risks

© CROWN COPYRIGHT NZ HEALTH PARTNERSHIPS ANNUAL REPORT 2016 | 13
Peter Anderson
CHAIR
Appointed to the NZ Health Partnerships Board in October 2015.
Committees: Remuneration Committee (Chair), NIP Subcommittee.
Independent Director
Deryck Shaw
Appointed to the NZ Health Partnerships Board in June 2015.
Committees: Finance Risk Audit and Compliance Committee.
Chair of Lakes DHB, Midlands Region.
Board Members
Lee Mathias
Appointed to the NZ Health Partnerships Board in June 2015.
Committee: Finance Risk Audit and Compliance Committee.
Chair of Counties Manukau DHB, Northern Region.
Phil Sunderland
Appointed to the NZ Health Partnerships Board in June 2015.
Committee: Remuneration Committee.
Chair of MidCentral DHB, Central Region.

14 | © CROWN COPYRIGHT NZ HEALTH PARTNERSHIPS ANNUAL REPORT 2016
Murray Cleverley
Appointed to the NZ Health Partnerships Board in June 2015.
Committees: Remuneration Committee, NIP Subcommittee.
Chair of Canterbury DHB and South Canterbury DHB, South Island Region.
Jo Hogan
Appointed to the NZ Health Partnerships Board in April 2016.
Committees: Remuneration Committee, NIP Subcommittee.
Independent Director.
Terry McLaughlin
Appointed to the NZ Health Partnerships Board in October 2015.
Committee: Finance Risk Audit and Compliance Committee (Chair).
Independent Director.

© CROWN COPYRIGHT NZ HEALTH PARTNERSHIPS ANNUAL REPORT 2016 | 15
PART TWO
Statement of Performance
16 | © CROWN COPYRIGHT NZ HEALTH PARTNERSHIPS ANNUAL REPORT 2016
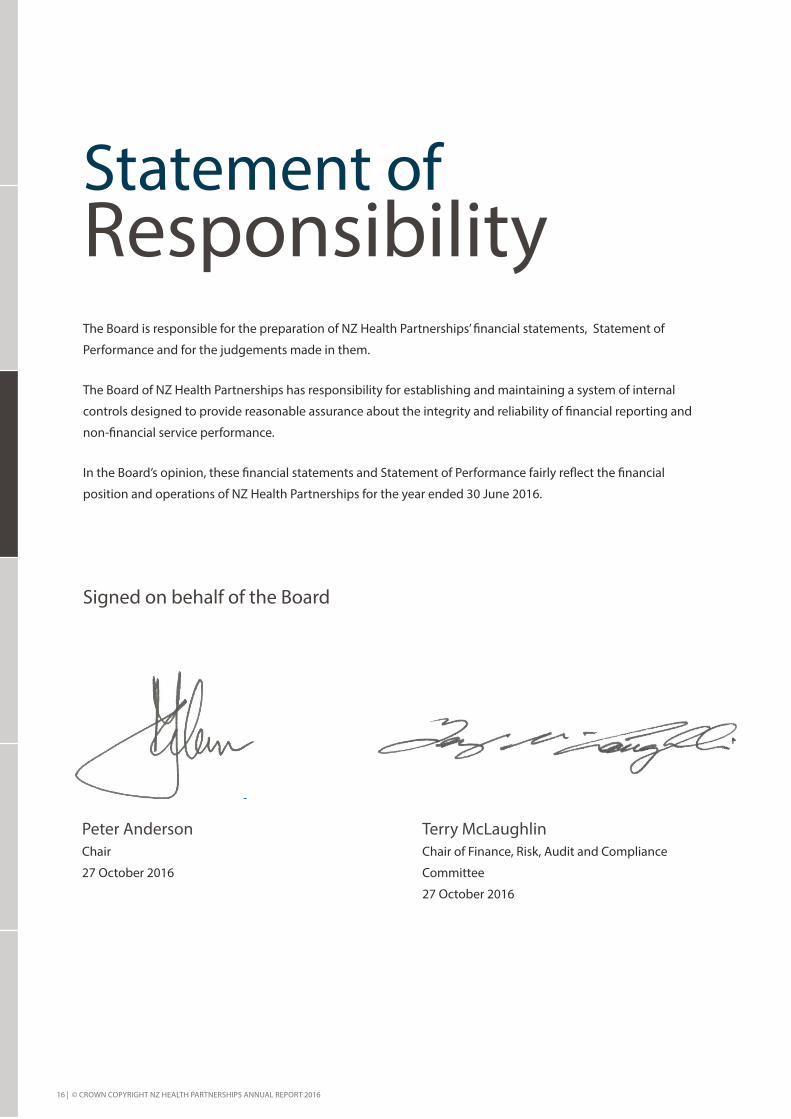
The Board is responsible for the preparation of NZ Health Partnerships’ financial statements, Statement of
Performance and for the judgements made in them.
The Board of NZ Health Partnerships has responsibility for establishing and maintaining a system of internal
controls designed to provide reasonable assurance about the integrity and reliability of financial reporting and
non-financial service performance.
In the Board’s opinion, these financial statements and Statement of Performance fairly reflect the financial
position and operations of NZ Health Partnerships for the year ended 30 June 2016.
Signed on behalf of the Board
Statement of Responsibility
Peter AndersonChair
27 October 2016
Terry McLaughlinChair of Finance, Risk, Audit and Compliance
Committee
27 October 2016

© CROWN COPYRIGHT NZ HEALTH PARTNERSHIPS ANNUAL REPORT 2016 | 17
To enable us to meet the commitments of the three strategic themes the DHBs fund NZ Health Partnerships
through two output classes:
• Output Class 1: Our programmes are well-managed and coordinated.
• Output Class 2: Our services are high performing and deliver the DHBs both qualitative and quantitative benefits.
NZ Health Partnerships has 23 performance measures and targets to assess our success in delivering fit for
purpose programmes and services to our shareholders. Our overall performance is summarised below:
Figure 3: NZ Health Partnerships Overall Year End Performance
Achieved Partially Achieved Not Achieved Discontinued
66% 26% 4% 4%15 of 23 6 of 23 1 of 23 1 of 23
Output Class 1Table 1: Output Class 1 year end performance
Programmes Achieved Partially Achieved Not Achieved Discontinued
Governance 100%
1 of 1
National Oracle Solution 100%
3 of 3
National Infrastructure Platform 33% 67%
1 of 3 2 of 3
Food Services 33% 67%
1 of 3 2 of 3
Linen & Laundry 100%
1 of 1
Our Performance

18 | © CROWN COPYRIGHT NZ HEALTH PARTNERSHIPS ANNUAL REPORT 2016
Output Class 2Table 2: Output Class 2 year end performance
Services Achieved Partially Achieved Not Achieved Discontinued
Management Services 50% 25% 25%
2 of 4 1 of 4 1 of 4
DHB Procurement 100%
2 of 2
Shared Banking 67% 33%
2 of 3 1 of 3
Collective Insurance 100%
3 of 3
Assessing our performance
As outlined in our Statement of Service Expectations 1 July 2015 to 30 June 2016, NZ Health Partnerships
assesses its performance as achieved, partially achieved or not achieved. Discontinued has been added and
is a new assessment category.
Table 3: NZ Health Partnerships performance assessment ratings
Performance Rating Description
Achieved The measure has been achieved within its target date.
Partially AchievedThe activities and outputs have been completed; however, the measure was not achieved within the
target date.
Not Achieved The measure has not been completed.
Discontinued The programme or service has been discontinued.

© CROWN COPYRIGHT NZ HEALTH PARTNERSHIPS ANNUAL REPORT 2016 | 19
Output Class 1 ProgrammesThe purpose of this output class is to ensure programmes are well-managed and coordinated. There were
performance measures for overall programme governance and each of the four programmes.
In total there were 11 performance measures.
Figure 4: NZ Health Partnerships Output Class 1 Year End Performance
Achieved Partially Achieved Not Achieved Discontinued
55% 36% 0% 9%6 of 11 4 of 11 0 of 11 1 of 11
Table 4: Programme Governance Performance Measures and Targets 2015/16
Performance Measure Target Target Date
Programme governance and engagement review
• Programme governance and engagement groups reviewed and aligned to the new governance charter
Quarter 3
Achieved
Comment: Governance review has been completed and the amended programme governance and engagement model incorporated into the Head Agreement (this document sets out the obligations between NZ Health Partnerships and DHBs for the specified agreed shared services).
Programme Governance

20 | © CROWN COPYRIGHT NZ HEALTH PARTNERSHIPS ANNUAL REPORT 2016
National Oracle Solution
The National Oracle Solution (NOS) programme is building a single financial management information system
ready for DHB implementation.
The programme represents a significant investment for the sector and is a critical enabler to the National
Procurement Service.
The overall status of the programme (30 June 2016): GREEN
The NOS programme had made significant progress since emerging from the replanning of the Finance
Procurement and Supply Chain programme.
Table 5: National Oracle Solution Performance Measures and Targets 2015/16
Performance Measure Target Target Date
DHB support for solution design • Key stakeholders and sector specialists are involved in a series of workshops to validate the detailed design of the National System
• DHBs approve the solution design of the financial system
Quarter 2
Achieved
Comment: November 2015 Stage Gate passed with approval via NOS Governance groups and from DHB
CEs and CFOs to proceed with the programme. Nine DHBs confirmed their implementation timelines to
July 2018.
Build Phase planning complete • Completion of the financial system Build Phase, including its release to the sector
• Phase completion is signed off by the appropriate governance groups
Quarter 4
Achieved
Comment: Time and Cost to complete the build approved. Build was 90 per cent complete and Solutions
Acceptance Testing scheduled to commence 1 August 2016.

© CROWN COPYRIGHT NZ HEALTH PARTNERSHIPS ANNUAL REPORT 2016 | 21
Stage Gate passed • Completion of all agreed artefacts for the November Stage Gate
• Stage Gate passed following approval by relevant governance bodies
Quarter 2
Achieved
Comment: The Treasury recommended nine actions based on the November 2015 Stage Gate review.
Seven and half of the nine actions have been completed, including those with a deadline of 30 September
2016.
Significant developments post-30 June 2016
• The key go live date for implementation has been delayed from 1 January 2017 to 1 July 2017 because of delays to the design and delivery of IaaS. NOS timelines and budget have been reset, and the business case remains sound.
• The DHB DataHub team has transitioned from healthAlliance (FPSC) to NZ Health Partnerships.
• A Request for Proposal (RFP) process selected Rubicon Red for provision of the Oracle Fusion Middleware toolset.
National Infrastructure Platform
The National Infrastructure Platform (NIP) is the IT infrastructure that hosts the applications and systems
DHBs use every day in the delivery of health care. The programme will consolidate the DHBs’ current 40 data
centres of varying sizes and ages to more centralised and modern data centres which will increase security,
reliability and reduce the risk of critical outages.
The overall status of the programme (30 June 2016): AMBER
The NIP had experienced significant delivery delays due to lack of delivery by the service provider, IBM. As a
consequence, during the second half of 2015/16, the programme had been subject to commercial, technical
and delivery reviews to determine the best way forward for DHBs.

22 | © CROWN COPYRIGHT NZ HEALTH PARTNERSHIPS ANNUAL REPORT 2016
Table 6: National Infrastructure Platform Performance Measures and Targets 2015/16
Performance Measure Target Target Date
Implementation Roadmaps • A detailed roadmap has been developed identifying strategic implementation milestones
Quarter 2
Partially Achieved
Comment: The road maps were completed however NZ Health Partnerships twice made the decision to delay implementation because of IBM’s non-performance.
Independent Quality Assurance • Conduct quality assurance reviews of NIP programme
Quarter 4
Achieved
Comment: NZ Health Partnerships with, the assistance of DHB Chief Information Officers and other subject matter experts, completed a technical assessment of IBM’s solution in March 2016. The DIA also conducted a technical assessment.
Best Practice Processes • Best practice readiness processes developed and shared with DHBs
• Individual readiness workshops have taken place with each DHBs findings published
Quarter 4
Partially Achieved
Comment: The readiness processes were developed however these would need to be updated once a decision on the way forward has been made.
Significant developments post-30 June 2016
• NZ Health Partnerships has agreed a variation to the existing contract with IBM as a result of delays. This will allow DHBs to consume services from the other approved panel suppliers and IBM once its service is certified.
• A recommended go-forward plan for the programme has been developed with DHBs. The plan is with DHBs for formal approval at the date of signing this report.

© CROWN COPYRIGHT NZ HEALTH PARTNERSHIPS ANNUAL REPORT 2016 | 23
Food Services
Food Services seeks to implement a shared food services model for participating DHBs. In 2014 Compass
Group NZ was selected by HBL after conducting an extensive procurement process to provide Food Services
to DHBs. NZ Health Partnerships undertakes contract and vendor management of the Food Services
Agreement (FSA) on behalf of DHBs.
The overall status of the programme (30 June 2016): AMBER
The Food Services programme transitioned to a service in 2015/16 as the focus shifted from business case
development to implementation and operational management.
Six DHBs were participating in the FSA: Waitemata, Auckland, Counties Manukau, Hauora Tairawhiti, Nelson
Marlborough and Southern.
Table 7: Food Services Performance Measures and Targets 2015/16
Performance Measure Target Target Date
Implementation • Successful implementation occurs for DHBs that have entered into the FSA
Quarter 4
Partially Achieved
Comment: Mobilisation and transition completed and new service pricing commenced for the six participating DHBs.
Contract KPIs • 100% Tier 1 contract KPIs are met or action plans are in place
• Notice of Exemption for the hospitals and nominated DHB premises are issued
Quarter 4
Achieved
Comment: Reporting against KPIs for all participating DHBs and 100% of Tier 1 contract KPIs had been met (two Tier 1 KPIs). Each DHB participating in the FSA achieved its performance target for the following measures:
• The Safe Food and Beverages – no incidents of proven food poisoning events.
• DHB HACCP Food Safety plan¹ - is current and a valid certificate is available
¹ Compass is able to apply for an exemption for not having a current and valid DHB HACCP Food Safety plan however Compass has
a current and valid certificate for each of the six participating DHBs.
24 | © CROWN COPYRIGHT NZ HEALTH PARTNERSHIPS ANNUAL REPORT 2016
Performance Measure Target Target Date
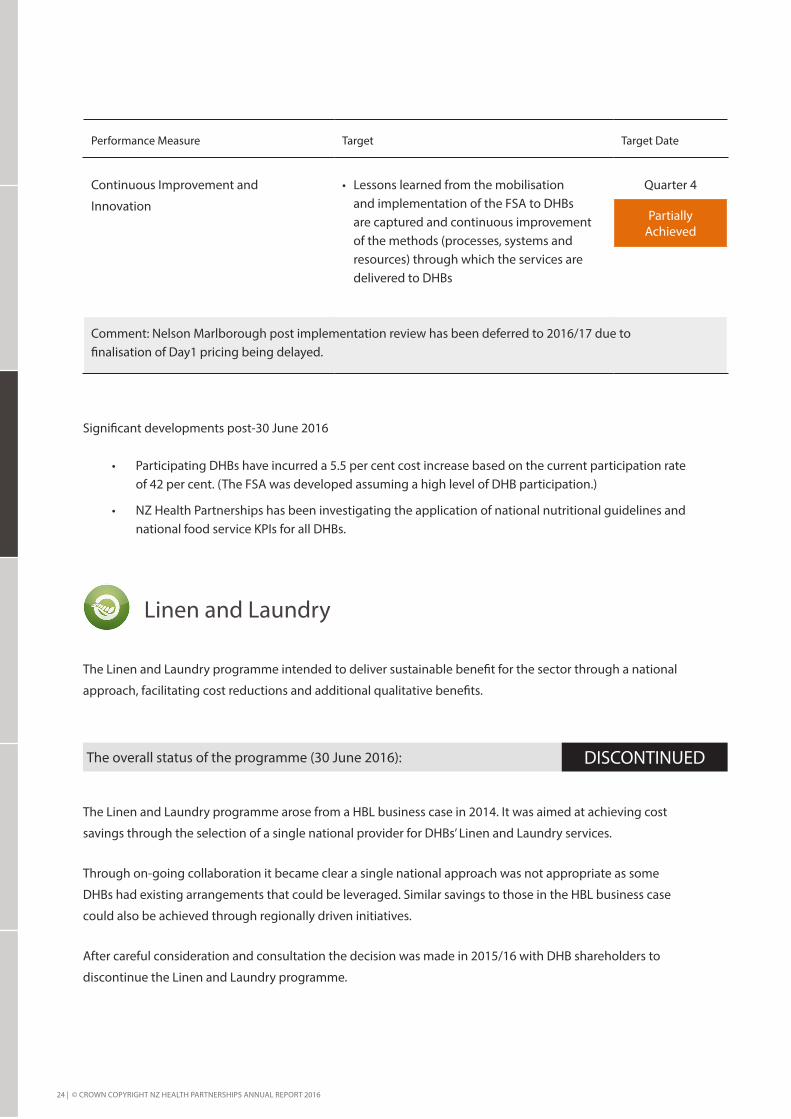
Continuous Improvement and
Innovation
• Lessons learned from the mobilisation and implementation of the FSA to DHBs are captured and continuous improvement of the methods (processes, systems and resources) through which the services are delivered to DHBs
Quarter 4
Partially Achieved
Comment: Nelson Marlborough post implementation review has been deferred to 2016/17 due to finalisation of Day1 pricing being delayed.
Significant developments post-30 June 2016
• Participating DHBs have incurred a 5.5 per cent cost increase based on the current participation rate of 42 per cent. (The FSA was developed assuming a high level of DHB participation.)
• NZ Health Partnerships has been investigating the application of national nutritional guidelines and national food service KPIs for all DHBs.
Linen and Laundry
The Linen and Laundry programme intended to deliver sustainable benefit for the sector through a national
approach, facilitating cost reductions and additional qualitative benefits.
The overall status of the programme (30 June 2016): DISCONTINUED
The Linen and Laundry programme arose from a HBL business case in 2014. It was aimed at achieving cost
savings through the selection of a single national provider for DHBs’ Linen and Laundry services.
Through on-going collaboration it became clear a single national approach was not appropriate as some
DHBs had existing arrangements that could be leveraged. Similar savings to those in the HBL business case
could also be achieved through regionally driven initiatives.
After careful consideration and consultation the decision was made in 2015/16 with DHB shareholders to
discontinue the Linen and Laundry programme.

© CROWN COPYRIGHT NZ HEALTH PARTNERSHIPS ANNUAL REPORT 2016 | 25
Table 8: Linen and Laundry Performance Measures and Targets 2015/16
Performance Measure Target Target Date
Identify strategic options • Facilitate meetings for the DHBs open to considering a collective arrangement for outsourcing Linen and Laundry services
Quarter 2
Discontinued
Output Class 1: Financial Perspective
Table 9: Output Class 1 - Financials for 2015/16
2015/16 Budget
$000’s
2015/16 Actual$000’s
Revenue
National Oracle Solution 7,028 4,932
National Infrastructure Platform 3,385 2,850
Food Services (funded through Management Services budget) 501 515
Linen and Laundry (funded through Management Services budget) - -
Total revenue 10,914 8,297
Expenditure
National Oracle Solution 7,028 8,972
National Infrastructure Platform 3,385 3,196
Food Services (funded through Management Services budget) 501 515
Linen and Laundry (funded through Management Services budget) - -
Total expenditure 10,914 12,683
Surplus / (Deficit) 0 (4,386)
NOTE:
The deficit is due to the depreciation charges on the NOS IT assets and a loss on sale of the old IT asset
being decommissioned due to the new NOS infrastructure as a service being deployed.

26 | © CROWN COPYRIGHT NZ HEALTH PARTNERSHIPS ANNUAL REPORT 2016
Output Class 2 ServicesThis output class comprises the operational services delivered by NZ Health Partnerships including
Management Services, the National Procurement Service, Collective Insurance and Shared Banking.
As programmes are implemented and activity becomes business-as-usual, they are transitioned from
programmes to services.
The purpose of the output class is to ensure NZ Health Partnerships services are high performing and deliver
both qualitative and quantitative benefits to the DHBs.
Overall there were 12 service performance measures.
Figure 5: NZ Health Partnerships Output Class 2 Year End Performance
Achieved Partially Achieved Not Achieved Discontinued
75% 17% 8% 0%9 of 12 2 of 12 1 of 12 0 of 12
Management Services
Management Services refers to the central function within NZ Health Partnerships that implements initiatives
relating to organisational change, cultural alignment, strategy, programme management, and stakeholder
communication and engagement. These activities act as an enabler for NZ Health Partnerships to implement
its three strategic themes throughout the organisation.
The overall status of the service (30 June 2016)
Significantly, NZ Health Partnerships appointed Megan Main as its Chief Executive. Megan joined NZ Health
Partnerships from Health Purchasing Victoria, where she held the role of Chief Executive for eight years.
Health Purchasing Victoria is responsible for the procurement and management of more than 40 contract
categories (clinical, indirect materials, services and equipment streams) for the 80 independent health
services organisations servicing a population of just under six million.

© CROWN COPYRIGHT NZ HEALTH PARTNERSHIPS ANNUAL REPORT 2016 | 27
Table 10: Management Services Performance Measures and Targets 2015/16
Performance Measure Target Target Date
Services governance and engagement review
• Services governance and engagement groups reviewed and aligned to the new governance charter
Quarter 3
Achieved
Comment: Service review had been completed and amended programme governance and engagement model has been incorporated into the Head Agreement (this document sets out the obligations between NZ Health Partnerships and DHBs for the specified agreed shared services).
Customer satisfaction • >75% of customers surveyed rate the quality of their working relationship with NZ Health Partnerships as “Good” or “Very Good”
• Establish a benchmark “Overall Stakeholder Score”
Quarter 4
Partially Achieved
Comment: NZ Health Partnerships' first stakeholder survey established an “Overall Stakeholder Engagement Score” of 66 per cent. The result will be used as the baseline target for the next survey.
The target was ‘partially achieved’ because of the survey results were finalised in August 2016, later than the intended 30 June target date.
Discontinued target not included in the summary of targets achieved. The new target of Establishing a benchmark “Overall
Stakeholder Score” is included in the summary of targets achieved.
Use of DHB expertise • >300 days per annum of DHB subject matter experts engaged across the NZ Health Partnerships portfolio
Quarter 4
Achieved
Comment: NZ Health Partnerships works collaboratively with DHBs to utilise their expertise and experience to develop and deliver shared services. There is strong DHB representation on our programme and service advisory and governance groups.
Budget Management • Actual spend for Management Services is <95% of the budget
Quarter 4
Not Achieved
Comment: NZ Health Partnerships achieved robust expense control with actual Management Services expenditure being 1 per cent over Budget, however this was less than expected target of -5 percent, due to expenditure on legal fees and consultants being higher than anticipated.

28 | © CROWN COPYRIGHT NZ HEALTH PARTNERSHIPS ANNUAL REPORT 2016
Significant developments post-30 June 2016
• NZ Health Partnerships has been developing an integrated business plan which in part focuses on internal management processes, stakeholder engagement and our people including better use of DHB expertise.
DHB Procurement
DHB Procurement includes both the DHB Procurement Strategy implementation work and the National
Procurement Service provided by healthAlliance (FPSC) Ltd.
The overall status of the service (30 June 2016)
NZ Health Partnerships contracted specialists ArcBlue Consulting to conduct a sector wide review of
procurement and identify opportunities for improvement.
Completed in December 2015, ArcBlue’s recommendations were closely aligned to those from the DHBs’ own
Strategic Procurement Subcommittee which had conducted an earlier review.
Informed by both reviews, in April 2016 the DHB Procurement Strategy was endorsed at the DHB Chief
Executive Forum and approved by the NZ Health Partnerships Board.
An interim Joint Procurement Authority (JPA) involving senior leadership from DHBs, PHARMAC, MBIE and
NZ Health Partnerships was established, as well as an interim Procurement Operations Advisory Group
(POAG) which produced an initial draft of the sector’s first ever aligned Annual Procurement Plan.
In addition, as well as managing healthAlliance (FPSC)'s delivery of the National Procurement Service,
planning continued around the ongoing transition of medical device procurement to PHARMAC.
Table 11: National Procurement Service Performance Measures and Targets 2015/16
Performance Measure Target Target Date
Independent Review of the National Procurement Service
• Conduct independent quality assurance of the National Procurement Service
Quarter 2
Achieved
Comment: Independent review completed in December 2015.
© CROWN COPYRIGHT NZ HEALTH PARTNERSHIPS ANNUAL REPORT 2016 | 29
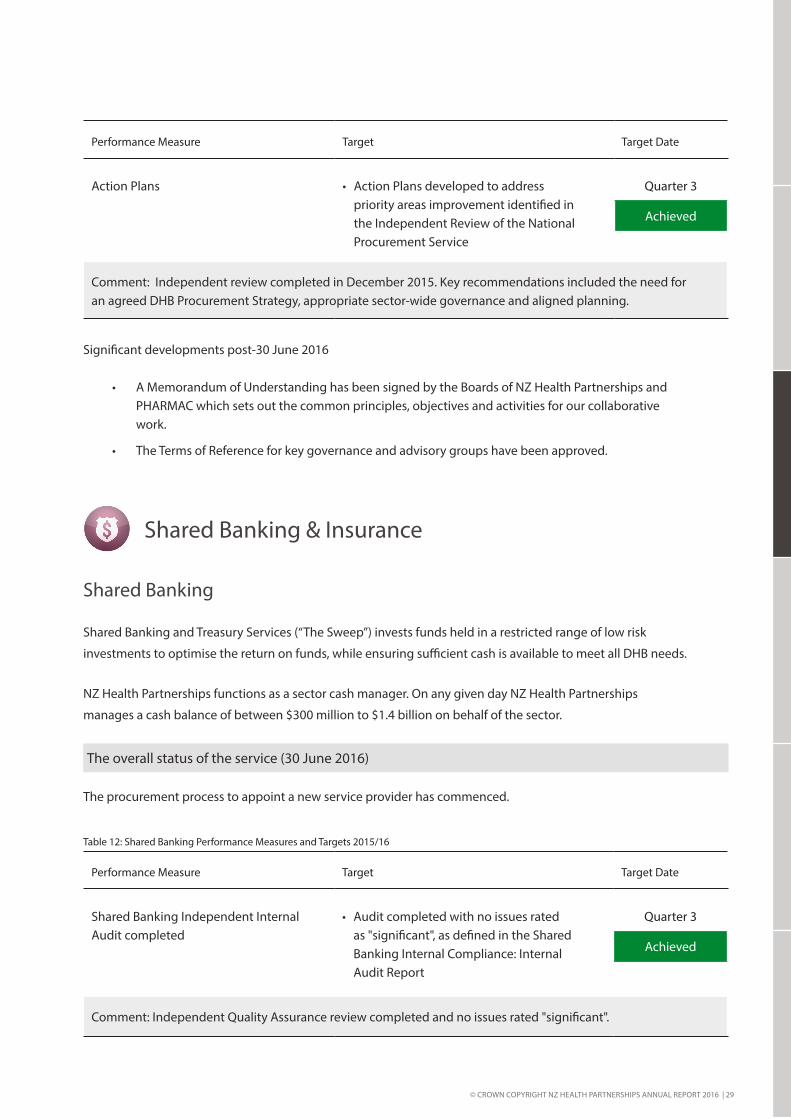
Performance Measure Target Target Date
Action Plans • Action Plans developed to address priority areas improvement identified in the Independent Review of the National Procurement Service
Quarter 3
Achieved
Comment: Independent review completed in December 2015. Key recommendations included the need for an agreed DHB Procurement Strategy, appropriate sector-wide governance and aligned planning.
Significant developments post-30 June 2016
• A Memorandum of Understanding has been signed by the Boards of NZ Health Partnerships and PHARMAC which sets out the common principles, objectives and activities for our collaborative work.
• The Terms of Reference for key governance and advisory groups have been approved.
Shared Banking & Insurance
Shared Banking
Shared Banking and Treasury Services (“The Sweep”) invests funds held in a restricted range of low risk
investments to optimise the return on funds, while ensuring sufficient cash is available to meet all DHB needs.
NZ Health Partnerships functions as a sector cash manager. On any given day NZ Health Partnerships
manages a cash balance of between $300 million to $1.4 billion on behalf of the sector.
The overall status of the service (30 June 2016)
The procurement process to appoint a new service provider has commenced.
Table 12: Shared Banking Performance Measures and Targets 2015/16
Performance Measure Target Target Date
Shared Banking Independent Internal Audit completed
• Audit completed with no issues rated as "significant", as defined in the Shared Banking Internal Compliance: Internal Audit Report
Quarter 3
Achieved
Comment: Independent Quality Assurance review completed and no issues rated "significant".

30 | © CROWN COPYRIGHT NZ HEALTH PARTNERSHIPS ANNUAL REPORT 2016
Performance Measure Target Target Date
NZ Health Partnerships joining the
existing Shared Banking arrangement
• NZ Health Partnerships has joined the Shared Banking arrangement
• NZ Health Partnerships' entry has been approved by the appropriate governance bodies
Quarter 4
Partially Achieved
Comment: Submission for NZ Health Partnerships to join the Shared Banking arrangement had been submitted to the Ministry of Health (MoH) for a decision.
Tender process for new Shared Banking
arrangement commenced
• Procurement process to appoint new banker has commenced
Quarter 4
Achieved
Comment: Westpac Bank Ltd has provided banking and treasury services for all DHBs since 2011. The banking and treasury service competitive tender in the form of a Request for Proposal (RFP) commenced in 2015/16. The tender closed in September 2016 and responses were being evaluated.
Significant developments post-30 June 2016
• The Banking tender has been undertaken with New Zealand’s four major banks, ANZ, BNZ, ASB and Westpac. A recommendation as to the preferred vendor is expected to be taken to the NZ Health Partnerships Board in December 2016.
• A benchmarking exercise has been completed and the Shared Banking and Treasury Services achieved $2.619 million of non-budgetary benefits in 2015/16.
Collective Insurance
This service is responsible for managing the insurance requirements for all 20 DHBs and 13 associated joint
agencies and subsidiaries that have elected to join the Collective Insurance Service. The objective of the
service is to obtain insurance for participants at the most cost-effective price, taking into account the terms
and conditions, market dynamics and the strategic intentions of DHBs. Collectively DHBs have assets valued
at approximately $15 billion.

© CROWN COPYRIGHT NZ HEALTH PARTNERSHIPS ANNUAL REPORT 2016 | 31
The overall status of the service (30 June 2016)
All three objectives were achieved.
Table 13: Collective Insurance Performance Measures and Targets 2015/16
Performance Measure Target Target Date
Appropriate Insurance Coverage achieved
• Appropriate insurance coverage achieved for DHBs and joint agencies in the following policy areas: material damage / business interruption, liability, personal accident, travel, and motor vehicle
Quarter 4
Achieved
Comment: Collective Insurance Service cover has been obtained for material damage / business interruption (MDBI), liability package, motor vehicle, travel, and personal accident. The coverage has been obtained from insurers in New Zealand, Australia, London, Singapore and China.
Note: The Collective Insurance Service also negotiated significant improvements to the deductible applying to the programme that has improved the insured position of DHBs in high earthquake zones.
New Broker appointed • Successful completion of secondary procurement process to appoint new Broker
Quarter 4
Achieved
Comment: NZ Health Partnerships and DHB Boards approved a one-year extension of Marsh Limited’s contract to 30 June 2018.
Insurance coverage delivers benefits for
DHBs and Joint Agencies
• $5.283 million of benefits realised during financial year 2015/16, including savings from Fire Service levies
Quarter 4
Achieved
Comment: Marsh Limited confirmed saving achieved by DHBs through the Collective Insurance Service was $5.283 million in non-budgetary benefits.
Significant developments post-30 June 2016
• None.

32 | © CROWN COPYRIGHT NZ HEALTH PARTNERSHIPS ANNUAL REPORT 2016
Output Class 2: Financial Perspective
Table 14: Output Class 2 - Financials for 2015/16
2015/16 Budget
$000’s
2015/16 Actual$000’s
Revenue
Shared Banking
Interest Revenue from Shared Banking Facility 24,000 28,384
Shared Banking Operations 360 360
Management Services (including Collective Insurance) 5,499 5,709
National Procurement Service 10,920 10,926
Integrator 350 350
Total revenue 41,129 45,729
Expenditure
Shared Banking
Interest Revenue from Shared Banking Facility 24,000 28,363
Shared Banking Operations 360 362
Management Services (including Collective Insurance) 5,341 5,553
National Procurement Service 10,920 10,789
Integrator 350 374
Total expenditure 40,971 45,441
Surplus / (Deficit) 158 288

© CROWN COPYRIGHT NZ HEALTH PARTNERSHIPS ANNUAL REPORT 2016 | 33
Key Benefits Definitions
Benefits can be made up of two parts: budgetary and non-budgetary (includes cash avoidance and qualitative benefits). All cash benefits (and associated cash costs) are included in the calculation of a business case’s net present value.
Budgetary Benefits
Budgetary is defined as the incremental annual change, primarily cash and includes any depreciation impact. These benefits result in a budget line reduction, compared with the prior year.
Non Budgetary Benefits
Non-budgetary benefits are defined as those that form part of the business case that do not meet the definition of budgetary. There are three general components:
• Cash avoidance: cash that would have been spent is now totally avoided or reallocated as a result of the business case.
• Cumulative benefits: are those that are carried forward from previous years, whether they are budgetary or non-budgetary in nature.
• Qualitative benefits: accrue from associated activity as a result of a business case and need to be reported in some way. These may be able to be quantified but this may prove to be too difficult to do reliably.
BenefitsBenefits management is at the very heart of NZ Health
Partnerships’ purpose. Our programmes and services are
developed and implemented with the singular purpose of
delivering benefits (value) to DHBs.
Reported Benefits
Benefits are reported by DHBs to NZ Health Partnerships
and we are responsible for reporting benefits at an
aggregated level. DHBs measure, track and report benefits
of the National Procurement Service as well as regional
and local initiatives. NZ Health Partnerships report Banking
and Insurance Services benefits by DHB. We receive from
the Ministry of Business Innovation and Employment
(MBIE) benefits achieved from DHBs participating in All of
Government (AoG) contracts.
The following tables show Benefits Reporting for year end
2015/16.
Key Points
• Benefits reports have been received from all 20 DHBs, signed off by the DHB CFOs or equivalent.
• Reported benefits for the year total $61.4m against Statement of Performance Expectations (SPE) target of $58.5m, a positive variance of $2.9m.
• The positive variance is due to above target performance by the National Procurement Service and Banking, while Other Procurement was below target ($16.2m versus $18.3m).
• Budgetary benefits total $15.0m and non-budgetary $46.4m against SPE targets of $34.9m and $23.6m respectively. The higher non-budgetary benefits achieved mainly reflect higher “cost avoidance” benefits on capital purchases.

34 | © CROWN COPYRIGHT NZ HEALTH PARTNERSHIPS ANNUAL REPORT 2016
Developing our benefits framework
The benefits we currently report are financial benefits, both budgetary and non-budgetary. In 2015/16 we
began work to improve benefits reported to include non-financial benefits centred on quality, safety, access,
efficiency and population.
Table 15: Reported Benefits for 2015/16 by Output Class (all figures in $000’s)
Output Class BudgetaryNon -
Budgetary Total Target as
per SPE
Output Class 1
National Oracle Solution - - - -
National Infrastructure Platform - - - -
Food Services - - - 410
Linen and Laundry - - - 300
- - - 710
Output Class 2
National Procurement Service¹ 11,065 26,199 37,264 33,300
Banking - 2,619 2,619 925
Insurance - 5,283 5,283 5,283
Other Procurement² 3,896 12,325 16,221 18,328
14,961 46,426 61,387 57,836
GRAND TOTAL 14,961 46,426 61,387 58,546
1 National Procurement Service includes: AoG, healthAlliance FPSC, NZHP National, PHARMAC, NPP & NPS project types2 Other procurement includes: DHB individual & DHB collaborative project types

© CROWN COPYRIGHT NZ HEALTH PARTNERSHIPS ANNUAL REPORT 2016 | 35
Table 16: Reported Benefits for 2015/16 by DHB (all figures in $000’s):
DHB Budgetary Non - Budgetary Total ¹
Auckland 2,383 9,208 11,591
Bay of Plenty 391 2,411 2,802
Canterbury 1,331 5,068 6,399
Capital & Coast 637 4,094 4,731
Counties Manukau 1,852 2,571 4,423
Hawkes Bay 200 859 1,059
Hutt Valley 436 1,450 1,886
Lakes 102 515 617
MidCentral 296 1,715 2,011
Nelson Marlborough 116 1,178 1,294
Northland 661 2,284 2,945
South Canterbury 433 162 595
Southern 1,300 4,109 5,409
Hauroa Tairawhiti 104 294 398
Taranaki 555 612 1,167
Waikato 2,932 5,595 8,527
Wairarapa 42 351 393
Waitemata 1,014 2,590 3,604
West Coast 37 447 484
Whanganui 129 519 648
healthAlliance 10 394 404
Total 14,961 46,426 61,387
1 The above results include reported benefits from MBIE, for AoG contracts, BP (for fuel contract), and banking and insurance, as well as benefits reported by each DHB. Accordingly the above results are higher than the individual DHB reported totals.

36 | © CROWN COPYRIGHT NZ HEALTH PARTNERSHIPS ANNUAL REPORT 2016
Tabl
e 17
: Re
port
ed B
enefi
ts fo
r FY2
015/
16 b
y D
HB
& re
port
ing
sour
ce (a
ll fig
ures
in $
000’
s):
Full
Year
201
5/16
DH
B
New
ben
efits
repo
rted
curr
ent F
Y
Carr
ied
forw
ard
from
prio
r FY’
s
Tota
l per
DH
B Be
nefit
s
Repo
rts
Net
AoG
adju
stm
ent p
er
MBI
E¹Fu
el p
er B
PBa
nkin
gIn
sura
nce
Tota
l
Auck
land
6,58
5 3,
139
9,72
4 88
5 79
29
2 61
1 11
,591
Bay
of P
lent
y45
3 1,
542
1,99
5 45
0 70
40
24
7 2,
802
Cant
erbu
ry1,
147
3,03
3 4,
180
758
108
235
1,11
8 6,
399
Capi
tal &
Coa
st39
6 2,
417
2,81
3 1,
057
89
296
476
4,73
1
Coun
ties
Man
ukau
1,78
6 1,
523
3,30
9 32
1 85
36
1 34
7 4,
423
Haw
kes
Bay
70
410
480
307
43
97
132
1,05
9
Hut
t Val
ley
773
248
1,02
1 52
1 42
59
24
3 1,
886
Lake
s17
6 13
18
9 21
8 25
93
92
61
7
Mid
Cent
ral
530
916
1,44
6 14
9 43
13
7 23
6 2,
011
Nel
son
Mar
lbor
ough
159
643
802
386
67
(106
) 14
5 1,
294
Nor
thla
nd91
9 1,
009
1,92
8 65
1 12
9 87
15
0 2,
945
Sout
h Ca
nter
bury
433
- 43
3 60
28
21
53
59
5
Sout
hern
969
2,89
1 3,
860
1,03
2 13
2 13
0 25
5 5,
409
Hau
roa
Taira
whi
ti10
7 -
107
197
19
10
65
398
Tara
naki
690
106
796
187
39
56
89
1,16
7
Wai
kato
2,77
3 4,
338
7,11
1 57
7 11
9 26
7 45
3 8,
527
Wai
rara
pa14
3 -
143
64
19
122
45
393
Wai
tem
ata
1,15
3 1,
328
2,48
1 37
1 11
5 33
9 29
8 3,
604
Wes
t Coa
st9
206
215
40
41
44
144
484
Wha
ngan
ui13
9 23
2 37
1 14
4 22
27
84
64
8
heal
thA
llian
ce-
392
392
- -
12
- 40
4
Tota
l19
,410
24
,386
43
,796
8,
375
1,31
4 2,
619
5,28
3 61
,387
1 –
MBI
E re
port
sav
ings
from
AoG
con
trac
ts q
uart
erly
. The
se s
avin
gs a
re in
clud
ed le
ss a
ny A
oG b
enefi
ts a
lread
y re
port
ed b
y D
HBs
. Per
MBI
E, F
Y15/
16 A
oG b
enefi
ts fo
r all
DH
Bs to
tal $
10.4
M.

© CROWN COPYRIGHT NZ HEALTH PARTNERSHIPS ANNUAL REPORT 2016 | 37
PART THREE
Financial Statementsfor year ended 30 June 2016

38 | © CROWN COPYRIGHT NZ HEALTH PARTNERSHIPS ANNUAL REPORT 2016
Notes
2015-16
Actual
$000’s
2015-16
Budget
$000’s
Revenue
Revenue from DHBs 2 21,631 22,505
Interest revenue NZ Health Partnerships 219 200
Shared Banking 28,385 24,000
Other revenue 3,791 5,338
Total revenue 54,026 52,043
Expenditure
Personnel costs 3 3,205 4,095
Depreciation and amortisation expense 8,9 2,126 2,112
Finance costs NZ Health Partnerships 0 0
Shared Banking 28,362 24,000
Other expenses 4 24,431 21,678
Total expenditure 58,124 51,885
Surplus / (Deficit) (4,098) 158
Other Comprehensive revenue and expense 0 0
TOTAL COMPREHENSIVE REVENUE AND EXPENSE (4,098) 158
Explanations of major variances against budget are provided in note 17.
The accompanying notes form part of these financial statements.
Statement of Comprehensive Revenue and Expenses for the year ended 30 June 2016

© CROWN COPYRIGHT NZ HEALTH PARTNERSHIPS ANNUAL REPORT 2016 | 39
Notes
2015-16
Actual
$000’s
2015-16
Budget
$000’s
ASSETS
Current Assets:
Cash and cash equivalents 5 110,566 1,722
Receivables 6 9,077 6,955
Investments - DHB Shared Banking Facility 7 120,000 90,000
Prepayments 48 0
DHB Shared Banking Facility 10a 26,691 191,028
Total current assets 266,382 289,755
Non-Current Assets:
Investment - DHB Shared Banking Facility 7 20,000 0
Property, plant and equipment 8 78 1,720
Intangible assets 9 55,757 61,730
Total Non-Current assets 75,835 63,450
Total Assets 342,217 353,205
LIABILITIES
Current Liabilities
Payables 10 10,446 6,888
DHB Shared Banking Facility 10b 269,469 281,028
Employee entitlements 11 177 215
Income in Advance 1,307 0
Total Current Liabilities 281,399 288,131
Non-Current Liabilities
Employee entitlements 11 0 0
Total Non-Current Liabilities 0 0
Total Liabilities 281,399 288,131
Net Assets 60,818 65,074
EQUITY
Contributed Capital 12 64,916 64,916
Accumulated surplus / (deficit) 12 (4,098) 158
Total Equity 60,818 65,074
Statement of Financial Position at 30 June 2016
Explanations of major variances against budget are provided in note 17.
The accompanying notes form part of these financial statements.

40 | © CROWN COPYRIGHT NZ HEALTH PARTNERSHIPS ANNUAL REPORT 2016
Statement of Changes in Equity for the year ended 30 June 2016
Notes
2015-16
Actual
$000’s
2015-16
Budget
$000’s
Balance 1 July 2015 0 0
Total Comprehensive Revenue and Expenses for the year (4,098) 158
Owner Transactions
Contributed Capital 64,916 64,916
BALANCE AS AT 30 JUNE 2016 12 60,818 65,074
Explanations of major variances against budget are provided in note 17.
The accompanying notes form part of these financial statements.

© CROWN COPYRIGHT NZ HEALTH PARTNERSHIPS ANNUAL REPORT 2016 | 41
Explanations of major variances against budget are provided in note 17.
The accompanying notes form part of these financial statements.
Notes
2015-16
Actual
$000’s
2015-16
Budget
$000’s
Cash flows from Operating Activities
Receipts from DHBs 19,139 24,485
Receipts from other revenue 3,625 3,358
Interest received 28,787 24,000
Payments to suppliers (24,084) (21,728)
Payments to employees (3,244) (4,095)
Interest paid (29,607) (24,000)
Net DHB Sweep account movements with DHBs (223,755) 0
Good and services tax (net) 368 50
Net Cash Flow from Operating Activities (228,771) 2,070
Cash flows from Investing Activities
Funds from deposits 330,000 90,798
Purchase of property, plant and equipment (6) 20
Purchase of intangible assets (3,735) (9,216)
Funds to deposit (235,000) (139,000)
Net Cash Flow from Investing Activities 91,259 (57,398)
Cash flows from Financing Activities
Cash transferred 248,078 248,078
Proceeds from borrowing 0 0
Repayment interest 0 0
Net Cash Flow from Financing Activities 248,078 248,078
Net (decrease)/increase in cash and cash equivalents 110,566 192,750
Cash and cash equivalents at the beginning of the year 0 0
Cash and cash equivalents at the end of the year 5 110,566 192,750
Statement of Cashflows for the year ended 30 June 2016

42 | © CROWN COPYRIGHT NZ HEALTH PARTNERSHIPS ANNUAL REPORT 2016
Reconcilition of net surplus/(deficit) to net cash flow from operating activities
Actual
2016
$000’s
Net surplus/ (deficit) (4,098)
Add/ (less) non-cash items
Depreciation and amortisation expense 2,126
Total non-cash items 2,126
Add/ (less) movements in statement of financial position items
(Inc)/Dec in Debtors and other receivables (9,077)
(Inc)/Dec in Prepayments (48)
Inc/(Dec) in Creditors and other payables 10,446
Inc/(Dec) in Income in Advance 1,307
Inc/(Dec) in Employee entitlements 177
Inc/(Dec) in DHB Sweep Account (223,755)
Inc/(Dec) transferred from prior year (5,849)
Net movements in working capital items (226,799)
Net cash flow from operating activities (228,771)

© CROWN COPYRIGHT NZ HEALTH PARTNERSHIPS ANNUAL REPORT 2016 | 43
Notes to Financial Statements
Contents
1. Statement of Accounting Policies ............................................................................................ 44
2. Revenue ............................................................................................................................................. 47
3. Personnel Costs .............................................................................................................................. 47
4. Other Expenses ............................................................................................................................... 49
5. Cash and Cash Equivalents ......................................................................................................... 50
6. Receivables ....................................................................................................................................... 51
7. Investments ..................................................................................................................................... 52
8. Property, plant and equipment ................................................................................................ 52
9. Intangible Assets ............................................................................................................................ 54
10. Payables ............................................................................................................................................. 59
11. Employee Entitlements ................................................................................................................ 61
12. Equity ................................................................................................................................................. 62
13. Related Party Transactions ......................................................................................................... 63
14. Financial Instruments ................................................................................................................... 64
15. Contingencies ................................................................................................................................. 67
16. Events after the balance date .................................................................................................... 67
17. Explanation of major variances against budget ................................................................. 67
18. Capital management .................................................................................................................... 68

44 | © CROWN COPYRIGHT NZ HEALTH PARTNERSHIPS ANNUAL REPORT 2016
1. Statement of Accounting Policies
REPORTING ENTITY
NZ Health Partnerships (NZHP) Limited is a Crown entity as defined by the Crown Entities Act 2004 and is
domiciled and operates in New Zealand. The relevant legislation governing NZHP’s operations include the
Crown Entities Act 2004. NZHP is a multi-parent Crown subsidiary, owned by the 20 District Health Boards,
which have equal class A shareholding and voting rights.
NZHP’s primary objective is to operate as a cooperative undertaking, and enable DHBs to collectively
maximise shared services opportunities for the national good. NZHP does not operate to make financial
return.
NZHP has designated itself as a public benefit entity (PBE) for financial reporting purposes.
The financial statements for NZHP are for the year ended 30 June 2016, and were approved by the Board on
27 October 2016.
BASIS OF PREPARATION
NZHP was incorporated on 16 June 2015 however held no assets, liabilities and did not commence
operations until the 1 July 2015 so the period of the annual report has been determined to be 1 July 2015 to
30 June 2016.
The financial statements are based on policies and approvals in place as at 1 July 2015. Under the Health
Sector (Transfers) Act 1993, effective 1 July 2015, all of Health Benefits Limited (HBL) assets and liabilities,
including all employment and commercial agreements, have transferred to NZ Health Partnerships Limited
(NZHP) by Order in Council.
The financial statements have been prepared on a going concern basis, and the accounting policies have
been applied consistently throughout the year.
Statement of Compliance
These financial statements of NZHP have been prepared in accordance with the requirements of the
Crown Entities Act 2004, which includes the requirement to comply with New Zealand Generally Accepted
Accounting Practice (NZ GAAP).
The financial statements have been prepared to comply with Public Benefit Entity Standards (PBE Standards)
for a Tier 1 entity. NZ Health Partnerships is adopting the PBE Standards for the first time.
These financial statements comply with PBE Standards.

© CROWN COPYRIGHT NZ HEALTH PARTNERSHIPS ANNUAL REPORT 2016 | 45
Presentation currency and rounding
The financial statements are presented in New Zealand dollars and all values are rounded to the nearest
thousand dollars ($000).
Standards issued that are not yet effective and have not been early adopted
In 2015, the External Reporting Board issued Disclosure Initiative (Amendments to PBE IPSAS 1), 2015
Omnibus Amendments to PBE Standards, and Amendments to PBE Standards and Authoritative Notice as a
Consequence of XRB A1 and Other Amendments. These amendments apply to PBEs with reporting periods
beginning on or after 1 January 2016. NZHP will apply these amendments in preparing its 30 June 2017
financial statements. NZHP expects there will be no effect in applying these amendments.
SUMMARY OF SIGNIFICANT ACCOUNTING POLICIES
Significant account policies are included in the notes to which they relate. Significant accounting policies that
do not relate to a specific note are outlined below.
Significant Accounting Policies
Revenue
Interest Revenue
Interest revenue is recognised in the year in which it is earned using the effective interest method. Interest
revenue on an impaired financial asset is recognised using the original effective interest rate.
Expenditure
Finance Costs
Borrowing costs are recognised as an expense in the financial year in which they are incurred.
Goods and Services Tax
All items in the financial statements are presented exclusive of Goods and Services Tax (GST), except for
receivables and payables, which are presented on a GST-inclusive basis. Where GST is not recoverable as
input tax then it is recognised as part of the related asset or expense.
The net amount of GST recoverable from, or payable to, the Inland Revenue Department (IRD) is included as
part of receivables or payables in the statement of financial position.
The net GST paid to, or received from the IRD, including the GST relating to investing and financing activities,
is classified as a net operating cash flow in the statement of cash flows.

46 | © CROWN COPYRIGHT NZ HEALTH PARTNERSHIPS ANNUAL REPORT 2016
Commitments and contingencies are disclosed exclusive of GST.
Income tax
NZHP is a public authority and consequently is exempt from the payment of income tax. Accordingly, no
provision has been made for income tax.
Budget figures
The budget figures are derived from the statement of performance expectations as approved by the Board
at the beginning of the financial year. The budget figures have been prepared in accordance with NZ GAAP,
using accounting policies that are consistent with those adopted by the Board in preparing these financial
statements.
Cost Allocation
NZHP has determined the cost of outputs using the cost allocation system outlined below.
Direct costs are those costs directly attributed to an output. Indirect costs are those costs that cannot be
identified in an economically feasible manner with a specific output.
Direct costs are charged directly to outputs. Indirect costs are charged to outputs based on cost drivers
and related activity or usage information. Depreciation is charged on the basis of asset utilisation.
Personnel costs are charged on the basis of actual time incurred. Property and other premises costs, such
as maintenance, are charged on the basis of floor area occupied for the production of each output. Other
indirect costs are assigned to outputs based on the proportion of direct staff costs for each output.
Critical Accounting Judgements and Estimates
In preparing these financial statements, NZHP has made estimates and assumptions concerning the
future. These estimates and assumptions may differ from the subsequent actual results. Estimates and
assumptions are continually evaluated and are based on historical experience and other factors, including
expectation of future events that are believed to be reasonable under the circumstances.
Critical judgement in applying accounting policies
Management has exercised the following critical judgements in applying accounting policies:
• Capitalisation of National Oracle Solution (NOS) Programme (previously known as Finance, Procurement and Supply Chain Programme) – refer to Note 9.
• Impairment of NOS Assets – refer to Note 9.
© CROWN COPYRIGHT NZ HEALTH PARTNERSHIPS ANNUAL REPORT 2016 | 47
2. Revenue
Accounting Policy
Funding from DHBs
NZHP is funded through revenue received from the DHBs, which is restricted in its use for the purpose of
NZHP meeting its objectives as specified in the Statement of Intent. The breakdown of revenue of different
output class is on pages 25 and 32. Revenue is recognised as revenue when earned and is reported in the
financial period to which it relates.
There were no donations received during the year.
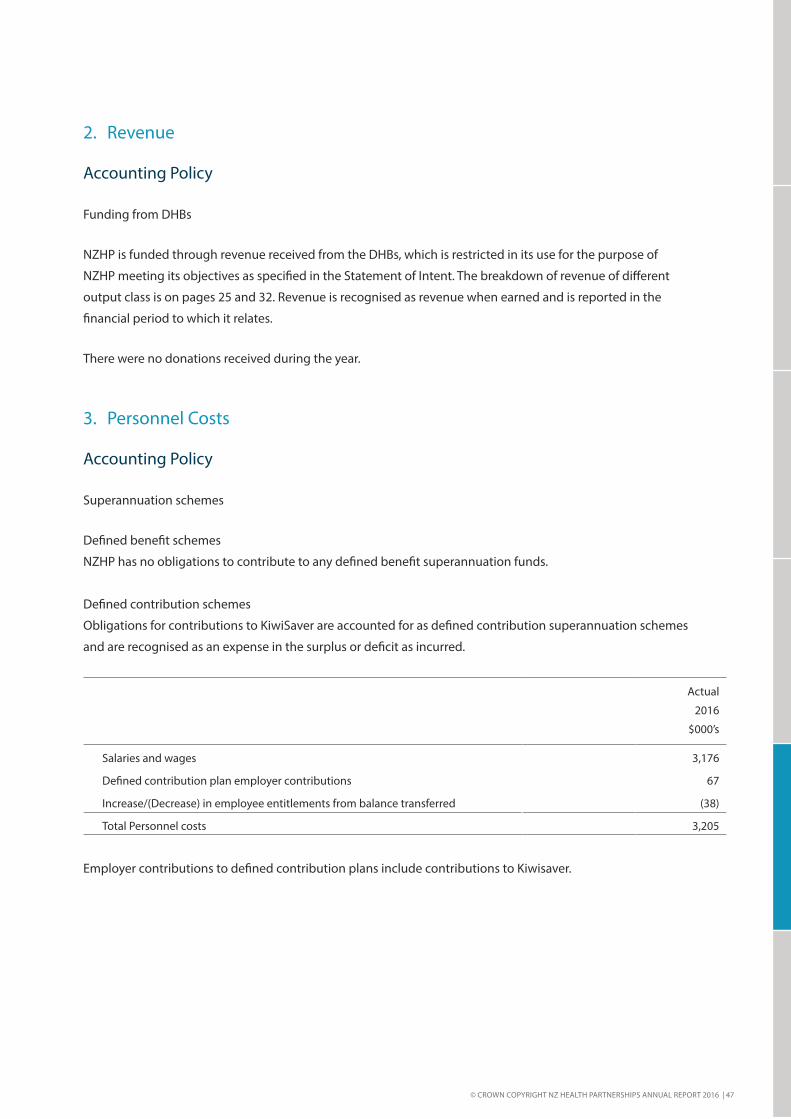
3. Personnel Costs
Accounting Policy
Superannuation schemes
Defined benefit schemes
NZHP has no obligations to contribute to any defined benefit superannuation funds.
Defined contribution schemes
Obligations for contributions to KiwiSaver are accounted for as defined contribution superannuation schemes
and are recognised as an expense in the surplus or deficit as incurred.
Actual
2016
$000’s
Salaries and wages 3,176
Defined contribution plan employer contributions 67
Increase/(Decrease) in employee entitlements from balance transferred (38)
Total Personnel costs 3,205
Employer contributions to defined contribution plans include contributions to Kiwisaver.

48 | © CROWN COPYRIGHT NZ HEALTH PARTNERSHIPS ANNUAL REPORT 2016
Employee remuneration
The Company paid short term benefits in excess of $100,000 by way of remuneration including salary and
benefits to 9 employees during the year.
Actual
2016
Total remuneration paid or payable:
$100,000 - $109,999 0
$110,000 - $119,999 2
$120,000 - $129,999 0
$130,000 - $139,999 2
$140,000 - $149,999 1
$150,000 - $159,999 1
$160,000 - $169,999 0
$170,000 - $179,999 1
$230,000 - $239,999 2
Total employee remuneration 9
During the year ended 30 June 2016, 8 employees received compensation and other benefits in relation to
cessation totalling $285k.
Board member remuneration
The total value of remuneration paid or payable to each Board member during the year was:
Actual
2016
$000’s
Peter Anderson (started Oct 15, chair from Feb 16) 34
Sue Suckling (interim chair, resigned Jan 16) 34
Lee Mathias 29
Terry McLaughlin (started Oct 15) 22
Murray Cleverley 29
Jo Hogan (started Apr 16) 7
Deryck Shaw 29
Phil Sunderland 29
Total Board member remuneration 213
There have been no payments made to committee members appointed by the Board who are not Board
members during the financial year.

© CROWN COPYRIGHT NZ HEALTH PARTNERSHIPS ANNUAL REPORT 2016 | 49
NZHP has provided a deed of indemnity to Directors for certain activities undertaken in the performance of
NZHP’s functions.
NZHP has effected Directors’ and Officers’ Liability and Professional Indemnity insurance cover during the
financial year in respect of the liability or costs of Board members and employees.
No Board members received compensation or other benefits in relation to cessation.
4. Other Expenses
Accounting Policy
Operating leases
An operating lease is a lease that does not transfer substantially all the risks and rewards incidental to
ownership of an asset to the lessee. Lease payments under an operating lease are recognised as an expense
on a straight line basis over the lease term. Lease incentives received are recognised in the surplus/deficit as
a reduction of rental expense over the lease term.
Actual
2016
$000’s
Fees to principal auditor, Audit New Zealand:
- Audit fees for financial statement 128
Other Auditors e.g. GT, EY 150
Staff travel 224
Consultancy costs 1,274
Services contracted out 14,947
Contractors 1,537
Operating Lease Expense 382
Board member fees 213
Loss on sale of Assets 1,091
Other expenses 4,485
Total Other expenses 24,431

50 | © CROWN COPYRIGHT NZ HEALTH PARTNERSHIPS ANNUAL REPORT 2016
Operating leases as lessee
Actual
2016
$000’s
Rent payable under non-cancellable operating leases to the end of the lease terms are:
- Not later than one year 170
- Later than one year and not later than five years 190
- Later than five years 0
NZHP has two performance guarantees of $186K and $114K with Goodman Nominee (Ltd) through Westpac.
5. Cash and Cash Equivalents
Accounting Policy
Cash and cash equivalents includes cash on hand, deposits held at call with banks and other short-term
highly liquid investments with original maturities of three months or less. All investments are held in New
Zealand.
Actual
2016
$000’s
Cash at bank and on hand 207
Call deposits 5,950
DHB Shared Banking Facility 104,409
Total Cash and cash equivalents 110,566
Amounts held within the shared banking facility are not available for use by NZHP.

© CROWN COPYRIGHT NZ HEALTH PARTNERSHIPS ANNUAL REPORT 2016 | 51
6. Receivables
Accounting Policy
Short term receivables are recorded at the amount due, less any provision for uncollectability.
A receivable is considered impaired when there is evidence that NZHP will not be able to collect the amount
due. The amount of the impairment is the difference between the carrying amount of the receivable and the
present value of the amounts expected to be collected.
Actual
2016
$000’s
Receivables 9,077
Less: provision for impairment 0
Total receivables 9,077
Total receivables comprises:
Receivables 8,861
GST receivables 216
Total receivables 9,077
The ageing profile of receivables at year end is detailed below:
Gross
$000’s
2016 Actual
Impairment
$000’s
Net
$000’s
Not past due 9,077 0 9,077
Past due over 90 days 0 0 0
Total 9,077 0 9,077
All receivables greater than 90 days in age are considered to be past due.
NZHP has a very small number of receivables, and impairment is assessed based on individual amounts
outstanding and the likelihood of non-payment.

52 | © CROWN COPYRIGHT NZ HEALTH PARTNERSHIPS ANNUAL REPORT 2016
7. Investments
Accounting Policy
Bank term deposits
Bank term deposits are initially measured at the amount invested. Interest is subsequently accrued and
added to the investment balance.
Actual
2016
$000’s
Current portion
Term deposits with maturities greater than 3 months and remaining durations less than 12 months
120,000
Total Current Portion 120,000
Non-Current portion
Term deposits with maturities greater than 3 months and remaining durations greater than 12 months
20,000
Total Non-Current Portion 20,000
Total Investment 140,000
The carrying value of term deposits approximate their fair value.
8. Property, plant and equipment
Accounting Policy
Property, plant and equipment consist of three asset classes, which are as follows:
1. Leasehold improvements,
2. Furniture, office equipment,
3. and Information technology.
Property, plant and equipment are shown at cost, less any accumulated depreciation and impairment losses.

© CROWN COPYRIGHT NZ HEALTH PARTNERSHIPS ANNUAL REPORT 2016 | 53
Additions
The cost of an item of property, plant and equipment is recognised as an asset only when it is probable that
future economic benefits or service potential associated with the item will flow to NZHP and the cost of the
item can be measured reliably.
In most instances, an item of property, plant and equipment is initially recognised at its cost. Where an asset
is acquired through a non-exchange transaction, it is recognised at its fair value as at the date of acquisition.
The cost of day-to-day servicing of property, plant, and equipment is expensed in the surplus or deficit as they
are incurred.
Disposals
Gains and losses on disposals are determined by comparing the proceeds with the carrying amount of the
asset and are reported in the surplus or deficit.
Depreciation
Depreciation is provided on a straight-line basis on all property, plant and equipment, at rates that will
write-off the cost (or valuation) of the assets to their estimated residual values over their useful lives. The
useful lives and associated depreciation rates of major classes of property, plant and equipment have been
estimated as follows:
Asset Type Useful Life Rate
Leasehold improvements 5 – 14 years 7% - 20%
Furniture and office equipment 1.5 – 9.5 years 10.5% - 67%
IT Hardware 2.5 – 5 years 20% - 40%
Leasehold improvements are depreciated over the unexpired period of the lease or the estimated remaining
useful lives of the improvements, whichever is the shorter.
Impairment of property, plant and equipment
NZHP does not hold any cash-generating assets. Assets are considered cash-generating where their primary
objective is to generate a commercial return.
Non-cash-generating assets
Property, plant, and equipment held at cost that have a finite useful life are reviewed for impairment whenever
events or changes in circumstances indicate that the carrying amount may not be recoverable. An impairment
loss is recognised for the amount by which the asset’s carrying amount exceeds its recoverable service
amount. The recoverable service amount is the higher of an asset’s fair value, less costs to sell, and value in
use.

54 | © CROWN COPYRIGHT NZ HEALTH PARTNERSHIPS ANNUAL REPORT 2016
Value in use is the present value of an asset’s remaining service potential. It is determined using an approach
based on either a depreciated replacement cost approach, a restoration cost approach, or a service units
approach. The most appropriate approach used to measure value in use depends on the nature of the
impairment and availability of information.
If an asset’s carrying amount exceeds its recoverable service amount, the asset is regarded as impaired and
the carrying amount is written down to the recoverable amount. The total impairment loss is recognised in the
surplus or deficit.
The reversal of an impairment loss is recognised in the surplus or deficit.
Breakdown of property, plant and equipment and further information
Movements for each class of property, plant, and equipment are as follows:
Leasehold
Improvements
$000’s
Furniture and
office
equipment
$000’s
Information
Technology
$000’s
Total
$000’s
Cost or valuation
Balance at 1 July 2015 0 0 0 0
Contributed Assets 12 63 1,633 1,708
Additions 0 4 2 6
Disposal/sales 0 0 (1,601) (1,601)
Balance as 30 June 2016 12 67 34 113
Accumulated depreciation and impairment losses
Balance at 1 July 2015 0 0 0 0
Depreciation expense 4 16 443 463
Elimination on disposal (428) (428)
Balance as 30 June 2016 4 16 15 35
Carrying amounts
At 1 July 2015 0 0 0 0
At 30 June 2016 8 51 19 78
The total amount of property, plant and equipment in the course of construction is $nil

© CROWN COPYRIGHT NZ HEALTH PARTNERSHIPS ANNUAL REPORT 2016 | 55
9. Intangible Assets
Accounting Policy
Software acquisition and development
Computer software licenses are capitalised on the basis of the costs incurred to acquire and bring to use the
specific software. Staff training costs are recognised as an expense when incurred. Costs associated with
maintaining computer software are recognised as an expense when incurred.
Costs associated with development and maintenance of NZ Health Partnership’s website is recognised as
an expense when incurred. Costs that are directly associated with the development of software for internal
use are recognised as an intangible asset. Direct costs include software development employee costs and an
appropriate portion of relevant overheads.
Amortisation
The carrying value of an intangible asset with a finite life is amortised on a straight-line basis over its
useful life. Amortisation begins when the asset is available for use and ceases at the date that the asset is
derecognised. The amortisation charge for each financial year is recognised in the surplus or deficit.
The useful lives and associated amortisation rates of major classes of intangible assets have been estimated
as follows:
Acquired computer software 2.5 - 5 years 20% - 40%
Impairment of intangible assets
Refer to the policy for impairment of property, plant, and equipment in Note 8. The same approach applies to
the impairment of intangible assets.
At 30 June 2016, DHBs have made payments in relation to the National Oracle Solution (NOS) Programme
(previously known as Finance Procurement and Supply Chain Programme), which was held in work in
progress at year end. The NOS rights have been tested for impairment by comparing the carrying amount of
the intangible asset to its replacement cost (RC), which is considered to equate to the DHB’s share of the RC
of the underlying NOS assets.
Critical judgement in applying accounting policies
Capitalisation of National Oracle Solution
The National Oracle Solution “NOS” (previously known as Finance Procurement and Supply Chain (FPSC))
programme is a significant part of health sectors saving initiatives.
56 | © CROWN COPYRIGHT NZ HEALTH PARTNERSHIPS ANNUAL REPORT 2016
The NOS programme is set to improve the way goods and services are made available to DHBs for
purchasing, ordering, delivery storage and payment. A national approach to these services will combine the
purchasing power of DHBs, create visibility of stock and ensure a common financial language across the
health sector.
Throughout the development of the NOS programme, the assets that are created by the programme will be
held in Work in Progress (WIP). The construction is expected to be completed and rolled out by 1 July 2017.
The NOS programme is not a single asset, but a bundle of assets that are both tangible such as IT hardware
and intangible, such as software, policy manuals, process documentation, process maps, standard operating
procedures, reference materials and intellectual property.
The costs that are directly associated with the development of the NOS programme will be recognised
as tangible or intangible assets when it is in the location and condition necessary for it to be capable of
operating in the manner intended by management. Direct costs include project development employees,
contractors, consultants and apportionment of the relevant overheads.
Indirect costs are recognised as expenses when incurred and include e.g. depreciation, software licenses,
and software maintenance costs.
Amortisation
The amortisation of the assets will begin once the asset is available for use (commissioned into the fixed
asset register) and will cease at the date that the asset is derecognised. The carrying value of an intangible
asset with a finite life is amortised on a straight line basis over its useful life. The useful lives of NOS
intangible assets have been estimated to be 15 years (life of the contract).
Impairment of NOS Assets
NZHP has considered the impairment of the NOS assets at 30 June 2016 under the applicable accounting
standards, specifically PBE IPSAS 21 Impairment of Non-Cash-Generating Assets. The managements view is
that there is no impairment.
There are a number of considerations that were given in reaching the conclusion that are set out below:
• the NOS asset is deemed to be a non-cash generating asset. This is on the basis that there are no cash flows directly linked to the asset. Rather, the benefit to each DHB is the potential cost savings from a negotiated national contract above the cost of each DHB negotiating a similar contract themselves. It is also noted that the class B shares held by each DHB are non-voting and do not carry any entitlement to any dividends
• there is no indication that the demand or need for the services provided by the asset will cease or near cessation

© CROWN COPYRIGHT NZ HEALTH PARTNERSHIPS ANNUAL REPORT 2016 | 57
• there has been no significant long-term changes with an adverse effect on NZHP that has taken place during the period, or will take place in the near future, in the technological, legal, or government policy environment in which the entity operates.
• there has been no physical damage to the asset.
• there has been no significant long-term change with an adverse effect on NZHP that has taken place during the period, or will take place in the near future, to the extent to which, or manner in which an asset is used or expected to be used.
• there is no indication for a decision to halt the construction of the asset before it is complete or in a usable condition and sufficient funds are available or will be made available to complete the asset.
• the benefits that the programme is forecast to deliver will be in excess of the total costs of the programme including costs to date. Benefit delivery is driven by the scope of the programme and as such it is expected that the programme is to be delivered consistent with the original scope
• that the WIP does not include any material costs that reflect inefficiency or similar items.
• the National Finance Shared Service and the National Supply Chain Shared Services have been deferred to a future date that was approved in the change case.
NZHP has taken over from Health Benefits Limited a range of Capital Commitments in relation to the
development of the NOS System. The nature and extent of these commitments are variable at NZHP’s
discretion and may change in duration, value or mix at any point in time. At any point in time all of these
Commitments will be funded within the funding envelope that has been secured from the DHBs to fund the
development of the NOS System.
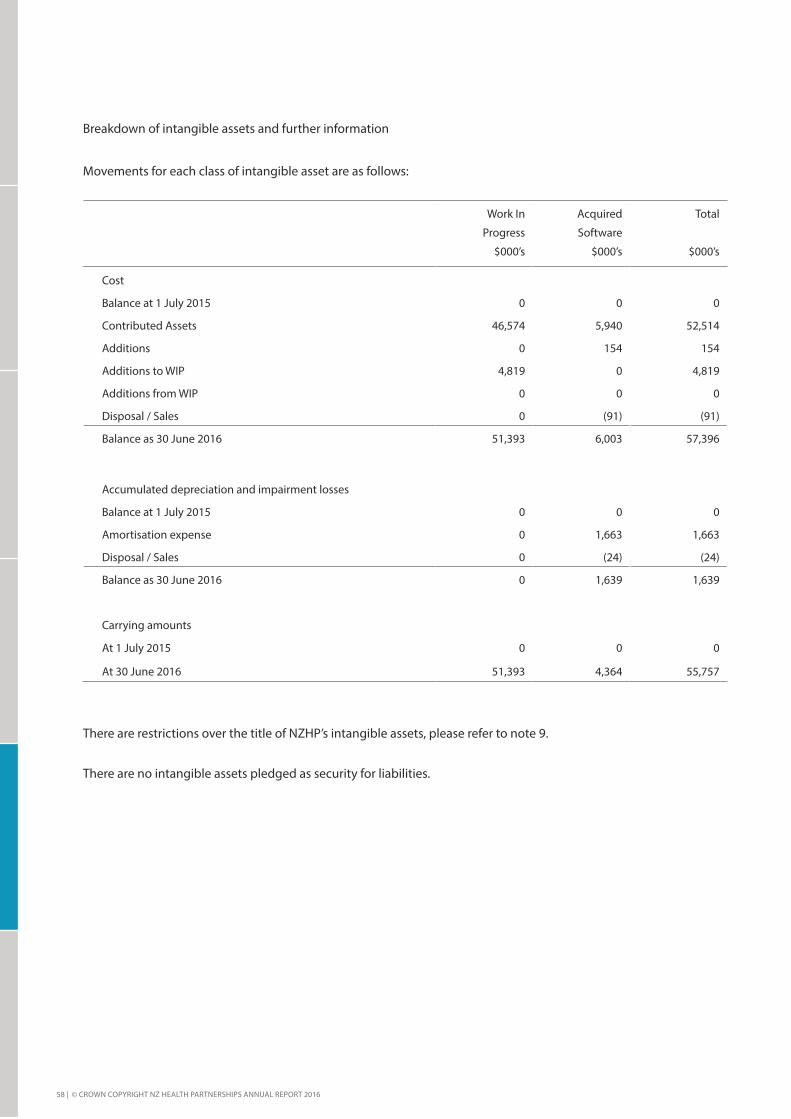
58 | © CROWN COPYRIGHT NZ HEALTH PARTNERSHIPS ANNUAL REPORT 2016
Breakdown of intangible assets and further information
Movements for each class of intangible asset are as follows:
Work In
Progress
$000’s
Acquired
Software
$000’s
Total
$000’s
Cost
Balance at 1 July 2015 0 0 0
Contributed Assets 46,574 5,940 52,514
Additions 0 154 154
Additions to WIP 4,819 0 4,819
Additions from WIP 0 0 0
Disposal / Sales 0 (91) (91)
Balance as 30 June 2016 51,393 6,003 57,396
Accumulated depreciation and impairment losses
Balance at 1 July 2015 0 0 0
Amortisation expense 0 1,663 1,663
Disposal / Sales 0 (24) (24)
Balance as 30 June 2016 0 1,639 1,639
Carrying amounts
At 1 July 2015 0 0 0
At 30 June 2016 51,393 4,364 55,757
There are restrictions over the title of NZHP’s intangible assets, please refer to note 9.
There are no intangible assets pledged as security for liabilities.

© CROWN COPYRIGHT NZ HEALTH PARTNERSHIPS ANNUAL REPORT 2016 | 59
10. Payables
Accounting Policy
Short-term payables are recorded at their face value.
Actual
2016
$000’s
Creditors 1,043
Accrued expenses 9,197
Other payables 133
Tax payable (GST and PAYE) 73
Total payables 10,446
Creditors and other payables are non-interest bearing and are normally settled on 30-day terms. Therefore,
the carrying value of creditors and other payables approximates their fair value.

60 | © CROWN COPYRIGHT NZ HEALTH PARTNERSHIPS ANNUAL REPORT 2016
DHB and other Shared Banking Facility
Actual
2016
$000’s
Northland District Health Board 2,177
Waitemata District Health Board 53,631
Auckland District Health Board 31,887
Counties Manukau District Health Board 31,726
Waikato District Health Board 811
Bay of Plenty District Health Board 7,252
Lakes District Health Board 1,201
Hauora Tairawhiti Health Board (6,804)
Taranaki District Health Board (8,672)
Hawke’s Bay District Health Board 14,223
MidCentral District Health Board 24,582
Whanganui District health Board 10,958
Capital & Coast District Health Board 12,775
Hutt Valley District health Board 4,233
Wairarapa District Health Board (1,412)
Nelson Marlborough District Health Board 24,774
West Coast District Health Board 11,795
Canterbury District Health Board 11,117
South Canterbury District Health Board 19,155
Southern District Health Board (9,803)
HealthShare Limited 1,035
healthAlliance Limited 6,122
healthAlliance (FPSC) Limited 15
Total DHB Shared Banking Facility 242,778
Current Assets a. 26,691
Current Liabilities b. 269,469
Total DHB Shared Banking Facility 242,778
This balance is represented by:
Cash and cash equivalents 104,409
Term deposits 140,000
Accrued interest (1,595)
Admin fee (36)
Total 242,778

© CROWN COPYRIGHT NZ HEALTH PARTNERSHIPS ANNUAL REPORT 2016 | 61
11. Employee Entitlements
Accounting Policy
Short-term employee entitlements
Employee benefits that are due to be settled within 12 months after the end of the period in which the
employee renders the related service are measured at nominal values based on accrued entitlements at
current rates of pay. These include salaries and wages accrued up to balance date and annual leave earned to
but not yet taken at balance date.
A liability and an expense is recognised where there is a contractual obligation or where there is a past
practice that has created a constructive obligation and a reliable estimate of the obligation can be made.
Presentation of employee entitlements
Sick leave and annual leave are classified as a current liability.
Actual
2016
$000’s
Current portion
Accrued salaries and wages 41
Annual leave 136
Employee Sick Leave Entitlements 0
Total current portion 177
Non-Current portion
Employee Sick Leave Entitlements 0
Total Non-Current Portion 0
Total Employee Entitlements 177
NZHP does not currently have any employment agreement containing long service leave entitlements. All
employee entitlements relate to annual leave entitlements expected to be taken within the twelve months
following the entitlement falling due.

62 | © CROWN COPYRIGHT NZ HEALTH PARTNERSHIPS ANNUAL REPORT 2016
12. Equity
Accounting Policy
Equity is measured as the difference between total assets and total liabilities. Equity is disaggregated and
classified into the following components.
• Accumulated surplus / (deficit)
• Contributed Capital – Crown Equity
• Capital Injection – “B” Class Shares
Actual
2016
$000’s
Accumulated surplus / (deficit)
Surplus/ (Deficit) for the year (4,098)
Balance at 30 June (4,098)
Accumulated deficit transferred from HBL (3,716)
B class shares transferred 68,333
Capital contributions transferred 299
Balance at 30 June 64,916
Total Equity 60,818
NZHP has issued 100 A class shares at $1 per share. $68.333m B class shares were transferred from HBL
and reissued under NZHP.
NZHP has issued B Class Shares to DHBs for the purpose of funding the development of the National NOS
Shared Service. The following rights are attached to these shares;
• B Class Shares confer no voting rights
• B Class Shareholders shall have the right to access the NOS Shared Services
• The Class B Shares confer no right to a dividend other than the Board may authorise a dividend by the Company at a time and of an amount to the Class B Shareholders as it thinks fit, but the Dividend may only be made out of any surplus earned by the Company from NOS Shared Service Services
• Holders of B Class Shares have the same rights as A Class Shares to receive notices, reports and accounts of the Company and to attend general meetings of the Company
• On liquidation or dissolution of the Company, each B Class Shareholder shall be entitled to be paid from surplus assets of the Company an amount equal to the holder’s proportional share of the liquidation value of the Assets based upon the proportion of the total number of issued and paid up B Class shares that it holds. Otherwise each paid up B Class Share confers no right to a share in

© CROWN COPYRIGHT NZ HEALTH PARTNERSHIPS ANNUAL REPORT 2016 | 63
the distribution of the surplus assets. This payment shall be made in priority to any distribution of surplus assets in respect of A Class Shares
• On liquidation or dissolution of the Company, each unpaid B Class Shares confers no right to a share in the distribution of the surplus assets.
13. Related Party Transactions
Related party disclosures have not been made for transactions with related parties that are:
• within a normal supplier or client/recipient relationship
• on terms and conditions no more or less favourable than those that it is reasonable to expect NZHP would have adopted in dealing with the party at arm’s length in the same circumstances.
Further, transactions with other government agencies (for example, Government departments and Crown
entities) are not disclosed as related party transactions when they are consistent with the normal operating
arrangements between government agencies and undertaken on the normal terms and conditions for such
transactions.
Key management personnel
No transactions were entered into during the year with key management personnel apart from salaries and
reimbursed expenses.
Key management personnel compensation
Actual
2016
$000’s
Board Members
Remuneration 213
Full time equivalent members 6.33
Leadership Team
Remuneration 1009
Full time equivalent members 5.83
Total Key management personnel remuneration 1,222
Total full time equivalent personnel 12.16
Key management personnel include all board members, the Chief Executive, and members of the NZHP
Executive Team. Due to the difficulty in determining the full time equivalent for board members, the full time
equivalent figure is taken as the number of board members.

64 | © CROWN COPYRIGHT NZ HEALTH PARTNERSHIPS ANNUAL REPORT 2016
14. Financial Instruments
14A Financial Instrument Categories
The carrying amounts of financial assets and liabilities in each of the NZ PBE IPSAS 28 categories are as
follows:
Actual
2016
$000’s
Loans and receivables
Cash and cash equivalents 110,566
Receivables (excluding GST) 8,861
DHB Shared Banking Facility 26,691
Investments - Term deposits 140,000
Total loans and receivables 286,118
Financial liabilities measured at amortised cost
Payables (excluding income in advance and GST) 10,373
DHB Shared Banking Facility 269,469
Total financial liabilities measured at amortised cost 279,842
14B Financial Instrument Risks
NZHP’s activities expose it to credit risk, cash flow risk and liquidity risk. NZHP policy does not allow any
transactions that are speculative in nature to be entered into.
Fair value interest rate risk
Fair value interest rate risk is the risk that the fair value of a financial instrument will fluctuate due to changes
in market interest rates. NZHP’s exposure to fair value interest rate risk is limited to its cash deposits which
are held at variable rates of interest. NZHP does not actively manage its exposure to fair value interest rate
risk.
Cash flow interest rate risk
Cash flow interest rate risk is the risk that the cash flows from financial instruments will fluctuate because of
changes in market interest rates. NZHP’s exposure to cash flow interest rate risk is limited to term deposits.
This exposure is not considered significant and is not actively managed.

© CROWN COPYRIGHT NZ HEALTH PARTNERSHIPS ANNUAL REPORT 2016 | 65
Credit risk
Credit risk is the risk that a third party will default on its obligation to NZHP, causing it to incur a loss. Due to
the timing of its cash inflows and outflows, NZHP invests surplus cash with registered banks.
NZHP has processes in place to review the credit quality of customers prior to the granting of credit. In the
normal course of business, NZHP is exposed to credit risk from cash and term deposits with banks, debtors
and other receivables. For each of these, the maximum credit exposure is best represented by the carrying
amount in the statement of financial position.
NZHP holds no collateral or other credit enhancements for financial instruments that give rise to credit risk.
NZHP will ensure that any participating DHB’s maximum debit balance does not exceed one month’s Provider
Arm revenue (consistent with Ministry of Health requirements). Escalation to the NZHP Chief Executive/
Ministry of Health officials is required if it appears likely that this restriction will be breached, potentially
including the removal of the offending DHB from the Sweep (immediately following receipt of monthly
Ministry revenue).
NZHP will ensure that Westpac’s Standard & Poor’s long-term credit rating shall not fall below “A+” as stated
in its treasury policy. Escalating action, including discussion with Westpac, DHBs, and Ministry/Treasury
officials, should commence if Westpac’s “A+” rating is placed on “negative outlook”.
NZHP will ensure that Sweep-related credit exposure to other entities shall be controlled as follows:
• Term investments shall only be made with,
- New Zealand registered and incorporated banks that are systemically important (ie Kiwibank,
Westpac New Zealand Limited, Bank of New Zealand, ANZ National Bank Limited and ASB
Bank Limited). Permitted exposure to such banks is unlimited.
- New Zealand registered banks (not otherwise included above), subject to individual credit
limits approved by NZHP’s Board. These limits are to be reviewed 6 monthly or when the
credit rating is downgraded or placed on “negative” outlook.
• In all cases with a long-term Standard & Poor’s credit rating of “A+” or better. This is to be confirmed at the time each term deposit is made for the bank concerned.
• No credit exposure to any other party for any other Sweep-related purpose shall be accepted.
• If a bank’s (other than Westpac’s) credit rating falls below “A+”:
- If it remains at or below the minimum credit rating outlined in the Operational Policy
Framework for DHB maintaining accounts with that bank, place no further deposits with that
bank and let all existing deposits run to maturity.
- If it falls below the minimum credit rating outlined in the Operational Policy Framework,
consult with the CFO Reference Group whether to let the deposits run to maturity or
immediately break them. If the deposit has more than two months to run to maturity, the
approval of the Minister of Finance is required to break them.

66 | © CROWN COPYRIGHT NZ HEALTH PARTNERSHIPS ANNUAL REPORT 2016
- If the downgrade is systemic, discuss the situation with DHB CFOs and Ministry of Health /
Treasury officials before taking any action.
Credit quality of financial assets
The credit quality of financial assets that are neither past due nor impaired can be assessed by reference to
Standard and Poor’s credit ratings (if available) or to historical information about counterparty default rates:
Actual
2016
$000’s
COUNTERPARTIES WITH CREDIT RATINGS
Cash, cash equivalents and investments
AA- rated 250,566
Total cash, cash equivalents and investments 250,566
COUNTERPARTIES WITHOUT CREDIT RATINGS
Receivables
Existing counterparty with no defaults in the past
Debtors and other receivables (excluding GST) 8,861
DHB Shared Banking Facility 26,691
Total receivables 35,552
Liquidity risk
Management of liquidity risk
Liquidity risk is the risk that NZHP will encounter difficulty raising liquid funds to meet commitments as they
fall due. Prudent liquidity risk management implies maintaining sufficient cash and the ability to close out
market positions. NZHP manages liquidity risk by continuously monitoring forecast and actual cash flow
requirements.
DHB Shared Banking Facility:
There is a risk that a DHB does not obtain sufficient funds from NZHP because NZHP has too much of its
funds invested on term deposits or because DHBs are, in total, overdrawn.
The agreement requires DHBs to provide up to date cash forecasts to NZHP, which will help NZHP to manage
this risk. Further, NZHP has a standby facility with Westpac that will allow it to borrow any such shortfalls up
to $50m. As at 30 June 2016 there was no risk of this nature. Thus liquidity risk would only arise if DHBs
were, in total, overdrawn in excess of this amount. Further, NZHP maintains a $75m "buffer" in its sweep
account before funds are placed on term deposit.
Contractual maturity analysis of financial liabilities
The table below analyses financial liabilities into relevant maturity groupings based on the remaining period

© CROWN COPYRIGHT NZ HEALTH PARTNERSHIPS ANNUAL REPORT 2016 | 67
at balance date to the contractual maturity date. The amounts disclosed are the contractual undiscounted
cash flows.
Carrying
amount
$000’s
Contractual
cash flows
$000’s
Less than
6 months
$000’s
6-12
months
$000’s
Greater
than 1 yr
$000’s
2016
Payables (excluding income in advance, taxes payable and grants received subject to conditions) 10,373 10,373 10,373 0 0
DHB Shared Banking Facility 269,469 269,469 269,469 0 0
Total 279,842 279,842 279,842 0 0
15. Contingencies
NZHP does not have any contingent assets or liabilities.
16. Events after the balance date
There have been no material events subsequent to 30 June 2016.
17. Explanation of major variances against budget
Statement of comprehensive income
Revenue
Interest Revenue
Interest Income is $4.3m is higher than budget due to higher than planned shared banking activities and
longer term deposits maturing.
Other revenue
Other revenue was $1.54m lower than budget due to delays in service establishment in the National
Infrastructure Platform programme.
Expenses
Personnel Costs
Personnel costs is $890k lower than budget due to the lower than planned staff which is offset against the
other expenses.
Interest Expenses

68 | © CROWN COPYRIGHT NZ HEALTH PARTNERSHIPS ANNUAL REPORT 2016
Interest expenses is $4.36m is higher than budget due to higher than planned interest revenue generated.
Other expenses
Other expenses is $2.75m higher than budget due to a new infrastructure as a Service being deployed and old
decommissioned.
Statement of Financial Position
Cash, cash equivalents and DHB Shared Banking Facility
Cash, cash equivalents and DHB Shared Banking Facility were lower than budget by $55m (refer to note 5)
mainly due to the funds held in investments for the DHB Sweep account on behalf of the DHBs.
Investment
Investment for short term and long term was higher than budget by $50m due to the funds held in the DHB
Sweep account on behalf of the DHBs.
DHB shared banking facility under current Liabilities
DHB shared banking facility were lower than budget by $11.56m due to changes in the individual DHBs’ cash
positions.
Statement of Cash Flows
Cash receipts and payments varied to the budgets due to changes in the individual DHBs’ cash positions.
18. Capital management
NZ Health Partnerships’ capital is its equity, which comprises capital and accumulated surplus/(deficit).
Equity is represented by net assets.
NZHP is subject to the financial management and accountability provisions of the Crown Entities Act
2004, which impose restrictions in relation to borrowings, acquisition of securities, issuing guarantees and
indemnities, and the use of derivatives.
NZHP manages its equity by prudently managing revenues, expenses, assets, liabilities, investments, and
general financial dealings to ensure the company effectively achieves its objectives and purpose.

© CROWN COPYRIGHT NZ HEALTH PARTNERSHIPS ANNUAL REPORT 2016 | 69
Independent Auditor's Report
Independent Auditor’s Report
To the readers of NZ Health Partnership Limited’s financial statements and performance
information for the year ended 30 June 2016
The Auditor-General is the auditor of NZ Health Partnerships Limited (NZHP). The Auditor-General has appointed me, Andy Burns, using the staff and resources of Audit New Zealand, to carry out the audit of the financial statements and the performance information of NZHP on her behalf.
Opinion on the financial statements and the performance information
We have audited:
the financial statements of NZHP on pages 38 to 68, that comprise the statement of financial position as at 30 June 2016, the statement of comprehensive revenue and expenses, statement of changes in equity and statement of cashflows for the year ended on that date and the notes to the financial statements that include accounting policies and other explanatory information; and
the performance information of NZHP on pages 17 to 36.
In our opinion:
The financial statements of NZHP:
present fairly, in all material respects:
its financial position as at 30 June 2016; and
its financial performance and cash flows for the year then ended; and
comply with generally accepted accounting practice in New Zealand and have been prepared in accordance with Public Benefit Entity Standards.
The performance information:
presents fairly, in all material respects, NZHP’s performance for the year ended 30 June 2016, including for each class of reportable outputs:
its standards of performance achieved as compared with forecasts included in the statement of performance expectations for the financial year; and

70 | © CROWN COPYRIGHT NZ HEALTH PARTNERSHIPS ANNUAL REPORT 2016
its actual revenue and output expenses as compared with the forecasts included in the statement of performance expectations for the financial year.
Complies with generally accepted accounting practice in New Zealand.
Our audit was completed on 27 October 2016. This is the date at which our opinion is expressed.
The basis of our opinion is explained below. In addition, we outline the responsibilities of the Board and our responsibilities, and explain our independence.
Basis of opinion
We carried out our audit in accordance with the Auditor-General’s Auditing Standards, which incorporate the International Standards on Auditing (New Zealand). Those standards require that we comply with ethical requirements and plan and carry out our audit to obtain reasonable assurance about whether the financial statements and the performance information are free from material misstatement.
Material misstatements are differences or omissions of amounts and disclosures that, in our judgement, are likely to influence readers’ overall understanding of the financial statements and the performance information. If we had found material misstatements that were not corrected, we would have referred to them in our opinion.
An audit involves carrying out procedures to obtain audit evidence about the amounts and disclosures in the financial statements and the performance information. The procedures selected depend on our judgement, including our assessment of risks of material misstatement of the financial statements and the performance information, whether due to fraud or error. In making those risk assessments, we consider internal control relevant to the preparation of NZHP’s financial statements and performance information in order to design audit procedures that are appropriate in the circumstances, but not for the purpose of expressing an opinion on the effectiveness of NZHP’s internal control.
An audit also involves evaluating:
the appropriateness of accounting policies used and whether they have been consistently applied;
the reasonableness of the significant accounting estimates and judgements made by the Board;
the appropriateness of the reported performance information within NZHP’s framework for reporting performance;
the adequacy of the disclosures in the financial statements and the performance information; and
the overall presentation of the financial statements and the performance information.
We did not examine every transaction, nor do we guarantee complete accuracy of the financial statements and the performance information. Also, we did not evaluate the security and controls over the electronic publication of the financial statements and the performance information.

© CROWN COPYRIGHT NZ HEALTH PARTNERSHIPS ANNUAL REPORT 2016 | 71
We believe we have obtained sufficient and appropriate audit evidence to provide a basis for our audit opinion.
Responsibilities of the Board
The Board is responsible for preparing financial statements and performance information that:
comply with generally accepted accounting practice in New Zealand and Public Benefit Entity Standards;
present fairly NZHP’s financial position, financial performance and cash flows; and
present fairly NZHP’s performance.
The Board’s responsibilities arise from the Crown Entities Act 2004.
The Board is responsible for such internal control as it determines is necessary to enable the preparation of financial statements and performance information that are free from material misstatement, whether due to fraud or error. The Board is also responsible for the publication of the financial statements and the performance information, whether in printed or electronic form.
Responsibilities of the Auditor
We are responsible for expressing an independent opinion on the financial statements and the performance information and reporting that opinion to you based on our audit. Our responsibility arises from the Public Audit Act 2001.
Independence
When carrying out the audit, we followed the independence requirements of the Auditor-General, which incorporate the independence requirements of the External Reporting Board.
In addition to the audit, we have carried out an assignment providing assurance over a contract sign off request for NIP transition programme consultancy. This assignment is compatible with those independence requirements. Other than the audit and this assignment, we have no relationship with or interests in NZHP.
Andy Burns Audit New Zealand On behalf of the Auditor-General Auckland, New Zealand

72 | © CROWN COPYRIGHT NZ HEALTH PARTNERSHIPS ANNUAL REPORT 2016
DirectoryRegistered Office
Level 2, Building 2
Central Park
660-670 Great South Road
Penrose, Auckland
New Zealand
NZBN 94290041807927
Contact Address
PO Box 11-410
Ellerslie
Auckland 1061
New Zealand
Email: [email protected] Web: www.nzhealthpartnerships.co.nz
Phone: +64 9 487 4900
Auditor
The Auditor-General pursuant to section 15 of the Public Audit Act 2001. Andy Burns of Audit New
Zealand was appointed to perform the audit on behalf of the Auditor-General.
Banker
Westpac Banking Corporation