Methodology Report for the nz health survey
91
Methodology Report for the 2006/07 New Zealand Health Survey
Transcript of Methodology Report for the nz health survey

Methodology Report for the 2006/07 New Zealand Health Survey

Ministry of Health. 2008. Methodology Report for the 2006/07 New Zealand Health Survey. Wellington: Ministry of Health.
Published in June 2008 by the Ministry of Health
PO Box 5013, Wellington, New Zealand
ISBN 978-0-478-31771-8 (online) HP 4598
This document is available on the Ministry of Health’s website: http://www.moh.govt.nz

Authors This report was written by Dr Robert Clark (Centre for Statistical and Survey Methodology, University of Wollongong, Australia), Miranda Devlin, Sarah Gerritsen, Robert Templeton and Niki Stefanogiannis (Public Health Intelligence, Ministry of Health).
Methodology Report for the 2006/07 New Zealand Health Survey iii

Acknowledgements Thank you to the many thousands of New Zealanders who gave their time to participate in the New Zealand Health Survey and to the interviewers who worked so diligently to collect the data. The authors are very grateful to Kylie Mason and Maria Turley (Public Health Intelligence), Megan Pledger (Victoria University of Wellington, Public Health Intelligence) and Elisabeth Wells (University of Otago) for peer-reviewing this report. The 2006/07 New Zealand Health Survey would not have been possible without the support and enthusiasm of many individuals. The following people were instrumental to the survey itself.
Project management Sarah Gerritsen and Dr Barry Borman (Public Health Intelligence).
Interview and data processing team National Research Bureau Ltd, especially Andy Heinemann, Ken Sutton, Janette Simpson and the dedicated national office and field staff.
Sample design and methodology Dr Robert Clark (University of Wollongong, Australia), Robert Templeton (Public Health Intelligence), Alistair Gray (Statistics Research Associates) and Larry Hill (National Research Bureau Ltd).
Questionnaire content Dr Martin Tobias, Maria Turley, Sarah Gerritsen, Dr Niki Stefanogiannis and Dr Jill McKenzie (Public Health Intelligence).
Independent Monitoring Group Paul Brown (Statistics New Zealand), Dr Jackie Cumming (Victoria University of Wellington), Professor Chris Cunningham (Massey University), Associate Professor Robert Scragg (University of Auckland), Jeff Sheerin (Ministry of Social Development), Research Associate Professor J Elisabeth Wells (University of Otago) and Professor Peter Crampton (University of Otago).
Ministry of Health and District Health Board Advisory Group Dr Ashley Bloomfield, Pamela Burns, Ted Cizadlo, Jon Foley, Phillipa Gaines, Lisa Kitione, Jesse Kokaua, Stephen Lungley, Andrew Mackenzie, Richard McLachlan, Natalie Paki Paki, Stuart Powell, Dr Pat Tuohy and Paula Searle (Ministry of Health), Dr Gary Jackson (Counties Manukau DHB), and Stephen Twitchin (Bay of Plenty DHB).
iv Methodology Report for the 2006/07 New Zealand Health Survey

Contents
1 Introduction 1
2 Background 2 2.1 Objectives of the NZ Health Survey 2 2.2 Ethical approval 3
3 Population and Frame 4 3.1 Target population 4 3.2 Survey population 5 3.3 Sample frame 6
4 Sample Design 7 4.1 Objectives of the sample design 7 4.2 Sample selection 8 4.3 Rationale for the sample design 10
5 Data Collection Instruments 12 5.1 Development of the child health questionnaire 12 5.2 Consultation on content 13 5.3 Constraints on content 13 5.4 Criteria for new content 13 5.5 Adult questionnaire content 14 5.6 Child questionnaire content 15 5.7 Cognitive testing 15
6 Data Collection and Quality Control 16 6.1 Collection mode 16 6.2 Interviewer training 16 6.3 Enumeration 17 6.4 Call pattern 17 6.5 Informed consent 18 6.6 Proxy reporting 18 6.7 Language assistance 18 6.8 Koha and support for participants 18 6.9 Dress rehearsal 19 6.10 Field dates 19 6.11 Respondent burden 19
7 Final Response Rates 22 7.1 Adult response rate 22 7.2 Child response rate 25 7.3 Coverage rates 26
Methodology Report for the 2006/07 New Zealand Health Survey v
8 Data Processing 30 8.1 Capture 30 8.2 Coding 30 8.3 Security of information 30 8.4 Checking and editing 30 8.5 Imputation 31 8.6 Creation of derived variables 31
9 Weighting 33 9.1 Overview of weighting process 33 9.2 Calibrated weights 34 9.3 Benchmark populations used for NZ Health Survey 36 9.4 Replicate weights 39
10 Technical Notes for Analysis 40 10.1 Suppression due to small numbers 40 10.2 Age standardisation 40 10.3 Confidence intervals 40 10.4 Adjusting population totals for item non-response 41 10.5 Data set extension for total response ethnicity 41
11 DHB Estimate Modelling 43 11.1 Overview of DHB estimation methods 43 11.2 Grouped DHB estimates (as published in A Portrait of Health) 44 11.3 Modelled DHB estimates available on PHIOnline 44
12 Comparability of 2006/07 NZ Health Survey Data with Other Survey Data 48 12.1 1992/93 NZ Health Survey 48 12.2 1996/97 NZ Health Survey 49 12.3 1997 National Nutrition Survey 49 12.4 2002 National Children’s Nutrition Survey 50 12.5 2002/03 NZ Health Survey 50 12.6 Comparability of the surveys 51
13 Dissemination of Data 53 13.1 Publications 53 13.2 Online data tables 54 13.3 Access to confidential unit record files (CURFs) 54 13.4 DHB regional estimates on the PHIOnline website 54 13.5 Contacting PHI 54
References 56
vi Methodology Report for the 2006/07 New Zealand Health Survey
Appendices Appendix 1: Procedure for selection and participation rates of respondents in the 2006/07
NZ Health Survey 59 Appendix 2: Summary of 2006/07 NZ Health Survey content consultation 60 Appendix 3: Respondent selection procedure 61 Appendix 4: Information provided to participants 68 Appendix 5: Response summary tables, by ethnic group, for 2006/07 NZ Health Survey 73 Appendix 6: Sample sizes 76 Appendix 7: Single and combination ethnic groups 81 Appendix 8: Summary of other national health surveys 83
List of Figures Figure 1: Proportion of adult interviews in 2006/07 NZ Health Survey completed, by month,
October 2006 to November 2007 19 Figure 2: Adult coverage rates (%), by age group and gender 27 Figure 3: Māori adult coverage rates (%), by age group and gender 28 Figure 4: Pacific adult coverage rates (%), by age group and gender 28 Figure A1: Procedure for selection and participation rates of respondents in the 2006/07 NZ
Health Survey 59 Figure A2: Example of the front of a household screener sheet used in ‘core’ households (where
all adults and children are eligible) 63 Figure A3: Example of the front of a household screener sheet used in ‘screened’ households
(where only Māori, Pacific or Asian adults and children are eligible) 64 Figure A4: Reverse side of the household screener (for both core and screened households) 65 Figure A5: Front side of the ethnicity showcard used on the doorstep to complete column C of the
household screener (in both ‘core’ and ‘screened’ households) 66 Figure A6: Reverse side of the ethnicity showcard used on the doorstep to complete column C of
the household screener (in both ‘core’ and ‘screened’ households) 67
Methodology Report for the 2006/07 New Zealand Health Survey vii

List of Tables Table 1: Proportion (%) of people in each age group in institutions or non-private dwellings,
2006 Census 5 Table 2: Projected sample allocation, by District Health Board, based on 2001 Census 8 Table 3: Summarised content of the 2006/07 NZ Health Survey adult questionnaire 14 Table 4: Summarised content of the 2006/07 NZ Health Survey child questionnaire (answered
by primary caregiver) 15 Table 5: Unweighted response summary for adults 23 Table 6: Weighted response summary for adults 24 Table 7: Final adult weighted response rates (percentage), by ethnic group and gender 24 Table 8: Unweighted response summary for children 25 Table 9: Weighted response summary for children 25 Table 10: Child weighted response rates 26 Table 11: Sample sizes and coverage rates 27 Table 12: Child coverage rates (%), by ethnic group 29 Table 13: Final population benchmark totals 37 Table 14: Summary information about the 2006/07 NZ Health Survey weights (000s) 38 Table 15: Basic descriptive information on adult weights 38 Table 16: Basic descriptive information on child weights 39 Table 17: Example of template for standardised total response ethnic group data set 42 Table 18: Explanatory variables used in the synthetic DHB estimates 47 Table A1: Unweighted response summary: Māori adults 73 Table A2: Weighted response summary: Māori adults 73 Table A3: Unweighted response summary: Pacific adults 73 Table A4: Weighted response summary: Pacific adults 74 Table A5: Unweighted response summary: Māori children 74 Table A6: Weighted response summary: Māori children 74 Table A7: Unweighted response summary: Pacific children 75 Table A8: Weighted response summary: Pacific children 75 Table A9: Sample sizes and population counts for children and adults, by gender, 2006/07
NZ Health Survey 76 Table A10: Sample sizes and population counts, by ethnic group and gender, 2006/07 NZ Health
Survey 76 Table A11: Sample sizes and population counts, by age group and gender, 2006/07 NZ Health
Survey 77 Table A12: Sample sizes and population counts, by NZDep2006 quintile and gender, 2006/07 NZ
Health Survey 78 Table A13: Sample sizes and population counts, by District Health Board area, 2006/07
NZ Health Survey 79 Table A14: Sample sizes in previous surveys used in time trends, total population, by gender 79 Table A15: Sample sizes in previous surveys used in time trends, Māori population, by gender 80 Table A16: Number of adult respondents in the 2006/07 NZ Health Survey, by single and
combination ethnic groups 81 Table A17: Number of child respondents in the 2006/07 NZ Health Survey, by single and
combination ethnic groups 82 Table A18" Summary of other national health surveys 83
viii Methodology Report for the 2006/07 New Zealand Health Survey

1 Introduction The Ministry of Health repeats the New Zealand Health Survey (here referred to as the NZ Health Survey) at regular intervals to monitor changes in the health of the population. The 2006/07 NZ Health Survey is the fourth such survey. Previous NZ Health Surveys were conducted in 1992/93, 1996/97 and 2002/03. The NZ Health Survey collects information that cannot be obtained more effectively or efficiently through other means, such as analyses of hospital administrative records, disease registries or epidemiological research. For most topics in the NZ Health Survey, the survey is the best source of information at a population level. This methodology report details the procedures and protocols followed to ensure the NZ Health Survey produces the high-quality and robust data expected of official statistics. Further information on specific areas of analysis is available in a number of reports and technical documents, which can be accessed at www.moh.govt.nz/moh.nsf/indexmh/portrait-of-health (see section 13).
Methodology Report for the 2006/07 New Zealand Health Survey 1

2 Background The NZ Health Survey measures self-reported physical and mental health status (including doctor-diagnosed health conditions), risk and protective behaviours for health outcomes, and the use of health care services, among the usually resident New Zealand population living in private dwellings. The 2006/07 NZ Health Survey is the fourth national population-based health survey. Previous NZ Health Surveys were conducted in 1992/93, 1996/97 and 2002/03. The 2006/07 survey involved face-to-face interviews in 12,847 households throughout New Zealand, with 12,488 adults (15 years and over) and the primary caregivers of 4921 children (aged from birth to 14 years). By comparison, the 2002/03 survey involved face-to-face interviews with 12,929 adults, the 1996/97 survey involved face-to-face interviews with 7862 adults and the primary caregivers of 1019 children, and the 1992/93 survey involved telephone interviews with 7065 adults. Public Health Intelligence (PHI) developed the objectives and content of the 2006/07 NZ Health Survey in consultation with stakeholders and an Independent Monitoring Group. The fielding of the 2006/07 survey was contracted to a specialist survey provider, National Research Bureau Ltd (NRB), who undertook the interviewing and cleaned the data. Public Health Intelligence led the analysis and dissemination of the data. The NZ Health Survey is a key component of the New Zealand Health Monitor, an integrated programme of household surveys and cohort studies managed by Public Health Intelligence, which aims to monitor the health of the New Zealand population (Ministry of Health 2005). It is also an important element in the cross-sector Programme of Official Social Statistics managed by Statistics New Zealand. As a signatory to the Protocols of Official Statistics (Statistics New Zealand 2007), the Ministry of Health has employed best-practice survey techniques to produce high-quality data through the NZ Health Survey. The methodology of the New Zealand Health Survey is similar to the national health surveys of like countries, as summarised in Appendix 8.
2.1 Objectives of the NZ Health Survey The five objectives of the NZ Health Survey are to: 1. measure the health status of New Zealanders, and the prevalence of selected
health conditions 2. measure the prevalence of risk and protective factors associated with these health
conditions 3. measure the use of health services, including barriers to accessing health services 4. examine differences between population groups (as defined by age, gender,
ethnicity and socioeconomic position) 5. examine changes in key NZ Health Survey data over time.
2 Methodology Report for the 2006/07 New Zealand Health Survey

2.2 Ethical approval The New Zealand Health and Disability Multi-Region Ethics Committee granted approval for the 2006/07 NZ Health Survey (MEC/06/02/004), confirming that the study met the following ethical principles: • validity of research • minimisation of harm • privacy and confidentiality • informed consent • cultural and social responsibility. The Ethics Committee approved the wording of all public materials from the survey, including the invitation letter, information brochures, consent form, questionnaires and thank you cards (see Appendix 4). The 2006/07 adult and child questionnaires are available online from: www.moh.govt.nz/moh.nsf/indexmh/portrait-of-health.
Methodology Report for the 2006/07 New Zealand Health Survey 3

3 Population and Frame This section discusses the target population, the survey population and the sample frame. The target population is the population the survey aims to represent. All statistics for the survey refer to the target population. The survey population is the population that was covered in the survey. For various reasons (discussed below), there was a small proportion of people who could not be covered by the survey. As a result, the survey population is slightly smaller than the target population. The sample weights are designed to reflect the target population, so that the weighted statistics produced from the NZ Health Survey can be taken to be representative of this population. The sample frame is the list of areas, and the lists of dwellings and people within areas, that was used to select the NZ Health Survey sample from the survey population.
3.1 Target population The target population for the 2006/07 NZ Health Survey was the usually resident civilian population of all ages living in permanent private dwellings in New Zealand. The target population was approximately 3.1 million adults (aged 15 years and over) and 854,000 children (aged from birth to 14 years), according to the 2006 New Zealand Census of Population and Dwellings. The target population is defined to include only permanent private dwellings, so temporary private dwellings are excluded, including caravans, cabins and tents in a motor camp, and boats. The target population also excludes non-private dwellings (institutions). Examples of this type of dwelling are: hotels, motels, guest houses, boarding houses, homes for the elderly, hostels, motor camps, hospitals, barracks and prisons. Table 1 presents the proportion of people in each age group who were in institutions or non-private dwellings, as measured by the 2006 Census. Once non-permanent and non-private dwellings are excluded, the target population contains 94% of the total usually resident population.
4 Methodology Report for the 2006/07 New Zealand Health Survey

Table 1: Proportion (%) of people in each age group in institutions or non-private dwellings, 2006 Census
Age group Proportion of people not in private occupied dwellings (%)
0–4 2.5 5–9 2.4 10–14 5.9 15–24 7.4 25–34 5.2 35–44 4.6 45–54 4.9 55–64 5.6 65–74 6.8 75+ 30.6
Total 6.0
People were eligible to be interviewed at their usual residence only. If they were temporarily visiting a household that was selected into the NZ Health Survey, they were not eligible to be selected as part of that household. This ensured that no-one had a double chance of being selected in the survey. People who were a usual resident in a private dwelling in New Zealand, but who were temporarily overseas for some of the survey period, were in the scope for the survey. In the great majority of cases these individuals had a chance of being selected in the survey, as the survey provider made repeated call-backs to non-contacted households in the sample over the survey period. The benchmarks used in weighting the survey also included usual residents temporarily overseas. People aged 15 years or over were in the target population for the adult survey, and those aged from birth to 14 years were in the target population for the child survey.
3.2 Survey population A total of 98.9% of New Zealand’s 1.4 million permanent private dwellings (households) were eligible for participation in the NZ Health Survey. For practical reasons a small number of households that were part of the defined target population were excluded from the survey population, but these have been accounted for in the final estimates via the survey weights. Households not included were those in meshblocks with less than nine occupied dwellings (according to the 2001 New Zealand Census of Population and Dwellings), and those located off the main islands of New Zealand (North, South and Waiheke), such as those on other sparsely inhabited off-shore islands, on-shore islands, waterways and inlets. Due to the small number of households omitted, any possible bias is likely to be extremely small.
Methodology Report for the 2006/07 New Zealand Health Survey 5

3.3 Sample frame An area-based frame of Statistics New Zealand’s meshblocks was used, based on New Zealand 2001 Census meshblocks, containing 32,173 meshblocks. A sample of 1385 meshblocks was selected from this frame. The sample design used is described in more detail in Chapter 4. Interviewers listed all the addresses in each of these areas. These lists of dwellings were then used as a frame from which a sample of dwellings was selected from each meshblock. One eligible adult (if any) and one eligible child (if any) were then selected from each selected dwelling.
6 Methodology Report for the 2006/07 New Zealand Health Survey

4 Sample Design The sample design for the 2006/07 NZ Health Survey was developed by the Centre for Statistical and Survey Methodology, University of Wollongong, New South Wales, Australia.
4.1 Objectives of the sample design The sample design was developed based on the following objectives. 1. A range of population-level prevalences need to be estimated (eg, asthma,
diabetes, stroke, obesity, tobacco use, GP visits in past 12 months, problem gambling) with sufficient accuracy.
2. Estimates for all ages are required, preferably by the following age groups: 0–4, 5–9, 10–14, 15–24, 25–44, 45–64, 65+ years.
3. Sufficient data to allow for small area estimation at District Health Board (DHB) level is required.
4. Estimates by ethnic group are required (Māori, Pacific, Asian, European/Other), with Māori estimates having approximately the same relative standard error/accuracy as the non-Māori population estimates (equal explanatory power), to the extent that this can reasonably be achieved.
5. The design should avoid large variation in estimation weights, in order to reduce standard errors of key estimates and to support analysis of the survey data by multiple users.
6. The 2006/07 NZ Health Survey design should not vary too much from the design of the 2002/03 NZ Health Survey, so that comparisons can be made between surveys.
The fourth sample design objective was the most challenging. The final design achieved this aim of producing robust ethnicity data by a combination of disproportionate sampling, where DHBs containing a higher proportion of Māori residents were sampled at a slightly higher rate, and by using a large screening sample, where only those respondents who identified as being Māori, Pacific or Asian were eligible for the survey. In the 2006/07 NZ Health Survey screening was the main approach used to achieve the required sample sizes by ethnicity. Disproportionate sampling was only used in a limited way (at DHB-level) because it conflicts to some extent with objective 5. Probabilities of selections of households were set to be approximately proportional to the square root of the proportion of the people in the DHB who were Māori (according to the 2001 Census). Table 2 shows the number of meshblocks to be selected and the household probabilities of selection, by DHB.
Methodology Report for the 2006/07 New Zealand Health Survey 7

Table 2: Projected sample allocation, by District Health Board, based on 2001 Census
DHB Adult population
(000s)
Percentage of Māori
Total meshblocks
Meshblocks in sample
Adult sample size (core and screen)
Household probability of selection in core sample
01 Northland 111.7 22.2 1342 78 727 0.0101 02 Waitemata 378.8 7.1 2909 130 1193 0.0057 03 Auckland 322.6 6.4 2792 108 1132 0.0054 04 Counties Manukau 322.4 12.7 2364 132 1469 0.0077 05 Waikato 259.3 15.6 3003 145 1306 0.0085 06 Lakes 72.6 24.6 802 55 544 0.0106 07 Bay of Plenty 149.7 18.3 1333 91 822 0.0092 08 Tairawhiti 32.0 35.5 390 29 320 0.0128 09 Taranaki 80.0 10.9 1154 41 320 0.0071 10 Hawke’s Bay 112.1 17.5 1322 71 612 0.0090 11 Whanganui 47.2 17.0 748 32 265 0.0088 12 Midcentral 121.7 11.4 1489 62 513 0.0072 13 Hutt 104.7 11.5 1182 52 488 0.0073 14 Capital and Coast 211.9 7.6 2172 81 739 0.0059 15 Wairarapa 30.0 10.5 427 15 120 0.0070 16 Nelson Marlborough 101.6 6.2 1025 38 280 0.0053 17 West Coast 23.9 6.3 378 14 99 0.0075 18 Canterbury 371.1 5.1 3553 120 921 0.0049 19 South Canterbury 42.9 4.1 577 14 99 0.0044 20 Otago 141.9 4.6 1873 45 336 0.0046 21 Southland 82.6 8.1 1338 36 272 0.0061
Total 3120.7 10.8 32173.0 1389* 12577 0.0072
* A number of minor changes to the design resulted in this number being reduced to 1385. Of these, only 1378 meshblocks had eligible respondents.
More information on the boosting of Māori, Pacific and Asian people in the 2006/07 NZ Health Survey sample is contained in a paper by Clark and Gerritsen (2006), available from www.moh.govt.nz/moh.nsf/indexmh/portrait-of-health.
4.2 Sample selection Like earlier NZ Health Surveys, the 2006/07 NZ Health Survey adopted a multi-stage, stratified, probability-proportional-to-size (PPS) sampling design. A three-step selection process was used to achieve the sample.
Step 1: Selection of meshblocks Meshblocks vary considerably in size and were therefore selected by PPS design, whereby the size measure was the number of occupied dwellings in the meshblock according to the 2001 Census. In other words, larger meshblocks had an increased chance of selection in the design. Those DHBs with relatively higher population proportions of Māori (according to the 2001 Census) also had a slightly increased
8 Methodology Report for the 2006/07 New Zealand Health Survey

chance of meshblock selection. The survey design required a minimum of 100 households selected from each DHB in the sample in order to meet objective 3. In all, 1385 meshblocks were selected throughout the country for inclusion in the 2006/07 NZ Health Survey. These were randomly allocated to the four quarters, or ‘seasons’, during which interviewing occurred, and were spread throughout the country over the four seasons (to minimise seasonality bias).
Step 2: Selection of households within meshblocks Within each meshblock some households were selected to form the core sample, and some households were selected to form the screened or booster sample. Households in the core sample were selected by a systematic procedure of beginning at a random point pre-allocated in the meshblock, and knocking on the door of every kth house. Households in the screened sample were selected by knocking on every jth house, excluding the core households in the same meshblock. The values of k were chosen so as to select on average 9.5 core households per meshblock. The values of j were chosen so as to select on average 12 screened households per meshblock in the 10 DHBs with a high concentration of Māori, and on average 15 screened households per meshblock in other DHBs. The design was a ‘self-weighting sample’ within a DHB, which means that every eligible household in a DHB had the same chance of being in the core sample and the same chance of being in the screening sample. Self-weighting samples are a common approach in household surveys because they reduce the amount of variation in the estimation weights. In total 14,571 households were approached for the core sample and 20,998 households were approached for inclusion in the screened sample.
Step 3: Selection of respondents within households The procedure for selecting respondents in the ‘core’ and ‘screened’ households was essentially the same. Within each household all eligible adults (those aged 15 years and over who usually reside at that dwelling) and all eligible children (those aged from birth to 14 years old who usually reside at that dwelling at least 50% of the time) were identified. The names of all eligible respondents were then listed in descending order of age on a sampling Kish grid (Kish 1949), and the ethnicities (obtained by proxy from the person who answered the door using the Statistics New Zealand question) of all household members was recorded. One adult and one child were selected based on whose names fell alongside predetermined indicators on the sampling Kish grid. No interview was conducted in households in the screen sample if there were no household members identified as Māori, Pacific or Asian. Overall, 12,874 households participated in the 2006/07 NZ Health Survey, with interviews completed with 12,488 adults and the primary caregivers of 4922 children. There was no substitution of households or respondents if the selected household or respondent was not contactable or unavailable.
Methodology Report for the 2006/07 New Zealand Health Survey 9

Appendix 1 outlines the procedure for the selection and participation rates of respondents in the 2006/07 NZ Health Survey, and Appendix 3 contains more information on respondent selection and the ethnicity screening procedure.
4.3 Rationale for the sample design This sample design was selected from multiple options as the best possible way to meet the objectives of the NZ Health Survey while producing limited variation in the weights and the lowest possible design effects. The simplest possible sample design would be a simple random sample of all people in New Zealand, so that everyone has an equal and independent chance of being selected in the sample. However, a design of this type would not be feasible because: • there is not a sufficiently accurate list of all addresses in New Zealand which can be
used as a sampling frame • the sample would be geographically very spread out, requiring interviewers to travel
great distances between interviews. Also, a simple random sample would not result in large enough numbers of Māori, Pacific or Asian people in the sample to enable adequate statistics for these groups. Because of this, the NZ Health Survey, like most household surveys, uses a complex sample design. Complex designs have a number of features which affect the precision of statistics coming from the survey. 1. Different people have a different chance of selection. This is captured in the
‘weight’, which is the number of people that each survey respondent represents in the target population. In the NZ Health Survey, people in different DHBs have different weights, and Māori, Pacific and Asian people have lower weights than other people, to reflect the fact that these groups had an increased chance of selection in the sample relative to simple random sampling. Sampling of one adult and/or child per household also leads to different weights, as adults and children in larger households receive a larger weight.
2. The sample is ‘clustered’. In the NZ Health Survey a sample of meshblocks was selected and a sample of households was selected from each meshblock. If the households in the sample were shown on a map of New Zealand they would appear clumped. This makes the survey more affordable, as interviewers do not have to travel between as many areas as they would if simple random sampling were used.
The net effect of a complex design can be measured by the ‘design effect’ (or DEFF). The DEFF is the ratio of the variance (a measure of precision) of an estimate achieved by a complex design, relative to the variance of the same estimate that would be achieved by a simple random sample of the same size. The closer the DEFF is to 1, the closer the design is to simple random sampling. Design effects of between 2 and 4 are typical in population health studies, which means the variance is larger than would have been obtained using a simple random sample. Even though the DEFF is greater
10 Methodology Report for the 2006/07 New Zealand Health Survey

than 1, it does not mean that a simple random sample should be used, as this would be prohibitively expensive. A complex design like that used in the NZ Health Survey is less precise than a simple random sample with the same sample size, but is much more precise than could be achieved by a simple random sample with the same budget. Nevertheless, DEFFs should not be too large. In particular, it is appropriate for weights to vary across the sample, otherwise it would not be possible for Māori, Pacific and Asian people to have an increased chance of selection in the sample. If the variation in weights is too extreme, however, then the DEFF will be very large, and this would be counter-productive for all statistics, even for Māori and other sub-population groups. The best statistical methods available for sampling sub-populations were used to ensure that the design was appropriate for achieving adequate precision for national and sub-population estimates within the survey budget. Design effects are different for each statistic. The median design effects over 27 key indicators from the survey were 1.70 for national estimates and 1.51 for Māori estimates. For more information on the sample design of the 2006/07 NZ Health Survey, including alternative designs considered, refer to Clark (2008) and Clark and Gerritsen (2006). Both of these papers are available from www.moh.govt.nz/moh.nsf/indexmh/portrait-of-health.
Methodology Report for the 2006/07 New Zealand Health Survey 11

5 Data Collection Instruments The content of the NZ Health Survey has remained similar over time, where possible, to allow for comparisons between surveys. The main difference between the 2006/07 NZ Health Survey and previous surveys is that this is the first to ask comprehensive questions on child health (the 1996/97 NZ Health Survey included only a limited number of questions on child health service utilisation). It is envisaged that future surveys will continue to include a comprehensive child health questionnaire. Key differences between the 2002/03 and 2006/07 adult questionnaire include: • a more detailed primary health care section, covering accessibility,
comprehensiveness of service, continuity and co-ordination of care, as well as experiences of primary health care
• an expanded oral health care section • additional questions on mental health conditions • new chronic pain questions • revised tobacco questions (to align with the Tobacco Use Survey) • replacement of the 2002/03 problem gambling screen with an internationally
comparable screen (the Canadian Problem Gambling Index) • addition of the Economic Living Standards Index (ELSI-SF) and New Zealand Index
of Socioeconomic Deprivation for Individuals (NZiDep) • removal of the WHO-LF health status questions (to be included every second NZ
Health Survey, the next being in 2009/10) • more detailed collection of household and family composition • updated height, weight and waist circumference collection protocols and equipment.
5.1 Development of the child health questionnaire The child health questionnaire for the 2006/07 NZ Health Survey was developed by Public Health Intelligence using theoretical frameworks of the whole child approach and the key settings model provided in New Zealand’s Agenda for Children (Ministry of Social Development 2002). Topics for inclusion were based on gaps in current child health data collection following a content consultation with stakeholders, as described below. The questionnaire was constructed using validated questions from existing surveys, where possible. New questions were cognitively tested by TNS Research, as described below. More information on the development of the child health questionnaire is contained in a paper by Gerritsen (2006), available from www.moh.govt.nz/moh.nsf/indexmh/portrait-of-health.
12 Methodology Report for the 2006/07 New Zealand Health Survey

5.2 Consultation on content A wide consultation on the proposed content of the 2006/07 NZ Health Survey was undertaken from August to November 2005. See Appendix 2 for the organisations and individuals who provided comment on the content of the 2006/07 NZ Health Survey questionnaires.
5.3 Constraints on content The following constraints are taken into account when assessing topics and questions for inclusion in the NZ Health Survey. • Questionnaire limitations. Questionnaires are not able to gather complex, detailed
information. They are best designed with closed questions and predetermined response categories.
• Respondent burden and resistance. The questionnaire has to be designed so that New Zealanders are willing to participate in the survey. In order to achieve compliance, the questionnaire must be able to be completed in a reasonable amount of time (approximately one hour). Topics that offend or annoy, that people cannot answer easily, or that are complex and difficult to comprehend are avoided.
• Continuity and relevance. Continuity of questions over different health surveys is important as the NZ Health Survey monitors population health over time by comparing data from one survey to the next. At the same time, it must be able to remain relevant to the information needs of the Ministry of Health.
• Integration. The NZ Health Survey uses standard frameworks and classifications with validated questions, where possible, to allow for integration with data from other sources.
5.4 Criteria for new content All new topics and questions for the 2006/07 NZ Health Survey were assessed against the following three criteria before inclusion in the questionnaire. 1. The NZ Health Survey is the most appropriate source for the information. The
data cannot be collected more effectively and efficiently by other means (eg, a qualitative study or a randomised control trial). The information should be required for monitoring purposes as opposed to a one-off research project.
2. The data collected is needed to inform decisions made by the Ministry of Health and DHBs. The topic should be relevant to the New Zealand Health Strategy and current priority areas for the Ministry of Health.
3. Quality information can be collected. The data collected by the questions must provide information of an acceptable quality.
Methodology Report for the 2006/07 New Zealand Health Survey 13

5.5 Adult questionnaire content The 2006/07 NZ Health Survey adult questionnaire is available from www.moh.govt.nz/moh.nsf/indexmh/portrait-of-health. Table 3 outlines the topic areas in the questionnaire. Table 3: Summarised content of the 2006/07 NZ Health Survey adult questionnaire
Module Topics Details
Chronic health conditions Heart disease, stroke, diabetes, asthma, chronic obstructive pulmonary disease, arthritis, spinal disorders, osteoporosis, cancer, mental health conditions, other long-term conditions, chronic pain
Prevalence of ever-diagnosed condition, age at diagnosis, treatment
Health service utilisation Primary health care provider use, general practitioners, nurses, oral health care professionals, medical specialists, prescriptions, complementary and alternative health professionals, other health care professionals, telephone health advice, hospital use
Use in previous 12 months, frequency of contact, reasons for visit, unmet need and barriers to access, measures of service for primary health care
Health risk and protective factors
High blood pressure, high blood cholesterol, mammograms, cervical smears, prostate specific antigen testing, physical activity, tobacco smoking, second-hand smoke exposure, vegetable and fruit intake, alcohol use and hazardous drinking, gambling participation and problem gambling
Prevalence of risk and protective factors
Health status General health in past four weeks (physical and mental health), psychological distress
SF-36 Health Status Questionnaire and K10 Psychological Distress Scale
Sociodemographics Gender, age, ethnicity, language, country of birth, education, income support, labour status, income, racial discrimination, medical insurance, household characteristics, living standards and deprivation characteristics
Standard questions and classifications
Anthropometry Height, weight and waist circumference measurements
Using standardised equipment and procedures
Re-contact Permission to re-contact within two years, contact details
14 Methodology Report for the 2006/07 New Zealand Health Survey

5.6 Child questionnaire content The 2006/07 NZ Health Survey child questionnaire is available from www.moh.govt.nz/moh.nsf/indexmh/portrait-of-health. Table 4 outlines the topic areas in the questionnaire. Table 4: Summarised content of the 2006/07 NZ Health Survey child questionnaire
(answered by primary caregiver)
Module Topics Details
Health status and development
Chronic conditions, general health in past four weeks (physical and emotional/behavioural), family cohesion, discipline
Prevalence of ever-diagnosed condition, age at diagnosis, treatment, CHQ-PF28 general health questionnaire
Health service utilisation Primary health care provider use, general practitioners, nurses, oral health care professionals, medical specialists, prescriptions, other health care professionals, telephone health advice, hospital use
Use in past 12 months, frequency of contact, reasons for visit, unmet need and barriers to access
Health risk and protective factors
Breastfeeding, eating breakfast at home, fizzy drink and fast food intake, active transport to school, television watching, exposure to second-hand smoke
Prevalence of risk and protective factors
Socio-demographics Gender, age, ethnicity, language, country of birth, early childhood care and education, shared parenting arrangements, primary caregiver’s relationship to child, age, education, income support, labour status, and household characteristics
Standard questions and classifications
Anthropometry Height and weight measurements (if two years and over) and waist circumference measurements (if five years and over)
Using standardised equipment and procedures
5.7 Cognitive testing New questions in the 2006/07 NZ Health Survey (that is, those questions that had not been used in previous health surveys) were cognitively tested by TNS Research, to ensure the questions were easily understood by respondents and able to produce high-quality data. TNS conducted 30 qualitative interviews in April 2006 with members of the general public from the Wellington region. The socio-demographic characteristics of the interviewees were as varied as possible to allow for testing with multiple users (ie, differing age, gender, ethnicity, socioeconomic position, age of children). Several proposed new questions were excluded or changed following testing.
Methodology Report for the 2006/07 New Zealand Health Survey 15

6 Data Collection and Quality Control
6.1 Collection mode The 2006/07 NZ Health Survey interview team consisted of approximately 200 National Research Bureau (NRB) professional social research interviewers. Interviews were conducted in respondents’ homes, with the interviewer typing responses directly into a laptop computer using Blaise Computer Assisted Personal Interview (CAPI) software. Showcards with predetermined response categories were used to assist respondents, where appropriate. The height, weight and waist measurements were taken following protocols developed specifically for the New Zealand Health Monitor surveys, using professional weighing scales (Tanita HD-351), a portable stadiometer (Seca 214), and a standard anthropometric measure tape (Lufkin W606PM). Protocols for collecting height, weight and waist measurements in New Zealand Health Monitor surveys are available at www.moh.govt.nz/moh.nsf/indexmh/portrait-of-health.
6.2 Interviewer training Interviewers received a two-day training course on how to conduct the 2006/07 NZ Health Survey interviews, in addition to their standard social research training. Material used in the training included: • the origin and purpose of the survey • public information materials (invitation letter, information brochure) • meshblock maps for household enumeration and selection • instructions for sampling dwellings, including a demonstration video • Kish grids for respondent selection • screened and core sampling instructions • details on how to administer the survey • consent forms • questionnaire content • response category showcards • professional weighing scales, stadiometer and measuring tape for anthropometric
measurements • detailed anthropometry protocols, including a demonstration video • thank you cards and koha pens for participants • cultural competence and safety training • tests designed to assess the use of training. In addition, field supervisors were trained as interviewers, and received additional training on: • contact and support with interviewers • progress and evaluation forms for interviewers.
16 Methodology Report for the 2006/07 New Zealand Health Survey

Refresher training sessions were held in April/May 2007, partway through the data collection period, for all interviewers. These sessions provided an opportunity for interviewers to discuss any particular issues they had encountered, and allowed supervisors to check interview techniques, especially anthropometry measurement standards.
6.3 Enumeration Before selecting households to participate in the NZ Health Survey, interviewers re-enumerated the dwellings in their area (meshblock) to take account of the number of new dwellings built and the number of buildings demolished since the last pre-census enumeration.
6.4 Call pattern The call pattern used in the NZ Health Survey was an important component of achieving high response performance.
Number of calls The ‘call’ refers to one visit on one day during a particular time band (eg, 5–8 pm). NRB conducted a total of up to 10 calls at each sampled dwelling, at different times of the day and on different days of the week, before accepting that dwelling as a non-contact.
Spacing of calls Making all 10 calls within a fortnight does not capture people away from their dwelling for a fortnight or longer. Therefore, the procedure used was to make six calls in the survey month in which the meshblock was issued, then pause for three to four weeks, attempt two more calls, and finally pause a further three to four weeks before implementing the final two calls. This helped not only in the case of people who were temporarily away, but also helped for people who were busy work-wise, socially or for family reasons when their dwelling was first approached.
Recovery attempts Where a meshblock or interviewer–meshblock combination produced a below-standard response rate, it was identified in the field manager’s computer tracking of the response rate. After investigation, a different interviewer may have been assigned to re-visit that meshblock to re-attempt the refusals, generally with an explanation to refusers as to why the interviewer was approaching them again.
Invigilation This step refers to the field supervisor in each area phoning back the household to confirm that the interview was done and to check that the respondent is the one stated. It is rare for interviewers who are properly trained and field-supported to falsify interviews, but nevertheless NRB perform a 15% field check on each interviewer as a precautionary measure.
Methodology Report for the 2006/07 New Zealand Health Survey 17

6.5 Informed consent The NZ Health Survey was voluntary, relying on the goodwill of participants, and consent was obtained without coercion or inducement. Adults and the primary caregivers of children selected for the survey were given an invitation letter from the Ministry of Health and an information brochure (available in 11 languages). If they agreed to take part, they were asked to sign a consent form. The consent form included a request for an interpreter if required (in multiple languages), and it was also possible to match respondents and interviewers by language, ethnicity and gender when requested (see Figures A5 and A6, Appendix 4 for copies of the invitation letter, English-language information brochure and consent form).
6.6 Proxy reporting In rare instances where the selected adult respondent was unable to participate in the Health Survey interview due to a health condition or cognitive impairment (n = 49, 0.4% of adult interviews), a proxy response was obtained from their caregiver; that is, the person who had day-to-day responsibility for their care. In addition, a small number of adult respondents (n = 104, 0.8%) required cognitive assistance from a family member, friend or caregiver in order to answer the questionnaire. Child interviews were conducted with a primary caregiver of the child; that is, a person who had day-to-day responsibility for the care of the child. In most instances (79%) this was the biological mother of the child. Sometimes this was the biological father of the child (14%), the foster, adoptive or whangai mother or father (2%), the mother or father’s partner or spouse (1%), a grandparent (3%), other relative (1%), or someone else (less than 1%). When the primary caregiver of the child respondent was also selected as the adult respondent (n = 3187, 64.8% of the child interviews), the child questionnaire skipped questions in the socio-demographic section so as to not repeat questions already asked in the adult questionnaire.
6.7 Language assistance Professional language interpreters assisted with 51 (0.4%) of adult interviews and 30 (0.6%) of child interviews. A further 238 (1.9%) of adult interviews and 100 (2.0%) of child interviews were conducted with language assistance provided by a friend or family member of the respondent.
6.8 Koha and support for participants All participants of the 2006/07 NZ Health Survey were given a thank you card and ballpoint pen at the conclusion of the interview. The card contained a list of health and community organisations with free-phone numbers for use by the participant if they felt they needed to discuss any issues raised by their participation in the Health Survey or wanted advice on a health issue.
18 Methodology Report for the 2006/07 New Zealand Health Survey

For the interviews to take place, child care was provided by family, friends and others in 0.5% and by NRB in 0.02% of adult interviews. Child care was provided by family and friends in 1.5% and by NRB in 0.06% of child interviews.
6.9 Dress rehearsal A dress rehearsal to test the sample design, and to refine the instruments, operations and processes, was undertaken from 15 May to 9 June 2006 by NRB in 16 meshblocks randomly selected throughout New Zealand. Subsequent changes were made to the questionnaire, interviewer training and operations, but the original sample design was retained. Interview data collected in the dress rehearsal was not used in the final data sets (ie, it was not combined with the main sample).
6.10 Field dates Interviews were conducted between Friday 6 October 2006 and Thursday 29 November 2007. By seasonality, 35% of interviews were completed in spring, 20% in summer, 25% in autumn and 20% in winter (see Figure 1). Figure 1: Proportion of adult interviews in 2006/07 NZ Health Survey completed, by month,
October 2006 to November 2007
0
2
4
6
8
10
12
Oct
ober
200
6
Nov
embe
r 200
6
Dec
embe
r 200
6
Janu
ary
2007
Febr
uary
200
7
Mar
ch 2
007
Apr
il 20
07
May
200
7
June
200
7
July
200
7
Aug
ust 2
007
Sep
tem
ber 2
007
Oct
ober
200
7
Nov
embe
r 200
7
Month
Percentage of total interviews
6.11 Respondent burden The response rate and the high proportion of respondents happy to be re-contacted to answer further questions of interest to the Ministry of Health indicate that the survey was well received by the public.
Methodology Report for the 2006/07 New Zealand Health Survey 19

Three types of interview were conducted in the households that agreed to participate in the NZ Health Survey: an adult-only interview, a child-only interview, and an adult and child interview. All the times in minutes below are the CAPI time, and include all adult and/or child question modules, the adult and/or child demographic question modules, the adult and child measurements questions, the re-contact questions in the adult questionnaire, and the ‘entry’ and ‘exit’ questions at the beginning and end of the questionnaires. These times do not include the time spent in a household before or after the interview or interviews were conducted. • For the 7932 adult-only interviews, the median time taken to complete the interview
was 62 minutes, the mean time taken to complete the interview was 66 minutes, and the lower and upper quartiles were 50 and 77 minutes.
• For the 386 child-only interviews, the median time taken to complete the interview was 38 minutes, the mean time taken to complete the interview was 41 minutes, and the lower and upper quartiles were 30 and 47 minutes.
• For the 4518 adult and child interviews, the median time taken to complete the interview was 84 minutes, the mean time taken to complete the interview was 88 minutes, and the lower and upper quartiles were 70 and 102 minutes.
• For the 12,836 household interviews overall, the median time taken to complete the interview was 69 minutes, the mean time taken to complete the interview was 73 minutes, and the lower and upper quartiles were 54 and 87 minutes.
One distinction to be aware of with the above times is that there were two types of ‘adult and child’ interview. These were, firstly, where the adult respondent was also the primary caregiver for the eligible child (ie, the respondent was the same adult for the two interviews), and, secondly, where the adult respondent was not the primary caregiver for the eligible child (ie, the respondents were different adults for the two interviews). Where the respondent was the same person, the adult and child interview duration was shorter than where the respondents were different people. This difference is partly due to the fact the CAPI programming ensured that the same person was not asked a sub-set of demographic questions twice. The programming ensured that this sub-set of demographic questions was only asked once, irrespective of whether this person completed the adult or child questionnaire first. Please note that, for a number of reasons, there are 38 adult interviews and 17 child interviews that have not been included in the durations outlined above.
Minimising respondent burden and maximising response rates The questionnaire and operational processes were carefully designed to ensure that the impact on respondents was minimised. For example: • only one eligible adult and one eligible child were selected per dwelling • well-tested and largely well-proven questionnaires were used
20 Methodology Report for the 2006/07 New Zealand Health Survey
• professional trained interviewers conducted the interview • appointments were taken for interviews to be conducted at a time to suit the
respondent and their family • language, culture and gender matching of eligible respondents and interviewer were
undertaken where necessary • a proxy respondent could be used in the case of severe ill health or cognitive
disability • child care was provided if requested. The following methods were used to maximise response rates: • in-field support of interviewers • use of well-designed call pattern processes, allowing for up to nine call-backs at
differing times of the week and day • revisiting ‘closed’ meshblocks during a recovery phase (ie, when visiting households
where no contact had been established or the selected respondent was unable to take part at that time, but did not refuse to participate).
Methodology Report for the 2006/07 New Zealand Health Survey 21

7 Final Response Rates The main measure used to assess the overall quality of a survey is the final weighted response rate. The response rate is a measure of how many people who were selected to take part in the survey actually participated. A high response rate means that the survey results are more representative of the New Zealand population.
7.1 Adult response rate The final weighted response rate for adults in the 2006/07 NZ Health Survey was 67.9%. The weighted response rate reflects the probability of being selected into the sample, and describes the success of the study in terms of achieving co-operation from the population being measured. There are four components to the weighted adult response rate calculation: • ineligibles (eg, vacant sections, vacant dwellings and non-residential dwellings) • eligible responding (interview conducted, respondent confirmed to be eligible for the
survey) • eligible non-responding (interview not conducted, but enough information collected to
indicate that the household did contain an eligible adult – almost all refusals were in this category)
• unknown eligibility (eg, non-contacts and refusals who provided insufficient information to determine eligibility).
The response rates were calculated overall, and by ethnicity. In calculating the response rates by ethnicity, non-interviews whose ethnicity could not be identified and who would otherwise be classified into group 3 (eligible non-responding) were reclassified as unknown eligibility. As a result, for the ethnic response rates group 3 was much larger than for the overall response rate. In many surveys this means that it is not feasible to calculate response rates broken down by ethnicity, because there are so many instances of unknown eligibility that the response rate cannot be reliably estimated. In the case of the NZ Health Survey, however, ethnicity was collected by proxy on the doorstep, so that in most cases ethnicity could be identified (at least approximately) even if the full interview was not conducted. As a result, it was feasible to calculate response rate by ethnicity for the NZ Health Survey, although this is less reliable than the overall response rate. It was not feasible to calculate response rates by age because age could not be identified for non-interviewed people, unlike ethnicity, which was collected on the household form.
22 Methodology Report for the 2006/07 New Zealand Health Survey

The response rate was calculated as follows:
Response rate =number of eligible responding
x 100
number of eligible responding
number of eligible non-responding
estimated number of eligibles from the unknowns+ +
The justification for this response rate was that a proportion of the unknowns were likely to be eligible if contact could have been made. As contact could not be made with the estimated number who would be eligible, they were classified as non-respondents. The estimated number of unknown eligibles was calculated as follows:
number of eligible responding
number of eligible non-responding
number of ineligibles+ +
Estimated number of eligibles from the
unknowns=
numberof
unknownsx
number of eligible responding + number of eligible
non-responding
Tables 5 and 6 show details of the response rate calculation of unweighted and weighted response rates, respectively, and Table 7 shows the response rate by gender and ethnicity. Table 5: Unweighted response summary for adults
Interviews
Core Screen Total
(A1) Interviews (eligible) 9,079 3,409 12,488 (A2) Interviews (ineligible) 0 0 0 (B1) Non-interviews (eligible) 2,928 1,349 4,277 (B2) Non-interviews (ineligible) 1,211 14,688 15,899 (B3) Non-interviews (eligibility unknown) 1,353 1,552 2,905 (C) Estimated proportion of eligible people
(= (A1+ B1) / (A1+ B1+ A2 + B2)) 90.8% 24.5%
(D) Estimated eligible non-response (= B1 + B3 * C)
4,157 1,729 5,886
(E) Response rate (= A / (A + D))
68.6% 66.3% 68.0%
Methodology Report for the 2006/07 New Zealand Health Survey 23

Table 6: Weighted response summary for adults
Interviews
Core Screen Total
(A1) Interviews (eligible) 378,278 130,580 508,858 (A2) Interviews (ineligible) 0 0 0 (B1) Non-interviews (eligible) 122,740 52,185 174,925 (B2) Non-interviews (ineligible) 58,207 612,034 670,241 (B3) Non-interviews (eligibility unknown) 57,300 62,751 120,051 (C) Estimated proportion of eligible people
(= (A1 + B1) / (A1 + B1 + A2 + B2)) 89.6% 23.0%
(D) Estimated eligible non-response (= B1 + B3 * C)
174,076 66,615 240,691
(E) Response rate (= A / (A + D))
68.5% 66.2% 67.9%
See Appendix 5 for the above tables detailed by ethnic group (Māori, Pacific, Asian and European/Other). Table 7: Final adult weighted response rates (percentage), by ethnic group and gender
Response rate (%) Ethnic group (total response)
Māori Pacific Asian European/Other Total
Males 62.6 65.5 79.5 66.4 66.1 Females 70.9 74.3 79.6 68.9 69.9
Total 67.5 70.2 79.6 67.8 67.9
24 Methodology Report for the 2006/07 New Zealand Health Survey
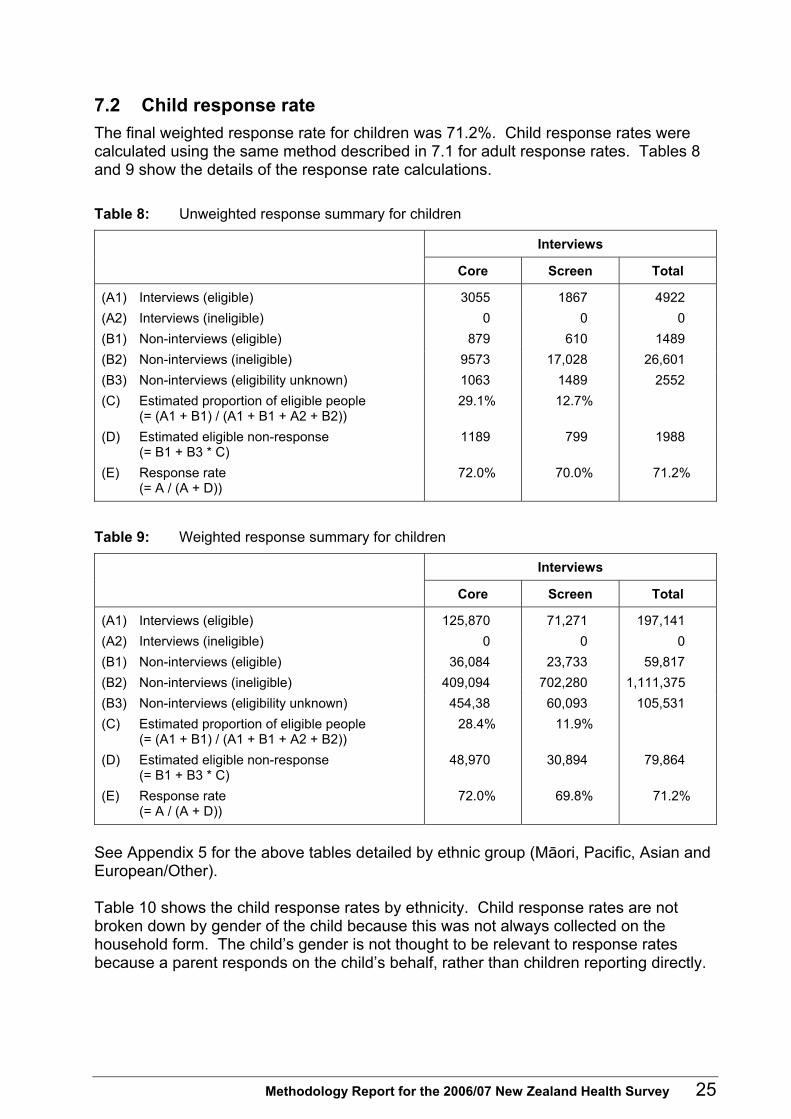
7.2 Child response rate The final weighted response rate for children was 71.2%. Child response rates were calculated using the same method described in 7.1 for adult response rates. Tables 8 and 9 show the details of the response rate calculations. Table 8: Unweighted response summary for children
Interviews
Core Screen Total
(A1) Interviews (eligible) 3055 1867 4922 (A2) Interviews (ineligible) 0 0 0 (B1) Non-interviews (eligible) 879 610 1489 (B2) Non-interviews (ineligible) 9573 17,028 26,601 (B3) Non-interviews (eligibility unknown) 1063 1489 2552 (C) Estimated proportion of eligible people
(= (A1 + B1) / (A1 + B1 + A2 + B2)) 29.1% 12.7%
(D) Estimated eligible non-response (= B1 + B3 * C)
1189 799 1988
(E) Response rate (= A / (A + D))
72.0% 70.0% 71.2%
Table 9: Weighted response summary for children
Interviews
Core Screen Total
(A1) Interviews (eligible) 125,870 71,271 197,141 (A2) Interviews (ineligible) 0 0 0 (B1) Non-interviews (eligible) 36,084 23,733 59,817 (B2) Non-interviews (ineligible) 409,094 702,280 1,111,375 (B3) Non-interviews (eligibility unknown) 454,38 60,093 105,531 (C) Estimated proportion of eligible people
(= (A1 + B1) / (A1 + B1 + A2 + B2)) 28.4% 11.9%
(D) Estimated eligible non-response (= B1 + B3 * C)
48,970 30,894 79,864
(E) Response rate (= A / (A + D))
72.0% 69.8% 71.2%
See Appendix 5 for the above tables detailed by ethnic group (Māori, Pacific, Asian and European/Other). Table 10 shows the child response rates by ethnicity. Child response rates are not broken down by gender of the child because this was not always collected on the household form. The child’s gender is not thought to be relevant to response rates because a parent responds on the child’s behalf, rather than children reporting directly.
Methodology Report for the 2006/07 New Zealand Health Survey 25

Table 10: Child weighted response rates
Ethnicity (total response) Weighted response rate (%)
Māori 74.9 Pacific 74.9 Asian 74.0 European/Other 75.0
Total 71.2
Note that in Table 10 the total response rate is lower than all of the ethnic sub-population response rates. This is possible because in the calculation of the ethnic response rates, any child whose ethnicity is unknown is treated as ‘unknown eligibility’. As a result, there are more cases of unknown eligibility for the response rates by ethnicity than in the overall response rate. The process of applying an estimated eligibility rate to these unknown eligibility cases means that it is possible for all of the ethnic response rates to be higher than the overall response rate. This did not occur in the adult response rates because the ethnicity could be imputed in many cases, so there were fewer instances of unknown ethnicity than in the child survey.
7.3 Coverage rates The coverage rate is an alternative measure related to survey response. The coverage rate is the ratio of the sum of the selection weights for the survey to the known external population size. These coverage rates reflect the discrepancy between the sample weighted by selection weight and the population by age, gender and ethnicity. Unlike the response rate, the coverage rate can be calculated without making any assumption regarding how many households with unknown eligibility were in fact eligible. Moreover, the coverage rate can usually be broken down in more detail than the response rate. However, definitional or operational differences between the survey scope and the external population size will affect the coverage rate (eg, differing definitions of ‘usual residence’). As a result, the response rate is generally used as the primary measure of the survey’s quality. Some information on the coverage rate is included here to provide more detail on response, particularly response by age group. Coverage rates also represent the factor by which the calibrated weighting process needed to adjust the initial selection weights in order to force agreement with benchmark data. Table 11 shows the coverage rates overall, and for Māori and Pacific adults. Figure 2 shows the coverage rates by age and gender. Figures 3 and 4 show the coverage rates for Māori and Pacific adults, respectively. It can be seen that males are under-represented, as are younger people. Table 12 shows the coverage rates for children, by ethnicity.
26 Methodology Report for the 2006/07 New Zealand Health Survey

It should be noted that once calibrated weights have been calculated, there is no discrepancy between the population benchmarks and the final weighted sample counts, by age, gender and ethnicity. Table 11: Sample sizes and coverage rates
Population Sample size Population benchmark
Sum of selection weights
Coverage rate
All adults 12,488 3,120,706 1,844,371 59.1% Māori adults 3,160 355,364 249,666 70.3% Pacific adults 1,033 164,618 110,062 66.9%
Figure 2: Adult coverage rates (%), by age group and gender
0
10
20
30
40
50
60
70
80
90
100
15–19 20–24 25–34 35–44 45–54 55–64 65+
Age group (years)
MalesFemales
Coverage rate (%)
Methodology Report for the 2006/07 New Zealand Health Survey 27

Figure 3: Māori adult coverage rates (%), by age group and gender
0
10
20
30
40
50
60
70
80
90
100
15–19 20–24 25–34 35–44 45–54 55–64 65+
Age group (years)
MalesFemales
Coverage rate (%)
Figure 4: Pacific adult coverage rates (%), by age group and gender
0
10
20
30
40
50
60
70
80
90
100
15–19 20–24 25–34 35–44 45–54 55–64 65+
Age group (years)
MalesFemales
Coverage rate (%)
28 Methodology Report for the 2006/07 New Zealand Health Survey

Table 12: Child coverage rates (%), by ethnic group
Coverage rates (%) Age group (years)
Māori Pacific All
0–4 87.5 72.2 65.8 5–9 83.3 78.7 67.0 10–14 77.6 74.0 68.3
All children 82.9 74.9 67.1
Methodology Report for the 2006/07 New Zealand Health Survey 29

8 Data Processing This section outlines the processes used to collect, check and output the data for the 2006/07 NZ Health Survey.
8.1 Capture Questionnaire responses were entered directly on interviewers’ laptops, using Blaise (version 4.8) Computer-Assisted Personal Interview (CAPI) software.
8.2 Coding Most of the questions used single-response options. However, there were some exceptions. A number of questions required discrete numerical responses, such as age at the time of a specific event, or the number of visits to a specific medical professional. Other numerical data came from measurements of continuous variables such as height and weight. A number of questions in the questionnaire offered an ‘other’ category, where respondents could specify non-standard responses. Each ‘other’ category response was recorded (in free text) in the Blaise computer software. Each response was then re-categorised to an existing code, coded to a newly set-up ‘standard’ code, or coded as ‘other’ by NRB coders. This coding was checked by both NRB and Public Health Intelligence. A number of questions allowed for multiple responses. For these questions all responses were retained, with each response shown as a separate variable on the data file.
8.3 Security of information Any information collected in the survey that could be used to identify individuals has been treated as strictly confidential. Data was transferred from interviewers’ laptops to head office at NRB by a secure internet upload facility. Data was transported to Public Health Intelligence at the Ministry of Health on CD-Rom by signed courier. Names and addresses of people and households who participated in the survey have not been stored with response data. Unit record data was stored in a secure area and was only accessible on a restricted (‘need to know’) basis.
8.4 Checking and editing NRB and Public Health Intelligence both undertook routine checking and editing of the data throughout the field period of the NZ Health Survey. In addition, the final unit record data sets provided to Public Health Intelligence have been edited for range and logic. Any inconsistencies found have been remedied by returning to the interviewer and, if necessary, to the respondent for clarification and correction.
30 Methodology Report for the 2006/07 New Zealand Health Survey
In addition, all extreme height and weight measurements (above or below the 0.01 and 0.99 percentiles of the 2002/03 total adult data) were checked with the interviewer to confirm there was not an error. In a small number of cases, where required, interviewers revisited participants to repeat the measurements or to obtain extra information. There were six respondents who had interviews that took place after their 15th birthday and who were sampled for the child survey. These respondents’ data has been analysed as child data and included in the 14 years age group analyses. There was also a respondent who was interviewed as a 15-year-old using the adult questionnaire, but when their age was calculated they were found to be 14 years old. This respondent’s data has been analysed as adult data and included in the 15 years age group analyses. One respondent was removed from the child data set after it was found that the child had answered the survey rather than the primary caregiver.
8.5 Imputation Household and personal income questions were the only questions in the NZ Health Survey to have significant levels of non-response (approximately 6% for personal income and 13% for household income for adult respondents, and 4% for household income for child survey respondents). All other questions had less than 1% missing data due to ‘don’t know’ responses and refusals. No explicit unit record or item imputation was used in the survey to deal with either unit record or item non-response. Non-response was adjusted for in the calculation of weights, to the extent that this is possible using the weighting variables available (age, sex, ethnicity and DHB).
8.6 Creation of derived variables A number of derived variables have been created on the 2006/07 NZ Health Survey data set. Where possible, standard definitions have been used, with all derivations being thoroughly checked. Derived variables such as educational qualification, labour-force status, body mass index (BMI) and SF-36 score are based on commonly used or standard definitions. Other derived variables – such as a summary indicator of physical activity level that incorporates information on the intensity, duration and frequency of physical activity – have been developed specifically for the analysis of the survey. For the purpose of ethnic group analyses, non-response was included as European/ Other, as was ‘New Zealander’. NZDep2006 is an area-based index of deprivation that measures the level of socioeconomic deprivation for each neighbourhood (meshblock) (Salmond et al 2007). As the 2006/07 NZ Health Survey was based on 2001 Census meshblocks, a probabilistic method had to be used to assign NZDep2006 deciles (and quintiles) to the
Methodology Report for the 2006/07 New Zealand Health Survey 31

2001 meshblocks that were used. This method was used where a 2001 meshblock was split into two or more 2006 meshblocks and these had different NZDep2006 deciles. The decile of the 2006 meshblock with the highest usually resident population was used; if these were equal then the decile of the 2006 meshblock with the highest number of private occupied dwellings was used; and if these were equal then the decile of the 2006 meshblock with the highest NZDep2006 decile was used. There were two meshblocks sampled in the survey that did not have an NZDep2006 score. In these two cases the average decile of the census area unit for those meshblocks was used. For more information on the derived variables in the NZ Health Survey, refer to the confidentialised unit record file (CURF) documentation, which will become available in September 2008.
32 Methodology Report for the 2006/07 New Zealand Health Survey

9 Weighting To ensure that no group is under- or over-represented in estimates from the survey, ‘weights’ are calculated for every survey participant. The weight can be thought of as the number of people in the population represented by a given survey participant.
9.1 Overview of weighting process Most national surveys have complex sample designs, where different groups have different chances of being selected in the survey. These complex designs are used for a variety of purposes, including: • reducing interviewer travel costs by ensuring the sample is geographically clustered,
or ‘clumped’ • ensuring all regions of interest, including small regions, have a sufficient sample to
enable adequate estimates • ensuring all sub-populations, in particular the Māori, Pacific and Asian populations,
have a sufficient sample to enable adequate estimates. To ensure no group is under- or over-represented in estimates from a survey, a method of calculating estimates that reflects the sample design must be used. Estimation weights are used to achieve this aim. A weight is calculated for every respondent, and these weights are used in calculating estimates of population totals (counts), averages and proportions. Typically, members of groups who have a lower chance of selection are assigned a higher weight, so that these groups are not under-represented in estimates. Conversely, groups with a higher chance of selection receive lower weights. Also, groups that have a lower response rate (eg, young men) are usually assigned a higher weight so that these groups are correctly represented in all estimates from the survey. Weights are designed to do two things: a) reflect the probabilities of selection of each respondent b) make use of external population benchmarks (typically obtained from a population
census) to correct for any discrepancies between the sample and the population benchmarks – this improves the precision of estimates and reduces bias due to non-response.
The first aim (a) can be achieved by setting weights equal to 1 divided by the probability of selection for the respondent. This method is called inverse probability weighting. However, a better method is calibrated weighting, which can achieve both (a) and (b). This is the method used for the 2006/07 NZ Health Survey, and is discussed below. Once weights have been calculated for all respondents, estimates of means, totals, counts and proportions can be calculated as follows.
Methodology Report for the 2006/07 New Zealand Health Survey 33

Proportions The proportion of the population who belong to a particular group (eg, the proportion of the population who have diabetes) is estimated by calculating the sum of the weights for the respondents in the group, divided by the sum of the weights of all respondents.
Proportions within population groups The proportion of people in a population group who belong to a subgroup (eg, the proportion of Māori who have diabetes) is estimated by calculating the sum of the weights for the respondents in the subgroup (Māori who have diabetes), divided by the sum of the weights for the respondents in the population group (Māori).
Totals (counts) Estimates of totals are given by the sum of the respondents of the weight multiplied by the variable of interest. For example, the estimate of the total number of people with diabetes in the whole population would be given by the sum, over all respondents, of the number of respondents with diabetes multiplied by the weight.
Averages (means) Estimates of the population averages (eg, the average number of visits to a GP) are calculated by calculating: • the sum, over all respondents, of the weight multiplied by the variable of interest • divided by the sum of the weights.
Averages within population groups Sometimes the average within a group is of interest (eg, the average number of visits to a GP by males). The estimate is given by calculating: • the sum, over respondents, in the group of the weight multiplied by the variable of
interest • divided by the sum of the weights of respondents in the group.
9.2 Calibrated weights The most commonly used methodology for survey weighting is calibrated weighting, and this is what was used for the 2006/07 NZ Health Survey. Calibrated weights are calculated using population benchmark information obtained externally from the survey. In the case of the NZ Health Survey this consists of population counts from the 2006 Census broken down by age, sex, DHB and ethnicity. The idea is to incorporate this external information about the population into the weights.
34 Methodology Report for the 2006/07 New Zealand Health Survey

This means that if the sample differs from the population according to any of these categories, then the estimation weights will correct for the discrepancy. For example, if young men are under-represented in the sample relative to the census counts (as is often the case due to non-response), the weights for young male respondents would be increased, so that this group is correctly represented in estimates. Calibrated weights are calculated to achieve two requirements. a) The weights should be close to the inverse of the probability of selection of each
respondent. b) The weights are calibrated to the known population counts for a range of sub-
populations (eg, age-by-sex categories). This means that the sum of the weights for respondents in the sub-population must exactly equal the known benchmark for the sub-population size.
To be more mathematically precise, the weights are chosen to minimise a measure of the distance between the weights and the inverse selection probabilities, subject to (b) being satisfied. Requirement (a) ensures that estimates have low bias, while requirement (b) improves the precision of estimates and achieves consistency between the survey estimates and external benchmark information. A number of distance measures are in common use. A chi-square distance function (case 1 in Deville and Särndal 1992: 378) was used for the weighting of the 2006/07 NZ Health Survey, which corresponds to generalised regression estimation (also known as GREG). The inverse selection probability is sometimes called the initial weight. The final, calibrated weights are sometimes expressed as:
final weight = initial weight * g-weight. The ‘g-weight’ indicates the factor by which calibration has changed the initial weight. A key decision in developing any weighting scheme is which and how many population benchmarks to incorporate into the weighting. The main issues to consider in this decision are as follows. a) Key output categories should be included as population benchmarks to ensure
good precision for these categories, and to give consistency with benchmark population data (eg, the Census).
b) Classifications that are related to variables of interest should be used. For example, many health conditions are related to age. Using population benchmarks by age group is therefore a sensible strategy.
c) Classifications related to non-response should be used. For example, young males typically have lower-than-average response rates. This suggests that age-by-sex benchmarks should be used in weighting.
Methodology Report for the 2006/07 New Zealand Health Survey 35

d) Not too many benchmarks should be used, as this can make weights unstable and may worsen the precision of estimates. Typically, the number of benchmarks should be less than 10–20% of the sample size. Another relevant measure is the relative variance of the g-weights. This should usually be 0.1–0.2 or less. However, these measures are very approximate and there are many legitimate reasons to depart from them.
9.3 Benchmark populations used for NZ Health Survey The benchmarks used in the NZ Health Survey weighting were population counts by: • age (0–4, 5–9, 10–14, 15–19, 20–24, 25–29, 30–34, 35–39, 40–44, 45–49, 50–54,
55–59, 60–64, 65–74, 75+) by • sex (male, female) by • total ethnic group (Statistics New Zealand Level 1 classification) (Māori, Pacific,
Asian, Other) and population counts by: • DHB area by • child (0–14) vs adult (15+).
Age, sex and ethnicity were included because these variables are related to many health conditions, are related to non-response, and were a key output classification for the survey. The particular age ranges used were based on the most important output categories to be used in NZ Health Survey analysis. DHB was included because this is the main geographic classification to be used in analysing the NZ Health Survey. DHB is also expected to be somewhat related to non-response and the variables of interest, although not as strongly as age, sex and ethnicity. Sometimes surveys are weighted by the New Zealand Deprivation Index (NZDep) to ensure the weighted sample distribution of socioeconomic characteristics reflects the population. The weighted counts from the NZ Health Survey sample by NZDep were calculated, and the distribution reflected the population distribution quite closely without explicitly using NZDep in weighting. Therefore it was decided that NZDep should not be used in weighting. The most recent New Zealand Census was conducted in March 2006, whereas the NZ Health Survey was conducted from October 2006 to November 2007. Population benchmarks for weighting the NZ Health Survey were compiled as follows. • Statistics New Zealand (SNZ) provided 2006 Census counts for usual residents in
private dwellings by age, sex, ethnicity and DHB.
36 Methodology Report for the 2006/07 New Zealand Health Survey
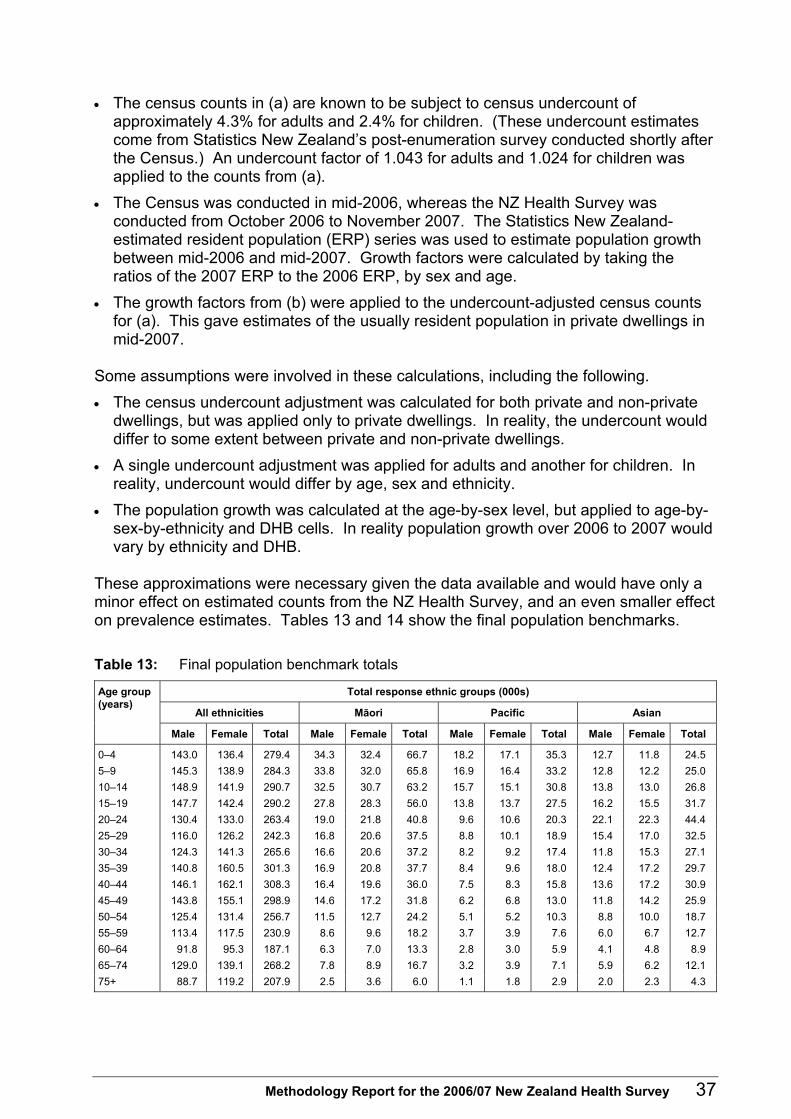
• The census counts in (a) are known to be subject to census undercount of approximately 4.3% for adults and 2.4% for children. (These undercount estimates come from Statistics New Zealand’s post-enumeration survey conducted shortly after the Census.) An undercount factor of 1.043 for adults and 1.024 for children was applied to the counts from (a).
• The Census was conducted in mid-2006, whereas the NZ Health Survey was conducted from October 2006 to November 2007. The Statistics New Zealand-estimated resident population (ERP) series was used to estimate population growth between mid-2006 and mid-2007. Growth factors were calculated by taking the ratios of the 2007 ERP to the 2006 ERP, by sex and age.
• The growth factors from (b) were applied to the undercount-adjusted census counts for (a). This gave estimates of the usually resident population in private dwellings in mid-2007.
Some assumptions were involved in these calculations, including the following. • The census undercount adjustment was calculated for both private and non-private
dwellings, but was applied only to private dwellings. In reality, the undercount would differ to some extent between private and non-private dwellings.
• A single undercount adjustment was applied for adults and another for children. In reality, undercount would differ by age, sex and ethnicity.
• The population growth was calculated at the age-by-sex level, but applied to age-by-sex-by-ethnicity and DHB cells. In reality population growth over 2006 to 2007 would vary by ethnicity and DHB.
These approximations were necessary given the data available and would have only a minor effect on estimated counts from the NZ Health Survey, and an even smaller effect on prevalence estimates. Tables 13 and 14 show the final population benchmarks. Table 13: Final population benchmark totals
Total response ethnic groups (000s)
All ethnicities Māori Pacific Asian
Age group (years)
Male Female Total Male Female Total Male Female Total Male Female Total
0–4 143.0 136.4 279.4 34.3 32.4 66.7 18.2 17.1 35.3 12.7 11.8 24.5 5–9 145.3 138.9 284.3 33.8 32.0 65.8 16.9 16.4 33.2 12.8 12.2 25.0 10–14 148.9 141.9 290.7 32.5 30.7 63.2 15.7 15.1 30.8 13.8 13.0 26.8 15–19 147.7 142.4 290.2 27.8 28.3 56.0 13.8 13.7 27.5 16.2 15.5 31.7 20–24 130.4 133.0 263.4 19.0 21.8 40.8 9.6 10.6 20.3 22.1 22.3 44.4 25–29 116.0 126.2 242.3 16.8 20.6 37.5 8.8 10.1 18.9 15.4 17.0 32.5 30–34 124.3 141.3 265.6 16.6 20.6 37.2 8.2 9.2 17.4 11.8 15.3 27.1 35–39 140.8 160.5 301.3 16.9 20.8 37.7 8.4 9.6 18.0 12.4 17.2 29.7 40–44 146.1 162.1 308.3 16.4 19.6 36.0 7.5 8.3 15.8 13.6 17.2 30.9 45–49 143.8 155.1 298.9 14.6 17.2 31.8 6.2 6.8 13.0 11.8 14.2 25.9 50–54 125.4 131.4 256.7 11.5 12.7 24.2 5.1 5.2 10.3 8.8 10.0 18.7 55–59 113.4 117.5 230.9 8.6 9.6 18.2 3.7 3.9 7.6 6.0 6.7 12.7 60–64 91.8 95.3 187.1 6.3 7.0 13.3 2.8 3.0 5.9 4.1 4.8 8.9 65–74 129.0 139.1 268.2 7.8 8.9 16.7 3.2 3.9 7.1 5.9 6.2 12.1 75+ 88.7 119.2 207.9 2.5 3.6 6.0 1.1 1.8 2.9 2.0 2.3 4.3
Methodology Report for the 2006/07 New Zealand Health Survey 37

All children 0–14
437.2 417.2 854.4 100.6 95.1 195.7 50.7 48.6 99.3 39.3 37.0 76.3
All adults 15+
1497.6 1623.1 3120.7 164.8 190.5 355.4 78.4 86.2 164.6 130.1 148.8 278.9
All ages 1934.8 2040.3 3975.1 265.4 285.6 551.1 129.1 134.8 263.9 169.4 185.8 355.2
Table 14: Summary information about the 2006/07 NZ Health Survey weights (000s)
District Health Board Children 0–14 years Adults 15+ years All people
01 Northland 34.1 111.7 145.8 02 Waitemata 104.0 378.8 482.8 03 Auckland 74.7 322.6 397.3 04 Counties Manukau 111.2 322.4 433.6 05 Waikato 76.2 259.3 335.5 06 Lakes 23.3 72.6 95.9 07 Bay of Plenty 42.8 149.7 192.5 08 Tairawhiti 11.3 32.0 43.3 09 Taranaki 22.3 80.0 102.3 10 Hawke’s Bay 33.3 112.1 145.4 11 Whanganui 13.5 47.2 60.7 12 Midcentral 33.4 121.7 155.1 13 Hutt 30.3 104.7 135.0 14 Capital and Coast 51.1 211.9 263.0 15 Wairarapa 8.0 30.0 38.0 16 Nelson Marlborough 25.4 101.6 127.0 17 West Coast 5.9 23.9 29.8 18 Canterbury 90.9 371.1 462.0 19 South Canterbury 10.3 42.9 53.2 20 Otago 31.3 141.9 173.2 21 Southland 21.1 82.6 103.7
Total 854.4 3120.7 3975.1
Table 15 shows some summary information on the final NZ Health Survey adult weights. In particular, this table presents information on the mean and coefficient of variation (CV) of the selection weights, the final weights and the g-weights, by ethnic group. The CV of the g-weights was 27% (or 0.27), which was considered to be acceptable. A small number of large weights (less than 5) were truncated. Table 16 shows summary information on the child weights. The CV of these g-weights was 28% (or 0.28). Table 15: Basic descriptive information on adult weights
Measure Sub-population Selection weight Final (GREG) weight g-weight
Overall 147.7 249.9 1.64 Māori/Pacific/Asian 92.6 141.5 1.51
Mean of weights
European/Other 191.6 336.4 1.75
Overall 69.7 78.6 26.6 Māori/Pacific/Asian 75.2 81.5 28.4
Coefficient of variation (%) of weights
European/Other 54.3 60.8 23.8
38 Methodology Report for the 2006/07 New Zealand Health Survey

Table 16: Basic descriptive information on child weights
Measure Sub-population Selection weight Final (GREG) weight g-weight
Overall 116.4 173.6 1.45 Māori/Pacific/Asian 83.6 107.9 1.31
Mean of weights
European/Other 177.8 296.6 1.71
Overall 80.4 86.6 28.3 Māori/Pacific/Asian 76.1 79.5 27.2
Coefficient of variation (%) of weights
European/Other 61.1 56.4 22.0
9.4 Replicate weights Standard errors are a measure of the precision of an estimate, and replicate weights are a method for obtaining standard errors for any weighted estimate. In the NZ Health Survey, 100 replicate weights were produced for every respondent in the sample. For any weighted estimator, 100 ‘replicate estimators’ can be calculated using these replicate weights. The standard error of the population estimate is based on the variation of the replicate estimates. This process can be done automatically in a number of statistical packages, including SUDAAN, STATA and R. The SAS programmes developed for analyses have been developed to incorporate these replicate weights. The replicate weights were produced using the GREGWT package, which was provided by the Australian Bureau of Statistics. Each of the 100 replicate estimators corresponds to removing a group of meshblocks, reweighting the remaining sample, and applying an appropriate scaling factor. This is called a grouped jack-knife method. For technical information on replicate variance estimation in surveys, see Rao and Wu (1988) and Shao and Tu (1995).
Methodology Report for the 2006/07 New Zealand Health Survey 39

10 Technical Notes for Analysis The descriptive NZ Health Survey analyses presented in A Portrait of Health (Ministry of Health 2008a) used some specific techniques, which are discussed below.
10.1 Suppression due to small numbers Small sample numbers can affect both the reliability and the confidentiality of results. Problems with reliability occur when the sample becomes too small to adequately represent the population from which it has been drawn. Problems with confidentiality can occur when it becomes possible to identify an individual, usually someone in a sub-group of the population within a small geographical area. In order to ensure the survey data presented is reliable and that the confidentiality of the participants is protected, data has only been presented when there are at least 30 people in the denominator (the population group being analysed). Care has been taken to ensure that no participant can be identified in the results.
10.2 Age standardisation Unadjusted rates have been presented in this report for estimates of the prevalence in the total population and by age group. However, age is an important determinant of health, so populations with different age structures (such as men and women, due to women having a longer life expectancy) will have different rates due to these age differences. For this report, age standardisation was performed by the direct method using the World Health Organization (WHO) world population age distribution (Ahmad et al 2000). This statistical method of standardising for age has been used in analyses by gender, ethnic group and neighbourhood deprivation (NZDep2006), and for comparisons between the different health surveys. Results for children in this report have been age standardised to the under 15-year-old population, and results for adults have been age standardised to the 15-year-old and over population.
10.3 Confidence intervals Ninety-five percent confidence intervals have been used to represent the sample error for estimates. A 95% confidence interval means there is a 95% chance that the true value of the estimate (if we were to survey the whole population) lies between the lower and upper confidence interval values. Differences between estimates are said to be statistically significant when the confidence intervals for each rate do not overlap. Sometimes, however, even when there are overlapping confidence intervals the difference between the groups can be statistically significant. In A Portrait of Health (Ministry of Health 2008a), any differences between two variables where the confidence intervals overlap were tested using a t-test. The significance of a t-test is represented by the p-value. If a p-value is below 0.05, then we are 95% confident the difference between the two estimates is statistically significant. Unless otherwise stated, all differences noted in the text in A Portrait of Health are statistically significant.
40 Methodology Report for the 2006/07 New Zealand Health Survey

Small numbers When calculating confidence intervals for percentages, if: • the numerator (number of respondents with the variable of interest) was less than 30,
or • the lower confidence interval resulted in a value less than 0, or • the upper confidence interval resulted in a value greater than 100 then the Korn and Graubard (1998) method was used to calculate the confidence interval. This means that where a confidence interval spreads outside the range of a percentage, the confidence interval may be asymmetrical.
Percentiles To calculate variances (and hence confidence intervals) using replicate weights for percentiles (including medians), the Woodruff method was used (Woodruff 1952).
10.4 Adjusting population totals for item non-response To account for item non-response in population total estimates, a factor was calculated using the sum of the weighted denominator and the weighted number of item non-respondents divided by the weighted denominator. This was applied to both the weighted numerator and the weighted denominator.
10.5 Data set extension for total response ethnicity Total response ethnic groups were used and standardised rate ratios and median differences presented to compare each ethnic group to the total New Zealand population. A table of the number of respondents with single and multiple ethnic groups is presented in Appendix 3. Specific methods were used for rate ratios and their 95% confidence intervals to account for having ethnic groups that were not mutually exclusive. When calculating the confidence intervals for these, the co-variance between the two groups needs to be taken into account. The delete-a-group jack-knife method was used to do this, because this technique gives a good approximation for the variance between groups by summing up all the differences between two groups within a replicate sample. This process is straightforward when considering rates; for mean and median differences it is more complex, but it can be done using a method outlined by Kish (1965). Age-standardised weights for each ethnic group were calculated separately to account for people with multiple ethnicities. There were 100 standardised replicate weights for each total response ethnic group the data were analysed by. A data set was created in which every respondent was represented at least twice: once as part of the total New Zealand population and once for each of the ethnic groups they identified with. Each respondent then had different standardised replicate weights for
Methodology Report for the 2006/07 New Zealand Health Survey 41

each of their ethnic groups, and for the total New Zealand population. This resulted in a data set that had more records than the number of respondents. Table 17 presents an example of a data set created using this method. In this example, respondent A (who identified with two ethnic groups) has three records in the data set: one for the total New Zealand population (Total NZ), one for Māori and one for Asian. Standardised weights and replicate weights would be created for each of these records, and this data set then used for all analyses. Table 17: Example of template for standardised total response ethnic group data set
Respondent Total response ethnicity
Final standardised
weight
Standardised replicate weight 1
Standardised replicate weight 2
Standardised replicate
weight ... G
A Total NZ A Māori A Asian
B Total NZ B Pacific
For more information about the use of total response ethnic groups for New Zealand Health Monitor surveys, see Ministry of Health 2008c.
42 Methodology Report for the 2006/07 New Zealand Health Survey

11 DHB Estimate Modelling This section describes the methods used to produce: • the grouped DHB estimates that are in A Portrait of Health: Key results of the
2006/07 New Zealand Health Survey • the DHB estimates available on the PHIOnline geographic mapping tool
(www.phionline.moh.govt.nz).
11.1 Overview of DHB estimation methods To help describe these methods it is first useful to outline some different ways of producing estimates for the DHBs: direct survey estimates, synthetic estimates and composite estimates.
Direct survey estimates These are calculated for each DHB using only the respondents from that DHB; in other words, standard survey sub-domain estimates. For many of the larger DHBs these will be of reasonable quality (and are likely to be at least as good as any modelled estimate). However, for many of the smaller DHBs these will not be of sufficient quality.
Synthetic estimates These are estimates derived from a statistical regression model. This means we use relationships between the variable of interest and factors such as age, gender and ethnicity to estimate the prevalence of the variable in the DHB. A variant of this method was used in the 2002/03 NZ Health Survey to produce DHB estimates.
Composite estimates Composite estimates are a combination of direct estimates and synthetic estimates. The idea is to make the best of the two sets of estimates, with the direct estimates being unbiased but highly variable and the synthetic estimates tending to have low variability but significant bias. The composite estimates can be thought of in a modelling context, and are equivalent to modelled estimates where the regression model includes DHB indicators that are modelled as random effects. The random effects model helps us derive measures of quality of the DHB estimates and also helps us understand the assumptions being made when constructing the DHB estimates in this way; namely, that the residual regional effects are random effects generated from a normal distribution. The model-based DHB estimates on PHIOnline can be thought of as composite estimates.
Methodology Report for the 2006/07 New Zealand Health Survey 43

11.2 Grouped DHB estimates (as published in A Portrait of Health) In A Portrait of Health: Key results of the 2006/07 New Zealand Health Survey direct survey estimates are provided for nine groupings of DHBs. Once the DHBs were put into the nine groupings there were at least 1000 adult respondents and 300 child respondents in each group. This allowed for sufficiently accurate estimates for the key health outcome measures without any need for model-based synthetic estimates. The groupings were decided upon after examining the sample size distribution across the DHBs and in consultation with analysts from the different DHBs. It would be preferable to produce direct estimates for each DHB, but for most DHBs these are not reliable (the confidence intervals are too wide). All the more detailed DHB estimates described below are calibrated so that they match the grouped DHB estimates as published in A Portrait of Health.
11.3 Modelled DHB estimates available on PHIOnline This section describes the methods used to produce the model-based DHB estimates on PHIOnline. It covers: • a simplified overview of the modelled estimates • some details of the application of the methods to the NZ Health Survey • a description of the administrative and census data used. Full details of the models and estimators can be found in Templeton 2008.
Overview of the modelling methods used The model-based DHB estimates on PHIOnline are derived using generalised linear mixed model (GLMM) methods. It is possible, however, to describe the resulting estimators without referring to the linear mixed model-based framework. The following is a very simplified step-by-step description of these estimators.
• Step 1: Produce DHB estimates directly from the survey data ( ). dirY
• Step 2: Produce synthetic DHB estimates ( ) based on a simple regression using the demographic profile of the DHB, the available DHB-level administrative data and the national-level survey data.
synY
• Step 3: Calculate the differences between the results from steps 1 and 2, and calculate an estimate of how much variation between these differences can be attributed to true ‘DHB’ effects (= ) and how much is most likely due to the known level of sampling error.
2ˆ uσ
• Step 4: Create a final set of DHB estimates, which are a sum of the modelled estimates plus the estimated DHB effects. The estimated DHB effects will reflect the pattern of DHB differences found in step 3, but these DHB differences will be scaled down (‘shrunk’) so that they reflect the amount of ‘true’ DHB variation (ie, by a factor which is in proportion to as estimated in step 3). 2ˆ uσ
44 Methodology Report for the 2006/07 New Zealand Health Survey

These final DHB estimates can then be thought of as simple weighted combinations of two main components:
• = a modelled estimate based on the demographic profile and the administrative/census data for each DHB
synY
• = a direct estimate based on observations of people in the survey who live in the DHB.
dirY
The weighting is based on the measure of ‘true’ DHB variation. Thus if there is strong DHB variation (even after accounting for the demographic and/or administrative rate differences), then the direct estimate will have more influence on the final result; otherwise (if there is not much evidence for DHB variation) more emphasis will go on the modelled estimates.
Implementation of the modelling methods. The description above is a simplified overview only. A generalised linear mixed model was used to produce the DHB estimates on PHIOnline. The approach taken to produce the modelled estimates mirrors the application of these methods by Saei and Chambers (2003a; 2003b) using the UK Labour Force Survey as the example data set. However, the UK survey is effectively a simple random sample, unlike the NZ Health Survey, which has variation in weights and clustering effects that need to be accounted for. To do this, effective sample sizes (rather than actual sample sizes) were used in the model-fitting process. This is not a perfect solution but should ensure the design effects of the NZ Health Survey are largely accounted for. Examination of covariances between cell (age/sex) estimates of various key variables would suggest the assumptions needed for this approximation are being met to a reasonable extent. The general process for creating these estimates is given below. This process was carried out for each variable of interest separately. More detailed discussion of each step is given in Templeton 2008. • Step 1. Create a data set with the direct DHB estimates and effective samples sizes. • Step 2. Fit the GLMM model and calculate the estimates and their mean square
error (MSE). An SAS program (based on PROC IML) was written to fit the GLMM model and calculate the MSE of the resulting DHB estimators.
• Step 3. Calibrate the modelled estimates so that they are consistent with the direct estimates for the grouped DHBs, as published in A Portrait of Health. A simple raking ratio method is used to accomplish this.
• Step 4. The diagnostics outlined in Brown et al (2001) are then examined for the resulting DHB estimates. These include checking for bias in the estimates, the goodness of fit of the models, and the coverage properties of the confidence intervals.
Methodology Report for the 2006/07 New Zealand Health Survey 45

As a check on the implementation of the GLMM approach, explicit composite estimates (and estimates of their MSE) can be produced using the direct estimators, synthetic estimators and the standard error and MSE of the direct and synthetic estimates. We found these to be quite close to the estimates produced directly from the GLMM models. The synthetic estimates needed for this validation process were produced using PROC SURVEYLOGISTIC and an SAS program (based on PROC IML) which implemented methods described in Ambler et al 2001 to estimate the MSE for the synthetic estimates.
Description of the auxiliary administrative and census data used One of the key aspects of this method is the use of DHB-level administrative (and census) data to create indicators for various health outcomes at the DHB level. Mostly the auxiliary data used in the modelling process was derived from the New Zealand Health Information (NZHIS) Service National Minimum Dataset (Hospital Events) (NMDS). The NMDS is a national collection of public and private hospital discharge information, including clinical information, for inpatients and day patients. Unit record data is collected and stored. All records must have a valid unique National Health Index (NHI) number. Data has been submitted electronically in an agreed format by public hospitals since 1993. The private hospital discharge information for publicly funded events (eg, birth events and geriatric care) has been collected since 1997. Other data is being added as it becomes available electronically. Another key source of administrative data was the Pharmaceutical Collection (known as Pharms). Pharms contains claim and payment information from pharmacists for subsidised dispensings that have been processed by the HealthPAC General Transaction Processing System (GTPS). Essentially, data was combined from the NMDS, and the NHI used to try to ensure events were not double counted, to produce approximate prevalence rates of some of the key chronic conditions in the NZ Health Survey. Data was also used from the 2006 New Zealand Census. This provided data on the socio-demographic profile of the population in each DHB, and also provided data on smoking rates by DHB within different age, gender and ethnic groups.
46 Methodology Report for the 2006/07 New Zealand Health Survey

Table 18: Explanatory variables used in the synthetic DHB estimates
Sociodemographic variables Rates Source
Māori Census Pacific
Ethnicity
Asian
Education No qualifications Census
Country of birth Born in New Zealand Census
Household size Three or more adults in household Census
In high NZDep meshblock Census Socioeconomic status Household income less than $25,000
Employment Employed Census
Unemployment benefit Census Domestic purposes benefit Sickness benefit
Social welfare receipt
Invalids benefit
Urban/rural living Living in urban area Census
Health indicator Smoking Current regular smoker (from census) Census Diabetes NMDS/Pharms Asthma NMDS/Pharms Chronic obstructive pulmonary disorder
NMDS/Pharms
High cholesterol NMDS/Pharms High blood pressure NMDS/Pharms Cardiovascular disorders
Rates based on diagnoses in public hospitals and prescriptions for medicines related to treatment of these conditions found in NZHIS data sets.
NMDS/Pharms
A set of rates, by DHB by age group and gender, was created for each of these indicators and was available for use as auxiliary variables in the modelled estimates for each DHB. Only variables that showed significant effects when fitted as part of the logistic modelling were included in the final GLMM models. This was determined on a variable-by-variable basis.
Methodology Report for the 2006/07 New Zealand Health Survey 47
12 Comparability of 2006/07 NZ Health Survey Data with Other Survey Data
In order to determine any changes in the prevalence of indicators over time, some analyses were carried out comparing current (2006/07) prevalence estimates with earlier prevalence estimates, by gender, for the total population. As a population group, Māori have the poorest health outcomes and highest mortality rate of any ethnic group in New Zealand (Blakely et al 2007; Robson and Harris 2007). It is therefore important to monitor progress towards addressing these disparities, and as a result time trend data for the Māori population by gender was presented in A Portrait of Health where possible. Although European/Other, Pacific and Asian people also have poor outcomes for some indicators in this report, comparisons with earlier survey data for these ethnic groups were not presented in the limited space available in A Portrait of Health. For some indicators small sample sizes in previous surveys meant that wide confidence intervals would limit the use of the comparisons. Time trends for these ethnic groups may be explored in other publications. Where possible in A Portrait of Health, data from the 2006/07 NZ Health Survey was compared with data from the 1996/97 and 2002/03 NZ Health Surveys as well as the 1997 National Nutrition Survey and 2002 Children’s Nutrition Survey. This section gives a brief description of the surveys used in the time trend analyses and provides information on the comparability of the surveys.
Caution is recommended when comparing results between surveys, as there are differences in sample sizes, response rates, questions and methodology. We advise that these aspects be taken into account before making comparisons between results from different surveys.
12.1 1992/93 NZ Health Survey The target population for the 1992/93 NZ Health Survey was defined as the total usually resident, non-institutionalised civilian population of New Zealand of all ages, residing in private households. A stratified cluster sampling process based on the Household Labour Force Survey was undertaken by Statistics New Zealand. The sample consisted of 8960 households. One respondent per household was selected. The response rate was 89%. Data was collected from 7065 individuals, with interviews carried out by telephone wherever possible. If a respondent did not have a telephone or refused to be interviewed over the telephone, a face-to-face interview was carried out at the respondent’s home.
48 Methodology Report for the 2006/07 New Zealand Health Survey

Public Health Intelligence has not carried out any survey comparisons with the 1992/93 NZ Health Survey due to the different mode of data collection used. Full details on the methodology of the 1992/93 health survey can be found in A Picture of Health (Statistics New Zealand and Ministry of Health 1993).
12.2 1996/97 NZ Health Survey The target population for the 1996/97 NZ Health Survey was defined as the total usually resident, civilian population of New Zealand of all ages, residing in permanent private households. A stratified cluster sampling process was undertaken by Statistics New Zealand to select a sample from the target population. The sampling frame was area-based using Statistics New Zealand primary sampling units (PSUs). Māori and Pacific people were oversampled in order to obtain more reliable estimates. There was also some regional oversampling. The sample consisted of 11,921 eligible households. One eligible adult was randomly selected from each selected household. The adult response rate was 74%. In a proportion of PSUs the selected adult was asked if they were a parent or caregiver to any children under 15 years of age in the household. If they were, the adult was then interviewed about one of their children. Data was collected from October 1996 to October 1997 using face-to-face interviewing. The final sample was made up of 7862 adults (including 1321 Māori adults) and 1019 children (including 231 Māori children). Appendix 6 contains tables with the sample sizes in the 1996/97 survey. Full details on the methodology of the 1996/97 health survey can be found in Taking the Pulse: The 1996/97 New Zealand Health Survey (Ministry of Health 1999).
12.3 1997 National Nutrition Survey The 1996/97 NZ Health Survey sample population was used to recruit participants for the 1997 National Nutrition Survey (1997 NNS). Data for the 1997 NNS was collected over the 12-month period from December 1996 to November 1997. The 1997 NNS achieved a response rate of 50%, taking into account the response rate of the 1996/97 NZ Health Survey. A total of 4636 adults participated in the 1997 NNS, including 704 Māori. Appendix 6 contains tables with the sample sizes in the 1997 NNS. Initial analyses of the 1996/97 data were age standardised to the New Zealand population as at March 1997. To allow comparison with the 2002/03 NZ Health Survey, the data was re-weighted to use the WHO world population for age standardisation (Ahmad et al 2000). This is the same age standardisation as carried out for the 2002/03 and 2006/07 NZ Health Surveys.
Methodology Report for the 2006/07 New Zealand Health Survey 49

In A Portrait of Health: Key results of the 2006/07 New Zealand Health Survey, ‘1997’ results for vegetable and fruit intake and body size for adults were obtained from the 1997 NNS. Full details on the methodology of the 1997 NNS can be found in NZ Food NZ People: Key results of the 1997 National Nutrition Survey (Russell et al 1999).
12.4 2002 National Children’s Nutrition Survey The target population for the 2002 National Children’s Nutrition Survey (CNS02) was children aged 5–14 years from schools throughout New Zealand. A sample of 160 schools was selected from the Ministry of Education list. Schools on the Chatham Islands, correspondence schools, and schools with fewer than 50 students were excluded. Te kura kaupapa schools were included regardless of size. Students were then randomly selected from the rolls of the selected schools in proportion to the number of students on the school roll. Different sampling proportions from the school roll were used to ensure approximately equal numbers of Māori, Pacific and European/Other children in the survey sample. The anthropometric measurements were carried out at school, and the main interview was carried out in the home in the presence of a parent or caregiver. Data was collected from February to December 2002. The overall response rate for schools was 91%. The response rate of children from participating schools was 69.3%. A total of 3275 children participated in the survey with parental and personal consent, including 1224 Māori children. Appendix 6 contains tables with the sample sizes in the CNS02. In A Portrait of Health: Key results of the 2006/07 New Zealand Health Survey, the CNS02 anthropometric measures were used to determine changes in body size in children between 2002 and 2006/07. Full details on the methodology of the CNS02 can be found in NZ Food NZ Children: Key results of the 2002 National Children’s Nutrition Survey (Ministry of Health 2003).
12.5 2002/03 NZ Health Survey The target population for the 2002/03 NZ Health Survey was the usually resident New Zealand adult population, 15 years and over, living in permanent private dwellings. An area-based frame using meshblocks as primary sampling units was used as the sample frame. Māori, Pacific peoples and Asian people were oversampled. Data was collected from September 2002 to January 2004 using face-to-face interviewing. The total response rate for the survey was 72%. A total of 12,929 people responded to the survey, including 4369 Māori. Appendix 6 contains tables with the sample sizes in the 2002/03 survey. Full details on the methodology of the 2002/03 NZ Health Survey can be found in A Portrait of Health: Key results of the 2002/03 New Zealand Health Survey (Ministry of Health 2004).
50 Methodology Report for the 2006/07 New Zealand Health Survey

12.6 Comparability of the surveys The 1996/97, 2002/03 and 2006/07 NZ Health Surveys had the same target population, included face-to-face interviews and had similar response rates. The analyses in A Portrait of Health for 2006/07 were restricted to questions that were comparable between the surveys. In some cases, time trends between 1996/97, 2002/03 and 2006/07 are shown, whereas in others only comparisons between 2002/03 and 2006/07 are possible. For example, only the vegetable and fruit questions in the 1997 NNS were comparable to the 2002/03 and 2006/07 health surveys. The CNS02 anthropometric measures were used to determine changes in body size in children between 2002 and 2006/07. Although care was taken to ensure that only questions with similar wording were used to assess changes in indicators, caution is required when comparing the results as other factors (such as question order) can influence responses to an unknown extent. Differences in survey design may also influence the comparability of results. Data collection for the 1996/97 NZ Health Survey was carried out by Statistics New Zealand. The University of Otago carried out the 1997 NNS and the CNS02 was carried out by the University of Auckland, Massey University (Palmerston North) and the University of Otago. Data collection for the 2002/03 and 2006/07 NZ Health Surveys was undertaken by NRB Ltd. Different practices between the various organisations may have introduced some unknown bias into the results, in particular when comparing the 1996/97 data with the 2002/03 and 2006/07 data. For example, to control for non-response, Statistics New Zealand allowed for four to six call-backs before accepting a dwelling as a non-contact dwelling, whereas NRB allowed up to 10 call-backs. Efforts have been made in all NZ Health Surveys to balance for seasonality; for example, the effect that interviewing people in winter may have on physical activity estimates. However, there may still be some differences due to this. A key objective of both the 2002/03 and 2006/07 health surveys was to improve the quality of ethnic estimates for Māori, Pacific and Asian people. These ethnic groups were therefore oversampled to provide more reliable results. As a result, there were three to four times as many Māori in the 2002/03 and 2006/07 health surveys compared to the 1996/97 NZ Health Survey. In the 1996/97 NZ Health Survey some variables for Māori have a small sample size. In these cases the reliability of results may be affected and will be reflected by wide confidence intervals, particularly when the results are stratified by gender. The small sample size has to be taken into account when comparing some variables for Māori when 1996/97 data is included in the time trend analyses. Replicate age-standardised survey weights were created for adults in the 2006/07 NZ Health Survey in order to calculate variances using the same methodology that was used for the 2002/03 NZ Health Survey. These replicated weights were created for a previous analysis comparing the results of the 1996/97 and 2002/03 NZ Health Surveys (Ministry of Health 2006).
Methodology Report for the 2006/07 New Zealand Health Survey 51

Replicate weights were not re-created for children in the 1996/97 NZ Health Survey. For the 1996/97 child data, a design effect of 2 was used and variance calculated using the direct method, which does not require replicate weights. The 2002/03 NZ Health Survey was benchmarked to age, sex, ethnicity and NZDep2001. The 1996/97 NZ Health Survey, although benchmarked to the general population, was not benchmarked to ethnicity (meaning that the final weighted proportions of Māori within the survey sample were not in line with the proportion of Māori within the general population). To assess the impact of not benchmarking to ethnicity in the 1996/97 survey, the representation of the main ethnic groups in the weighted results were compared between the 1996/97 NZ Health Survey and the 1996 Census. Although there are some differences (Māori are under-represented by about 1.8%, Pacific over-represented by 0.7% and the Other ethnic category over-represented by 1%), adjusting the 1996/97 survey weights to reflect these small differences does not have a significant impact on the overall results we have presented. As a result, we have not re-benchmarked the 1996/97 weights. In calculating body mass index (kg/m2), the 1997 NNS and CNS02 height and weight data was re-calculated using the same method as used in the 2002/03 and 2006/07 data sets. For the CNS02 and 2006/07 NZ Health Survey data, the International Taskforce on Obesity BMI cut-offs were used to define thinness, overweight and obesity using exact age for participants aged 2–17 years (Cole et al 2000; Cole et al 2007). For the 1997 NNS and 2002/03 NZ Health Survey, age was only available in years, so this was used in calculating the body size classifications for 15–17-year-olds. It is unlikely that using years rather than exact age in calculating body size for 15–17-year-olds will have any impact on the overall time trends for adults, by gender or ethnic group. For more information on body size calculations used for the 2006/07 NZ Health Survey, see Ministry of Health 2008b. Comparison between the 1996/97, 2002/03 and 2006/07 NZ Health Survey results for AUDIT and SF-36 must be interpreted with caution because the administration of the standard AUDIT and SF-36 forms was different between surveys. In 1996/97 the AUDIT and SF-36 instruments were self-administered, whereas in 2002/03 and 2006/07 they were interviewer-administered. Although both instruments are suitable for self-administration or administration by a trained interviewer in person or by telephone (Babor et al 2001; Ware et al 2005), it is unknown what effect this might have had on the responses within the two surveys.
52 Methodology Report for the 2006/07 New Zealand Health Survey

13 Dissemination of Data There are several ways to access the results and data from the 2006/07 NZ Health Survey: • publications • online data tables • confidential unit record files (CURFs) • PHIOnline maps • contacting PHI.
13.1 Publications Reports and technical papers about the NZ Health Survey are available on the Ministry of Health website at: www.moh.govt.nz/moh.nsf/indexmh/portrait-of-health. The first publication on the 2006/07 NZ Health Survey was released in May 2008: A Portrait of Health: Key results of the 2006/07 New Zealand Health Survey (Ministry of Health 2008a). This report presented the key findings of the 2006/07 NZ Health Survey by gender, age group, ethnic group, neighbourhood deprivation and regional area, where possible. Results were compared with earlier surveys, where possible, for the total population and for Māori, by gender. In addition to this methodology report, several other technical reports and papers related to the 2006/07 NZ Health Survey have been published: • Clark RG. 2008. Proposed Sample Design for the 2006/07 New Zealand Health
Survey. Wellington: Ministry of Health. • Clark RG. Improving regional level estimates from national surveys using Census
and administrative data. Official Statistics Research Journal 1, in press. • Clark RG. The Use of Proxy Reporting of Ethnicity to Improve the Efficiency of
Screening of the Māori, Pacific and Asian Populations. Report prepared as part of Official Statistics Research Project: Sampling for Subpopulation in Household Screening with Application to Māori and Pacific Sampling, forthcoming.
• Clark RG, Gerritsen S. 2006. Sampling the Māori population in the 2006/07 New Zealand Health Survey. Paper presented at Statistics Canada Symposium 2006: Methodological Issues in Measuring Population Health.
• Gerritsen S. 2006. Development and testing of a caregiver-proxy child health questionnaire for the New Zealand Health Survey. Paper presented at Statistics Canada Symposium 2006: Methodological Issues in Measuring Population Health.
• Ministry of Health. 2008b. Body Size Technical Report: Measurements and classifications in the 2006/07 New Zealand Health Survey. Wellington: Ministry of Health.
• Ministry of Health. 2008c. Presenting Ethnicity: Comparing prioritised and total response ethnicity in descriptive analyses of New Zealand Health Monitor surveys. Wellington: Ministry of Health.
Methodology Report for the 2006/07 New Zealand Health Survey 53
• Ministry of Health. 2008d. Monitoring Tobacco Use in New Zealand: A technical report on defining smoking status and estimates of smoking prevalence. Wellington: Ministry of Health.
• Public Health Intelligence, Marfell-Jones M. 2006. Protocols for Collecting Height, Weight and Waist Measurements in New Zealand Health Monitor Surveys. Wellington: Ministry of Health.
Further publications about the 2006/07 NZ Health Survey are planned and will be available from www.moh.govt.nz/phi/publications.
13.2 Online data tables To see the data for all key descriptive analyses (some of which are presented in A Portrait of Health), go to www.moh.govt.nz/moh.nsf/indexmh/portrait-of-health, where you can access the data tables online in Excel format in Appendices 5 and 6 of A Portrait of Health: Key results of the 2006/07 New Zealand Health Survey.
13.3 Access to confidential unit record files (CURFs) The analyses presented in publications are only a small proportion of those that could be undertaken. Public Health Intelligence (PHI) encourages researchers to use NZ Health Survey data sets to explore topics of interest. The 2006/07 NZ Health Survey adult and child CURFs, with accompanying documentation and user guides, will be available from September 2008. CURFs have had all identifying information about individuals removed, and have been modified to protect individual information. Approval is subject to certain criteria, terms and conditions, and the researcher’s organisation must sign a microdata access agreement with PHI. Refer to PHI’s Microdata Data Access Protocol online for more information and to download the application form (www.moh.govt.nz/phi/dataaccess).
13.4 DHB regional estimates on the PHIOnline website PHIOnline (www.phionline.moh.govt.nz) is a geographic visualisation tool with linked tables, graphs and maps, which gives a multidimensional view of data. DHB-level estimates for adults presented in this report are accessible on PHIOnline, allowing users to visually compare DHB data. Note that due to the small number of children in the survey sample for some DHBs, child data has not been included on PHIOnline. PHIOnline uses Adobe Flash player version 8 or above. Flash is a standard PC multimedia application, and is already embedded in most commonly used internet web browsers for free. If you have trouble accessing PHIOnline, please contact PHI.
13.5 Contacting PHI Public Health Intelligence Health and Disability Systems Strategy Directorate Ministry of Health PO Box 5013
54 Methodology Report for the 2006/07 New Zealand Health Survey

Wellington New Zealand Tel: +64 (4) 816 2000 Fax:+64 (4) 816 2340 Email: [email protected] Or, to contact staff directly, email: [firstname_lastname]@moh.govt.nz Website: www.moh.govt.nz/phi
Methodology Report for the 2006/07 New Zealand Health Survey 55

References Ahmad O, Boschi-Pinto C, Lopez A, et al. 2000. Age-standardization of Rates: A new WHO standard. Geneva: World Health Organization.
Ambler R, Caplan D, Chambers R, et al. 2001. Combining unemployment benefits data and LFS data to estimate ILO unemployment for small areas: an application of a modified Fay-Herriot method. Proceedings of the International Association of Survey Statisticians, Meeting of the International Statistical Institute, Seoul, August 2001.
Babor T, Higgins-Biddle J, Saunders J, et al. 2001. The Alcohol Use Disorders Identification Test: Guidelines for use in primary care. Geneva: World Health Organization.
Blakely T, Tobias M, Atkinson J, et al. 2007. Tracking Disparity: Trends in ethnic and socioeconomic inequalities in mortality, 1981–2004. Wellington: Ministry of Health.
Brown G, Chambers R, Heady P, et al. 2001. Evaluation of small area estimation methods: an application to unemployment estimates from the UK LFS. Proceedings of Statistics Canada Symposium, 2001.
Clark RG. 2008. Proposed Sample Design for the 2006/07 New Zealand Health Survey. Wellington: Ministry of Health.
Clark RG, Gerritsen S. 2006. Sampling the Māori population in the 2006/07 New Zealand Health Survey. Paper presented at Statistics Canada Symposium 2006: Methodological Issues in Measuring Population Health, 2006.
Cole TJ, Bellizzi MC, Flegal KM, et al. 2000. Establishing a standard definition for child overweight and obesity worldwide: international survey. British Medical Journal 320(7244): 1240.
Cole TJ, Flegal KM, Nicholls D, et al. 2007. Body mass index cut offs to define thinness in children and adolescents: international survey. British Medical Journal 335(7612): 194.
Deville JC, Särndal CE. 1992. Calibration estimators in survey sampling. Journal of the American Statistical Association 87: 376–382.
Gerritsen S. 2006. Development and testing of a caregiver-proxy child health questionnaire for the New Zealand Health Survey. Paper presented at Statistics Canada Symposium 2006: Methodological Issues in Measuring Population Health, 2006.
Kish L. 1949. A procedure for objective respondent selection within the household. Journal of the American Statistical Association 44(247): 380–7.
Kish L. 1965. Survey Sampling. New York: John Wiley & Sons Inc.
Korn EL, Graubard BI. 1998. Confidence intervals for proportions with small expected number of positive counts estimated from survey data. Survey Methodology 24(2): 193–201.
Ministry of Health. 1999. Taking the Pulse: The 1996/97 New Zealand Health Survey. Wellington: Ministry of Health.
Ministry of Health. 2003. NZ Food NZ Children: Key results of the 2002 National Children’s Nutrition Survey. Wellington: Ministry of Health.
Ministry of Health. 2004. A Portrait of Health: Key results of the 2002/03 New Zealand Health Survey. Wellington: Ministry of Health.
56 Methodology Report for the 2006/07 New Zealand Health Survey

Ministry of Health. 2005. The New Zealand Health Monitor: Updated strategic plan. Wellington: Ministry of Health.
Ministry of Health. 2006. A Comparison of Selected Findings from the 1996/97 and 2002/03 New Zealand Health Surveys. Wellington: Ministry of Health.
Ministry of Health. 2008a. A Portrait of Health: Key results of the 2006/07 New Zealand Health Survey. Wellington: Ministry of Health.
Ministry of Health. 2008b. Body Size Technical Report: Measurements and classifications in the 2006/07 New Zealand Health Survey. Wellington: Ministry of Health.
Ministry of Health. 2008c. Comparing Prioritised and Total Response Ethnicity in Descriptive Analyses of New Zealand Health Monitor surveys. Wellington: Ministry of Health.
Ministry of Health. 2008d. Monitoring Tobacco Use in New Zealand: A technical report on defining smoking status and estimates of smoking prevalence. Wellington: Ministry of Health.
Ministry of Social Development. 2002. New Zealand’s Agenda for Children. Wellington: Ministry of Social Development.
Office of National Statistics. 2006. Model-Based Estimates of ILO Unemployment for LAD/UAs in Great Britain: Guide for users. London: Office of National Statistics.
Public Health Intelligence, Marfell-Jones M. 2006. Protocols for Collecting Height, Weight and Waist Measurements in New Zealand Health Monitor Surveys. Wellington: Ministry of Health.
Rao JNK, Wu CFJ. 1988. Resampling inferences with complex survey data. Journal of the American Statistical Association 83(401): 231–41.
Robson B, Harris R. 2007. Hauora: Māori Standards of Health IV: A study of the years 2000–2005. Wellington: Te Rōpū Rangahau Hauora a Eru Pōmare, School of Medicine and Health Sciences, University of Otago.
Russell DG, Parnell WR, Wilson NC, et al. 1999. NZ Food NZ People: Key results of the 1997 National Nutrition Survey. Dunedin: LINZ® Activity and Health Research Unit, University of Otago.
Saei A, Chambers R. 2003a. Small Area Estimation: A review of methods based on the application of mixed models. S3RI Methodology Working Paper M03/16. Southampton Statistical Sciences Research Institute, University of Southampton.
Saei A, Chambers R. 2003b. Small Area Estimation Under Linear and Generalized Linear Mixed Models with Time and Area Effects. S3RI Methodology Working Paper M03/15. Southampton Statistical Sciences Research Institute, University of Southampton.
Shao J, Tu D. 1995. The Jackknife and Bootstrap. New York: Springer-Verlag.
Statistics New Zealand. 2007. Principles and Protocols for Producers of Tier 1 Statistics. Wellington: Statistics New Zealand.
Statistics New Zealand and Ministry of Health. 1993. A Picture of Health. Wellington: Statistics New Zealand.
Templeton R. 2008. Improving regional level estimates from national surveys using Census and administrative data. Official Statistics Research Journal Vol 1. [Online] available www.statisphere.govt.nz/osresearch.
Methodology Report for the 2006/07 New Zealand Health Survey 57

Ware JE, Kosinski M, Gandek B. 2005. SF-36 Health Survey: Manual and interpretation guide. Lincoln, RI: Quality Metric Incorporated.
Woodruff RS. 1952. Confidence intervals for medians and other position measures. Journal of the American Statistical Association 47: 635–46.
58 Methodology Report for the 2006/07 New Zealand Health Survey

Appendix 1: Procedure for selection and participation rates of respondents in the 2006/07 NZ Health Survey
Figure A1: Procedure for selection and participation rates of respondents in the 2006/07 NZ Health Survey
64.8 % of adult respondents were also the primary caregiver of the
child selected for the survey and
therefore completed both questionnaires
96.3% of adults agreed to have
their heightmeasured (out of 12,258 eligible, not pregnant, in
pain, or wheelchair bound)
96.1% of adults agreed to have
their weight measured (out of 12,258 eligible, not pregnant, in
pain, or wheelchair bound)
95.8% of adults agreed to have
their waist measured (out of 12,258 eligible, not pregnant, in
pain, or wheelchair bound)
96.8% of children agreed to have
their heightmeasured (out of
4175 eligible, aged 2 years+, not
in pain or wheelchair bound)
96.9% of children agreed to have
their weightmeasured (out of
4175 eligible, aged 2 years+, not
in pain or wheelchair bound)
96.8% of children agreed to have
their waistmeasured (out of
3217 eligible, aged 5 years+, not in pain or
wheelchair bound)
14,571 households were approached to form the ‘core’ sample where all ethnicities are eligible. Of these, 12007 (82.4%) had an adult who was eligible
for the survey. Eligibility was unknown in 9.3% of households and the remaining 8.3% of households were ineligible.
20,998 households were approached to form the ‘screened’ sample, of which 4757 (22.7%) had a member of Māori, Pacific or Asian ethnicity and were
eligible for the survey. Eligibility was unknown in 7.4% of households, and the remaining 69.9% of households were ineligible.
1381 meshblocks (small areas) from throughout New Zealand and stratified by District Health Board (DHB), were randomly selected. Interviewers applied predetermined ‘skip patterns’ within each meshblock to select households.
10318 (82.6%) adult respondents agreed that they would be happy to be contacted again about the possibility of answering further health questions of importance to the Ministry of Health
All household members were listed by descending age and then, if eligible to participate in the survey, one adult and one child were randomly selected using a Kish grid.
One eligible adult was selected from each household where an eligible adult could be identified. 75.6% (n = 9079) of known
eligible adults in the core sample completed the questionnaire, and 71.6% (n = 3409) of known eligible adults selected in the ‘screened’ sample completed the questionnaire, resulting in a
total of 12,488 adult interviews.
One child was selected from each household known to have an eligible child. The primary caregivers of 77.7% (n = 3055) of known eligible children selected in the ‘core’ sample and 75.4% (n = 1866) of known eligible children selected in the ‘screened’sample completed the questionnaire, resulting in a total of 4921
child interviews.
Methodology Report for the 2006/07 New Zealand Health Survey 59

Appendix 2: Summary of 2006/07 NZ Health Survey content consultation The following stakeholders provided comment on the content of the 2006/07 NZ Health Survey questionnaires in May 2005.
External • Agencies for Nutrition Action • Arthritis Foundation • Auckland University of Technology • Centre for Public Health Research, Massey University • Department of Internal Affairs, Manager of Gambling • Health Services Research Centre, Victoria University of Wellington • Mental Health Foundation • Ministry of Social Development • Ministry of Women’s Affairs • Motu Economic and Public Policy Research • Sociology Department, Auckland University (Peter Davis) • Statistics New Zealand • UNICEF New Zealand • Wellington School of Medicine and Health Sciences, University of Otago
Internal (Ministry of Health and DHBs) • Corporate and Information Directorate • Clinical Services Directorate • Disability Services Directorate • Māori Health Directorate • Mental Health Directorate • Public Health Directorate • Sector Policy Directorate • DHB representatives on the Internal Advisory Group Members of the 2006/07 NZ Health Survey Independent Monitoring Group (see Acknowledgements at the front of this document) also provided substantial feedback on the consultation documents.
60 Methodology Report for the 2006/07 New Zealand Health Survey

Appendix 3: Respondent selection procedure The following procedure was followed to randomly select eligible respondents for the 2006/07 NZ Health Survey in order to eliminate bias in the selection process.
1. Following enumeration by the interviewer (where they counted and recorded the households within their area boundary), the interviewer marked the ‘core’ households and ‘screened’ (or booster) households following a set pattern, beginning at a predetermined randomly selected spot on their meshblock map. For example, every third house may be a core household, and then every second house not already selected may be a screened household.
2. The interviewer then approached each ‘core’ house and talked to an adult who answered the door. The interviewer described the survey and requested the assistance of this adult to complete the household screener form (see page 64), in order to select household members to invite to take part in the survey.
3. The adult who answered the door was asked to give the first name or initials of everyone who usually lives at the house aged 15 years and over, in order from oldest to youngest. The names or initials were listed on the household screener in column A.
4. The gender of each adult in the household was also collected from the adult who answered the door (in column B).
5. The interviewer used the ethnicity showcard (on page 66) to collect the ethnicity of each household member. Note that this was a proxy response from the person who answered the door and may later have been found to be incorrect (ie, the selected respondent during the course of the survey may have identified themselves as a different ethnicity or ethnicities than the adult who answered the door), in which case the respondent’s self-defined ethnicity was used to determine both their survey eligibility and their ethnic group for data analysis purposes.1
6. Responses to the ethnicity showcard were categorised by the interviewer as Māori (M), Pacific (P), Asian (A) and/or European/Other (O), and recorded on the household screener in column C (1 = O, 2 = M, 3, 4, 5, or 6 = P and 7 or 8 = A). Specified answers to response ‘9’ could result in a tick in the P, A or O box depending on the answer given. Interviewers used the reverse side of the ethnicity showcard (on page 67) to determine which ethnicities were classified by Statistics New Zealand as Pacific and Asian. If the ethnicity was not listed on the reverse side of the showcard it was classified as Other.
1 The Use of Proxy Reporting of Ethnicity to Improve the Efficiency of Screening the Māori, Pacific and
Asian Populations (Clark, forthcoming) details the effectiveness of this technique.
Methodology Report for the 2006/07 New Zealand Health Survey 61
7. The initials or names of all adults were then transferred to the Kish grid on the household screener, in order from oldest to youngest (as all adults are eligible for selection in ‘core’ households). The number in column E that fell alongside the youngest adult household member was used to select the respondent (eg, in the household screener on page 64, the number in column E is ‘1’ no matter how many adults are in the household, so the first person listed in the Kish grid that is the eldest was selected to participate in the survey). The numbers in column E change on each household screener sheet, thereby making the process random when they are used in order.
8. Steps 2 to 7 were repeated on the right-hand side of the household screener sheet, this time listing any children aged from birth to 14 years in the household, in order to randomly select one child to take part in the survey. If there were no children in the household, the interviewer indicated this on the sheet.
9. The selected adult respondent and the primary caregiver of the selected child respondent were then invited to answer the questionnaire.
10. Appointment times to suit the respondents were made on the reverse of the household screener sheet (page 65).
11. Steps 2 to 10 were repeated in ‘screened’ households, with the only difference being that in Step 8 only those adults or children who were identified as Māori, Pacific or Asian were listed in the Kish grid and therefore eligible for selection. Different-coloured household screener forms with slightly differing instructions were used for the ‘screened’ households to minimise interviewer error.
62 Methodology Report for the 2006/07 New Zealand Health Survey

Figure A2: Example of the front of a household screener sheet used in ‘core’ households (where all adults and children are eligible)
Methodology Report for the 2006/07 New Zealand Health Survey 63

Figure A3: Example of the front of a household screener sheet used in ‘screened’ households (where only Māori, Pacific or Asian adults and children are eligible)
64 Methodology Report for the 2006/07 New Zealand Health Survey

Figure A4: Reverse side of the household screener (for both core and screened households)
Methodology Report for the 2006/07 New Zealand Health Survey 65

Figure A5: Front side of the ethnicity showcard used on the doorstep to complete column C of the household screener (in both ‘core’ and ‘screened’ households)
66 Methodology Report for the 2006/07 New Zealand Health Survey
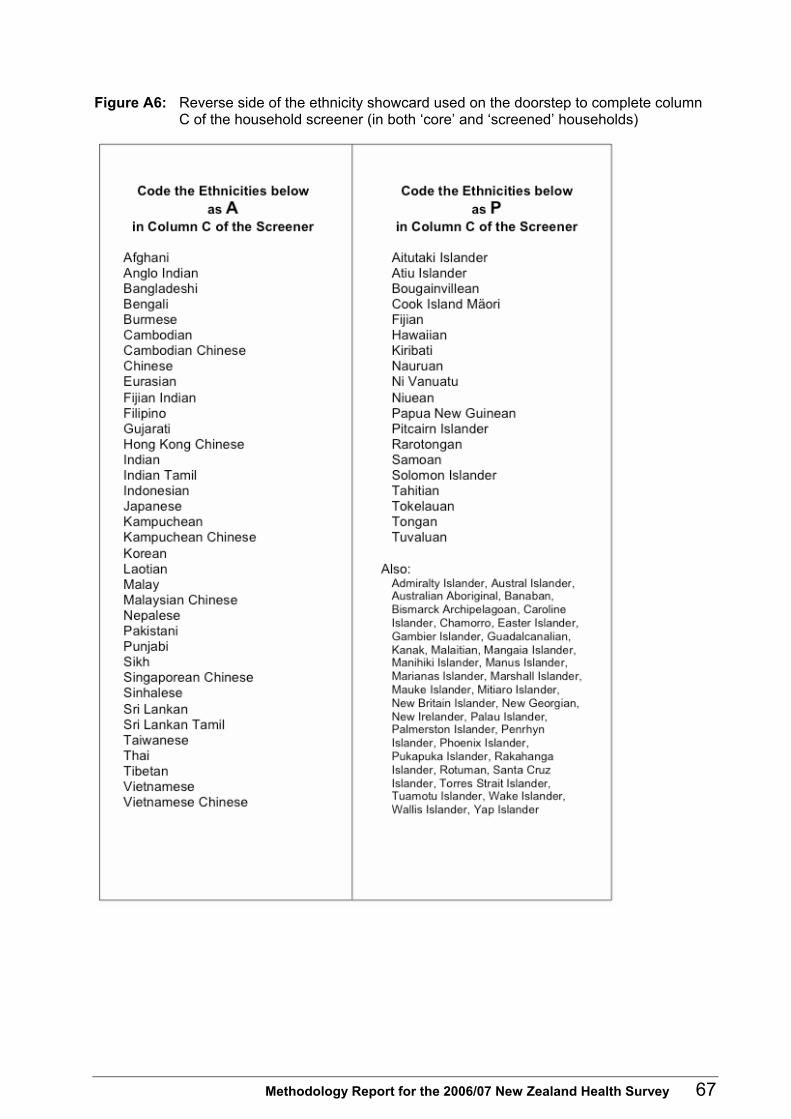
Figure A6: Reverse side of the ethnicity showcard used on the doorstep to complete column C of the household screener (in both ‘core’ and ‘screened’ households)
Methodology Report for the 2006/07 New Zealand Health Survey 67
Appendix 4: Information provided to participants
Invitation letter Dear Householder
The Ministry of Health invites you to take part in the 2006/07 New Zealand Health Survey
Your household has been selected by chance to participate in the 2006/07 NewZealand Health Survey. The New Zealand Health Survey collects information aboutthe health of New Zealanders and the health services they use. The information willbe used to develop health policy and programmes to better meet the needs of NewZealanders. One adult and one child, if there are any children in your household, will be invited totake part. While participation is voluntary, the Ministry of Health hopes you willconsent to participate. Your participation is important to improve the health ofNew Zealanders and the New Zealand health system. An interviewer from the National Research Bureau (NRB) will visit your house tospeak with you further and answer any questions you may have. Interviewing willtake place throughout New Zealand from September 2006 to November 2007. Regards Stephen McKernan Director-General of Health Ministry of Health Your NRB interviewer’s name is …………………………………………………………… Appointment Day …………………… Date …………………… Time ………………… If you would like to change this appointment or request an interviewer of the same gender or ethnicity as yourself, please phone the NRB on 0800 672 476
68 Methodology Report for the 2006/07 New Zealand Health Survey

English information brochure
Methodology Report for the 2006/07 New Zealand Health Survey 69

70 Methodology Report for the 2006/07 New Zealand Health Survey

Consent form
2006/07 New Zealand Health Survey
Request for interpreter
English I wish to have an interpreter. Yes No
Māori E hiahia ana ahau ki tētahi kaiwhakamāori korero. Ae Kao
Samoan Ou te mana’o ia i ai se fa’amatala upu. Ioe Leai
Tongan Oku ou fiema’u ha fakatonulea. Io Ikai
Cook Island Ka inangaro au i tetai tangata uri reo. Ae Kare
Niuean Fia manako au ke fakaaoga e taha tagat fakahokohoko kupu. E Nakai
Fijian Au gadreva me dua e vakadewa vosa vei au. Io Sega
Chinese 我希望有口译员 是 否 Korean 통역사가 필요합니다. 예 아니오 Hindi १. अनवादक, टीकाकार, दभािषया, ा याता हा नह
Consent form
I agree to take part in the New Zealand Health Survey on behalf of: [TICK ALL THAT APPLY]
Myself;
A child, for whom I am the primary caregiver;
An adult who is infirm or disabled, and for whom I am the primary caregiver. Please read each bullet point carefully before signing below:
• I have read and I understand the information pamphlet on the New Zealand Health Survey. I know I can ask questions at any time and I can contact NRB or the Ministry of Health if I want further information.
• I know that I can stop the interview at any time and I don’t have to answer every question.
There is no disadvantage to me if I don’t want to take part or if I stop at any time. • I know that my participation in the New Zealand Health Survey is confidential and any
information that could identify me or my child will never be used in any reports on this study. All my answers are protected by the Privacy Act of 1993.
Name: [PLEASE PRINT] …………………………………………………………………………………… Signed: …………………………………………………………… Date: …………/…………/………… Interviewer's signature………………………………… PSU Sampled home
Methodology Report for the 2006/07 New Zealand Health Survey 71

Thank you card
72 Methodology Report for the 2006/07 New Zealand Health Survey

Appendix 5: Response summary tables, by ethnic group, for 2006/07 NZ Health Survey
Table A1: Unweighted response summary: Māori adults
Core Screen Total
(A1) Interviews (eligible) 1248 1912 3160 (A2) Interviews (ineligible) 7831 1497 9328 (B1) Non-interviews (eligible) 350 733 1083 (B2) Non-interviews (ineligible) 3448 15,184 18,632 (B3) Non-interviews (eligibility unknown) 1694 1672 3366 (C) Estimated proportion of eligible people
(= (A1 + B1) / (A1 + B1 + A2 + B2)) 12.4% 13.7%
(D) Estimated eligible non-response (= B1 + B2 * C) 560 962 1522 (E) Response rate (= A / (A + D)) 69.0% 66.5% 67.5%
Table A2: Weighted response summary: Māori adults
Core Screen Total
(A1) Interviews (eligible) 45,921 68,727 114,647 (A2) Interviews (ineligible) 332,358 61,853 394,211 (B1) Non-interviews (eligible) 12,968 26,292 39,260 (B2) Non-interviews (ineligible) 152,763 633,266 786,029 (B3) Non-interviews (eligibility unknown) 72,517 67,412 139,929 (C) Estimated proportion of eligible people
(= (A1 + B1) / (A1 + B1 + A2 + B2)) 10.8% 12.0%
(D) Estimated eligible non-response (= B1 + B2 * C) 20,818 34,399 55,217 (E) Response rate (= A / (A + D)) 68.8% 66.6% 67.5%
Table A3: Unweighted response summary: Pacific adults
Core Screen Total
(A1) Interviews (eligible) 387 646 1033 (A2) Interviews (ineligible) 8692 2762 11,454 (B1) Non-interviews (eligible) 98 197 295 (B2) Non-interviews (ineligible) 3700 15,720 19,420 (B3) Non-interviews (eligibility unknown) 1694 1673 3367 (C) Estimated proportion of eligible people
(= (A1 + B1) / (A1 + B1 + A2 + B2)) 3.8% 4.4%
(D) Estimated eligible non-response (= B1 + B2 * C) 162 270 432 (E) Response rate (= A / (A + D)) 70.5% 70.5% 70.5%
Methodology Report for the 2006/07 New Zealand Health Survey 73

Table A4: Weighted response summary: Pacific adults
Core Screen Total
(A1) Interviews (eligible) 15,587 25,908 41,495 (A2) Interviews (ineligible) 362,692 104,671 467,363 (B1) Non-interviews (eligible) 3993 8098 12,091 (B2) Non-interviews (ineligible) 161,738 651,460 813,198 (B3) Non-interviews (eligibility unknown) 72,517 67,412 139,929 (C) Estimated proportion of eligible people
(= (A1 + B1) / (A1 + B1 + A2 + B2)) 3.6% 4.3%
(D) Estimated eligible non-response (= B1 + B2 * C) 6602 10,999 17,602 (E) Response rate (= A / (A + D)) 70.2% 70.2% 70.2%
Table A5: Unweighted response summary: Māori children
Core Screen Total
(A1) Interviews (eligible) 850 1133 1983 (A2) Interviews (ineligible) 2205 734 2939 (B1) Non-interviews (eligible) 152 306 458 (B2) Non-interviews (ineligible) 10,107 17,225 27,332 (B3) Non-interviews (eligibility unknown) 1256 1596 2852 (C) Estimated proportion of eligible people
(= (A1 + B1) / (A1 + B1 + A2 + B2)) 7.5% 7.4%
(D) Estimated eligible non-response (= B1 + B2 * C) 247 424 671 (E) Response rate (= A / A + D)) 77.5% 72.7% 74.7%
Table A6: Weighted response summary: Māori children
Core Screen Total
(A1) Interviews (eligible) 31,320 40,758 72,078 (A2) Interviews (ineligible) 94,550 30,513 125,063 (B1) Non-interviews (eligible) 5610 10,872 16,481 (B2) Non-interviews (ineligible) 431,304 710,920 1,142,22
4 (B3) Non-interviews (eligibility unknown) 53,702 64,315 118,017 (C) Estimated proportion of eligible people
(= (A1 + B1) / (A1 + B1 + A2 + B2)) 6.6% 6.5%
(D) Estimated eligible non-response (= B1 + B2 * C) 9134 15,059 24,192 (E) Response rate (= A / (A + D)) 77.4% 73.0% 74.9%
74 Methodology Report for the 2006/07 New Zealand Health Survey

Table A7: Unweighted response summary: Pacific children
Core Screen Total
(A1) Interviews (eligible) 312 487 799 (A2) Interviews (ineligible) 2743 1380 4123 (B1) Non-interviews (eligible) 70 108 178 (B2) Non-interviews (ineligible) 10,189 17,423 27,612 (B3) Non-interviews (eligibility unknown) 1256 1596 2852 (C) Estimated proportion of eligible people
(= (A1 + B1) / (A1 + B1 + A2 + B2)) 2.9% 3.1%
(D) Estimated eligible non-response (= B1 + B2 * C) 106 157 263 (E) Response rate (= A / (A + D)) 74.6% 75.6% 75.2%
Table A8: Weighted response summary: Pacific children
Core Screen Total
(A1) Interviews (eligible) 12,248 19,346 31,594 (A2) Interviews (ineligible) 113,622 51,925 165,547 (B1) Non-interviews (eligible) 2871 4338 7209 (B2) Non-interviews (ineligible) 434,043 717,454 1,151,497 (B3) Non-interviews (eligibility unknown) 53,702 64,315 118,017 (C) Estimated proportion of eligible people
(= (A1 + B1) / (A1 + B1 + A2 + B2)) 2.7% 3.0%
(D) Estimated eligible non-response (= B1 + B2 * C) 4313 6259 10,572 (E) Response rate (= A / (A + D)) 74.0% 75.6% 74.9%
Methodology Report for the 2006/07 New Zealand Health Survey 75

Appendix 6: Sample sizes Tables A9 to A13 show the 2006/07 NZ Health Survey sample sizes and the total usually resident population counts by gender, age, ethnicity, NZDep2006 quintile and DHB area. Tables A14 and A15 contain the sample sizes of previous health surveys used in the time series analyses in A Portrait of Health (Ministry of Health 2008a). Please note that due to the complex sample design of the survey, the sample size is not the only determinant of the reliability of the results. The geographic clustering of the sample, the unequal probabilities of selection, and the boosted sampling of Māori, Pacific and Asian peoples in the survey also affect the precision of estimates. Table A9: Sample sizes and population counts for children and adults, by gender, 2006/07
NZ Health Survey
Population group Gender Sample size Population
Boys 2,589 437,200 Girls 2,332 417,200
Children (0–14 years)
Total 4,921 854,500
Men 5,273 1,497,600 Women 7,215 1,623,100
Adults (15 years and over)
Total 12,488 3,120,700
Table A10: Sample sizes and population counts, by ethnic group and gender, 2006/07
NZ Health Survey
Ethnic group Gender Sample size Population
Boys 1,600 329,300 Girls 1,439 316,100 Men 3,652 1,227,600
European/Other
Women 4,941 1,324,000
Boys 1,040 100,500 Girls 943 95,100 Men 1,205 164,800
Māori
Women 1,955 190,600
Boys 435 50,800 Girls 363 48,600 Men 433 78,400
Pacific
Women 600 86,300
Boys 385 39,300 Girls 357 37,100 Men 657 130,200
Asian
Women 856 148,800
76 Methodology Report for the 2006/07 New Zealand Health Survey

Table A11: Sample sizes and population counts, by age group and gender, 2006/07 NZ Health Survey
Age group Gender Sample size Population
Boys 380 53,800 < 2 years Girls 366 58,400
Boys 517 89,100 2–4 years Girls 441 78,400
Boys 897 142,900 0–4 years Girls 807 136,700
Boys 748 145,400 5–9 years Girls 728 138,600
Boys 944 148,900 10–14 years Girls 797 141,800
Men 271 100,900 15–17 years Women 293 98,500
Men 439 176,900 18–24 years Women 660 176,900
Men 710 277,900 15–24 years Women 953 275,400
Men 785 240,300 25–34 years Women 1295 267,500
Men 1108 286,900 35–44 years Women 1469 322,600
Men 923 269,500 45–54 years Women 1156 286,500
Men 744 205,300 55–64 years Women 985 212,800
Men 598 129,000 65–74 years Women 706 139,100
Men 405 88,800 75 years and over Women 651 119,200
Methodology Report for the 2006/07 New Zealand Health Survey 77

Table A12: Sample sizes and population counts, by NZDep2006 quintile and gender, 2006/07 NZ Health Survey
NZDep2006 quintile Gender Sample size Population
Boys 380 96,600 Girls 353 86,500 Men 894 324,800
Quintile 1 (least deprived neighbourhoods)
Women 1117 349,400
Boys 409 78,000 Girls 346 76,300 Men 947 298,000
Quintile 2
Women 1175 310,800
Boys 489 82,700 Girls 437 83,200 Men 1065 314,500
Quintile 3
Women 1436 330,300
Boys 518 80,800 Girls 535 83,800 Men 1116 298,800
Quintile 4
Women 1615 340,900
Boys 793 99,100 Girls 661 87,400 Men 1251 261,500
Quintile 5 (most deprived neighbourhoods)
Women 1872 291,800
78 Methodology Report for the 2006/07 New Zealand Health Survey

Table A13: Sample sizes and population counts, by District Health Board area, 2006/07 NZ Health Survey
District Health Board area Age group (years) Sample size Population
0–14 982 115,500 Northland / Lakes / Tairawhiti / Hawke’s Bay / Whanganui 15+ 2426 375,600
0–14 522 104,000 Waitemata 15+ 1213 378,800
0–14 425 74,600 Auckland 15+ 1104 322,600
0–14 672 111,200 Counties Manukau 15+ 1301 322,400
0–14 589 76,200 Waikato 15+ 1417 259,400
0–14 597 98,500 Bay of Plenty / Taranaki / MidCentral 15+ 1643 351,400
0–14 469 89,400 Wairarapa / Hutt Valley / Capital and Coast 15+ 1264 346,600
0–14 328 90,900 Canterbury 15+ 1019 371,100
0–14 337 94,000 Nelson Marlborough / West Coast / South Canterbury / Otago / Southland
15+ 1101 392,900
Table A14: Sample sizes in previous surveys used in time trends, total population, by gender
Sample size Population group Gender
1996/97 NZ Health
Survey
1997 NNS 2002/03 NZ Health
Survey
2002 CNS 2006/07 NZ Health
Survey
Boys 548 – – 1,697 2,589 Girls 471 – – 1,578 2,332
Children (0–14 years)
Total 1,019 – – 3,275 4,921
Men 3,258 1,927 5,075 – 5,273 Women 4,604 2,709 7,854 – 7,215
Adults (15 years and over)
Total 7,862 4,636 12,929 – 12,488
Notes: NNS = National Nutrition Survey; CNS = National Children’s Nutrition Survey, only 5–14-year-olds.
Methodology Report for the 2006/07 New Zealand Health Survey 79

Table A15: Sample sizes in previous surveys used in time trends, Māori population, by gender
Sample size Population group Gender
1996/97 NZ Health
Survey
1997 NNS 2002/03 NZ Health
Survey
2002 CNS 2006/07 NZ Health
Survey
Boys 132 – – 631 1040 Girls 99 – – 593 943
Children (0–14 years)
Total 231 – – 1224 1983
Men 510 268 1550 – 1205 Women 811 436 2819 – 1955
Adults (15 years and over)
Total 1321 704 4369 – 3160
Notes: NNS = National Nutrition Survey; CNS = National Children’s Nutrition Survey, only 5–14 year olds.
80 Methodology Report for the 2006/07 New Zealand Health Survey
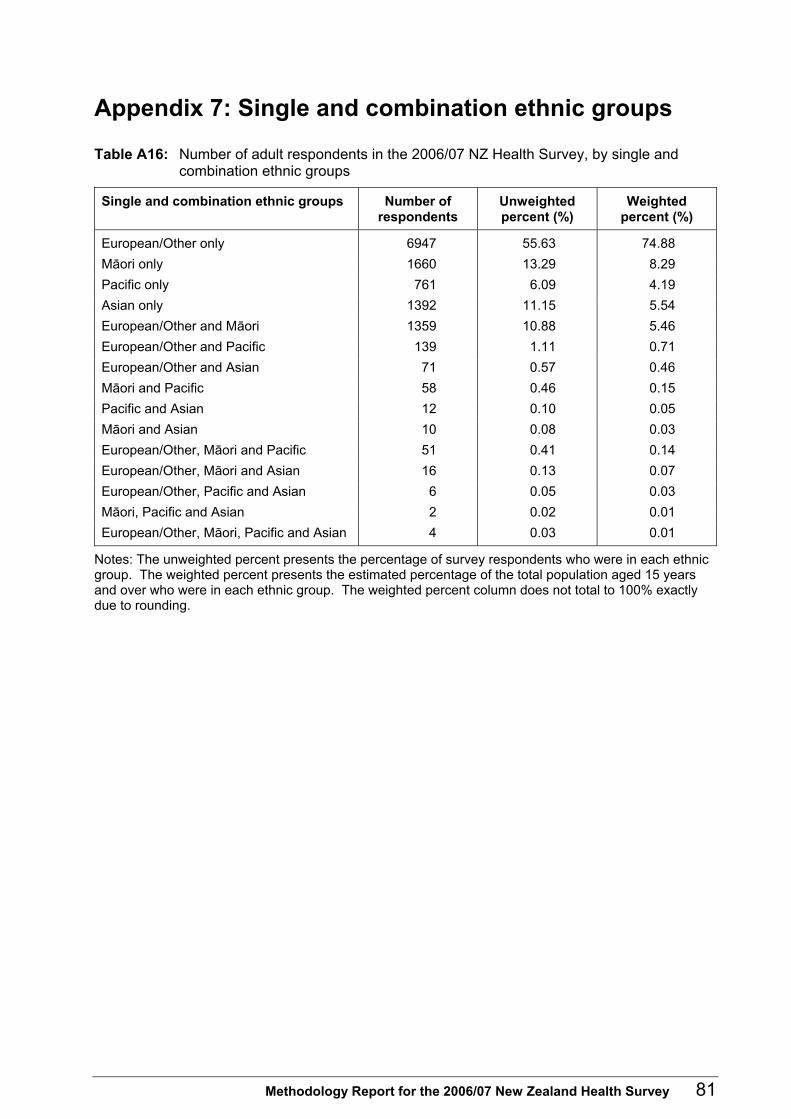
Appendix 7: Single and combination ethnic groups
Table A16: Number of adult respondents in the 2006/07 NZ Health Survey, by single and combination ethnic groups
Single and combination ethnic groups Number of respondents
Unweighted percent (%)
Weighted percent (%)
European/Other only 6947 55.63 74.88 Māori only 1660 13.29 8.29 Pacific only 761 6.09 4.19 Asian only 1392 11.15 5.54 European/Other and Māori 1359 10.88 5.46 European/Other and Pacific 139 1.11 0.71 European/Other and Asian 71 0.57 0.46 Māori and Pacific 58 0.46 0.15 Pacific and Asian 12 0.10 0.05 Māori and Asian 10 0.08 0.03 European/Other, Māori and Pacific 51 0.41 0.14 European/Other, Māori and Asian 16 0.13 0.07 European/Other, Pacific and Asian 6 0.05 0.03 Māori, Pacific and Asian 2 0.02 0.01 European/Other, Māori, Pacific and Asian 4 0.03 0.01
Notes: The unweighted percent presents the percentage of survey respondents who were in each ethnic group. The weighted percent presents the estimated percentage of the total population aged 15 years and over who were in each ethnic group. The weighted percent column does not total to 100% exactly due to rounding.
Methodology Report for the 2006/07 New Zealand Health Survey 81

Table A17: Number of child respondents in the 2006/07 NZ Health Survey, by single and combination ethnic groups
Single and combination ethnic groups Number of respondents
Unweighted percent (%)
Weighted percent (%)
European/Other only 1715 34.85 59.53 Māori only 774 15.73 9.00 Pacific only 400 8.13 7.19 Asian only 558 11.34 6.88 European/Other and Māori 922 18.74 11.26 European/Other and Pacific 133 2.70 1.89 European/Other and Asian 109 2.21 1.34 Māori and Pacific 109 2.21 0.99 Pacific and Asian 14 0.28 0.17 Māori and Asian 22 0.45 0.15 European/Other, Māori and Pacific 126 2.56 1.20 European/Other, Māori and Asian 23 0.47 0.21 European/Other, Pacific and Asian 9 0.18 0.10 Māori, Pacific and Asian 5 0.10 0.07 European/Other, Māori, Pacific and Asian 2 0.04 0.02
Notes: The unweighted percent presents the percentage of survey respondents who were in each ethnic group. The weighted percent presents the estimated percentage of the total population aged 15 years and over who were in each ethnic group. The unweighted percent column does not total to 100% exactly due to rounding.
82 Methodology Report for the 2006/07 New Zealand Health Survey

Appendix 8: Summary of other national health surveys
Table A18: Summary of other national health surveys Most recent survey for which results have been released Name of
survey Lead agency Mode Frequency
Year Sample size Response rate More information Australian National Health Survey
Australian Bureau of Statistics
Face-to-face interview (measurements in 2007-08)
Three-yearly 2004-05 19,501 adult (18+) 6,415 children (0-17)
89% of households (not available for adults and children)
http://www.abs.gov.au/ausstats/[email protected]/mf/4364.0
Health Survey for England
Department of Health (contracted to National Centre for Social Research)
Face-to-face interview and measurements
Continuous (results released annually)
2006 14,142 adults (16+) 3,491 children (0-15)
61% adults 66% children
www.dh.gov.uk/en/Publicationsandstatistics/PublishedSurvey/HealthSurveyForEngland/index.htm
The Welsh Health Survey
Department of Health (contracted to National Centre for Social Research)
Face-to-face interview and self-complete section
Continuous (results released annually)
2005/06 14,305 adults (16+) 3,062 children (0-15)
67% adults 67% children
http://new.wales.gov.uk/topics/statistics/publications/health-survey200506
The Scottish Health Survey
Scottish Executive Health Department (contracted to University of Glasgow)
Face-to-face interview and measurements
Five yearly 2003 8,148 adults (16+) 3,324 children (0-15)
60% adults 72% children
http://www.scotland.gov.uk/Publications/2005/11/25145024/50251
Canadian Community Health Survey
Statistics Canada Telephone (measurements in 2004 only)
Continuous (results released biannually)
2005 130,000 adolescents and adults (12+)
79% of adults aged 12 years and older
http://www.statcan.ca/english/sdds/indext.htm
National Health Interview Survey
National Centre for Health Statistics (CDC)
Face-to-face interview (no measurements)
Continuous (results released annually)
2006 24,275 adults (18+) 9,837 children (0-17)
71% adults 79% children
www.cdc.gov/nchs/nhis.htm
National Health and Nutrition Examination Survey
National Centre for Health Statistics (CDC)
Face-to-face interview, health exam and measurements
Continuous (results released biannually)
2005-06 10,348 adults (over two year period)
78% interview 75% examination
http://www.cdc.gov/nchs/nhanes.htm
Methodology Report for the 2006/07 New Zealand Health Survey 83