
Life Sciences Index presents Andrew Cox from IIAPS at Pharma Integrates 2013

Andrew Rashbass and Colin Jones
22 November 2017
FY17 results presentation

Page 2
2016 – no outward change
2017 – year of transition
2018 – year of growth
Message from our Investor Day in March 2016 Message from today
We’re on track
Strategic journey

Page 3
Strategy recap

Page 4
Euromoney’s capital allocation decisions can be understood along two dimensions
Structure
We characterise the business models of B2B information companies into three generations, which we call B2B Information 1.0, 2.0 and 3.0.
We service fundamentally cyclical markets. Understanding which point in the cycle they are in is fundamental to our capital allocation decisions.
Cycle
Plotting the businesses along the axes supports our investment decisions, capital allocation and defines strategic priorities.
Quadrants

Page 5
Successful B2B information companies will be 3.0 businessesStructure
- +
B2B Information 1.0
Monologue
Advertising-centric
Product-centric
B2B Information 2.0 B2B Information 3.0
Digital
Dialogue
Subscriptions
Customer-centric
Embedded in workflow
Part of the industry structure
Licensing revenues based on customer outcomes
Solution-centric
We aim to anticipate our markets’ development to become 3.0

Page 6
Market cycles impact the sectors that we serveCycle
Equities Commodities Banking and financial institutions
Commodity indexEquity index Bank shares index
0
50
100
150
200
250
300
350
0
200
400
600
800
1,000
1,200
1,400
1,600
1,800
2,000
2,200
2,400
2,600
60
80
100
120
140
160
180
200
220
240
1990 1994 1998 2002 2006 2010 2014 2018 1991 1995 1999 2003 2007 2011 2015 2018 2008 2009 2010 2011 2012 2013 2014 2015 2016 2017 2018
Source: S&P 500 index Source: Bloomberg Commodity index Source: S&P Bank index

Page 7
Based on the cycle and structure we categorise the businesses in the portfolio Quadrants
The quadrants guide investment decisions, capital allocation and also define strategic priorities
B2B Information 3.0
-
3 Prepare for the upturn• Protect and enhance competitive position• Selective investments for when cycle turns• Opportunistic revenue initiatives• Tight cost control• Fix any operational deficit
B2B Information 1.0
Challenged market Strong tailwinds
-
1
4
2
Cycle Stru
ctu
re
Invest
Use the time wiselyDisinvest• Modest investment to move to top-right quadrant• Maximise short-term profit and cash• Fix any operational deficit• Consider divestment
• Maximise short-term profit and cash• Divest• Prevent future build-up
• New product development• Sales and marketing• Acquisition• Fix any operational deficit• Accelerate transition to 3.0
+
+

Page 8
The actions dictated in the quadrant can be collected into our three key pillars of strategic activity
Prepare for the upturn
Invest3 4
1 2Disinvest
Use the time wisely
Prepare for the upturn
Invest3 4
1 2Disinvest
Use the time wisely
Prepare for the upturn
Invest3 4
1 2Disinvest
Use the time wisely
Invest around big themes
Actions depend on market characteristics
Disruption
Semi-opaque market
Inefficiency
Barriers to entry
Challenged business models
Transform the operating model Actively manage the portfolio
Product development and creating our future operating model
3.0 Business model
Must have, not nice to have
Create once, sell many
Best of both worlds
Recycling capital
Acquisition
Disposal

Page 9
Our portfolio of businesses are split into four segments composed of seven divisions with support from central functions
Price ReportingSpecialist
Information
Euromoney Institutional Investor PLC
Banking & FinanceGlobal Market
Intelligence
Asset Management Banking & Finance
Investment Research
Institutional Investor
Pricing, Data & Market IntelligenceCommodity
Events
Events
Central functions
Corporate Development
Finance
HR
IT
Marketing
Legal, Risk and Programmes
Fin
ance
Legal
Project and Asset Financing
Insurance
Derivatives
Commodity
TelC
ap
Segment Division

Page 10
Boeing Fleet Database (January 2016)
Reinsurance Security (August 2016)
FastMarkets (September 2016)
Broadgroup (March 2017)
RISI (April 2017)
Layer123 (April 2017)
Acquisitions Disposals Gulf & PE (April 2016)
HedgeFund Intelligence (December 2016)
II Intelligence (December 2016)
Euromoney Indices (March 2017)
LatinFinance (March 2017)
Adhesion & WBWE (October 2017)
CEIC & EMIS held for sale– Rationale: Recycling of capital towards big
investment themes
– Status: process on track. Any announcement unlikely before January 2018
– Impact on FY17 numbers (slide 55)
Active portfolio management
Page 11
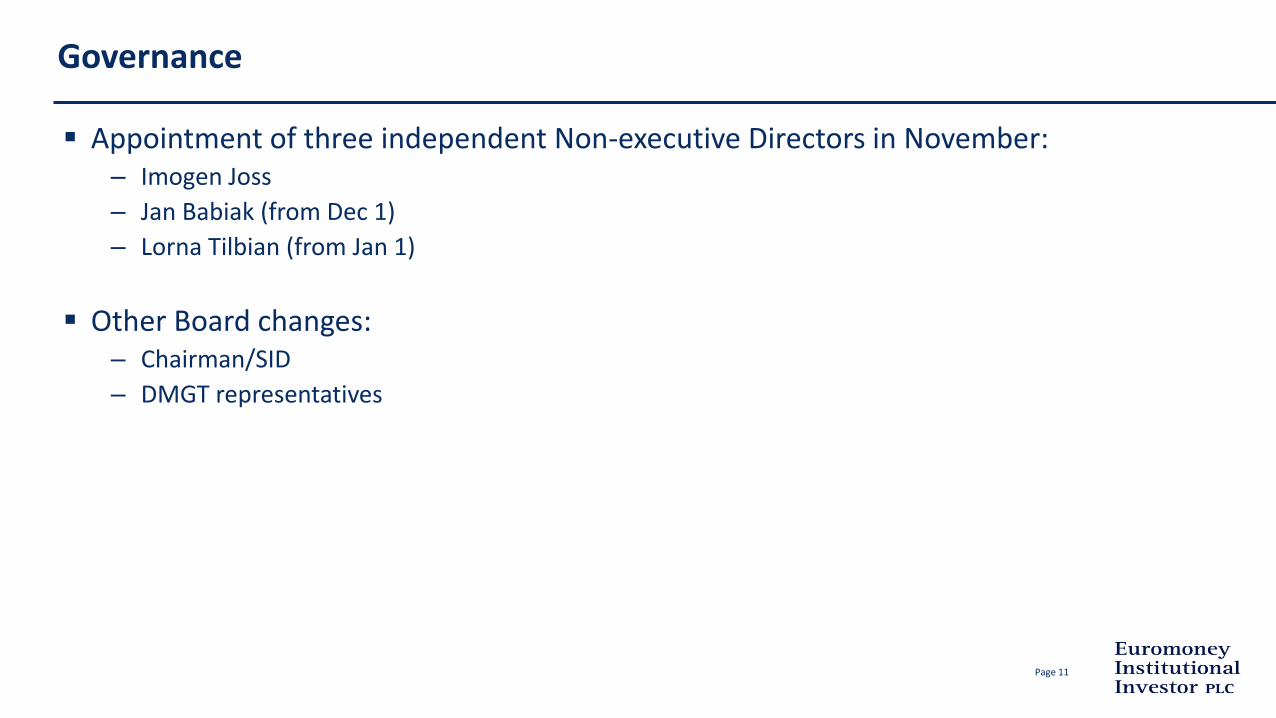
Appointment of three independent Non-executive Directors in November:– Imogen Joss
– Jan Babiak (from Dec 1)
– Lorna Tilbian (from Jan 1)
Other Board changes:– Chairman/SID
– DMGT representatives
Governance

From March 2016 Investor Day
FY14/FY15growth
(underlying)
Disinvest Batten downthe hatches
Use thetime wisely
Invest,Organic
Achievableorganicgrowth
Invest,Acquisitions
Achievablegrowth
New
2015Existing
Margin: Lower margin Margin-enhancing Higher margin
Quality: Lower quality Improving quality High quality
1
1. Underlying revenue growth from FY14 to FY15, excluding the impact of acquisitions, disposals, currency movements and significant event timing differences.
2. Note: Chart for illustrative purposes only. Not drawn to scale
Strategy: achievable revenue growth (not guidance)

Page 13
Full-year results
Page 14
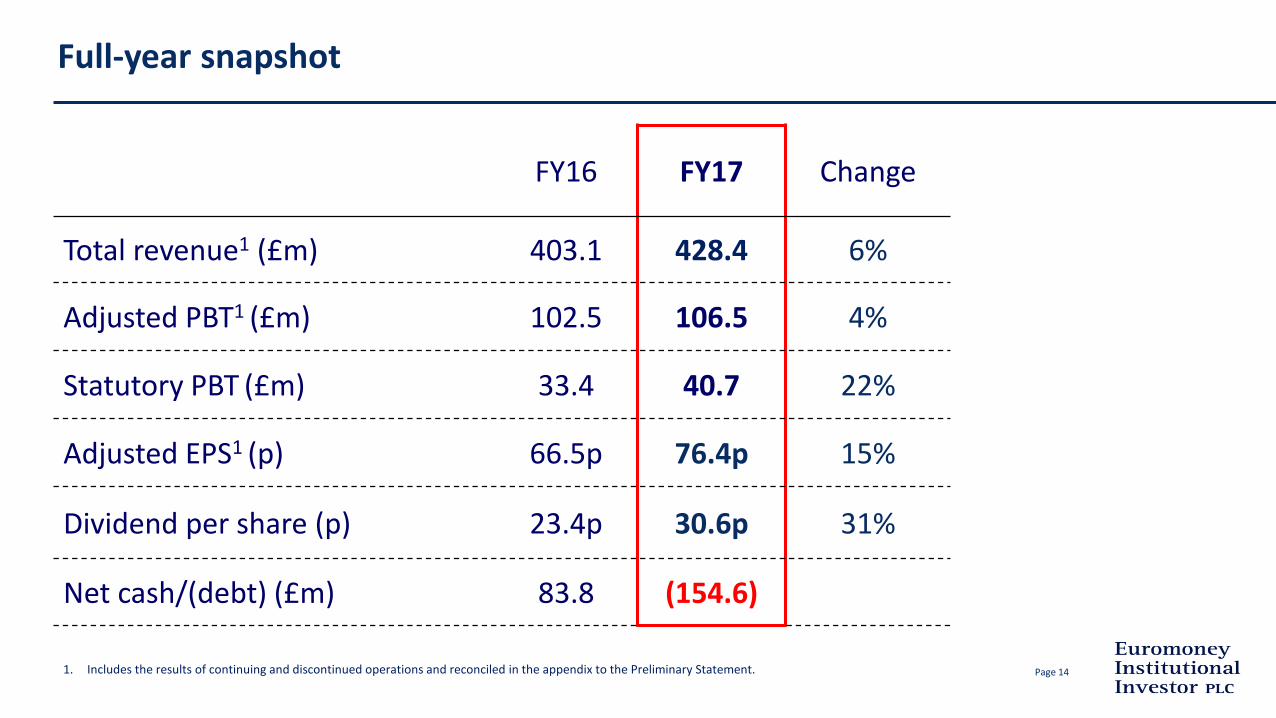
FY16 FY17 Change
Total revenue1 (£m) 403.1 428.4 6%
Adjusted PBT1 (£m) 102.5 106.5 4%
Statutory PBT (£m) 33.4 40.7 22%
Adjusted EPS1 (p) 66.5p 76.4p 15%
Dividend per share (p) 23.4p 30.6p 31%
Net cash/(debt) (£m) 83.8 (154.6)
1. Includes the results of continuing and discontinued operations and reconciled in the appendix to the Preliminary Statement.
Full-year snapshot

Page 15
Statutory profit (£m)
40.7
106.5 (20.8)
(33.7)
(9.2)
(5.2) 3.1
Adjusted PBT Acquired intangible amortisation
Exceptional items (slide 42)
Discontinuedoperations PBT
Associates/JVs
Acquisition commitmentmovements
Statutory PBT

Page 161. Includes the results of continuing and discontinued operations and reconciled in the appendix to the Preliminary Statement.
Adjusted1 results
£m FY16 FY17 Change
Total revenue 403.1 428.4 6%
Adjusted operating profit 101.4 107.1 6%
Adjusted operating margin 25.2% 25.0% (0.2%)
Adjusted PBT 102.5 106.5 4%

Page 17
FY16 to FY17 total revenue1 bridge (£m)
433.4428.4
403.1
34.5 (3.0) (1.2) (5.0)
FY16 FX Timing Net M&A FY16 underlying revenue(restated on FY17 basis
for continuing businesses)
Business revenue FY17
£41.5m Global Markets Intelligence Division
£37.1m Global Markets Intelligence Division
1. Includes the results of continuing and discontinued operations.

Page 18
FY16 to FY17 total revenue1 bridge (by segment) (£m)
428.4
433.4 (3.0)
5.1 (4.7)
(2.4)
FY16 underlying revenue(restated on FY17 basis
for continuing businesses)
AssetManagement
Pricing, Data & Market Intelligence
Banking &Finance
Commodity Events
FY17
HeadwindsStrategy & tailwinds
Self help
1. Includes the results of continuing and discontinued operations.

Page 19
FY16 to FY17 Adjusted PBT1 bridge (£m)
112.2
106.5
102.5
10.9 (2.1)0.9 (6.4)
FY16 FX Timing Net M&A FY16 Underlying Adjusted PBT(restated on FY17 basis
for continuing businesses)
Central costs(incl interest)
Business profit(incl Associates and JVs)
FY17
0.7
£8.8m Global Markets Intelligence Division
£11.5m Global Markets Intelligence Division
1. Includes the results of continuing and discontinued operations.

Page 20
FY16 to FY17 underlying1 segmental performance (£m)
Revenue
Profit
Pricing, Data & Market Intelligence
Banking & Finance Commodity Events
Battening down the hatches
Top-rightinvestment
Shifting quadrants
Self-help, plus H1 headwinds
Total
(5.0)
0.7
Asset Management
1. At constant exchange rates, including pro forma prior year comparatives for acquisitions and excluding disposals and significant event timing differences.
Associates/JVs

Page 211. At constant exchange rates, including pro forma prior year comparatives for acquisitions and excluding disposals and significant event timing differences.2. Includes other revenues but excludes revenues from sold/closed businesses. FX hedging losses restated in prior year at current year level.3. Q4 adjusted for ‘self-help’ actions and decision not to repeat events in certain markets due to increased geopolitical instability.
Revenue turnaround since Q1
Y-o-Y % change FY17 Actuals
Q1 Q2 Q3 Q4Q4
Like-for-like3
Subscriptions and content
1% 2% 1% 1% 1%
Advertising (16%) (10%) (5%) (3%) (3%)
Events (14%) 2% 4% (8%) (2%)
Total2 (5%) 1% 2% (2%) 0%
Revenue change by quarter1
Page 22
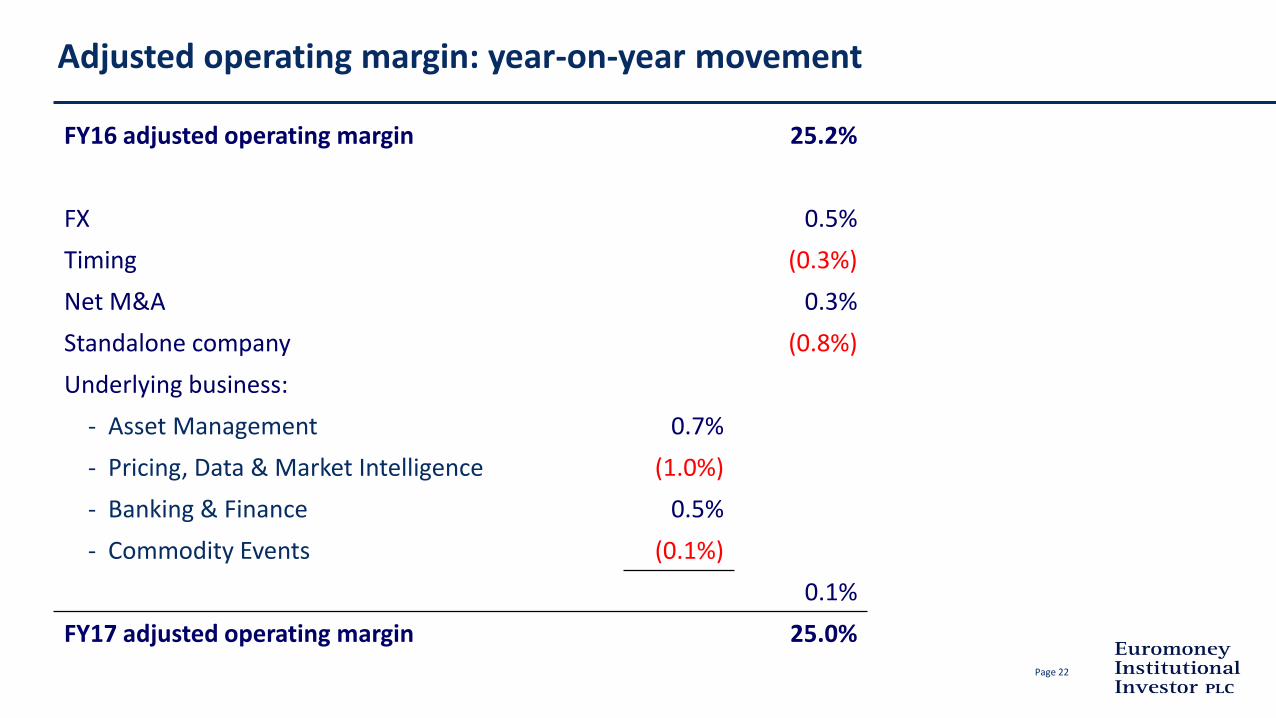
Adjusted operating margin: year-on-year movement
FY16 adjusted operating margin 25.2%
FX 0.5%
Timing (0.3%)
Net M&A 0.3%
Standalone company (0.8%)
Underlying business:
- Asset Management 0.7%
- Pricing, Data & Market Intelligence (1.0%)
- Banking & Finance 0.5%
- Commodity Events (0.1%)
0.1%
FY17 adjusted operating margin 25.0%
Page 23
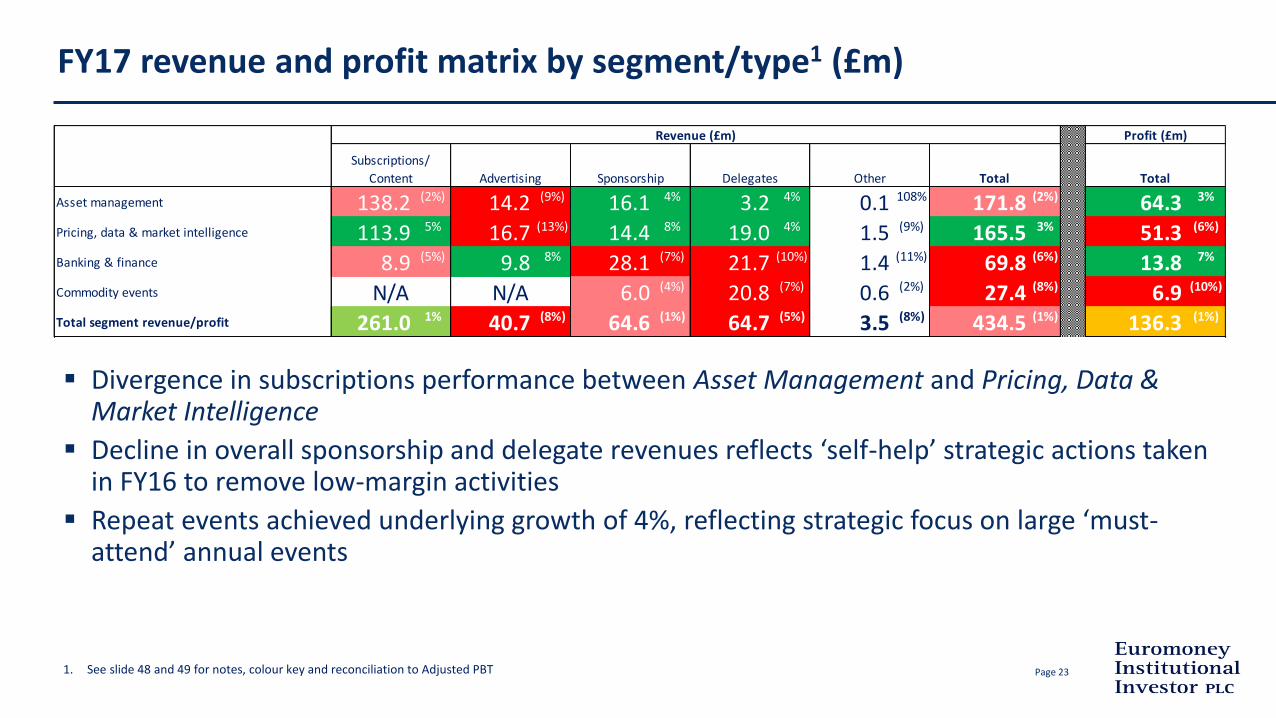
FY17 revenue and profit matrix by segment/type1 (£m)
Divergence in subscriptions performance between Asset Management and Pricing, Data & Market Intelligence
Decline in overall sponsorship and delegate revenues reflects ‘self-help’ strategic actions taken in FY16 to remove low-margin activities
Repeat events achieved underlying growth of 4%, reflecting strategic focus on large ‘must-attend’ annual events
1. See slide 48 and 49 for notes, colour key and reconciliation to Adjusted PBT
Asset management 138.2 (2%) 14.2 (9%) 16.1 4% 3.2 4% 0.1 108% 171.8 (2%) 64.3 3%
Pricing, data & market intelligence 113.9 5% 16.7 (13%) 14.4 8% 19.0 4% 1.5 (9%) 165.5 3% 51.3 (6%)
Banking & finance 8.9 (5%) 9.8 8% 28.1 (7%) 21.7 (10%) 1.4 (11%) 69.8 (6%) 13.8 7%
Commodity events 6.0 (4%) 20.8 (7%) 0.6 (2%) 27.4 (8%) 6.9 (10%)
Total segment revenue/profit 261.0 1% 40.7 (8%) 64.6 (1%) 64.7 (5%) 3.5 (8%) 434.5 (1%) 136.3 (1%)
Total
Profit (£m)Revenue (£m)
Delegates Other Total
N/A N/A
Subscriptions/
Content Advertising Sponsorship

Page 24
£10.9m year-on-year FX benefit to adjusted PBT:
– GBP/USD rate fell 14 cents
– £9.4m FX benefit on translation of overseas profits
– UK embedded FX benefit £9.4m partly offset by movement in hedging losses of £5.6m
– £0.4m FX loss on balance sheet revaluation (FY16: £1.9m gain)
FX hedging losses do not repeat in FY18 at current exchange rates
Impact of favourable FX
GBP/USD rate

Page 251. As reconciled in appendix to Preliminary Statement.
FY17 cash flow (£m)
83.8 (193.5)
126.0 (30.8)
(12.9)(102.2)
(21.8)
(4.8) 9.4 (7.8)(154.6)
Net cash atSept 30 2016
Share buyback(incl fees)
Underlying cashgenerated from
operations
Dividends Capex Net M&A Net tax Interest Other(incl FX)
Non tradingitems
Net debt atSept 30 2017
Underlying 12-month cash conversion 118%

Page 26
Outlook & summary

Page 27Source: Financial Times ‘Countdown to MiFID II’ (November 2017)
Asset Management and MiFID II impact
MiFID II: How asset managers will pay for research?
Absorb costs, 85%
Pass costs on to clients, 5%
Undecided, 7%
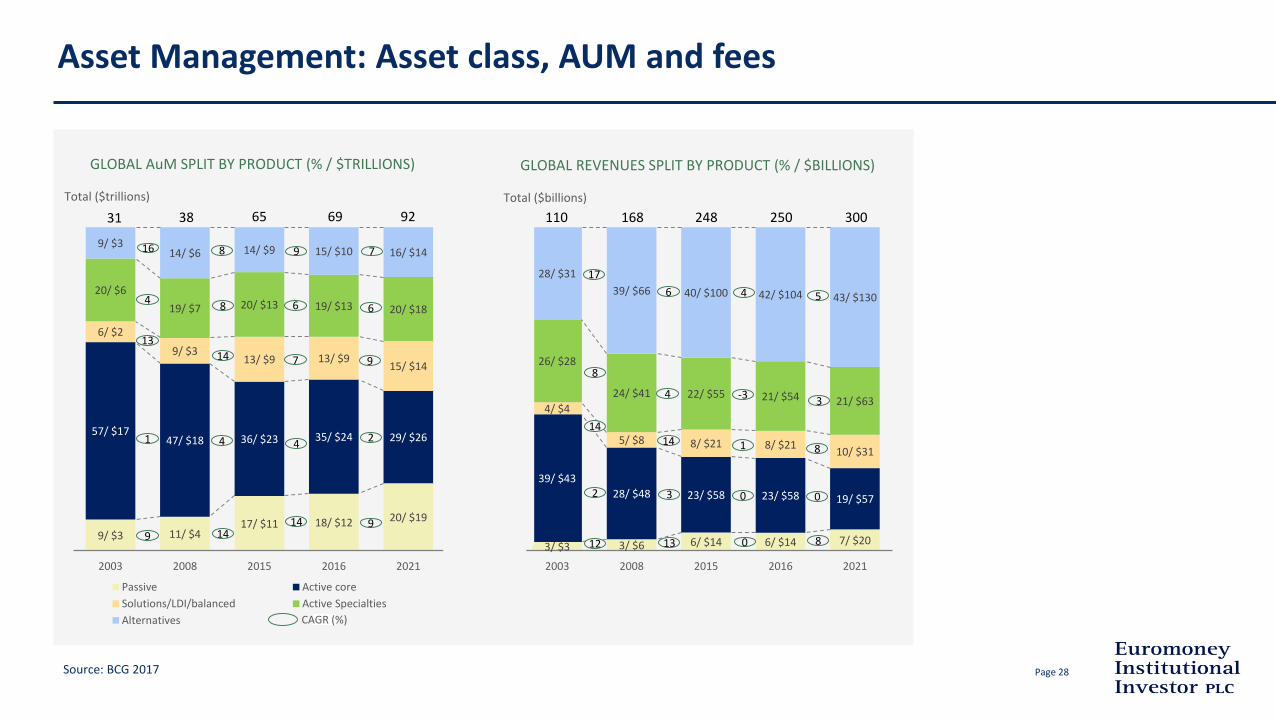
Page 28Source: BCG 2017
Asset Management: Asset class, AUM and fees
9/ $3 11/ $417/ $11 18/ $12 20/ $19
3/ $3 3/ $6 6/ $14 6/ $14 7/ $20
57/ $1747/ $18 36/ $23 35/ $24 29/ $26
39/ $43
28/ $48 23/ $58 23/ $58 19/ $57
6/ $2
9/ $313/ $9 13/ $9
15/ $14
4/ $4
5/ $8 8/ $21 8/ $2110/ $31
20/ $6
19/ $7 20/ $13 19/ $13 20/ $18
26/ $28
24/ $41 22/ $55 21/ $54 21/ $63
9/ $314/ $6 14/ $9 15/ $10 16/ $14
28/ $31
39/ $66 40/ $100 42/ $104 43/ $130
2003 2008 2015 2016 2021 2003 2008 2015 2016 2021
Total ($trillions) Total ($billions)
Passive Active core
Solutions/LDI/balanced Active Specialties
Alternatives
GLOBAL AuM SPLIT BY PRODUCT (% / $TRILLIONS) GLOBAL REVENUES SPLIT BY PRODUCT (% / $BILLIONS)
31 38 65 69 92 110 168 248 250 300
16
4
13
1
9
8
8
14
4 4
1414
9
9
9
6 6
7
2
7
17
8
14
3
3
14
2
12 13
4
4
6
-3
1
0
0
0
8
8
5
CAGR (%)

Page 29Source: LME Price Index
Metals prices turned in late 2015
Jan 07 Jan 08 Jan 09 Jan 10 Jan 11 Jan 12 Jan 13 Jan 14 Jan 15 Jan 16 Jan 17

Page 30Source: Coalition IB Index – 1H17 - September 2017
Banking & Finance: Global investment bank revenues have stabilised
57.749.5 45.3 42.7
38.2 38.5
19.8
24.723.8 28.5
23.4 22.6
16.5 19.822.6 21.9
17.6 21.0
1H12 1H13 1H14 1H15 1H16 1H17
(USD
Bill
ion
)
Figure 1. Revenues by Business
FICC Equities IBD
94.0 94.191.6
0% (3%) 2% (15%)
19%
(3%)
1%
YoY Change1H17 vs. 1H1693.1
79.282.0
4%

Page 31
Book of business – reported (c60% of total revenue)
Oct Nov Dec Jan Feb Mar Apr May Jun Jul Aug Sep
Total book of business at reported GBP/US$ rate
2015 2016 2017 2018
X
18.1% 19.2%

Page 32
Book of business – underlying
Oct Nov Dec Jan Feb Mar Apr May Jun Jul Aug Sep
Total book of business at constant GBP/US$ rate adjusted for net M&A
2015 2016 2017 2018
X0.8%
0.4%
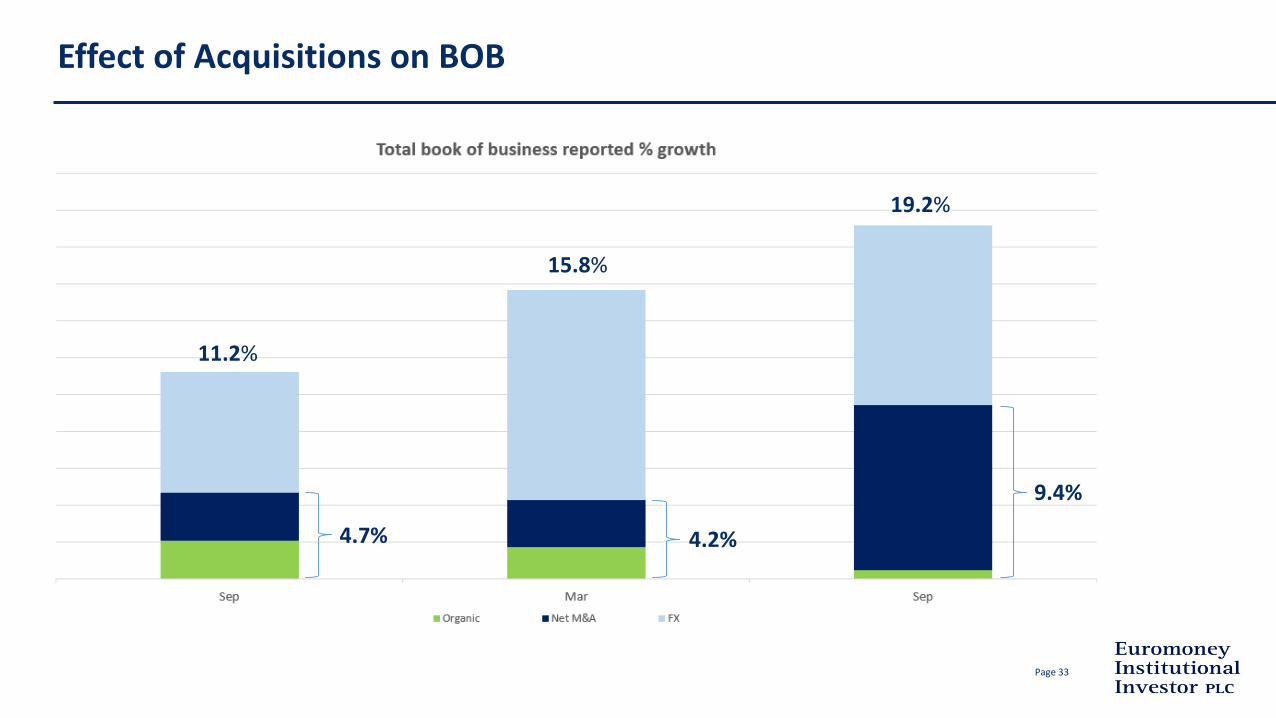
Page 33
Effect of Acquisitions on BOB
19.2%
9.4%
4.2%4.7%
15.8%
11.2%

Page 34
Book of business – Asset Management vs Pricing, Data & Market Intelligence
(8.0%)
(6.0%)
(4.0%)
(2.0%)
-
2.0%
4.0%
6.0%
8.0%
10.0%
Nov Dec Jan Feb Mar Apr May Jun Jul Aug Sep Oct
Book of business growth at constant GBP/US$ rate adjusted for net M&A (%)
Group Pricing, Data & Market Intelligence Asset Management
0.8%
8.5%
(5.9%)

Page 35
Advertising – underlying (c10% of total revenue)
Oct Nov Dec Jan Feb Mar Apr May Jun Jul Aug Sep
Advertising 52 week rolling sales at constant GBP/US$ rate
2015 2016 2017 2018
(6.1%)(5.3%)

Page 36
Events – underlying (c30% of total revenue)
Oct Nov Dec Jan Feb Mar Apr May Jun Jul Aug Sep
Events 52 week rolling sales at constant GBP/US$ rate
2015 2016 2017 2018
5.9%
6.4%

Page 37
Strategy on track. FY18 “year of growth”
Capital being rigorously allocated and quadrants managed. Continuing strong cash flow
DMGT sell down accelerates strategy. But there are standalone company costs
Invested FX benefit to accelerate strategy. FX no longer favourable
Asset management markets more challenged with MiFID II headwinds
Banking & finance and commodities markets improving
Summary: we’re where we expected to be – perhaps a bit ahead.
Outlook & summary

Page 38
Q&A

Andrew Rashbass and Colin Jones
22 November 2017
FY17 results presentation

Appendix:Supplementary information

Page 41
Adjusted Statutory
Revenue (£m) 428.4 386.9
Operating profit (£m) 107.1 43.4
Operating margin (%) 25.0% 11.2%
Profit before tax (£m) 106.5 40.7
EPS (p) 76.4p 37.9p
FY17 adjusted and statutory results

Page 421. See note 3 of the Preliminary Statement for fuller description.
Exceptional items1
£m FY17
Impairment (29.7)
Profit on disposal of businesses 2.9
Tax settlement 3.9
Restructuring and other (8.4)
Continuing operations (31.3)
Discontinued operations (2.4)
Total (33.7)

Page 431. See note 4 of the Preliminary Statement.
Net finance costs1
£m FY16 FY17
Interest on DMGT debt facility (1.3) (0.2)
Interest on cash deposit with DMGT 0.4 0.1
Interest on external borrowings - (3.7)
Interest on tax (0.4) (0.1)
Other 0.2 (0.1)
Adjusted net finance costs (1.1) (4.0)
Acquisition deferred consideration - 0.2
Acquisition commitments (0.6) 3.0
Total net finance costs (1.7) (0.8)

Page 441. See note 5 of the Preliminary Statement.
Tax1
£m FY16 FY17
Adjusted PBT 102.5 106.5
Total tax charge (12.9) (6.7)
Other tax adjustments (5.2) (13.1)
Adjusted tax charge (18.1) (19.8)
Adjusted effective tax rate 18% 19%

Page 45
Cash conversion
£m FY16 FY17
Adjusted operating profit 101.4 107.1
Cash generated from operations 103.8 118.2
Exceptional items 3.7 12.4
Timing differences (1.4) (4.6)
Underlying cash generated from operations 106.1 126.0
Cash conversion % 102% 110%
Underlying 12-month cash conversion % 105% 118%

Page 46
Deferred revenue
Sep-16 to Sep-17
£m Subscriptions Events Advertising
Opening balance1 93.5 22.5 2.8
Net M&A 11.2 1.1 (0.1)
FX (2.7) (0.4) -
Adjusted opening balance 102.0 23.2 2.7
Underlying movement 4.5 1.8 -
Closing balance2 106.5 25.0 2.7
Underlying growth % 4% 8% 0%
1. Excludes FY16 deferred revenue classified within total liabilities of businesses held for sale.2. Includes FY17 deferred revenue classified within total liabilities of business held for sale.

Page 47
Banking facilities
£m Purpose
Term-loan 120 Share buyback
Revolving credit facility 130 Acquisitions & working capital
250
Accordion 130 Additional acquisitions
380
Funding costs
Net Debt: EBITDA Margin above LIBOR
< 1.0 1.25%
<1.5 1.50%
<2.0 1.75%
<2.5 2.00%
>2.5 2.50%
Rate hedging
£32m of term-loan swapped to fixed rate of 0.76% p.a
$80m of term-loan swapped to fixed rate of 1.97% p.a

Page 48
FY17 revenue and profit matrix by segment/type (£m)
Notes
The absolute £ figures represent total segment revenue/profit, central
costs and Adjusted PBT.
The percentages represent underlying growth rates, including pro forma
prior year comparatives for acquisitions and excluding disposals and
significant event timing differences at constant exchange rates.
Total segment revenue of £434.5m excludes FX on forward contracts
(-£10.8m) and sold/closed businesses (+£4.7m).
For a reconciliation of segment profit to Adjusted PBT, refer to slide 49.
Key
Dark green – growth more than 2%
Light green – growth of 0% to 2%
Amber – decline of 0% to -1%
Pink – decline of -1% to -5%
Dark red – decline more than -5%
The white cells have not been colour-coded due to their size
Asset management 138.2 (2%) 14.2 (9%) 16.1 4% 3.2 4% 0.1 108% 171.8 (2%) 64.3 3%
Pricing, data & market intelligence 113.9 5% 16.7 (13%) 14.4 8% 19.0 4% 1.5 (9%) 165.5 3% 51.3 (6%)
Banking & finance 8.9 (5%) 9.8 8% 28.1 (7%) 21.7 (10%) 1.4 (11%) 69.8 (6%) 13.8 7%
Commodity events 6.0 (4%) 20.8 (7%) 0.6 (2%) 27.4 (8%) 6.9 (10%)
Total segment revenue/profit 261.0 1% 40.7 (8%) 64.6 (1%) 64.7 (5%) 3.5 (8%) 434.5 (1%) 136.3 (1%)
Central costs (incl FX/interest/associates & JVs) (29.8) -Adjusted PBT 106.5 (5%)
Total
Profit (£m)Revenue (£m)
Delegates Other Total
N/A N/A
Subscriptions/
Content Advertising Sponsorship

Page 49
FY17 segment profit to adjusted PBT reconciliation (£m)
Segment profit1 136.3
Non-segment items:
- Central costs (18.0)
- FX on hedging/balance sheet items (11.2)
- Associates/JVs 3.4
- Interest (4.0)
(29.8)
Adjusted PBT1 106.5
1. Includes the results of continuing and discontinued operations.

Page 501. After sold/closed businesses, FX and other revenues.2. Percentage of total FY17 revenue excluding closed businesses, FX and other revenues.
Total revenue change
Y-o-Y % change FY16 FY17 FY17
H1 H2 H1 H2 Full Year % revenue2
Subscriptions and content
5% 11% 19% 17% 18% 61%
Advertising (3%) (6%) 3% 6% 5% 9%
Sponsorship (3%) 10% 13% 10% 11% 15%
Delegates (5%) (5%) (2%) 4% 1% 15%
Total1 (2%) 2% 5% 8% 6%

Page 511. At constant exchange rates, including pro forma prior year comparatives for acquisitions and excluding disposals and significant event timing differences.2. Includes other revenues but excludes revenues from sold/closed businesses. FX hedging losses restated in prior year at current year level.
Underlying1 revenue change by quarter
Y-o-Y % change FY16 FY17
Q1 Q2 Q3 Q4 Q1 Q2 Q3 Q4
Subscriptions and content
2% 0% 1% 2% 1% 2% 1% 1%
Advertising (2%) (16%) (14%) (12%) (16%) (10%) (5%) (3%)
Sponsorship (7%) (8%) 9% (7%) (14%) 5% 5% (6%)
Delegates (18%) (17%) (9%) (12%) (14%) 1% 2% (11%)
Total2 (6%) (6%) (1%) (4%) (5%) 1% 2% (2%)

Page 52
Total revenue by segment
£m FY16 FY17 Total Underlying1
Asset management 156.7 171.8 10% (2%)
Pricing, data & market intelligence
132.1 165.5 25% 3%
Banking & finance 68.1 69.8 3% (6%)
Commodity events 29.3 27.4 (6%) (8%)
Sold/closed businesses 22.1 4.7 - -
FX hedges (5.2) (10.8) - -
403.1 428.4 6% (1%)
1. At constant exchange rates, including pro forma prior year comparatives for acquisitions and excluding disposals and significant event timing differences.
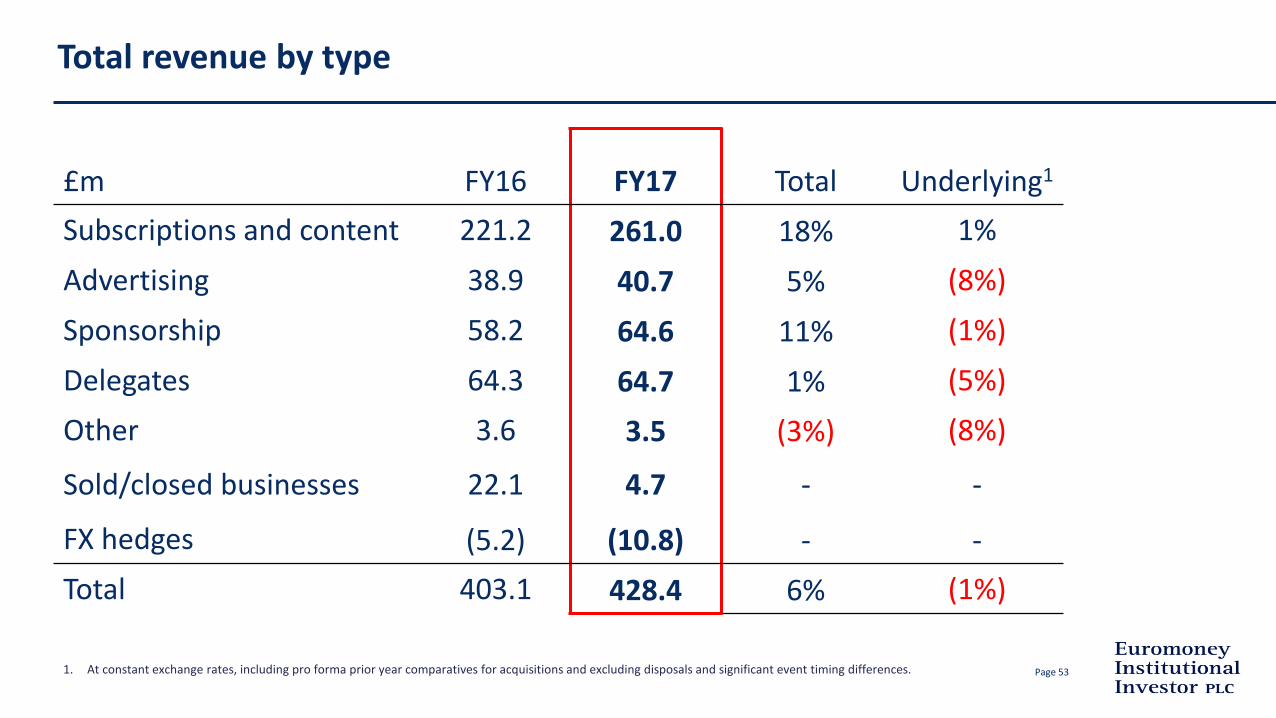
Page 531. At constant exchange rates, including pro forma prior year comparatives for acquisitions and excluding disposals and significant event timing differences.
Total revenue by type
£m FY16 FY17 Total Underlying1
Subscriptions and content 221.2 261.0 18% 1%
Advertising 38.9 40.7 5% (8%)
Sponsorship 58.2 64.6 11% (1%)
Delegates 64.3 64.7 1% (5%)
Other 3.6 3.5 (3%) (8%)
Sold/closed businesses 22.1 4.7 - -
FX hedges (5.2) (10.8) - -
Total 403.1 428.4 6% (1%)

Page 54
Adjusted operating profit by segment
£m FY16 FY17 Adjusted Underlying1
Asset management 55.2 64.3 16% 3%
Pricing, data & market Intelligence
43.8 51.3 17% (6%)
Banking & finance 10.5 13.8 31% 7%
Commodity events 8.0 6.9 (14%) (10%)
Sold/closed businesses 1.7 - - -
Central costs (14.5) (18.0) - -
FX hedges/balance sheet (3.3) (11.2) - -
Total 101.4 107.1 6% (4%)
1. At constant exchange rates, including pro forma prior year comparatives for acquisitions and excluding disposals and significant event timing differences.

Page 55
Discontinued operations1 (£m)
£m FY16 FY17 Change
Revenue 37.1 41.5 12%
Adjusted operating profit 10.1 11.9 18%
Adjusted operating margin 27.2% 28.6% 1.4%
Adjusted PBT 10.4 11.9 15%
Statutory PBT 10.5 9.2 (12%)
1. Discontinued operations represents the Global Markets Intelligence Division (CEIC and EMIS). All figures disclosed above are reconciled in the appendix to the Preliminary Statement.

Page 56
Sale of Adhesion and WBWE in October for €13.6m (£12.0m)
1. Adhesion’s FY16 results include its biennial wine exhibition, Vinisud. Its FY17 results include the first edition of an annualised Vinisud.
Disposal of Adhesion and WBWE
£m FY16 FY17
Revenue
- Adhesion1 7.9 6.5
- WBWE (held as a subsidiary) - 1.4
Operating profit
- Adhesion1 1.8 (0.1)
- WBWE (held as an associate) 0.1 -
- WBWE (held as a subsidiary) - 0.4
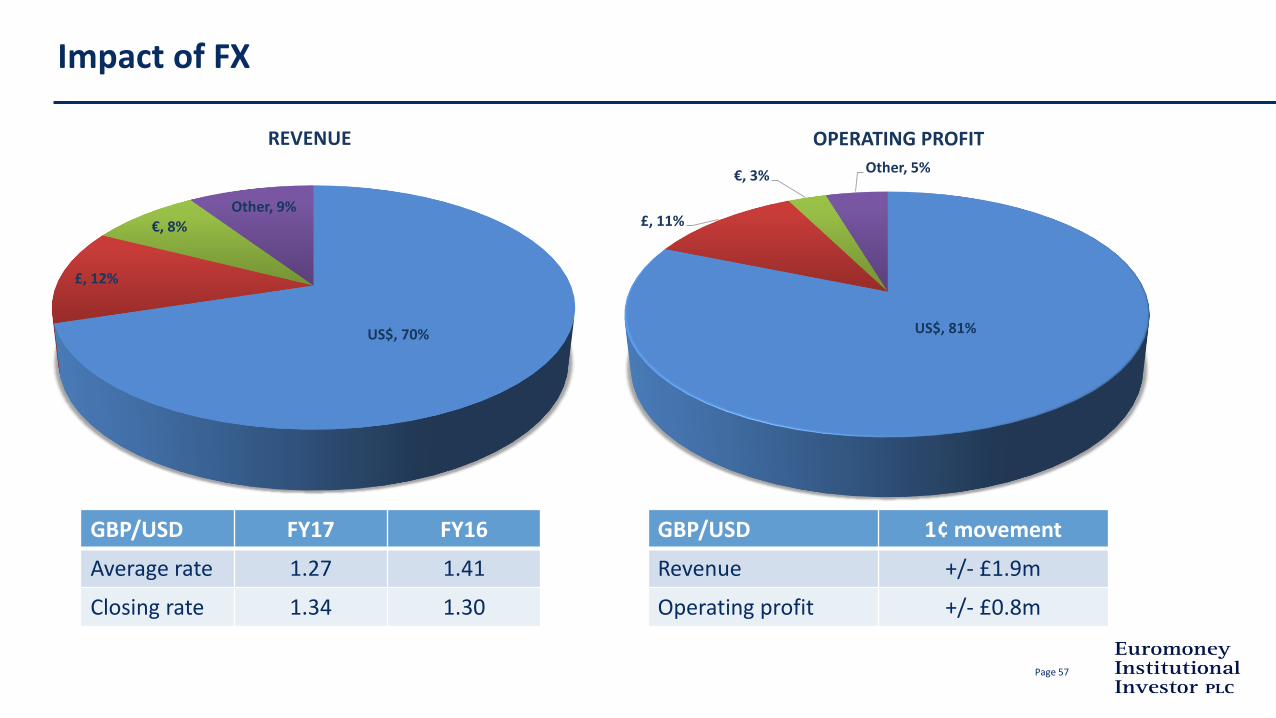
Page 57
Impact of FX
GBP/USD FY17 FY16
Average rate 1.27 1.41
Closing rate 1.34 1.30
GBP/USD 1¢ movement
Revenue +/- £1.9m
Operating profit +/- £0.8m
US$, 70%
£, 12%
€, 8%Other, 9%
REVENUE
US$, 81%
£, 11%
€, 3%Other, 5%
OPERATING PROFIT


![INDEX []INDEX ... NGLE Daniel ..... 236 Mar ... ha . ..... ..... 236 ABBOTT Andrew J ..... 23 B. Jane Shilling ..... 106](https://static.fdocuments.net/doc/165x107/5e3eb58e620b191f723b9a34/index-index-ngle-daniel-236-mar-ha-236-abbott-andrew.jpg)
