Analyst Meeting 2008 -...
72
Analyst Meeting 2008 September 18, 2008
Transcript of Analyst Meeting 2008 -...

Analyst Meeting 2008September 18, 2008

Opening Remarks and Management Introductions
Al WhiteVice President, Investor Relations and
Treasurer

3 The Cooper Companies Analyst Meeting 2008
Agenda7:30 am Registration
8:30 am Welcome and Introductions Al White
8:35 am Strategic Overview Bob Weiss
9:15 am CVI Business Unit John Weber
CVI Commercial Update Jeff McLean
CVI Manufacturing Fernando Torre
CVI R&D Arthur Back
10:15 am Break
10:30 am CSI Business Unit Nick Pichotta
11:00 am Finance Review and Outlook Gene Midlock
11:15 am Summary Bob Weiss
Question and Answer Session
4 The Cooper Companies Analyst Meeting 2008
Forward Looking StatementsThis presentation contains forward-looking statements as defined by the Private Securities Litigation Reform Act of 1995, including projections of Cooper’s results. To identify these statements look for words like "targets,” "expects," “seeks," "intends," "plans," "estimates" or "anticipates" and similar words or phrases. Forward-looking statements necessarily depend on assumptions, data or methods that may be incorrect or imprecise and are subject to risks and uncertainties. Actual results could differ materially from the projections made in this presentation. Additional information concerning factors that could cause material differences can be found in Cooper’s periodic filings with the Securities and Exchange Commission. They are available publicly and on request from Cooper’s investor relations department.
Strategic Overview
Bob WeissPresident & Chief Executive Officer

6 The Cooper Companies Analyst Meeting 2008
One Year in the Saddle
Year 1 Accomplishments:Concluded integration and restructuring
Addressed new product capacity constraints
Launched key new product -- Avaira
Strengthened management team
Completed capital expansion program

7 The Cooper Companies Analyst Meeting 2008
3-5 Year PlanDriving Revenue− Recession resistant− Market share gains
• Geographic expansion• Rollout of best in class products in each modality
• PC 1 Day – Single use 34% WW market• Avaira – 2 week 39% WW market• Biofinity – Monthly and beyond 27% of WW market
• Materials• Third generation SiH 30% WW market• ProClear family – Best-in-class conventional hydrogels 70% WW market
• New Product Rollouts• Biofinity (SiH) monthly toric Calendar 1Q09• PC 1 Day – Japan Fiscal 1H09• Avaira (SiH) 2 week toric Calendar 4Q09• SiH Multifocal Fiscal 2010
− 3-5 Year Target – 1.5x Market

8 The Cooper Companies Analyst Meeting 2008
3-5 Year PlanDriving Gross Margin− Leverage manufacturing platform
• Conversion onto GenII completed
• Leverage Biofinity production lines into Specialty Lenses and Avaira
• Improve GenII footprint and efficiency
− Leverage material platform• SiH materials to Specialty Lenses
• Significant cost reductions in using PC material
• Significant cost reductions in using SiH materials
− 3-5 Year Target – Low 60s
9 The Cooper Companies Analyst Meeting 2008
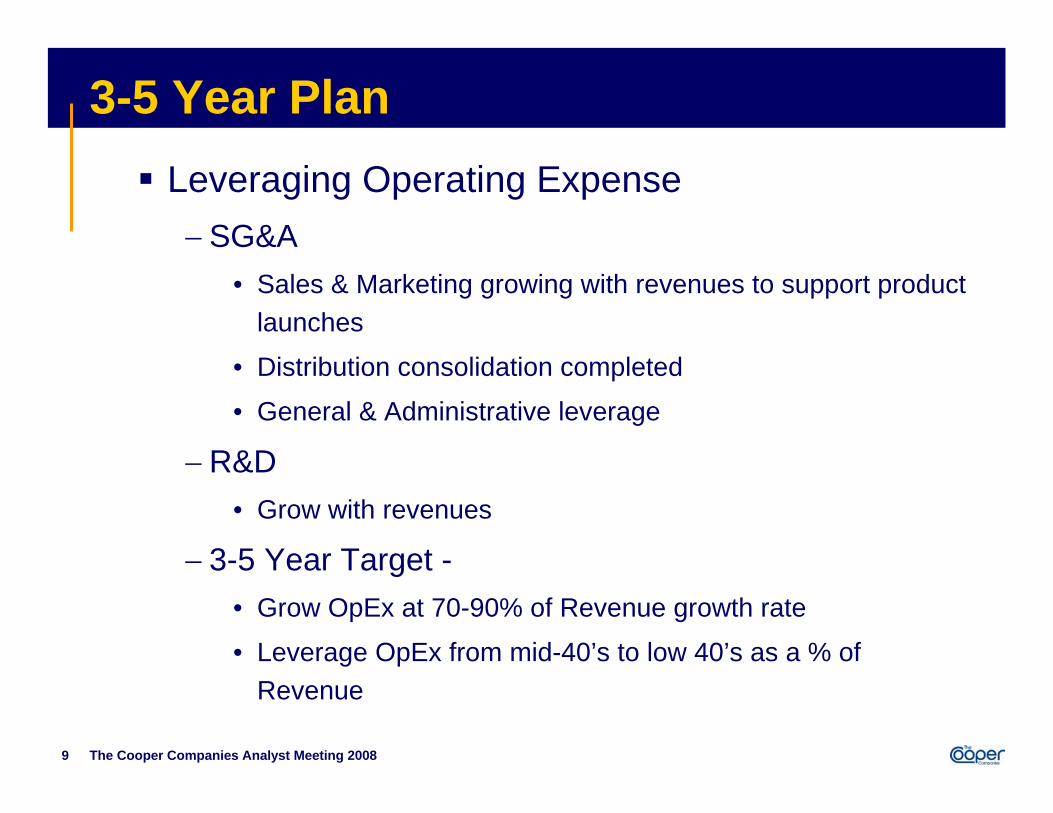
3-5 Year PlanLeveraging Operating Expense− SG&A
• Sales & Marketing growing with revenues to support product launches
• Distribution consolidation completed
• General & Administrative leverage
−R&D• Grow with revenues
− 3-5 Year Target -• Grow OpEx at 70-90% of Revenue growth rate
• Leverage OpEx from mid-40’s to low 40’s as a % of Revenue
10 The Cooper Companies Analyst Meeting 2008
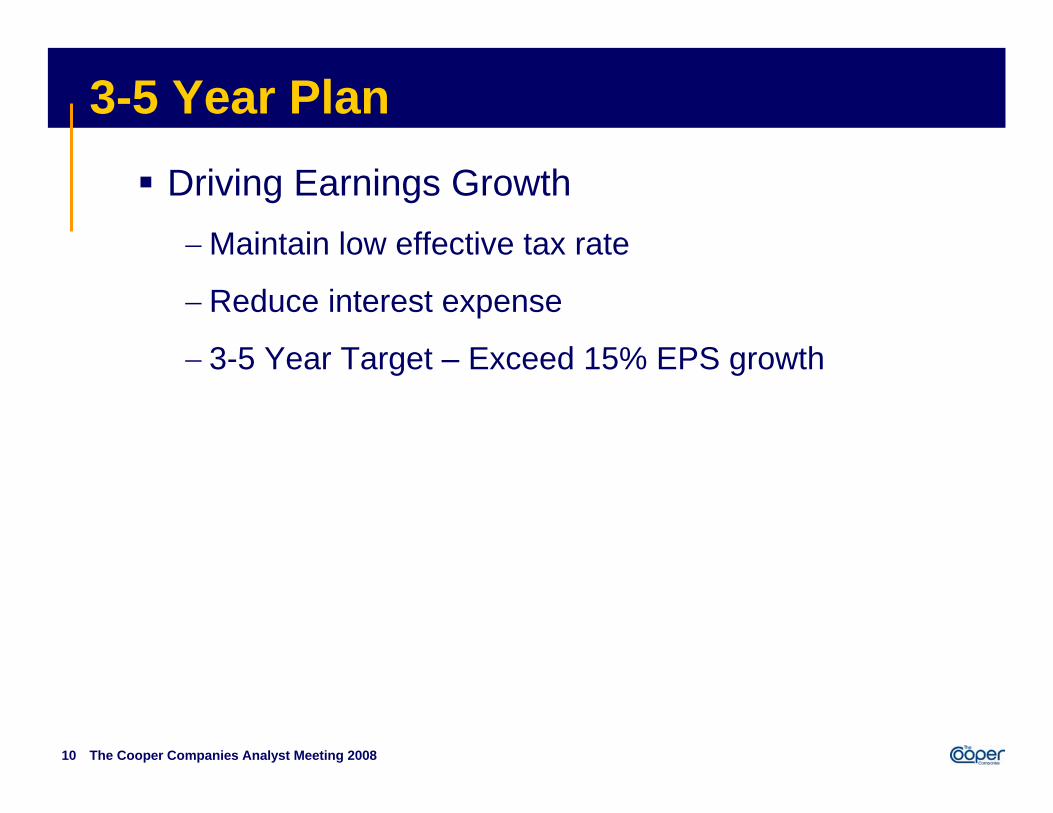
3-5 Year PlanDriving Earnings Growth−Maintain low effective tax rate
−Reduce interest expense
− 3-5 Year Target – Exceed 15% EPS growth

11 The Cooper Companies Analyst Meeting 2008
3-5 Year PlanGenerating Solid Cash Flow− Lower CapEx requirements
• FY2009: $125-140M
• FY2010 onward: sub-$125M
− Improve inventory months-on-hand (MOH)• Distribution consolidation completed
• New systems (Logility)
− 3-5 Year Target -• $1B+ of Operating Cash Flow ’09-12
• Over 50% will be Free Cash Flow

12 The Cooper Companies Analyst Meeting 2008
3-5 Year PlanDeleveraging Balance Sheet− Lower MoH
− Lower CapEx
− Strong FCF
− 3-5 Year Target –• Debt/Cap under 30%
• FD/EBITDA under 3x

13 The Cooper Companies Analyst Meeting 2008
5 Key Takeaways for Today
Depth of management team
Well positioned to leverage growth
Market leading product lines
Integration completed
Driving efficiencies

CooperVisionBusiness Unit
John WeberPresident

15 The Cooper Companies Analyst Meeting 2008
CooperVision – Overview
Global manufacturer of contact lenses Approx. 7,000 employees in more than 54 countries
YTD 2008 growth has outpaced the market
Since 2005:
Reduced and strategically focused distribution centers
Expanded product portfolio and introduced two world class silicone spheres
Leveraged manufacturing technology around the world
Increased R&D investment to 1.7x 2005 levels
Product mix: 42% Specialty, 39% Spherical, 19% Single Use
Geographic mix: 44% Americas, 39% Europe, 17% Asia-Pacific

16 The Cooper Companies Analyst Meeting 2008
CooperVision’s Global Segments
EMEAEMEA
Asia-PacAsia-Pac
16
AmericasAmericas% of CVI Sales: 44%Market Position: #2Led By: J. McLeanStrategic Focus: Share Growth
% of CVI Sales: 17%Market Position: #4Led By: Dr. J.C. AragonStrategic Focus: Investment
% of CVI Sales: 39%Market Position: #2Led By: A. SedgwickStrategic Focus: Expansion Growth

17 The Cooper Companies Analyst Meeting 2008
CooperVision’s GoalsCooperVision targets growing revenue 1.5X the contact lens market and leveraging our expenses to drive bottom line profitability and free cash flow
Targeted Strategy Components:Best in class products competing in all major modalities and materials
Flexible market strategy offering a clear alternative to the market leader
Expanding presence in the Asia Pacific region
Operational excellence supporting flexibility in an efficient manner
18 The Cooper Companies Analyst Meeting 2008
The CooperVision Management TeamCooperVision has assembled a strong management team, capable of delivering improved bottom line financial results through revenue growth and leveraging expenses
The team has the skills, experience, and expertise in all key functions required to successfully lead and manage a contact lens company
Three key members of the executive management team presenting today
19 The Cooper Companies Analyst Meeting 2008
Jeff McLeanExecutive Vice-President, Commercial Strategy
Promoted in April 2008 from CooperVision’s President of the Americas
Responsibilities include:Developing and coordinating commercial strategy− Company positioning
− Product positioning
Interacting with R&D to determine and monitor product development strategy
Background includes several successful management sales & marketing positions over 27 years within the contact lens industry

20 The Cooper Companies Analyst Meeting 2008
Fernando TorreVice-President, Manufacturing
Responsibilities includeImproving and maintaining high standard of lens quality
Manufacturing scale up of silicone hydrogel capacity
Continuously driving down COGS
Background includes progressive engineering and manufacturing management positions
Over seven years experience leading high-volume contact lens manufacturing plants at CooperVision
Began career as an R&D engineer and project manager, which allowed leveraging our technology transfer process – positive results demonstrated in Avaira and silicone hydrogel toric capacity expansions
21 The Cooper Companies Analyst Meeting 2008
Dr. Arthur BackVice-President, Research and Development
Responsibilities includeDeveloping CVI’s family of silicone hydrogel products, including currently transferring silicone hydrogel torics to manufacturing plants
Continuously improving product performance
Developing and executing product pipeline
Background includes a successful career in contact lens optics and materials research
PhD with 24 years experience of contact lens research and development
Successfully managed the Avaira technology transfer to our manufacturing plants

CooperVisionCommercial Update
Jeff McLeanExecutive Vice President,
Commercial Strategy

23 The Cooper Companies Analyst Meeting 2008
To Enhance Each and Every Contact Lens Experience
Our Vision
24 The Cooper Companies Analyst Meeting 2008
We market contact lenses that enhance the experience of eye
care providers and wearers alike through the application of technology, expertise and service. We listen to our
customers and respond to their diverse needs.
Our Mission

Market Trends
26 The Cooper Companies Analyst Meeting 2008
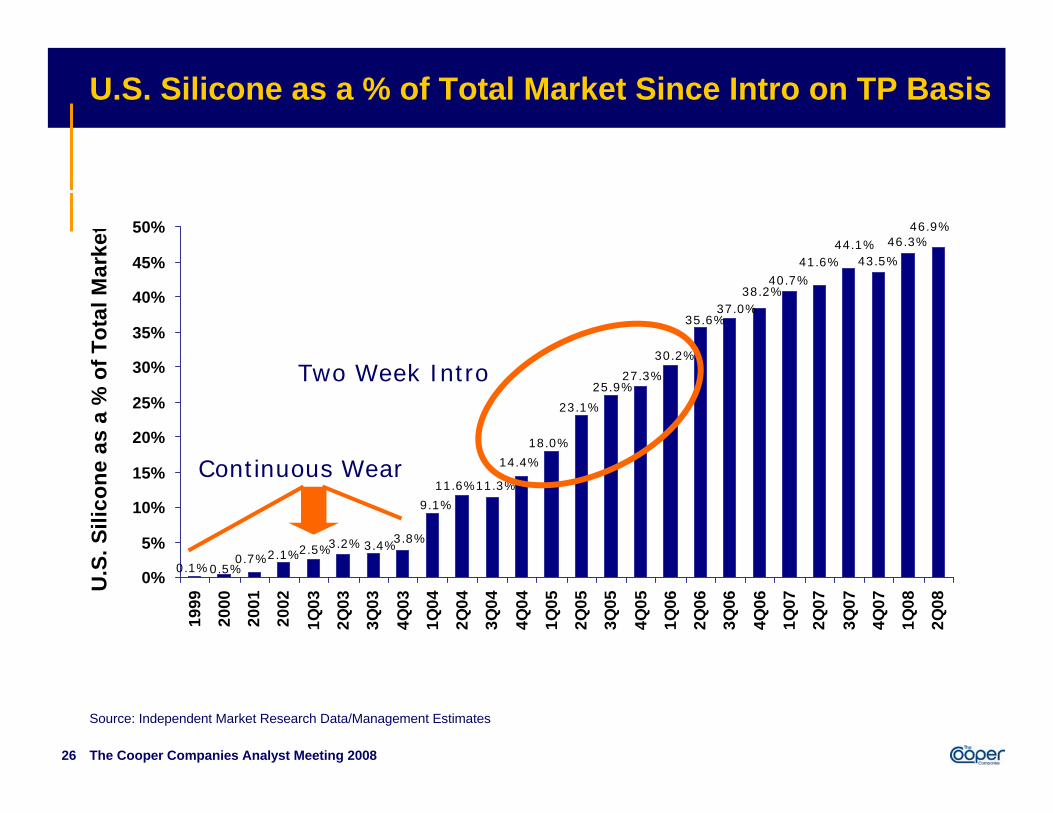
U.S. Silicone as a % of Total Market Since Intro on TP Basis
43.5%
46.3%
0.1%2.1%0.7%
0.5%
40.7%38.2%
37.0%35.6%
30.2%
27.3%25.9%
23.1%
18.0%
14.4%
11.3%11.6%
9.1%
3.8%3.4%3.2%2.5%
44.1%41.6%
46.9%
0%
5%
10%
15%
20%
25%
30%
35%
40%
45%
50%
1999
2000
2001
2002
1Q03
2Q03
3Q03
4Q03
1Q04
2Q04
3Q04
4Q04
1Q05
2Q05
3Q05
4Q05
1Q06
2Q06
3Q06
4Q06
1Q07
2Q07
3Q07
4Q07
1Q08
2Q08
U.S
. Sili
cone
as
a %
of T
otal
Mar
ket
Continuous Wear
Two Week Intro
Source: Independent Market Research Data/Management Estimates
27 The Cooper Companies Analyst Meeting 2008
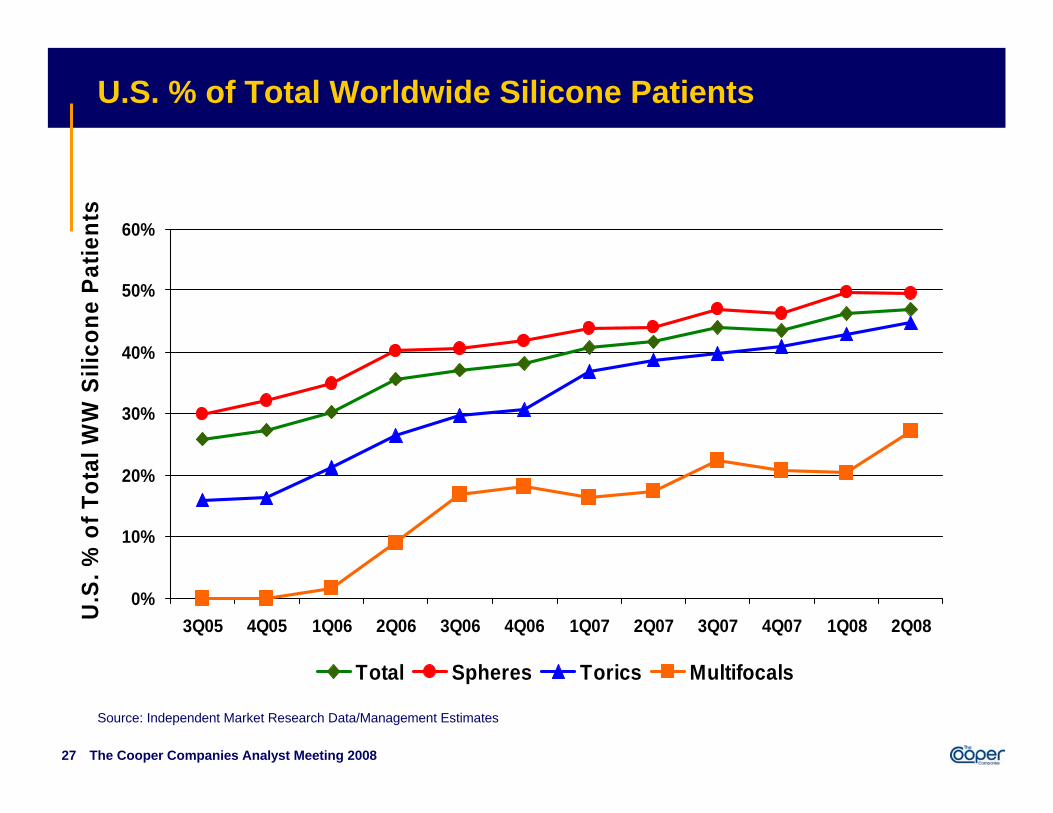
U.S. % of Total Worldwide Silicone Patients
0%
10%
20%
30%
40%
50%
60%
3Q05 4Q05 1Q06 2Q06 3Q06 4Q06 1Q07 2Q07 3Q07 4Q07 1Q08 2Q08U.S
. % o
f Tot
al W
W S
ilico
ne P
atie
nts
Total Spheres Torics Multifocals
Source: Independent Market Research Data/Management Estimates
28 The Cooper Companies Analyst Meeting 2008
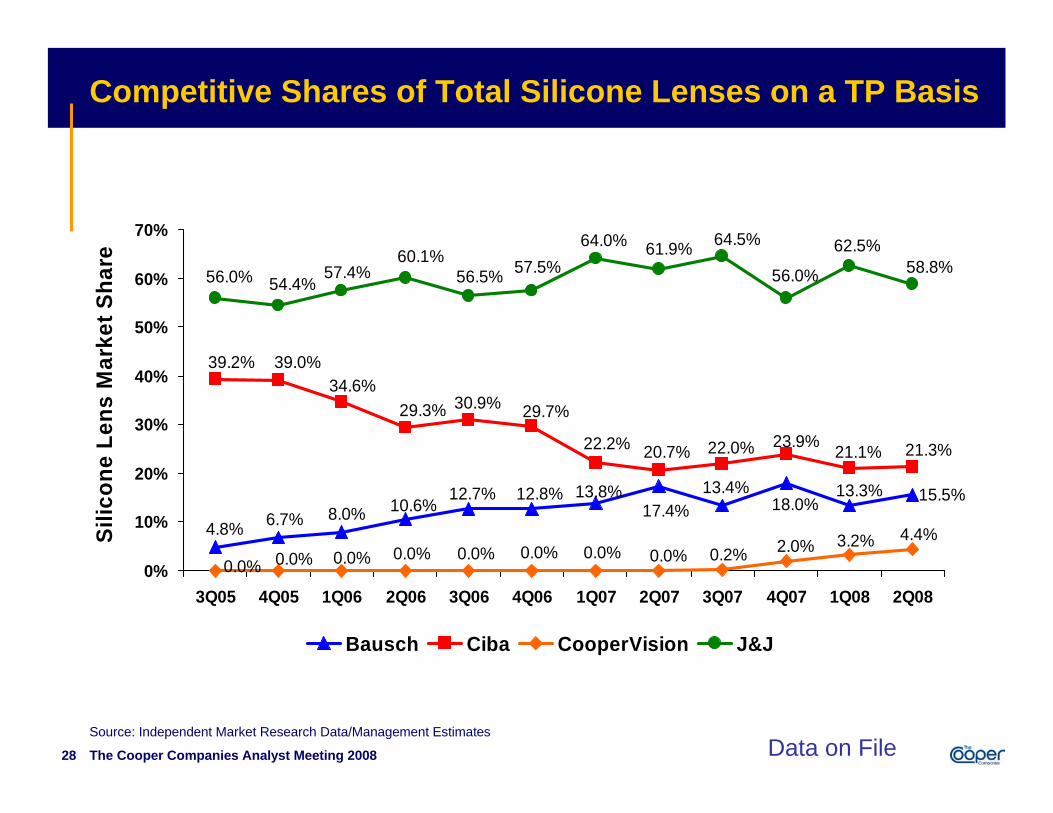
Competitive Shares of Total Silicone Lenses on a TP Basis
15.5%13.3%18.0%
13.4%17.4%
13.8%12.8%10.6%8.0%6.7%4.8%
12.7%
21.3%21.1%23.9%22.0%20.7%22.2%
29.7%30.9%29.3%34.6%
39.0%39.2%
0.0% 0.0% 0.0% 0.0% 0.0% 0.0% 0.0% 0.0%4.4%3.2%2.0%0.2%
58.8%62.5%
56.0%
64.5%61.9%64.0%57.5%56.5%
60.1%57.4%
54.4%56.0%
0%
10%
20%
30%
40%
50%
60%
70%
3Q05 4Q05 1Q06 2Q06 3Q06 4Q06 1Q07 2Q07 3Q07 4Q07 1Q08 2Q08
Silic
one
Lens
Mar
ket S
hare
Bausch Ciba CooperVision J&J
Data on FileSource: Independent Market Research Data/Management Estimates
29 The Cooper Companies Analyst Meeting 2008
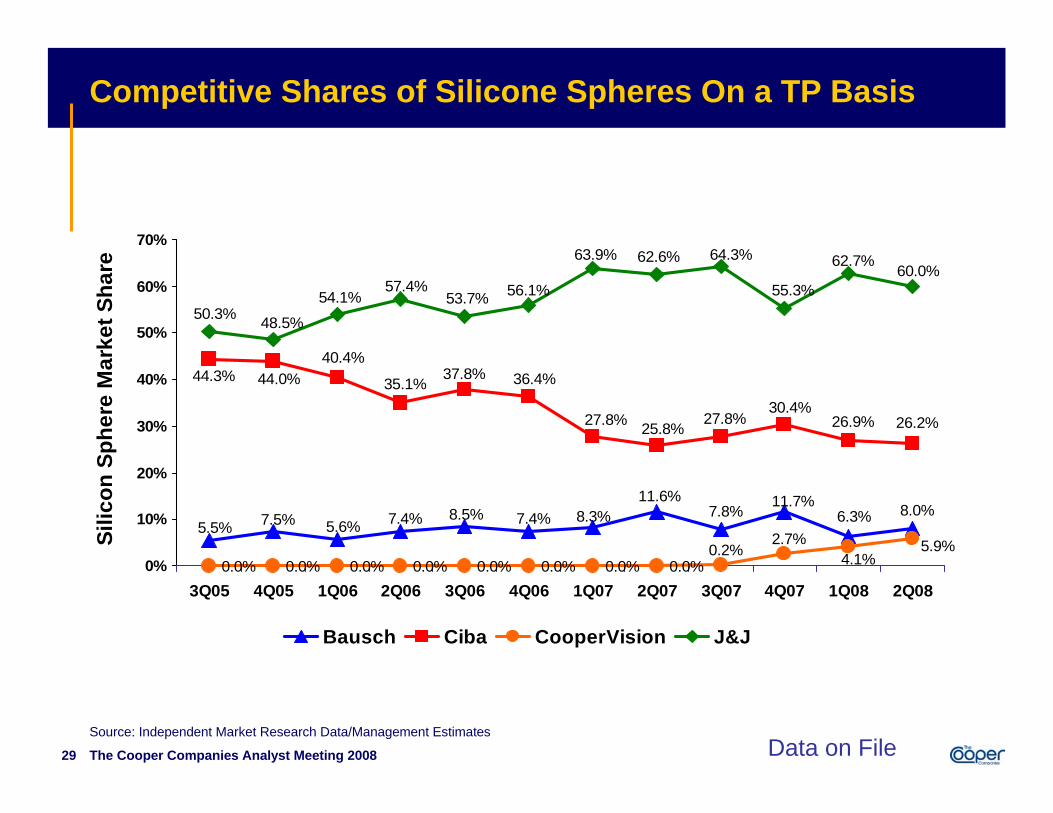
Competitive Shares of Silicone Spheres On a TP Basis
0.0% 0.0% 0.0% 0.0% 0.0% 0.0% 0.0% 0.0%
8.0%11.7%7.8%
11.6%8.3%7.4%7.4%5.6%7.5%5.5%
8.5% 6.3%
26.2%26.9%30.4%
27.8%25.8%27.8%
36.4%37.8%35.1%
40.4%44.0%44.3%
2.7%0.2% 5.9%
4.1%
60.0%62.7%
55.3%
64.3%62.6%63.9%
56.1%53.7%57.4%
54.1%
48.5%50.3%
0%
10%
20%
30%
40%
50%
60%
70%
3Q05 4Q05 1Q06 2Q06 3Q06 4Q06 1Q07 2Q07 3Q07 4Q07 1Q08 2Q08
Silic
on S
pher
e M
arke
t Sha
re
Bausch Ciba CooperVision J&J
Data on FileSource: Independent Market Research Data/Management Estimates

30 The Cooper Companies Analyst Meeting 2008
Soft Patient Visits - Last 8 Period Trend
7,0827,239
6,5826,826
7,029
8,340
6,748
7,060
4,461
4,186
5,359
4,3494,114 3,918
4,464 4,425
3,000
4,000
5,000
6,000
7,000
8,000
9,000
Q32006
Q42006
Q12007
Q22007
Q32007
Q42007
Q12008
Q22008
Num
ber o
f Sof
t Len
s Pa
tient
Vis
its
Total NF/RF
Source: Independent Market Research Data/Management Estimates

31 The Cooper Companies Analyst Meeting 2008
Total Patient Share Total Soft Lenses – HPR
42.5 42.3
1.6 1.5
13.8 13.8
20.019.222.9 22.4
0
10
20
30
40
50
Current Quarter Last 12 Months
Bausch & Lomb CIBA CooperVision Vistakon Other
Source: Health Product Research (HPR)

32 The Cooper Companies Analyst Meeting 2008
NF/RF Patient Share Total Soft Lenses – HPR
41.6 41.7
1.6 1.4
15.014.1
18.8 19.522.423.9
0
10
20
30
40
50
Current Quarter Last 12 Months
Bausch & Lomb CIBA CooperVision Vistakon Other
Source: Health Product Research (HPR)

33 The Cooper Companies Analyst Meeting 2008
Easy To Do Business With
0
2
4
6
8
10
Ciba 8.14 8.34 8.09 8.22 8.20
Johnson & Johnson 7.82 7.88 7.97 8.32 8.25
CooperVision 8.04 8.26 8.32 8.40 8.32
Bausch & Lomb 7.89 7.97 7.59 7.57 7.59
mean importance 8.83 8.83 8.83 8.83 8.83
Wave 1
Wave 2
Wave 3
Wave 4
Wave 5
2 2 1 1 1
[Wave 5 N = 323]
Source: Independent Market Research Data/Management Estimates
34 The Cooper Companies Analyst Meeting 2008
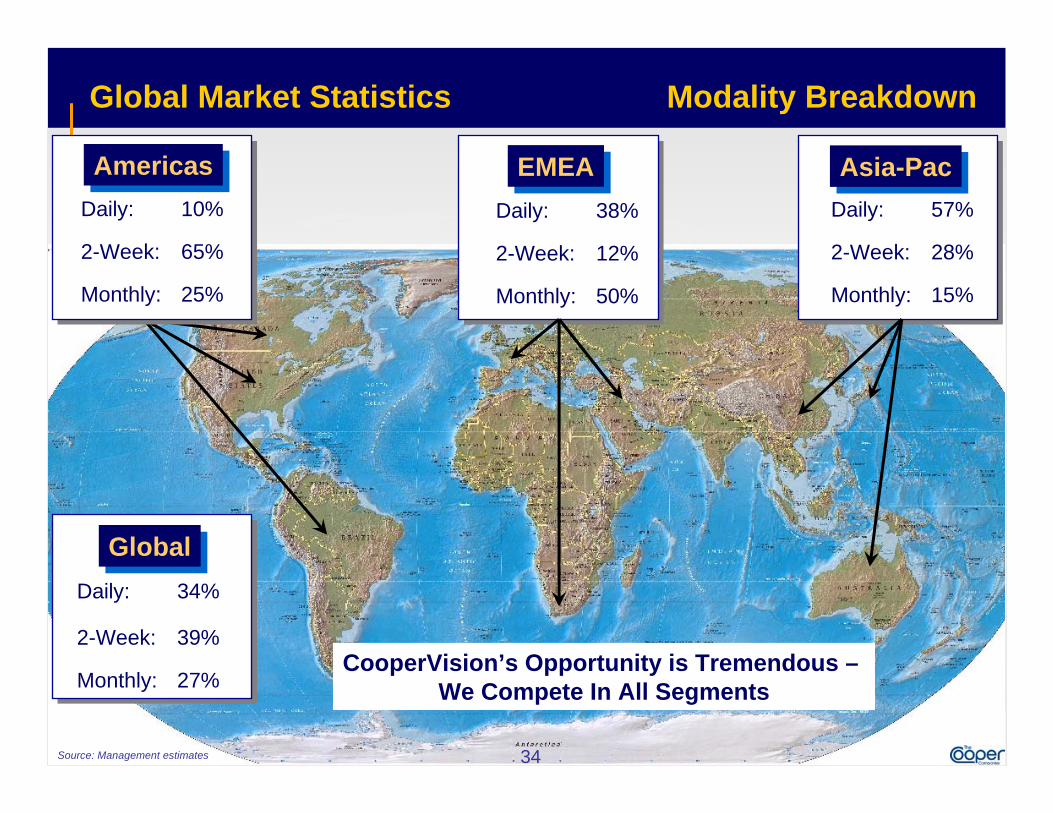
Global Market Statistics
EMEAEMEA Asia-PacAsia-Pac
15%Monthly:
28%2-Week:
57%Daily:
50%Monthly:
12%2-Week:
38%Daily:
GlobalGlobal
27%Monthly:
39%2-Week:
34%Daily:
Source: Management estimates 34
Modality Breakdown
AmericasAmericas
25%Monthly:
65%2-Week:
10%Daily:
CooperVision’s Opportunity is Tremendous –We Compete In All Segments
35 The Cooper Companies Analyst Meeting 2008
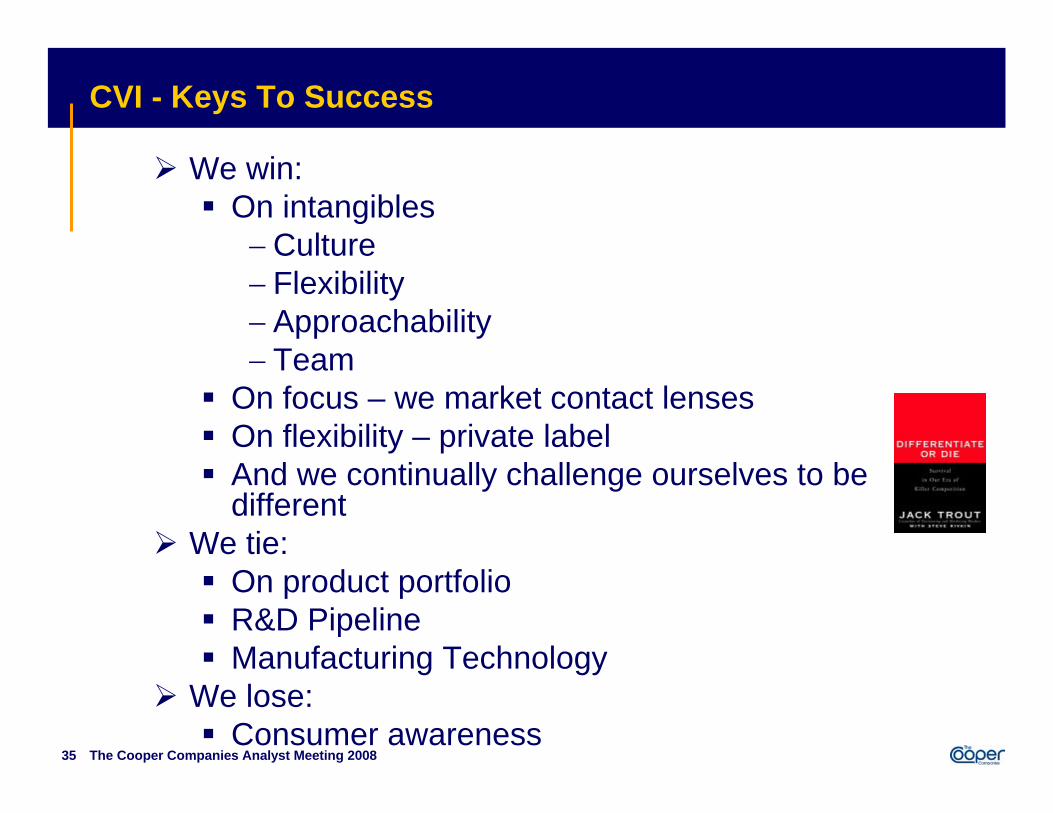
CVI - Keys To Success
We win:On intangibles−Culture− Flexibility− Approachability− Team
On focus – we market contact lensesOn flexibility – private labelAnd we continually challenge ourselves to be different
We tie:On product portfolioR&D PipelineManufacturing Technology
We lose:Consumer awareness
CooperVisionManufacturing
Fernando TorreVice President, Manufacturing

37 The Cooper Companies Analyst Meeting 2008
Global Manufacturing Organization
Southampton,UK
Rochester, NY
Norfolk, Virginia
Juana Diaz,Puerto Rico
Adelaide,Australia
Madrid,Spain

38 The Cooper Companies Analyst Meeting 2008
Global Manufacturing Organization
Hamble Frequency
Spheres & ToricsProclear SpheresBiofinity SpheresBiofinity ToricsAvaira Spheres
Warrior Close One Day SpheresProclear One Day
Juana DíazOne Day SpheresOne Day Torics
Proclear One DayBiomedics Spheres &
ToricsAvaira Spheres
NorfolkProclear Spheres,
Torics & MultifocalsBiomedics XCBiomedics EP
Molding Manufacturing Operations
Scottsville PlantLathing
Lathing Manufacturing Operations
UK Lathing BU
Adelaide
Madrid
39 The Cooper Companies Analyst Meeting 2008
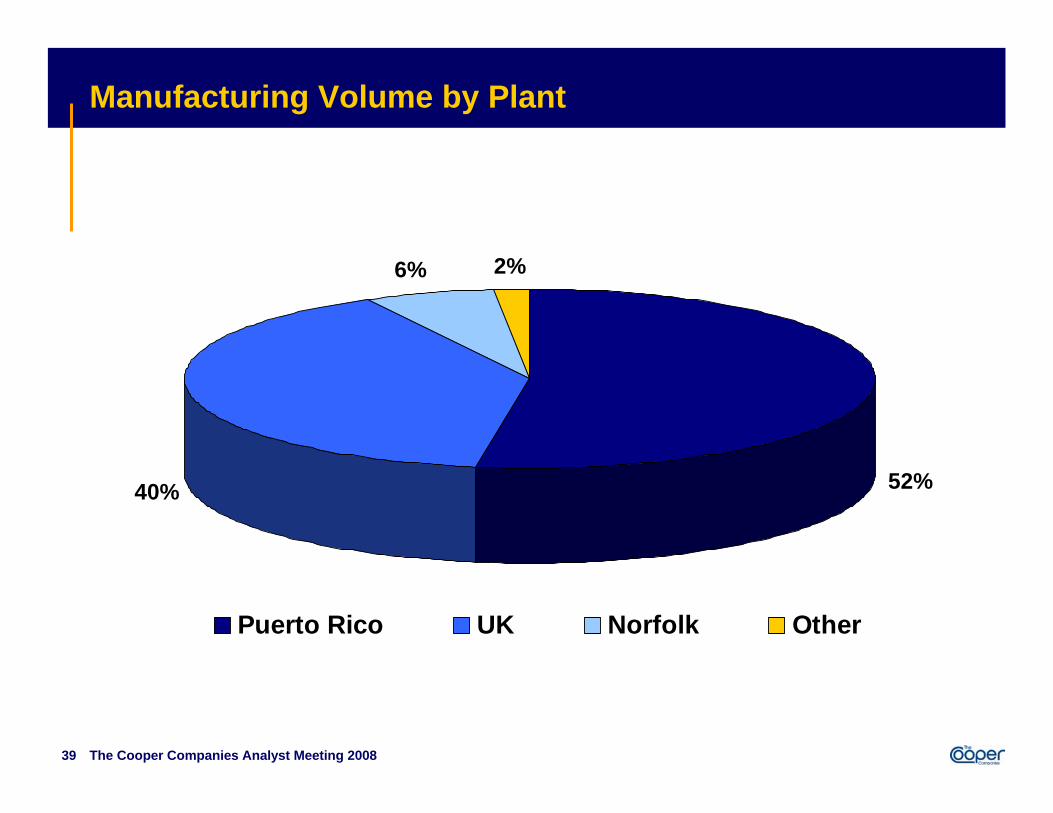
Manufacturing Volume by Plant
52%40%
6% 2%
Puerto Rico UK Norfolk Other

40 The Cooper Companies Analyst Meeting 2008
Manufacturing Capacity Trend
728.3
900.9
1001.7
1308
1149.5
0
200
400
600
800
1000
1200
1400
2007 Actual 2008 Actual/Fcst 2009 Budget 2009E Capacity 2010E Capacity
Volu
me
(Mill
ion
Lens
es)

41 The Cooper Companies Analyst Meeting 2008
Manufacturing Productivity Trend
0
1000
2000
3000
4000
5000
6000
7000
2007 2008E 2009E0
200
400
600
800
1000
1200
Volume (Million Lenses) Total Headcount
Volu
me
(Mill
ion
Lens
es)

42 The Cooper Companies Analyst Meeting 2008
Manufacturing Ramp up for Avaira vs. BiofinityVo
lum
e
Year 1 Year 2 Year 3
Avaira Spheres Biofinity Spheres
Note: Volume estimates are based on actual and forecasted production.

CooperVisionResearch & Development
Arthur BackBOptom PhD FAAO
Vice President, R&D

44 The Cooper Companies Analyst Meeting 2008
CooperVisionR&D Investment:
Expanded Capability
Pre-2005 2008Sites Southampton, UK Southampton, UK
Pleasanton,CA
Square Footage 10,000 44,000
Employees 30 115
PhD Level Scientists 2 30
Prototype Manufacturing Lines 1 5
Material Competency 80% external 20% external
Annual Investment (CVI) sub-$10M Approx. $32.5M

45 The Cooper Companies Analyst Meeting 2008
Proclear 1 Day
Biomedics EP in Omafilcon A
Evolution 1 Day (Japan)
Single use Ocufilcon D toric
Biofinity monthly silicone hydrogel
Avaira 2 week silicone hydrogel
R&D Investment: Products Developed Since 2005CooperVision
46 The Cooper Companies Analyst Meeting 2008
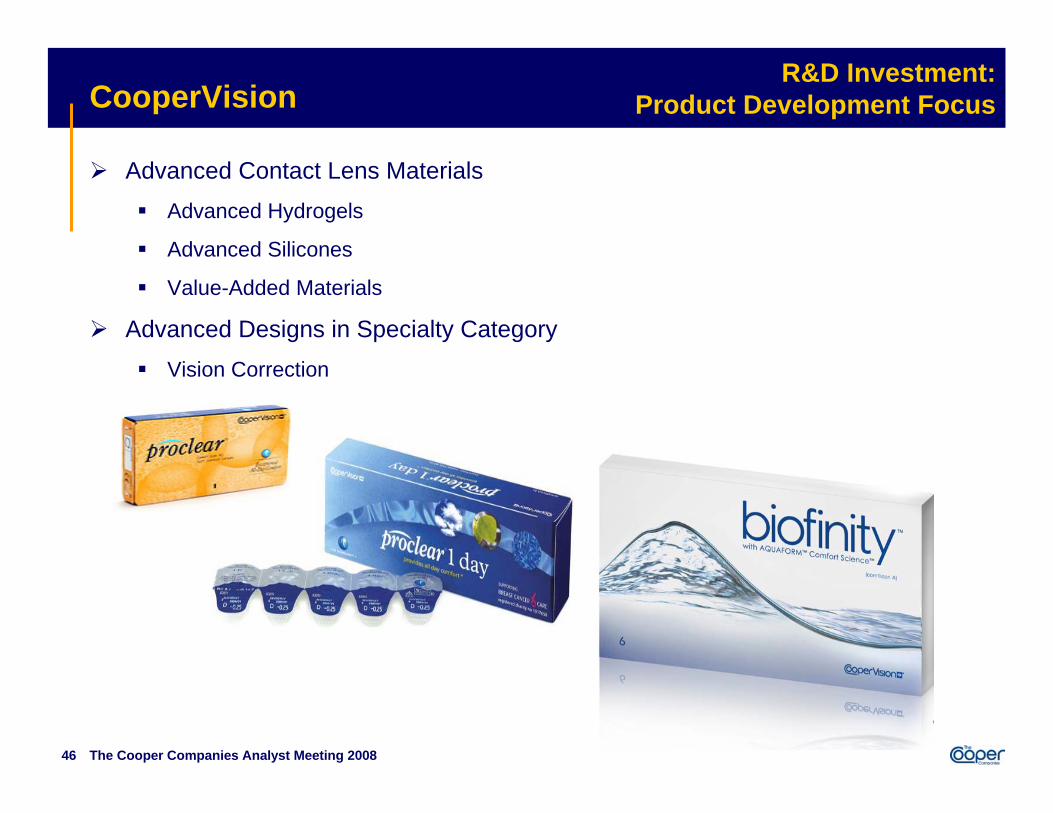
R&D Investment: Product Development Focus
Advanced Contact Lens MaterialsAdvanced Hydrogels
Advanced Silicones
Value-Added Materials
Advanced Designs in Specialty CategoryVision Correction
CooperVision
47 The Cooper Companies Analyst Meeting 2008
R&D Investment: The Future
Multiple new products anticipated through to 2010Key specialty products into silicone materials
New materials
Other design/chemistry
Continue focus on developing internal R&D function
CooperVision
Nick PichottaCEO
CooperSurgicalBusiness UnitUpdate

49 The Cooper Companies Analyst Meeting 2008
Fertility Clinic
6%
Office63%
Hospital31%
CooperSurgical - OverviewCooperSurgical (CSI) develops, manufactures, and markets medical devices, diagnostic products and surgical instruments for gynecologists and obstetricians
Leader of the fragmented US medical device segment of women’s healthcare
− Holds an estimated 9% share of $1.6M market*
Leader of in-office OB/GYN products
Headquartered in Trumbull, CT
Management teamNicholas J. Pichotta, CEO
Paul L. Remmell, President & COO
Robert D. Auerbach, M.D., FACOG, SVP & Chief Medical Officer
* Source: Equity research
Total Employees 555G&A 43
Sales, Marketing 127
Cust Service, Tech Support 29
Engineering 14
Manufacturing 322
Distribution 20
Revenues by Point of Sale
50 The Cooper Companies Analyst Meeting 2008
17.2 25.4 28.7 30.146.4
58.571.4
82.0101.5 108.7
124.8
151.1165 - 170
0
50
100
150
200
1996 1997 1998 1999 2000 2001 2002 2003 2004 2005 2006 2007 2008E
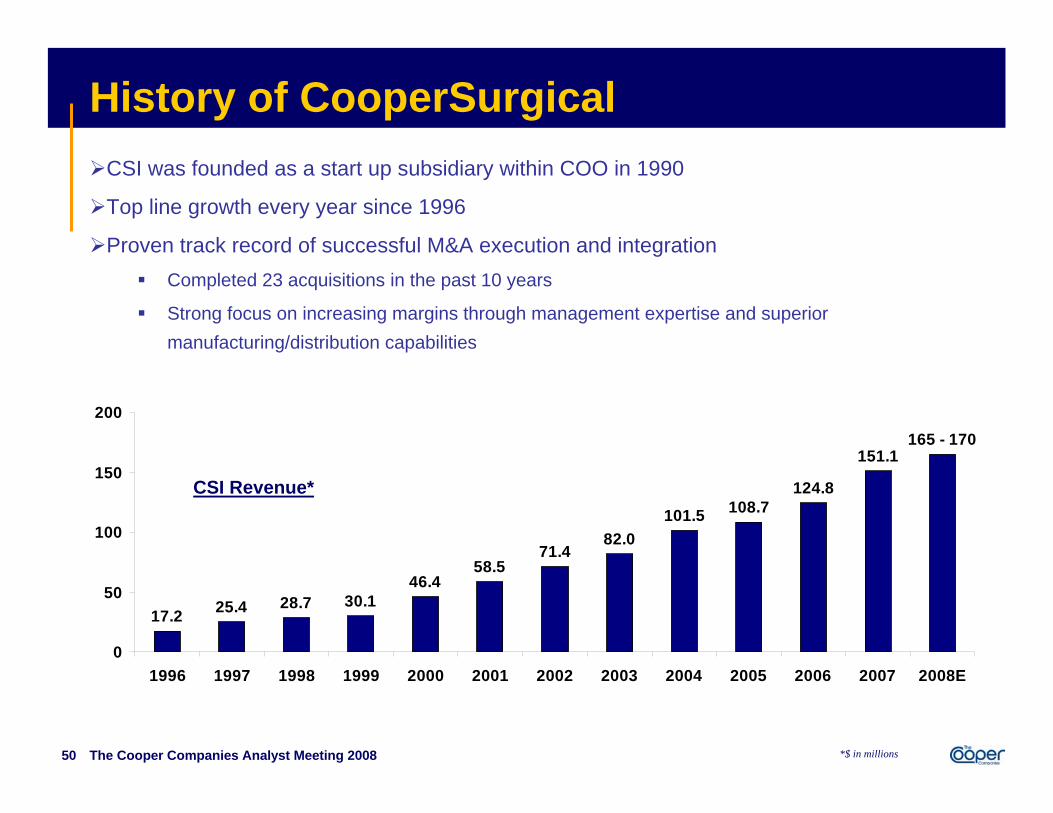
History of CooperSurgicalCSI was founded as a start up subsidiary within COO in 1990
Top line growth every year since 1996
Proven track record of successful M&A execution and integrationCompleted 23 acquisitions in the past 10 years
Strong focus on increasing margins through management expertise and superior manufacturing/distribution capabilities
CSI Revenue*
*$ in millions
51 The Cooper Companies Analyst Meeting 2008
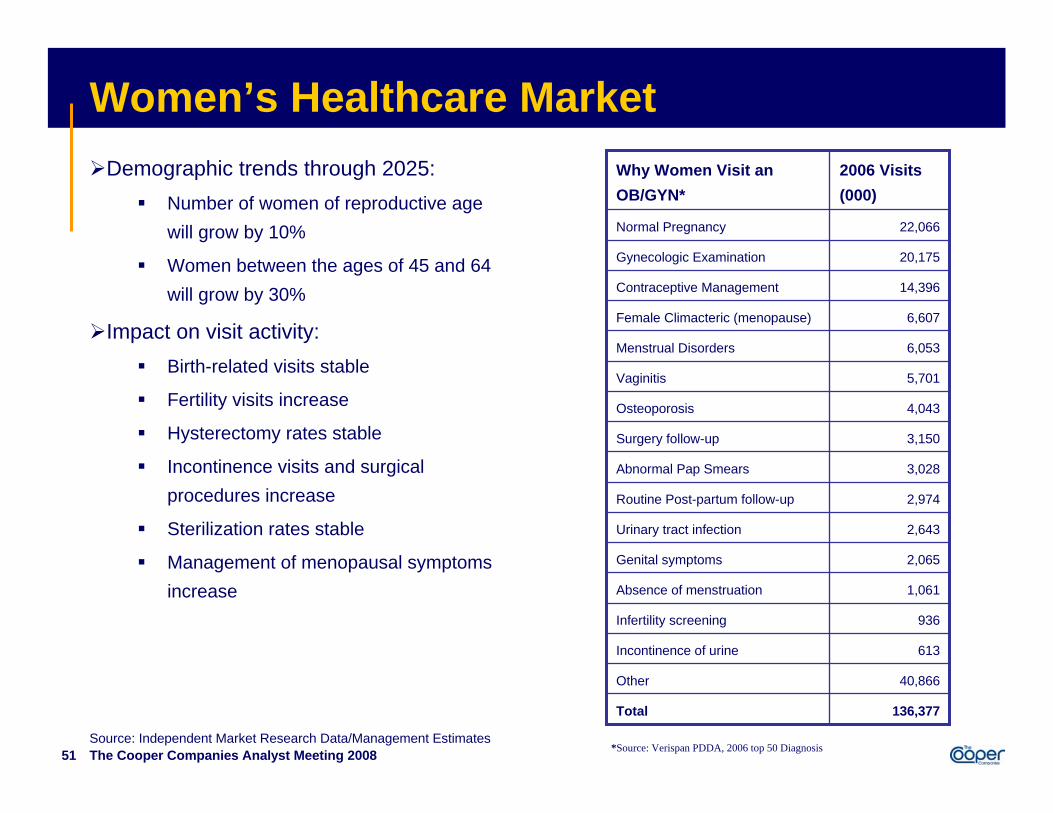
Women’s Healthcare MarketDemographic trends through 2025:
Number of women of reproductive age will grow by 10%
Women between the ages of 45 and 64 will grow by 30%
Impact on visit activity:Birth-related visits stable
Fertility visits increase
Hysterectomy rates stable
Incontinence visits and surgical procedures increase
Sterilization rates stable
Management of menopausal symptoms increase
136,377Total
40,866Other
613Incontinence of urine
936Infertility screening
1,061Absence of menstruation
2,065Genital symptoms
2,643Urinary tract infection
2,974Routine Post-partum follow-up
3,028Abnormal Pap Smears
3,150Surgery follow-up
4,043Osteoporosis
5,701Vaginitis
6,053Menstrual Disorders
6,607Female Climacteric (menopause)
14,396Contraceptive Management
20,175Gynecologic Examination
22,066Normal Pregnancy
2006 Visits (000)
Why Women Visit an OB/GYN*
*Source: Verispan PDDA, 2006 top 50 DiagnosisSource: Independent Market Research Data/Management Estimates

52 The Cooper Companies Analyst Meeting 2008
Procedure Type # of Procedures (000)
Childbirth 4,100 Pelvic floor surgery 192 Operations on female genital organs 4,058
Oophorectomy and salpingo-oophrectomy 511
Bilateral destruction or occlusion of fallopian tube 662
Hysteroscopy 237 Excision or destruction of lesion or tissue of uterus and supporting structures 179 Abdominal hysterectomy and hysterectomy not otherwise specified 407
Vaginal hysterectomy 184
Diagnostic dilation and curettage 475
Key U.S. Hospital Procedures
Source: Independent Market Research Data/Management Estimates

53 The Cooper Companies Analyst Meeting 2008
Women’s Healthcare Points of Care
OB/GYN Offices 13,665
Hospitals 4,290
Fertility Clinics 394
Group Practice Profiles:
32,33313,665Total
5,7382,488Multi-specialty
26,59511,177Single Specialty
Number of OB/GYNS
Number of Practices
Type of Group
Provider breakdown
Source: Independent Market Research Data/Management Estimates

54 The Cooper Companies Analyst Meeting 2008
CSI Sales Force
55 The Cooper Companies Analyst Meeting 2008
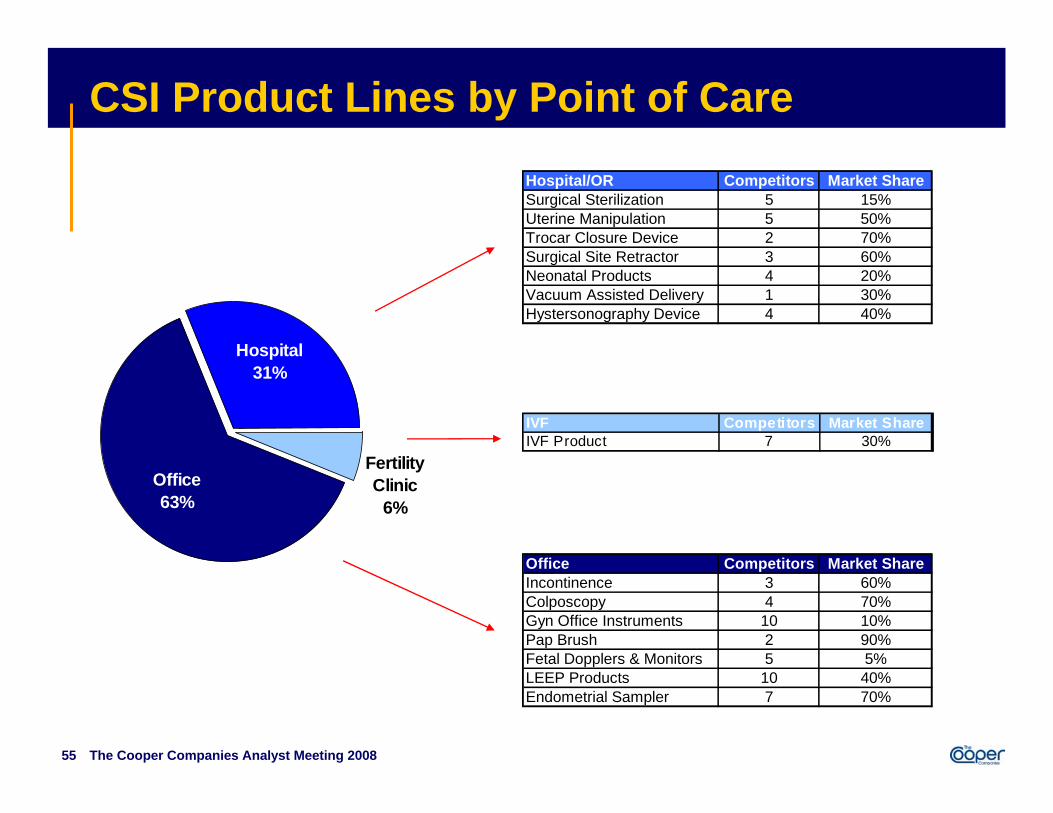
Hospital31%
Office63%
Fertility Clinic
6%
CSI Product Lines by Point of Care
IVF Competitors Market ShareIVF Product 7 30%
Office Competitors Market ShareIncontinence 3 60%Colposcopy 4 70%Gyn Office Instruments 10 10%Pap Brush 2 90%Fetal Dopplers & Monitors 5 5%LEEP Products 10 40%Endometrial Sampler 7 70%
Hospital/OR Competitors Market ShareSurgical Sterilization 5 15%Uterine Manipulation 5 50%Trocar Closure Device 2 70%Surgical Site Retractor 3 60%Neonatal Products 4 20%Vacuum Assisted Delivery 1 30%Hystersonography Device 4 40%
56 The Cooper Companies Analyst Meeting 2008
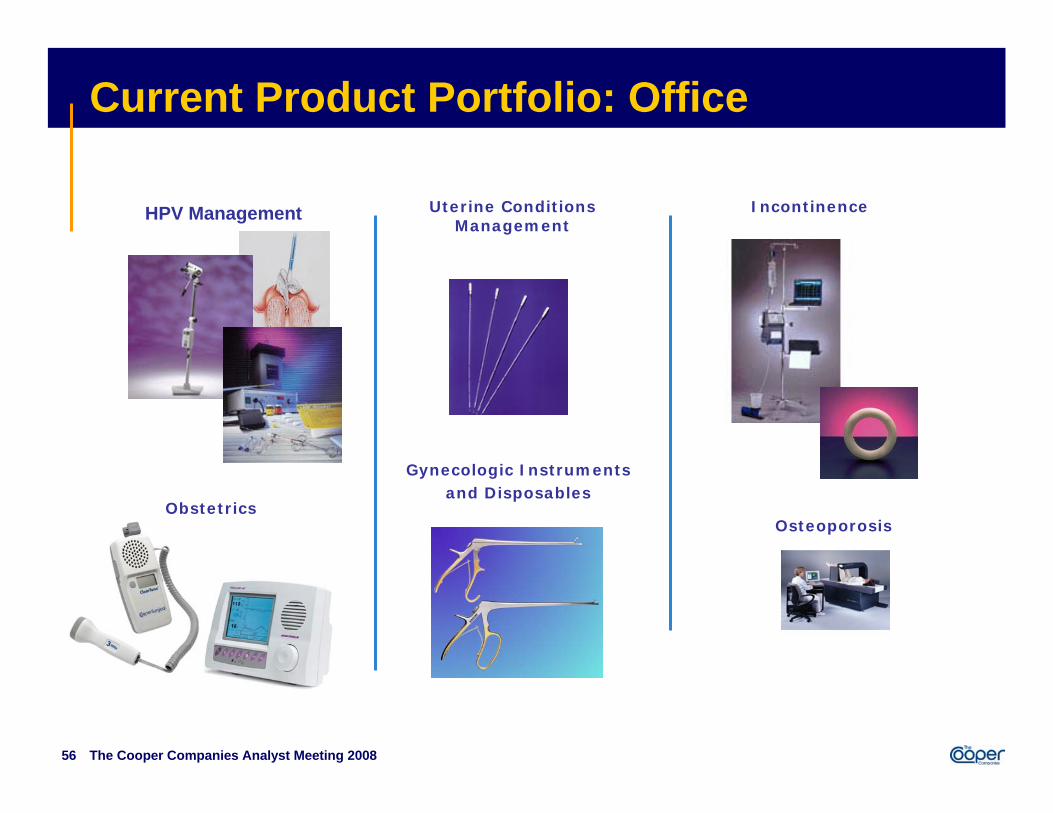
Current Product Portfolio: Office
HPV Management Uterine Conditions Management
Osteoporosis
Gynecologic Instruments and Disposables
Incontinence
Obstetrics

57 The Cooper Companies Analyst Meeting 2008
Current Product Portfolio: Hospital
Uterine Conditions Management
Surgical Site Management
Obstetrics
Port Site Closure
Sterilization
Green Surgical Trocars
58 The Cooper Companies Analyst Meeting 2008
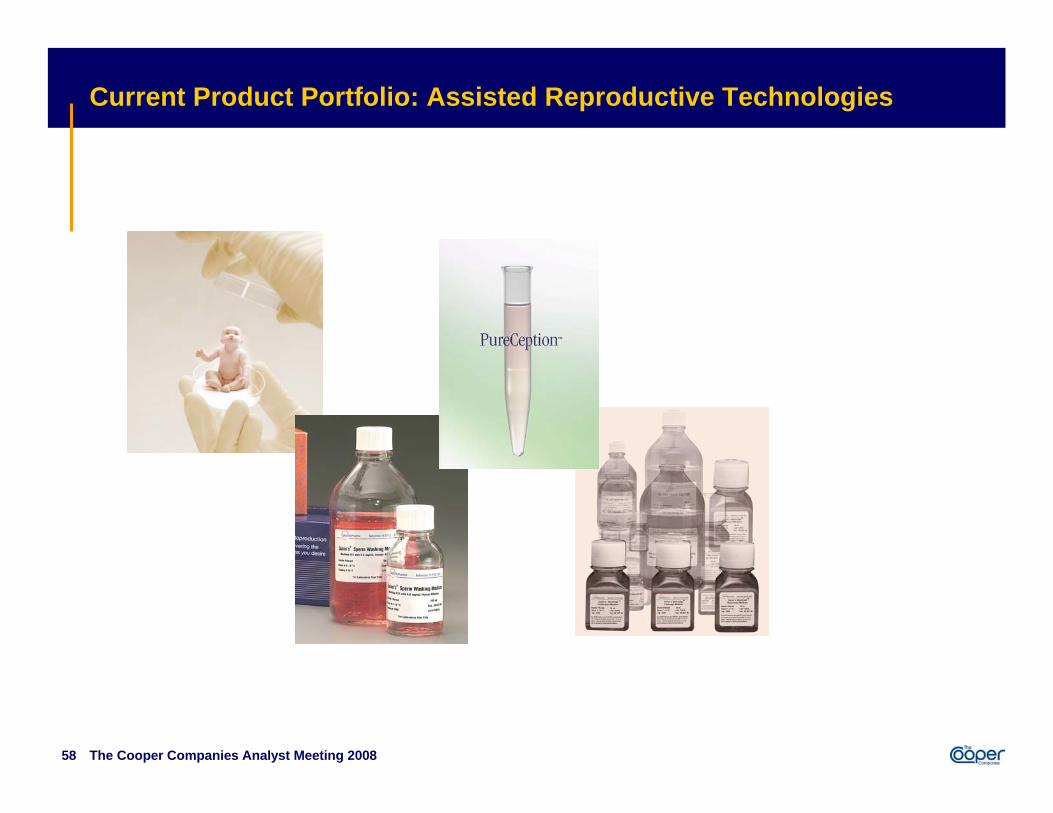
Current Product Portfolio: Assisted Reproductive Technologies

59 The Cooper Companies Analyst Meeting 2008
CSI PerformanceRevenue details:
15% CAGR from 2005 through 2008E
15% of revenues are international
19 core product categories with over 600 products
Margin Details Consistent GPM and OM improvements over the past several years
OtherMinimal CapEx requirements
Significant Free Cash Flow generation
CSI Revenue & Operating Margin*
109125
155 165-170
18%19% 19%
20%
020406080
100120140160180
2005 2006 2007 2008E16%
17%
18%
19%
20%
21%
22%
*$ in millions
CSI Quarterly Revenue & Operating Margin*
42.739.9
20%
18%
0.05.0
10.015.020.025.030.035.040.045.0
Q3 2007 Q3 200816%
17%
18%
19%
20%
21%
22%

60 The Cooper Companies Analyst Meeting 2008
Strategies for Growth
Focus on women’s health
Continue to consolidate the market
Advance technologies
Grow hospital and fertility segments
Capitalize on demographic trends
61 The Cooper Companies Analyst Meeting 2008
Key Takeaways
Well established/recognized manufacturer of OB/GYN devices
Dedicated to provide the highest quality of products and service to the OB/GYN
Highly skilled direct sales force to cover the US office and outpatient hospital markets
Strong sales presence in GYN OR, L&D and Fertility Clinics enhances the relationship with the OB/GYN
Strong pipeline including a new Trocar product

Financial Review & Outlook
Gene MidlockChief Financial Officer

63 The Cooper Companies Analyst Meeting 2008
Six Months – Areas of FocusSix Months Areas of Focus:
Free Cash Flow
Debt Reduction
Enhanced Forecasting
Reduction and Leveraging of G&A

64 The Cooper Companies Analyst Meeting 2008
Q4 and 2009 GuidanceFiscal 4Q08 Guidance*
EPS: $0.58-$0.64
Revenue: $285M - $295M
Gross Margin: Approx. 60%
FCF: Positive
ETR: 26.5%
Share Count: 45.3M
No Callouts anticipated
Fiscal 2009*CapEx: $125-$140M
ETR: 15-17%
No Callouts anticipated
Additional Guidance on 4Q Earnings Call (Dec. 9)
* As issued on 9/4/08.
65 The Cooper Companies Analyst Meeting 2008
Effective Tax RateAnnual rate
Fairly consistent – 2008 15 – 17%
Geographic mix
Risk reserve – favorable audit history is decreasing reserves
Quarterly rate volatility – Risk reserve for uncertaintiesGAAP requirement as “discrete items”− release of reserves in quarter in which statute of limitations expires, or probability
of assessment changes
− Setting up of interest reserves on a quarterly basis
Operations in 25 countries, with differing tax laws
FY 2008 “discrete items” by quarterQ1, $500k. Q2, $200k. Q3, ($4.9M) Q4, $100k
FY 2009 anticipated “discrete items” by quarterQ1 and Q4, relatively large; Q2 none; Q3, moderate

66 The Cooper Companies Analyst Meeting 2008
Gross Margin Drivers
Product mixdriven by single-use, SiH and specialty lenses
Leveraging manufacturing capabilityGen II conversion
FXOff-shore sales and manufacturing
Hedging
Off-shore inventory

67 The Cooper Companies Analyst Meeting 2008
Foreign ExchangeCurrency Hedges impacted Gross Margins 290 bps in Q3 (non-GAAP)
All contacts designated against COGS
Non-GAAP (USD)Scenarios Comparison
Q3 (No Hedges) Q3 (COGS)Revenue 285,884,000 285,884,000 COGS 113,520,753 121,899,000 Total Q3 172,363,247 163,985,000 Gross Margin 60.3% 57.4% GM Difference - 2.9%
68 The Cooper Companies Analyst Meeting 2008
Operating Margin Drivers
Sales & MarketingSupport new product launches
DistributionDistribution center consolidation
R&DGrowing with sales
G&A

In Summary

70 The Cooper Companies Analyst Meeting 2008
5 Key TakeawaysDepth of management team
Well positioned to leverage growth
Market leading product lines
Integration completed
Driving efficiencies

QUESTIONS?

72 The Cooper Companies Analyst Meeting 2008
Contacts:Robert S. Weiss
President and Chief Executive Officer
Eugene J. MidlockSenior Vice President and Chief Financial Officer
Albert G. White IIIVice President, Investor Relations & Treasurer
Phone: 925-460-3663
Fax: 925-460-3648
Email: [email protected]
Kim DuncanDirector, Investor Relations
Phone: 925-460-3663
Fax: 925-460-3648
Email: [email protected]
The Cooper Companies Contact Info
Corporate Headquarters:6140 Stoneridge Mall Road, Ste 590
Pleasanton, CA 94588
www.coopercos.com
www.coopervision.com
www.coopersurgical.com