Knoll, Inc. -...
25
Knoll, Inc. 2008 Investor Presentation Andrew Cogan, CEO Barry McCabe, EVP, CFO
Transcript of Knoll, Inc. -...

Knoll, Inc. 2008 Investor Presentation
Andrew Cogan, CEOBarry McCabe, EVP, CFO

© 20072
DisclaimerThe following information includes forward-looking statements within the meaning of Section 27A of the Securities Act of 1933, as amended, and Section 21E of the Securities Exchange Act of 1934, as amended. All statements regarding Knoll, Inc.’s expected future financial position, results of operations, cash flows, business strategy, budgets, projected costs, capital expenditures, products, competitive positions, growth opportunities, plans, goals and objectives of management for future operations, as well as statements that include words such as "anticipate," "if," "believe," "plan," "estimate," "expect," "intend," "may," "could," "should," "will," and other similar expressions are forward-looking statements. Such forward-looking statements are inherently uncertain, and readers must recognize that actual results may differ materially from the expectations of Knoll management. Knoll does not undertake a duty to update such forward-looking statements. Factors that may cause actual results to differ materially from those in the forward-looking statements include, without limitation, corporate spending and service-sector employment, price competition, acceptance of Knoll’s new products, the pricing and availability of raw material and components, foreign exchange pressures, transportation costs, demand for high quality, well designed office furniture solutions, changes in the competitive marketplace, changes in the trends in the market for office furniture and other risks identified in Knoll’s Annual Report on Form 10-K and other filings with the Securities and Exchange Commission. Many of these factors are outside of Knoll’s control.

© 20073
For 70 Years, Knoll Has Used Modern Design to Connect People With Their Work, Their Lives and Their World• A product portfolio by prominent, internationally acknowledged architects and designers• Recognized as a design leader with a premier brand identity• Products noted for their high quality and sophisticated aesthetics
Ludwig Mies van der Rohe
Hans andFlorence
Eero Saarinen
Formway Design
FrankGehry
Shelton Mindel
© 20074
We Were One of the First Furniture Manufacturers to Demonstrate Leadership in Sustainability• Environmental commitment that is well over two decades old
• One of the first furniture companies to achieve GREENGUARD certification across all products
• First furniture company to LEED® train and certify all of our A&D specialists
• First furniture company to join the Chicago Climate Exchange (CCX)
• Walk the talk –– Gold LEED for Lubin Facility, LEED Certification for San Francisco
and Philadelphia Showrooms

© 20075
Premier Brand IdentityKnoll Targets the Middle to Upper End of the Market Where Image, Performance and Customer Service are Key Differentiating Factors
Pric
e R
a nge
High
Mid-High
Mid-Low
Budget
North America Market Share¹ 17.6%14.0% 18.5%8.4%
(1) Based on LTM December 31, 2007 North America or U.S. publicly reported segments as a percent of LTM December 31, 2007 BIFMA U.S. industry shipments.
© 20076
(5)%
0%
5%
10%
15%
20%
25%
2000 2001 2002 2003 2004 2005 2006 2007
Ope
ratin
g M
argi
n
Knoll Herman Miller Steelcase
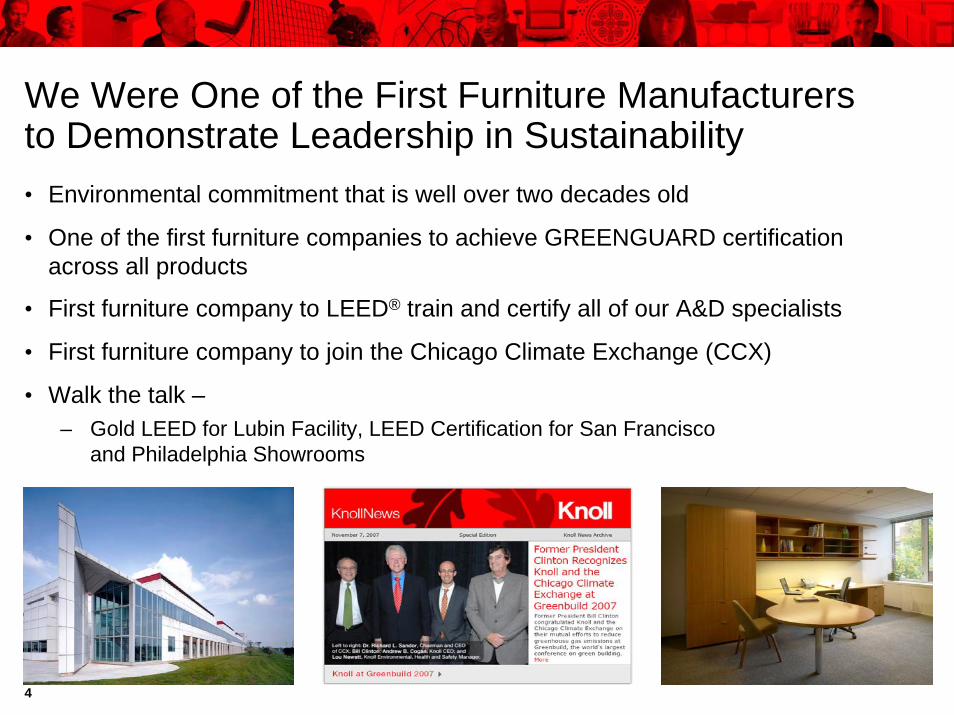
Industry-leading Margins Throughout Business Cycle
Source: Knoll financials and public financials
(1) Operating margins excludes certain non-recurring costs. See reconciliation of Knoll adjusted operating profit to the comparable GAAP measure for the period 2004 through 2007 on page 24. No adjustments were made to operating margins for the periods prior to 2004.
13.5%
10.8%
4.4%
(1)

© 20077
Our Growth from our 2004 IPO through 2007 49.5 % Sales Growth (millions)
$706.4$808.0
$982.2$1,055.8
$0.00
$200.00
$400.00
$600.00
$800.00
$1,000.00
$1,200.00
2004 2005 2006 2007
Knoll Vs BIFMA Growth 2004 through 2007
49.5%
27.8%
0%
10%
20%
30%
40%
50%
60%
Perc
enta
ge S
ales
Incr
ease
(%)
Knoll GrowthBIFMA Growth
Gross Margin
34.1%
33.7%
32.5%
34.6%
31.0%
31.5%
32.0%
32.5%
33.0%
33.5%
34.0%
34.5%
35.0%
2004 2005 2006 2007
Operating Margins Increased 340 Basis Points
10.1%
11.5%11.9%
13.5%
0.0%
2.0%
4.0%
6.0%
8.0%
10.0%
12.0%
14.0%
16.0%
2004 2005 2006 2007

© 20078
Our Growth from our 2004 IPO through 2007 (cont.)
95% Adjusted EBITDA Growth (2) (millions)
$87.7
$114.6
$142.1
$170.9
$-
$20.0
$40.0
$60.0
$80.0
$100.0
$120.0
$140.0
$160.0
$180.0
2004 2005 2006 2007
Leverage Ratio (3)4.48
2.762.46
2.18
0
0.5
1
1.5
2
2.5
3
3.5
4
4.5
5
2004 2005 2006 2007
123% Adjusted EPS Growth (1)
$0.66
$0.80
$1.17
$1.47
$0.00
$0.20
$0.40
$0.60
$0.80
$1.00
$1.20
$1.40
$1.60
2004 2005 2006 2007
Debt Level $ (millions)
$392.90
$316.00
$350.30$368.60
$0.00
$50.00
$100.00
$150.00
$200.00
$250.00
$300.00
$350.00
$400.00
$450.00
12/31/2004 12/31/2005 12/31/2006 12/31/2007
(1) Adjusted EPS exclude certain non-recurring costs. For a reconciliation of these non-GAAP measures to the comparable GAAP measure, see page 24.
(2) For details of the EBITDA calculation, including a reconciliation of EBITDA to GAAP Net Income, see “Leverage Ratio” on page 25.
(3) Leverage Ratio is calculated by dividing the outstanding debt by EBITDA. For details of the leverage ratio calculation, see page 25.

© 20079
Free Cash Flow (thousands) (1)
$35,552
$48,564
$69,632
$82,312
0
10,000
20,000
30,000
40,000
50,000
60,000
70,000
80,000
90,000
2004 2005 2006 2007
FREE CASH FLOW
Cash Returned to Shareholders $ (2)
$15,956
$128,627
$70,420
$0.00
$20,000.00
$40,000.00
$60,000.00
$80,000.00
$100,000.00
$120,000.00
$140,000.00
2005 2006 2007
Diluted Weighted Average Shares (millions)
48.3
52.9
51.2
49.2
48.0
49.0
50.0
51.0
52.0
53.0
54.0
12/04 12/05 12/06 12/07
Debt Levels $316 $332 $324 $375 $350 $329$357
125% Dividend Growth $
$0.20
$0.25
$0.41
$0.45
$0.00
$0.05
$0.10
$0.15
$0.20
$0.25
$0.30
$0.35
$0.40
$0.45
$0.50
2004 2005 2006 2007
Our Growth from our 2004 IPO through 2007 (cont.)
(1) Free Cash Flow is defined as Net Income plus depreciation and amortization and non-cash stock compensation less capital expenditures. For details of the free cash flow calculation, see page 25.
(2) Cash returned to shareholders includes dividends paid and shares repurchased.

© 200710
Trends We Watch
-1000
-500
0
500
1000
1500
1991 1993 1995 1997 1999 2001 2003 2005 2007
American Institute of Architects Billings Index
40
50
60
2000 2001 2002 2003 2004 2005 2006 March2007
June2007
Sept.2007
Dec.2007
Inde
x
Absorption and Vacancy Rates
(40)
(30)
(20)
(10)
-
10
20
30
40
Net
Abs
orpt
ion
(mill
ions
sq.
ft.)
7.5%
10.0%
12.5%
15.0%
17.5%
20.0%
% Vacancy
Net Absorption Vacancy %
2002 2003 2004 2005 2006 20071997 1998 1999 2000
Billings Index = The nine to twelve months lag between architecture billings and construction spending
Change In Office Employment
BIFMA Shipments 1980 -2008F
0
2,000
4,000
6,000
8,000
10,000
12,000
14,000
80 81 82 83 84 85 86 87 88 89 90 91 92 93 94 95 96 97 98 99 00 01 02 03 04 05 06 0708
(F)
x
Ship
men
ts -
mill
ions
of U
S$
$8.9
0$1
0.98
$8.5
1
$3.3
3$3
.75
$4.1
5$4
.56
$5.7
4$6
.41
$6.6
8
$7.3
3$7
.45
$7.8
3$7
.86
$7.7
1
$8.1
6$8
.85
$9.4
4$1
0.04
$11.
46
$12.
35
8.5%12.6%10.7%
9.8%
25.9%
11.8%4.1%
9.8% 1.7%5.1%0.4%
-8.1%
6.7% 5.8%
8.5%6.6%
6.4%
14.1%
7.8% -0.9%
8.5%
-17.4%
-19.0%-4.3%
$7.2
3
$12.
24
$13.
28
$8.9
4
5.1%
12.7%
$10.
1
7.4%
$10.
8
5.5%
$11.
4
-0.90%
$11.
3
Source: Grubb & Ellis Source: BIFMA
Source: American institute of Architects Billings indexSource: McGraw Hill Construction

© 200711
Growth Strategy • Leverage our leading Office System offerings to capture market share in
underpenetrated seating, storage and casegoods categories.
• Drive high margin high growth Specialty businesses through expanded product offerings, distribution channels and sales and marketing programs.
• Increase International presence and results.
• Position Knoll as the supplier of choice for companies seeking to attract the next generation of office workers by creating dynamic workplaces that respond to emerging workstyles and trends.

© 200712
We Still Have Significant Market Share Opportunity in Underpenetrated Categories
$75m
28%26%
20%
12%
18%
4% 3%
1%0
5
10
15
20
25
30
Office Systems Seating Storage Casegoods
Cat
egor
y Sh
are
(%)2
Category Share of Total Industry Shipments¹Knoll Category Share
$3,117
$552
$2,948
$114
$2,273
$81
$1,306
+$300 M
1. Percent of LTM 9/30/07 industry shipments of $11.3 billion, as reported by BIFMA2. As of LTM 9/30/07

© 200713
Today approximately 98% of Our Sales Come from Less Than 50% of the Global Market
¹ EstimateMarket Opportunity North AmericaMarket Opportunity Knoll EuropeMarket Opportunity Knoll International
$10.9B(1)
$6.4B(1)
$15.0B(1)
Knoll North America8.41%
Knoll International
0.15%
Knoll Europe1.05%
Implementing a Geographic Segmentation of the Business to Raise Visibility and Focus on $15BInternational Opportunity
(1)

© 200714
We Are Building a Design-driven Portfolio Less Dependent on NA Office Cycles• Significantly Decreased Exposure
to Office Systems Category
• Strengthened and Expanded Complimentary Seating, Storage, and Casegood Offerings
• Aggressively Increased Specialty Sales, Distribution, and Marketing Efforts
• Acquired Edelman Leather our 5th
Specialty Business
68%
12% 13%
7%
53%
19% 19%
10%
0
10
20
30
40
50
60
70
80
Office Systems Complimentary Specialty Europe/International
Cat
egor
y Sh
are
(%)2
% Sales YTD December 31, 2000% Sales YTD December 31, 2007

© 200715
Engaged Leading Design Talent Around the Globe to Address the Needs of the Modern Workplace and Home Just as Hans and Florence Did 70 Years Ago

© 2007
Financial Performance

© 200717
Contribution Margin Shows Good ProgressKNOLL, INC.YTD 2007
DECEMBER, YEAR TO DATE2007 2006 VARIANCE
SALES 1,055,814 982,152 73,662% YEAR OVER YEAR GROWTH 7.5% 21.6%
COST OF GOODS SOLD 690,689 663,115 27,574
GROSS MARGIN 365,125 319,037 46,08834.6% 32.5% 2.1 PTS
CONTRIBUTION MARGIN 62.6%
OPERATING EXPENSES 222,937 202,097 20,84021.1% 20.6% 0.5 PTS
ADJ OPERATING PROFIT (1) 142,188 118,440 23,74813.5% 12.1% 1.4 PTS
CONTRIBUTION MARGIN 32.2%
ADJ EARNINGS PER SHARE (1) $1.47 $1.17 $0.30% GROWTH 25.6% 46.3%
(1) Adjusted operating profit and adjusted EPS exclude certain non-recurring costs. For a reconciliation of these non-GAAP measures to the comparable GAAP measure, see page 24.

© 200718
We Have Made Excellent Progress Towards Our Mid-term Goal of Achieving 35% Gross Margins
GM as a % of Sales
34.1%
33.7%
34.1%34.3%
34.7%
35.1%
32.5%
31.0%
31.5%
32.0%
32.5%
33.0%
33.5%
34.0%
34.5%
35.0%
35.5%
2004 2005 2006
• Pricing– Realizing price and stabilizing
discount
• Global Sourcing– Expanding opportunities
• Factory Initiatives– Absorption and efficiencies improving
• Inflation– Moderating
Q107
• Fuel Costs• Foreign Exchange
– Canadian dollar strengthening
POSITIVES NEGATIVES
Q207 Q307 Q407

© 200719
And to Our Goal of Achieving 15% Operating Margins
10.7%11.6%
12.4%
13.8% 13.5% 14.0%
12.1%
0.0%
2.0%
4.0%
6.0%
8.0%
10.0%
12.0%
14.0%
16.0%
2004 2005 Q1072006
• Continue Leveraging Our SG&A
– Selectively invest in our support infrastructure
– Where possible, keep costs variable
– Keep SG&A at 21-22% of sales
Q207 Q307 Q407
Adjusted Operating Margins as a % of Sales
(1) Adjusted operating margins exclude certain non-recurring costs. For a reconciliation of adjusted operating profit to the comparable GAAP measure, see page 24. No adjustments were made to operating margins for the periods of 2007.
(1)

© 200720
5%
18%19%
20%
16%
12%
10%12% 12% 12%
14% 14%14%
17%
20%
0%
6%
13%
19%
25%
1996 1997 1998 1999 2000 2001 2002 2003 2004 2005 2006 Q107 Q207 Q307 Q407
Our Margin Performance is Approaching its Historical Average
Adjusted Operating Margins(1) Adjusted Operating margins exclude certain non-recurring costs. For a reconciliation of adjusted operating profit to the comparable GAAP measure for the periods 2004 through 2007 see
page 24. No adjustments were made to operating margins for the periods prior to 2004.
1996–2006 Avg.: 15%
(1)

© 200721
Allocation of Free Cash Flow• Invest in Focused Initiatives to Drive Top-line
Growth and Improve Margins– Complementary acquisitions
– New and enhanced products
– Look at factory machinery and equipment for efficiencies and cost improvements
• Pay Dividends to Shareholders
• Share Repurchase (8.5 million shares since December 2004)
• Target 2.0 – 2.5x Debt / EBITDA

© 200722
Thank You
www.knoll.com

© 200723
Reconciliation of Adjusted EPS 2004 through 2007
2004 2005 2006 2007Earnings per Share - Diluted 0.55$ 0.68$ 1.14$ 1.45$
Add back: Write off of deferred financing fees 0.03 0.05 - 0.02 Public offering expense 0.08 - 0.03 - Restructuring charges - 0.01 - - Taxes related to repatriation of foreign earnings - 0.06 - -
Adjusted Earnings per Share Diluted 0.66$ 0.80$ 1.17$ 1.47$

© 200724
Reconciliation of Adjusted Operating Profit and Adjusted Earnings per Share
FY 2007 FY 2006 FY 2005 FY 2004
Operating Profit ($mm) 142.2$ 116.9$ 92.8$ 71.3$
Add back:
Restructuring charges - - 0.8 - Public offering expenses - 1.5 (1) - 4.4
Adjusted Operating Profit 142.2$ 118.4$ 93.6$ 75.7$
Net Sales 1,055.8$ 982.2$ 808.0$ 706.4$
Operating Margin 13.5% 12.1% 11.6% 10.7%
Earnings per Share (Diluted) 1.45$ 1.14$ 0.68$ 0.55$
Add back:
Restructuring charges - - 0.01 - Public offering expenses - 0.03 - 0.08 Write-off of deferred financing fees 0.02 - 0.05 0.03 Taxes related to repatriation of foreign earnings - - 0.06 -
Adjusted Earnings per Share 1.47$ 1.17$ 0.80$ 0.66$
(1) Includes costs associated with our two secondary stock offerings, the buyback of 3.9mm shares from Warburg Pincusand fees incurred in connection with the amendment of our credit facility.

© 200725
2004 2005 2006 2007
Net Income 26,744$ 35,909$ 58,633$ 71,443$
Add: Depreciation 20,080 18,721 19,194 19,655
Amortization 1,692 626 663 1,604
Stock compensation expense 167 4,052 4,504 5,902
Less:
Capital expenditures (13,131) (10,744) (13,362) (16,292)
Free Cash Flow 35,552$ 48,564$ 69,632$ 82,312$
( in t ho usand s)
(1) Non-recurring costs include public offering expenses, write-off of deferred financing fees, restructuring charges and additionaltaxes from the repatriation of foreign earnings
(2) Non cash items include stock compensation expense, unrealized gains/losses on derivatives and the write-off of deferred financing fees
(3) Includes an annualized proforma EBITDA for Edelman Leather, which was acquired on October 1, 2007.
12/31/04 12/31/05 12/31/06 12/31/2007
Debt Levels 392.9$ 316.0$ 350.0$ 368.6$
LTM Net Income ($mm) 26.7$ 35.9$ 58.7$ 71.4$ LTM Adjustments
Interest 19.5 23.7 23.7 24.6
Taxes 19.8 27.9 35.4 41.4
Depreciation and Amortization 20.0 18.7 19.2 21.3
Non-cash items(2) 1.7 8.4 5.1 12.2 (3)
LTM EBITDA 87.7$ 114.6$ 142.1$ 170.9$
Leverage Ratio 4.48 2.76 2.46 2.18
Free Cash Flow Leverage Ratio